Genetic characterization of a core collection of Linum ...
15
Genetic characterization of a core collection of flax (Linum usitatissimum L.) suitable for association mapping studies and evidence of divergent selection between fiber and linseed types Soto-Cerda et al. Soto-Cerda et al. BMC Plant Biology 2013, 13:78 http://www.biomedcentral.com/1471-2229/13/78
Transcript of Genetic characterization of a core collection of Linum ...
Genetic characterization of a core collection offlax (Linum usitatissimum L.) suitable forassociation mapping studies and evidence ofdivergent selection between fiber and linseedtypesSoto-Cerda et al.
Soto-Cerda et al. BMC Plant Biology 2013, 13:78http://www.biomedcentral.com/1471-2229/13/78

Soto-Cerda et al. BMC Plant Biology 2013, 13:78http://www.biomedcentral.com/1471-2229/13/78
RESEARCH ARTICLE Open Access
Genetic characterization of a core collection offlax (Linum usitatissimum L.) suitable forassociation mapping studies and evidence ofdivergent selection between fiber and linseedtypesBraulio J Soto-Cerda1,2,4, Axel Diederichsen3, Raja Ragupathy1,2 and Sylvie Cloutier1,2*
Abstract
Background: Flax is valued for its fiber, seed oil and nutraceuticals. Recently, the fiber industry has invested in thedevelopment of products made from linseed stems, making it a dual purpose crop. Simultaneous targeting ofgenomic regions controlling stem fiber and seed quality traits could enable the development of dual purposecultivars. However, the genetic diversity, population structure and linkage disequilibrium (LD) patterns necessary forassociation mapping (AM) have not yet been assessed in flax because genomic resources have only recently beendeveloped. We characterized 407 globally distributed flax accessions using 448 microsatellite markers. The data wasanalyzed to assess the suitability of this core collection for AM. Genomic scans to identify candidate genes selectedduring the divergent breeding process of fiber flax and linseed were conducted using the whole genome shotgunsequence of flax.
Results: Combined genetic structure analysis assigned all accessions to two major groups with six sub-groups.Population differentiation was weak between the major groups (FST = 0.094) and for most of the pairwisecomparisons among sub-groups. The molecular coancestry analysis indicated weak relatedness (mean = 0.287) formost individual pairs. Abundant genetic diversity was observed in the total panel (5.32 alleles per locus), and somesub-groups showed a high proportion of private alleles. The average genome-wide LD (r2) was 0.036, with arelatively fast decay of 1.5 cM. Genomic scans between fiber flax and linseed identified candidate genes involved incell-wall biogenesis/modification, xylem identity and fatty acid biosynthesis congruent with genes previouslyidentified in flax and other plant species.
Conclusions: Based on the abundant genetic diversity, weak population structure and relatedness and relativelyfast LD decay, we concluded that this core collection is suitable for AM studies targeting multiple agronomic andquality traits aiming at the improvement of flax as a true dual purpose crop. Our genomic scans provide the firstinsights into candidate regions affected by divergent selection in flax. In combination with AM, genomic scans havethe ability to increase the power to detect loci influencing complex traits.
Keywords: Genetic diversity, Population structure, Linkage disequilibrium, Association mapping, Linum usitatissimum,Fiber flax, Linseed, Divergent selection
* Correspondence: [email protected] of Plant Science, University of Manitoba, 66 Dafoe Road,Winnipeg, MB R3T 2N2, Canada2Cereal Research Centre, Agriculture and Agri-Food Canada, 195 Dafoe Rd,Winnipeg, MB R3T 2M9, CanadaFull list of author information is available at the end of the article
© 2013 Soto-Cerda et al.; licensee BioMed CenCreative Commons Attribution License (http:/distribution, and reproduction in any medium
tral Ltd. This is an Open Access article distributed under the terms of the/creativecommons.org/licenses/by/2.0), which permits unrestricted use,, provided the original work is properly cited.
Soto-Cerda et al. BMC Plant Biology 2013, 13:78 Page 2 of 14http://www.biomedcentral.com/1471-2229/13/78
BackgroundFlax (Linum usitatissimum L.) is an annual, self-pollinated species with a genome size of ~ 370 Mb [1].The species is believed to have originated in either theMiddle East or Indian regions [2] and spread throughoutAsia and Europe, prior to its introduction into the NewWorld [3]. Divergent selection applied over thousands ofyears has resulted in fiber and linseed types which arethe same species but differ considerably in morphology,anatomy, physiology and agronomic performance [4].Fiber flax cultivars are taller and less branched and aregrown in the cool-temperate regions of China, theRussian Federation and Western Europe [3]. Linseedcultivars are shorter, more branched, larger seeded andare grown over a wider area in continental climateregions of Canada, India, China, the United States andArgentina [3]. Flax provides raw materials for food,medicine and textiles and, as such, it has been of greatimportance to human culture and development for morethan 8,000 years [5]. Linseed oil is well-known for itshealth benefits mainly attributed to its high content ofomega-3 alpha linolenic acid (55-57%). Linseed oil hasbeen used for centuries in paints and varnishes becauseof its unique drying properties attributable to itsdistinctive fatty acid composition [6]. Consumption ofground seeds adds nutritional benefits because flax seedsare also a rich source of lignans, compounds that haveanticancer properties [7]. In the last decade, the fiberindustry has devoted some effort to develop high-valueproducts from linseed stems with applications in thepulp, technical fiber and biofuel industries [4,8]. There-fore, understanding the genetic diversity of flax collec-tions is important for the continued improvement ofthis crop as well as for its development into a truly dualpurpose crop [8].Initial diversity assessments in flax were carried out
using morphological parameters [9-12] and isozymes[13,14]. In recent years, molecular marker systems suchas randomly amplified polymorphic DNA (RAPD), amp-lified fragment length polymorphism (AFLP), inter-simple sequence repeat (ISSR), simple sequence repeat(SSR) and inter-retrotransposon amplified polymorphism(IRAP) have been used to measure genetic variation andrelationships in cultivars and landraces of flax [15-29].However, most of these previous studies assessed eitherfew marker loci or few genotypes.World gene banks store approximately 48,000 acces-
sions of flax germplasm [30]. In Canada, a world collec-tion of approximately 3,500 accessions of cultivated flaxis maintained by Plant Gene Resources of Canada(PGRC). This collection has traditionally been deployedin flax breeding through a variety of conventional strat-egies [3]. In 2009, the Total Utilization Flax Genomics(TUFGEN; http://www.tufgen.ca) project was initiated in
Canada to generate genomics resources for flax and toapply them to an array of traits for the ultimate purposeof flax improvement. The TUFGEN project has devel-oped numerous genomics resources including molecularmarkers [23,29,31], genetic maps [32,33], a physical mapand bacterial artificial chromosome end sequences [1],expressed sequence tags [34] and whole genome shotgunsequence [35]. To take advantage of these tools, a corecollection of 407 flax accessions capturing the breadth ofthe phenotypic diversity of the PGRC collection wasassembled.Quantitative trait loci (QTL) and association mapping
(AM) are complementary approaches for the identi-fication of marker-trait association. The first utilizesbiparental mapping populations to monitor the co-segregation of QTL and marker loci. The second utilizesgermplasm collections to identify QTL-marker cor-relations based on LD [36]. QTL analysis has limitedmapping resolution due to the accumulation of fewmeiosis events in a single cross, but it is not affected bypopulation structure which can be a source of spuriousassociation in AM. Conversely, AM can achieve highermapping resolution through high numbers of historicalrecombination events in germplasm collections. An idealassociation panel should harbor the broadest genetic di-versity because this is often correlated with a rapid LDdecay necessary to resolve complex trait variation(s) to asingle gene or nucleotide [37]. Null or weak populationstructure and a low level of relatedness among indivi-duals of the germplasm collection are also desirable.Thus, genetic diversity, population structure, familialrelatedness and LD patterns need to be assessed prior toAM analyses to fully exploit their advantages for flaxgenetic improvement.In this study we genotyped 407 flax accessions using
448 microsatellite loci. The overall goal was to evaluatethe usefulness of this flax core collection for AM studies.Our specific goals were: (1) to investigate the geneticdiversity; (2) to estimate the levels of population struc-ture and assess familial relatedness; (3) to detect thepatterns of LD; and (4) to identify non-neutral genomicregions potentially underlying divergent selection bet-ween fiber and linseed types.
ResultsPhylogenetic analysisBased on 414 neutral loci, the phylogenetic analysisusing the NJ algorithm partitioned the 407 accessionsinto two major groups and one admixed group(Figure 1a; Additional file 1: Table S1). Group 1 (G1)was composed of 155 accessions that were furthersubdivided into three sub-groups representing accessionsfrom South Asia, Western Europe and South America.The South Asian sub-group included mostly accessions
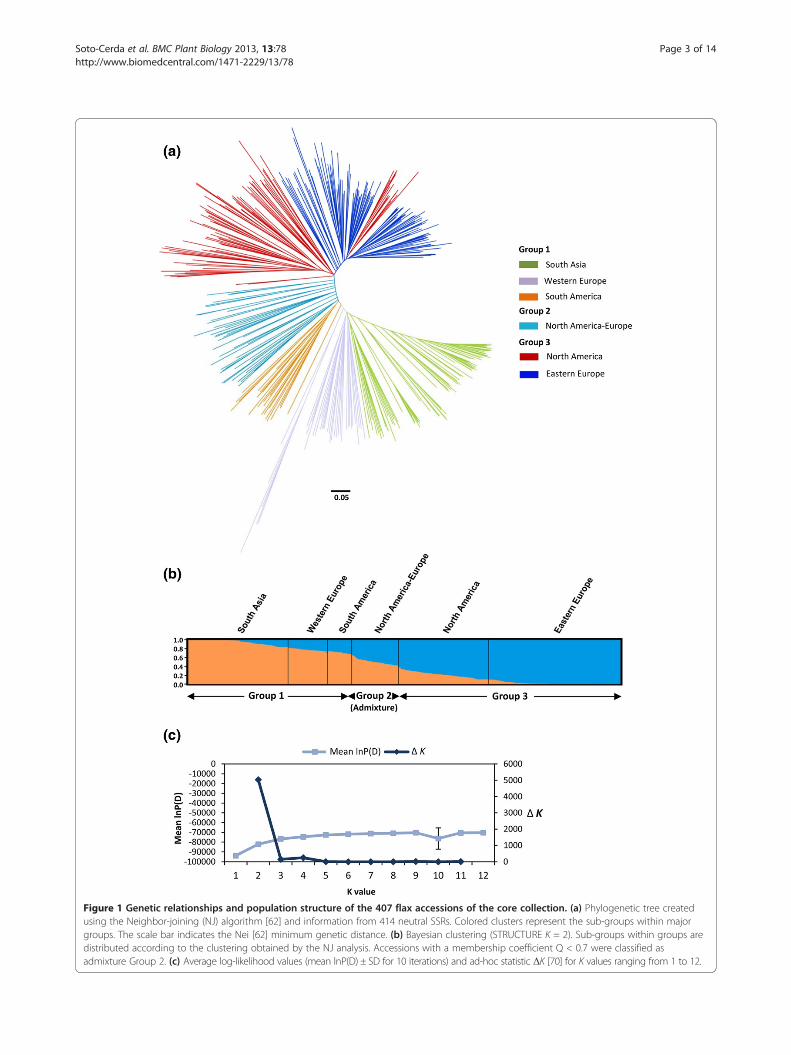
Figure 1 Genetic relationships and population structure of the 407 flax accessions of the core collection. (a) Phylogenetic tree createdusing the Neighbor-joining (NJ) algorithm [62] and information from 414 neutral SSRs. Colored clusters represent the sub-groups within majorgroups. The scale bar indicates the Nei [62] minimum genetic distance. (b) Bayesian clustering (STRUCTURE K = 2). Sub-groups within groups aredistributed according to the clustering obtained by the NJ analysis. Accessions with a membership coefficient Q < 0.7 were classified asadmixture Group 2. (c) Average log-likelihood values (mean lnP(D) ± SD for 10 iterations) and ad-hoc statistic ΔK [70] for K values ranging from 1 to 12.
Soto-Cerda et al. BMC Plant Biology 2013, 13:78 Page 3 of 14http://www.biomedcentral.com/1471-2229/13/78

Soto-Cerda et al. BMC Plant Biology 2013, 13:78 Page 4 of 14http://www.biomedcentral.com/1471-2229/13/78
from India, Pakistan and Afghanistan while the WesternEuropean sub-group contained mostly accessions fromFrance, Portugal and Germany but also from Romaniaand Turkey. The South American sub-group includedaccessions from Argentina and Uruguay. Group 3 (G3)had 206 accessions distributed into two sub-groups,namely North America and Eastern Europe. The NorthAmerican sub-group clustered cultivars and breedingmaterials originating exclusively from Canada and theU.S.A. However, not all North American accessionsclustered within that sub-group. A few of these acces-sions were included in the Eastern European sub-groupwhich otherwise included mostly accessions from Russia,Ukraine, Romania, Poland and Lithuania. This sub-group included 90% of the fiber flax accessions presentin the core collection. Within the Eastern Europeansub-group, the geographic origin and industrial useoverlapped, including fiber flax accessions from theNetherlands, the former Soviet Union and the U.S.A.The admixed group (G2), namely the North American/European group, had 43 accessions from the U.S.A.,Canada and European countries.
Population structureA total of 259 loci meeting the neutrality criteria, with LD< 0.4 and distributed across the 15 linkage groups, wereincluded in these analyses. Similar to the phylogeneticanalysis based on the NJ algorithm, the PCoA revealed thepresence of two major groups albeit with some admixtureamong sub-groups (Additional file 2: Figure S1a). Co-ordinate 1 and 2 explained 65.8% of the total geneticvariation. The Bayesian-based clustering approach imple-mented in STRUCTURE also identified two groupsaccording to the Δk approach (Figure 1b, c). Based on theestimated membership coefficient (Q), the South Asian,Western European and South American sub-groups(Q > 0.70) could be clustered together within G1, and theNorth American and Eastern European sub-groups(Q > 0.70) could be similarly clustered within G3. TheNorth American/European sub-group (G2) was mostly anadmixture of the other two major groups. Taken together,the NJ, PCoA and STRUCTURE analyses all agreed withrespect to the distribution of the 407 flax accessions intotwo major groups. Additionally, the NJ and STRUCTUREanalyses agreed in partitioning the collection into six sub-groups, with few differences among sub-groups. The highproportion of shared alleles revealed by the PCoA andSTRUCTURE analyses was confirmed by the weak popu-lation structure as measured by the coefficient of popula-tion differentiation (FST = 0.094, P < 0.001) between G1and G3. The level of differentiation between sub-groupsranged from 0.02 (P < 0.001, North America vs EasternEurope) to 0.16 (P < 0.001, Eastern Europe vs South Asia)(Additional file 2: Figure S1b).
Molecular coancestryBased on the alleles of the 448 microsatellites, theaverage molecular coancestry between any two flaxaccessions was 0.287 in the core collection as a whole.Approximately 70% of the pairwise coancenstry esti-mates ranged from 0.1 to 0.3 (Figure 2a). The intra sub-group molecular coancestry ranged from 0.587 (WesternEurope) to 0.713 (Eastern Europe). The pairwise molecularcoancestry estimates ranged from 0.525 (North Americavs Western Europe) to 0.633 (North America vs EasternEurope) (Figure 2c). Overall, more than 80% of the pair-wise molecular coancestry estimates in the core collectionand sub-groups ranged from 0.114 to 0.350 and 0.525 to0.601, respectively. The coancestry analysis indicated thatmost flax accessions had weak and moderate familialrelatedness with the other accessions in the core collectionand sub-groups respectively, which may be a reflection ofthe broad genetic diversity of the PGRC collectionand the careful selection of accessions exercised whileconstructing the core collection.
Genetic diversityIn the core collection, the 414 neutral microsatellitesretained detected 2202 alleles (Na) (mean = 5.32/locus),out of which 1187 (54%) had a MAF < 0.05 and wereconsidered rare alleles (Ra). The total unbiased genediversity (UHe) and the observed heterozygosity (Ho)were 0.427 and 0.023, respectively. Allelic richness (Rs)was estimated at 5.68, the inbreeding coefficient (FIS) at0.946 and the PIC value at 0.374. The genetic diversityparameters were also estimated for the major groupsand sub-groups (Table 1). The parameters Na, Rs, ∏, Ra
and PIC in G1 were superior to those in G3, eventhough the population size of G1 was 25% smaller thanG3. The parameters Ho and FIS across the core collec-tion, the major groups and sub-groups are consistentwith the predominantly self-pollinated nature of thespecies.
Linkage disequilibriumTo analyze LD variation, genetic distances for 293microsatellites were available from the consensus linkagemap of flax [33]. The average genome-wide distancebetween adjacent markers was 5.3 ± 2.4 cM. In the corecollection, the average r2 values for linked and unlinkedmarkers were 0.036 and 0.023, respectively. The 95th
percentile of r2 distribution for unlinked markers was0.09 and 10.81% of the loci pairs were in significant LD.The average genome-wide LD decayed to 0.1 within 1.5cM (Figure 2b). LD values within sub-groups and majorgroups are presented in Table 2. The average r2 valuesfor linked and unlinked markers were higher in G1 thanin G3 and the percentage of loci in significant LD waslower with 8.10% in G1 versus 12.22% in G3. Slower LD

Table 1 Genetic diversity parameters of the core collection for the two major groups (G1 and G3), the admixed group(G2) and their sub-groups
Population N1 UHe2 Ho
3 Na4 Rs
5 ∏6 Ra7 FIS
8 Polymorphic loci (%) PIC9
Core collection 407 0.427 0.023 2202 5.68 - 1187 0.946 100 0.374
Group 1 153 0.418 0.023 1978 4.37 547 925 0.944 99.8 0.361
South Asia 92 0.348 0.020 1510 2.85 116 542 0.931 95.9 0.305
Western Europe 37 0.448 0.017 1608 3.44 246 418 0.961 97.1 0.393
South America 24 0.395 0.047 1135 2.70 27 186 0.878 91.3 0.332
Group 2
North Amer./Eur. 43 0.411 0.023 1341 2.91 32 324 0.933 96.4 0.352
Group 3 211 0.356 0.022 1613 3.44 183 683 0.933 99.1 0.332
North America 95 0.378 0.028 1362 2.69 73 424 0.932 98.6 0.334
Eastern Europe 116 0.300 0.020 1487 2.55 45 642 0.927 95.7 0.2651 Number of accessions.2 Unbiased gene diversity.3 Observed heterozygosity.4 Number of alleles.5 Allelic richness and 6 number of private alleles estimated on a sample of balanced size using the rarefaction method [66].7 Rare alleles < 5%.8 Inbreeding coefficient.9 Polymorphism information content.
Figure 2 Distribution of pairwise molecular coancestry estimates and linkage disequilibrium decay. (a) Global pairwise molecularcoancestry estimates of the 407 flax accessions of the core collection. Only kinship values ranging from 0 to 0.5 are shown. (b) Scatter plot of LDdecay (r2) against the genetic distances (cM) for pairs of linked SSRs across the 15 linkage groups. The inner panel shows a detailed view of LDdecay for markers located within 5 cM. The decay curves were plotted according to Breseghello and Sorells [75]. The blue line represents thethreshold level of significance (r2 = 0.1). The red line represents the average genome-wide LD of linked markers. (c) Pairwise molecular coancestryestimates [72] within each of the six sub-groups. The diagonal values correspond to the intra sub-group molecular coancestry. (d) Averagegenome-wide LD decay curves for linked markers within each of the six sub-groups.
Soto-Cerda et al. BMC Plant Biology 2013, 13:78 Page 5 of 14http://www.biomedcentral.com/1471-2229/13/78
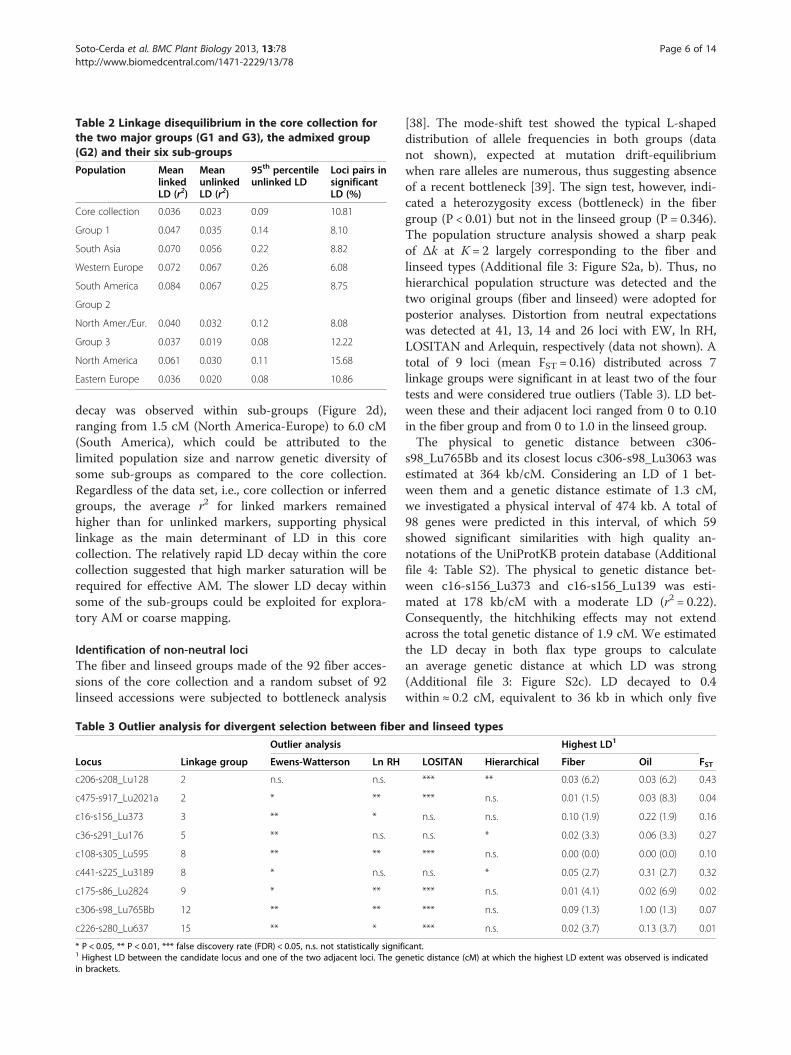
Table 2 Linkage disequilibrium in the core collection forthe two major groups (G1 and G3), the admixed group(G2) and their six sub-groups
Population MeanlinkedLD (r2)
MeanunlinkedLD (r2)
95th percentileunlinked LD
Loci pairs insignificantLD (%)
Core collection 0.036 0.023 0.09 10.81
Group 1 0.047 0.035 0.14 8.10
South Asia 0.070 0.056 0.22 8.82
Western Europe 0.072 0.067 0.26 6.08
South America 0.084 0.067 0.25 8.75
Group 2
North Amer./Eur. 0.040 0.032 0.12 8.08
Group 3 0.037 0.019 0.08 12.22
North America 0.061 0.030 0.11 15.68
Eastern Europe 0.036 0.020 0.08 10.86
Soto-Cerda et al. BMC Plant Biology 2013, 13:78 Page 6 of 14http://www.biomedcentral.com/1471-2229/13/78
decay was observed within sub-groups (Figure 2d),ranging from 1.5 cM (North America-Europe) to 6.0 cM(South America), which could be attributed to thelimited population size and narrow genetic diversity ofsome sub-groups as compared to the core collection.Regardless of the data set, i.e., core collection or inferredgroups, the average r2 for linked markers remainedhigher than for unlinked markers, supporting physicallinkage as the main determinant of LD in this corecollection. The relatively rapid LD decay within the corecollection suggested that high marker saturation will berequired for effective AM. The slower LD decay withinsome of the sub-groups could be exploited for explora-tory AM or coarse mapping.
Identification of non-neutral lociThe fiber and linseed groups made of the 92 fiber acces-sions of the core collection and a random subset of 92linseed accessions were subjected to bottleneck analysis
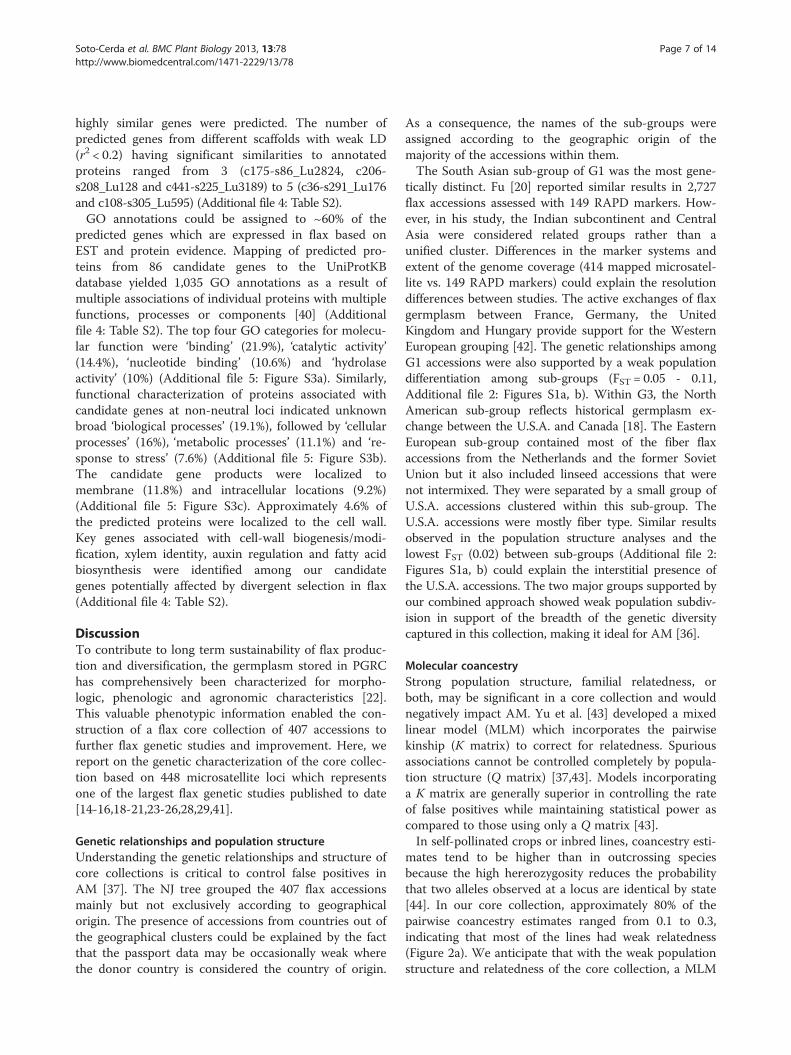
Table 3 Outlier analysis for divergent selection between fiber
Outlier analysis
Locus Linkage group Ewens-Watterson Ln RH
c206-s208_Lu128 2 n.s. n.s.
c475-s917_Lu2021a 2 * **
c16-s156_Lu373 3 ** *
c36-s291_Lu176 5 ** n.s.
c108-s305_Lu595 8 ** **
c441-s225_Lu3189 8 * n.s.
c175-s86_Lu2824 9 * **
c306-s98_Lu765Bb 12 ** **
c226-s280_Lu637 15 ** *
* P < 0.05, ** P < 0.01, *** false discovery rate (FDR) < 0.05, n.s. not statistically signif1 Highest LD between the candidate locus and one of the two adjacent loci. The gein brackets.
[38]. The mode-shift test showed the typical L-shapeddistribution of allele frequencies in both groups (datanot shown), expected at mutation drift-equilibriumwhen rare alleles are numerous, thus suggesting absenceof a recent bottleneck [39]. The sign test, however, indi-cated a heterozygosity excess (bottleneck) in the fibergroup (P < 0.01) but not in the linseed group (P = 0.346).The population structure analysis showed a sharp peakof Δk at K = 2 largely corresponding to the fiber andlinseed types (Additional file 3: Figure S2a, b). Thus, nohierarchical population structure was detected and thetwo original groups (fiber and linseed) were adopted forposterior analyses. Distortion from neutral expectationswas detected at 41, 13, 14 and 26 loci with EW, ln RH,LOSITAN and Arlequin, respectively (data not shown). Atotal of 9 loci (mean FST = 0.16) distributed across 7linkage groups were significant in at least two of the fourtests and were considered true outliers (Table 3). LD bet-ween these and their adjacent loci ranged from 0 to 0.10in the fiber group and from 0 to 1.0 in the linseed group.The physical to genetic distance between c306-
s98_Lu765Bb and its closest locus c306-s98_Lu3063 wasestimated at 364 kb/cM. Considering an LD of 1 bet-ween them and a genetic distance estimate of 1.3 cM,we investigated a physical interval of 474 kb. A total of98 genes were predicted in this interval, of which 59showed significant similarities with high quality an-notations of the UniProtKB protein database (Additionalfile 4: Table S2). The physical to genetic distance bet-ween c16-s156_Lu373 and c16-s156_Lu139 was esti-mated at 178 kb/cM with a moderate LD (r2 = 0.22).Consequently, the hitchhiking effects may not extendacross the total genetic distance of 1.9 cM. We estimatedthe LD decay in both flax type groups to calculatean average genetic distance at which LD was strong(Additional file 3: Figure S2c). LD decayed to 0.4within ≈ 0.2 cM, equivalent to 36 kb in which only five
and linseed types
Highest LD1
LOSITAN Hierarchical Fiber Oil FST
*** ** 0.03 (6.2) 0.03 (6.2) 0.43
*** n.s. 0.01 (1.5) 0.03 (8.3) 0.04
n.s. n.s. 0.10 (1.9) 0.22 (1.9) 0.16
n.s. * 0.02 (3.3) 0.06 (3.3) 0.27
*** n.s. 0.00 (0.0) 0.00 (0.0) 0.10
n.s. * 0.05 (2.7) 0.31 (2.7) 0.32
*** n.s. 0.01 (4.1) 0.02 (6.9) 0.02
*** n.s. 0.09 (1.3) 1.00 (1.3) 0.07
*** n.s. 0.02 (3.7) 0.13 (3.7) 0.01
icant.netic distance (cM) at which the highest LD extent was observed is indicated
Soto-Cerda et al. BMC Plant Biology 2013, 13:78 Page 7 of 14http://www.biomedcentral.com/1471-2229/13/78
highly similar genes were predicted. The number ofpredicted genes from different scaffolds with weak LD(r2 < 0.2) having significant similarities to annotatedproteins ranged from 3 (c175-s86_Lu2824, c206-s208_Lu128 and c441-s225_Lu3189) to 5 (c36-s291_Lu176and c108-s305_Lu595) (Additional file 4: Table S2).GO annotations could be assigned to ~60% of the
predicted genes which are expressed in flax based onEST and protein evidence. Mapping of predicted pro-teins from 86 candidate genes to the UniProtKBdatabase yielded 1,035 GO annotations as a result ofmultiple associations of individual proteins with multiplefunctions, processes or components [40] (Additionalfile 4: Table S2). The top four GO categories for molecu-lar function were ‘binding’ (21.9%), ‘catalytic activity’(14.4%), ‘nucleotide binding’ (10.6%) and ‘hydrolaseactivity’ (10%) (Additional file 5: Figure S3a). Similarly,functional characterization of proteins associated withcandidate genes at non-neutral loci indicated unknownbroad ‘biological processes’ (19.1%), followed by ‘cellularprocesses’ (16%), ‘metabolic processes’ (11.1%) and ‘re-sponse to stress’ (7.6%) (Additional file 5: Figure S3b).The candidate gene products were localized tomembrane (11.8%) and intracellular locations (9.2%)(Additional file 5: Figure S3c). Approximately 4.6% ofthe predicted proteins were localized to the cell wall.Key genes associated with cell-wall biogenesis/modi-fication, xylem identity, auxin regulation and fatty acidbiosynthesis were identified among our candidategenes potentially affected by divergent selection in flax(Additional file 4: Table S2).
DiscussionTo contribute to long term sustainability of flax produc-tion and diversification, the germplasm stored in PGRChas comprehensively been characterized for morpho-logic, phenologic and agronomic characteristics [22].This valuable phenotypic information enabled the con-struction of a flax core collection of 407 accessions tofurther flax genetic studies and improvement. Here, wereport on the genetic characterization of the core collec-tion based on 448 microsatellite loci which representsone of the largest flax genetic studies published to date[14-16,18-21,23-26,28,29,41].
Genetic relationships and population structureUnderstanding the genetic relationships and structure ofcore collections is critical to control false positives inAM [37]. The NJ tree grouped the 407 flax accessionsmainly but not exclusively according to geographicalorigin. The presence of accessions from countries out ofthe geographical clusters could be explained by the factthat the passport data may be occasionally weak wherethe donor country is considered the country of origin.
As a consequence, the names of the sub-groups wereassigned according to the geographic origin of themajority of the accessions within them.The South Asian sub-group of G1 was the most gene-
tically distinct. Fu [20] reported similar results in 2,727flax accessions assessed with 149 RAPD markers. How-ever, in his study, the Indian subcontinent and CentralAsia were considered related groups rather than aunified cluster. Differences in the marker systems andextent of the genome coverage (414 mapped microsatel-lite vs. 149 RAPD markers) could explain the resolutiondifferences between studies. The active exchanges of flaxgermplasm between France, Germany, the UnitedKingdom and Hungary provide support for the WesternEuropean grouping [42]. The genetic relationships amongG1 accessions were also supported by a weak populationdifferentiation among sub-groups (FST = 0.05 - 0.11,Additional file 2: Figures S1a, b). Within G3, the NorthAmerican sub-group reflects historical germplasm ex-change between the U.S.A. and Canada [18]. The EasternEuropean sub-group contained most of the fiber flaxaccessions from the Netherlands and the former SovietUnion but it also included linseed accessions that werenot intermixed. They were separated by a small group ofU.S.A. accessions clustered within this sub-group. TheU.S.A. accessions were mostly fiber type. Similar resultsobserved in the population structure analyses and thelowest FST (0.02) between sub-groups (Additional file 2:Figures S1a, b) could explain the interstitial presence ofthe U.S.A. accessions. The two major groups supported byour combined approach showed weak population subdiv-ision in support of the breadth of the genetic diversitycaptured in this collection, making it ideal for AM [36].
Molecular coancestryStrong population structure, familial relatedness, orboth, may be significant in a core collection and wouldnegatively impact AM. Yu et al. [43] developed a mixedlinear model (MLM) which incorporates the pairwisekinship (K matrix) to correct for relatedness. Spuriousassociations cannot be controlled completely by popula-tion structure (Q matrix) [37,43]. Models incorporatinga K matrix are generally superior in controlling the rateof false positives while maintaining statistical power ascompared to those using only a Q matrix [43].In self-pollinated crops or inbred lines, coancestry esti-
mates tend to be higher than in outcrossing speciesbecause the high hererozygosity reduces the probabilitythat two alleles observed at a locus are identical by state[44]. In our core collection, approximately 80% of thepairwise coancestry estimates ranged from 0.1 to 0.3,indicating that most of the lines had weak relatedness(Figure 2a). We anticipate that with the weak populationstructure and relatedness of the core collection, a MLM

Soto-Cerda et al. BMC Plant Biology 2013, 13:78 Page 8 of 14http://www.biomedcentral.com/1471-2229/13/78
correcting for K should provide sufficient statisticalpower to control most of the false positive associationsin future AM studies [43].
Genetic diversityA suitable core collection for AM should encompass asmuch phenotypic and molecular diversity as can bereliably measured in a given environment [36,37]. Anaverage of 5.32 alleles per locus over 414 microsatelliteswas observed in our core collection. This value is higherthan the range previously reported (2.72 – 3.46)[28,41,45,46]. This allelic diversity even exceeded that of adiverse sample of L. usitatissimum L. subsp. angustifolium(Huds.) Thell., (wild progenitor) and L. usitatissimumL. subsp. usitatissimum (4.62) [26]. This high value maybe the result of the number of genotypes analyzed (407),the choice of the germplasm, the number of microsatelliteloci (414 neutral out of 448) and the microsatellite repeattype and length [29,47].A higher number of private alleles were observed in
G1 as compared to G3 (Table 1). The Western Europeansub-group was particularly rich in private alleles with246. Novel genetic variations, not previously sampled orutilized in modern flax breeding programs, may bepresent in this sub-group, offering unique alleles forbroadening the diversity of flax gene pools. This is con-trary to previous studies that have reported generallylow genetic diversity of flax germplasm [18,21,23,26-28].Although 85% of the accessions of our core collectionare cultivars and breeding materials, the collectionpossesses abundant genetic diversity, an advantageousattribute for dissecting the genetic basis of QTL forimmediate application in flax breeding [36,48].
Linkage disequilibriumLow LD demands the use of dense marker sets resultingin tight linkage between markers and QTL, an advanta-geous criterion for breeding applications because thepredictive ability of a marker will be robust through gen-erations [36]. The average r2 of the entire core collectionwas 0.036 and the average genome-wide LD decayedwithin 1.5 cM (Figure 2b). In self-pollinated specieswhere recombination is less effective than in outcrossingspecies LD declines more slowly [36]. Nonetheless, thegermplasm that makes up the collection plays a key rolein LD variation because the extent of LD is influencedby the level of genetic variation captured by the targetpopulation. For example, in wild barley (Hordeumvulgare ssp. spontaneum), despite its high rate of self-fertilization (~98%), LD decayed within 2 kb, a valuesimilar to that observed in maize, an outcrossing species[49]. The low LD of this core collection dictates the needfor higher marker saturation to provide superior map-ping resolution and QTL detection power by AM [50] as
compared to using biparental linkage maps. Alterna-tively, selection of sub-groups with low FST and higherbut similar levels of LD would require a reduced numberof individuals and markers for exploratory AM.The percentage of loci pairs in significant LD was
fairly similar in each sub-group except for the NorthAmerican and Eastern European sub-groups whichregistered the highest values, possibly reflecting theirmore intensive artificial selection and narrow germplasm[18]. Although our core collection did not behave as anunstructured large population, our combined analyses ofpopulation structure showed that G1 and G3 wereweakly differentiated, representing two ancestral popula-tions that minimize differences in LD and potentially theamount of spurious associations (Figures 1a, b). Thus,the results of our LD characterization within diversegenetic groups offer the versatility to perform cost-effective AM studies in flax by providing the fundamen-tal characterization of the collection demonstrating itsusefulness for AM.
Identification of non-neutral lociFlax is one of the few domesticated plants that have beensubjected to disruptive selection [8]. North Americaalmost exclusively grows linseed and, up until recently,the stems were considered more problematic than benefi-cial because of their slow field biodegradation. However,the use of short fibers has received increased attention inNorth America in the last few years because of the interestin extracting value from the stem of linseed varieties [4].Stem fiber content does not seem associated with qualita-tive or quantitative plant characteristics in flax germplasm[4] indicating that there are no major biological restric-tions for pyramiding agronomic and seed quality traitswith high fiber content.Crops have been subjected to strong selective pressure
directed at genes controlling traits of agronomic im-portance during their domestication and subsequentepisodes of selective breeding [47]. Under positive selec-tion, favourable alleles will increase in frequency untilfixation. As an effect of genetic hitchhiking, loci closelylinked to beneficial alleles might present distortionsfrom neutral expectations. Genome scans have allowedthe identification of candidate loci involved in domesti-cation and breeding traits in several crops [47,51] anddomesticated animals [52,53]. However, populationstructure and bottlenecks can mimic the effect of se-lection and create false positives. The combination ofseveral methods based on different assumptions canreduce false positives [54].We applied four different tests of neutrality to identify
the genomic regions that deviate from neutral expecta-tions potentially associated with fiber and linseed diver-gent selection. Collectively, 86 candidate genes were

Soto-Cerda et al. BMC Plant Biology 2013, 13:78 Page 9 of 14http://www.biomedcentral.com/1471-2229/13/78
identified at nine loci (Additional file 4: Table S2).Among our candidate genes, we found a β-tubulininvolved in cell morphogenesis and elongation of fiber incotton [55], a glucan endo-1,3-β-glucosidase associatedwith cell wall biogenesis/degradation in flax [56], achitinase involved in polysaccharide degradation [56], aMYB transcription factor that influences cellulosemicrofibril angle in Eucalyptus [57] and a class III HD-Zip protein 4 (HB4) involved in xylem identity in flax[58] (Additional file 4: Table S2). Candidate genes suchas pyruvate dehydrogenase E1 and fatty acid alpha-hydroxylase involved in fatty acid biosynthetic processeswere also identified (Additional file 4: Table S2). How-ever, β-galactosidase and cellulose synthase, two keyenzymes for cell-wall modification and cellulose synthe-sis in flax [56,58] were not present at any of the nineloci. Previously identified genes in flax microarrayanalyses of hypocotyl and phloem fiber development[56] and differentially expressed genes between flaxinner and outer stem tissues [58] were found among ourcandidate genes (Additional file 4: Table S2).Although preliminary, our scans provided the first
insights of non-neutral loci potentially affected by diver-gent selection in flax. Candidate genes, especially thosepreviously reported [56,58], will require further investi-gation and validation. To enhance the probability ofidentifying additional candidate loci, a high density ofmarkers would be desirable. Currently, next generationsequencing technology enables the re-sequencing of alarge number of accessions at a reasonable price. Thus,high quality and dense single nucleotide polymorphism(SNP) markers promise to provide comprehensive gen-ome coverage for the identification of non-neutralgenomic regions in flax [53]. Such genomic tools for flaxgenetic studies are being developed and more comprehen-sive genomic scans will be possible in the near future.
ConclusionsIn this study, high levels of genetic diversity wererevealed as compared to previous flax genetic studies.The weak population structure and relatedness and rela-tively fast LD decay indicate the suitability of this flaxcore collection for AM. The peculiar divergent breedingapplied in the development of fiber and linseed flaxvarieties provides a unique opportunity to understandhow human needs have sculpted the flax genome duringdomestication and improvement, and how these diver-gent genomic regions could be deployed in breeding forflax as a dual purpose crop.
MethodsPlant materialThe PGRC flax collection has been evaluated in the fieldto measure seed characteristics, disease resistance and
phenological traits [22]. Based on this information, acore collection of 381 flax accessions was assembledrepresenting the phenotypic diversity of the PGRC flaxworld collection. To these, 26 accessions of relevance torecent Canadian flax breeding programs were added,resulting in a core collection of 407 accessions. Informa-tion on the geographic origin and improvement status ofthe accessions is shown (Additional file 6: Table S3 andAdditional file 7: Figure S4). The core collection com-prised 92 fiber accessions, 285 linseed accessions and 30unknown accessions.
DNA isolation and microsatellite genotypingGenomic DNA was extracted from leaf tissues collectedfrom a single plant of each accession [23]. DNA wasquantified using a fluorometer and diluted to a 6 ng/μLworking solution. Four hundred forty eight micro-satellites [23,29,45,46,59] distributed across the 15linkage groups [33] were analyzed following the proced-ure previously described [23]. Briefly, the amplificationproducts were resolved on an ABI 3130xl Geneticanalyzer (Applied Biosystems, Foster City, CA, USA).Output files were analyzed by GeneScan (AppliedBiosystems) and subsequently imported into Geno-grapher. Fragment sizes were estimated using GeneScanROX-500 and MapMarker® 1000 (BioVentures Inc.,Murfreesboro, TN) internal size standards, and thegenotypic data matrix generated was used for all poster-ior analyses. The genotype of each locus was encodedbased on its allele size in bp or as a null allele for domi-nant markers. The selective neutrality status was testedacross microsatellites prior to other downstream geneticanalyses using the Ewens-Watterson (EW) neutrality test[60] implemented in POPGENE v.1.31 [61] with 1,000permutations without replacement.
Phylogenetic analysisTo assess the genetic relationships among the accessionsof the core collection, a dendrogram was generatedusing the neighbour-joining (NJ) algorithm [62] basedon the Nei [62] minimum genetic distance methodimplemented in PowerMarker v.3.25 [63] and displayedby MEGA 5 [64]. The Nei [62] minimum geneticdistance method is applicable to any population withoutregard to the number of alleles per locus, the pattern ofevolutionary forces and the reproductive method of theorganism studied. Thus it is a realistic estimation of thegenetic relationships in an artificial population whenindividuals display different selection intensities, bree-ding objectives, and improvement status. The analysiswas performed with the 414 neutral microsatellitesidentified by the EW neutrality test including minorallele frequency (MAF) < 0.05. The genotype of eachmarker was encoded as two alleles using their sizes
Soto-Cerda et al. BMC Plant Biology 2013, 13:78 Page 10 of 14http://www.biomedcentral.com/1471-2229/13/78
estimated above as follow: homozygous state (allele1/allele1) and heterozygous state (allele1/allele2). Null alleles“null/null” were encoded as 999/999 and missing values as“?/?”. The reliability of the dendrogram topology wasconfirmed with 1,000 bootstraps with replacements.
Population structureTo investigate the patterns of population structure, weconducted principal coordinate (PCoA) and Bayesian-based analyses. Because LD can affect both PCoA andSTRUCTURE analyses, we thinned the marker set byexcluding microsatellites in strong LD, i.e., markers with asquare of the correlation coefficient (r2) greater than 0.4[65]. Allelic frequencies were calculated in PowerMarkerv.3.25 [63] and MAF < 0.05 were set to “U” (missing data)and excluded from the LD analysis. Genetic distancesbetween markers were obtained from the microsatelliteconsensus linkage map of flax [33] integrated with thephysical map [1]. Linked and unlinked LD (r2) was deter-mined using GGT 2.0 [66] with genotypic data encoded asfollows: 100/100 =A, 200/200 = B, 300/300 = C and so on,where each letter represents a different allele. Heterozy-gous individuals were considered missing value "U". PCoAwas performed in a multidimensional space with datastandardization using GENALEX v.6.41 [67]. Populationstructure analysis was carried out using STRUCTURE2.3.3 [68,69]. The admixture model was used with a burnin of 10,000 and 100,000 iterations for K populationsranging from 1 to 12. Ten runs for each K value wereperformed and the ad-hoc statistic Δk was used to deter-mine the optimum number of sub-groups [70]. Prior topopulation structure analysis, SSR data was encoded usingthe size of each allele and “-9” was used for missing values.Accessions with estimated memberships ≥ 0.70 wereassigned to corresponding groups; accessions with esti-mated memberships < 0.70 were assigned to a mixedgroup. We adopted a cut-off value of 0.70 because 85% ofthe accessions are cultivars and breeding material, thus itis likely that their genome structure resembles more thanone ancestral population. The inferred sub-groups werevisualized in Distruct [71]. Pairwise FST comparisons werecalculated using GENALEX v.6.41 [67] to determine thegenetic differentiation between the inferred geneticgroups.
Molecular coancestryStrong familial relatedness can potentially inflate thenumber of spurious associations when it is notaccounted for by the AM model. Relatedness wasestimated using the molecular coancestry parameter (fij)according to Caballero and Toro [72]. The molecularcoancestry between two individuals i and j is the pro-bability that two randomly sampled alleles from thesame locus in two individuals are identical by state [72].
Molecular coancestry between two individuals i and j ata given locus can be computed using the followingscoring rules [72]: fij,l = ¼[I11 + I12 + I21 + I22], where Ixyis 1 when allele x on locus l in individual i and allele yin the same locus in individual j are identical and zerootherwise. Notice that this estimate can only have fourvalues: 0, ¼, ½, and 1. The molecular coancestry betweentwo individuals i and j (fij) can be obtained simply byaveraging over L analyzed loci. Molecular coancestrymatrices comparing all pairs of individuals within thecore collection and within the different genetic groupsidentified above were calculated using all 448 micro-satellites using MolKin v.3.0 [73]. Genotypic data basedon the size of alleles was encoded as two alleles follow-ing the Genpop software format as follows: 100/200 =0102, 200/200 = 0202 and so on. Missing values werelabeled “0000”.
Genetic diversityGenetic diversity parameters were estimated across thegenetic groups identified above based on the 414 neutralmicrosatellites. Unbiased gene diversity (UHe), observedheterozygosity (Ho), total number of alleles (Na), in-breeding coefficient (FIS) and polymorphic loci (%) werecalculated in GENALEX v.6.41 [67]. Allelic richness (Rs)and private alleles (∏) were corrected for sample sizedifferences and estimated using the rarefaction methodimplemented in HP-RARE v.1.2 [74]. The number of rarealleles (MAF < 0.05) and the polymorphism informationcontent (PIC) values were calculated in PowerMarkerv.3.25 [63].
Linkage disequilibriumLD was estimated by calculating r2 using GGT 2.0 [66]as described in the population structure section above.Only microsatellites with known chromosome informa-tion in the consensus map of flax [33] were used for LDestimation. Microsatellites on the same linkage groupwere considered linked and those on different linkagegroups, unlinked. Mean LD was estimated for linked andunlinked markers in the total panel and for the differentgenetic groups identified by NJ and population structureanalyses. The 95th percentile of r2 distribution forunlinked markers was considered the cut-off LD valueto determine whether LD resulted from physical linkage[75]. Average genome-wide LD decay versus geneticdistance was estimated as previously described [75]. Acut-off value of r2 = 0.1 was set to estimate the averagegenome-wide LD block. In order to compare the trendof LD decay amongst the different genetic groups, weaveraged LD values to distance intervals equal to theaverage genome-wide LD block estimated.
Soto-Cerda et al. BMC Plant Biology 2013, 13:78 Page 11 of 14http://www.biomedcentral.com/1471-2229/13/78
Identification of non-neutral lociTo identify candidate loci linked to genomic regions thatmight have experienced divergent selection, we used the92 fiber flax accessions present in the core collection(Additional file 6: Table S3) The “line selection” modulein PowerMarker v.3.25 [63] allows the selection of a coreset of lines from a large germplasm collection that maxi-mizes the genetic diversity. Likewise, this module en-ables the selection of a random set of lines from a largepopulation. Using PowerMarker v.3.25 [63] we randomlyselected a set of 92 linseed accessions (among the 285linseed accessions of the core collection) that capturedthe average number of alleles present in 100 random setsof 92 lines for the identification of non-neutral loci.Because bottlenecks can create false positive outliers,both fiber and linseed groups were analyzed withBOTTLENECK v.1.2.02 assuming the two-phase muta-tion model proposed for microsatellite data [38]. Geno-typic data followed the Genepop format describedabove. We applied four outlier tests to minimize thenumber of false positives. (1) The Ewens-Watterson(EW) test statistic which identifies positively selectedloci by evaluating significant deviation from expectedheterozygosity (Dh/sd) in a single population [76] wascalculated using BOTTLENECK v.1.2.02 [38]. Statisticalsignificance (Dh/sd < −2.5, P < 0.05) was assigned basedon 1,000 permutations without replacement. (2) The lnRH test that identifies loci that differ in variability fromthe remainder of the genome by calculating the ratio ofgene diversity in two populations was performed [77].After standardization of ln RH estimates, 95% of the neutralloci are expected to have values ranging between −1.96 and1.96. Any locus with a value higher than 1.96 (P < 0.05) wasconsidered non-neutral. (3) The Beaumont and Nichols[78] approach implemented in LOSITAN [79] identifies lociunder selection based on the distribution of heterozygosityand FST under an island model of migration. The expectednull distribution of FST values and estimated P values foreach locus were obtained [79]. Loci exceeding the 95%upper confidence area were considered non-neutral.Genotypic data also followed the Genepop format de-scribed above. (4) The hierarchical island model thatidentifies outlier loci by allowing the exchange of moremigrants within groups than between groups while gener-ating the null distribution of FST values to reduce thenumber of false positives, was also applied to the data set[80]. The fiber and linseed groups were analyzed withSTRUCTURE 2.3.3 [68,69] to determine the number ofgroups to incorporate in the hierarchical analysis usingthe ad-hoc statistic Δk [70]. The expected FST distribu-tions were obtained using Arlequin v.3.5 [81]. Loci outsidethe 95% upper confidence area were considered non-neutral (P < 0.05). The genotype of each marker wasencoded as two alleles using their size estimate where the
homozygous state was 100100 and the heterozygous statewas 100200. Null alleles “null/null” were encoded as999999 and missing values were “??”. Loci identified by atleast two of the above four tests were retained and investi-gated as candidates for divergent selection.
Candidate genesTo identify candidate genes by homology search, weused the combined information of the consensus geneticmap [33], the physical map [1] and the whole genomeshotgun (WGS) sequence assembly ([35]; http://www.phytozome.net) of flax. When the candidate locus andits adjacent marker with the highest LD (r2 > 0.4) werelocated in the same WGS sequence assembly scaffold,we estimated the physical to genetic distance (Mb/cM)to define the physical distance to be investigated for theidentification of candidate genes. When adjacentmarkers were on different scaffolds or showed weak LD(r2 < 0.2), we limited the search for candidate genes tothe 10 kb regions upstream and downstream of theoutlier markers. Annotation of the WGS assembly usingthe Hidden Markov Model-based gene-finding programsAugustus v.2.5.5 [82] and GlimmerHMM v.3.0.1 [83]were used. Using the BLASTn algorithm, predicted openreading frames of candidate genes were searched againstan in-house flax EST database comprising 462,190 flaxESTs ([23,34,58]; NCBI Linum usitatissimum ESTdb) forevidence of expression, using an E-value cutoff of 1e-5.The same candidate gene sequences were used to per-form BLASTx searches against the 16 million annotatedproteins in the UniProtKB db [84] to provide evidence ofprotein function using an E-value cutoff of 1e-5. Geneontology (GO) annotations ([40]; http://www.geneontology.org) were also retrieved from the UniProtKB. Plant GO-slims for all three independent GO categories namely,cellular components, molecular functions and biologicalprocesses were obtained from all GO terms associated withthe BLASTx gene annotations using the GO slim viewerfrom the AgBase web server ([85]; http://www.agbase.msstate.edu).
Additional files
Additional file 1: Table S1. (Portable Document Format file) List of the407 flax accessions sorted according to the neighbour-joining tree.
Additional file 2: Figure S1. (Portable Document Format file) (a)Principal coordinate analysis (PCoA) of the 407 flax accessions of the corecollection based on the 259 neutral SSRs with LD < 0.4. Sub-groups werelabeled according to the NJ analysis results (Figure 1a). (b) Pairwise FSTvalues between the 6 sub-groups of flax inferred by the NJ, STRUCTUREand PCoA analyses. 1 = North America. 2 = Eastern Europe. 3 = South Asia.4 = Western Europe. 5 = North America/Europe. 6 = South America.* Significant values at P < 0.001.
Additional file 3: Figure S2. Population structure and linkagedisequilibrium analyses of the fiber flax and linseed groups (PortableDocument Format file). (a) Bayesian clustering analysis (STRUCTURE K = 2)

Soto-Cerda et al. BMC Plant Biology 2013, 13:78 Page 12 of 14http://www.biomedcentral.com/1471-2229/13/78
of fiber flax and linseed. (b) ad-hoc statistic ΔK [62] for K values rangingfrom 1 to 4. (c) Average genome-wide LD decay (r2) against geneticdistance (cM) within fiber and linseed flax groups. The black linerepresents the decay curve at the genome level of the two flax groups.
Additional file 4: Table S2. (Portable Document Format file) Analysis ofcandidate genes affected by divergent selection between fiber flax andlinseed groups. green: BLASTx hit vs UniProtKB (No Hits), blue: BLASTx hitvs UniProtKB (less than 34 aminoacids or 35% similarity), red: BLASTn hitagainst Flax-ESTs (No Hits), yellow: BLASTn hit against Flax-ESTs (less than80 bp or 80% similarity).
Additional file 5: Figure S3. (Portable Document Format file) GO-slimannotations of gene products predicted from nine non-neutral candidategenomic regions between fiber flax and linseed groups. (a) Molecularfunction. (b) Biological process. (c) Cellular component.
Additional file 6: Table S3. (Portable Document Format file) Corecollection data including accession number, accession name, origin andimprovement status. CN = Canadian number, Plant Gene Resources ofCanada (PGRC).
Additional file 7: Figure S4. (Portable Document Format file)Distribution of the 407 flax accessions of the core collection.(a) geographical origin. (b) improvement status.
Competing interestsThe authors declare that they have no competing interests.
Authors’ contributionsBJSC conducted this work as part of his PhD thesis. He carried out the analyses,interpretation of data and co-wrote the manuscript. AD characterized anddeveloped the flax core collection. RR carried out the gene prediction andgene annotation. SC designed the study, generated the data, supervised thework and co-wrote the manuscript. All authors critically reviewed themanuscript. All authors read and approved the final manuscript.
AcknowledgmentsThe authors are grateful to Andrzej Walichnowski, Evelyn Miranda and YelenaShmelov for technical assistance. Members of the Cloutier laboratory are alsoacknowledged for the development of the microsatellite markers and theconsensus genetic map of flax. This work was conducted as part of the TotalUtilization Flax Genomics (TUFGEN) project funded by Genome Canada andco-funded by the Government of Manitoba, the Flax Council of Canada andthe Manitoba Flax Growers Association. Project management and support byGenome Prairie are also gratefully acknowledged. Braulio J. Soto-Cerda wassupported by Becas Chile – Comisión Nacional de Investigación Científica yTecnológica (CONICYT).
Author details1Department of Plant Science, University of Manitoba, 66 Dafoe Road,Winnipeg, MB R3T 2N2, Canada. 2Cereal Research Centre, Agriculture andAgri-Food Canada, 195 Dafoe Rd, Winnipeg, MB R3T 2M9, Canada. 3PlantGene Resources of Canada, Agriculture and Agri-Food Canada, 107 SciencePlace, Saskatchewan, SK S7N 0X2, Canada. 4Present address: AgriaquacultureNutritional Genomic Center, CGNA, Genomics and Bioinformatics Unit, Km 10Camino Cajón-Vilcún, INIA Temuco, Chile.
Received: 31 August 2012 Accepted: 26 April 2013Published: 6 May 2013
References1. Ragupathy R, Rathinavelu R, Cloutier S: Physical mapping and
BAC-end sequence analysis provide initial insights into the flax(Linum usitatissimum L.) genome. BMC Genomics 2011, 12(1):217.
2. Vavilov NI: The origin, variation, immunity and breeding of cultivatedplants. Chronica Botanica 1951, 13:1–366.
3. Green AG, Chen Y, Singh SP, Dribnenki JCP: Flax. In Compendium oftransgenic crop plants. Edited by Kole C, Hall TC. Oxford: BlackwellPublishing Ltd; 2008:199–226.
4. Diederichsen A, Ulrich A: Variability in stem fibre content and itsassociation with other characteristics in 1177 flax (Linum usitatissimum L)genebank accessions. Ind Crop Prod 2009, 30(1):33–39.
5. van Zeist W, Bakker-Heeres JAH: Evidence for linseed cultivation before6000 BC. J Archeol Sci 1975, 2(3):215–219.
6. Przybylski R: Flax oil and high linolenic oils. In Bailey’s industrial oil and fatproducts. 6th edition. Edited by Shahidi F. Hoboken: John Wiley & Sons, Inc;2001:281–301.
7. Westcott NA, Muir AD: Flax seed lignan in disease prevention and healthpromotion. Phytochem Rev 2003, 2003(2):401–417.
8. Cullis C: Oilseeds: Linum. In Wild crop relatives: Genomic and breedingresources. Edited by Cole C. Berlin: Springer; 2011:177–189.
9. von Kulpa W, Danert S: Zur Systematik von Linum usitatissimumL. Kulturpflanze 1962, 3:341–388.
10. Diederichsen A: Comparison of genetic diversity of flax (Linumusitatissimum L.) between Canadian cultivars and a world collection.Plant Breed 2001, 120(4):360–362.
11. Diederichsen A, Rozhmina TA, Zhuchenko AA, Richards KW: Screening forbroad adaptation in 96 flax (Linum usitatissimum L.) accessions underdry and warm conditions in Canada and Russia. Plant Genet Resour Newsl2006, 146:9–16.
12. Diederichsen A, Raney JP: Seed colour, seed weight and seed oil contentin Linum usitatissimum accessions held by Plant Gene Resources ofCanada. Plant Breed 2006, 125(4):372–377.
13. Tyson H, Fieldes MA, Cheung C, Starobin J: Isozyme relative mobility (Rm)changes related to leaf position; apparently smooth Rm trends andsome implications. Biochem Genet 1985, 23(9–10):641–654.
14. Månsby E, Diaz O, von Bothmer R: Preliminary study of genetic diversityin Swedish flax (Linum usitatissimum). Genet Resour Crop Evol 2000,47(4):417–424.
15. Spielmeyer W, Green AG, Bittisnish D, Mendham N, Lagudah ES:Identification of quantitative trait loci contributing to Fusarium wiltresistance on an AFLP linkage map of flax (Linum usitatissimum).Theor Appl Genet 1998, 97(4):633–641.
16. Everaert I, De Riek J, De Loose M, Van Waes J, Van Bockstaele E: Mostsimilar variety grouping for distinctness evaluation of flax and linseed(Linum usitatissimum L.) varieties by means of AFLP and morphologicaldata. Plant Var Seed 2001, 14(2):69–87.
17. Fu YB, Diederichsen A, Richards KW, Peterson G: Genetic diversity within arange of cultivars and landraces of flax (Linum usitatissimum L) asrevealed by RAPDs. Genet Resour Crop Evol 2002, 49(2):167–174.
18. Fu YB, Rowland GG, Duguid SD, Richards KW: RAPD analysis of 54 NorthAmerican flax cultivars. Crop Sci 2003, 43(4):1510–1515.
19. Wiesnerová D, Wiesner I: ISSR-based clustering of cultivated flaxgermplasm is statistically correlated to thousand seed mass.Mol Biotechnol 2004, 26(3):207–213.
20. Fu YB: Geographic patterns of RAPD variation in cultivated flax.Crop Sci 2005, 45(3):1084–1091.
21. Diederichsen A, Fu YB: Phenotypic and molecular (RAPD) differentiationof four infraspecific groups of cultivated flax (Linum usitatissimum L.subp. usitatissimum). Genet Resour Crop Evol 2006, 53(1):77–90.
22. Diederichsen A, Fu BF: Flax genetic diversity as the raw material for futuresuccess. International conference on flax and other bast plants; 2008[http://www.saskflax.com/documents/fb_papers/51_Diederichsen.pdf].
23. Cloutier S, Niu Z, Datla R, Duguid S: Development and analysis of EST-SSRsfor flax (Linum usitatissimum L.). Theor Appl Genet 2009, 119(1):53–63.
24. Rajwade AV, Arora RS, Kadoo NY, Harsulkar AM, Ghorpade PB, Gupta VS:Relatedness of Indian flax genotypes (Linum usitatissimum L.): aninter-simple sequence repeat (ISSR) primer assay. Mol Biotechnol 2010,45(2):161–170.
25. Uysal H, Fu YB, Kurt O, Peterson GW, Diederichsen A, Kusters P: Geneticdiversity of cultivated flax (Linum usitatissimum L.) and its wildprogenitor pale flax (Linum bienne Mill.) as revealed by ISSR markers.Genet Resour Crop Evol 2010, 57(7):1109–1119.
26. Fu YB: Genetic evidence for early flax domestication with capsulardehiscence. Genet Resour Crop Evol 2011, 58(8):1119–1128.
27. Smỳkal P, Bačová-Kerteszová N, Kalendar R, Corander J, Schulman AH,Pavelek M: Genetic diversity of cultivated flax (Linum usitatissimum L.)germplasm assessed by retrotransposon-based markers. Theor Appl Genet2011, 122(7):1385–1397.
28. Soto-Cerda BJ, Maureira-Butler I, Muñoz G, Rupayan A, Cloutier S: SSR-basedpopulation structure, molecular diversity and linkage disequilibriumanalysis of a collection of flax (Linum usitatissimum L.) varying formucilage seed-coat content. Mol Breed 2012, 30(2):875–888.

Soto-Cerda et al. BMC Plant Biology 2013, 13:78 Page 13 of 14http://www.biomedcentral.com/1471-2229/13/78
29. Cloutier S, Miranda E, Ward K, Radovanovic N, Reimer E, Walichnowski A,Datla R, Rowland G, Duguid S, Ragupathy R: Simple sequence repeatmarker development from bacterial artificial chromosome endsequences and expressed sequence tags of flax (Linum usitatissimum L.).Theor Appl Genet 2012, 125(4):685–694.
30. Diederichsen A: Ex situ collections of cultivated flax (Linum usitatissimumL.) and other species of the genus Linum L. Genet Resour Crop Evol 2007,54(3):661–678.
31. Kumar S, You FM, Cloutier S: Genome wide SNP discovery in flax throughnext generation sequencing of reduced representation libraries. BMCGenomics 2012, 13:684.
32. Cloutier S, Ragupathy R, Niu Z, Duguid S: SSR-based linkage map of flax(Linum usitatissimum L.) and mapping of QTLs underlying fatty acidcomposition traits. Mol Breed 2011, 28(4):437–451.
33. Cloutier S, Ragupathy R, Miranda E, Radovanovic N, Reimer E, WalichnowskiA, Ward K, Rowland G, Duguid S, Banik M: Integrated consensus geneticand physical maps of flax (Linum usitatissimum L.). Theor Appl Genet 2012,125(8):1783–1795.
34. Venglat P, Xiang D, Qiu S, Stone SL, Tibiche C, Cram D, Alting-Mees M,Nowak J, Cloutier S, Deyholos M, Bekkaoui F, Sharpe A, Wang E, Rowland G,Selvaraj G, Datla R: Gene expression analysis on flax seed development.BMC Plant Biol 2011, 11:74.
35. Wang Z, Hobson N, Galindo L, Zhu S, Shi D, McDill J, Yang L, Hawkins S,Neutelings G, Datla R, Lambert G, Galbraith DW, Grassa CJ, Geraldes A,Cronk QC, Cullis C, Dash PK, Kumar PA, Cloutier S, Sharpe AG, Wong GK,Wang J, Deyholos MK: The genome of flax (Linum usitatissimum)assembled de novo from short shotgun sequence reads. Plant J 2012,72(3):461–473.
36. Flint-Garcia S, Thornsberry JM, Bukler ES: Structure of linkagedisequilibrium in plants. Annu Rev Plant Biol 2003, 54:357–374.
37. Myles S, Peiffer J, Brown PJ, Ersoz ES, Zhang Z, Costich DE, Bukler ES:Association mapping: Critical considerations shift from genotyping toexperimental design. Plant Cell 2009, 21(8):2194–2202.
38. Cornuet JM, Luikart G: Description and power analysis of two tests fordetecting recent population bottlenecks from allele frequency data.Genetics 1996, 144(4):2001–2014.
39. Luikart G, Allendorf FW, Cornuet JM, Sherwin WB: Distortion of allelefrequency distributions provides a test for recent populationbottlenecks. J Hered 1998, 89(3):238–247.
40. Ashburner M, Ball CA, Blake JA, Botstein D, Butler H, Cherry JM, Davis AP,Dolinski K, Dwight SS, Eppig JT, Harris MA, Hill DP, Issel-Tarver L, Kasarskis A,Lewis S, Matese JC, Richardson JE, Ringwald M, Rubin GM, Sherlock G: Geneontology: tool for the unification of biology. Nature Genet 2000, 25(1):25–29.
41. Rachinskaya OA, Lemesh VA, Muravenko OV, Yurkevich OY, Guzenko EV,Bol'sheva NL, Bogdanova MV, Samatadze TE, Popov KV, Malyshev SV,Shostak NG, Heller K, Hotyleva LV, Zelenin AV: Genetic polymorphism offlax Linum usitatissimum based on the use of molecular cytogeneticmarkers. Genetika 2011, 47(1):56–65.
42. Maggioni L, Pavelek M, van Soest LJM, Lipman E: Flax Genetic Resources inEurope. Ad hoc meeting: 7–8 December 2001. Prague: International PlantGenetic Resources Institute; 2002.
43. Yu J, Pressoir G, Briggs W, Vroh Bi I, Yamasaki M, Doebley J, McMullen M,Gaut B, Nielsen D, Holland J, Kresovich S, Buckler E: A unified mixed-modelmethod for association mapping that accounts for multiple levels ofrelatedness. Nat Genet 2006, 38(2):203–208.
44. Bernardo R, Romero-Severson J, Ziegle J, Hauser J, Joe L, Hookstra G,Doerge RW: Parental contribution and coefficient of coancestry amongmaize inbreds: pedigree, RFLP, and SSR data. Theor Appl Genet 2000, 100(3–4):552–556.
45. Roose-Amsaleg C, Cariou-Pham E, Vautrin D, Tavernier R, Solignac M:Polymorphic microsatellite loci in Linum usitatissimum. Mol Ecol Notes2006, 6(3):796–799.
46. Deng X, Long S, He D, Li X, Wang Y, Liu J, Chen H: Development andcharacterization of polymorphic microsatellite markers in Linumusitatissimum. J Plant Res 2010, 123(1):119–123.
47. Vigouroux Y, McMullen M, Hittinger CT, Houchins K, Schulz L, Kresovich S,Matsuoka Y, Doebley J: Identifying genes of agronomic importance inmaize by screening microsatellites for evidence of selection duringdomestication. Proc Natl Acad Sci USA 2002, 99(15):9650–9655.
48. Yu J, Buckler E: Genetic association mapping and genome organizationof maize. Curr Opin Biotechnol 2006, 17(2):155–160.
49. Morrell PL, Toleno DM, Lundy KE, Clegg MT: Low levels of linkagedisequilibrium in wild barley (Hordeum vulgare ssp. spontaneum) despitehigh rates of self-fertilization. Proc Natl Acad Sci USA 2005, 102:2442–2447.
50. Xiao Y, Cai D, Yang W, Ye W, Younas M, Wu J, Liu K: Genetic structure andlinkage disequilibrium pattern of a rapeseed (Brassica napus L.)association panel revealed by microsatellites. Theor Appl Genet 2012,125(3):437–447.
51. Casa AM, Mitchell SE, Hamblin MT, Sun H, Bowers JE, Paterson AH, AquadroCF, Kresovich S: Diversity and selection in sorghum: simultaneousanalyses using simple sequence repeats. Theor Appl Genet, 111(1):23–30.
52. Flori L, Fritz S, Jaffrézic F, Boussaha M, Gut I, Heath S, Foulley JL, Gautier M:The genome response to artificial selection: a case study in dairy cattle.PLoS ONE 2009, 4(8):e6595.
53. Schwarzenbacher H, Dolezal M, Flisikowski K, Seefried F, Wurmser C,Schlötterer C, Fries R: Combining evidence of selection with associationanalysis increases power to detect regions influencing complex traits indairy cattle. BMC Genomics 2012, 13:48.
54. Shimada Y, Shikano T, Merilä J: A high incidence of selection onphysiologically important genes in the three-spined stickleback,Gasterosteus aculeatus. Mol Biol Evol 2011, 28(1):181–193.
55. He XC, Qin YM, Xu Y, Hu CY, Zhu YX: Molecular cloning, expressionprofiling, and yeast complementation of 19 β-tubulin cDNAs fromdeveloping cotton ovules. J Exp Bot 2008, 59(10):2687–2695.
56. Roach MJ, Deyholos MK: Microarray analysis of developing flaxhypocotyls identifies novel transcripts correlated with specific stages ofphloem fibre differentiation. Ann Bot 2008, 102(3):317–330.
57. Sexton TR, Henry RJ, Hardwood CE, Thomas DS, McManus LJ, Raymond C,Henson M, Shepherd M: Pectin methyltransferase genes influence solidwood properties of Eucalyptus pilularis. Plant Physiol 2011, 158(1):531–541.
58. Fenart S, Ndong YP, Duarte J, Rivière N, Wilmer J, van Wuytswinkel O, LucauA, Cariou E, Neutelings G, Gutierrez L, Chabbert B, Guillot X, Tavernier R,Hawkins S, Thomasset B: Development and validation of a flax(Linum usitatissimum L.) gene expression oligo microarray.BMC Genomics 2010, 11:592.
59. Deng X, Long S, He D, Li X, Wang Y, Hao D, Qiu C, Chen X: Isolation andcharacterization of polymorphic microsatellite markers from flax(Linum usitatissimum L.). Afr J Biotechnol 2011, 10(5):734–739.
60. Manly BFJ: The statistics of natural selection. In Spurious test results due toisolation by distance. London: Chapman and Hall; 1985:186–195.
61. Yeh FC, Yang RC, Boyle TBJ, Ye ZH, Mao JX: POPGENE, the user-friendlyshareware for population genetic analysis. Molecular biology andbiotechnology centre: University of Alberta Press; 1997.
62. Nei M: Analysis of gene diversity in subdivided populations. Proc NatlAcad Sci USA 1973, 70(12):3321–3323.
63. Liu K, Muse SV: PowerMarker: an integrated analysis environment forgenetic marker analysis. Bioinformatics 2005, 21(9):2128–2129.
64. Tamura K, Peterson D, Peterson N, Stecher G, Nei M, Kumar S: MEGA5:Molecular evolutionary genetics analysis using maximum likelihood,evolutionary distance, and maximum parsimony methods. Mol Biol Evol2011, 28(10):2731–2739.
65. Yunusbayev B, Metspalu M, Järve M, Kutuev I, Rootsi S, Metspalu E, BeharDM, Varendi K, Sahakyan H, Khusainova R, Yepiskoposyan L, KhusnutdinovaEK, Underhill PA, Kivisild T, Villems R: The Caucasus as an asymmetricsemipermeable barrier to ancient human migrations. Mol Biol Evol 2011,29(1):359–365.
66. van Berloo R: GGT 2.0: Versatile software for visualization and analysis ofgenetic data. J Hered 2008, 99(2):232–236.
67. Peakall R, Smouse PE: GENALEX 6: genetic analysis in excel. Populationgenetic software for teaching and research. Mol Ecol Notes 2006, 6(1):288–295.
68. Pritchard JK, Stephens M, Rosenberg NA, Donnelly P: Association mappingin structured populations. Am J Hum Genet 2000, 67(1):170–181.
69. Hubisz MJ, Falush D, Stephens M, Pritchard JK: Inferring weak populationstructure with the assistance of sample group information. Mol EcolResour 2009, 9(5):1322–1332.
70. Evanno G, Regnaut S, Goudet J: Detecting the number of clusters ofindividuals using the software STRUCTURE: a simulation study. Mol Ecol2005, 14(8):2611–2620.
71. Rosenberg NA: Distruct: a program for the graphical display ofpopulation structure. Mol Ecol Notes 2004, 4(1):137–138.
72. Caballero A, Toro MA: Analysis of genetic diversity for the managementof conserved subdivided populations. Conserv Genet 2002, 3(3):289–299.

Soto-Cerda et al. BMC Plant Biology 2013, 13:78 Page 14 of 14http://www.biomedcentral.com/1471-2229/13/78
73. Gutierréz JP, Royo LJ, Álvarez I, Goyache F: MolKin v. 2.0: a computerprogram for genetic analysis of populations using molecular coancentryinformation. J Hered 2005, 96(6):718–721.
74. Kalinowski ST: HP-RARE 1.0: a computer program for performingrarefaction on measures of allelic richness. Mol Ecol Notes 2005,5(1):187–189.
75. Breseghello F, Sorrells M: Association mapping of kernel size and millingquality in wheat (Triticum aestivum L.) cultivars. Genetics 2006,172(2):1165–1177.
76. Watterson GA: The homozygosity test of neutrality. Genetics 1978,88(2):405–417.
77. Kauer MO, Dieringer D, Schlötterer C: A microsatellite variability screen forpositive selection associated with the "out of Africa" habitat expansionof Drosophila melanogaster. Genetics 2003, 165(3):1137–1148.
78. Beaumont MA, Nichols RA: Evaluating loci for use in the genetic analysisof population structure. Proc Royal Soc Lond B 1996, 263(1377):1619–1626.
79. Antao T, Lopes A, Lopes RJ, Beja-Pereira A, Luikart G: LOSITAN: aworkbench to detect molecular adaptation based on a Fst-outliermethod. BMC Bioinformatics 2008, 9:323.
80. Excoffier L, Hofer T, Foll M: Detecting loci under selection in ahierarchically structured population. Heredity 2009, 103(4):285–298.
81. Excoffier L, Lischer HEL: Arlequin suite ver. 3.5: a new series of programsto perform population genetics analyses under Linux and Windows.Mol Ecol Resour 2010, 10(3):564–567.
82. Stanke M, Diekhans M, Baertsch R, Haussler D: Using native andsyntenically mapped cDNA alignments to improve de novo gene finding.Bioinformatics 2008, 24(5):637–644.
83. Majoros WH, Pertea M, Salzberg SL: TigrScan and GlimmerHMM: twoopen source ab initio eukaryotic gene-finders. Bioinformatics 2004,20(16):2878–2879.
84. The UniProt Consortium: The universal protein resource (UniProt) 2009.Nucleic Acid Res 2009, 37:D169–D174.
85. McCarthy FM, Wang N, Magee GB, Nanduri B, Lawrence ML, Camon EB,Barrell DG, Hill DP, Dolan ME, Williams WP, Luthe DS, Bridges SM, BurgessSC: AgBase: a functional genomics resource for agriculture.BMC Genomics 2006, 7:229.
doi:10.1186/1471-2229-13-78Cite this article as: Soto-Cerda et al.: Genetic characterization of a corecollection of flax (Linum usitatissimum L.) suitable for associationmapping studies and evidence of divergent selection between fiberand linseed types. BMC Plant Biology 2013 13:78.
Submit your next manuscript to BioMed Centraland take full advantage of:
• Convenient online submission
• Thorough peer review
• No space constraints or color figure charges
• Immediate publication on acceptance
• Inclusion in PubMed, CAS, Scopus and Google Scholar
• Research which is freely available for redistribution
Submit your manuscript at www.biomedcentral.com/submit