
Genetic factors affecting the omega-3 and omega-6 fatty...
127
Institut für Tierwissenschaften, Abt. Tierzucht und Tierhaltung der Rheinischen Friedrich – Wilhelms – Universität Bonn Genetic factors affecting the omega-3 and omega-6 fatty acid variation in egg yolk I n a u g u r a l – D i s s e r t a t i o n zur Erlangung des Grades Doktor der Agrarwissenschaft (Dr. agr.) der Hohen Landwirtschaftlichen Fakultät der Rheinischen Friedrich – Wilhelms – Universität zu Bonn vorgelegt im October 2006 von Nguyen Thi Kim Khang aus Cantho, Vietnam
Transcript of Genetic factors affecting the omega-3 and omega-6 fatty...
Institut für Tierwissenschaften, Abt. Tierzucht und Tierhaltung
der Rheinischen Friedrich – Wilhelms – Universität Bonn
Genetic factors affecting the omega-3 and omega-6 fatty acid
variation in egg yolk
I n a u g u r a l – D i s s e r t a t i o n
zur Erlangung des Grades
Doktor der Agrarwissenschaft
(Dr. agr.)
der
Hohen Landwirtschaftlichen Fakultät
der
Rheinischen Friedrich – Wilhelms – Universität
zu Bonn
vorgelegt im October 2006
von
Nguyen Thi Kim Khang
aus
Cantho, Vietnam
Diese Dissertation ist auf dem Hochschulschriftenserver der ULB Bonn
http://hss.ulb.uni-bonn.de/diss_online elektronisch publiziert
E-mail: [email protected]
Universitäts- und Landesbibliothek Bonn
Landwirtschaftliche Fakultät – Jahrgang 2006
Zugl.: ITW; Bonn, Univ., Diss., 2006
D 98
Referent: Prof. Dr. K. Schellander
Korreferent: Prof. Dr. R. Galensa
Tag der mündlichen Prüfung: 22 November 2006

Dedicated to my beloved husband, Le Hoang Tam, for his supports throughout my Ph.D
program. This research is also dedicated to my parents, brothers, sisters and all members of
my family for their concerns and their encouragements

Genetic factors affecting the omega-3 and omega-6 fatty acid variation in egg yolk
This study aimed to elucidate the genetic divergence of quail lines selected for high and low
ω-6:ω-3 PUFAs ratio in the egg yolk by estimation of the genetic parameters, to clone and
characterize of the direct candidate genes, FADS1 and FADS2, and to elucidate the effects
of polymorphisms of these genes on the ω-6 and ω-3 fatty acid contents in egg yolk.
Furthermore, the expression of the FADS1 and FADS2 genes as well as their polymorphisms
in different European (LSL) and Vietnamese chicken breeds (Ac, Noi, H’mong, Ri and Te)
was investigated.
The AA and DHA content were significantly lower in the high line than in the low line
(P<0.01). The ω-6 and ω-3 PUFA ratio was significantly reduced between the low and high
lines (P<0.01). Moderate heritabilties were found in the C22:6 (ω-3) and ω-6:ω-3 PUFA ratio
and the low line is more efficient than the high line.
The quail and chicken cDNA sequences of FADS1 and FADS2 genes were obtained. No
significant difference in expression of the two genes was found in both quail and chicken.
However, the expression of both genes in the Te and LSL chicken breeds were significantly
higher than Ac, Noi, Ri and H’mong chicken breeds.
In quail FADS2 five synonymous SNPs were found, while in FADS1 two of five SNPs
resulted in an amino acid substitution. FADS2 was significantly associated with C20:4 (ω-6),
C22:6 (ω-3) and the ω-6:ω-3 PUFA ratio (P<0.05), whereas FADS1 was significantly
associated not only with C14:0, C16:0 and C16:1 (ω-7), but also with C18:2 (ω-6) (P<0.05).
Analysis of the quail SNPs in the different European and Vietnamese local chicken breeds
revealed that only SNP4 of FADS2 segregated in five out of the six chicken breeds. The two
SNPs within the FADS1 gene at position 391 and 468 segregated in Te, Noi, Ri and LSL
chicken breeds.
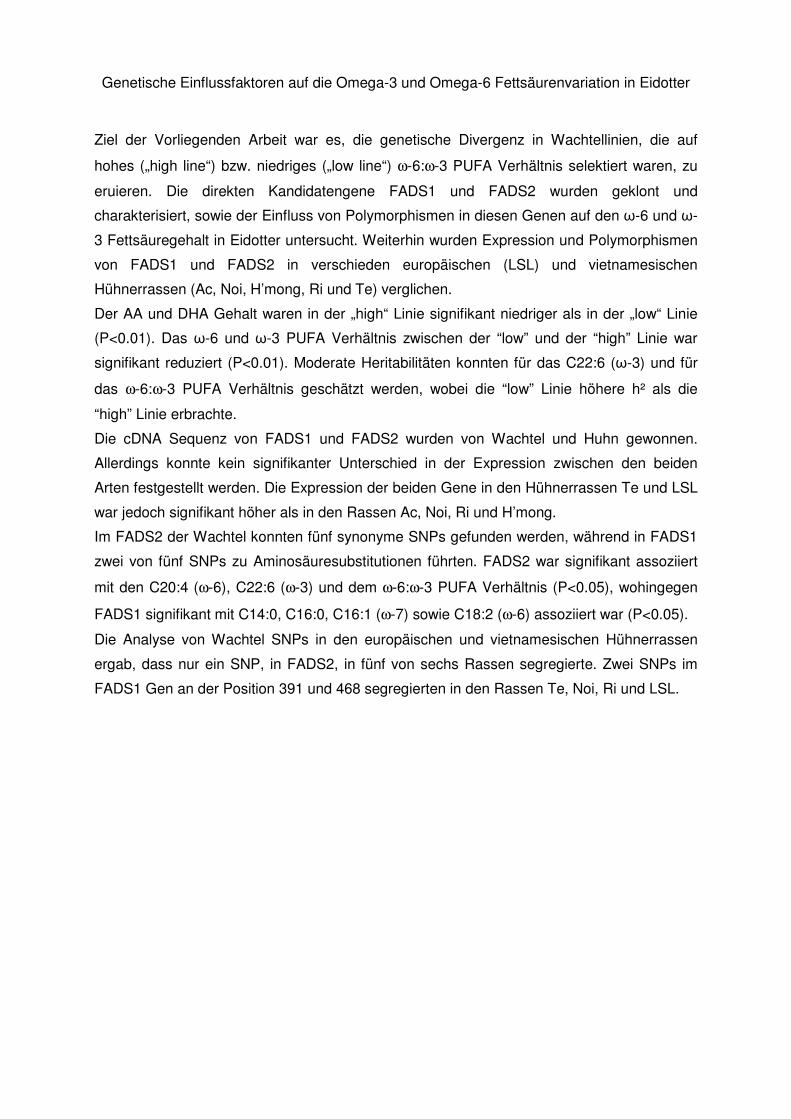
Genetische Einflussfaktoren auf die Omega-3 und Omega-6 Fettsäurenvariation in Eidotter
Ziel der Vorliegenden Arbeit war es, die genetische Divergenz in Wachtellinien, die auf
hohes („high line“) bzw. niedriges („low line“) ω-6:ω-3 PUFA Verhältnis selektiert waren, zu
eruieren. Die direkten Kandidatengene FADS1 und FADS2 wurden geklont und
charakterisiert, sowie der Einfluss von Polymorphismen in diesen Genen auf den ω-6 und ω-
3 Fettsäuregehalt in Eidotter untersucht. Weiterhin wurden Expression und Polymorphismen
von FADS1 und FADS2 in verschieden europäischen (LSL) und vietnamesischen
Hühnerrassen (Ac, Noi, H’mong, Ri und Te) verglichen.
Der AA und DHA Gehalt waren in der „high“ Linie signifikant niedriger als in der „low“ Linie
(P<0.01). Das ω-6 und ω-3 PUFA Verhältnis zwischen der “low” und der “high” Linie war
signifikant reduziert (P<0.01). Moderate Heritabilitäten konnten für das C22:6 (ω-3) und für
das ω-6:ω-3 PUFA Verhältnis geschätzt werden, wobei die “low” Linie höhere h² als die
“high” Linie erbrachte.
Die cDNA Sequenz von FADS1 und FADS2 wurden von Wachtel und Huhn gewonnen.
Allerdings konnte kein signifikanter Unterschied in der Expression zwischen den beiden
Arten festgestellt werden. Die Expression der beiden Gene in den Hühnerrassen Te und LSL
war jedoch signifikant höher als in den Rassen Ac, Noi, Ri und H’mong.
Im FADS2 der Wachtel konnten fünf synonyme SNPs gefunden werden, während in FADS1
zwei von fünf SNPs zu Aminosäuresubstitutionen führten. FADS2 war signifikant assoziiert
mit den C20:4 (ω-6), C22:6 (ω-3) und dem ω-6:ω-3 PUFA Verhältnis (P<0.05), wohingegen
FADS1 signifikant mit C14:0, C16:0, C16:1 (ω-7) sowie C18:2 (ω-6) assoziiert war (P<0.05).
Die Analyse von Wachtel SNPs in den europäischen und vietnamesischen Hühnerrassen
ergab, dass nur ein SNP, in FADS2, in fünf von sechs Rassen segregierte. Zwei SNPs im
FADS1 Gen an der Position 391 und 468 segregierten in den Rassen Te, Noi, Ri und LSL.

Contents: Page
Abstract
List of abbreviations
List of tables
List of figures
1 Introduction 1
2 Literature review 3
2.1 Roles of omega-3 and omega-6 polyunsaturated fatty acids for human
health
3
2.1.1 Chemical structure and nomenclature of fatty acids 3
2.1.2 Digestion, absorption and transportation of fatty acids 5
2.1.3 Membranes and membrane lipids 7
2.1.4 Functional fatty acids 8
2.1.5 Dietary recommendations for the polyunsaturated fatty acids 9
2.2 Sources of long-chain polyunsaturated fatty acids 11
2.3 Changing the fatty acid profile in the egg yolk 12
2.3.1 Changing by feeding 12
2.3.2 Breeding changes the fatty acids 13
2.4 Egg formation and fat deposition 14
2.4.1 Composition of eggs 14
2.4.2 Yolk formation and fat deposition 16
2.5 Biochemical metabolism of unsaturated fatty acids - candidate genes
for fatty acid profiles in the egg yolk
17
2.5.1 Classification and characteristics of desaturase enzymes 17
2.5.2 Biosynthesis pathways of unsaturated fatty acids 18
2.5.3 Function of ∆9-, ∆6- and ∆5-desaturases 20
2.5.4 Expression and factors regulating ∆6- and ∆5- desaturases 22
2.6 Molecular genetic background and strategies for candidate gene
identification and influence on the fatty acid profiles.
23
3 Material and Methods 25
3.1 Chemicals, reagents and media and commercial kits 25
3.1.1 Chemicals and kits 25
3.1.2 Reagents and media 25
3.1.3 Commercial kits 28
3.2 Equipments 28
3.3 Softwares 29
3.4 Animals 30
3.4.1 Selection experiments 30
3.4.2 Feed composition 31
3.4.3 Phenotypic trait records 32
3.5 Molecular genetics methods 33
3.5.1 RNA isolation 33
3.5.2 cDNA synthesis 33
3.5.3 DNA isolation 34
DNA isolation from liver tissue 34
DNA purification from agarose gels 34
DNA purification by Qiagen mini-kits for sequencing on CEQ8000 35
3.5.4 Ligation, transformation, plasmid isolation and sequencing 35
Ligation 35
Cloning and transformation 35
Plasmid isolation 36
Sequencing by using LI-COR sequencer 37
3.5.5 Clean-up PCR and sequencing on CEQ 8000 37
3.6 Identification of the candidate genes FADS1 and FADS2 in divergent
lines of Japanese quails
38
3.6.1 Sample collection 38
Collection of liver tissue in quails 38
Collection of liver tissue in Vietnamese local chickens 38
3.6.2 Characterisation of FADS1 and FADS2 genes 39
Sequence identification of cDNA FADS1 and FADS2 genes in quails 41
Sequence identification of FADS1 and FADS2 cDNA in chicken 41
3.6.3 Identification of polymorphisms of the FADS1 and FADS2 genes 41
Animals 41
Identification of polymorphisms of the FADS1 gene 41
Identification of polymorphisms of the FADS2 gene 42
3.6.4 Genotyping approach for the FADS1 and FADS2 genes 43
Genotyping of the FADS1 gene 43
Genotyping of the FADS2 gene 44
3.7 Expression of the FADS1 and FADS2 genes 45
3.7.1 Animals 45
Quail 45
Chicken 45
3.7.2 Quantitative by real-time PCR 45
3.8 Statistical analysis 46
3.8.1 Genetic evaluation based on selection of the eight divergently 46
selected lines of Japanese quails
3.8.2 Genotype analysis 47
4 Results 48
4.1 Fatty acid composition in egg yolk 48
4.1.1 Composition of fatty acids in egg yolk of the high and low lines of the
5th, 6th and 7th generation
48
4.1.2 Fatty acid profiles in Ri chicken 50
4.2 Heritability 50
4.3 Cloning and characterizations of the FADS1 and FADS2 genes 52
4.4 Expression of the FADS1 and FADS2 genes in the high and low lines
of quails and in chicken
60
4.5 Screening for the polymorphisms in the FADS1 and FADS2 genes 61
4.5.1 Allele frequencies of the FADS1 and FADS2 genes in the Japanese
quail population
62
4.5.2 Genotype frequencies of the FADS2 and FADS1 genes in chicken 64
4.6 Functional roles of FADS1 and FADS2 on PUFA in the yolk of
Japanese quail
64
FADS1 64
FADS2 65
4.7 Function of FADS1 and FADS2 on MUFA and SFA in the yolk of
Japanese quail
67
FADS1 67
FADS2 68
4.8 Interaction between the FADS1 and FADS2 genes in the high and low
lines on fatty acid profiles in yolk of quail
68
5 Discussion 71
5.1 Fatty acid profiling 71
5.2 Characterisation of the FADS1 and FADS2 genes in quail 73
5.3 The expression of the FADS1 and FADS2 genes in different chicken
breeds
76
5.4 Function of FADS1 and FADS2 on the fatty acids of the yolk 78
6 Conclusions 81
7 Summary 82
8 Zusammenfassung 85
9 References 88
Acknowledgements
Curriculum Vitae
List of abbreviations
AA : Arachidonic acid, C20:4 ω-6
ACP : Acyl carrier protein
ALA : Alpha-Linolenic acid, C18:3 ω-3
BLUP : Best linear unbiased prediction
BHT : Butylhydroxitoluol
cDNA : Complementary deoxy ribonucleic acid
CDS : Coding sequence
CHD : Coronary heart disease
COX : Cyclooxygenase
CVD : Cardiovascular disease
DHA : Docoxahexaenoic acid, C22:6 ω-3
DMSO : Dimethyl sulfoxide
DNA : Deoxy ribonucleic acid
dNTP : Deoxy nucleotide triphosphate
DPA : Docoxapentaenoic acid, C22:5 ω-3
DTT : 1, 4, Dithio theritol
EDTA : Ethylenediaminetetraacetic acid
EPA : Eicosapentanoic acid, C20:5 ω-3
ER : Endoplasmic reticulum
EST : Expressed sequenced tag
ExoSAP : Exonuclease I and Shrimp Alkaline Phosphatase
FA gel : Formaldehyde agarose gel
FADS1 : Fatty acid desaturase 1
FADS2 : Fatty acid desaturase 2
FAME : Fatty acid methyl ester
FAO : Food and Agriculture Organization
FBAT : Family based association tests
FFA : Free fatty acid
FID : Flame ionization detector
GLA : Gamma-linolenic acid, C18:3 ω-6
GLM : General Linear Models
HDL : High density lipoprotein
ISSFAL : International society for the study of fatty acids and lipids
LA : Linoleic acid, C18:2 ω-6
LDL : Low density lipoprotein
LSL : Lohman selected light
LSM : Least square means
mRNA : Messenger RNA
MUFA : Monounsaturated fatty acid
MW : Molecular weight
NCEP : National Cholesterol Education Program
NRC : National Research Council
OD260 : Optical density at 260 nm wavelength (UV light)
PAGE : Polyacrylamide gel electrophoresis
PC : Phosphatidylcholine
PCR : Polymerase chain reaction
PE : Phosphatidylethanolamine
PI : Phosphatidylinositol
pmol : Picomolar
PS : Phosphatidyl serine
PUFA : Polyunsaturated fatty acid
RACE : Rapid amplification of cDNA end
REML : Restricted maximum likelihood
RNA : Ribonucleic acid
SAP : Shrimp alkaline phosphatase
SFA : Saturated fatty acid
SLS : Sample loading solution
SMART : Switching mechanism at 5’ end of RNA transcript
SNP : Single nucleotide polymorphism
SSCP : Single strand conformation polymorphism
TAE : Tris-acetate buffer
TBE : Tris-borate buffer
TE : Tris-EDTA buffer
TEMED : N,N,N’,N’-tetramethylethelenediamine
TMSH : Trimethylsulfonium hydroxide
URT : Untranslated region
VLDL : Very low density lipoprotein
WHO : World Health Organization
X-gal : 5-Bromo 4-chloro-3-indolyl-β-D-galactoside
µg : Microgram
µl : Microliter
µM : Micromolar
ω-3 : Omega-3
ω-6 : Omega-6
List of tables: Page
Table 1: Nomenclature of fatty acids 4
Table 2: Dietary recommendations for intake of polyunsaturated fatty acids 10
Table 3: Recommendations for intake of the ω-6:ω-3 PUFA ratio 11
Table 4: Fatty acid composition of the egg yolk of different poultry species 14
Table 5: The components of the egg 15
Table 6: Major lipids (% of total weight) in the yolk 15
Table 7: Fatty acid compositionsof the yolk (% total weight) 16
Table 8: Specific primers for RACE PCR on quail FADS1 and FADS2 genes 41
Table 9 Primer sequences used for screening the SNPs in quail FADS1 42
Table 10: Primers used for PCR sequencing and single base extension 43
Table 11: Specific primers used for single base extension reaction PCR 45
Table 12: Primers used for the quantitative Real-time PCR 46
Table 13: Fatty acid composition in egg yolk of the low and high Japanese quail
lines of the 5th, 6th and 7th generation
49
Table 14: Fatty acid profiles in the Ri local chicken breed 50
Table 15: Heritability estimates for the C22:6 (ω-3) and the ω-6:ω-3 PUFA ratio in
different generations of the high and low lines of quail
51
Table 16: Genetic correlation between the fatty acid traits for the high and low
lines in quail
51
Table 17: Percentage of nucleotide sequence identities of quail FADS1 and
FADS2 genes with other species using the BLAST algorithm
53
Table 18: Percentage of sequence identities of chicken FADS1 and FADS2 genes
with other species using the BLAST algorithm
57
Table 19: Polymorphic positions in the coding region of the quail FADS1 gene 61
Table 20: Polymorphic positions in the coding region of the quail FADS2 gene 62
Table 21: Allele frequencies of the FADS1 gene in the high and low quail lines 62
Table 22: Genotype frequencies of the FADS1 Val391 genotypes in the different
generations of the high and low lines
63
Table 23: Genotype frequencies of the FADS1 Val468Ala genotypes in the
different generations of the high and low lines in quails
63
Table 24: Allele frequencies of the FADS2 SNPs in the high and low quail lines in
quails
63
Table 25: Frequencies of the FADS1 and FADS2 genotypes in the different local
chicken breeds
64
Table 26: FADS1 Val391 genotype effects on the fatty acid profiles in the quail
yolk
65

Table 27: The FADS1 haplotypes associate with PUFA in the quail yolk 65
Table 28: Genotype effects of the FADS2 gene on polyunsaturated fatty acid
profiles in egg yolk
66
Table 29: The association between the FADS2 SNPs and the fatty acids profiles
by FBAT analysis
66
Table 30: FADS1 genotype effects on the fatty acid profiles in the quail yolk 67
Table 31: The FADS1 haplotypes associate with fatty acid profiles in the quail yolk 67
Table 32: Genotype effects of SNP2 of the FADS2 gene on fatty acid profiles in
egg yolk
68
Table 33: Haplotype frequencies and the association of the haplotypes of FADS2
with C16:0
68
Table 34: The FADS1 Val391 genotypes interaction with high and low lines in fatty
acid profiles
69
Table 35: The FADS1 Val468Ala genotype interaction with high and low lines in
fatty acid profiles
69
Table 36: The FADS1 haplotype interaction with lines on the mono- and
polyunsaturated fatty acids
70
Table 37: Effect of the SNP2 and SNP3 genotypes of the FADS2 gene on the fatty
acid profiles in the high and low lines
70
List of figures Page
Figure 1: The chemical structure of fatty acids 5
Figure 2: Egg yolk formation 17
Figure 3: Metabolic pathway for the conversion of dietary C16:1 (ω-7) and
C18:1 (ω-9) by the ∆5- and ∆6- desaturases
21
Figure 4: Metabolic pathways for the conversion of dietary UFAs to their LC-
PUFA
21
Figure 5: Selection scheme of the low and high lines of Japanese quail based
on EBV
31
Figure 6: Different Vietnamese local chicken breeds and European chicken 39
Figure 7: Alignment of the FADS1 amino acid sequences of quail, human, rat,
mouse and the predicted chicken
54
Figure 8: Aligment of the FADS2 amino acid sequences of Japanese quail,
cow, human, mouse, rat and chicken
55
Figure 9: Exon/intron structure of the FADS1 and FADS2 genes in quail 56
Figure 10: Aligment of FADS1 and FADS2 amino acid sequences of the
present chicken and predicted chicken FADS1, FADS2
58
Figure 11: Exon/intron structure of the FADS1 and FADS2 genes in chicken 59
Figure 12: The expression of the FADS1 and FADS2 genes in the different
local chicken breeds
60
Introduction 1
1 Introduction
Polyunsaturated fatty acids (PUFAs), especially docosahexaenoic acid (DHA, C22:6 ω-
3) and eicosapentanoic acid (EPA, C22:5 ω-3) of the ω-3 type are essential for normal
development and play an important role in the improvement of human health with
respect to e.g. cardiovascular disease, inflammatory response and brain development
(Simopoulos 2000). Therefore, decreasing the ω-6:ω-3 PUFA ratio to 5:1 in human
diets is considered to improve human health. Research on alternative food sources
enriched with ω-3 fatty acids indicated that birds are able to synthesize DHA and EPA
from ω-3 PUFAs from the diet by carbon chain elongation and desaturation and deposit
these substances into the yolk (Klassing 1998, Bavelaar et al. 2004). There are clear
differences between poultry species such as chicken, turkey, duck and goose, given
the same basic feed, regarding the deposition of DHA and EPA. In the chicken yolk
there clearly was a higher enrichment of DHA than in other poultry species (Surai et al.
1999). The modification of fatty acid composition in the egg yolk by feeding is possible
and well-examined (Simopoulos 1988, Caston et al. 1990, Watkins 1991, Cherian et al.
1992). Increasing the ω-3 fatty acid and at the same time reducing the ω-6 fatty acid
content of eggs is considered to be a feasible way to improve their nutritional value and
make them a beneficial source of DHA and EPA in terms of functional food for
improving people’s health (Van Elswyk 1997, Leskanich et al. 1997, Simopoulos 2000).
Recently, a selection experiment demonstrated that selection for high and low ω-6:ω-3
PUFA ratio is possible in Japanese quail (Mennicken et al. 2005). Until now, however,
little is known about the genetic basis of the variation of the ω-3 and ω-6 fatty acid
content of the egg yolk and to what extent the ω-3 fatty acid absorption - mainly linoleic
acid (LA, C18:2 ω-6) and α–linolenic acid (ALA, C18:3 ω-3) - and endogenous
biosynthesis rate or deposition in the egg yolk - mainly arachidonic acid (AA, C20:4 ω-
6) and DHA - contribute to the variation.
Advances in molecular techniques elucidate that the biosynthesis of ω-3 and ω-6 fatty
acids from the dietary essential fatty acid LA and ALA is catalyzed by the activity of the
fatty acid desaturase (FADS) 1 and 2 enzymes. Many studies have focused on the
activity of these enzymes, for example, cDNA encoding FADS1 has been isolated in
human (Cho et al. 1999b, Leonard et al. 2000), C. elegans (Michaelson et al. 1998a,
Watts et al. 1999) and fungi (Knutzon et al. 1998, Michaelson et al. 1998b). In addition
to FADS1, the activity of FADS2 has been found in vertebrate species such as human
(Cho et al. 1999a) and rat (Aki et al. 1999), but also in plant (Sayanova et al. 1997),
moss (Girke et al. 1998) and fungi (Zhang et al. 2004). Both genes are members of the
Introduction 2
FADS gene cluster which is located on chromosome 5 in chicken and on chromosome
11 in human. The FADS cluster is thought to arise evolutionarily from gene duplication
based on its similar exon/intron organization. FADS family members are considered
fusion products composed of an N-terminal cytochrome b5-like domain and a C-
terminal multiple membrane-spanning desaturase portion, both of which are
characterized by conserved histidine motifs.
On the basis of molecular techniques that can be used to elucidate the genetics
underlying this variation through the identification of functional candidate genes, the
objectives of this study were:
To estimate genetic parameters and direct selection response for the ω-6 and
ω-3 PUFA ratio in egg yolk of lines of the differently selected Japanese quail
To clone and characterize the direct candidate genes, FADS2, FADS1 and to
elucidate the effects of polymorphisms of these genes on the ω-6 and ω-3 fatty acid
contents in egg yolk in these divergently selected Japanese quail lines
To detect the expression of the FADS2 and FADS1 as well as their
polymorphisms in different European and Vietnamese chicken breeds.
For this study, the divergently selected Japanese quails for the high and low ω-6:ω-3
PUFA ratio as well as different European and Vietnamese chicken breeds were used.

Literature review 3
2 Literature review
2.1 Roles of omega-3 and omega-6 polyunsaturated fatty acids for human health
The quantity and quality of fat in the diet play an important role in maintaining human
health. Many studies have directly concerned the amount and type of fat intake to
specific diseases such as cardiovascular disease, hypercholesterolemia, cancer, high
blood pressure and obesity. To appreciate the functional roles of fatty acids on human
health, the chemical structure of fatty acids, their metabolism and relationship to
various diseases are reviewed in this part.
2.1.1 Chemical structure and nomenclature of fatty acids
Fatty acids contain a straight chain of carbon atoms with a carboxyl (COOH) group at
one end and a methyl group (CH3) at the other end. There are many names for the
fatty acids (Table 1). The common name was based on the source of the discovery, for
example, palmitic from palm oil or oleic from olive oil. The systematic name is using
IUPAC nomenclature to indicate the chemical structure of fatty acids. The carboxyl-
reference system indicates the number of carbons, the number of double bonds and
the positions of the double bonds counting from the carboxyl carbon. The last name is
based on the first double bond counting from the methyl end or omega end of the
molecule.
Literature review 4
Table 1: Nomenclature of fatty acids
Names Abbreviations
Trivial IUPAC Carboxyl-
reference
ω-
reference
Saturated fatty acids
Myristic acid Tetradecanoic 14:0 14:0
Palmitic acid Hexadecanoic 16:0 16:0
Stearic acid Octadecanoic 18:0 18:0
Monounsaturated fatty acids
Palmitoleic acid 7-Hexadecenoic 16:1 ∆7 16:1 ω-7
Palmitoleic acid 9-Hexadecenoic 16:1 ∆9 16:1 ω-9
Oleic acid 9-Octadecenoic 18:1 ∆9 18:1ω-9
Polyunsaturated fatty acids*
Linoleic acid 9,12-Octadecenoic 18:2 ∆9,12 18:2 ω-6
5,9-Octadecadienoic 18:2 ∆5,9
Linolenic acid 9,12,15-Octadecenoic 18:3 ∆9,12,15 18:3 ω-3
γ-Linolenic acid 6,9,12-Octadecatroenoic 18:3 ∆6,9,12 18:3 ω-6
Dihomo-γ-linolenic 8,11,14-Eicosatrienoic 20:3 ∆8,11,14 20:3 ω-6
Arachidonic acid 5,8,11,14-Eicosatetraenoic 20:4 ∆5,8,11,14 20:4 ω-6
5,8,11,14,17-Eicosapentaenoic 20:5 ∆5,8,11,14,17 20:5 ω-3
Docoxahexaenoic
acid
4,7,10,12,16,19-
Docosahexaenoic
22:6
∆4,7,10,12,16,19
22:6 ω-3
* all double bonds are of the cis configuration
Fatty acids can be divided broadly into saturated, monounsaturated and
polyunsaturated fatty acids and the properties of these fatty acids depend on the fatty
acids composing them. Fatty acids with no double bond are called saturated.
Monounsaturated fatty acids have one double bond while polyunsaturated fatty acids
have two or more double bonds. Saturated and monounsaturated fatty acids are
synthesized independently, while polyunsaturated fatty acids (PUFAs), an important
constituent of the diet, cannot be synthesized in the body and they contribute to a
multitude of cellular pathways and functions. PUFAs are divided into two main types:
the ω-6 and the ω-3 families, which are characterized by the position of first double
bond. The ω-3 PUFAs have a terminal double bond at the third carbon from the methyl
end of the acyl chain, while the ω-6 PUFAs have a double bond at the sixth carbon
Literature review 5
from the methyl end of the chain. The chemical structure of fatty acids is illustrated in
Figure 1.
Saturated fatty acid
Monounsaturated fatty acid
Polyunsaturated fatty acid
Figure 1: The chemical structure of fatty acids
2.1.2 Digestion, absorption and transportation of fatty acids
Dietary lipids consist mainly of triglycerides and small amounts of phospholipids,
cholesterol and its ester. Digestion of fat food is initiated mixing with lingual lipase,
followed by hydrolysis of triglycerides in the stomach. Gastric lipase is also important in
the initial hydrolysis of fat, especially for the short and medium triglycerides or those
with mixed chain lengths (Nelson 2000). In birds, after leaving the gizzard lipid particles
are initially sub-solubilized by bile salts and reach the duodenum as triglycerides and
phospholipids (Freeman 1984). In addition, pancreatic lipase catalyses the hydrolysis
of triglycerides at the first and third position of natural glycerides, leaving 1,2-
diacylglycerol and 2-monoacylglycerides. By the action of pancreatic lipase,
phospholipids are also hydrolyzed at the second position to free fatty acid with
cholesterol, lysophospholipids and glycerol (Freeman 1984, Nelson 2000). These
compounds combine with biliary salt to form micelles which are passively absorbed by
Literature review 6
an energy-independent mechanism by which the lipolytic products pass from the
micelle into the mucosa.
The absorption process from the intestinal lumen to the enterocyte is by passive
diffusion across the plasma membrane (Carey et al. 1983). The fatty acids, upon
entering the mucosa cells, bind to intracellular proteins depending on the degree of
saturation and chain length. Long chain unsaturated fatty acids are bound in
preferentially before short and medium chain fatty acids (Ockner et al. 1972, Brindley
1984). In chicken, the jejunum is the major intestinal site of lipid absorption compared
to the ileum and duodenum (Newman 2000).
After re-esterification in the intestinal cells, the absorbed lipids are mainly transported
in the lymph as chylomicrons, short chain fatty acids enter directly into the portal vein
system, whereas medium chain fatty acids are transported in lymph or portal blood
depending on their chain length.
Triglycerides, phospholipids, cholesterol and cholesterol esters are present in the
plasma lipids as lipoproteins. In addition, there is also a much smaller fraction of
unesterified long chain fatty acids (free fatty acids, FFAs) in the plasma.
The FFA is actively metabolized in the plasma membrane during the uptake of plasma
triglycerides into the tissues. The rate of FFA production by adipose tissue controls the
FFA in plasma because of the directly close relationship between the FFA turnover and
the FFA concentration. Therefore, the nutritional diet has not only a strong effect on the
fractional uptake of FFA but also alters the proportion of the oxidized and esterified
uptake. These FFA are attached to a membrane fatty acid binding protein in the cell,
the short chain fatty acids are more hydrophilic and are thus absorbed directly through
the cell membrane.
In addition to FFA, lipoproteins are divided into four major groups based on their
density that play an important role in physiological and in clinical diagnosis.
Chylomicrons are derived from intestinal absorption of triglycerides; very low density
lipoproteins (VLDL) are derived from liver for the export of triglycerides; low-density
lipoproteins (LDL) are representative final stages in the catabolism of VLDL; and high
density lipoproteins (HDL) are involved in VLDL and chylomicrons metabolism and in
cholesterol transport. Chylomicrons and VLDL are predominantly represented in
triglyceride whereas LDL and HDL are mostly found in cholesterol and phospholipids
(Mayes 1996). In the circulating triglycerides, both chylomicrons and VLDL contain
apolipoprotein (apo) C and E and are hydrolysed by lipoprotein lipase which is found in
the endothelial cells of the liver and is related to chylomicron remnant and HDL
metabolism. Moreover, lipoprotein lipase activity involves both phospholipids and apo
C-II as cofactors. Thus, chylomicrons and VLDL provide the enzyme for their
Literature review 7
metabolism with both substrates and cofactors. Lipoprotein lipase is expressed at
different expression levels in different tissues such as heart, adipose tissue, spleen,
lung, kidney and it is linked with the nutritional condition. The heart lipoprotein lipase
has 10 times lower Km for triglycerides than in adipose tissue enzyme. In the starving
condition the decreasing concentration of plasma triglycerides leads to diminish the
saturation enzyme in adipose tissue while the heart enzyme remains saturated with
substrate, therefore redirecting circulating substrates from adipose tissue toward the
heart, resulting in an increase the uptake of lipoprotein triglycerides (Mayes 1996).
2.1.3 Membranes and membrane lipids
Membrane lipids serve as biological boundaries for the various cell compartments, thus
are important for the life of organisms. The membranes consist of two major
components, proteins and a bi-layer lipid membrane. Hulbert and Else (1999) showed
that the degree of saturation, the type and the number of double bonds of the lipid are
related to the characteristics of the lipid bilayer and the fluidity of membrane lipids. The
bi-layer lipid is composed predominantly of phospholipids, cholesterol and a small
amount of glycolipids. The glycolipids have a role in the cell surface associated
antigens, whereas the cholesterol serves to regulate fluidity and can be found in the
lipid portion of the plasma membranes. Phospholipids are important amphipathic
molecules essential for cellular membrane formation and function, and are derivatives
from either glycerol back bone called glycerophospholipid (phosphoglycerides) or
sphingomyelin back bone. The phospholipids have fatty acids which are esterified to
the hydroxyl on the first and second carbon, while the third carbon hydroxyl is esterified
to phosphate. In membrane lipids, phosphate is in turn esterified to an alcohol of one of
the following polar head groups of ethanolamine, choline, serine, glycerol and inositol,
they are named phosphatidylethanolamine (PE), phosphatidylcholine (PC),
phosphatidylserine (PS), phosphatidylglycerol, phosphatidylinositol (PI) and
diphosphatidylglycerol. PE and PC are the most predominant phospholipids in human
(Schmid et al. 1995) and birds (Hermier et al. 1999). The polar position of the
phospholipids requires for the electrostatic charge that is needed for the surface
associations of specific cell surface proteins.
Furthermore, the activity of cell membranes as well as the equilibrium and dynamical
properties of the bi-layer lipids depend on the physical state of the lipids. Cell
membranes work well when their lipids are in the liquid crystal state which relies on the
chain length and saturation of fatty acids attached at the first and second carbon of the
Literature review 8
phospholipid. Membranes whose phospholipid fatty acids are saturated are less fluid
than those membranes containing polyunsaturated fatty acids in their phospholipids.
2.1.4 Functional fatty acids
As mentioned above, dietary fats including quality and quantity of fats have effects not
only on their absorption, transportation and metabolism but also on the membrane
physiological properties.
Saturated fatty acids (SFA) are nonessential fatty acids because they can be
synthesized by human. It is commonly accepted that diets high in saturated fat raise
plasma total cholesterol and LDL-cholesterol leading to a high risk of coronary artery
disease, diabetes and obesity (Grundy 1997), while monounsaturated fatty acids, oleic
and stearic acid, may decrease plasma total cholesterol and LDL-cholesterol (Kris-
Etherton et al. 1999). A similar result is found when SFAs are replaced with
polyunsaturated fatty acids (Goodnight et al. 1982). Linoleic acid (LA, ω-6) and α-
linolenic acid (ALA, ω-3) are called essential fatty acids that cannot be synthesized by
humans and thus must be obtained from diets. They serve as precursor for
eicosanoids. The principal eicosanoids of biological significance to humans are a group
of molecules derived from C20 fatty acid, arachidonic acid (AA, ω-6) and
eicosopentaenoic acid (EPA, ω-3), especially. These eicosanoids reside in the
membrane phospholipid bilayer of cells (Nakamura et al. 1996, Zhou et al. 2001) and
have a variety of physiological functions including eicosanoid signalling (Funk 2001),
pinocytosis (Schmidt et al. 1999), ion channel modulation (Kang et al. 1996) and
regulation of gene expression (Clarke et al. 1994).
In addition, studies have focused on prostaglandins (PGs), thromboxanes (TXs) and
leukotrienes (LTs) derived from those of AA and EPA which are produced via
cyclooxygenase (COX) and lipoxygenase (LOX). Supplement dietary of DHA and EPA
conduce to reduced production of 2-series prostaglandins (PG2), thromboxanes (TX2)
and 4-series leukotrienes (LT4) which can promote inflammation and vasoconstriction,
stimulate platelet aggregation. Moreover, the 3-series prostaglandins (PG3) and
thromboxanes (TX3) and 5-series leukotrienes (LT5), are also potent pro-inflammatory
mediator that acts as chemotaxis for neutrophils and increases their adhesion to vessel
endothelium, respect to active vasodilators and inhibitors of platelet aggregation (Lewis
et al. 1986, Weber et al. 1986, Hutchins 2005). Furthermore, DHA is a prominent fatty
acid in cell membranes and especially abundant in neural and retinal tissue. For that
reason, DHA is essential in visual and neurological development, particularly in
premature infants. Whereas, increasing the ω-6 fatty acids, particularly AA in the diet,
Literature review 9
contributes to the eicosanoid formation and the competition with ω-3 fatty acids for the
COX or LOX enzymes, thus leading to antagonistic action in physiological functions.
When interpreting the physiological significance of ω-3 fatty acids in human health,
more attention should be paid to the correct balance of ω-6 and ω-3 fatty acids in diets
with respect to not only the various diseases but also the neonatal growth and
development.
2.1.5 Dietary recommendations for the polyunsaturated fatty acids
Understanding the important role of dietary fatty acids associated with human
diseases, the developed countries especially in North America and Northern European
countries have implemented new policies to improve the current consumption patterns
that provide health benefits. The typical Western diets are currently related to high
intake of SFA that are linked to health problems such as cardiovascular disease,
diabetes and obesity. For optimal human health, total fat and cholesterol should be
reduced in the diet, particularly, the intake of saturated fatty acids should be
decreased, the intake of polyunsaturated fatty acids increased. According to the
recommendation of the National Cholesterol Education Program (NCEP) and the
American Heart Association, the total fat intake should be less than 30% of energy
content in the diet and saturated fat intake limits less than 10% of energy from fat
(Krauss et al. 1996, Lichtenstein 2003). In association with the recommendation to
reduce intake of saturated fatty acids, trans-fatty acids should be less than 0.7% of
total energy intake (Okamoto et al. 1999) and daily intake of cholesterol should be no
more than 300 mg (Dixon et al. 2001). Moreover, the National Research Council (NRC)
recommendation for the total PUFA intake should be at 7% of energy (NRC 1989). In
addition to optimal PUFA daily intake, the recommendation of linoleic acid is 1% of
energy (Sanders 2000), α-linolenic acid is 0.5 to 2.5 % of energy (Voskuil et al. 1996)
and ω-3 PUFA including EPA and DHA is 0.5% of energy (British Nutrition Foundation,
1992). Based on these recommendations, a number of dietary supplements containing
EPA and DHA have been proposed for different lifestyle choices for the overall health,
for example daily intake of EPA and DHA for adults is 0.65 g, during pregnancy and
lactation a DHA intake of 300 mg/d must be ensured (Simopoulos et al. 1999), and the
daily intake for the mental health is 2 to 4 g (Haag 2003). The recommendations of
EPA+DHA intake for the general population are shown in Table 2.

Literature review 10
Table 2: Dietary recommendations for intake of polyunsaturated fatty acids
EPA + DHA (g/d) Source
Canada 1.2-1.6 Scientific review
committee (1990)
NATO 0.8 Leskanish et al.
(1997)
ISSFAL 0.65 Simpoulos et al
(1999)
US 0.65 Kris-Etherton et al.
(2000)
WHO-NATO 0.3-0.5 Kris-Etherton et al.
(2002)
WHO FAO 0.4-1.0 2003
Amerian Heart Association 1.0 Kris-Etherton et al.
(2002)
UK SACN 0.45 Gebauer et al. (2006)
US Food and Drug Administration <3.0 Smith (2005)
The current diets in Western countries contain low levels of ω-3 PUFAs with
concomitant high levels of ω-6 PUFAs, i.e. the ω-6: ω-3 PUFAs ratio is about 25:1
(Simopoulos 1991). Therefore, the desirable dietary ω-6:ω-3 PUFA ratio
recommendations in some countries are shown in Table 3.
Increased ω-3 PUFA intakes vitamin E levels which is an antioxidizable substrate
should be considered. Daily intake of vitamin E is 0.4 mg/g LA, with 3.2 to 10.4 mg for
men and 2.5 to 8 mg for women (Leskanich et al. 1997).
Despite guidelines for an adequate quantity of these essential fatty acids have been
well established, scientists are still searching for better ratio of ω-6:ω-3 PUFA as well
as finding suitable food sources of long-chain polyunsaturated fatty acids to satify the
discussed health guidelines.
Literature review 11
Table 3: Recommendations for intake of the ω-6:ω-3 PUFA ratio
Country ω-6:ω-3 PUFA ratio Reference
Australia 8:1 Ollis et al (1999)
Canada 4:1 Holub (2002)
UK 6:1 Widdowson (2005)
USA 9.8:1 Kris-Etherton et al. (2002)
Japan 4-4.5:1 Okita et al. (1995)
Japan 4:1 Sugano et al. (2000)
FAO/WHO 5-10:1 Trautwein (2001)
Germany 5:1 Trautwein (2001)
2.2 Sources of long-chain polyunsaturated fatty acids
Seafoods, e.g. salmon, hering, mackerel, trout and sardin are considered to be a good
source for the ω-3 fatty acids, especially EPA and DHA. The dietary recommendations
for optimal health are at least two meals per week with a high amount of sea-fish.
However, the modification of food enriched with fish does not correspond to the
consumer preferences because of a number of factors including the preference for
fresh or frozen steaks, price perception and income. Besides, the world population
increased in recent years while marine resources continued decreasing because of the
expansion of the deep-sea fishing and also the environmental impacts on fish farms
(Pauly et al. 2002, Hites et al. 2004). Furthermore, the high levels of mercury
accumulates with in some kinds of fish are also of concern. Therefore, seafoods are
unlikely to be a sustainable solution to efficiently supply these valuable fatty acids in a
long term approach.
An alternative approach for increasing ω-3 fatty acid supplements may be by
pharmacologic intake. However, the danger of an uncontrolled overdose by the user
exists and it is also problematic because of palatability when consuming these
"enriched" foods.
Poultry products, e.g. poultry meat and in particular eggs, may provide an exciting
alternative food source due to its large acceptance as well as a source of ω-3 fatty
acids (Van Elswyk et al. 1992), despite a consistently high fat content in the egg yolk
which contains appoximately 33g fat/ 100g yolk or 6g fat/ egg (Noble et al. 1990). The
enrichment of ω-3 fatty acids in eggs plays an important role in increasing the
nourishing food for a part of the population. In fact, the egg yolk has a high digestibility,
a balanced amount of amino acids, bioavailable sources of carotenoids, lutein and
Literature review 12
zeaxanthin (Handelman et al. 1999). Besides, egg yolk contains high vitamins (A, E, K,
B1, B2, B6), folic acid and particular mineral sources (Na, K, Ca, P, Mg, F, Fe)
(Burrington 2000).
The egg is regularly consumed in large quantities in many Western countries and it
seems to have increased when measured by the total egg consumption or per capita
egg consumption. According to Speedy (2003), per capita egg consumption is 384
eggs in Japan, 320 eggs in France, 322 eggs in the Netherlands, 294 eggs in
Denmark, 290 eggs in America, 288 eggs in Mexico and 274 eggs in Malaysia. In
Germany, the average egg consumption is 244 eggs per-capita (Speedy 2003). From
these data, the average daily consumption is about 3,7 g yolk fat which comprises
about 34% saturated fatty acids, 45% monounsaturated fatty acids and 18%
polyunsaturated fatty acids, thus yolk fat contains less saturated than unsaturated fatty
acids. With regard to the beneficial effects of unsaturated fatty acids, yolk fatty acid
composition corresponds to the recommendations of NCEP and DGE (1991), i.e. the
dietary intake of fat should not exceed 10% saturated fatty acids as well as at least
30% monounsaturated fatty acids and polyunsaturated fatty acids. Furthermore, an
enriched egg can provide approximately 400 mg ω-3 PUFA containing about 290 mg of
EPA and DHA, thus the hen egg can supply a half amount of the recommended daily
intake of the ω-3 PUFA (Farrell 1998). However, the ω-6:ω-3 PUFA ratio in the egg yolk
is still too high.
2.3 Changing the fatty acid profile in the egg yolk
2.3.1 Changing by feeding
Poultry species are able to convert from the diet to long chain polyunsaturated fatty
acids, DHA and EPA, by desaturation and elongation from their preliminary fats such
C18:2 (ω-6) and C18:3 (ω-3) (Farrell 1994). The ω-3 PUFA in the egg yolk can be
increased by changing the dietary fat of the laying hens and it has been well examined
(Leskanich et al. 1997).
The distribution of various dietary fats contribute to increasing the ω-3 PUFA of yolk fat.
Fish oil and seed oil products are successfully used as an alternative source of DHA
and EPA in the laying hen’s diet. For example, hens fed with a diet containing 10% of
flax seed oil could transfer ω-3 fatty acid to the egg with approximately 264 mg of ALA
and 92 mg of DHA and EPA (Ferrier et al. 1995). Farrell (1995) showed that hens fed
with a diet of alga product or fish oil increased the ω-3 PUFA deposition in yolk to 470
Literature review 13
mg/egg, containing 250 mg EPA and DHA. Furthermore, the ω-6:ω-3 PUFA ratio in the
yolk fatty acid was reduced approximately from 11-14:1 to less than 2:1 (Caston et al.
1990, Cherian et al. 1992, Farrell 1995, Eder et al. 1998). Thereby, an enriched ω-3
egg can meet the daily consumption of ω-3 PUFA as the current recommendations
(Table 2 and 3).
However, Van Elswyk et al. (1992) have shown that a hen’s diet containing 3%
menhaden oil was able to differently taste and flavour between ω-3 enriched and
control scrambled eggs. It is suggested that to enhance the yolk ω-3 fatty acid, fish oil
should be not over 3% in the hen diet. Besides, the levels of dietary antioxidants should
be increased in order to prevent unwanted smell and flavour derives in the product
(Leskanich et al. 1997).
2.3.2 Breeding changes the fatty acids
The nutritional manipulation in the laying hen’s diets including the sources of ω-3 fatty
acids promotes the deposition of these nutrients into egg yolk (Leskanich et al. 1997).
There are clear differences between poultry species such as chicken, turkey, duck and
goose, given the same basic feed, regarding the deposition of DHA and EPA. In the
chicken yolk there was clearly a higher enrichment of DHA (Leskanich et al. 1997,
Surai et al. 1999) (Table 4). Differences in yolk fat content have been found on different
strains and breeds (Washburn 1979) or different chicken breeds and hybrid origins
(Ahn et al. 1995, Scheideler et al. 1998). In addition, the fatty acid profiles of the yolk
can be greatly affected by age or between breed and age of the hens (Noble et al.
1986, Washburn 1990, Scheideler et al. 1998). The body fat content of the hen also
affects to the yolk fat. The study of Hargis (1988) supported that the egg yolk
cholesterol are not correlated to cholesterol levels of laying hens, however an increase
of the antioxidable substrates as vitamin E, carotenoide with the increase of the PUFA
content in the yolk is desirable (Cherian et al. 1997, Hartfiel et al. 1997, Surai et al.
1997). The absorption rate of linoleic acid (LA C18:2 ω-6) and particularly α-linolenic
acid (ALA C18:3 ω-3) increases with the age of the hens (Scheideler et al. 1998) and
the ω-6:ω-3 PUFA ratio in the egg yolk changes in the process of the laying period.
Literature review 14
Table 4: Fatty acid composition of the egg yolk of different poultry species
Fatty acid Chicken Turkey Goose Duck
14:0 0.4 0.5 0.7 0.5
16:0 25.8 28.9 31.2 26.4
16:1 ω-7 2.1 8.8 3.8 2.7
18:0 8.6 7.9 7.0 6.4
18:1 ω-9 40.5 39.5 41.9 47.0
18:1 ω-7 1.6 3.3 2.0 1.9
18:2 ω-6 14.7 8.6 9.3 5.6
18:3 ω-3 0.4 0.3 0.4 0.3
20:1 ω-9 0.3 0.2 0.4 0.5
20:4 ω-6 1.7 1.2 2.3 4.0
22:6 ω-3 1.6 0.4 0.3 0.6
Adapted from Surai et al. (1999)
Furthermore, results of Zaky et al. (1996) pointed out that a selection on "egg mass
feeding utilization" over eight to nine generations, reduced the content of saturated
fatty acids in chickens eggs and increased the ratio of polyunsaturated fatty acids to
saturated fatty acids (P/S ratio).
Recently, our research group showed that genetic variance is present in the poultry
which can be used for the enrichment of ω-3 fatty acids and lowering of the ω-6:ω-3
PUFA ratio (Mennicken et al. 1997, Mennicken et al. 2000). However, up to now little is
known about the genetic basis of the variation of the ω-3 and ω-6 fatty acid content of
the egg yolk and to what extent the ω-3 fatty acid absorption, mainly on LA and ALA,
and endogenous biosynthesis rate or deposition in the egg yolk, mainly on AA and
DHA, contribute to variation.
2.4 Egg formation and fat deposition
2.4.1 Composition of eggs
The egg contains three components including shell, yolk and egg white. The
corresponding proportions are given in Table 5. The major components of yolk are
lipids and proteins (2:1). The yolk contains 15.7 to 16.6% protein, 31.8 to 35.5% lipid,
0.2 to 1.0% carbohydrate and 1.1% ash in water (Powrie and Nakai 1986). All lipids are
deposited into the yolk during maturation. The yolk lipids consist of triacylglyceride
Literature review 15
(63%) which is considered a neutral lipid, phospholipid (30%) which consists of
phosphatidyl choline or lecithin and cholesterol (5–6%) (Table 6). These lipids are
associated with at least two proteins, vitellin and vitellenin (Shenstone 1968).
Table 5: The components of the egg
Estimated mean Reported values
% of whole egg
Shell 10.5 7.8 – 13.6
Yolk 31.0 24.0 – 35.5
White 58.5 53.1 – 68.9
Total edible contents 89.5 86.4 – 92.2
(Shenstone 1968)
Within yolk triacylglyceride, oleic acid is the most predominant and it is twice as much
as the phospholipids (Table 7). A high amount of AA and DHA in comparison with other
components are present in phospholipids (Leskanich et al. 1997). Many studies have
shown that the fatty acid composition of the diet directly affects the fatty acid
composition of the total phospholipid of the yolk (Balnave 1970, Halle 1997). However,
the dietary fatty acid composition will not alter the total amount of saturated fatty acids
in total yolk lipid. The alteration in the yolk fatty acids is effected mainly by an increase
in the linoleic acids with concurrent decrease in the oleic acid content when there is an
increase in dietary fatty acids containing two or more double bonds (Coppock et al.
1962, Chen et al. 1965, Summers et al. 1966).
Table 6: Major lipids (% of total weight) in the yolk
Chicken1 Pharaoh2 Golden2 White2
Cholesterol esters 1.3 1.13 1.16 1.00
Triglycerides 63.1 58.67 64.12 52.13
Free fatty acids 0.9 - - -
Free cholesterol 4.9 3.51 3.89 2.98
Total cholesterol 6.2 4.64 4.85 3.98
Phospholipids 29.7 - - -
Phosphatidylethanolamine 23.9 - - -
Phosphatidylcholine 69.1 - - -
Phosphatidylserine 2.7 - - -
1 chicken yolk (Noble 1987)
2 quail yolk of different origin (Tarasewicz et al. 2004)
Literature review 16
Table 7: Fatty acid compositions of the yolk (% total weight)
Fatty acid Triacylglyceride Phospholipid
16:0 24.5 28.4
16:1 ω-7 6.6 1.9
18:0 6.4 14.9
18:1 ω-9 46.2 29.5
18:2 ω-6 14.7 13.8
18:3 ω-3 1.1 0.3
20:4 ω-6 0.3 6.2
22:6 ω-3 <0.2 4.1
Leskanich et al. (1997)
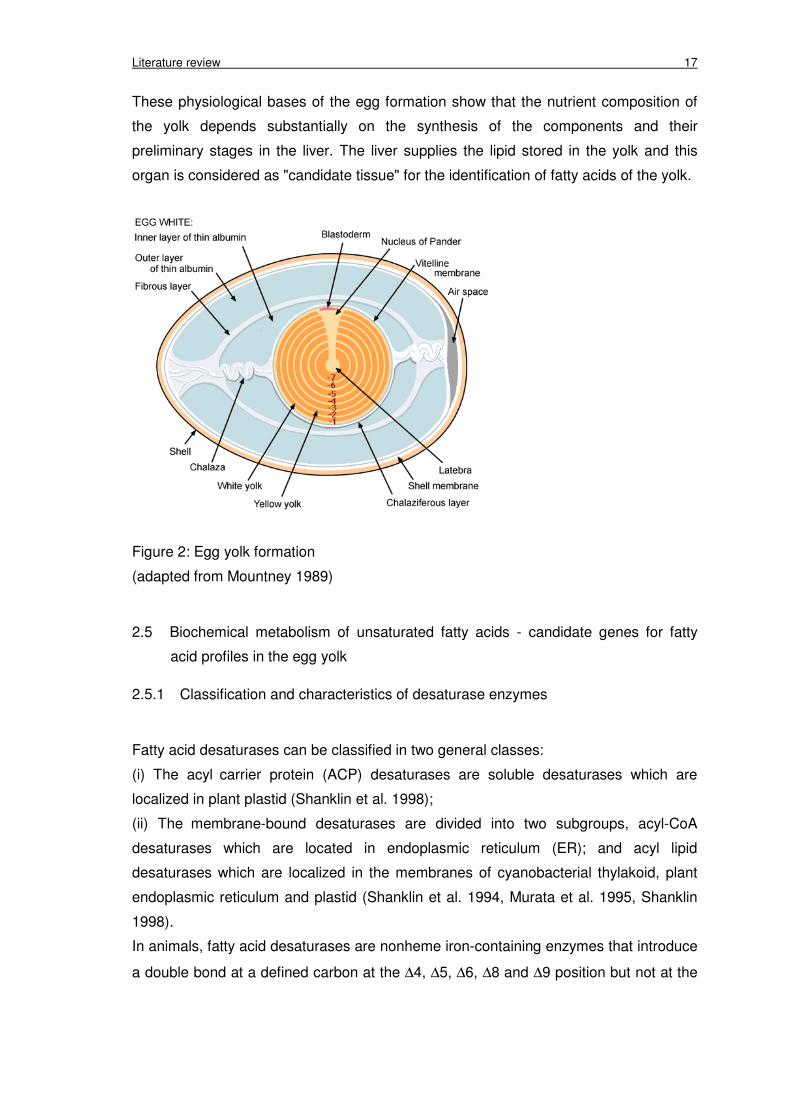
2.4.2 Yolk formation and fat deposition
The yolk is formed not only in the growing follicle and the ovary but also in the liver of
the laying hens and it is prompted by estrogenic stimulation (Gilbert 1972). The yolk
comprises two kinds of yolk; white yolk is formed in the second stage and contains
more protein and yellow yolk is accumulated in the third stage of the yolk formation and
contains more fat (Figure 2).
Yolk is formed in one of many follicular sacs of the ovary; the cell membrane of ovum is
surrounded by a non-cellular vitellin membrane and then hen’s liver takes lipid nutrients
from the bloodstream to the ovary and turns them into yolk.
During the yolk development the liver produces two major yolks, vitellogenin and VLDL
which are taken up from the blood by developing oocytes in the ovary via receptor-
mediated endocytosis. This oocyte vitellogenesis receptor (OV receptor) belongs to the
LDL receptor superfamily that shows high sequence identity with the mammal VLDL
receptors, which is an essential receptor in avian species. Receptor-deficient mutant
hens are sterile and exhibit severe hyperlipaemia with aortic artherosclerosis
(Schneider 1996, Bujo et al. 1996). Vitellogenin is synthesized by estrogenic hormones
from the ovary and is taken up into the ovum.
When yolk matures, the follicle ruptures along a line relatively free from blood vessels
known as the stigma, and the yolk is released. After a few hours the yolk is coated with
an albumen layer and the shell membranes are deposited during the egg passing into
the isthmus. Continuously the calcification takes place in the uterine region and also
pigment is formed. Finally, the egg passes into the vagina and cloaca for laying.
Literature review 17
These physiological bases of the egg formation show that the nutrient composition of
the yolk depends substantially on the synthesis of the components and their
preliminary stages in the liver. The liver supplies the lipid stored in the yolk and this
organ is considered as "candidate tissue" for the identification of fatty acids of the yolk.
Figure 2: Egg yolk formation
(adapted from Mountney 1989)
2.5 Biochemical metabolism of unsaturated fatty acids - candidate genes for fatty
acid profiles in the egg yolk
2.5.1 Classification and characteristics of desaturase enzymes
Fatty acid desaturases can be classified in two general classes:
(i) The acyl carrier protein (ACP) desaturases are soluble desaturases which are
localized in plant plastid (Shanklin et al. 1998);
(ii) The membrane-bound desaturases are divided into two subgroups, acyl-CoA
desaturases which are located in endoplasmic reticulum (ER); and acyl lipid
desaturases which are localized in the membranes of cyanobacterial thylakoid, plant
endoplasmic reticulum and plastid (Shanklin et al. 1994, Murata et al. 1995, Shanklin
1998).
In animals, fatty acid desaturases are nonheme iron-containing enzymes that introduce
a double bond at a defined carbon at the ∆4, ∆5, ∆6, ∆8 and ∆9 position but not at the
Literature review 18
∆12 or ∆15. These reactions occur in the endoplasmic reticulum and utilise acyl-CoA
as substrates and require O2 and NAD(P)H which comprises NAD(P)H-cytochrome b5
reductase, cytochrome b5 and a terminal desaturase. In the process of double bond
formation, the membrane bound cytochrome b5 transfers electron by lateral diffusion
from NADH cytochrome b5 reductase to the terminal desturase. Alignment of the
amino acid sequences of membrane-bound desaturases reveal three conserved his-
boxes that contain eight histidine residues HX(3-4)H, HX (2-3)HH and H/QX(2-3)HH. These
histidine residues have been implicated in the binding of di-iron, necessary for catalytic
activity (Napier et al. 1997, Michaelson et al. 2002).
2.5.2 Biosynthesis pathways of unsaturated fatty acids
Birds are able to synthesize DHA and EPA from ω-3 PUFAs from the discriminate
foods by carbon chain elongation and desaturation and deposit these substances into
the yolk. In birds, liver is an active site for the synthesis of fatty acids compared to
adipose tissue (Volpe and Vagelos 1973, Bloch and Vance 1977, McGarry and Foster
1980). The biosynthesis pathways of fatty acids in birds are similar to those that have
been described in mammals (Sprecher 1981). The biosynthesis of unsaturated fatty
acids are supported by desaturase enzymes, which catalyze the introduction of double
bonds into preformed acyl chains by removal of a pair of hydrogens, concomitant
oxidation of an electron donor and reduction of O2 (Shanklin et al. 1998, Girke et al.
1998). The essential fatty acids have different metabolic pathways which are influenced
by dietary fat, type and the amount of essential fatty acids. The main pathway for de
novo synthesis of fatty acids occurs in the cytoplasm.
∆9-desaturase or stearoyl-CoA-desaturase (SCD)
Stearoyl–CoA desaturase (SCD) is the rate-limiting enzyme in the biosynthesis of
monounsaturated fatty acids by introducing the double bond at the 9 to 10 position of
the carboxyl end of fatty acids (Nakamura et al. 2004). The preferred desaturation
substrates are mainly palmitoleic and oleic acids which are converted to palmitoleoyl–
CoA (C16:1) and oleoyl–CoA (C18:1), respectively (Volpe et al. 1973, Enoch et al.
1976, Sprecher 1981, Kasturi et al. 1982, Wakil et al. 1983, Ntambi 1995, Ntambi et al.
1999). These reactions require oxygen (O2), NADH and an electron transport sequence
comprising NADH-cytochrome b5 reductase, cytochrome b5 and SCD (Nakamura et al.
2004). The deduced amino acid sequences indicate that this enzyme contains three
Literature review 19
conserved histidine motifs which are essential for enzyme activity (Shanklin et al.
1994).
SCD has been cloned in rat (Thiede et al. 1985, 1986, Strittmatter et al. 1988), mouse
(Madsen et al. 1997, Ntambi et al. 2003), chicken (Prasad et al. 1979), human (Li et al.
1994, Cadena et al. 1997) and carp (Tiku et al. 1996, Macartney et al. 1996).
∆6-desaturase or FADS2
LA (C18:2 ω-6) and ALA (C18:3 ω-3) are essential fatty acids (EFAs) and considered
as precursors of long chain ω-6 and ω-3 fatty acids. ∆6-desaturase, one of these rate-
limiting enzymes, catalyzes the bioconversion of the C18:2 into C18:3 and C24:4 into
C25:5 in the ω-6 series and of the C18:3 into C18:4 and C24:5 into C24:6 in the ω-3
series (Voss et al. 1991, Sprecher et al. 1995) (Figure 3). LA is rapidly incorporated
into tissue and complex lipids and elongated and desaturated to AA (Lands et al.
1990), whereas ALA is even more strikingly eliminated from the tissues. ALA is slowly
converted to EPA and DHA. In the contrary, AA may be metabolized at a much faster
rate than DHA (Adam et al. 1986).
When in diet essential fatty acids are deficient or absent, ∆6-desaturase enzyme will
introduce double bonds into the n-9, n-12, and n-15 positions of the carbon chain of n-9
series (Figure 4) by desaturation of eicosaenoic acid to eicosatrienoic acid or “mead
acid” which is characteristic for essential fatty acid deficiency (Fulco et al. 1959, Mead
1968, Retterstol et al. 1995, Mayes 1996, Fokkema et al. 2002). This long chain PUFA
is neither an “essential fatty acid” nor replaces AA or compensate for the deficiency of
EFAs symptoms, however, it could be combined into the same tissues and complex
lipids as AA (Nelson 2000).
So, the ∆6-desaturase participates in at least three reactions for the conversion of LA,
ALA and C24:5 (ω-3) into their respective products of fatty acids (Inagaki et al. 2003).
The activity of ∆6-desaturase enzyme has been studied in vertebrate species such as
human (Cho et al. 1999a) and rat (Aki et al. 1999), but also in plant (Sayanova et al.
1997), moss (Girke et al. 1998) and fungi (Zhang et al. 2004).
Analysis of amino acid sequences has shown that ∆6-desaturase contains an N-
terminal cytochrome b5-like domain together with heme binding motifs. HDxGH,
HFQHH and QIEHH are the three histidine motifs that characterize the membrane-
bound desaturase (Shanklin et al. 1994, Los and Murata 1998, Marquardt et al. 2000,
Nakamura et al. 2004).
Literature review 20
∆5- desaturase or FADS1
∆5-desaturase is involved in the last step of biosynthesis of long chain PUFAs AA
(C20:4 ω-6) from the dihomo-γ-linoleic acid (C20:3 ω-6); and EPA (C20:5 ω-3) from
C20:4 (ω-3) (Leikin et al. 1992, Horrobin 1992, Leonard et al. 2000) (Figure 3).
Because of competition between ω–6 and ω–3 fatty acids for desaturase and elongase
enzymes, the quantity of linoleic acid in the diet can affect the extent of ALA conversion
to EPA and DHA (Simopoulos 1988, Ackerman 1995). cDNAs encoding ∆5-desaturase
have been isolated in human (Cho et al. 1999b, Leonard et al. 2000), Caenorhabditis
elegans (Michaelson et al. 1998a, Watts et al. 1999) and Mortierella alpine (Michaelson
et al. 1998b).
2.5.3 Function of ∆9-, ∆6- and ∆5-desaturases
Function of ∆9-desaturase
SCD catalyses the synthesis of oleic acid (18:1 ω-9), the main product of this enzyme,
present in most tissues as an energy reserve. This fatty acid is a requisite component
of membrane phospholipids, triglycerides, cholesterol esters and wax esters that can
affect lipoprotein metabolism and adiposity (Miyazaki et al. 2001a,b,c). High SCD
activity has been implicated in a wide range of disorders including diabetes,
artherosclerosis, cancer, obesity and viral infection (Enser 1975, Khoo et al. 1991, Li et
al. 1994, Pan et al. 1994, Jones et al. 1996, Lee et al. 2001, Miyazaki et al. 2001b).
Function of ∆6- and ∆5-desaturases
∆6- desaturase and ∆5- desaturase are the key enzymes for the synthesis of long
chain polyunsaturated fatty acids such as AA (C20:4 ω-6) and DHA (C22:6 ω-3)
(Emken et al. 1992, Pawlosky et al. 1992, Sprecher et al. 1995, Sprecher 1996) that
are incorporated in phospholipids (PLs) and perform essential physiological functions.
The ∆5- and ∆6-desaturases are considered as the rate limiting steps in the
biosynthesis of long chain PUFAs. Both prefer as substrate fatty acids with double
bonds in the ω-6 and, secondarily, the ω-3 position of the carbon chain. DHA (C22:6 ω-
3) is the most predominant product whilst DPA (C22:5 ω-3) does not accumulate
appreciably when adequate ω-3 fatty acids are in the diets (Sprecher et al. 1995,

Literature review 21
Sprecher 1996). Sprecher and co-workers (Sprecher and Lee 1975, Bernert and
Specher 1975, Sprecher 1991) have shown that dietary PUFAs are not elongated and
then desaturated but rather are desaturated and then elongated. The vital functions of
AA and DHA in human health are discussed in the section 2.2.1
Figure 3: Metabolic pathways for the conversion of dietary UFAs to their LC-PUFA
(adapted from Sprecher 1981)
Figure 4: Metabolic pathway for the conversion of dietary C16:1 (ω-7) and C18:1 (ω-9)
by the ∆5-, ∆6- desaturases
(adapted from Sprecher 1981)
Literature review 22
2.5.4 Expression and factors regulating ∆6- and ∆5- desaturases
The availability of long chain C20 and C22 PUFAs greatly depends on the activity of
the enzymes involved in the biosynthesis pathways by ∆6- and ∆5- desaturases and
elongases (Specher 1981). Both, ∆6- and ∆5- desaturases are expressed in different
tissues, such as in adrenal gland, liver, brain, testis in both rat (Matsuzaka et al. 2002)
and human (Cho et al. 1999b) with the highest level of expression in liver (Scott et al.
1989). In rat testis, the ∆6- and ∆5- desaturases have the same expression pattern
(Matsuzaka et al. 2002). However, the expression and activity of the ∆6- and ∆5-
desaturases depend on age which depletes the ∆6- desaturase level in the testes and
liver in rat (Horrobin 1981).
The activity of the ∆6- and ∆5- desaturase enzymes is mainly controlled by nutritional
and hormonal factors (Wakil et al. 1983, Brenner 1989). The synthesis of fatty acids
increases in response to the low dietary fat intake and decreases when the intake is
high (Newman 2000). Furthermore, dietary ω-3 and ω-6 use the same enzymes of ∆5-
and ∆6- desaturases in the biosynthesis pathway leading the competition between ω-3
and ω-6 acids for these enzymes in order to produce their final products. Therefore, the
activities of these enzymes can probably be altered by diet and by hormone status
(Brenner 1989).
Food
Dietary saturated fatty acids are effective in suppressing de novo fatty acid synthesis. A
higher content of saturated fats and trans fatty acids can inhibit the activity of ∆6-
desaturase and thereby lead to a decrease of the ratio between ALA and LA (Wahl et
al. 2002). Moreover, studies on rats showed that rats fed with a diet of fish oil displayed
less desaturase activity than rats fed a beef tallow diet or a linseed oil diet. When these
diets were enriched with cholesterol, the desaturase activity was reduced, especially
the ∆5-desaturase (Garg et al. 1988). Another study has demonstrated that the higher
the corn oil contents in the diet, the lower the expression of both desaturases
(Rodriguez-Cruz et al. 2006).
Dietary PUFAs suppressed the genes involved in fatty acid synthesis including SCD,
∆5- and ∆6- desaturases (Holloway et al. 1975, Clarke et al. 1994, Ntambi et al. 1996).
In diets high in ω-3, most of ∆5-desaturase is used for the ω-3 pathway and thus little is
available to convert DGLA into AA while in a low ω-3 diet, most of ∆5-desaturase is

Literature review 23
ready for conversion DGLA to AA (Emken et al. 1992). The enzymatic activity of both
desaturases is reduced by diabetes (Holman et al. 1983, Igal et al. 1991, Poisson et al.
1991) or by fasting and it is induced by re-feeding carbohydrate (Brenner 1989,
Poisson et al. 1991).
Hormones
Despite these different physiological roles of SCD, ∆5- and ∆6-desaturases, these
desaturases share common regulatory features including dependence of expression on
insulin, glucagons, adrenaline, glucocorticoids and andrenocorticotropin hormones
(Mandon et al. 1987, Nakamura et al. 2002). Many studies have concerned the effect
of insulin, which up regulates the desaturase activities, especially in ∆6-desaturase
(Mandon et al. 1987, Brenner 1989, Saether et al. 2003). Besides, the activity of ∆5-
desaturase is suppressed by the hormone glucagons (Brenner 2003) while ∆6-
desaturase is inhibited by adrenaline (Joshi and Aranda 1979, Brenner 2003).
2.6 Molecular genetic background and strategies for candidate gene identification
and influence on the fatty acid profiles.
Nowadays, the combination of genetic and molecular approaches has given more
evidences how genes determine the physical traits to develop products and practices
for use by society. For example, in plant it can be used to alter the amount of the acyl
groups normally in a species or to introduce exotic acyl groups (Slack and Browse
1984, Somerville and Browse 1988, Hammond and Glatz 1989, Hills et al. 1991,
Somerville 1993, Kinney 1997). In animals, the genetic selection as well as feeding
practices resulted in a considerable reduction in muscular fat (Rhee 1992) or milk fatty
acids (Karijord et al. 1982). Furthermore, linkage mapping or positional cloning has
successfully characterized the affect of back fat on porcine chromosome 4 by a large
QTL (Andersson et al. 1994, Knott et al. 1998, Walling et al. 1998), fatness traits on
chicken (Jennen 2004). Therefore, based on the selection of a population, genetic
regions associated with the fatty acid profiles can be identified. This approach could
compliment classical genetic selection programs currently used to modify the fatty acid
composition of egg yolk. ω-6:ω-3 PUFA ratios are desired in the first step of the
selection process. Through selection, the genetic value of the animals in a population is
estimated and it is affected by genetic variation in the population, accuracy of selection
and generation (Mennicken et al. 2000, 2005).
Literature review 24
Quails (Coturnix coturnix) are particularly used as avian model in many fields of
biological and medical research, especially it is considered as a standard laboratory
animal because it requires short generation intervals and also their genetic parameters
are similar to the other poultry species (Wilson et al. 1961). Because of that, quail
contribute an important role in agricultural production. The first genetic linkage map of
the Japanese quail was reported by using microsatellites (Pang et al.1999, Kayang et
al. 2000, 2004) or the amplified fragment length polymorphism (AFLP) markers
(Roussot et al. 2003). Recently studies have found the association between the QTL
and egg production traits involved in shaping the egg laying curve (Minvielle et al.
2006). However, the limited information that is available on the genetics of the
Japanese quail.
Along with quantitative traits, candidate gene identification provides new opportunities
for the exploitation by understanding the fundamental biological mechanism.
Considerable attention has focused on the beneficial effects of polyunsaturated fatty
acids that are converted into long chain polyunsaturated fatty acids, including AA and
DHA by the enzymes involved in the conversion of essential fatty acids into longer-
chain and highly unsaturated fatty acids e.g. ∆5-desaturase (FADS1) and ∆6-
desaturase (FADS2).
Finally, selected candidate genes need to be characterized and examined for their
ability to be used in the breeding schemes.
Material and Methods 25
3 Material and Methods
3.1 Chemicals, reagents and media and commercial kits
3.1.1 Chemicals and kits
Biomol (Hamburg): Phenol, Lambda DNA Eco91I (BstE II) and Lambda DNA HindIII
Biozym Diagnostik (Hessisch-Oldendorf): Sequagel XR sequencing gel (National
Diagnostics)
Roth (Karlsruhe): Acetic acid, Ampicillin, Ammonium peroxydisulphate (APS),
Butylhydroxitoluol (BHT), Boric acid, Bromophenol blue, Calcium chloride,
Chlorofrom, Dimethyl sulfoxide (DMSO), dNTP, Ethylenediaminetetraacetic
acid (EDTA), Ethanol, Ethidium bromide, Formadehyde (37%), Formamide,
Glycerin, Hydrochloric acid, Hydrogen peroxide (30 %), Isopropyl b-D-
thiogalactoside (IPTG), Methanol, N,N´-dimethylform-amide, Nitric acid,
Peptone, Proteinase K, Sodium dodecyl sulphate (SDS), Silver nitrate,
Sodium carbonate, Sodium chloride, Sodium hydroxide, N,N,N´,N´-
Tetramethylethylene-diamine (TEMED), Tris, 5-bromo-4-chloro-3-indolyl-b-D-
galactopyra-noside (X-gal), Xylencyanol and Yeast extract.
Larodan Fine Chemical AB: Mixture Me 61, Mixture Me 63, Mixture Me 81
Serva Electrophoresis GmbH (Heidelberg): Acrylamide (molecular biology grade) and
Bisacrylamide.
Sigma-Aldrich Chemie GmbH (Taufkirchen): Agarose, Blue dextran, Calcium chloride,
Diethyl barbituric acid, Ethylene glycol-bis (2-amino- ethylether)-N,N,N´,N´-
tetraacetic acid (EGTA), Isopropanol, Magnesium chloride, Penicillin, Sodium
barbiturate, Tri reagent.
3.1.2 Reagents and media
All solutions used in this investigation were prepared with deionized and demineralized
(Millipore) water and pH was adjusted with sodium hydroxide or hydrochloric acid.
APS solution: Ammoniumpersulfat 5 g
10% (w/v) water added to 50 ml
Acrylamide 40% : Acrylamide 76g (78.4g)
19:1 (49:1) Bis-acrylamide 4g (1.6g)
water added to 200 ml
Acrylamide gels 6% (12%): 40 % Acrylamide 6.75 ml(4.5 ml)

Material and Methods 26
water 46.25 ml (12.75
ml)
10% APS (100 mg/ml) 400 µl (130 µl)
TEMED 40 µl (10 µl)
Acetic acid 10% Acetic acid 100 ml
water added to 1000 ml
Blue dextran buffer: Blue dextran (50 mg/ml) 1 ml
EDTA 0.5M (186.1 mg/ml) 50 µl
Formamide 5 ml
IPTG solution: IPTG 1.2 g
water added to 10 ml
LB-agar plate: Sodium chloride 8 g
Peptone 8 g
Yeast extract 4 g
Agar-Agar 12 g
Sodium hydroxide (40 mg/ml) 480 µl
water added to 800 ml
LB-broth: Sodium chloride 8 g
Peptone 8 g
Yeast extract 4 g
Sodium hydroxide(40 mg/ml) 480 µl
water added to 800 ml
Lysis buffer: SDS (10%) 200 µl
Tris-HCl 1M (pH 8.0) 4 ml
EDTA 0.5M (pH 8.0) 4 ml
Proteinase K 2% (w/v) 4.44 ml
Mercaptoethanol 4 ml
water added to 200 ml
Natrium acetate solution (3M): Natrium acetate (pH 5.3)
water added to
133.05 g
500 ml
Nitric acid (1%) Nitric acid (66%)
water added to
PAA loading buffer: Formamide 98 % (v/v)
EDTA 0.5M (pH 8.0) 10 mM
Bromophenol blue 0.5 mg/ml
Xylenzyanol 0.5 mg/ml
Material and Methods 27
Proteinase K solution: Proteinase K in 1× TE-buffer 2% (w/v)
Saline Na2HPO32H2O 6.19 g
KH2PO4 2.54 g
NaCl 4.14 g
Formaldehyde (37%) 125 ml
Distilled water 100 ml
SDS solution: Sodium dodecylsulfat in water 10% (w/v)
Sequence loading buffer: Formamide 83% (v/v)
EDTA 0.5M ( pH 8.0) 4 mM
Blue dextran 10m g/ml
Silane solution: Silane 3 µl
Ethanol 95% (added) 1 ml
Silver staining solution: Sodium carbonate 30 g
(Development solution) water added to 1000 ml
Formaldehyde 1500 µl
Silbernitrate solution: Silbernitrate 5 g
(0.2%) water added 2500 ml
SSCP loading buffer: Formamide 47.5 ml
Sodium hydroxide 200 mg
Bromophenol blue 125 mg
Xylenecyanol 125 mg
50× TAE-buffer, pH=8 Tris 242 mg
Acetic acid 57.1 ml
EDTA 0.5M (186.1 mg/ml) 100 ml
water added to 1000 ml
10× TBE-buffer: Tris 108 g
Boric acid 55 g
EDTA 0.5M (186.1mg/ml) 40 ml
water added to 1000 ml
1× TE-buffer: Tris 1M 10.0 ml
EDTA 0.5M (186.1 mg/ml) 2.0 ml
water added to 1000 ml
X-gal: X-gal 50 mg
N, N´-dimethylformamide 1 ml
Glycogen Glycogen 20 mg
water added to 1 ml
Material and Methods 28
3.1.3 Commercial kits
CEQTM DNA Size Standard 80 Kit BECKMAN COULTERTM
CEQTM SNP-Primer Extension Kit BECKMAN COULTERTM
Dye Terminator Cycle Sequencing BECKMAN COULTER
Exo-SAP-IT usb
Gen EluteTM Plasmid Miniprep Kit Sigma, Eppendorf
Oligonucleotide primers MWG Biotech, Ebersberg
PGEM-T and PGEM-T Easy Vector Systems Promega
QIA quick PCR purification Kit Qiagen, Hilden
Recombinant RNasin Ribonuclease Inhibitor Promega
Rneasy Mini Kit Qiagen
RQ1 Rnase-free DNAse Promega
SequiTherm EXCELTMII Biozym Dianostic
Shrimp Alkaline Phosphatase usb
SMARTTM RACE cDNA Amplification Kit BD Biosciences Clontech USA
SuperScriptTM II Reverse Transcriptase Invitrogen
Taq DNA polymerase GENCRAFT
3.2 Equipments
Automated sequencer LI-COR 4200 MWG (Ebersberg)
Automated sequencer CEQ 8000 Beckman Coulter
Centrifuge HERMLE Z233MK HERMLE (Wehingen)
Centrifuge HERMLE Z323K HERMLE (Wehingen)
Electrophoresis(horizontal) SUB-cell GT BIO RAD (München)
Electrophoresis(vertical) UniEquip S2S Uniequip (Martinsried)
Electrophoresis(vertical) Sequi-Gen GT BIO RAD (München)
Electrophoresis(vertical) UniEquip DAIICHI Uniequip (Martinsried)
Gas-chromatograph 8500 Perkin Elmer Autosystem
Gel dryer BIO RAD 583 BIO RAD (München)
Incubator Memmert BB16 Memmert (Schwabach)
Power supply BIO RAD Pac3000 BIO RAD (München)
Power supply BIO RAD Pac300 BIO RAD (München)
Spectrophotometer(UV) DU®-62 PM2K Unterschleissheim-Lohhof
Thermocycler MJ Research PTC100 Biozym, Hess Oldendorf
Material and Methods 29
Thermocycler Minicycler PTC150 Biozym Hess. Oldendorf
Thermocycler BIO RAD iCycler BIO RAD (München)
Thermoshaker Gerhardt - Gerhardt (Bonn)
UV Transilluminator UniEquip Uvi-tec Uniequip (Martinsried)
UV/Visible Spectrophoto Utrospec 2100pro Amersham Biosciences
Wasserreinigungsanlage Millipore Milli Q Millipore (Eschborn)
Wasserreinigungsanlage Millipore Milli R Millipore (Eschborn)
3.3 Softwares
BBSRC chickEST database http://www.chick.umist.ac.uk/
BCM search launcher http://searchlauncher.bcm.tmc.edu/
BLAST program http://www.ncbi.nlm.nih.gov/blast/
CEQ 8000 software Beckman, Coulter, USA
ClustalW Multiple Sequence
Alignment
http://searchlauncher.bcm.tmc.edu/
multialign/Options/clustalw.html
Compute pI /Mw tool program http://www.expasy.ch/tools/pi_tool.html
Genepop 3.4 http://wbiomed.curtin.edu.au/genepop/index.html
Image Analysis program
(Version 4.10)
LI-COR Biotechnology, USA
Multiple sequence alignment by
Florence Corpet
http://prodes.toulouse.inra.fr/multalin/multalin.html
One-Dscan program Scanalytics Inc., Billerica, MA
Primer design program Primer express software version 2.0
Primer3 Input http://frodo.wi.mit.edu/cgi-
bin/primer3/primer3_www.cgi
SAS Version 8.2 SAS Institute Inc., Cary, NC, USA
UCSC genome bioinformatics http://www.genome.ucsc.edu/index.html?org=Chic
ken&db=galGal2&hgsid=30444323
Webcutter 2.0 http://rna.lundberg.gu.se/cutter2/
Weight to molar quantity for
nucleic acid
http://www.molbiol.ru/eng/scripts/01_07.html

Material and Methods 30
3.4 Animals
3.4.1 Selection experiments
The basis breeding population of Japanese quails was kept since 1966. It consisted of
four quail lines, with three lines selected for dust bathing activity (NN, HH and KK) and
one representing an unselected control line (N24) (Gerken and Petersen 1992). The
divergent selection within each of the four pure breed quail lines was performed. The
ω-6:ω-3 PUFA ratio and C22:6 (ω-3) were desired in the first step of the selection
process. The egg yolks were examined for the fatty acid contents in order to establish
the pedigree for the next generation. The breeding value of individuals was estimated
and quails were ranked from best to worst. The six hens with highest and six hens with
lowest ω-6:ω-3 PUFA ratio in egg yolk of 30 hens were kept by mass selection. The
hens were randomly mated with selected cocks of the same line. After four generations
of divergent selection, eight sublines of the HIGH and LOW lines are produced
(Mennicken et al. 2005). Animals of the 4th generation of these divergently selected
lines were previously shown to differ in the ω-6:ω-3 ratio by 2.4 units, i.e. a difference
of 1.6 phenotypic standard units (sp=1.57) and four genetic standard units (sg=0.64)
(Mennicken et al. 2005). The selection was continuously carried out for three
generations of S5, S6 and S7. The hens were kept in individual cages and fed a
commercial layer diet.
Selection of generation S5
The production of the S5 generation was performed by selecting approximate six hens
of each of the eight sublines from the S4 generation and the cocks were randomly
selected from S4 generation due to the estimated breeding value (EBV) for the ω-6:ω-3
PUFA ratio. Therefore, generation five consisted of 78 hens from low line and 74 hens
from high lines and 24 cocks per line.
Selection of generation S6
The S6 generation consisted of totally 170 Japanese laying quails (67 hens in the high
line and 103 hens in the low line) and 24 cocks from generation S5 based on the
breeding value obtained information from 6 hens with highest and six hens with lowest
ω-6:ω-3 PUFA ratio of each sub line.
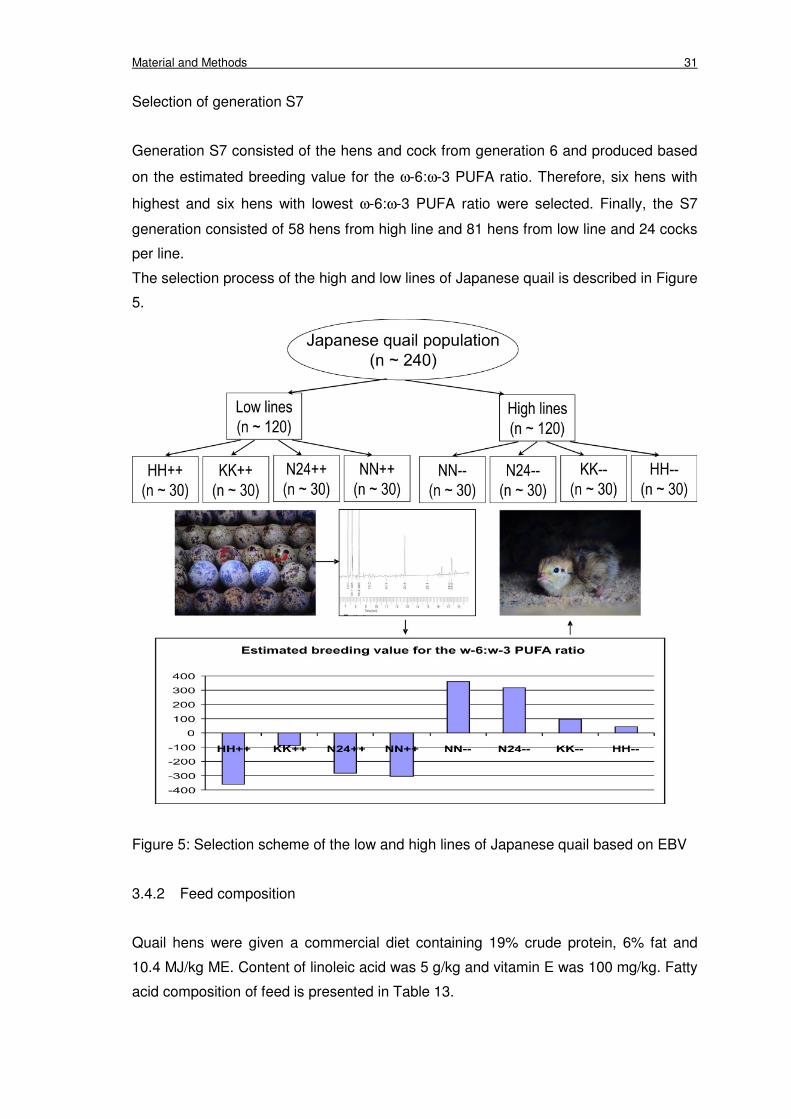
Material and Methods 31
Selection of generation S7
Generation S7 consisted of the hens and cock from generation 6 and produced based
on the estimated breeding value for the ω-6:ω-3 PUFA ratio. Therefore, six hens with
highest and six hens with lowest ω-6:ω-3 PUFA ratio were selected. Finally, the S7
generation consisted of 58 hens from high line and 81 hens from low line and 24 cocks
per line.
The selection process of the high and low lines of Japanese quail is described in Figure
5.
Figure 5: Selection scheme of the low and high lines of Japanese quail based on EBV
3.4.2 Feed composition
Quail hens were given a commercial diet containing 19% crude protein, 6% fat and
10.4 MJ/kg ME. Content of linoleic acid was 5 g/kg and vitamin E was 100 mg/kg. Fatty
acid composition of feed is presented in Table 13.
Material and Methods 32
3.4.3 Phenotypic trait records
Egg collection
Three eggss per hens were collected in two times, from day 15 after the first egg was
layed onwards and repeated one week later after the first collection.
All hens of the 5th, 6th and 7th generation were used for analysing the fatty acid profiles
to evaluate the heritability of the ω-6:ω-3 PUFA ratio and C22:6 ω-3 of the eight
divergent selected lines of Japanese quails.
In addition, Ri chicken eggs (n=11) were collected from Thuyphuong farm, National
Institute of Animal Husbandry, Hanoi, Vietnam.
Fatty acid analyses
Yolk lipid was extracted according to the method of Folch et al. (1957). Three egg yolks
per hen were magnetically homogenized and 1 g of yolk was dried with 6 g sodium
sulphate. It was suspended in 10 ml chloroform-methanol mixture (1:1) containing
0.02% BHT and shaked for 20 min. The supernatant were transferred to a 2.0 ml tube
and plunged in a stream of nitrogen. Analysis of the fatty acid composition was carried
out by gas chromatography using trimethylsulphoniumhydroxide (TMSH) (Schulte and
Weber 1989). A 30 µl of TMSH was added in a total volume of 100 µl sample in a vial
for analysis. The fatty acid methyl esters (FAME) were analyzed by gas
chromatography (Perkin Elmer Autosystem model 8500) equipped with a flame
ionization detector (FID) and a split injector and a capillary column (30 m×0.32 mm
inner diameter) with a 0.25 µm film thickness. Helium was used as gas carrier. The GC
conditions were as follows injector temperature at 250 oC, the detector 260oC. The
column temperature program started at 150°C for 2 min, follwed by an increase of
10°C/min to 180°C/min and held for 5 min, and then 5oC/min to 225oC. Identification of
fatty acid methyl ester peaks was based upon retention times obtained for methyl
esters prepared from the three standards of fatty acid (Mixture Me 61, 63 and 81)
(Larodan, Sweden).
Material and Methods 33
3.5 Molecular genetics methods
3.5.1 RNA isolation
Total RNA was isolated from quail liver by using the guanidium thiocyanate method
(Chomczynski and Sacchi 1987). Liver tissue (60 mg) was homogenized in 500 µl
Trizol reagent by syringe and needle, and incubated at room temperature for 5 min. A
volume of 200 µl chloroform was added to the homogenised sample and mixed
thoroughly by gently shaking and incubated at room temperature for 10 min. The
mixture was centrifuged at 12,000 g for 15 min at 4oC. The upper aqueous phase was
transferred to a new tube and its RNA was precipitated by adding 500 µl isopropanol,
gently shaking. The sample was incubated at room temperature for 10 min and then
centrifuged at 12,000 g for 10 min at 4oC. The supernatant was removed and the RNA
pellet was washed with 1 ml ethanol (70%) and then centrifuged for 5 min. The
supernatant was removed, the RNA pellet was air-dried for 10 min and dissolved in 50
µl RNase-free water and stored at -80oC for further use.
To remove the DNA residue, the RNA was treated with DNase. The reaction contained
a mixture of 20 µl RNA, 4 µl RQ1 buffer, 7.5 µl RQ1 DNase, 1 µl RNase inhibitor and
7.5 µl RNase-free water. The mixture was incubated at 37oC for 1 hour and then
purified by using RNeasy Mini Kit. The RNA concentration was measured by a
spectrophotometer at 260 nm and 280 nm with the best ratio of RNA of approximately
1.7-1.8. RNA quality was also checked on 1.2% FA (Formaldehyde agarose) gel. The
purified RNA was used for synthesizing cDNA.
3.5.2 cDNA synthesis
First strand cDNA synthesis was performed in a volume of 20 µl containing 1.2 µg of
total RNA (5µl), 1 µl oligo d(T)12 (500 µg/ml) and 1µl random primers (500 µg/ml) were
heated at 70oC for 5 min and immediately chilled on ice. A mixture containing 4.5 µl
10mM dNTP mix, 4 µl 5 x first strand buffer, 2.5 µl 0.1M DTT, 1 µl RNasin (40 u/l) and
1 µl SuperScriptTMII (200 units) was added. The reaction was incubated at 42oC for 90
min and at 70oC for 15 min. The cDNA was diluted with 80 µl RNase free water and
stored at -20oC as a template for further use.
The SMART RACE cDNA Amplication kit (Clontech) was used for cDNA synthesis
following the manufacture’s protocol.
Material and Methods 34
3.5.3 DNA isolation
DNA isolation from liver tissue
Liver tissue was cut into small pieces and digested with 700 µl digestion buffer, 70 µl of
10% SDS and 18 µl of proteinase K. The mix was incubated in the shaking incubator at
37oC overnight (for 12 – 24 hrs). A volume of 700 µl phenol-chloroform (1:1) was
added, gently shaken and then centrifuged for 10 min at 10,000 g. The upper phase
was transferred into a new tube and 700 µl chloroform was added. The solution was
mixed by gently shaking and then centrifuged for 10 minutes at 10,000 g. The upper
phase was again transferred into a new tube and 700 µl isopropanol with 70 µl of 3M
natrium acetate (with 1:10 ratio) was added to precipitate the DNA and then gently
shaken and centrifuged for 5 minutes. The upper phase was discarded, the pellet was
washed with 700 µl ethanol (70%) and centrifuged for 5 min. The supernatant was
removed and the DNA pellet was dried for 20 min. The DNA pellet was re-suspended
in 500 µl 1xTE buffer. The DNA concentration was measured by taking 20 µl DNA
stock into a total volume of 700 µl 1xTE (dilution factor = 35, 1 OD = 50 ng/µl and DNA
concentration (µg/ml) = OD260 x 50 x dilution factor). The DNA stock was diluted to a
final concentration of 50 ng/µl, which is used further as working solution.
DNA purification from agarose gels for cloning and sequencing of PCR fragments
The band of interest was excised from 1% agarose gel, placed in an 1.5 ml tube and
frozen at -20oC for 30 min. The frozen gel was ground by an 1 ml pipette tip. A volume
of 500 µl 1 x TE buffer was added and homogenized by needle and syringe. Phenol-
chloroform (1:1) was added in equal volume (500 µl). Needle and syringe were used to
homogenise the solution. This mixture was centrifuged for 20 min at 10,000 g at 20oC.
The supernatant was transferred into a new tube. A volume of 500 µl chloroform was
added, mixed and centrifuged for 15 min. The upper phase was transferred into a new
tube. The DNA was precipitated by adding 3M natrium acetate (pH=5.2) with a ratio
Vsample/VNaOAc=0.1 and was chilled in 1ml ethanol (100%). The solution was gently
mixed, incubated at -20oC overnight or at -80oC for 1hr and then centrifuged for 30 min
at 14,000 g at 4oC. The supernatant was removed. The DNA pellet was washed by 1ml
ethanol (70%) and centrifuged for 10 min. The supernatant was removed, the pellet
dried for 5-10 min and then dissolved in 7 µl millipore water and kept at 4oC for further
use.

Material and Methods 35
DNA purification by Qiagen mini-kits for sequencing on CEQ8000
The band of interest was excised from 1% agarose gel. The gel slice was weighed and
3 volumes of QG buffer to 1 volume of gel was added. This was incubated in the hot
water bath until the gel was completely dissolved in QG buffer. An equal volume of
isopropanol was added and homogenized by shaking up and down. The whole liquid
was transferred to the spin column and then centrifuged for 1 min at 14,000 g at 19-
20oC. The flow-through was discarded, a volume of 500 µl QG buffer added and
centrifuged for 1 min at 14,000 g at 19-20oC. The flow-through was discarded, 750 µl
PE buffer added and centrifuged for 1 min at 14,000 g at 19-20oC. The flow-through
was discarded and the column was centrifuged for 1 min at 14,000 g at 19-20oC. The
spin column was transferred to an 1.5 ml tube, 50 µl millipore water added and
incubated at room temperature for 5-10 min. The column was centrifuged and the
sample was dried in speed vacuum machine for 30 min at 50oC. Finally, the DNA was
dissolved in 10 µl water as template for PCR.
3.5.4 Ligation, transformation, plasmid isolation and sequencing
Ligation
The purified PCR product was ligated into the pGEM-T vector or pGEM-T easy
vector. The reaction was performed in 6 µl total volume which contained 2.5 µl of 2 x
rapid ligation buffer, 0.5 µl of T4 DNA ligase (3 units/µl), 0.5 µl vector (50 ng/µl) and 2.0
µl of purified DNA template. The reaction was incubated at room temperature for 1 hr
or at 4oC overnight.
Cloning and transformation
A volume of 3.5 µl ligation reaction was transferred to a sterile 15 ml tube containing 70
µl competent E.coli DH5α and incubated on ice for 20 min. The competent cells were
heat shocked in a water bath at 42oC for 90 seconds and immediately cooled on ice for
2 min. The tube was removed from ice, 650 µl nutrient medium (LB-Broth or SOC
medium) with ampicillin (10 mg/ml) added and incubated in the shaking incubator at
37oC at 100 rpm for 90 min. The transformed bacterial culture was platted in duplicate
on the LB-Broth agar-ampicillin petri dishes, which contained 20 µl of X-gal (50 mg/ml)
and 20 µl of 0.1M IPTG. These plates were incubated at 37oC overnight until colonies
Material and Methods 36
are visible. The colonies containing plasmid with DNA insert were white, while the other
colonies were blue. For each sample 4 white and 1 blue colonies were picked up and
suspended into 30 µl of 1 x PCR buffer. The white colonies were also immersed into
500 µl LB-Broth-Ampicillin medium and incubated in the shaking incubator at 37oC at
100 rpm for further plasmid isolation after the inserted fragment was confirmed.
The suspension was heated at 95oC for 15 min and 10 µl of its lysate was used as
template for M13 PCR. The M13 reaction was performed in a total volume of 20 µl
containing 1 x PCR buffer, 50 µM of each dNTP, 0.5 unit of Taq DNA polymerase and
0.2 µM of M13 primer (F: 5’-TTGTAAAACGACGGCCAGT-3’; R:5’-
CAGGCCACAGCTATGACC-3’). The PCR was as follows denaturion at 95oC for 3 min,
followed by 35 cycles (95oC for 30 seconds, 56oC for 30 seconds, 70oC for 30 seconds)
and a final extension at 70oC for 5 min. The extension time was set to a longer time for
longer fragments. A total volume of 5 µl PCR product was electrophoresed on a 2%
agarose gel. The positive colonies were moved slower than non-insert colonies and
were used for sequencing.
Plasmid isolation
From M13 results, the cultured bacteria were transferred into a 15 ml tube containing 5
ml culture medium with ampicillin at 37oC overnight. These cultured bacteria were used
for plasmid isolation.
Plasmid with DNA insert was isolated by using GenEluteTM plasmid mini kit (Sigma).
The cultured bacteria were centrifuged for 1min at 14,000 g and the supernatant was
removed. The cells were resuspended in 200 µl resuspension solution and
homogenised by pipetting until it completely dissolved. The cells were transferred to a
2ml tube and 200 µl lysis solution added. The tube was gently inverted for 8-10 times
until the mixture became clear and viscous and then incubated at room temperature for
4 min. The cell debris was precipitated by adding 350 µl neutralized solution into the
tube and mixed by gently inversion 4-6 times. The cell tube was centrifuged at 14,000 g
for 10 min. The GenElute miniprep binding column was prepared by adding 500 µl
solution, with short centrifugation and discarding the flow-through. Subsequently, the
clear supernatant was transferred to the GenElute column, centrifuged for 1 min and
the flow-through discarded. The GenElute column was washed by adding 750 µl wash
solution, centrifugation for 1 min and discarding the flow-through. The column was
centrifuged again to eliminate excess ethanol. The column was transferred to a fresh
collection tube, 50 µl elution solution or milli-pore water added and centrifuged at

Material and Methods 37
14,000 g for 5 min. A volume of 5 µl plasmid DNA with 2 µl loading buffer was
electrophoresed on a 2% agarose gel. The plasmid DNA quality was measured at 260
nm and 280 nm by taking 7µl of plasmid DNA to 693 µl milli-pore water (dilution factor
= 100) in a spectrophotometer (UV/Visible Spectrophoto, Biosciences). The plasmid
DNA concentration (ng/µl = OD260 x dilution factor x 50) was converted into number of
copies (molecules) using the following program
http://www.molbiol.ru/eng/scripts/01_07.html. The plasmid DNA was diluted to be
similar concentration with serial dilutions of linearized plasmid DNA from 1010 to 101
copy number in 45 µl volume.
Sequencing by using LI-COR sequencer
The positive colony was subsequently sequenced by the dideoxy chain-termination
method (Sanger et al. 1977) using the SequiTherm Excell TM II DNA sequencing kit.
For each of the four terminators (ddATP, ddCTP, ddGTP and ddTTP) 1µl (0.25 µmol)
was added into marked tubes as well as 2 µl of the mixture, which contained 3.6 µl of
3.5 x sequencing buffer, 0.25 µl (2.5 pmol) of each primer (700-IRD labelled SP6
primer 5’-TAAATCCACTGTGATATCTTATG-3’ and 800-IRD labelled T7 primer (5’-
ATTATGCTGAGTGATATCCCGCT-3’), 0.5 µl of SequiTherm Excel II DNA polymerase
(5 units/µl) and 3.5 µl of the plasmid DNA elute. The PCR was as follows: denaturation
at 95oC for 3 min, followed by 35 cycles of 95oC for 30 seconds, 58oC for 30 seconds,
70oC for 30 seconds and a final extension at 70oC for 5 min. The reaction was stopped
by adding 1.5 µl stop solution, denaturing at 95oC for 5 min and chilling on ice. The
PCR sequence was loaded on 6% Sequagel XR. The electrophoresis was performed
on a LI-COR model 4200 automated DNA sequencer in 1xTBE buffer at 50oC, 50 W
and 1200 V. Sequence results were analyzed by using the Image Analysis program,
version 4.1 (LI-COR).
3.5.5 Clean-up PCR and sequencing on CEQ 8000
A volume of 5 µl each amplified fragment was subjected to purification adding 1 µl
ExoSAP-IT and incubating at 37oC for 45 min, with following inactive action of the
enzymes at 80oC for 15 min.
The clean DNA template was subsequently used for the sequencing PCR which
contained 8 µl of milli-pore water, 2 µl of 1 M primer giving 1pmole per reaction and 4 µl
of DTCS Quick Start Master Mix (Beckman Coulter). The PCR reaction was performed
Material and Methods 38
with 30 cycles (96 oC for 20 sec, 50 oC for 20 sec, 60 oC for 4 min). The stop solution
was prepared in a volume of 2.0 µl of 3M NaOAc (pH = 5.2), 2.0 µl of 100 mM EDTA
(pH = 2.0) and 1.0 µl of glycogen (20 mg/ml). The PCR product was transferred to a
1.5 ml sterile tube and mixed with 5 µl stop solution. A volume of 60 µl cold ethanol
(98%) was added and mixed by vortex and then centrifuged for 15 min at 4oC. The
supernatant was removed and the pellet washed 2 times with 200 µl cold ethanol
(70%) and centrifuged for 5 min at 4oC. The pellet was dried by the speed vacuum
machine at 35oC and resuspended in 40 µl SLS (Sample loading solution). The sample
was loaded in to plates and sequenced using the CEQ8000 Genetic Analysis System.
3.6 Identification of the candidate genes FADS1 and FADS2 in divergent lines of
Japanese quails
3.6.1 Sample collection
Collection of liver tissue in quails
According to the selection experiment of the high and low lines, the birds from the S5,
S6 and S7 generation were slaughtered at the end of the trial and the livers were
collected for further RNA and DNA isolation.
Collection of liver tissue in Vietnamese local chickens
Unrelated laying hens of the breeds Ri (n=3), H’mong (n=3), Te (n=3) were collected
from the National Institute of Animal Husbandry, Hanoi, Vietnam. Noi (n=6) and Ac
(n=6) chickens were collected from Cantho City, Vietnam. The European breed,
selected Lohman light (SLS) (n=4) was used (Figure 6).
From these samples RNA was isolated (see section 3.5.1) and cDNA generated (see
section 3.5.2) for further studies.
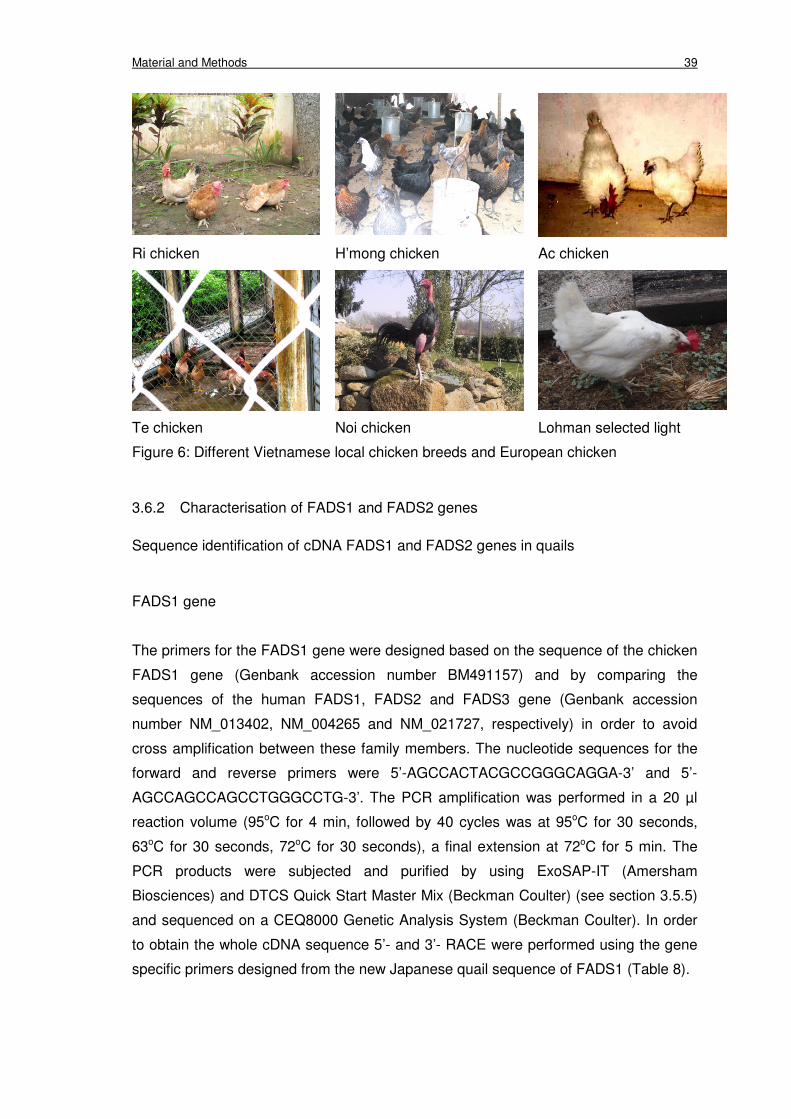
Material and Methods 39
Ri chicken H’mong chicken Ac chicken
Te chicken Noi chicken Lohman selected light
Figure 6: Different Vietnamese local chicken breeds and European chicken
3.6.2 Characterisation of FADS1 and FADS2 genes
Sequence identification of cDNA FADS1 and FADS2 genes in quails
FADS1 gene
The primers for the FADS1 gene were designed based on the sequence of the chicken
FADS1 gene (Genbank accession number BM491157) and by comparing the
sequences of the human FADS1, FADS2 and FADS3 gene (Genbank accession
number NM_013402, NM_004265 and NM_021727, respectively) in order to avoid
cross amplification between these family members. The nucleotide sequences for the
forward and reverse primers were 5’-AGCCACTACGCCGGGCAGGA-3’ and 5’-
AGCCAGCCAGCCTGGGCCTG-3’. The PCR amplification was performed in a 20 µl
reaction volume (95oC for 4 min, followed by 40 cycles was at 95oC for 30 seconds,
63oC for 30 seconds, 72oC for 30 seconds), a final extension at 72oC for 5 min. The
PCR products were subjected and purified by using ExoSAP-IT (Amersham
Biosciences) and DTCS Quick Start Master Mix (Beckman Coulter) (see section 3.5.5)
and sequenced on a CEQ8000 Genetic Analysis System (Beckman Coulter). In order
to obtain the whole cDNA sequence 5’- and 3’- RACE were performed using the gene
specific primers designed from the new Japanese quail sequence of FADS1 (Table 8).
Material and Methods 40
The 5’- RACE_FADS1 primer was performed by denaturation at 95oC for 3 min, and
touchdown PCR followed by 10 cycles (95oC for 30 seconds, 55-45oC for 30 seconds,
72oC for 1 min) and further 30 cycles (95oC for 30 seconds, 45oC for 30 seconds, 72oC
for 1 min); the final extension was 72oC for 10 min.
The 3’- RACE_FADS1 primer for PCR amplification was performed by denaturation at
95oC for 3 min, and then followed by 40 cycles (95oC for 30 seconds, 55oC for 30
seconds, 72oC for 1 min), the final extension was 72oC for 10 min.
Another pair of FADS1 primer (Table 8), FADS1p, were also amplified by denaturation
at 95oC for 3 min, followed by 40 cycles of 95oC for 30 seconds, 55oC for 30 seconds,
72oC for 2 min and a final extension at 72oC for 10 min. The PCR products were
purified by using ExoSAP-IT (Amersham Biosciences) and DTCS Quick Start Master
Mix (Beckman Coulter) and sequenced on CEQ8000 Genetic Analysis System
(Beckman Coulter) (see section 3.5.5).
FADS2 gene
The primers for the FADS2 gene were designed based on the sequence of the chicken
FADS2 gene (Genbank accession number BG709923) and by comparing the
sequences of the human FADS1, FADS2 and FADS3 gene (Genbank accession
number NM_013402, NM_004265 and NM_021727, respectively) in order to avoid
cross amplification between these family members. The nucleotide sequences for the
forward and reverse primers were 5'-GGCAAGAAGAAGCTGAA-3' and 5'-
AGAAACAGGGATCCCAGAAT-3', respectively. A touch down PCR was performed in
a total reaction volume of 20 µl containing 25 ng cDNA as template, beginning with 95
oC for 5 min, followed by 20 cycles (95 oC for 30 seconds, 61-51 oC (-0.5 oC/cycle) for
30 seconds, 72 oC for 1 min) and further 20 cycles (95 oC for 30 seconds, 51 oC for 30
seconds, 72 oC for 1 min), the final extension was 72 oC for 5 min. The amplified
fragments were subjected to electrophoresis in a 1% agarose gel with a lambda DNA
BstEII marker as a reference for fragment size and visualized under UV
transilluminator. The gel containing the DNA fragment of interest was cut out and
isolated with phenol-chloroform (see section 3.5.3). The extracted DNA was cloned
(pGEM-T Vector System I) and sequenced on a LI-COR Model 4200 automated
sequencer (see section 3.5.4). To obtain the whole cDNA sequence 5’- and 3’- RACE
was performed. Specific primers were designed in Table 8.
Material and Methods 41
Table 8: Specific primers for RACE PCR on quail FADS1 and FADS2 genes
Amplicon 5'- RACE (5'→3') Ann. temp. (oC)
FADS1 AGTGGATGACCCAAAGTACCAGAT TD 55-45
FADS2 TACCTGCCTTACAACCACCAGCACG 60
Amplicon 3'- RACE (5'→3') Ann. temp. (oC)
FADS1 CAACCCAGCTTTGAACCCAGCAAGAAT 55
FADS1p F: TCGACACAATTACTGGAAGGTGGC
R: ATCGTACACCTTCCTATCGACCAC
55
FADS2 GGATCCCAGAATGCCATAGAATGGG 60
The 5’- RACE_FADS2 and 3’- RACE_FADS2 primers (Table 8) were amplified in a
volume of 20 µl by denaturation at 95oC for 3 min, and then touchdown PCR followed
by 10 cycles (at 95oC for 30 seconds, 57-62oC for 30 seconds, 72oC for 2 min); 30
cycles (at 95oC for 30 seconds, 57oC for 30 seconds, 72oC for 2 min); and a final
extension at 72oC for 10 min. The amplified fragments were purified for cloning and
subsequently sequencing (see section 3.5.3).
Sequence identification of FADS1 and FADS2 cDNA in chicken
The primers characterizing the FADS1 and FADS2 genes in quail were applied in
chickens.
3.6.3 Identification of polymorphisms of the FADS1 and FADS2 genes
Animals
Eight representative animals of the 6th generation of each of the high and low lines (n=
16) were selected for detecting polymorphisms of the FADS1 and FADS2 genes. RNAs
were isolated as described in section 3.5.1.
Identification of polymorphisms of the FADS1 gene
The first pair primer of the FADS1 gene (Table 9), FADS1a, was performed in 20µl
reaction volume containing 25 ng cDNA as template by 95oC for 3 min, followed by 40
cycles (95oC for 30 seconds, 50oC for 30 seconds, 72oC for 30 seconds) and a final
extension at 72oC for 5 min.
Material and Methods 42
The second pair primer of the FADS1 gene (Table 9), FADS1b, was amplified. A touch
down PCR was performed in 20 µl reaction volume containing 25 ng cDNA as
template, beginning with 95 oC for 3 min, followed by 14 cycles (95 oC for 30 seconds,
51-45 oC (-0.5 oC/cycle) for 30 seconds, 72 oC for 30 seconds) and further 26 cycles
(95 oC for 30 seconds, 45 oC for 30 seconds, 72 oC for 30 seconds) and 72 oC for 5
min.
The PCR products were purified by using ExoSAP-IT (Amersham Biosciences) and
DTCS Quick Start Master Mix (Beckman Coulter) and sequenced on a CEQ8000
Genetic Analysis System (Beckman Coulter) (see section 3.5.5).
Comparative sequencing of animals from the eight divergent lines of quail was
performed using the CEQ8000 Genetic Analysis System.
Table 9: Primer sequences used for screening the SNPs in quail FADS1 gene
Amplicon Sequence (5'→3') Length (bp) Ann. temp. (oC)
FADS1a CACGGATCCTTTCGTAGCAT
GCTGGAAGTGGAGGTGGTTC
455 50
FADS1b TCTGCTTCCGAAAGGACCCTGAT
GCCACCTTCCAGTAATTGTGTCGA
539 TD51-45
FADS1-1a ACTGGTAGAAGATTTCCGTGAGC
TGCCCAGAAGCAACGCAGAGAAG
185 50
Identification of polymorphisms of the FADS2 gene
To identify polymorphisms in the coding region, two pairs of primers (FADS2a and
FADS2b) for PCR amplification were designed based on the total length of the quail
FADS2 genes (Table 10). The two amplified fragments of the FADS2 gene were 120
bp overlapping. Touch down PCR was performed in 20 µl reaction volume containing
cDNA as template, beginning with 95 oC for 5 min, followed by 8 cycles (95 oC for 30
seconds, 64-60 oC (-0.5 oC/cycle) for 30 seconds, 72 oC for 1.5 min) and 32 cycles (95
oC for 30 seconds, 60 oC for 30 seconds, 72 oC for 1.5 min) and 72 oC for 5 min.
Comparative sequencing of animals from the eight divergent lines of quail was
performed using the Image Analysis program, version 4.1 (LI-COR).
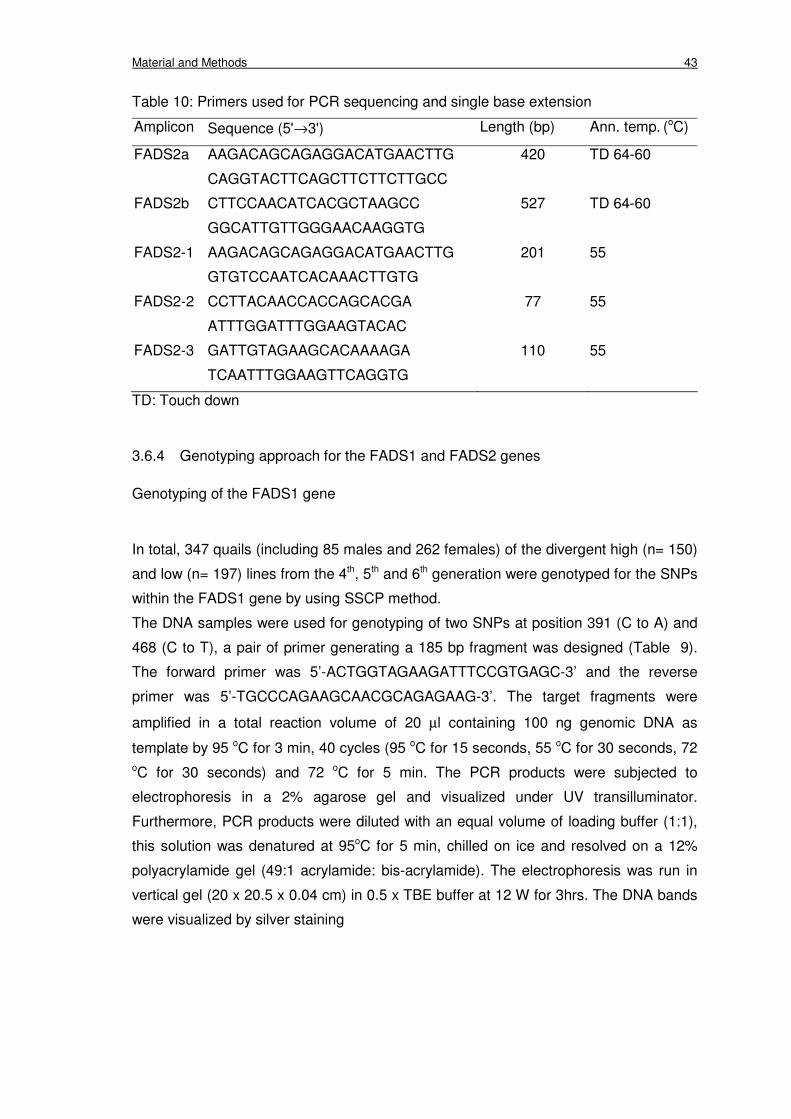
Material and Methods 43
Table 10: Primers used for PCR sequencing and single base extension
Amplicon Sequence (5'→3') Length (bp) Ann. temp. (oC)
FADS2a AAGACAGCAGAGGACATGAACTTG
CAGGTACTTCAGCTTCTTCTTGCC
420 TD 64-60
FADS2b CTTCCAACATCACGCTAAGCC
GGCATTGTTGGGAACAAGGTG
527 TD 64-60
FADS2-1 AAGACAGCAGAGGACATGAACTTG
GTGTCCAATCACAAACTTGTG
201 55
FADS2-2 CCTTACAACCACCAGCACGA
ATTTGGATTTGGAAGTACAC
77 55
FADS2-3 GATTGTAGAAGCACAAAAGA
TCAATTTGGAAGTTCAGGTG
110 55
TD: Touch down
3.6.4 Genotyping approach for the FADS1 and FADS2 genes
Genotyping of the FADS1 gene
In total, 347 quails (including 85 males and 262 females) of the divergent high (n= 150)
and low (n= 197) lines from the 4th, 5th and 6th generation were genotyped for the SNPs
within the FADS1 gene by using SSCP method.
The DNA samples were used for genotyping of two SNPs at position 391 (C to A) and
468 (C to T), a pair of primer generating a 185 bp fragment was designed (Table 9).
The forward primer was 5’-ACTGGTAGAAGATTTCCGTGAGC-3’ and the reverse
primer was 5’-TGCCCAGAAGCAACGCAGAGAAG-3’. The target fragments were
amplified in a total reaction volume of 20 µl containing 100 ng genomic DNA as
template by 95 oC for 3 min, 40 cycles (95 oC for 15 seconds, 55 oC for 30 seconds, 72
oC for 30 seconds) and 72 oC for 5 min. The PCR products were subjected to
electrophoresis in a 2% agarose gel and visualized under UV transilluminator.
Furthermore, PCR products were diluted with an equal volume of loading buffer (1:1),
this solution was denatured at 95oC for 5 min, chilled on ice and resolved on a 12%
polyacrylamide gel (49:1 acrylamide: bis-acrylamide). The electrophoresis was run in
vertical gel (20 x 20.5 x 0.04 cm) in 0.5 x TBE buffer at 12 W for 3hrs. The DNA bands
were visualized by silver staining
Material and Methods 44
Silver staining of nucleic acid
After electrophoresis, the glass-polyacrylamide gels were fixed and stained by silver
(Anolle’s and Gresshoff 1994) with following steps. First, the glass gel was fixed in 10%
acetic acid for 15 min, shortly washed with distilled water for 2 times and fixed again in
1% nitric acid for 10 min and again washed two times with distilled water for 4 min. The
gel was impregnated with 0.2% silvernitrate (2 g/l) and 0.056% formaldehyde (37%) for
10 min, quickly rinsed with distilled water and developed using the developed solution
(30g natrium carbonate/1l, 0.056% formaldehyde (37%) and 120 µl 0.1N Na2S2O3) until
the optimal image contrast was obtained. The image development was stopped in 10%
acetic acid for 1 min. The gel was washed with distilled water and dried at room
temperature or transferred to the filter paper (Whatmann 3MM) and dried in the gel
dryer at 80 oC for 2 hours.
Genotyping of the FADS2 gene
In total, 160 quails (including 39 males and 121 females) of the divergent high (n=68)
and low (n=92) lines from the 4th and 5th generation were genotyped for the SNPs
within the FADS2 gene by single base extension (SBE) (Hirschhorn et al. 2000) using
the CEQ8000 Genetic Analysis System.
For genotyping three pairs of primers (FADS2-1, FADS2-2 and FADS2-3) for
amplification of the genomic DNA were designed from the cDNA sequences (Table 10).
Specific primers for SBE are shown in Table 11. The target fragments were amplified in
a total reaction volume of 20 µl containing 100 ng genomic DNA as template by 95 oC
for 3 min, 40 cycles (95 oC for 15 seconds, 55 oC for 30 seconds, 72 oC for 30
seconds), and 72 oC for 5 min. The PCR products were mixed and purified (see section
3.2.2). SBE was performed as a multiple PCR in reaction volume of 10 µl containing
0.1 pmole of the synthetic clean DNA templates, 1 pmole multi-primer mix and 0.2 µM
SNP primer extension premix (Beckman Coulter) by 25 cycles (96 oC for 10 sec, 50 oC
for 10 sec, 72 oC for 30 Sec). The multiple SBE products were purified (2.5 µl SBE
product added to 1 µl SAP [Amersham Biosciences]) by 37 oC 30 min, 80 oC 10 min.
The genotypes were determined using the CEQ8000 Genetic Analysis System.
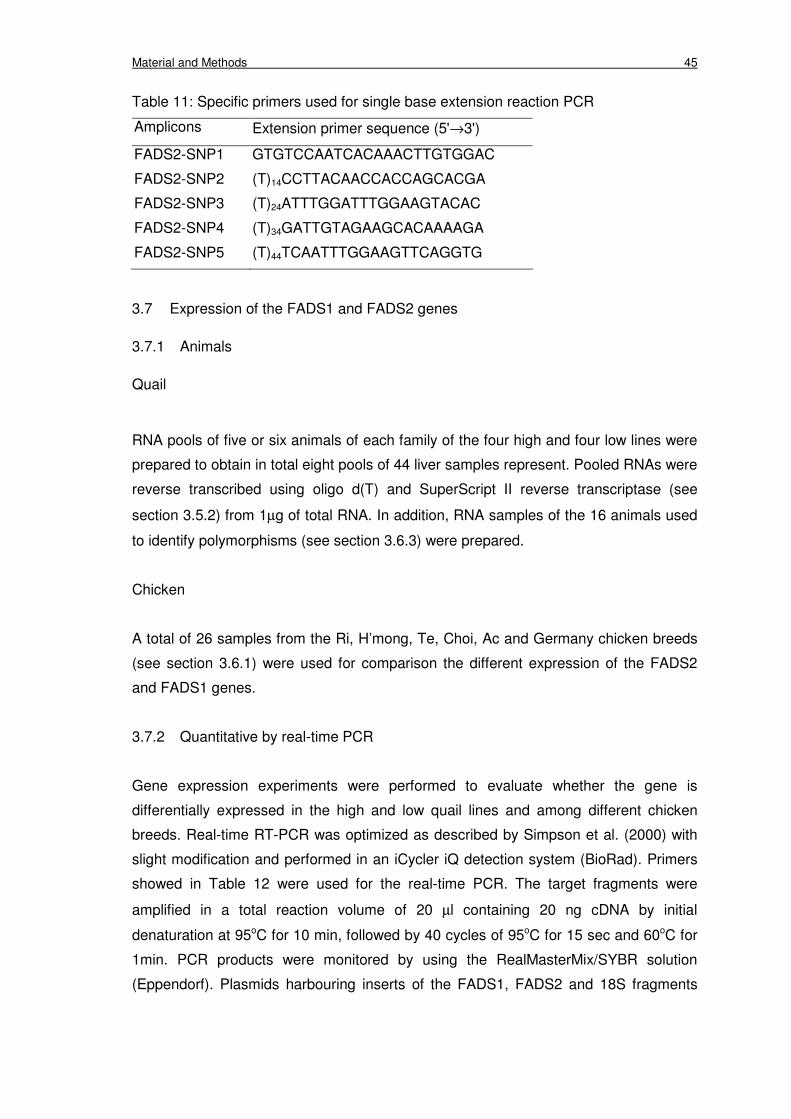
Material and Methods 45
Table 11: Specific primers used for single base extension reaction PCR
Amplicons Extension primer sequence (5'→3')
FADS2-SNP1 GTGTCCAATCACAAACTTGTGGAC
FADS2-SNP2 (T)14CCTTACAACCACCAGCACGA
FADS2-SNP3 (T)24ATTTGGATTTGGAAGTACAC
FADS2-SNP4 (T)34GATTGTAGAAGCACAAAAGA
FADS2-SNP5 (T)44TCAATTTGGAAGTTCAGGTG
3.7 Expression of the FADS1 and FADS2 genes
3.7.1 Animals
Quail
RNA pools of five or six animals of each family of the four high and four low lines were
prepared to obtain in total eight pools of 44 liver samples represent. Pooled RNAs were
reverse transcribed using oligo d(T) and SuperScript II reverse transcriptase (see
section 3.5.2) from 1µg of total RNA. In addition, RNA samples of the 16 animals used
to identify polymorphisms (see section 3.6.3) were prepared.
Chicken
A total of 26 samples from the Ri, H’mong, Te, Choi, Ac and Germany chicken breeds
(see section 3.6.1) were used for comparison the different expression of the FADS2
and FADS1 genes.
3.7.2 Quantitative by real-time PCR
Gene expression experiments were performed to evaluate whether the gene is
differentially expressed in the high and low quail lines and among different chicken
breeds. Real-time RT-PCR was optimized as described by Simpson et al. (2000) with
slight modification and performed in an iCycler iQ detection system (BioRad). Primers
showed in Table 12 were used for the real-time PCR. The target fragments were
amplified in a total reaction volume of 20 µl containing 20 ng cDNA by initial
denaturation at 95oC for 10 min, followed by 40 cycles of 95oC for 15 sec and 60oC for
1min. PCR products were monitored by using the RealMasterMix/SYBR solution
(Eppendorf). Plasmids harbouring inserts of the FADS1, FADS2 and 18S fragments
Material and Methods 46
were constructed and serial dilutions of linearized plasmid DNA were used to obtain
standard curves for each gene. The house keeping gene 18S was used to normalize
and Real–time PCR products were verified for their specificity by melting curve analysis
(iCycler iQ software programm), agarose gel electrophoresis and sequencing.
Table 12: Primers used for the quantitative Real-time PCR
Amplicon Sequence (5'→3') Ann. temp. (oC)
FADS1 AGCCACTACGCCGGGCAGGA
AGCCAGCCAGCCTGGGCCTG
60
FADS2 GGCAAGAAGAAGCTGAA
AGAAACAGGGATCCCAGAAT
60
18S GAGCGAAAGCATTTGCCAAG
GGCATCGTTTATGGTCGGAAC
60
3.8 Statistical analysis
3.8.1 Genetic evaluation based on selection of the eight divergently selected lines of
Japanese quails
The fatty acid profiles in the egg yolks and the different generations were analyzed
between the high and low lines. The differences between the lines were estimated for
each generation with the following model by analysis of variance using the General
Linear Models (GLM) produce, Least Square Means (LSM) of SAS (Version 9.1).
Yijk = µ + (generation x line)ij + eijk
Where Yijk is the individual observation for fatty acid profiles, µ is the overall mean,
(generation x line) is the fixed effect of the jth line within generation, eijk is the random
residual effect.
The genetic distance between sires was defined. The breeding values were estimated
by the BLUP (best linear unbiased prediction) using the PEST package. The variance
components were obtained from REML analysis considering an animal model with the
lines within generation as fixed effect, and animals and replication as random effects.
The heritability was estimated from parent-offspring by using the following formula
δ2a
h2 = δ2
a + δ2e
Material and Methods 47
Where δ2a is variance component of the measured fatty acid trait by animal record, δ2
e
is variance component of the random residual effect.
3.8.2 Genotype analysis
Allelic frequencies, genotype frequencies and Hardy-Weinberg equilibrium
Allele frequencies of candidate genes FADS1 and FADS2 within lines were calculated
and Hardy-Weinberg equilibrium was tested by Chi-square test. Genotype frequencies
at the five SNPs were separately estimated and the influence of the generations was
tested by Chi-square test. Both analyses were performed by using the procedure
FREQ (SAS). Furthermore, the haplotypes of the FADS2 and FADS1 genes, based on
the family structure of the parents and their offspring from the high and low lines of
quail, were estimated using Merlin (Abecasis et al. 2002).
Association analysis of the candidate genes FADS2 and FADS1 and fatty acid profiles
in yolk of Japanese quails
Association analysis between FADS2, FADS1 and fatty acid profiles was using the
statistical linear model comprising the effects of line and genotypes as well as their
interaction. This analysis was performed with the procedure “PROC GLM” of the SAS
software package (SAS System for Windows, release 8.02). Multiple mean
comparisons were conducted by using Ryan-Einot-Gabriel-Welsch (REGW) F-Test.
In addition, family-based association test was done using the FBAT program, providing
a test for linkage as well as association and by this avoiding spurious association
caused by admixture of populations. With this analysis, it was tested whether higher
and lower fatty acid contents go together with excess transmission of a particular allele
from parents and offspring.
Results 48
4 Results
4.1 Fatty acid composition in egg yolk
4.1.1 Composition of fatty acids in egg yolk of the high and low lines of the 5th, 6th and
7th generation
The egg yolk fatty acid composition of the high and low line of the 5th, 6th and 7th
generation is shown in Table 13. Myristic acid (C14:0) and palmitic acid (C16:0) were
significantly different between high and low lines in each generation (P<0.01), whereas
stearic acid (C18:0) was significantly different among the three generations of the high
and low line (P<0.01). Oleic acid (C18:1 ω-9) was the main monounsaturated fatty acid
present in the egg yolk being significantly different between high and low lines (P<0.01)
in each generation as well as among three generations within the low and high lines
(P<0.01). The amount of linoleic acid (LA; C18:2 ω-6) in the egg yolk was significantly
reduced compared to the feed and this fatty acid was significantly higher in the high
line than in the low line (P<0.01) as well as significantly lower (P<0.01) in generation 7
for both high and low lines compared to the other generations. The feed contained α-
linolenic acid (ALA; C18:3 ω-3) about 3.5%, however egg yolk contained less than
0.1% and eicosapentanoic acid (EPA; C20:5 ω-3) was present only in small amounts in
both feed and egg, therefore ALA and EPA were not considered for analysis.
Arachidonic acid (AA; C20:4 ω-6) and docoxahexaenoic acid (DHA; C22:6 ω-3), were
not detected in the diet but were found in the yolk. The present data (Table 13)
demonstrate that AA and DHA content were significantly lower in the high line than in
the low line (P<0.01). Significant differences were observed for the low and high lines
in the total amount of saturated fatty acids (SFA) (P<0.01) and monounsaturated fatty
acids (MUFA) contents (P<0.05). Also the amounts of ω-3 PUFA and ω-6 PUFA in the
low and high lines were significantly different (P<0.01). Comparison of the ratio of the
ω-6 and ω-3 fatty acids shows that the ratio of the ω-6 and ω-3 fatty acids were
significantly different (P<0.01) between the low and high lines, however, there was no
significant difference in the 7th generation in the high and low lines.
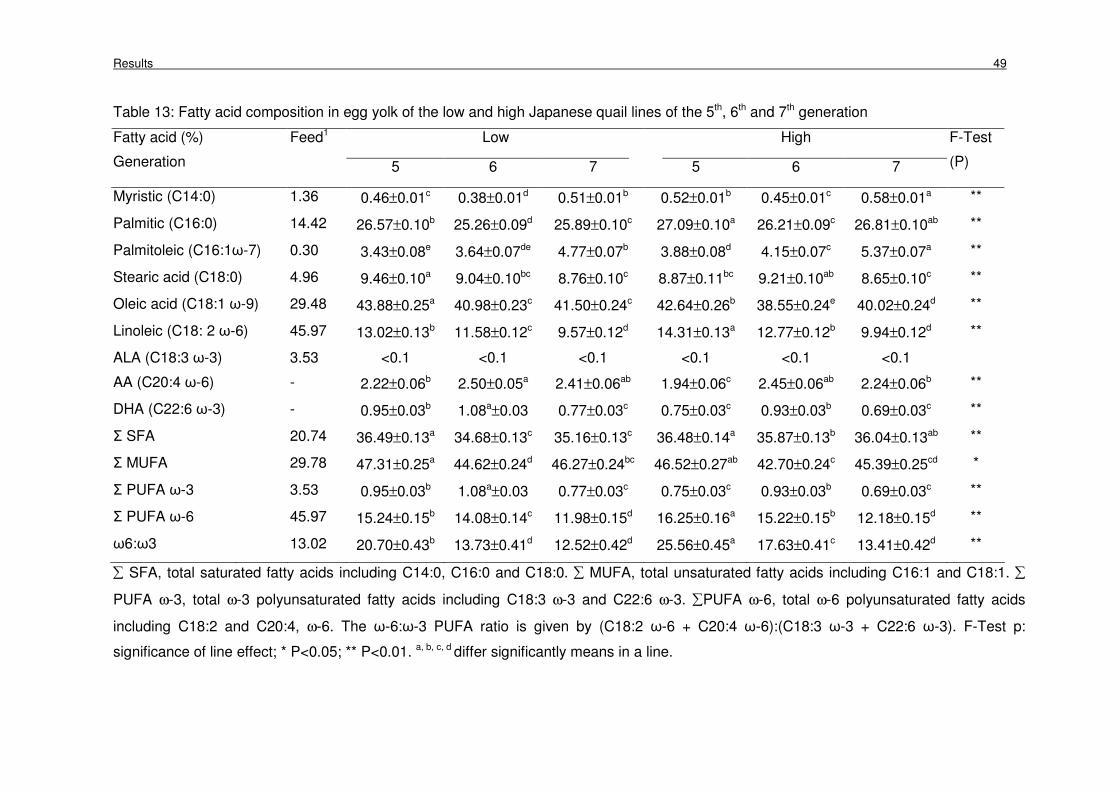
Results 49
Table 13: Fatty acid composition in egg yolk of the low and high Japanese quail lines of the 5th, 6th and 7th generation
Feed1 Low High Fatty acid (%)
Generation 5 6 7 5 6 7
F-Test
(P)
Myristic (C14:0) 1.36 0.46±0.01c 0.38±0.01d 0.51±0.01b 0.52±0.01b 0.45±0.01c 0.58±0.01a **
Palmitic (C16:0) 14.42 26.57±0.10b 25.26±0.09d 25.89±0.10c 27.09±0.10a 26.21±0.09c 26.81±0.10ab **
Palmitoleic (C16:1ω-7) 0.30 3.43±0.08e 3.64±0.07de 4.77±0.07b 3.88±0.08d 4.15±0.07c 5.37±0.07a **
Stearic acid (C18:0) 4.96 9.46±0.10a 9.04±0.10bc 8.76±0.10c 8.87±0.11bc 9.21±0.10ab 8.65±0.10c **
Oleic acid (C18:1 ω-9) 29.48 43.88±0.25a 40.98±0.23c 41.50±0.24c 42.64±0.26b 38.55±0.24e 40.02±0.24d **
Linoleic (C18: 2 ω-6) 45.97 13.02±0.13b 11.58±0.12c 9.57±0.12d 14.31±0.13a 12.77±0.12b 9.94±0.12d **
ALA (C18:3 ω-3) 3.53 <0.1 <0.1 <0.1 <0.1 <0.1 <0.1
AA (C20:4 ω-6) - 2.22±0.06b 2.50±0.05a 2.41±0.06ab 1.94±0.06c 2.45±0.06ab 2.24±0.06b **
DHA (C22:6 ω-3) - 0.95±0.03b 1.08a±0.03 0.77±0.03c 0.75±0.03c 0.93±0.03b 0.69±0.03c **
Σ SFA 20.74 36.49±0.13a 34.68±0.13c 35.16±0.13c 36.48±0.14a 35.87±0.13b 36.04±0.13ab **
Σ MUFA 29.78 47.31±0.25a 44.62±0.24d 46.27±0.24bc 46.52±0.27ab 42.70±0.24c 45.39±0.25cd *
Σ PUFA ω-3 3.53 0.95±0.03b 1.08a±0.03 0.77±0.03c 0.75±0.03c 0.93±0.03b 0.69±0.03c **
Σ PUFA ω-6 45.97 15.24±0.15b 14.08±0.14c 11.98±0.15d 16.25±0.16a 15.22±0.15b 12.18±0.15d **
ω6:ω3 13.02 20.70±0.43b 13.73±0.41d 12.52±0.42d 25.56±0.45a 17.63±0.41c 13.41±0.42d **
∑ SFA, total saturated fatty acids including C14:0, C16:0 and C18:0. ∑ MUFA, total unsaturated fatty acids including C16:1 and C18:1. ∑
PUFA ω-3, total ω-3 polyunsaturated fatty acids including C18:3 ω-3 and C22:6 ω-3. ∑PUFA ω-6, total ω-6 polyunsaturated fatty acids
including C18:2 and C20:4, ω-6. The ω-6:ω-3 PUFA ratio is given by (C18:2 ω-6 + C20:4 ω-6):(C18:3 ω-3 + C22:6 ω-3). F-Test p:
significance of line effect; * P<0.05; ** P<0.01. a, b, c, d differ significantly means in a line.
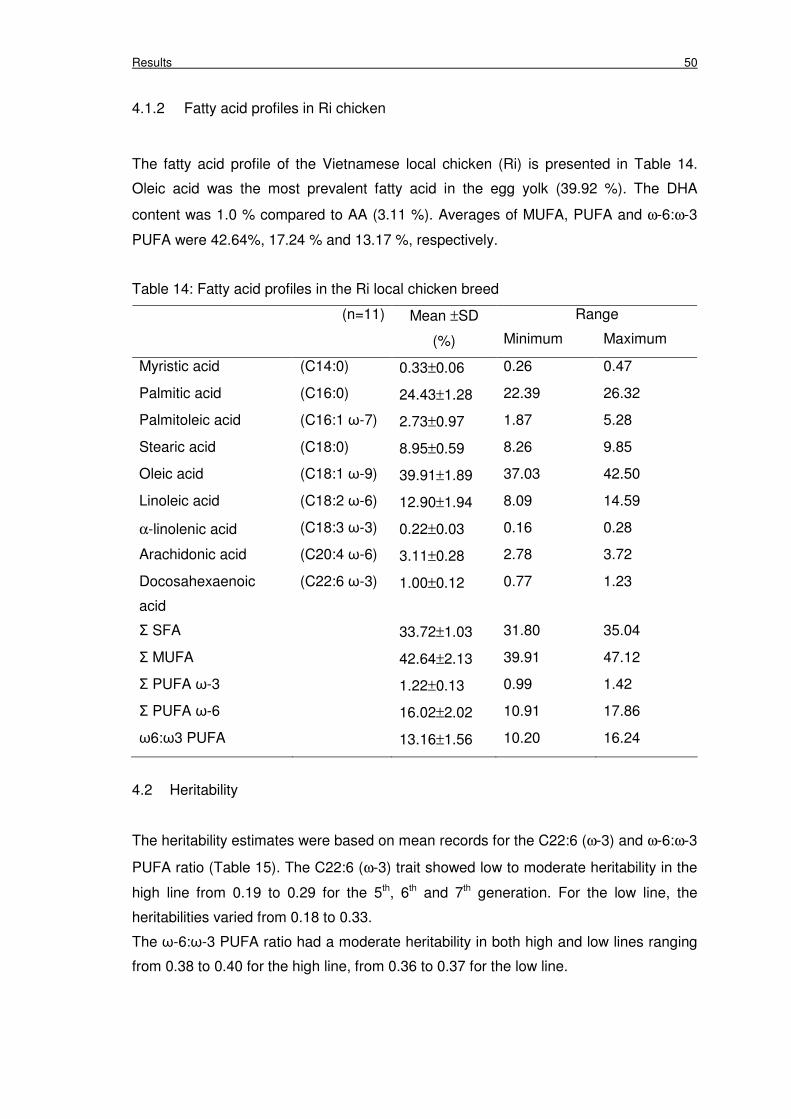
Results 50
4.1.2 Fatty acid profiles in Ri chicken
The fatty acid profile of the Vietnamese local chicken (Ri) is presented in Table 14.
Oleic acid was the most prevalent fatty acid in the egg yolk (39.92 %). The DHA
content was 1.0 % compared to AA (3.11 %). Averages of MUFA, PUFA and ω-6:ω-3
PUFA were 42.64%, 17.24 % and 13.17 %, respectively.
Table 14: Fatty acid profiles in the Ri local chicken breed
Range (n=11) Mean ±SD
(%) Minimum Maximum
Myristic acid (C14:0) 0.33±0.06 0.26 0.47
Palmitic acid (C16:0) 24.43±1.28 22.39 26.32
Palmitoleic acid (C16:1 ω-7) 2.73±0.97 1.87 5.28
Stearic acid (C18:0) 8.95±0.59 8.26 9.85
Oleic acid (C18:1 ω-9) 39.91±1.89 37.03 42.50
Linoleic acid (C18:2 ω-6) 12.90±1.94 8.09 14.59
α-linolenic acid (C18:3 ω-3) 0.22±0.03 0.16 0.28
Arachidonic acid (C20:4 ω-6) 3.11±0.28 2.78 3.72
Docosahexaenoic
acid
(C22:6 ω-3) 1.00±0.12 0.77 1.23
Σ SFA 33.72±1.03 31.80 35.04
Σ MUFA 42.64±2.13 39.91 47.12
Σ PUFA ω-3 1.22±0.13 0.99 1.42
Σ PUFA ω-6 16.02±2.02 10.91 17.86
ω6:ω3 PUFA 13.16±1.56 10.20 16.24
4.2 Heritability
The heritability estimates were based on mean records for the C22:6 (ω-3) and ω-6:ω-3
PUFA ratio (Table 15). The C22:6 (ω-3) trait showed low to moderate heritability in the
high line from 0.19 to 0.29 for the 5th, 6th and 7th generation. For the low line, the
heritabilities varied from 0.18 to 0.33.
The ω-6:ω-3 PUFA ratio had a moderate heritability in both high and low lines ranging
from 0.38 to 0.40 for the high line, from 0.36 to 0.37 for the low line.
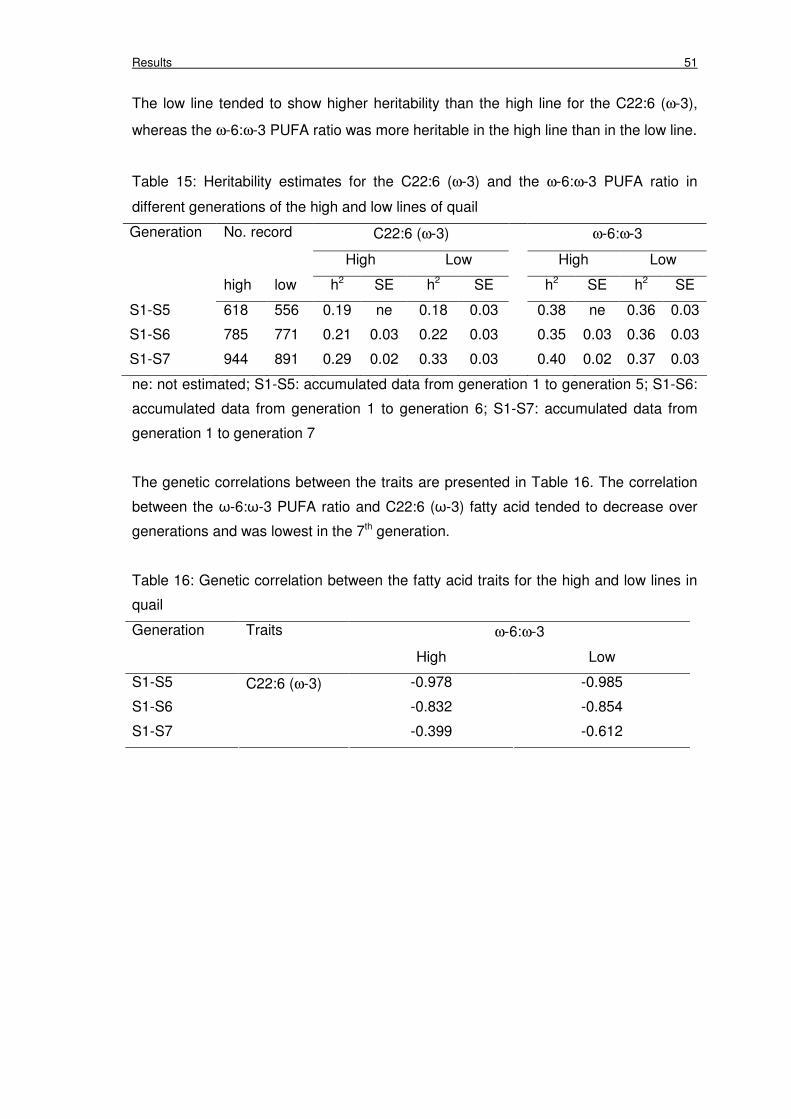
Results 51
The low line tended to show higher heritability than the high line for the C22:6 (ω-3),
whereas the ω-6:ω-3 PUFA ratio was more heritable in the high line than in the low line.
Table 15: Heritability estimates for the C22:6 (ω-3) and the ω-6:ω-3 PUFA ratio in
different generations of the high and low lines of quail
C22:6 (ω-3) ω-6:ω-3 Generation No. record
High Low High Low
high low h2 SE h2 SE h2 SE h2 SE
S1-S5 618 556 0.19 ne 0.18 0.03 0.38 ne 0.36 0.03
S1-S6 785 771 0.21 0.03 0.22 0.03 0.35 0.03 0.36 0.03
S1-S7 944 891 0.29 0.02 0.33 0.03 0.40 0.02 0.37 0.03
ne: not estimated; S1-S5: accumulated data from generation 1 to generation 5; S1-S6:
accumulated data from generation 1 to generation 6; S1-S7: accumulated data from
generation 1 to generation 7
The genetic correlations between the traits are presented in Table 16. The correlation
between the ω-6:ω-3 PUFA ratio and C22:6 (ω-3) fatty acid tended to decrease over
generations and was lowest in the 7th generation.
Table 16: Genetic correlation between the fatty acid traits for the high and low lines in
quail
ω-6:ω-3 Generation Traits
High Low
S1-S5 -0.978 -0.985
S1-S6 -0.832 -0.854
S1-S7
C22:6 (ω-3)
-0.399 -0.612
Results 52
4.3 Cloning and characterizations of the FADS1 and FADS2 genes
The nucleotide sequence of the cDNA of the FADS1 gene was obtained from ESTs
homologous with human, mouse, rat and chicken by cloning and sequencing. A cDNA
of 1797 bp of the total length was obtained for the FADS1. Aligment of the quail FADS1
cDNA sequence showed that there is higher homology of 81%, 82%, 82% and 95%
with human, rat, mouse and predicted chicken, respectively (Table 17).
The deduced protein comprised 1334 nucleotides encoding 445 amino acids.
Alignment of the amino acid sequences of quail FADS1 gene with human, rat, mouse
and predicted chicken is shown in Figure 7. The amino acid sequence of the quail
FADS1 gene has 76% similarity with FADS1 of human, 78% with FADS1 of rat and
mouse, and 95% homology to the predicted chicken sequence (XP_421052) (Figure 7).
The amino acid sequence of the FADS1 gene shared 60%, 59% and 58% identity with
FADS2 of human, rat and mouse, respectively.
Similar to FADS1, the FADS2 gene (Genbank accession number DQ336389) was
obtained by cloning and sequencing. A total length of 1350 bp was obtained, including
the poly (A) tail, along with the polyadenylation site, AATAAA, in the corresponding 3'
UTR region. Sequence comparison of quail FADS2 with the chicken orthologue
(Genbank accession number XM_421053) showed an identity of 95% and with
mammalian orthologues (including human, mouse, rat and cow) an average of 83%
(Table 17). The translated protein (position 10 to 1223 bp) is 404 amino acids in size. A
comparison of the quail amino acid sequence with that from other species is shown in
Figure 8, indicating that the nucleotides encoding the first 40 amino acids of the quail
protein were not covered by the cloned and sequenced fragment. Nevertheless, high
similarity was found with the chicken protein (93%), whereas compared to human,
mouse, rat and cow the amino acid sequence showed 75% identity.
Comparison of quail FADS1 and FADS2 cDNA sequences shared high sequence
identity (76%) between the two genes.
The exon/intron organization of FADS2 and FADS1 was deduced by aligning the cDNA
to the human genomic sequences (NT_0033903.7 from 6901108 to 6941020 for
FADS2; and from 6889822 to 6890258 for FADS1). These alignments showed that
quail FADS2 cDNA analyzed cover exon 3 to exon 8, while quail FADS1 cDNA
consists of 12 exons as in human (Figure 9).
The amino acid sequence comparisons of quail FADS1 and FADS2 shows that both
genes present the cytochrome b5-heme function and also the conserved three histidine
motifs, HDFGH, HFQHH and QIEHH that are essential for enzymic activity of
membrane-bound desaturase (Shankline et al. 1994). However, the cytochrome b5-like
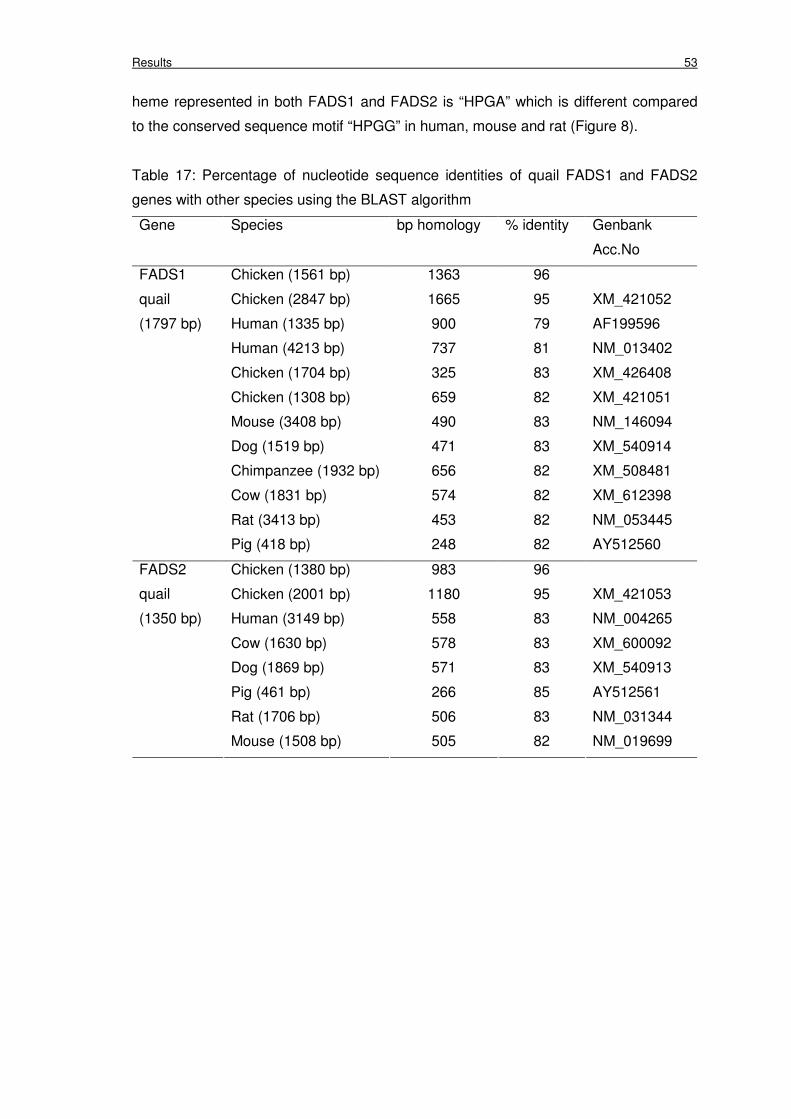
Results 53
heme represented in both FADS1 and FADS2 is “HPGA” which is different compared
to the conserved sequence motif “HPGG” in human, mouse and rat (Figure 8).
Table 17: Percentage of nucleotide sequence identities of quail FADS1 and FADS2
genes with other species using the BLAST algorithm
Gene Species bp homology % identity Genbank
Acc.No
Chicken (1561 bp) 1363 96
Chicken (2847 bp) 1665 95 XM_421052
Human (1335 bp) 900 79 AF199596
Human (4213 bp) 737 81 NM_013402
Chicken (1704 bp) 325 83 XM_426408
Chicken (1308 bp) 659 82 XM_421051
Mouse (3408 bp) 490 83 NM_146094
Dog (1519 bp) 471 83 XM_540914
Chimpanzee (1932 bp) 656 82 XM_508481
Cow (1831 bp) 574 82 XM_612398
Rat (3413 bp) 453 82 NM_053445
FADS1
quail
(1797 bp)
Pig (418 bp) 248 82 AY512560
Chicken (1380 bp) 983 96
Chicken (2001 bp) 1180 95 XM_421053
Human (3149 bp) 558 83 NM_004265
Cow (1630 bp) 578 83 XM_600092
Dog (1869 bp) 571 83 XM_540913
Pig (461 bp) 266 85 AY512561
Rat (1706 bp) 506 83 NM_031344
FADS2
quail
(1350 bp)
Mouse (1508 bp) 505 82 NM_019699

Results 54
Figure 7: Alignment of the FADS1 amino acid sequences of quail, human (Genbank Accession
No. NP_037534), rat (Genbank Accession No. BAB69054), mouse (Genbank Accession No.
NP_666206) and the predicted chicken (Genbank Accession No. XP_421052)*. Three
conserved histidine motifs (HDxGH, HFQHH and QIEHH) are underlined. The conserved
histidine of N-terminal cytochrome b5 of the desaturase domains is indicated by arrows. HPGG
motif is in box. The position of the polymorphisms in the FADS2 are indicated by arrows
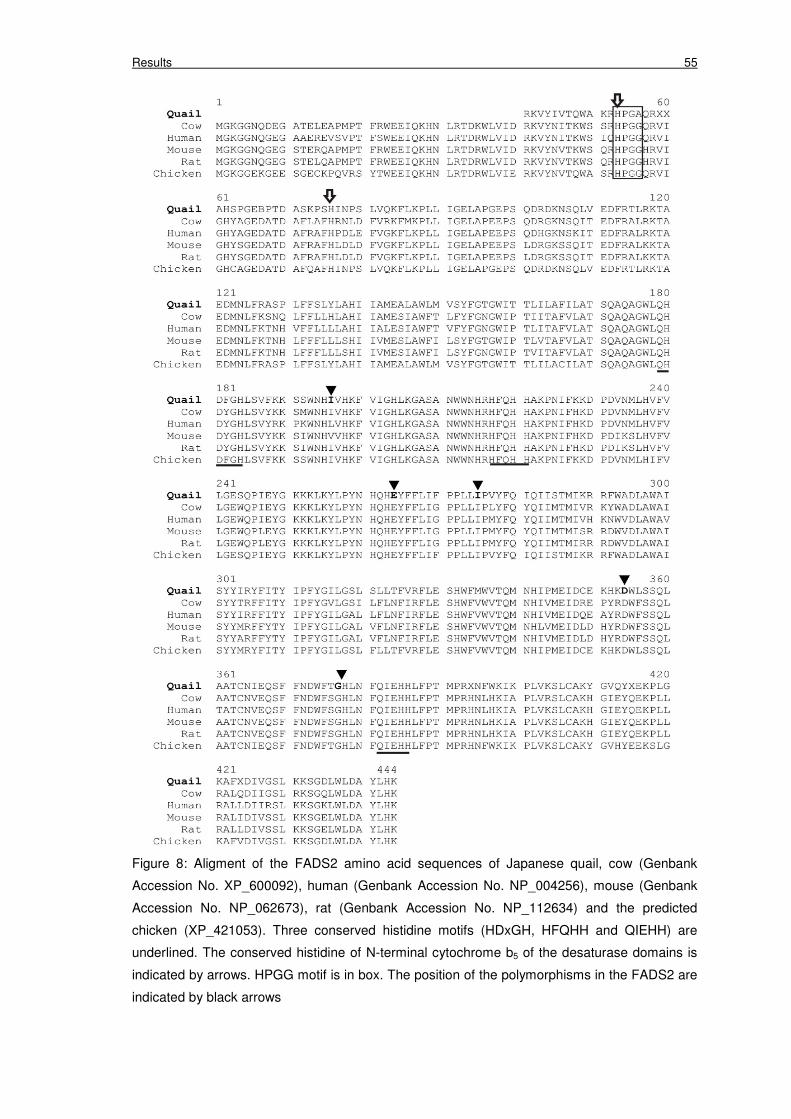
Results 55
Figure 8: Aligment of the FADS2 amino acid sequences of Japanese quail, cow (Genbank
Accession No. XP_600092), human (Genbank Accession No. NP_004256), mouse (Genbank
Accession No. NP_062673), rat (Genbank Accession No. NP_112634) and the predicted
chicken (XP_421053). Three conserved histidine motifs (HDxGH, HFQHH and QIEHH) are
underlined. The conserved histidine of N-terminal cytochrome b5 of the desaturase domains is
indicated by arrows. HPGG motif is in box. The position of the polymorphisms in the FADS2 are
indicated by black arrows
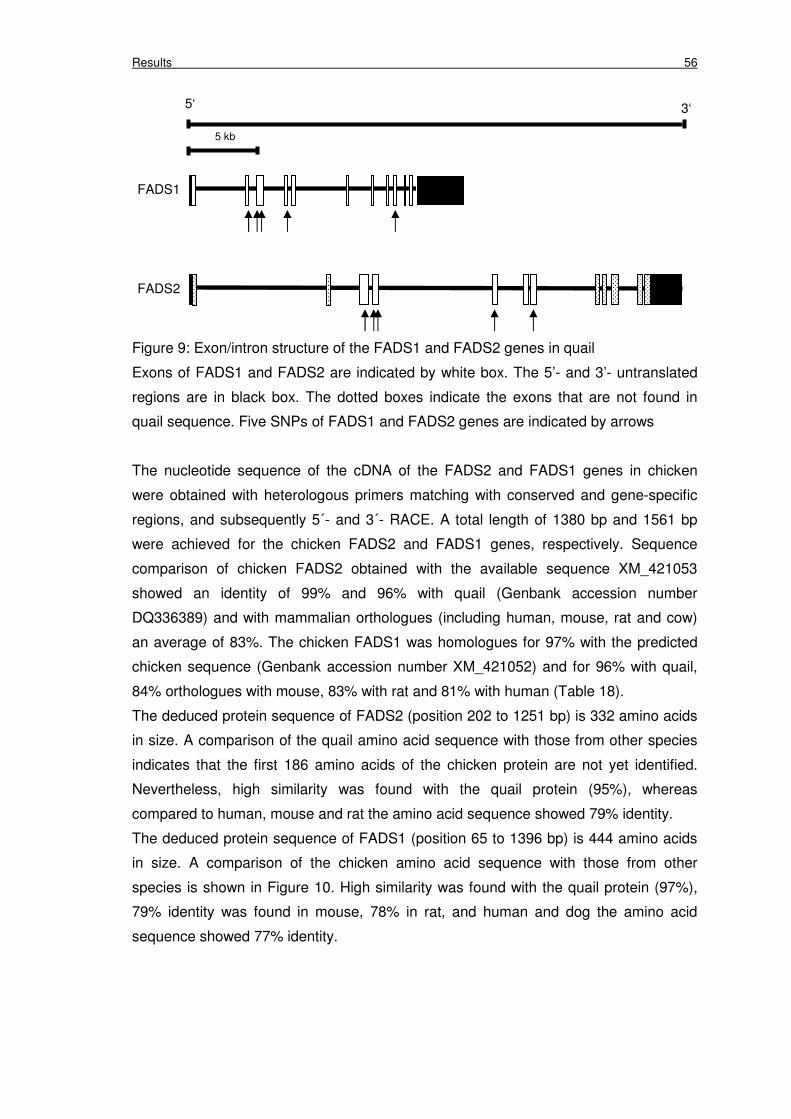
Results 56
Figure 9: Exon/intron structure of the FADS1 and FADS2 genes in quail
Exons of FADS1 and FADS2 are indicated by white box. The 5’- and 3’- untranslated
regions are in black box. The dotted boxes indicate the exons that are not found in
quail sequence. Five SNPs of FADS1 and FADS2 genes are indicated by arrows
The nucleotide sequence of the cDNA of the FADS2 and FADS1 genes in chicken
were obtained with heterologous primers matching with conserved and gene-specific
regions, and subsequently 5´- and 3´- RACE. A total length of 1380 bp and 1561 bp
were achieved for the chicken FADS2 and FADS1 genes, respectively. Sequence
comparison of chicken FADS2 obtained with the available sequence XM_421053
showed an identity of 99% and 96% with quail (Genbank accession number
DQ336389) and with mammalian orthologues (including human, mouse, rat and cow)
an average of 83%. The chicken FADS1 was homologues for 97% with the predicted
chicken sequence (Genbank accession number XM_421052) and for 96% with quail,
84% orthologues with mouse, 83% with rat and 81% with human (Table 18).
The deduced protein sequence of FADS2 (position 202 to 1251 bp) is 332 amino acids
in size. A comparison of the quail amino acid sequence with those from other species
indicates that the first 186 amino acids of the chicken protein are not yet identified.
Nevertheless, high similarity was found with the quail protein (95%), whereas
compared to human, mouse and rat the amino acid sequence showed 79% identity.
The deduced protein sequence of FADS1 (position 65 to 1396 bp) is 444 amino acids
in size. A comparison of the chicken amino acid sequence with those from other
species is shown in Figure 10. High similarity was found with the quail protein (97%),
79% identity was found in mouse, 78% in rat, and human and dog the amino acid
sequence showed 77% identity.
FADS1
FADS2
5‘ 3‘
5 kb
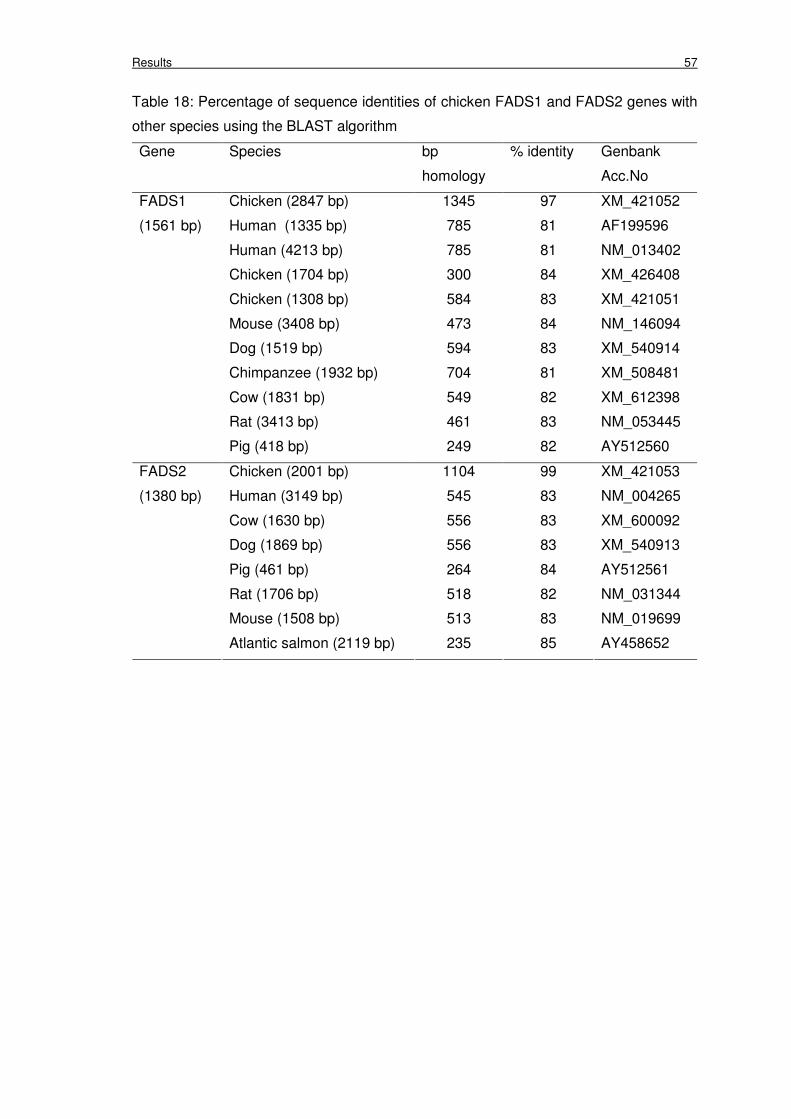
Results 57
Table 18: Percentage of sequence identities of chicken FADS1 and FADS2 genes with
other species using the BLAST algorithm
Gene Species bp
homology
% identity Genbank
Acc.No
Chicken (2847 bp) 1345 97 XM_421052
Human (1335 bp) 785 81 AF199596
Human (4213 bp) 785 81 NM_013402
Chicken (1704 bp) 300 84 XM_426408
Chicken (1308 bp) 584 83 XM_421051
Mouse (3408 bp) 473 84 NM_146094
Dog (1519 bp) 594 83 XM_540914
Chimpanzee (1932 bp) 704 81 XM_508481
Cow (1831 bp) 549 82 XM_612398
Rat (3413 bp) 461 83 NM_053445
FADS1
(1561 bp)
Pig (418 bp) 249 82 AY512560
Chicken (2001 bp) 1104 99 XM_421053
Human (3149 bp) 545 83 NM_004265
Cow (1630 bp) 556 83 XM_600092
Dog (1869 bp) 556 83 XM_540913
Pig (461 bp) 264 84 AY512561
Rat (1706 bp) 518 82 NM_031344
Mouse (1508 bp) 513 83 NM_019699
FADS2
(1380 bp)
Atlantic salmon (2119 bp) 235 85 AY458652
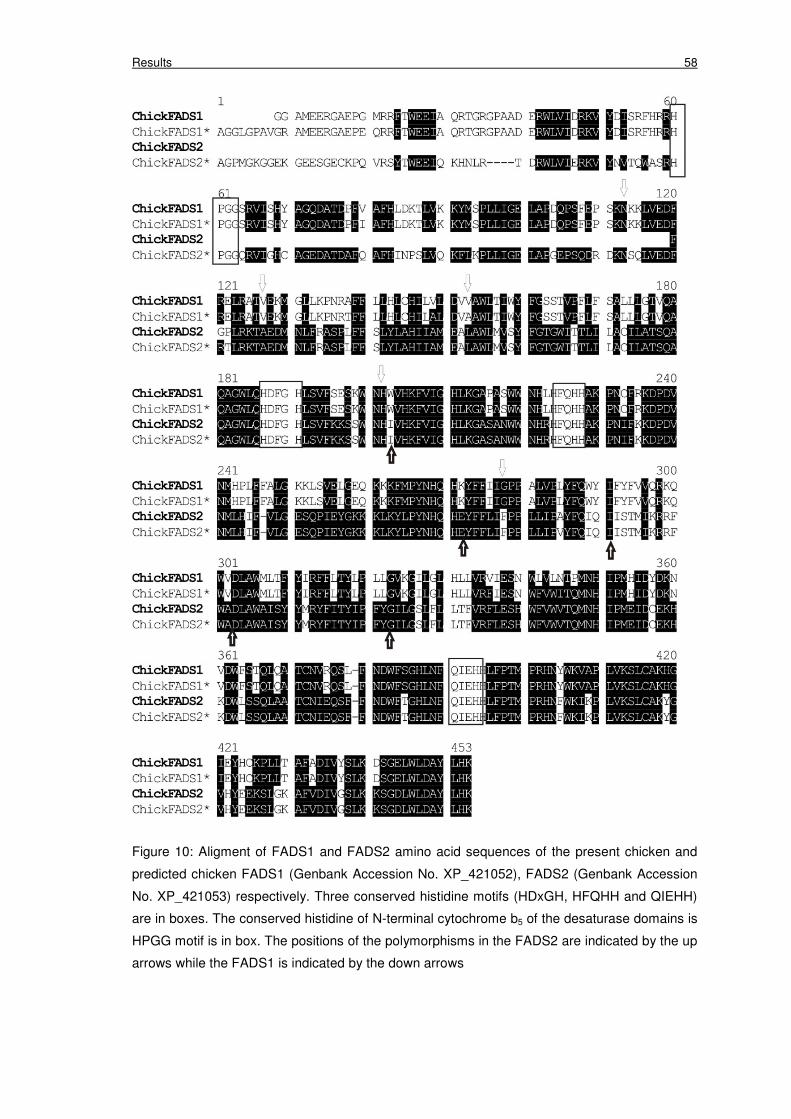
Results 58
Figure 10: Aligment of FADS1 and FADS2 amino acid sequences of the present chicken and
predicted chicken FADS1 (Genbank Accession No. XP_421052), FADS2 (Genbank Accession
No. XP_421053) respectively. Three conserved histidine motifs (HDxGH, HFQHH and QIEHH)
are in boxes. The conserved histidine of N-terminal cytochrome b5 of the desaturase domains is
HPGG motif is in box. The positions of the polymorphisms in the FADS2 are indicated by the up
arrows while the FADS1 is indicated by the down arrows

Results 59
The exon/intron boundaries in chicken FADS2 and FADS1 were determined the same
way as in the quail sequences. These alignments showed that the chicken FADS2
cDNA consists of seven exons starting from exon 3 to exon 9, while FADS1 cDNA
consists of 12 exons as in human (Figure 11).
The comparison of the deduced amino acid sequences of FADS2 and FADS1 genes
have revealed the existence of three conserved His-box motifs: HDFGH, HFQHH and
QIEHH. However, the heme-binding residue in the cytochrome b5 superfamily HPGG
motif on chicken FADS2 sequence was not found (Figure 10).
The cDNA sequences of FADS2 and FADS1 of the Genbank predicted sequences in
chicken XM_421052 (2847 bp) for FADS1 and XM_421053 (2001 bp) for FADS2
were compared to the new sequences in quail chicken were compared. The results
showed that the new sequences in both quail and chicken were shorter than the
Genbank sequences of FADS2 and FADS1 cDNA. For example, the incomplete
sequence of quail FADS2 cDNA missed about 400 bp at the 5’- end and 370 bp at the
3’- end while in chicken about 600 bp and 280 bp at the 5’- and 3’- ends was missing.
The FADS1 sequence was missing about 1,000 bp at the 5’- end and about 600 bp and
450 bp at the 3’- end for quail and chicken, respectively. Therefore, the missing
fragments were sequenced with the primers derived from the 5’- and 3’- ends based on
the overlap between the new sequences of FADS2 and FADS1 and the chicken
predicted sequences (XM_421053 and XM_421052, respectively) were amplified on
both cDNAs of quail and chicken. Nevertheless, no longer sequence was obtained.
Figure 11: Exon/intron structure of the FADS1 and FADS2 genes in chicken
Exons of FADS1 and FADS2 are indicated by white box. The 5’- and 3’- untranslated
regions are in black box. The dotted boxes indicate the exons that are not found in
chicken sequence. Five SNPs of FADS1 and FADS2 genes are indicated by arrows
FADS1
FADS2
5‘ 3‘
5 kb
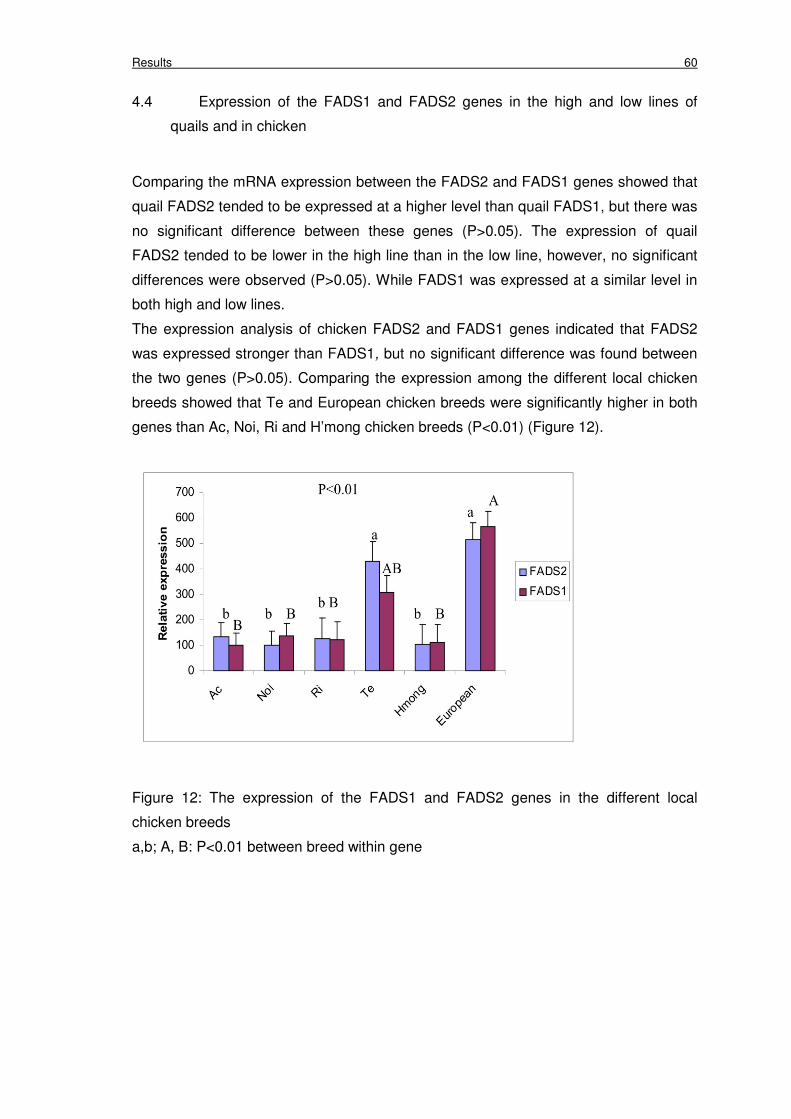
Results 60
4.4 Expression of the FADS1 and FADS2 genes in the high and low lines of
quails and in chicken
Comparing the mRNA expression between the FADS2 and FADS1 genes showed that
quail FADS2 tended to be expressed at a higher level than quail FADS1, but there was
no significant difference between these genes (P>0.05). The expression of quail
FADS2 tended to be lower in the high line than in the low line, however, no significant
differences were observed (P>0.05). While FADS1 was expressed at a similar level in
both high and low lines.
The expression analysis of chicken FADS2 and FADS1 genes indicated that FADS2
was expressed stronger than FADS1, but no significant difference was found between
the two genes (P>0.05). Comparing the expression among the different local chicken
breeds showed that Te and European chicken breeds were significantly higher in both
genes than Ac, Noi, Ri and H’mong chicken breeds (P<0.01) (Figure 12).
Figure 12: The expression of the FADS1 and FADS2 genes in the different local
chicken breeds
a,b; A, B: P<0.01 between breed within gene
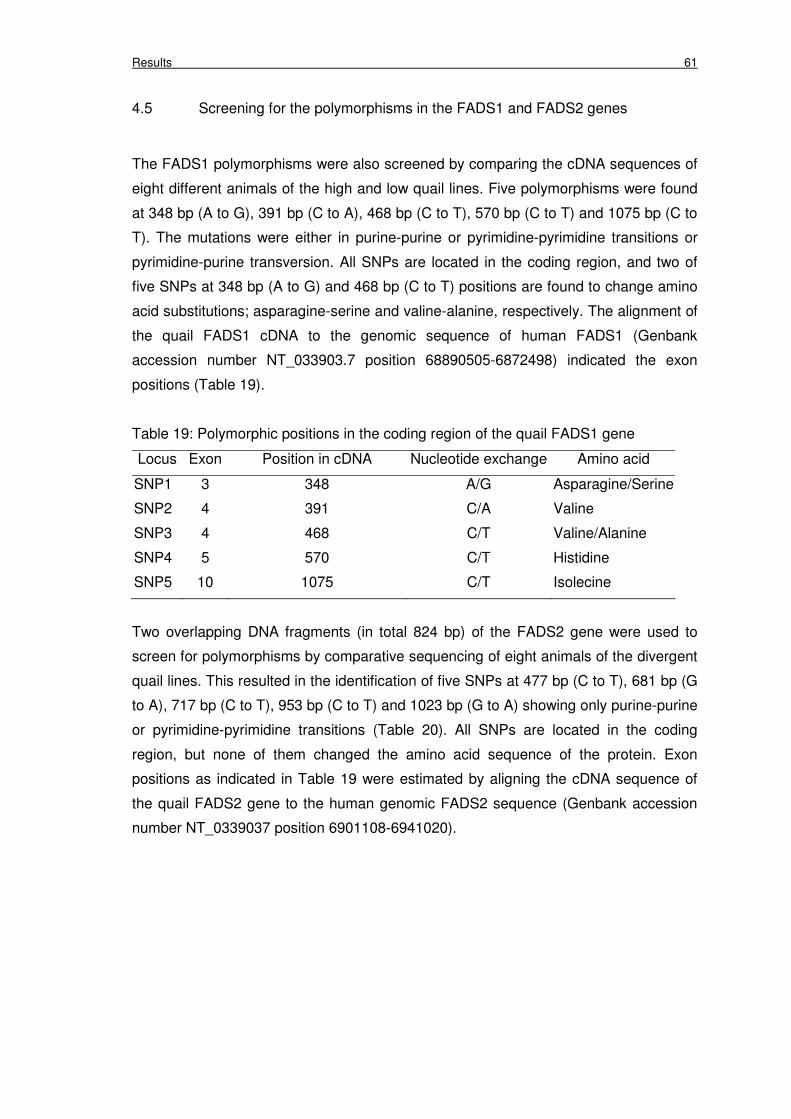
Results 61
4.5 Screening for the polymorphisms in the FADS1 and FADS2 genes
The FADS1 polymorphisms were also screened by comparing the cDNA sequences of
eight different animals of the high and low quail lines. Five polymorphisms were found
at 348 bp (A to G), 391 bp (C to A), 468 bp (C to T), 570 bp (C to T) and 1075 bp (C to
T). The mutations were either in purine-purine or pyrimidine-pyrimidine transitions or
pyrimidine-purine transversion. All SNPs are located in the coding region, and two of
five SNPs at 348 bp (A to G) and 468 bp (C to T) positions are found to change amino
acid substitutions; asparagine-serine and valine-alanine, respectively. The alignment of
the quail FADS1 cDNA to the genomic sequence of human FADS1 (Genbank
accession number NT_033903.7 position 68890505-6872498) indicated the exon
positions (Table 19).
Table 19: Polymorphic positions in the coding region of the quail FADS1 gene
Locus Exon Position in cDNA Nucleotide exchange Amino acid
SNP1 3 348 A/G Asparagine/Serine
SNP2 4 391 C/A Valine
SNP3 4 468 C/T Valine/Alanine
SNP4 5 570 C/T Histidine
SNP5 10 1075 C/T Isolecine
Two overlapping DNA fragments (in total 824 bp) of the FADS2 gene were used to
screen for polymorphisms by comparative sequencing of eight animals of the divergent
quail lines. This resulted in the identification of five SNPs at 477 bp (C to T), 681 bp (G
to A), 717 bp (C to T), 953 bp (C to T) and 1023 bp (G to A) showing only purine-purine
or pyrimidine-pyrimidine transitions (Table 20). All SNPs are located in the coding
region, but none of them changed the amino acid sequence of the protein. Exon
positions as indicated in Table 19 were estimated by aligning the cDNA sequence of
the quail FADS2 gene to the human genomic FADS2 sequence (Genbank accession
number NT_0339037 position 6901108-6941020).
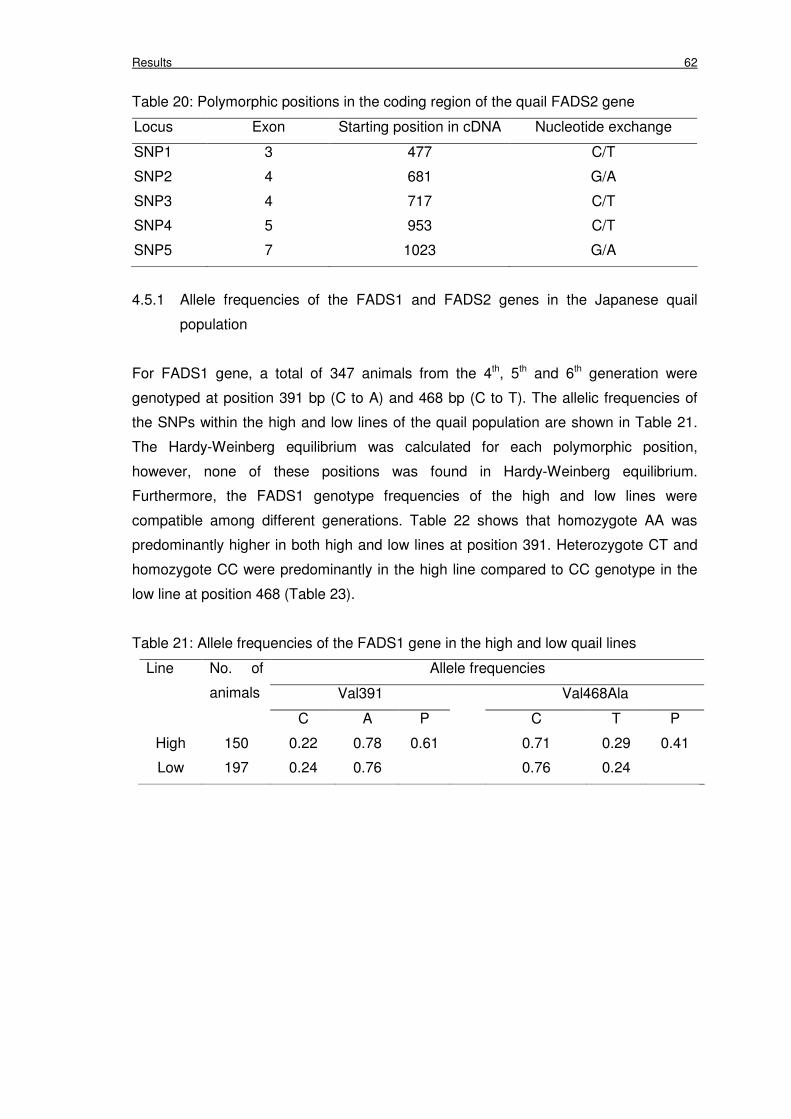
Results 62
Table 20: Polymorphic positions in the coding region of the quail FADS2 gene
Locus Exon Starting position in cDNA Nucleotide exchange
SNP1 3 477 C/T
SNP2 4 681 G/A
SNP3 4 717 C/T
SNP4 5 953 C/T
SNP5 7 1023 G/A
4.5.1 Allele frequencies of the FADS1 and FADS2 genes in the Japanese quail
population
For FADS1 gene, a total of 347 animals from the 4th, 5th and 6th generation were
genotyped at position 391 bp (C to A) and 468 bp (C to T). The allelic frequencies of
the SNPs within the high and low lines of the quail population are shown in Table 21.
The Hardy-Weinberg equilibrium was calculated for each polymorphic position,
however, none of these positions was found in Hardy-Weinberg equilibrium.
Furthermore, the FADS1 genotype frequencies of the high and low lines were
compatible among different generations. Table 22 shows that homozygote AA was
predominantly higher in both high and low lines at position 391. Heterozygote CT and
homozygote CC were predominantly in the high line compared to CC genotype in the
low line at position 468 (Table 23).
Table 21: Allele frequencies of the FADS1 gene in the high and low quail lines
Allele frequencies
Val391 Val468Ala
Line No. of
animals
C A P C T P
High 150 0.22 0.78 0.61 0.71 0.29 0.41
Low 197 0.24 0.76 0.76 0.24

Results 63
Table 22: Genotype frequencies of the FADS1 Val391 genotypes in the different
generations of the high and low lines
High Low Generation
CC CA AA CC CA AA
S4 0.07 (2) 0.34 (11) 0.59 (19) 0.07 (3) 0.48 (19) 0.45 (18)
S5 0.08 (4) 0.30 (16) 0.62 (33) 0.05 (3) 0.44 (31) 0.51 (36)
S6 0.07 (5) 0.28 (18) 0.65 (42) 0.08 (7) 0.22 (19) 0.70 (61)
Number of animals per genotype and generation are shown in parentheses
Table 23: Genotype frequencies of the FADS1 Val468Ala genotypes in the different
generations of the high and low lines in quails
High Low Generation
CC CT TT CC CT TT
S4 0.45 (13) 0.48 (14) 0.07 (2) 0.49 (21) 0.44 (19) 0.07 (3)
S5 0.58 (30) 0.37 (19) 0.05 (3) 0.50 (35) 0.46 (32) 0.04 (3)
S6 0.49 (33) 0.42 (28) 0.09 (6) 0.69 (58) 0.23 (19) 0.08 (7)
Number of animals per genotype and generation are shown in parentheses
A total of 160 animals have been genotyped for the five SNPs of the FADS2 gene and
the allelic frequencies are given in Table 24. All genotype distributions were tested for
Hardy-Weinberg equilibrium. There only genotypes at SNP5 was to the Hardy-
Weinberg equilibrium while the other four were not in Hardy-Weinberg equilibrium.
Table 24: Allele frequencies of the FADS2 SNPs in the high and low quail lines in
quails
SNP1 SNP2 SNP3 SNP4 SNP5
C T G A C T C T G A P
Low (n=92) 0.61 0.39 0.93 0.07 0.57 0.43 0.28 0.72 0.86 0.14 <0.05
High (n=68) 0.59 0.41 0.89 0.11 0.59 0.41 0.25 0.75 0.78 0.22
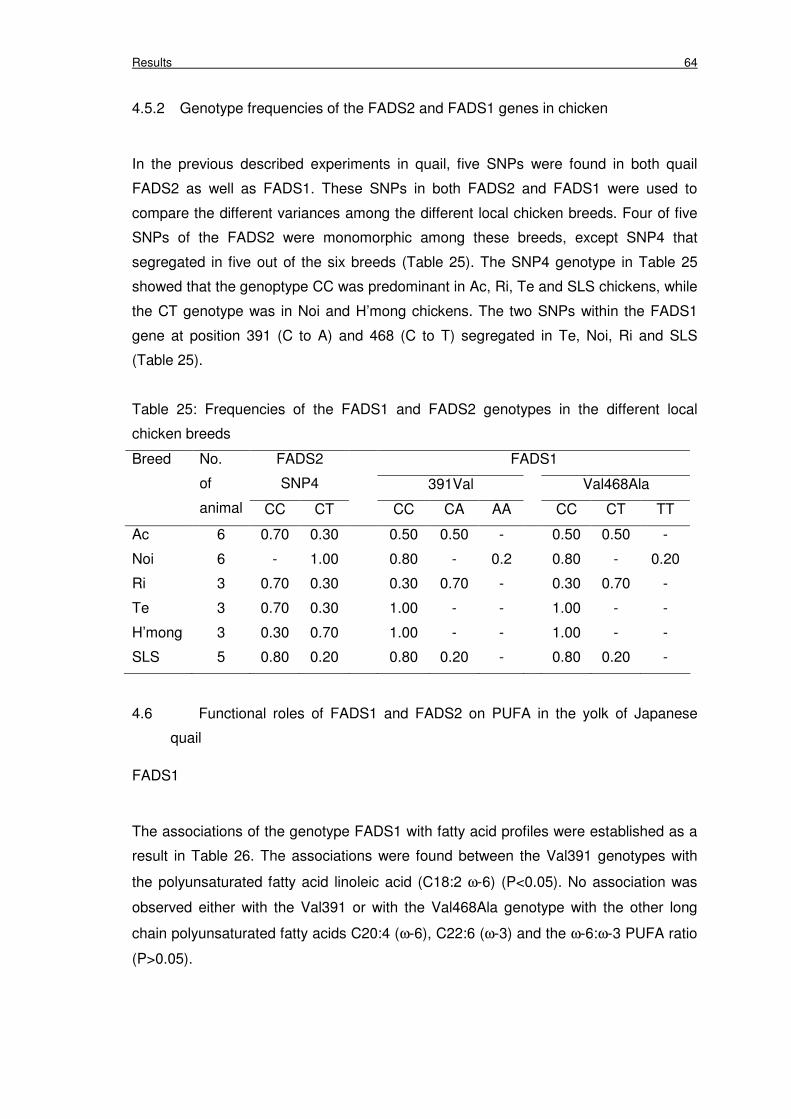
Results 64
4.5.2 Genotype frequencies of the FADS2 and FADS1 genes in chicken
In the previous described experiments in quail, five SNPs were found in both quail
FADS2 as well as FADS1. These SNPs in both FADS2 and FADS1 were used to
compare the different variances among the different local chicken breeds. Four of five
SNPs of the FADS2 were monomorphic among these breeds, except SNP4 that
segregated in five out of the six breeds (Table 25). The SNP4 genotype in Table 25
showed that the genoptype CC was predominant in Ac, Ri, Te and SLS chickens, while
the CT genotype was in Noi and H’mong chickens. The two SNPs within the FADS1
gene at position 391 (C to A) and 468 (C to T) segregated in Te, Noi, Ri and SLS
(Table 25).
Table 25: Frequencies of the FADS1 and FADS2 genotypes in the different local
chicken breeds
FADS1 FADS2
SNP4 391Val Val468Ala
Breed No.
of
animal CC CT CC CA AA CC CT TT
Ac 6 0.70 0.30 0.50 0.50 - 0.50 0.50 -
Noi 6 - 1.00 0.80 - 0.2 0.80 - 0.20
Ri 3 0.70 0.30 0.30 0.70 - 0.30 0.70 -
Te 3 0.70 0.30 1.00 - - 1.00 - -
H’mong 3 0.30 0.70 1.00 - - 1.00 - -
SLS 5 0.80 0.20 0.80 0.20 - 0.80 0.20 -
4.6 Functional roles of FADS1 and FADS2 on PUFA in the yolk of Japanese
quail
FADS1
The associations of the genotype FADS1 with fatty acid profiles were established as a
result in Table 26. The associations were found between the Val391 genotypes with
the polyunsaturated fatty acid linoleic acid (C18:2 ω-6) (P<0.05). No association was
observed either with the Val391 or with the Val468Ala genotype with the other long
chain polyunsaturated fatty acids C20:4 (ω-6), C22:6 (ω-3) and the ω-6:ω-3 PUFA ratio
(P>0.05).
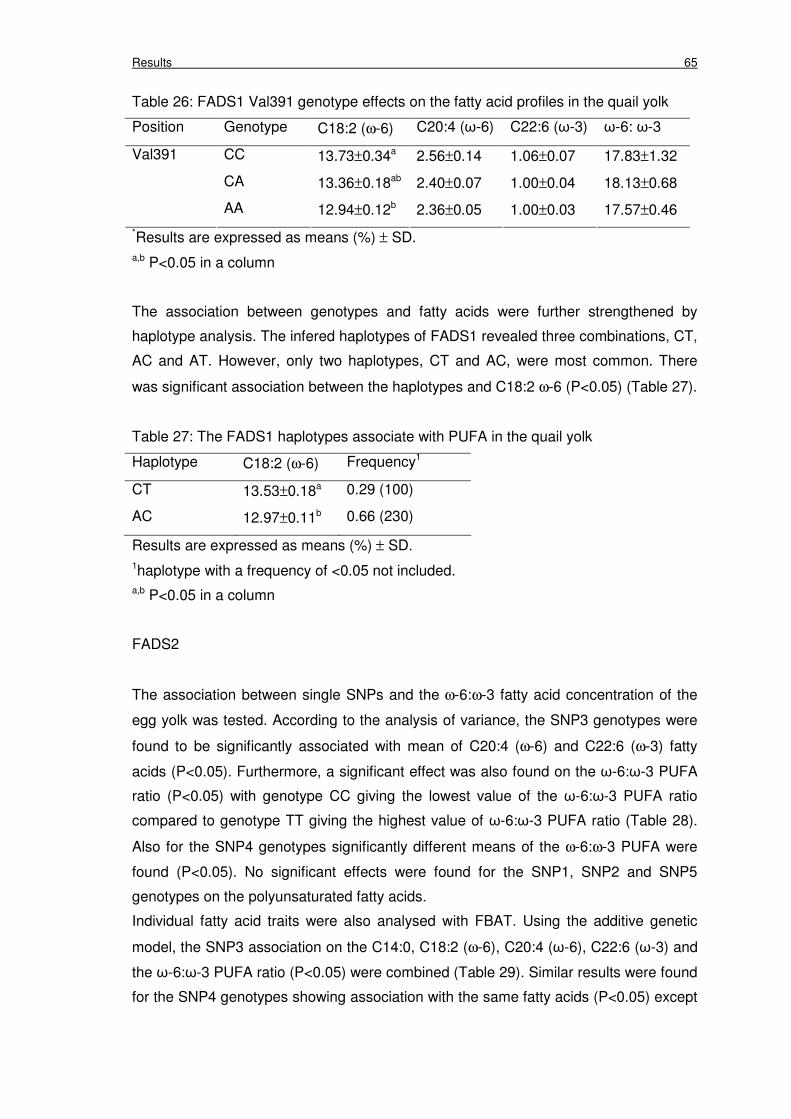
Results 65
Table 26: FADS1 Val391 genotype effects on the fatty acid profiles in the quail yolk
Position Genotype C18:2 (ω-6) C20:4 (ω-6) C22:6 (ω-3) ω-6: ω-3
CC 13.73±0.34a 2.56±0.14 1.06±0.07 17.83±1.32
CA 13.36±0.18ab 2.40±0.07 1.00±0.04 18.13±0.68
Val391
AA 12.94±0.12b 2.36±0.05 1.00±0.03 17.57±0.46
*Results are expressed as means (%) ± SD.
a,b P<0.05 in a column
The association between genotypes and fatty acids were further strengthened by
haplotype analysis. The infered haplotypes of FADS1 revealed three combinations, CT,
AC and AT. However, only two haplotypes, CT and AC, were most common. There
was significant association between the haplotypes and C18:2 ω-6 (P<0.05) (Table 27).
Table 27: The FADS1 haplotypes associate with PUFA in the quail yolk
Haplotype C18:2 (ω-6) Frequency1
CT 13.53±0.18a 0.29 (100)
AC 12.97±0.11b 0.66 (230)
Results are expressed as means (%) ± SD.
1haplotype with a frequency of <0.05 not included.
a,b P<0.05 in a column
FADS2
The association between single SNPs and the ω-6:ω-3 fatty acid concentration of the
egg yolk was tested. According to the analysis of variance, the SNP3 genotypes were
found to be significantly associated with mean of C20:4 (ω-6) and C22:6 (ω-3) fatty
acids (P<0.05). Furthermore, a significant effect was also found on the ω-6:ω-3 PUFA
ratio (P<0.05) with genotype CC giving the lowest value of the ω-6:ω-3 PUFA ratio
compared to genotype TT giving the highest value of ω-6:ω-3 PUFA ratio (Table 28).
Also for the SNP4 genotypes significantly different means of the ω-6:ω-3 PUFA were
found (P<0.05). No significant effects were found for the SNP1, SNP2 and SNP5
genotypes on the polyunsaturated fatty acids.
Individual fatty acid traits were also analysed with FBAT. Using the additive genetic
model, the SNP3 association on the C14:0, C18:2 (ω-6), C20:4 (ω-6), C22:6 (ω-3) and
the ω-6:ω-3 PUFA ratio (P<0.05) were combined (Table 29). Similar results were found
for the SNP4 genotypes showing association with the same fatty acids (P<0.05) except

Results 66
the ω-6:ω-3 PUFA ratio (Table 29). No significant associations were observed among
the SNP1, SNP2 and SNP5 genotypes and the phenotypic fatty acids under this model.
Table 28: Genotype effects of the FADS2 gene on polyunsaturated fatty acid profiles in
egg yolk
SNP3
Genotype TT CT CC
Trait (%)
C18:2ω-6 14.16±0.98 13.91±0.21 13.22±0.48
C20:4ω-6 1.81b±0.33 2.37a±0.07 2.44a±0.17
C22:6ω-3 0.71b±0.18 1.02a±0.04 1.07a±0.09
ω-6:ω-3 25.31a±3.10 19.78b±0.65 16.49b±1.53
Genotype SNP4
Trait TT CT CC
ω-6:ω-3 18.21ab±0.83 21.05b±0.94 13.60a±3.53
*Results are expressed as means (%) ± SD
a,b P<0.05 in a line
Table 29: The association between the FADS2 SNPs and the fatty acids profiles by
FBAT analysis
Locus SNP3 (C-T) SNP4 (C-T)
Traits Z p-value Z p-value
C14:0 2.355 0.019* 2.105 0.035*
C18:2 ω-6 2.177 0.029* 2.173 0.030*
C20:4 ω-6 2.589 0.010* 2.590 0.010*
C22:6 ω-3 2.602 0.009** 2.566 0.010*
ω-6:ω-3 2.089 0.037* 1.840 0.066ns
* P<0.05; ** P<0.01; ns: not significant
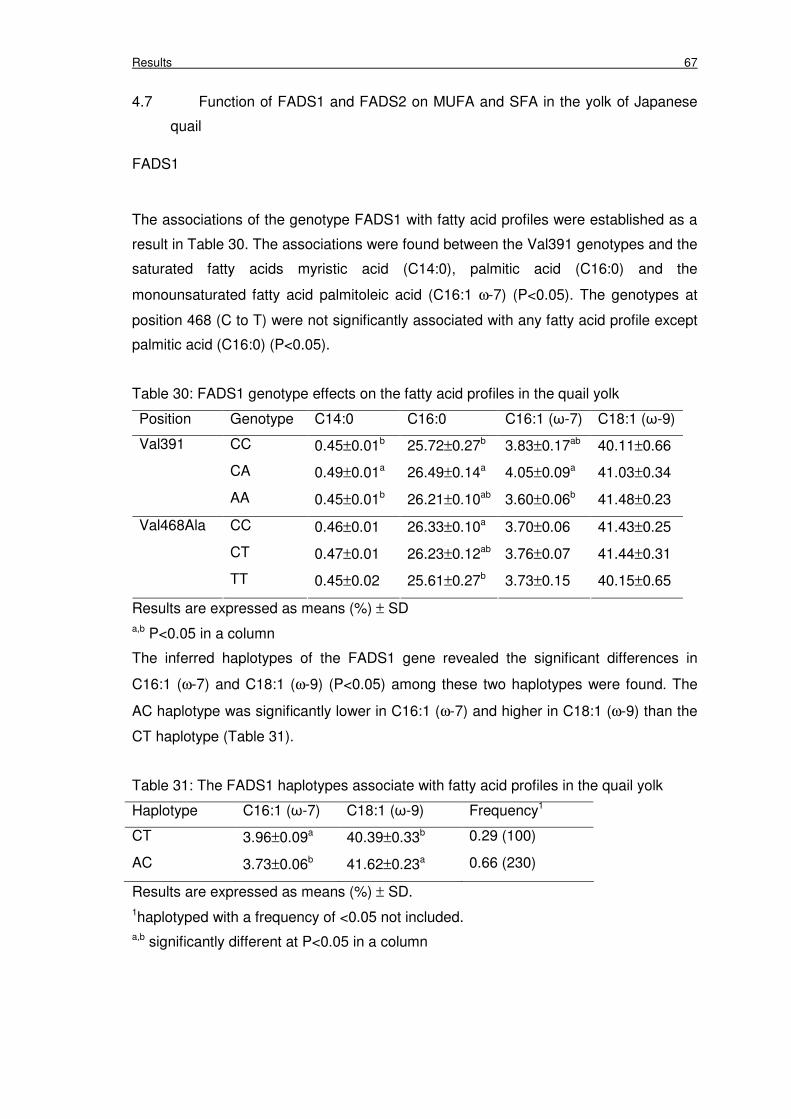
Results 67
4.7 Function of FADS1 and FADS2 on MUFA and SFA in the yolk of Japanese
quail
FADS1
The associations of the genotype FADS1 with fatty acid profiles were established as a
result in Table 30. The associations were found between the Val391 genotypes and the
saturated fatty acids myristic acid (C14:0), palmitic acid (C16:0) and the
monounsaturated fatty acid palmitoleic acid (C16:1 ω-7) (P<0.05). The genotypes at
position 468 (C to T) were not significantly associated with any fatty acid profile except
palmitic acid (C16:0) (P<0.05).
Table 30: FADS1 genotype effects on the fatty acid profiles in the quail yolk
Position Genotype C14:0 C16:0 C16:1 (ω-7) C18:1 (ω-9)
CC 0.45±0.01b 25.72±0.27b 3.83±0.17ab 40.11±0.66
CA 0.49±0.01a 26.49±0.14a 4.05±0.09a 41.03±0.34
Val391
AA 0.45±0.01b 26.21±0.10ab 3.60±0.06b 41.48±0.23
CC 0.46±0.01 26.33±0.10a 3.70±0.06 41.43±0.25
CT 0.47±0.01 26.23±0.12ab 3.76±0.07 41.44±0.31
Val468Ala
TT 0.45±0.02 25.61±0.27b 3.73±0.15 40.15±0.65
Results are expressed as means (%) ± SD
a,b P<0.05 in a column
The inferred haplotypes of the FADS1 gene revealed the significant differences in
C16:1 (ω-7) and C18:1 (ω-9) (P<0.05) among these two haplotypes were found. The
AC haplotype was significantly lower in C16:1 (ω-7) and higher in C18:1 (ω-9) than the
CT haplotype (Table 31).
Table 31: The FADS1 haplotypes associate with fatty acid profiles in the quail yolk
Haplotype C16:1 (ω-7) C18:1 (ω-9) Frequency1
CT 3.96±0.09a 40.39±0.33b 0.29 (100)
AC 3.73±0.06b 41.62±0.23a 0.66 (230)
Results are expressed as means (%) ± SD.
1haplotyped with a frequency of <0.05 not included.
a,b significantly different at P<0.05 in a column
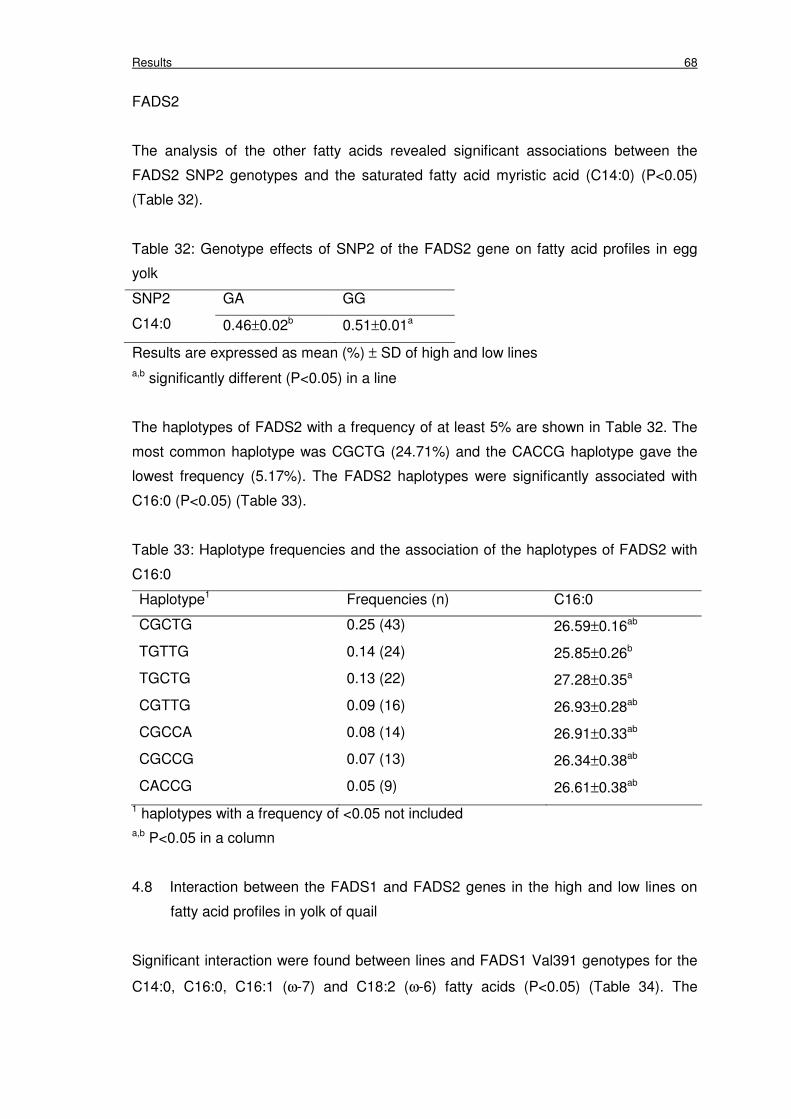
Results 68
FADS2
The analysis of the other fatty acids revealed significant associations between the
FADS2 SNP2 genotypes and the saturated fatty acid myristic acid (C14:0) (P<0.05)
(Table 32).
Table 32: Genotype effects of SNP2 of the FADS2 gene on fatty acid profiles in egg
yolk
SNP2 GA GG
C14:0 0.46±0.02b 0.51±0.01a
Results are expressed as mean (%) ± SD of high and low lines
a,b significantly different (P<0.05) in a line
The haplotypes of FADS2 with a frequency of at least 5% are shown in Table 32. The
most common haplotype was CGCTG (24.71%) and the CACCG haplotype gave the
lowest frequency (5.17%). The FADS2 haplotypes were significantly associated with
C16:0 (P<0.05) (Table 33).
Table 33: Haplotype frequencies and the association of the haplotypes of FADS2 with
C16:0
Haplotype1 Frequencies (n) C16:0
CGCTG 0.25 (43) 26.59±0.16ab
TGTTG 0.14 (24) 25.85±0.26b
TGCTG 0.13 (22) 27.28±0.35a
CGTTG 0.09 (16) 26.93±0.28ab
CGCCA 0.08 (14) 26.91±0.33ab
CGCCG 0.07 (13) 26.34±0.38ab
CACCG 0.05 (9) 26.61±0.38ab
1 haplotypes with a frequency of <0.05 not included
a,b P<0.05 in a column
4.8 Interaction between the FADS1 and FADS2 genes in the high and low lines on
fatty acid profiles in yolk of quail
Significant interaction were found between lines and FADS1 Val391 genotypes for the
C14:0, C16:0, C16:1 (ω-7) and C18:2 (ω-6) fatty acids (P<0.05) (Table 34). The
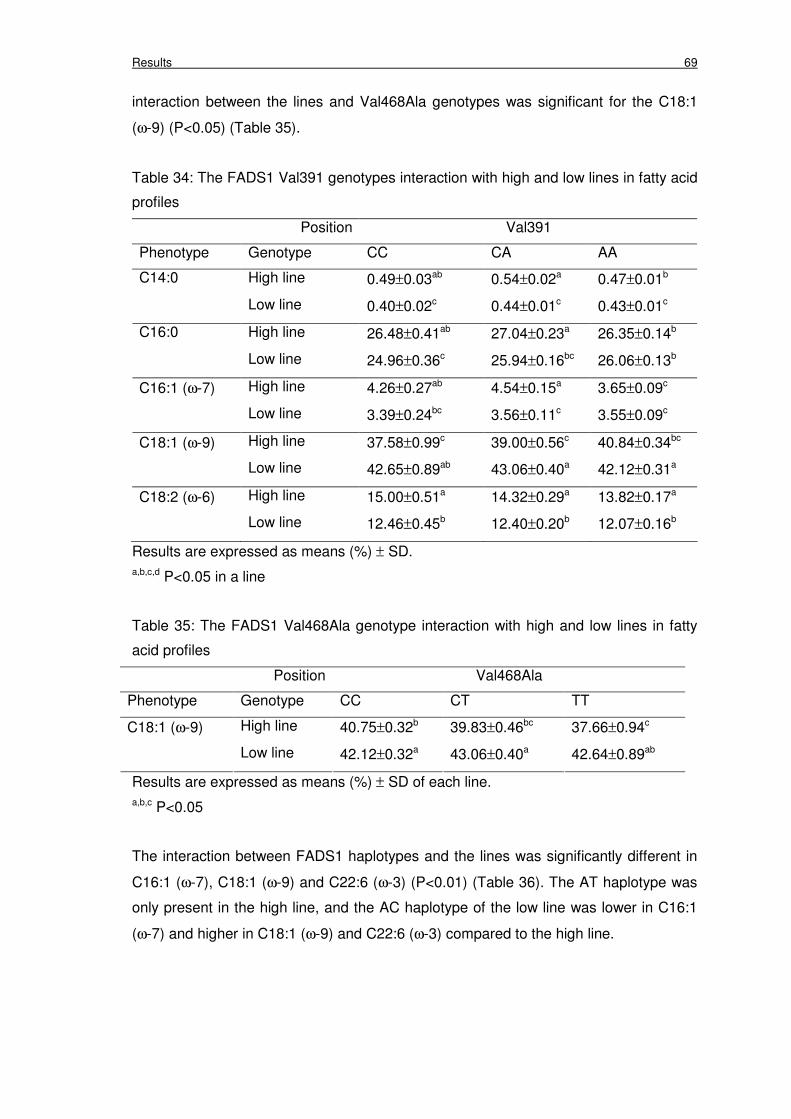
Results 69
interaction between the lines and Val468Ala genotypes was significant for the C18:1
(ω-9) (P<0.05) (Table 35).
Table 34: The FADS1 Val391 genotypes interaction with high and low lines in fatty acid
profiles
Position Val391
Phenotype Genotype CC CA AA
High line 0.49±0.03ab 0.54±0.02a 0.47±0.01b C14:0
Low line 0.40±0.02c 0.44±0.01c 0.43±0.01c
High line 26.48±0.41ab 27.04±0.23a 26.35±0.14b C16:0
Low line 24.96±0.36c 25.94±0.16bc 26.06±0.13b
High line 4.26±0.27ab 4.54±0.15a 3.65±0.09c C16:1 (ω-7)
Low line 3.39±0.24bc 3.56±0.11c 3.55±0.09c
High line 37.58±0.99c 39.00±0.56c 40.84±0.34bc C18:1 (ω-9)
Low line 42.65±0.89ab 43.06±0.40a 42.12±0.31a
C18:2 (ω-6) High line 15.00±0.51a 14.32±0.29a 13.82±0.17a
Low line 12.46±0.45b 12.40±0.20b 12.07±0.16b
Results are expressed as means (%) ± SD.
a,b,c,d P<0.05 in a line
Table 35: The FADS1 Val468Ala genotype interaction with high and low lines in fatty
acid profiles
Position Val468Ala
Phenotype Genotype CC CT TT
High line 40.75±0.32b 39.83±0.46bc 37.66±0.94c C18:1 (ω-9)
Low line 42.12±0.32a 43.06±0.40a 42.64±0.89ab
Results are expressed as means (%) ± SD of each line.
a,b,c P<0.05
The interaction between FADS1 haplotypes and the lines was significantly different in
C16:1 (ω-7), C18:1 (ω-9) and C22:6 (ω-3) (P<0.01) (Table 36). The AT haplotype was
only present in the high line, and the AC haplotype of the low line was lower in C16:1
(ω-7) and higher in C18:1 (ω-9) and C22:6 (ω-3) compared to the high line.

Results 70
Table 36: The FADS1 haplotype interaction with lines on the mono- and
polyunsaturated fatty acids
Phenotype Haplotype AT CT AC
High line 2.92±0.20c 4.44±0.14a 3.89±0.09b C16:1(ω-7)
Low line 3.49±0.11bc 3.56±0.07b
High line 41.32±0.77ab 37.89±0.52c 40.91±0.37b C18:1 (ω-9)
Low line 42.90±0.43a 42.33±0.28a
High line 2.19±0.17 2.52±0.11 2.21±0.08 C20:4 (ω-6)
Low line 2.48±0.09 2.48±0.06
C22:6 (ω-3) High line 0.89±0.08ab 1.02±0.06ab 0.87±0.04b
Low line 1.06±0.05a 1.10±0.03a
ω-6:ω-3 High line 19.30±1.53 19.19±1.04 20.79±0.71
Low line 16.36±0.86 15.09±0.56
Results are expressed as means (%) ± SD of each line.
a,b,c P<0.05 in a line
The interactions of polymorphisms of the FADS2 gene with the divergently high and
low lines (Table 37) were examined. Results of the SNP2 genotypes showed significant
interaction with the lines for C14:0 (P<0.01). Likewise, the interaction between lines
and SNP3 genotypes were significant for C16:0 fatty acid (P<0.05).
Table 37: Effect of the SNP2 and SNP3 genotypes of the FADS2 gene on the fatty acid
profiles in the high and low lines
SNP2 GA GG
High line 0.46±0.02b 0.56±0.01a C14:0
Low line 0.47±0.02b 0.46±0.01b
TT CT CC
High line 26.75±0.69cd 26.82±0.16cd 27.88±0.37c
SNP3
C16:0
Low line 26.12±0.69cd 26.43±0.13d 26.18±0.31d
*Results are expressed as means (%) ± SD of each line.
a,b P<0.01
c,d P<0.05
Discussion 71
5 Discussion
Nowadays, new insights into the relationship between food and prevention of diseases
are considered to be important for human being. In addition to fatty acids from the fish
source, fatty acids especially ω-3 PUFA from non-fish foods such as eggs have been
paid attention to. This study emphasized on the genetic variations between the high
and low lines of Japanese quail to improve the nutritive value of eggs, with respect to
the ω-3 and ω-6:ω-3 PUFA ratio, through understanding the metabolic pathways
particular in the desaturation of these fatty acids. This involved genomic approaches
including the identification of genes and their alleles contributing to the increase of the
ω-3 fatty acids as well as the reduction of the ω-6:ω-3 PUFA ratio to match the human
nutritional recommendation.
5.1 Fatty acid profiling
As previously mentioned, the fatty acid composition of the egg yolk can be changed by
modifying the hen’s diet (Watkins 1991, Cherian et al. 1992, 1993, Menicken et al.
2005). The yolk fatty acid profiles generally depend on the dietary fatty acid
composition and the deposition rate differs for different fatty acids. The fatty acid
profiles of the high and low line in Table 13 revealed that yolk fat was relatively higher
in unsaturated fatty acids, especially in oleic acid and followed by palmitic acid than in
the diet (Leskanich et al. 1997). The amount of SFA and MUFA were significantly
different between high and low lines in each generation with significant higher SFA and
lower MUFA in the high line than in the low line. Moreover, these data also indicated
that MUFA content was present at a higher level than SFA. The former fatty acids are
located on sn2 position whereas the latter are located on sn1 position (Leskanich et al.
1997). From the phenotypic data, it is clearly shown that the maternal fatty acids of
C18:2 (LA, ω-6) and C18:3 (ALA, ω-3) were higher in the diet than in the yolk
deposition, while the polyunsaturated fatty acids as C20:4 (AA, ω-6) and C22:6 (DHA,
ω-3), were the most predominant ω-6 and ω-3 fatty acids in the yolk, were converted
into the egg yolk although they were not detected in the feed supply. The fatty acid
profiles of the present study were in agreement with those of Mennicken et al. (2000,
2005), who showed that AA and DHA were higher in the yolk than in the diet. The
increase of these fatty acids in the egg yolk can be obtained in another way than
directly from the dietary fatty acids, i.e. they can be synthesized in the liver by
desaturation and elongation of LA and ALA, respectively (Watkins et al. 1987). In this
Discussion 72
synthesis, ∆6- and ∆5- desaturase enzymes, which create long chain polyunsaturated
fatty acid (LC-PUFA), are involved. Furthermore, the conversion of LA to AA was
relatively higher than that of ALA to DHA indicating the competition between the ω-6
and ω-3 PUFA for the enzymes involved in fatty acid elongation and desaturation.
Comparing the deposition rate between high and low lines indicated higher DHA and
AA in the low line than in the high line during the selection process. These line results
indicate genetic differences in utilization and storage of dietary fatty acids, with the low
line having most likely a more efficient utilization of dietary fat than the high line. This
could also be related to lower desaturase enzyme activities in the high line than in the
low line. This result is in agreement with Mennicken et al. (2005), who have shown that
the low line could be affected by divergent selection.
The increase in ω-3 fatty acids, particularly DHA, and decrease in ω-6 fatty acids
especially LA in the yolk of the low line leads to a reduced the ω-6:ω-3 PUFA ratio
(Table 13). Selection for the ω-6:ω-3 PUFA ratio after 6 generations in the high and low
lines resulted significantly lower. However, the ratio of ω-6:ω-3 PUFA among the three
generations of the two selected lines showed a similar selection response in the 7th
generation when compared to the 5th and 6th generation. It is suggested that the
divergent selection for the ω-6:ω-3 PUFA ratio has been efficient after 6 generations. In
a previous study (Mennicken et al. 2005), at generation 4 the ω-6:ω-3 PUFA ratio was
significantly different between the high and low lines (14.93 and 12.35, respectively). At
the 7th generation, the ratio of ω-6:ω-3 PUFA was 13.41 and 12.52 for the high and low
lines, respectively. The selection has become effective with increasing generations,
even though there was a slightly increase of the ω-6:ω-3 PUFA ratio at the 7th
generation in the low line. This result was in agreement with Zaky et al. (1996) who
showed that the fatty acid composition i.e. a higher ratio for PUFA:SFA had improved
over eight to nine generations by selection. In another experiment (Minvielle et al.
2002), selection on egg production increased yolk content and the ω-6:ω-3 PUFA ratio.
Little information has been reported on the estimated heritabilities for the egg quality
related to the ω-6:ω-3 PUFA ratio. Genetic variance was estimated by REML (Falconer
1984) for the differential selection of the C22:6 (DHA, ω-3) and the ω-6:ω-3 PUFA ratio.
Moderate heritabilities were found in the C22:6 (DHA, ω-3) and shown a higher
heritability for the ω-6:ω-3 PUFA ratio. In addition, the low line is more efficient than the
high line. Minvielle et al. (2002) found that selection for egg quality had moderate
heritability and strong genetic correlation with yolk component, particular in the ω-6:ω-3
PUFA ratio. This study and Mennicken et al. (2000, 2005) demonstrated that the

Discussion 73
divergent selection for the ω-6:ω-3 PUFA ratio was significantly higher in yolk weight,
proportion and the soluble fat content in the low line compared to the high line while
there was no significant difference between selected high and low lines as well as no
effect on fertility and hatchability. It is interesting to note that the heritability for the
abdominal fat of the female quail at 58 days was also moderate (0.33) (Sadjadi and
Becker 1980). There may be a close relationship between the abdominal fat trait and
yolk fat content. However, Suk et al. (1998) demonstrated that there was no correlation
between the yolk cholesterol and yolk fat content and the abdominal fat deposition.
In Table 15, the estimated heritabilities increased for both fatty acid traits during the
selection process suggesting that the breeding model can change the yolk fatty acids.
Mennicken et al. (2005) also recorded the heritability, which was higher when
compared to the results of this study but in agreement with the earlier results
(Mennicken et al. 2000). Moreover, negative genetic correlation between the C22:6
(DHA, ω-3) and the ω-6:ω-3 PUFA ratio indicates that selecting for higher ω-6:ω-3
PUFA ratio cooperates with a lower level of C22:6 (DHA, ω-3) fatty acid. This can be
illustrated by comparing the mean of C22:6 (ω-3) and the ω-6:ω-3 PUFA ratio between
high and low lines (Table 13). Mennicken et al. (2005) found a similar phenotypic
correlation between the C22:6 (DHA, ω-3) and the ω-6:ω-3 PUFA ratio.
As expected, the estimated heritablities for the ω-6:ω-3 PUFA ratio of both high and low
lines increased over generations whereas the phenotypic selection decreased. These
results indicate that selection can genetically improve DHA and change the ω-6:ω-3
PUFA ratio in the egg yolk.
5.2 Characterisation of the FADS1 and FADS2 genes in quail
In this study, the quail FADS2 gene was cloned and a sequence of 1350 bp obtained,
which comprised of 1227 bp coding sequence (CDS), the stop codon (nt1228-1230)
and the 3’ UTR region with the polyadenylation site. However, the 5’ end of CDS with
the start codon was not identified. Compared to the human cDNA FADS2 sequence
(3121 bp; Genbank accession number NM_004265.2) (Marquardt et al. 2000) the CDS
of the quail FADS2 gene is 120 bp shorter, which corresponds to the missing 40 amino
acids of the quail FADS2 protein (Figure 8).
In addition to the FADS2 gene, the quail FADS1 was also cloned and had a partial
cDNA of 1797 bp in length that comprised 1334 nucleotides encoding 445 amino acids
with the stop codon (nt1367-1369). However, the quail FADS1 cDNA was incomplete
with missing the start codon like the FADS2.
Discussion 74
The quail FADS2 and FADS1 nucleotide sequences showed high identity (77%) as did
the deduced protein. Moreover, both FADS2 and FADS1 showed high identity and are
closely related to the FADS2 and FADS1 of human, rat and mouse. Thus, quail FADS2
and FADS1 have also acquired as the functional characterization of fatty acid
desaturase activities. Human FADS1 and FADS2 together with FADS3 are clustered
genes, which are located on chromosome 11q12–q13.1. The first two desaturases are
oriented head to head and arose by duplication of the other (Marquardt et al. 2000,
Nakamura et al. 2004). By following the chicken genome project (NCBI, genome
project, chicken ID 10804), it is shown that FADS2 and FADS1 in chicken are located
head to head on chromosome 5. Based on the comparative map between chicken
chromosome 5 and quail chromosome 5 (Kayang et al. 2006) the FADS2 and FADS1
genes are most likely located on quail chromosome 5 as well. Therefore, it is possible
that quail FADS2 and FADS1 genes arose also from gene duplication as in human
(Marquardt et al. 2000, Nakamura et al. 2004) and mouse (Nakamura et al. 2004).
The deduced amino acid sequences of quail FADS2 and FADS1 contain two domains;
a N-terminal catalytic domain which is involved in the electron transport and acts as an
electron donor in the desaturation reaction (Michell et al. 1995, Marquardt et al. 2000)
and the C-terminal cytochrome b5-like domain containing three highly conserved
histidine motifs, HDXGH, HFQHH and QIEHH, which are characteristic for membrane-
bound desaturase (Jump et al. 1999, Marquardt et al. 2000) and essential for
desaturase activity. These structural features characteristic for the desaturase genes
were found in human (Cho et al. 1999 a, b, Marquardt et al. 2000), rat (Aki et al. 1999)
and mouse (Cho et al. 1999 a). Despite these similarities with other species, the heme-
binding residue in the cytochrome b5 superfamily “HPGG” motif, which is present in
human, rat, mouse and C. elegans FADS2 (Marquardt et al. 2000), is replaced by a
“HPGA” motif in both quail FADS2 and FADS1. This change from “G” to “A” in the hem-
binding iron in quail suggests that the cytochrome b5 of FADS2 and FADS1 containing
the “HPGA” motif may be characteristic in quail species and may not change the
protein expression and catalytic activities. As Guillou et al. (2004) found that the
deletion of the “HPGG” motif or the substitution of histidine for an alanine residue did
not change ∆6-desaturase expression in rat. Moreover, recent study in humans
demonstrated that front-end desaturases may accept some differences at the methyl
end of their substrates and require only an appropriate carboxylic end where the new
double bonds are introduced (Domergue et al. 2002).
In this study, the comparative sequencing of eight animals of the divergent quail lines
revealed five SNPs for both FADS2 and FADS1. As described in Figure 6, the last
three of five synonymous SNPs (SNP3, SNP4 and SNP5) of FADS2 were observed
Discussion 75
between the second and the third histidin box. They revealed highly conserved regions
across human, it could mean that these SNPs are ancestral amino acids of the FADS
gene cluster. Similarly, the identified five SNPs found for FADS1 included two amino
acid substitutions from asparagine to serine at position 348 and from valine to alanine
at position 468, which may have an important role on the enzyme function. Alignment
of the deduced amino acid sequences (Figure 7 and 8) indicated that the former amino
acid substitution and amino acid at SNP position 570 were highly conserved across the
three human FADS family, whereas the latter amino acid substitution together with the
other two SNPs at position 391 and 1075 were highly represented amino acids of
FADS1.
It is interesting that the five SNPs of quail FADS2 are located within the histindine rich
boxes of the desaturase enzyme, while the SNPs of FADS1 are near to the N-terminal
cytochrome b5 like domain. This may be related to the localization of both FADS2 and
FADS1 genes on the chromosome and possibly affected the transcription sequences of
FADS2 and FADS1 within this region. In human, the Northern-blot result indicated that
FADS2 and FADS1 genes are in closer relationship than to any other desaturase (Cho
et al. 1999 a).
This study additionally addressed the expression of the two genes in quail. In humans
FADS2 and FADS1 are expressed higher in liver compared to other tissues (Brenner
1989, Scott et al. 1989, Cho et al. 1999 a,b). Each desaturase displayed similar
activities toward the different substrates and the increment in FADS2 activity may have
masked an increase in FADS1 activity. Furthermore, the activity of both FADS2 and
FADS1 enzymes is mainly controlled by nutritional and hormonal factors (Wakil et al.
1983, Brenner 1989).
Quantitative Real-time-PCR results showed that quail FADS2 mRNA has a similar
expression compared to the quail FADS1 mRNA, though the FADS2 mRNA expressed
higher than that of FADS1. This result is in agreement with Leonard et al. (2000) who
showed that the expression of both FADS2 and FADS1 varied in different tissues and
was highest for FADS2. It is known that FADS2 is the rate-limiting enzyme in the
biosynthesis of the long chain PUFA and acts not only on C18- PUFA but also on C20-
PUFA (Sprecher et al. 1995) suggesting that FADS2 may require an appropriate higher
level for the transcription at both sites than FADS1. Besides, Hasting et al. (2001)
showed that the FADS2 gene is more active towards ∆6-desaturase substrates than
∆5-desaturase substrates and prefers to convert ω-3 fatty acids rather than ω-6 fatty
acids.
In comparison, the expression of the FADS genes in the divergent selection of the high
and low lines showed that the low line expressed FADS2 at a higher level, about two
Discussion 76
fold of that in the high line, whereas the expression of FADS1 was the same level in
both high and low lines. These results confirm and extend the phenotypic data which
showed a high deposition rate of DHA and AA and led to a low ratio of the ω-6:ω-3
PUFA in the low line. Haugaard et al. (2006) showed that there is a negative correlation
between the ω-6:ω-3 PUFA ratio and the ∆6-desaturase activity, i.e. increase in ∆6-
desaturase activity was parallel to a decrease in the ω-6:ω-3 PUFA ratio while the ∆5-
desaturase activity did not increase.
5.3 The expression of the FADS1 and FADS2 genes in different chicken breeds
Birds are able to synthesize the long chain ω-3 PUFA that are important source of EPA
and DHA for human health. However, a wide variation in fatty acids among the avian
species has been found (Leskanich et al. 1997, Surai et al. 1999). Molecular
understanding of the different species in their abilities to synthesis of EPA and DHA
may contribute to a biotechnological solution for production of EPA and DHA sources
which have been demonstrated in plant (Galili et al. 2002). In quail, the functional
FADS2 and FADS1 genes have been cloned and characterized as well as the
association between their SNPs with the fatty acid composition in the egg yolk. The
FADS2 and FADS1 genes in chicken were also identified and characterized. The SNPs
that were detected in quail were studied to evaluate their contributions to synthesize
AA and DHA by FADS2 and FADS1 desaturase activities in different Vietnamese local
chicken breeds.
Fatty acid profiles in Ri chicken yolk contained a higher level of oleic acid and palmitic
acid, which is consistent with the results in quail. The interesting findings in this study
are the levels of AA and DHA, the predominant polyunsaturated fatty acids in the yolk.
Compared with other results (Ahn et al. 1995, Leskanich et al. 1997) the low amount of
DHA and high AA in Ri chicken yolk, then consequently, the ratio of ω-6:ω-3 PUFA in
Ri chicken yolk was higher than in chicken eggs enriched with ω-3 fatty acids. Of
course, many studies illustrated that yolk fatty acid composition reflected dietary fat for
the laying hens, thus resulted in the increase of the proportion of the fatty acids that
deposit into the egg (Leskanich et al. 1997, Raes et al. 2002). An explanation for the
lower ω-3 fatty acids as well as the higher ω-6 fatty acids in Ri chicken may be because
the hens were fed a normal diet with a lower ω-3 fatty acid content. However, the level
of DHA content in Ri chicken compared with other species like turkey, goose and duck
(Surai et al. 1999) indicates that Ri chicken is also more efficient in converting to longer
chain ω-3 PUFAs than the above species. Therefore, studies on the different local
Discussion 77
chicken breeds are usefull regarding the improvement of the ω-3 fatty acid sources for
human consumption as well as the management of genetic resource populations and
their utilisation in future improvement programmes.
Regarding the different yolk fatty acids in relation to enzyme activities involved in the
conversion of long chain PUFAs, chicken FADS2 and FADS1 were identified and
characterized. A total length of 1380 bp and 1561 bp were obtained for the chicken
FADS2 and FADS1 genes, respectively. The coding sequence of FADS2 comprised
969 bp encoding 332 amino acids and the 1332 bp chicken FADS1 cDNA contained an
open reading frame of 444 amino acids. Both FADS genes share high similarity to the
predicted chicken genes, FADS2 (XM_421053) and FADS1 (XM_421052) and about
79% identities with their human analogues (Marquardt et al. 2000). However, the
alignment of FADS2 amino acid sequences in Figure 10 shows the small difference
between the present and predicted chickens, e.g. at position 121-122 and 285, it could
be potential polymophisms of this gene in chicken.
The structural characteristics of the FADS2 and FADS1 revealed the typical features of
membrane bound desaturases, HDFGH, HFQHH and QIEHH, and a cytochrome b5
like domain that is similar to human, rat, mouse and especially quail, except for the
deduced protein of FADS2 that was lacking of the cytochrome b5 like domain “HPGG”.
Aligned sequences reveal that the orthologous chicken FADS2 and FADS1 genes have
retained their intron/exon structure, indicating that the common ancestor of chicken
FADS genes may have similar functions to other mammalian desaturases reported.
Despite similarities between quail and chicken (Sadjadi and Becker 1980), both of
these species have some definite differences including the cytochrome b5 domain
containing the highly conserved sequence motif “HPGG”, which is found in chicken,
human and mouse, but changing to “HPGA” in quail. In addition, comparing the length
of the coding sequence and the deduced protein sequences of FADS2 and FADS1 in
chicken and quail showed that chicken sequences were shorter than those of quail.
However, both chicken and quail FADS2 and FADS1 sequences obtained shorter
length than the predicted molecular sizes, 2021 bp and 2847 bp for Gallus gallus
species of FADS2 (XM_421053) and FADS1 (XM_421052). One possible explanation
is the alternative transcripts of these genes in both quail and chicken that could be a
reason for getting shorter transcripts as described by Stöhr et al. (1998) for the
transcripts of 3,000 and 4,000 bp.
Consistent with previous expression results in quail, the mRNA expression of FADS2
and FADS1 genes in chicken showed no significant difference between both genes,
though expression was higher in FADS2 than FADS1. This could be because the
FADS2 and FADS1 are oriented in inverse sequence to each other on human
Discussion 78
chromosome 11 and the transcription of the FADS2 and FADS1 genes are co-
ordinately governed by regulator sequences within the 11,000 bp sequences (Cho et
al. 1999 b, Marquardt et al. 2000).
Although the different avian species with different fatty acid profiles have been reported
by Leskanich et al. (1997) and Surai et al. (1999), this is the first study on the local
genetic variability of chicken breeds regarding the expression of FADS2 and FADS1.
The expression of FADS2 and FADS1 mRNA in six different local chicken breeds
showed that the expression of Te chicken and European chicken is significantly (4.5 –
5 fold) higher than that in the other chicken breeds, Ac, Noi, Ri and H’mong (Figure
12). As the expression in quail showed, the ω-6:ω-3 PUFA ratio depends on the relative
expression of the FADS2 activity (Haugaard et al. 2006). It is therefore suggested that
the endogenous metabolism of Te and European chicken breeds may be more efficient
in the incorpation of the higher ω-3 PUFA into the egg yolk than others. In human,
hormones and other factors have been implicated in the control of expression of
FADS2 and FADS1. Here, genetic variation, another factor is hypothesized to increase
the activities of the desaturase enzymes. Also, the existence of genetically distinct
geographical populations or phylogenetic species could be concerned.
The differences among the diverse local chicken breeds were displayed furthermore by
the frequencies of FADS2 genotypes (Table 25). Interestingly, different genotypes of
FADS2 were observed for SNP4 position which showed significant association to ω-3
and ω-6 PUFAs in quail, whereas the other FADS2 SNPs were homologous. The
genotype CC was predominant for Ac, Ri, Te and European chicken breeds, whereas
for the Noi and H’mong chickens the CT genotype was predominant. The difference
between quail and chicken for the FADS2 gene on the ω-3 and ω-6 PUFA is that the
genotypes at SNP3 position were the most important in quail while in chicken the SNP4
position was most important.
The genotype frequencies of FADS1 are shown in Table 25. The genotype CC at 391
and 468 positions was predominant on Te, H’mong, European and Noi chickens; and
the genotypes CA and CT were predominant for Ri chicken.
5.4 Function of FADS1 and FADS2 on the fatty acids of the yolk
The FADS2 gene is addressed as a functional candidate gene for traits related to ω-6
and ω-3 PUFA concentration in egg yolk. Five SNPs were identified that segregated
among experimental divergently selected lines of quails. The SNPs were synonymous,
i.e. changing amino acids. The association analysis comprising analysis of variance
and family based association test (FBAT), revealed significant effects for SNP3 and
Discussion 79
SNP4 of FADS2 on the egg yolk fatty acid profiles, especially on the ω-6 and ω-3
PUFAs. These results indicate close linkage and linkage disequilibrium, i.e.
association, of the two SNPs with a causal polymorphism within or very close to
FADS2. No effects of the other SNPs were found, indicating that these are not in
linkage disequilibrium with the causal polymorphism. Comparisons of means
depending on genotypes indicate that the effect of the hypothesed causative
polymorphism is towards a more efficient desaturation, elongation and deposition of ω-
3 PUFA than ω-6 PUFA in the genotype favourised by selection for low ω-6:ω-3 PUFA
ratio, i.e. linoleic (LA) and α-linolenic acid (ALA) are precursors of long polyunsaturated
fatty acids that were available to the bird via the diet with the first being metabolized to
arachidonic acid (AA) and the second to docosahexaenoic acid (DHA).
In addition to the significant association between the FADS2 SNPs and the yolk ω-6
and ω-3 fatty acids, association was also found with the SFA myristic acid (C14:0). This
result may explain the fact that C14:0 increases ∆6-desaturase activity significantly
(Jan et al. 2004). Besides, Shappell et al. (2001) demonstrated that ∆6-desaturase
preferably receives C18 substrates for the catalytic mechanism and also allows
preferential desaturation of C14:0.
The haplotype analyses also showed significant association with an SFA, C16:0. The
TGTTG haplotype was associated with a significantly lower level of C16:0 compared to
the TGCTG haplotype. The different analyses indicate that the possible change of fatty
acid profile is mostly influenced by allele “C” or “T” at the SNP3 position. Miyazaki et al.
(2002) and Guillou et al. (2004) found that FADS2 acts on C16:0. Therefore, the
association between the FADS2 and the saturated fatty acids in quail indicate that it
may be correlated to saturated fatty acids that are effective in the de novo fatty acid
synthesis. Further studies on this aspect should be considered.
Furthermore, the other functional candidate gene FADS1, whose encoded protein is
specifically for the conversion of DGLA (C20:3 ω-6) to AA (C20:4 ω-6) or ETA (C20:4
ω-3) to DHA (C22:6 ω-3) in egg yolk (Sprecher et al. 1995), was addressed. Although
ω-6 and ω-3 C20 PUFA as DGLA and ETA are preferred substrates for the FADS1 in
other organisms, the association between FADS1 genotypes at position 391 and 468
with phenotypic fatty acid profiles in the yolk indicated that these polymorphisms were
neither significant associated with C20:3 (ω-6) nor C20:4 (ω-3). Even though, the
phenotypic fatty acid data strongly indicated the presence of FADS1 converting highly
specific the C20 – C22 PUFA. It is because the egg yolk contained too small amounts
of C20:3 (ω-6) and C20:4 (ω-3) fatty acids, which are the substrate for FADS1 in the
biosynthesis pathway, were therefore not available for analysis.
Discussion 80
In contrast, the association between FADS1 genotypes and saturated C14:0 and C16:0
fatty acids were significant. In animals, saturated C16:0 and C18:0 fatty acids are
desaturased to C16:1 (ω-7) and C18:1 (ω-9) fatty acids by stearoyl-CoA ∆9-
desaturase. Recently, a study in Bacillus subtilis showed that FADS1 desaturase can
introduce a double bond in saturated fatty acids (Aguilar et al. 1998, Altabe et al. 2003).
Additionally, the results continuously showed that associations were significant not only
with monounsaturated fatty acids but also with C18:2 (ω-6). These results were further
strengthened by the haplotype analysis which showed significant association with both
monounsaturated and C18:2 (ω-6) fatty acids. It is known that animals lack ∆12 and
∆15 fatty acid desaturases, which are responsible for converting oleic acid (C18:1, ω-9)
into C18:2 (ω-6) and C18:3 (ω-3). Plants normally can produce these essential fatty
acids by desaturase enzyme at C12 and C15 positions, but a recent study showed that
∆5- desaturase also acts on C18:1 (ω-9) (Kajikawa et al. 2006). In yeast, it is found that
the endogenous substrate oleic acid could be converted to C20:4 (ω-6) by the
coexpression of ∆12-, ∆6- and ∆5- desaturases (Parker-Barnes et al. 2000). Another
example showed that the gene encoded for ∆5-desaturase catalyses monoenoic and
dienoic C16 – 20 fatty acids instead of trienoic and tetraenoic C20 fatty acids (Cahoom
et al. 2000). The question remains whether quail FADS1 may have a similar
desaturase reaction like in plant and in yeast. It is known that different acyl carriers are
used by different enzymes involved in the fatty acid metabolism, e.g., in yeast acyl-lipid
desaturase is used while in animals acyl co-enzyme A (CoA) desaturase (Tocher et al.
1998, Nakamura et al. 2004) is active.
An explanation for the association of FADS1 to C18:2 (ω-6) may be that the alterations
in fatty acid desaturase activities are not specific to any fatty acid series. Maeda et al.
(1978) illustrated that the metabolism of PUFA altered in Chang cells and presented
activities of both ∆6 and ∆5 on C18:3 (ω-3) and C20:4 (ω-3) substrates. Moreover,
Domergue et al. (2002) demonstrated that the indiscriminate use of ω-6 and ω-3 fatty
acids for several ∆5- and ∆6-desaturases in different organisms may be a general
feature of front-end desaturases. These findings led to hypothesize that the FADS1
desaturase enzyme might be different from that of saturated or monounsaturated
specific enzymes.
Conclusion 81
6 Conclusions
This study is the first report on the effect of genetic factors on the fatty acid profiles,
which were found to be associated with the polymorphisms of the FADS1 and FADS2
genes coding for the enzymes catalysing the synthesis of essential fatty acids.
The selection experiment on quail demonstrated that modern breeding can genetically
improve DHA and the ω-6:ω-3 PUFA ratio in the yolk by breeding.
Sequencing of the FADS1 and FADS2 genes was done to elucidate the molecular
structure and gene expression of these genes and their encoded proteins in the
biosynthesis pathway of the ω-6:ω-3 PUFA, as well as their association with the fatty
acid profiles in the egg yolk. The genetic identification of the FADS1 and FADS2 is
expected to provide beneficial effects in chicken.
Studying both FADS1 and FADS2 genes in the different local chicken breeds
contributed to the existing knowledge on local chicken genetics regarding the
production of key nutrients for human health. The management of genetic resource
populations and their utilisation in future breeding programmes should be considered.
The selection on both FADS genes provides information for future breeding and
selection strategies using molecular information and gives an opportunity for the
commercial egg producer to minimize the ω-6:ω-3 PUFA in egg yolk. However, in
further studies more birds should be used to validate the current findings.
Finally, this study clearly showed that the results found in quail can be used in chicken.
Therefore, the quail is an excelent model organism for studies in other bird species.
Summary 82
7 Summary
It is hypothesized that genetic effects have an influence on the PUFA content in egg
yolk, especially in the ability to the synthesis of long chain PUFAs from the modified
diet of laying hen by carbon chain elongation and desaturation and the deposition of
these substances into the yolk. Therefore, divergent quail lines of the 5th, 6th and 7th
breeding generation, continuously selected for a high and low ω-6: ω-3 PUFA ratio in
the yolk, were used as an animal model to estimate genetic effects on the yolk fatty
acid profiles.
The objectives of this study were to elucidate the genetic divergence of these high and
low quail lines by estimating the genetic parameters, to clone and characterize the
direct candidate genes, FADS1 and FADS2 and to analyse the effects of
polymorphisms within these genes on the ω-6 and ω-3 fatty acid contents in egg yolk.
Furthermore, the expressions of the FADS1 and FADS2 genes, as well as their
polymorphisms were examined in different European (LSL) and Vietnamese chicken
(Ac, Noi, H’mong, Ri und Te) breeds.
The fatty acid profiles of the high and low lines showed that AA (C20:4 ω-4) and DHA
(C22:6 ω-3) content were significantly lower in the high line than in the low line
(P<0.01). Furthermore, the ratio of the ω-6 and ω-3 PUFA was significantly reduced
(P<0.01) between the low and high lines, however, no significant difference was found
between the high and low lines of the 7th generation. Moderate heritabilties were found
in the C22:6 (ω-3) and ω-6:ω-3 PUFA ratio. The low line seems to be higher heritable
for the ω-6:ω-3 PUFA ratio and is more efficient than the high line. Moreover, negative
genetic correlation between the C22:6 (ω-3) and the ω-6:ω-3 PUFA ratio indicate that
selecting for a higher ω-6:ω-3 PUFA ratio coincided with lower C22:6 (ω-3) fatty acid. It
is suggested that breeding can genetically improve DHA and the ω-6:ω-3 PUFA ratio in
the yolk.
The nucleotide sequences of the FADS1 and FADS2 cDNA were obtained by cloning
and sequencing PCR products, resulting from heterologous primers matching
conserved and gene-specific regions of the FADS family of human, mouse, rat and
subsequently 5´- and 3´- RACE.
The quail cDNA sequences of FADS1 and FADS2 consisted of 1797 bp and 1350 bp,
which encoded 445 amino acids and 404 amino acids, respectively. The deduced
amino acid sequences of quail FADS1 and FADS2 contain two domains; the N-terminal
catalytic domain and C-terminal cytochrome b5-like domains which encoded protein of
both FADS1 and FADS2 and presented three highly conserved histidine motifs,
Summary 83
HDXGH, HFQHH and QIEHH which are characteristic for membrane-bound
desaturase and essential for desaturase activity.
Comparing the mRNA expression between the quail FADS1 and FADS2 genes, in the
quail, FADS2 was expressed at a higher level than quail FADS1, but no significant
difference was found between the FADS1 and FADS2 genes between the high and low
lines (P>0.05).
The FADS1 and FADS2 genes were screened for polymorphisms by comparative
sequencing of eight animals from the high and low lines resulting in five SNPs in the
coding region of both FADS genes. The five SNPs of the FADS1 gene were found at
348 bp (A to G), 391 bp (C to A), 468 bp (C to T), 570 bp (C to T) and 1075 bp (C to T),
giving either purine-purine or pyrimidine-pyrimidine transitions or pyrimidine-purine
transversion. The two SNPs at position 348 and 468 resulted in an amino acid
substitution, asparagine-serine and valine-alanine, respectively. The FADS2 SNPs
were synonymous and found at 477 bp (C to T), 681 bp (G to A), 717 bp (C to T), 953
bp (C to T) and 1023 bp (G to A), showing only purine-purine or pyrimidine-pyrimidine
transitions.
Single-base-extension (SBE) was used for genotyping the five SNPs of the FADS2
gene and single strand conformation polymorphism (SSCP) was applied for genotyping
two SNPs of FADS1 at 391 bp and 468 bp position. Allelic frequencies of both FADS2
and FADS1 polymorphisms showed that only SNP5 of the FADS2 was in Hardy-
Weinberg equilibrium.
The chicken cDNA sequences of FADS1 and FADS2 were obtained, resulting in a
length of 1380 bp and 1561 bp, respectively. The quail SNPs were identified within
both genes and used to compare the different variances among the different local
chicken breeds. The FADS2 SNPs were monomorphic among these breeds except
SNP4 that segregated in five out of the six breeds. The two SNPs of the FADS1 gene
at position 391 (C to A) and 468 (C to T) segregated in Te, Noi, Ri and LSL.
The mRNA expression of the FADS2 gene was stronger than of the FADS1 gene and
the significant highest levels for both genes were observed in Te and European
chicken breeds (P<0.01).
The association between single SNPs and fatty acid profiles in the egg yolk was
analyzed. The association results of the FADS1 showed that genotypes at position 391
were significantly associated with saturated C14:0, C16:0 (P<0.05), monounsaturated
C16:1 (ω-7) (P<0.05), as well as with the polyunsaturated fatty acid C18:2 (ω-6)
(P<0.05). The genotypes at position 468 were only significantly associated with C16:0
(P<0.05). The infered haplotypes from these two SNPs show that haplotypes C/T and
A/C were significantly associated with C16:1 (ω-7), C18:1(ω-9); C18:2 (ω-6) (P<0.05).

Summary 84
For FADS2 SNPs, means of SNP3 genotypes were found to be significantly associated
with C20:4 (ω-6), C22:6 (ω-3) and the ω-6:ω-3 PUFA ratio (P<0.05) while SNP4
genotypes were significant associated to the ω-6:ω-3 PUFA ratio (P<0.05). The
comprising analysis of variance and family based association test (FBAT) revealed
significant effects of SNP3 and SNP4 genotypes on the egg yolk fatty acid profiles,
especially the ω-6 and ω-3 PUFAs (P<0.05). The results strongly promote FADS2 as a
functional candidate gene for traits related to ω-6 and ω-3 PUFA in eggs.

Zusammenfassung 85
8 Zusammenfassung
Es wird angenommen, dass genetische Effekte einen Einfluss auf den PUFA Gehalt im
Eidotter, besonders für die Fähigkeit der Synthese von langkettigen PUFAs aus der
modifizierten Fütterung von Legehennen mit langkettigen und gesättigten
Kohlenstoffketten und die Verlagerung dieser Substanzen in das Eidotter haben. Daher
wurden divergente Wachtellinien der fünften, sechsten und siebten Zuchtgeneration
durchgängig für ein hohes und niedriges ω-6: ω-3 PUFA Verhältnis selektiert und als
Tiermodell zur Messung des erwarteten genetischen Effekts auf das Fettsäureprofil im
Eidotter verwendet.
Ziel der Vorliegenden Arbeit war es, die genetische Divergenz in Wachtellinien, die auf
hohes („high line“) bzw. niedriges („low line“) ω-6:ω-3 PUFA Verhältnis selektiert waren,
zu eruieren. Die direkten Kandidatengene FADS1 und FADS2 wurden geklont und
charakterisiert, sowie der Einfluss von Polymorphismen in diesen Genen auf den ω-6
und ω-3 Fettsäuregehalt in Eidotter untersucht. Weiterhin wurden Expression und
Polymorphismen von FADS1 und FADS2 in verschieden europäischen (LSL) und
vietnamesischen Hühnerrassen (Ac, Noi, H’mong, Ri und Te) verglichen.
Das Fettsäureprofil der hohen und niedrigen Linien zeigte, dass die AA (C20:4 ω-4)
und DHA (C22:6 ω-3) Gehalte in den hohen Linien signifikant niedriger waren als in
den niedrigen Linien (P<0.01). Weiterhin war das Verhältnis der ω-6 und ω-3 PUFA
zwischen den niedrigen und hohen Linien signifikant verringert (P<0.01), es konnte
jedoch kein signifikanter Effekt zwischen den hohen und niedrigen Linien der siebten
Generation gefunden werden. Moderate Heritabilitäten konnten für das C22:6(ω-3) und
für das ω-6:ω-3 PUFA Verhältnis geschätzt werden, wobei die “low” Linie höhere h² als
die “high” Linie erbrachte. Zusätzlich ergab die negative genetische Korrelation
zwischen dem C22:6 (ω-3) und dem ω-6:ω-3 PUFA Verhältnis, dass eine Selektion für
ein höheres ω-6:ω-3 PUFA Verhältnis mit einem niedrigeren C22:6 (ω-3)
Fettsäureverhältnis übereinstimmt. Es wird angenommen, dass die Zucht das DHA und
das ω-6:ω-3 PUFA Verhältnis im Eidotter verbessert.
Die Nukleotidsequenzen der FADS1 und FADS2 cDNA wurden durch Klonierung und
Sequenzierung festgestellt. Dazu wurden heterologe Primer verwendet, die in den
konservierten und genspezifischen Regionen der FADS Familie von Mensch, Maus
und Ratte lagen, um die Sequenzen abschnittsweise durch 5’- und 3’ -RACE zu
identifizieren.
Die Wachtel cDNA Sequenzen von FADS1 und FADS2 bestehen aus 1797 bp und
1350 bp, die für 445 und 404 Aminosäuren kodieren. Die Aminosäuresequenz dieser
Zusammenfassung 86
FADS1 und FADS2 Gene in Wachteln bestehen aus zwei Domainen; der N-Terminus
katalytischen Region und der C-Terminal cytochromen b5-ähnlichen Region. Diese
kodiert Proteine für beide Gene und stellt drei höher konservierte Histidin Motive dar,
HDXGH, HFQHH und QIEHH welche charakteristisch für membrangebundene
Desaturasen und notwendig für die Desaturase Aktivität sind.
Beim Vergleich der mRNA Expression der FADS1 und FADS2 Gene bei Wachteln
wurde festgestellt, dass FADS2 zu einem höheren Level exprimiert war als FADS1. Es
konnten jedoch keine signifikanten Unterschiede der FADS1 und FADS2 Gene
zwischen den hohen und niedrigen Linien (P<0.05) gefunden werden.
Die FADS1 und FADS2 Gene wurden durch vergleichende Sequenzierung von acht
Tieren der hohen und niedrigen Linien auf Polymorphismen durchsucht. Es konnten
fünf SNPs in den kodierenden Regionen beider FADS Gene gefunden werden. Die fünf
SNPs des FADS1 Gens wurden bei 348 bp (A zu G), 391 bp (C zu A), 468 bp (C zu T),
570 bp (C zu T) und 1075 bp (C zu T) gefunden und führten zu einer Purin-Purin oder
Pyrimidin-Pyrimidin Transition oder zu einer Pyrimidin-Purin Transversion. Die beiden
SNPs an den Positionen 348 und 468 führten zu einer Aminosäuresubstitution,
entweder Asparagin-Serin oder Valin-Alanin. Die FADS2 SNPs waren synonym und
wurden bei 477 bp (C zu T), 681 bp (G zu A), 717 bp (C zu T), 953 bp (C zu T) und
1023 bp (G zu A) gefunden, diese führten ausschließlich zu Purin-Purin oder Pyrimidin-
Pyrimidin Transitionen.
Single base extension (SBE) Methode wurden zur Genotypisierung der fünf SNPs des
FADS2 Gens verwendet. Die single strand confirmation polymorphism (SSCP)
Methode wurde zur Genotypisierung der zwei SNPs im FADS1 Gen bei 391 bp und
468 bp gewählt. Die Allelfrequenzen der Polymorphismen der beiden Gene FADS1 und
FADS2 zeigten, dass sich nur der SNP5 im FADS2 Gen im Hardy-Weinberg
Gleichgewicht befindet.
Die cDNA Sequenzen der FADS1 und FADS2 Genen bei Hühnern wurden untersucht,
diese ergaben Längen von 1380 bp und 1561 bp. Die Wachtel SNPs wurden innerhalb
der beiden Gene identifiziert und dazu verwendet, die verschiedenen Varianzen
zwischen den verschiedenen lokalen Hühnerrassen zu vergleichen. Die FADS2 SNPs
waren monomorphisch zwischen diesen Rassen, eine Ausnahme war der SNP4, der in
fünf dieser sechs Rassen segregierte. Die beiden SNPs des FADS1 Gens an den
Positionen 391 (C zu A) und 468 (C zu T) segregierten in den Hühnerrassen Te, Noi,
Ri und LSL.
Die mRNA Expression des FADS2 Gens war stärker als die des FADS1 Gens und die
signifikant höchsten Level wurden für beide Gene in den Hühnerrassen Te und den
europäischen Rassen gefunden (P<0.01).
Zusammenfassung 87
Die Assoziation zwischen einzelnen SNPs und den Fettsäureprofilen im Eidotter wurde
analysiert. Die Ergebnisse der Assoziationsanalysen des FADS1 Gens zeigten, dass
Genotypen an der Position 391 signifikant assoziiert mit den gesättigten C14:0, C16:0
(P<0.05), ungesättigten C16:1 (ω-7) (P<0.05), ebenso wie mit den mehrfach
ungesättigten Fettsäuren C18:2 (ω-6) (P<0.05) waren. Die Genotypen an der Position
468 waren nur mit C16:0 assoziiert (P<0.05). Der gebildete Haplotyp dieser zwei SNPs
zeigte, dass die Haplotypen C/T und A/C signifikant mit C16:1 (ω-7), C18:1(ω-9); C18:2
(ω-6) (P<0.05) assoziiert waren.
Für die FADS2 SNPs waren die Durchschnitte der SNP3 Genotypen signifikant mit
C20:4 (ω-6), C22:6 (ω-3) und dem ω-6:ω-3 PUFA Verhältnis (P<0.05) assoziiert
während die SNP4 Genotypen signifikant mit dem ω-6:ω-3 PUFA Verhältnis assoziiert
war (P<0.05). Die sich anschließende Analyse der Varianzen und der Familien-basierte
Assoziationstest (FBAT) ergaben signifikante Effekte der SNP3 und SNP4 Genotypen
auf die Fettsäureprofile im Eidotter, besonders die ω-6 and ω-3 PUFAs (P<0.05).
Diese Ergebnisse bestätigen stark, dass FADS2 ein funktionelles Kandidatengen für
Merkmale, die in Zusammenhang zu den ω-6 und ω-3 PUFA in Eiern stehen, ist.
References 88
9 References
Abecasis GR, Cherny SS, Cookson WO, Cardon LR (2002): Merlin--rapid analysis of
dense genetic maps using sparse gene flow trees. Nat Genet 30, 97-101
Ackerman L (1995): Reviewing the biochemical properties of fatty acids. Vet Med 90,
1138-1148
Adam O, Wolfram G, Zollner N (1986): Effect of α-linolenic acid in the human diet on
linoleic acid metabolism and prostaglandin biosynthesis. J Lipid Res 27, 421-426
Aguilar PS, Cronan JE Jr, de Mendoza D (1998): A Bacillus subtilis gene induced by
cold shock encodes a membrane phospholipid desaturase. J Bacteriol 180, 2194-2200
Ahn DU, Sunwoo HH, Wolfe FH, Sim JS (1995): Effects of dietary alpha-linolenic acid
and strain of hen on the fatty acid composition, storage stability, and flavor
characteristics of chicken eggs. Poult Sci 74, 1540-1547
Aki T, Shimada Y, Inagaki K, Higashimoto H, Kawammoto S, Shigeta S, Ono K, Suzuki
O (1999): Molecular cloning and functional characterization of rat delta-6 fatty acids
desaturase. Biochem Biophys Res Commun 255, 575-579
Altabe SG, Aguilar P, Caballero GM, de Mendoza D (2003): The Bacillus subtilis acyl
lipid desaturase is a delta5 desaturase. J Bacteriol 185, 3228-3231
Andersson L, Haley CS, Ellegren H, Knott SA, Johansson M, Andersson K, Andersson-
Eklund L, Edfors-Lilja I, Fredholm M, Hansson I (1994): Genetic mapping of
quantitative trait loci for growth and fatness in pigs. Science 263, 1771-1774
Anolle’s C, Gresshoff PM (1994): Staining nucleic acids with silver: An alternative to
radioisotopic and fluorescent labeling. Promega Notes Magazine 45, 13-20
Balnave D (1970): Essential fatty acids in poultry nutrition. World’s Poult Sci J 26, 442-
460
References 89
Bavelaar FJ, Hovernier R, Beynen AC (2004): High intake of Linoleic or α-Linolenic
acid in relation to plasma lipids, atherosclerosis and tissue fatty acid composition in the
Japanese quail. Intern J Poult Sci 11, 704-714
Bernert JT Jr, Sprecher H (1975): Studies to determine the role rates of chain
elongation and desaturation play in regulating the unsaturated fatty acid composition of
rat liver lipids. Biochim Biophys Acta 398, 354-363
Bloch K, Vance D (1977): Control mechanism in synthesis of saturated fatty acids. Ann
Rev Biochem 46, 263-298
Brenner RR (1989): Factors influencing fatty acid chain elongation and desaturation. In:
The role of fats in nutrition. 2nd edition. Vergrossen AJ, Crawford M (Eds.). Academic
Press, London, 45-79
Brenner RR (2003): Hormonal modulation of delta6 and delta5 desaturases: case of
diabetes. Prostaglandins Leukot Essent Fatty Acids 68, 151-62
Brindley DN (1984): Intracellular translocation of phosphatidate phosphohydrolase and
its possible role in the control of glycerolipid synthesis. Prog Lipid Res 23, 115-133
British Nutrition Foundation (1992): Unsaturated fatty acids. Nutritional and
physiological significance. The report of the British Nutrition Foundation’s task force.
Chapman & Hall, London
Bujo H, Yamamoto T (1996): VLDL receptor in health and disease: interview with a
receptor in avian oocytes and mammalian muscle and fat cells. Atheroscler Thromb 2,
71-75
Burrington KJ (2000): Nutritional and beneficial ingredients. Food Product Design 30
Cadena DL, Kurten RC, Gill GN (1997): The Product of the MLD Gene Is a Member of
the Membrane Fatty Acid Desaturase Family: Overexpression of MLD Inhibits EGF
Receptor Biosynthesis. Biochemistry 36, 6960–6967
Carey MC, Small DM, Bliss CM (1983): Lipid digestion and absorption. Ann Rev
Physiol 45, 651-678
References 90
Caston L and Lesson S (1990): Dietary flax and egg composition. Poult Sci 69, 1617-
1620
Chen PH, Common RH, Nikolaiczuk N, MacRae HF (1965): Some effects of added
dietary fats on the lipid composition of hen’s egg yolk. J Fd Sci 30, 838-845
Cherian G, Sim JS (1992): Omega-3 fatty acid and cholesterol content of newly
hatched chicks from linolenic acid enriched eggs. Lipids 32, 706-710
Cherian G, Sim JS (1993): Net transfer and incorporation of yolk n-3 fatty acids into
developing chick embryo. Poult Sci 72, 98-105
Cherian G, Sim JS (1997): Egg yolk polyunsaturated fatty acids and vitamin E content
alters the tocopherol status of hatched chicks. Poult Sci 76, 1753-1759
Cho HP, Makamura MT, Clake SD (1999a): Cloning, expression, and nutritional
regulation of the mammalian Delta-6 desaturase. J Biol Chem 274, 471-477
Cho HP, Nakamura M, Clarke SD (1999b): Cloning, expression, and fatty acid
regulation of the human delta-5 desaturase. J Biol Chem 274, 37335-37339
Clarke SD, Jump DB (1994): Dietary polyunsaturated fatty acid regulation of gene
transcription. Annu Rev Nutr 14, 83–98
Coppock JBM, Daniels NWR (1962): Influence of diet and husbandry on the nutritional
value of the hen’s eggs. J Sci Fd Agric 13, 459-467
Deutsche Gesellschaft für Ernährung (DGE) (1998): Ergebnisse der
Jahrespressekonferenz der DGE. DGE-spezial 4/98 vom 25.06.1998
Dixon LB, Ernst ND (2001): Choose a diet that is low in saturated fat and cholesterol
and moderate in total fat: subtle changes to a familiar message. J Nutr 131, 510S-526S
Domergue F, Lerchl J, Zahringer U, Heinz E (2002): Cloning and functional
characterization of Phaeodactylum tricornutum front-end desaturases involved in
eicosapentaenoic acid biosynthesis. Eur J Biochem 269, 4105-4113
References 91
Eder K, Roth-Maier DA, Kirchgessner M (1998): Laying performance and fatty acid
composition of egg yolk lipid of hens fed diets with various amounts of ground or whole
flaxseed. Arch Geflügelk 62, 223-228
Emken EA, Adlof RO, Rohwedden WK, Gulley RM (1992): Comparison of linoleic and
linolenic metabolism in men. Influence of dietary linoleic acid. In: Essential Fatty Acids
and Eicosanoids. Sinclair A, Gibson R (Eds.) American oil Chemists' Society,
Champaign, Illinois, 23-25
Enoch HG, Catala A, Strittmatter P (1976): Mechanism of rat liver microsomal stearyl-
CoA desaturase. Studies of the substrate specificity enzyme-substrate interactions,
and the function of lipid. J Biol Chem 251, 5095-5103
Enser M (1975): Desaturation of stearic acid by liver and adipose tissue from obese-
hyperglycaemic mice (ob/ob). Biochem J 148, 551-555
Falconer DS (1984): Einführung in die quantitative Genetik. Verlag Eugen Ulmer,
Stuttgart. ISBN: 3-8001-2532-3
Farrell DJ (1994): The fortification of hen’s eggs with long chain fatty acids and their
effect in humans. In: Egg uses and processing technologies, new developments. Sim
JS, Nakai S (Eds.). Verlag: CAB International, Wallingford, UK, 386-401
Farrell DJ (1995): The problems and practicalities of producing an omega (n)-3 fortified
egg. In: Egg and egg products quality. Cepero Briz R (Ed) Proc VI. Europ Symp.
Quality of eggs and egg products. 25-29 September, Zaragoza, Spain, 351-360
Farrell DJ (1998): Enrichment of hen eggs with n-3 long-chain fatty acids and
evaluation of enriched eggs in humans. Am J Clin Nutr 68, 538-544
Ferrier LK, Caston LJ, Leeson S, Squires J, Weaver BJ, Holub BJ (1995): alpha-
Linolenic acid- and docosahexaenoic acid-enriched eggs from hens fed flaxseed:
influence on blood lipids and platelet phospholipid fatty acids in humans. Am J Clin
Nutr 62, 81-86
Fokkema MR, Smit EN, Martini IA, Woltil HA, Boersma ER, Muskiet FA (2002):
Assessment of essential fatty acid and omega3-fatty acid status by measurement of
References 92
erythrocyte 20:3omega9 (Mead acid), 22:5omega6/20:4omega6 and
22:5omega6/22:6omega3. Prostaglandins Leukot Essent Fatty Acids 67, 345-56
Folch J, Lees M, Stanley GHS (1957): A simple method for isolation and purification of
total lipids from animal tissues. J Biol Chem 226, 351-360
Freeman CP (1984): Digestion, absorption and transport of fats-non ruminants. In: Fats
in animal nutrition. Wiseman J (Ed.). Proceddings of the 37th Nottingham Easter
School. Butterworths, London, UK, Chapter 5
Fulco AJ, Mead JF (1959): Metabolism of essential fatty acids. VIII. Origin of 5,8,11-
eicosatrienoic acid in the fat-deficient rat. J Biol Chem 234, 1411-1416
Funk CD (2001): Prostaglandins and Leukotrienes: Advances in Eicosanoid Biology
Science 294, 1871–1875
Galili G, Galili S, Lewinsohn E, Tadmor Y (2002): Genetic, Molecular, and Genomic
Approaches to Improve the Value of Plant Foods and Feeds. Critical Reviews in Plant
Sciences 21, 167 - 204
Garg ML, Thomson ABR, Clandinin MT (1988): Effect of dietary cholesterol and/or
omega 3 fatty acids on lipid composition and delta 5-desaturase activity of rat liver
microsomes. J Nutr 118, 661-668
Gebauer SK, Psota TL, Harris WS, Kris-Etherton PM (2006): n-3 fatty acid dietary
recommendations and food sources to achieve essentiality and cardiovascular
benefits. Am J Clin Nutr 83, 1526S-1535S
Gerken M, Petersen J (1992): Direct and correlated responses to bidirectional selection
for dustbathing activity in Japanese quail (Coturnix coturnix japonica). Behav Genet 22,
601-612
Gilbert AB (1972): The activity of the ovary in the relation to egg production. In: Egg
formation and production. Freeman BM, Lake PE (Eds.). British Poultry Science Ltd.,
Edinburgh, 6

References 93
Girke T, Schmid H, Zähringer U, Reski R, Heinz E (1998): Identification of a novel delta
6-acyl-group desaturase by targeted gene disruption in Physcomitrella patens. Plant J
15, 39-48
Goodnight SHJr, Harris WS, Connor WE, Illingworth DR (1982): Polyunsaturated fatty
acids, hyperlipidemia, and thrombosis. Arteriosclerosis 2, 87-113
Grundy SM (1997): What is the desirable ratio of saturated, polyunsaturated, and
monounsaturated fatty acids in the diet? Am J Clin Nutr 66, 988S-990S
Guillou H, D'Andrea S, Rioux V, Barnouin R, Dalaine S, Pedrono F, Jan S, Legrand P
(2004): Distinct roles of endoplasmic reticulum cytochrome b5 and fused cytochrome
b5-like domain for rat Delta-6-desaturase activity. J Lipid Res 45, 32-40
Haag M (2003): Essential fatty acids and the brain. Can J Psychiatry 48, 195-203
Hammond EG, Glatz BA (1989): Biotechnology applied to fats and oils. In:
Developments in Food Biotechnology. King R, Cheetham PSJ (Eds.). John Wiley &
Sons, New York, 173-217
Handelman GJ, Nightingale ZD, Lichtenstein AH, Schaefer EJ, Blumberg JB (1999):
Lutein and zeaxanthin concentrations in plasma after dietary supplementation with egg
yolk. Am J Clin Nutr 70, 247-251
Hargis PS (1988): Modifying egg yolk cholesterol in the domestic fowl—a review.
World's Poult Sci J 44, 17-29
Hartfiel W, Tüller R, Marx F (1997): Anreicherung essentieller n-3 Fettsäuren und
deren Stabilisierung durch Vitamin E in Hühnereiern. Vitaminspur 12, 24-30
Haugaard SB, Madsbad S, Hoy CE, Vaag A (2006): Dietary intervention increases n-3
long-chain polyunsaturated fatty acids in skeletal muscle membrane phospholipids of
obese subjects. Implications for insulin sensitivity. Clin Endocrinol (Oxf) 64, 169-178
Hermier D, Salichon MR, Guy G, Peresson R (1999): Differential channelling of liver
lipids in relation to susceptibility to hepatic steatosis in the goose. Poult Sci 78, 1398-
1406
References 94
Hills MJ, Murphy DJ (1991): Biotechnology of oilseeds. Biotechnol Genet Eng Rev 9,
41–46
Hirschhorn JN, Sklar P, Lindblad-Toh K, Lim YM, Ruiz-Gutierrez M, Bolk S, Langhorst
B, Schaffner S, Winchester E, Lander ES (2000): SBE-TAGS: an array-based method
for efficient single-nucleotide polymorphism genotyping. Proc Natl Acad Sci USA 97,
12164-12169
Hites RA, Foran JA, Carpenter DO, Hamilton MC, Knuth BA, Schwager SJ (2004):
Global assessment of organic contaminants in farmed salmon. Science 303, 226-229
Holloway CT, Holloway PW (1975): Stearyl coenzyme A desaturase activity in mouse
liver microsomes of varying lipid composition. Arch Biochem Biophys 167, 496–504
Holman RT, Johnson SB, Gerrard JM, Mauer SM, Kupcho-Sandberg S, Brown DM
(1983): Arachidonic acid deficiency in streptozotocin-induced diabetes. Proc Natl Acad
Sci USA 80, 2375-2379
Holub BJ (2002): Clinical nutrition: 4. Omega-3 fatty acids in cardiovascular care.
Canadian Medical Association J 166, 608-615
Horrobin DF (1981): Loss of delta-6-desaturase activity as a key factor in aging. Med
Hypotheses 7, 1211-1220
Horrobin DF (1992): Nutritional and medical importance of gamma-linolenic acid. Prog
Lipid Res 31, 167–194
Hulbert AJ, Else PL (1999): Membranes as possible pacemakers of metabolism. J
Theor Biol 199, 257-274
Hutchins H (2005): Symposium highlight—Omega-3 fatty acids: Recommendations for
therapeutics and prevention. Medscape General Medicine 7, 18
Igal RA, Mandon EC, de Gomez Dumm IN (1991): Abnormal metabolism of
polyunsaturated fatty acids in adrenal glands of diabetic rats. Mol Cell Endocrinol 77,
217-227

References 95
Inagaki K, Aki T, Shiota T, Kawamoto S, Shigeta S, Suzuki O, Ono K (2003): Evidence
of isozymes for delta6 fatty acid desaturase in rat hepatocytes. Biosci Biotechnol
Biochem 67, 451-454
Jan S, Guillous H, D’Andrea S, Daval S, Bouriel M, Rioux V, Legrand P (2004): Myristic
acid increases ∆6-desaturase activity in cultured rat hepatocytes. Reprod Nutri Dev 44,
131-140
Jennen DG, Vereijken AL, Bovenhuis H, Crooijmans RP, Veenendaal A, van der Poel
JJ, Groenen MA (2004): Detection and localization of quantitative trait loci affecting
fatness in broilers. Poult Sci 83, 295-301
Jones BH, Maher MA, Banz WJ, Zemel MB, Whelan J, Smith PJ, Moustaid N (1996):
Adipose tissue stearoyl-CoA desaturase mRNA is increased by obesity and decreased
by polyunsaturated fatty acids. Am J Physiol 271, E44-E49
Joshi VC, Aranda LP (1979): Hormonal regulation of the terminal enzyme of
microsomal stearoyl coenzyme A desaturase in cultured avian liver explants. Role of
insulin. J Biol Chem 254, 11779-11782
Jump DB, Clarke SD (1999): Regulation of gene expression by dietary fat. Annu Rev
Nutr 19, 63-90
Kajikawa M, Yamato KT, Kohzu Y, Shoji S, Matsui K, Tanaka Y, Sakai Y, Fukuzawa H
(2006): A front-end desaturase from Chlamydomonas reinhardtii produces pinolenic
and coniferonic acids by omega13 desaturation in methylotrophic yeast and tobacco.
Plant Cell Physiol 47, 64-73
Kang JX, Leaf A (1996): Antiarrhythmic Effects of Polyunsaturated Fatty Acids: Recent
Studies. Circulation 94, 1774–1780
Karijord O, Standal N, Syrstad O (1982): Sources of variation in composition of milk fat.
Z Tierz Züchtungsbiol 99, 81-93
Kasturi R, Joshi VC (1982): Hormonal regulation of stearoyl coenzyme A desaturase
activity and lipogenesis during adipose conversion of 3T3-L1 cells. J Biol Chem 257,
12224-12230
References 96
Kayang BB, Fillon V, Inoue-Murayama M, Miwa M, Leroux S, Feve K, Monvoisin JL,
Pitel F, Vignoles M, Mouilhayrat C, Beaumont C, Ito S, Minvielle F, Vignal A (2006):
Integrated maps in quail (Coturnix japonica) confirm the high degree of synteny
conservation with chicken (Gallus gallus) despite 35 million years of divergence. BMC
Genomics 7,101
Kayang BB, Inoue-Murayama M, Nomura A, Kimura K, Takahashi H, Mizutani M, Ito S
(2000): Fifty microsatellite markers for Japanese quail. J Hered 91, 502-505
Kayang BB, Vignal A, Inoue-Murayama M, Miwa M, Monvoisin JL, Ito S, Minvielle F
(2004): A first-generation microsatellite linkage map of the Japanese quail. Anim
Genetics 35, 195
Khoo DE, Fermor B, Miller J, Wood CB, Apostolov K, Barker W, Williamson RC, Habib
NA (1991): Manipulation of body fat composition with sterculic acid can inhibit
mammary carcinomas in vivo. Br J Cancer 63, 97-101
Kinney AJ (1997): Development of genetically engineered oilseeds: from molecular
biology to agronomics. In: Physiology, Biochemistry and Molecular Biology of Plant
Lipids. Williams JP, Khan MU, Wan Lem N (Eds.). Kluwer Academic Press, Dordrecht,
The Netherlands, 298-301
Klassing KC (1998): Comparative avian nutrition. CAB International, British Library,
London, UK, 171-174
Knott SA, Marklund L, Haley CS, Andersson K, Davies W, Ellegren H, Fredholm M,
Hansson I, Hoyheim B, Lundstrom K, Moller M, Andersson L (1998): Multiple marker
mapping of quantitative trait loci in a cross between outbred wild boar and large white
pigs. Genetics 149, 1069-1080
Knutzon DS, Thurmond JM, Huang YS, Chaudhary S, Bobik EG Jr, Chan GM, Kirchner
SJ, Mukerji P (1998): Identification of Delta5-desaturase from Mortierella alpina by
heterologous expression in Bakers' yeast and canola. J Biol Chem 273, 29360-29366
Krauss RM, Deckelbaum RJ, Ernst N, Fisher E, Howard BV, Knopp RH, Kotchen T,
Lichtenstein AH, McGill HC, Pearson TA, Prewitt TE, Stone NJ, VanHorn L, Weinberg
R (1996): Dietary guidelines for healthy American adults - A statement for health
References 97
professionals from the Nutrition Committee, American Heart Association. Circulation
94, 1795-1800
Kris-Etherton P, Harris WS, Appel LJ (2002): Fish consumption, fish oil, omega-3 fatty
acids and cardiovascular disease. Circulation 106, 2747-2757
Kris-Etherton PM, Pearson TA, Wan Y, Hargrove RL, Moriarty K, Fishell V, Etherton
TD (1999): High-monounsaturated fatty acid diets lower both plasma cholesterol and
triacylglycerol concentrations. Am J Clin Nutr 70, 1009-1015
Kris-Etherton PM, Taylor DS, Yu-Poth S, Huth P, Moriarty K, Fishell V, Hargrove RL,
Zhao G, Etherton TD (2000): Polyunsaturated fatty acids in the food chain in the United
States. Am J Clin Nutr 71, 179S-188S
Lands WEB, Morris A, Libelt B (1990): Quantitative effects of dietary polyunsaturated
fats on the composition of fatty acids in rat tissues. Lipids 25, 505-516
Lee WM, Ishikawa M, Ahlquist P (2001): Mutation of host delta9 fatty acid desaturase
inhibits brome mosaic virus RNA replication between template recognition and RNA
synthesis. J Virol 75, 2097-2106
Leikin AI, Brenner RR (1992): In vivo phospholipid modification induces changes in
microsomal ∆5-desaturase activity. Biochim Biophys Acta 1165, 189-193
Leonard AE, Kelder B, Bobik EG, Chuang LT, Parker-Barnes JM, Thurmond JM,
Kroeger PE, Kopchick JJ, Huang YS, Mukerji P (2000): cDNA cloning and
characterization of human Delta5-desaturase involved in the biosynthesis of
arachidonic acid. Biochem J 347, 719-724
Leskanich CO, Noble RC (1997): Manipulation of the n-3 polyunsaturated fatty acid
composition of avian eggs and meat. World’s Poultry Sci J 53, 155-183
Lewis RA, Lee TH, Austen KF (1986): Effect of omega-3 fatty acids on the generation
of products of 5-lipoxygenase pathway. In: Health effects of polyunsaturated fatty acids
in seafoods. Simopoulos AP, Kifer RR, Martin RE (Eds.). Academic Press, Orlando FL,
227-238
References 98
Li J, Ding SF, Habib NA, Fermor BF, Wood CB, Gilmour RS (1994): Partial
characterization of a cDNA for human stearoyl-CoA desaturase and changes in its
mRNA expression in some normal and malignant tissues. Int J Cancer 57, 348-352
Lichtenstein AH (2003): Dietary fat and cardiovascular disease risk: Quantity or
quality? J Women’s Health 12, 109 -114
Los DA, Murata N (1998): Structure and expression of fatty acid desaturases. Biochim
Biophys Acta 1394, 3-15
Macartney AI, Tiku PE, Cossins AR (1996): An isothermal induction of delta 9-
desaturase in cultured carp hepatocytes. Biochim Biophys Acta 1302, 207-216
Madsen L, Froyland L, Grav HJ, Berge RK (1997): Up-regulated delta 9-desaturase
gene expression by hypolipidemic peroxisome-proliferating fatty acids results in
increased oleic acid content in liver and VLDL: accumulation of a delta 9-desaturated
metabolite of tetradecylthioacetic acid. J Lipid Res 38, 554-563
Mandon EC, de Gomez Dumm IN, de Alaniz MJ, Marra CA, Brenner RR (1987): ACTH
depresses delta 6 and delta 5 desaturation activity in rat adrenal gland and liver. J Lipid
Res 28, 1377-1383
Marquardt A, Stoehr V, White K, Weber BHF (2000): cDNA cloning, genomic structure,
and chromosomal localization of three members of the human fatty acid desaturase
family. Genomics 66, 175-183
Matsuzaka T, Shimano H, Yahagi N, Amemiya-Kudo M, Yoshikawa T, Hasty AH,
Tamura Y, Osuga J, Okazaki H, Iizuka Y, Takahashi A, Sone H, Gotoda T, Ishibashi S,
Yamada N (2002): Dual regulation of mouse Delta(5)- and Delta(6)-desaturase gene
expression by SREBP-1 and PPARalpha. J Lipid Res 43, 107-114
Mayes PA (1996): Lipid transport and storage. In: Harper’s Biochemistry, 24th edition
Murray RK, Granner DK, Mayes PA, Rodwell VW (Eds.). Prentice Hall International,
Inc., USA, 254
McGarry JD, Foster DW (1980): Regulation of hepatic fatty acid oxidation and ketone
body production. Ann Rev Biochem 49, 395-420

References 99
Mead JF (1968): Metabolism of polyunsaturated fatty acids. Prog Chem Fats Other
Lipids 9, 159-192
Menicken L, Ponsuksili S, Tholen E, Khang NTK, Steier K, Petersen J, Schellander K,
Wimmers K (2005): Divergent selection for ω3:ω6 polyunsaturated fatty acid ratio in
quail eggs. Arch Tierz Dummerstorf 48, 527-534
Mennicken L, Spaeth M (1997): Variabilität des Fettsäuremusters in Wachteleier unter
besonderer Berücksichtigung der ω-3 und ω-6 Fettsäuren. Vortragstagung der DGFZ
und GfT am 10/11. September 1997 in Bonn
Mennicken L, Spaeth M, Petersen J (2000): Breeding for modified fatty acid profile in
eggs- results of a divergent selection experiment in quails. Proc XXI World’s Poultry
Congress, P12.08
Michaelson LV, Lazarus CM, Griffiths G, Napier JA, Stobart AK (1998b): Isolation of a
Delta5-fatty acid desaturase gene from Mortierella alpina. J Biol Chem 273, 19055-
19059
Michaelson LV, Longman AJ, Sayanova O, Stobart AK, Napier JA (2002): Isolation and
characterization of a cDNA encoding a Delta8 sphingolipid desaturase from Aquilegia
vulgaris. Biochem Soc Trans 30, 1073-1075
Michaelson LV, Napier JA, Lewis M, Griffiths G, Lazarus CM, Stobart AK (1998a):
Functional identification of a fatty acid delta5 desaturase gene from Caenorhabditis
elegans. FEBS Lett 439, 215-218
Minvielle F, Kayang BB, Inoue-Murayama M, Miwa M, Vignal A, Gourichon D, Neau A,
Monvoisin JL, Ito S (2006): Search for QTL affecting the shape of the egg laying curve
of the Japanese quail. BMC Genet 5;7-26
Minvielle F, Oguz Y (2002): Effects of genetics and breeding on egg quality of
Japanese quail. World’s Poult Sci J 58, 291–296
Miyazaki M, Gomez FE, Ntambi JM (2002): Lack of stearoyl-CoA desaturase-1 function
induces a palmitoyl-CoA Delta6 desaturase and represses the stearoyl-CoA
desaturase-3 gene in the preputial glands of the mouse. J Lipid Res 43, 2146-2154

References 100
Miyazaki M, Kim HJ, Man WC, Ntambi JM (2001a): Oleoyl-CoA is the major de novo
product of stearoyl-CoA desaturase 1 gene isoform and substrate for the biosynthesis
of the Harderian gland 1-alkyl-2,3-diacylglycerol. J Biol Chem 276, 39455-39461
Miyazaki M, Kim YC, Ntambi JM (2001b): A lipogenic diet in mice with a disruption of
the stearoyl-CoA desaturase 1 gene reveals a stringent requirement of endogenous
monounsaturated fatty acids for triglyceride synthesis. J Lipid Res 42, 1018-1024
Miyazaki M, Man WC, Ntambi JM (2001c): Targeted disruption of stearoyl-CoA
desaturase1 gene in mice causes atrophy of sebaceous and meibomian glands and
depletion of wax esters in the eyelid. J Nutr 131, 2260-2268
Mountney GJ (1989): Egg quality identification. In: Poultry products technology. 2nd ed.
Food Products Press (FPP), Inc. New Yolk – London, 293
Murata N, Wada H (1995): Acyl-lipid desaturases and their importance in the tolerance
and acclimation to cold of cyanobacteria. Biochem J 308, 1-8
Nakamura MT, Nara TY (2002): Gene regulation of mammalian desaturases. Biochem
Soc Trans 30, 1076-1079
Nakamura MT, Nara TY (2004): Structure, function, and dietary regulation of ∆6, ∆5,
and ∆9 desaturases. Annu Rev Nutr 24, 345-376
Nakamura MT, Phinney SD, Tang AB, Oberbauer AM, German JB, Murray JD (1996):
Increased hepatic delta 6-desaturase activity with growth hormone expression in the
MG101 transgenic mouse. Lipids 31, 139–143
Napier JA, Sayanova O, Stobart AK, Shewry PR (1997): A new class of cytochrome b5
fusion proteins. Biochem J 328, 717-718
National Research Council (1989): Recommended dietary allowances. 10th edition.
Washington DC, National Academy Press
Nelson GJ (2000): Effects of dietary fatty acids on lipid metabolism. In: Fatty acids in
foods and their health implications, 2nd edition. Chow CK (Ed.). Marcel Dekker Inc.,
New Yolk, USA, 488
References 101
Newman RN (2000): Modulation of avian metabolism by dietary fatty acids. Doctor
thesis, Department of Animal Science, University of Sydney, Australian.
http://setis.library.usyd.edu.au/adt/public_html/adt-NU/public/adt-NU20021119.162044/
Noble RC (1987): Egg lipids. In: Egg quality-Current problems and recent advances.
Wells RG, Belyavin CG (Eds.). Butterworths & Company, London, UK, 159-177
Noble RC, Cocchi M, Turchetto E (1990): Egg fat – a case for concern? World’s Poult
Sci J 46, 109-118
Noble RC, Lonsdale F, Connor K, Brown D (1986): Changes in the lipid metabolism of
the chick embryo with parental age. Poult Sci. 65:409-416
Ntambi JM (1995): The regulation of stearoyl-CoA desaturase (SCD). Prog Lipid Res
34, 139-150
Ntambi JM (1999): Regulation of stearoyl-CoA desaturase by polyunsaturated fatty
acids and cholesterol. J Lipid Res 40, 1549-1558
Ntambi JM, Miyazaki M (2003): Recent insights into stearoyl-CoA desaturase-1. Curr
Opin Lipidol 14, 255-261
Ntambi JM, Sessler AM, Takova T (1996): A model cell line to study regulation of
stearoyl-CoA desaturase gene 1 expression by insulin and polyunsaturated fatty acids.
Biochem Biophys Res Commun 220, 990–995
Ockner RK, Pittman JP, Yager JL (1972): Differences in the intestinal absorption of
saturated and unsaturated long chain fatty acids. Gastroenterology 62, 981-992
Ollis TE, Meyer BJ, Howe PRC (1999): Australian Food Sources and Intakes of
Omega-6 and Omega-3 Polyunsaturated Fatty Acids. Annals of Nutrition & Metabolism
43, 346-355
Okamoto T, Tsutsumi T, Tokairin S, Ebara H, Maruyama T, Niiya I, Sugano M (1999):
Formation of trans-fatty acids during vegetable oil refining and trans-fatty acid content
in refined edible oils. J Jpn Oil Chem Soc 48, 877-833
References 102
Okita M, Yoshida S, Yamamoto J, Suzuki K, Kaneyuki T, Kubota M, Sasagawa T
(1995): n-3 and n-6 fatty acid intake and serum phospholipid fatty acid composition in
middle-aged women living in rural and urban areas in Okayama Prefecture. J Nutr Sci
Vitaminol (Tokyo) 41, 313-323
Pan DA, Hulbert AJ, Storlien LH (1994): Dietary fats, membrane phospholipids and
obesity. J Nutr 124, 1555-1565
Pang SWY, Ritland C, Carlson JE, Cheng KM (1999): Japanese quail microsatellite loci
amplified with chicken-specific primers. Anim Genet 30, 195-199
Parker-Barnes JM, Das T, Bobik E, Leonard AE, Thurmond JM, Chaung LT, Huang
YS, Mukerji P (2000): Identification and characterization of an enzyme involved in the
elongation of n-6 and n-3 polyunsaturated fatty acids. Proc Natl Acad Sci USA 97,
8284-8289
Pauly D, Christensen V, Guenette S, Pitcher TJ, Sumaila UR, WaltersCJ, Watson R,
Zeller D (2002): Towards sustainability in world fisheries. Nature 418, 689-695
Pawlosky RJ, Sprecher HW, Salem NJr (1992): High sensitivity negative ion GC-MS
method for detection of desaturated and chain-elongated products of deuterated
linoleic and linolenic acids. J Lipid Res 33, 1711-1717
Poisson JP, Cunnane SC (1991): Long-chain fatty acid metabolism in fasting and
diabetes: relation between altered desaturase activity and fatty acid composition. J Nutr
Biochem 2, 60-70
Powrie WD, Nakai S (1986): Chemistry of eggs and egg products. In: Egg Science and
Technology, 3rd ed. Westport, Conn, AVI Publishing Co., 97-139
Prasad MR, Joshi VC (1979): Purification and properties of hen liver microsomal
terminal enzyme involved in stearoyl coenzyme A desaturation and its quantitation in
neonatal chicks. J Biol Chem 254, 6362-6368
Raes K, Huyghebaert G, De Smet S, Nollet L, Arnouts S, Demeyer D (2002): The
deposition of conjugated linoleic acids in eggs of laying hens fed diets varying in fat
level and fatty acid profile. J Nutr 132, 182-189
References 103
Retterstol K, Woldseth B, Christophersen BO (1995): Studies on the metabolism of [1-
14C]5.8.11-eicosatrienoic (Mead) acid in rat hepatocytes. Biochim Biophys Acta 1259,
82-88
Rhee KS (1992): Fatty acuds in meats and meat products. In: Fatty acids in foods and
their health implications. Chow CK (Ed). Marcel Dekker Inc., New Yolk, 65-93
Rodriguez-Cruz M, Tovar AR, Palacios-Gonzalez B, del Prado M, Torres N (2006):
Synthesis of long-chain polyunsaturated fatty acids in lactating mammary gland: role of
{Delta}5 and {Delta}6 desaturases, SREBP-1, PPAR{alpha}, and PGC-1. J Lipid Res
47, 553-560
Roussot O, Feve K, Plisson-Petit F, Pitel F, Faure JM, Beaumont C, Vignal A (2003):
AFLP linkage map of the Japanese quail Coturnix japonica. Genet Sel Evol 35, 559-
572
Sadjadi M, Becker WA (1980): Heritability and genetic correlations of body weight and
surgically removed abdominal fat in Coturnix quail. Poult Sci 59, 1977-1984
Saether T, Tran TN, Rootwelt H, Christophersen BO, Haugen TB (2003): Expression
and regulation of delta5-desaturase, delta6-desaturase, stearoyl-coenzyme A (CoA)
desaturase 1, and stearoyl-CoA desaturase 2 in rat testis. Biol Reprod 69, 117-124
Sanders TAB (2000): Polyunsaturated fatty acids in the food chain in Europe. Am J
Clin Nutr 71, 176S-178S
Sayanova O, Smith MA, Lapinskas P, Stobart AK, Dobson G, Christie WW, Shewry
PR, Napier JA (1997): Expression of a borage desaturase cDNA containing an N-
terminal cytochrome b5 domain results in the accumulation of high levels of delta6-
desaturated fatty acids in transgenic tobacco. Proc Natl Acad Sci USA 94, 4211-4216
Scheideler SE, Jaroni D, Froning G (1998): Strain and age effects on egg composition
from hens fed diets rich in n-3 fatty acids. Poult Sci 77, 192-196
Schmid PC, Spimrova I, Schmid HH (1995): Incorporation of exogenous fatty acids into
molecular species of rat hepatocyte phosphatidylcholine. Arch Biochem Biophys 322,
306-312
References 104
Schmidt A, Wolde M, Thiele C, Fest W, Kratzin H, Podtelejnikov AV, Witke W, Huttner
WB, Soling HD (1999): Endophilin I mediates synaptic vesicle formation by transfer of
arachidonate to lysophosphatidic acid. Nature 401, 133–141
Schneider WJ (1996): Vitellogenin receptors: oocyte-specific members of the low-
density lipoprotein receptor supergene family. Int Rev Cytol 166, 103-137
Schulte E, Weber K (1989): Schnelle Herstellung der Fettsaeuremethylester aus Fett
mit Trimethylsulfoniumhydroxid oder Natriummethylat. Fat Sci Technol 91, 181-183
Scientific review committee (1990): Nutrition recommendations. Ottawa: Minister of
National Health and Welfare Canada. H49-42/1990E
Scott BL, Bazan NG (1989): Membrane docosahexaenoate is supplied to the
developing brain and retina by the liver. Proc Natl Acad Sci USA 86, 2903-2907
Shanklin J, Cahoon EB (1998): Desaturation and related modifications of fatty acids.
Annu Rev Plant Physiol Plant Mol Biol 49, 611 641
Shanklin J, Whittle E, Fox BG (1994): Eight histidine residues are catalytically essential
in a membrane-associated iron enzyme, stearoyl-CoA desaturase, and are conserved
in alkane hydroxylase and xylene monooxygenase. Biochemistry 33, 12787-12794
Shappell SB, Keeney DS, Zhang J, Page R, Olson SJ, Brash AR (2001): 15-
Lipoxygenase-2 expression in benign and neoplastic sebaceous glands and other
cutaneous adnexa. J Invest Dermatol 117, 36-43
Shenstone IS (1968): The gross composition, chemistry and physico-chemical basis of
organization of yolk and white. In: Egg quality. A study of the hen’s egg. Carter TC
(Ed). Oliver and Boy Robert Cunningham & Sons Ltd. Alva, 29
Simopoulos AP (1988): n-3 fatty acids in growth and development and in health and
disease. Part 2: the role of n-3 fatty acids in health and disease: dietary implications.
Nutr Today 23, 12-18
Simopoulos AP (1991): Omega-3 fatty acids in health and disease and in growth and
development. Am J Clin Nutr 54, 438-63

References 105
Simopoulos AP (2000): Human requirement for N-3 polyunsaturated fatty acids. Poult
Sci 79, 961-970
Simopoulos AP, Leaf A, Salem NJr (1999): Workshop on the Essentiality of and
Recommended Dietary Intakes for Omega-6 and Omega-3 Fatty Acids. J Am Coll Nutr
18, 487-489
Simpson DA, Feeney S, Boyle C, Stitt AW (2000): Retinal VEGF mRNA measured by
SYBR green I fluorescence: A versatile approach to quantitative PCR. Mol Vis 6, 178-
183
Slack CR, Browse JA (1984): Lipid Synthesis During Seed Development. In: Seed
Physiology. Murray D (Ed.). Academic Press, Sydney, 209-244
Smith KM, Sahyoun NR (2005): Fish consumption: Recommendations versus
advisories, can they be reconciled? Nutrition Reviews, 39-46
Somerville CR (1993): Future prospects for genetic modification of the composition of
edible oils from higher plants. Am J Clin Nutr 58, 270S–275S
Somerville CR, Browse J (1988): Genetic manipulation of fatty acid composition of
plant lipids. Adv Phytochem 22, 19-45
Speedy AW (2003): Global production and consumption of animal source foods. J
Nutr133, 4048S-4053S
Sprecher H (1981): Biochemistry of essential fatty acids. Prog Lipid Res20, 13-22
Sprecher H (1991): Enzyme activities affecting tissue lipid fatty acid composition. World
Rev Nutr Diet 66, 166-176
Sprecher H (1996): New advances in fatty-acid biosynthesis. Nutrition12, 5S -7S
Sprecher H, Lee CJ (1975): The absence of an 8-desaturases in rat liver: a
reevaluation of optional pathways for the metabolism of linoleic and linolenic acids.
Biochim Biophys Acta 388, 113-125
References 106
Sprecher H, Luthria DL, Mohammed BS, Baykousheva SP (1995): Reevaluation of the
pathways for the biosynthesis of polyunsaturated fatty acids. J Lipid Res 36, 2471-2477
Strittmatter P, Thiede MA, Hackett CS, Ozols J (1988): Bacterial synthesis of active rat
stearyl-CoA desaturase lacking the 26-residue amino-terminal amino acid sequence. J
Biol Chem 263, 2532-2535
Sugano M, Hirahara F (2000): Polyunsaturated fatty acids in the food chain in Japan.
Am J Clin Nutr 71, 189S-196S
Suk YO, Washburn KW (1998): The relationship between parental yolk cholesterol and
yolk fat concentration to abdominal fat content and feed conversion ratio of their
respective offspring. Poult Sci 77, 377-378
Summers JD, Slinger SJ, Anderson WJ (1966): The effect of feeding various fats and
fat by products on the fatty acid and cholesterol composition of egg. Br Poult Sci 7,
127-134
Surai PF, Kutz E, Wishart GJ, Noble RC, Speake BK (1997): The relationship between
the dietary provision of alpha-tocopherol and the concentration of this vitamin in the
semen of chicken: effects on lipid composition and susceptibility to peroxidation. J
Reprod Fertil 110, 47-51
Surai PF, Speake BK, Noble RC, Mezes M (1999): Species-specific differences in the
fatty acid profiles of the lipids of the yolk and of the liver of the chick. J Sci Fd Agric 79,
733-736
Tarasewicz Z, Szczerbińska D, Ligocki M, Dańczak A, Majewska D, Kurzawa J (2004):
Effect of the origin of quails on their utility type and selected egg quality traits.
Electronic Journal of Polish Agricultural Universities, Animal Husbandry, Volume 7,
Issue 2. http://www.ejpau.media.pl/series/volume7/issue2/animal/art-07.html
Thiede MA, Ozols J, Strittmatter P (1986): Construction and sequence of cDNA for rat
liver stearyl coenzyme A desaturase. J Biol Chem 261, 13230-13235
Thiede MA, Strittmatter P (1985): The induction and characterization of rat liver stearyl-
CoA desaturase mRNA. J Biol Chem 260, 14459-14463
References 107
Tiku PE, Gracey AY, Macartney AI, Beynon RJ, Cossins AR (1996): Cold-Induced
Expression of ∆9-Desaturase in Carp by Transcriptional and Posttranslational
Mechanisms. Science 271, 815-818
Trautwein E (2001): n-3 fatty acids-physiological and technical aspects for their use in
food. Eur J Lipid Sci Technol 103, 45-55
Van Elswyk ME (1997): Comparison of n-3 fatty acid sources in laying hen rations for
improvement of whole egg nutritional quality: a review. Br J Nutr 78, S61-S69
Van Elswyk ME, Sams AR, Hargis PS (1992): Composition, Functionality, and Sensory
Evaluation of eggs from hens fed dietary menhaden. J Food Sci 57, 342-4,349
Volpe JJ, Vagelos PR (1973): Saturated fatty acid biosynthesis and its regulation. Ann
Rev Biochem 42, 21-60
Voskuil DW, Feskens EJ, Katan MB, Kromhout D (1996): Intake and sources of alpha-
linolenic acid in Dutch elderly men. Eur J Clin Nutr 50, 784-787
Voss A, Reinhart M, Sankarappa S, Sprecher H (1991): The metabolism of
7,10,13,16,19-docosapentaenoic acid to 4,7,10,13,16,19-docosahexaenoic acid in rat
liver is independent of a 4-desaturase. J Biol Chem 266, 19995-20000
Wahl HG, Kausch C, Machicao F, Rett K, Stumvoll M, Haring HU (2002): Troglitazone
downregulates delta-6 desaturase gene expression in human skeletal muscle cell
cultures. Diabetes 51, 1060-1065
Wakil SJ, Stoops LK, Joshi VC (1983): Fatty acid synthesis and its regulation. Ann Rev
Biochem 52, 537-579
Walling GA, Archibald AL, Cattermole JA, Downing AC, Finlayson HA, Nicholson D,
Visscher PM, Walker CA, Haley CS (1998): Mapping of quantitative trait loci on porcine
chromosome 4. Anim Genet 29, 415-424
Washburn KW (1979): Genetic variation in the chemical composition of the egg. Poult
Sci 58, 529-535
References 108
Washburn KW (1990): Genetic variation in egg composition. In: Poultry breeding and
genetics. Crawford RD (Ed). Elsevier, Amsterdam, 781-804
Watkins BA (1991): Importance of essential fatty acids and their derivatives in poultry. J
Nutr 121, 1475-1485
Watkins BA, Kratzer FH (1987): Probable formation pathways of polyenoic acids in
avians. Poult Sci 66, 306-313
Watts JL, Browse J (1999): Isolation and characterization of a Delta 5-fatty acid
desaturase from Caenorhabditis elegans. Arch Biochem Biophys 362, 175-182
Weber PC, Fischer S, von Schacky C, Lorenz R, Strasser T (1986): Dietary omega-3
polyunsaturated fatty acids and eicosanoid formation in man. In: Health effects of
polyunsaturated fatty acids in seafoods. Simopoulos AP, Kifer RR, Martin RE (Eds.).
Academic Press, Orlando FL, 49-60
WHO/FAO Expert Consultation (2003): Diet, nutrition and the prevention of chronic
diseases. World Health Organ Tech Rep Ser 916, 89–90.
Wilson WO, Abbott UK, Abplanalp H (1961): Evaluation of coturnix (Japanese quail) as
a pilot animal for poultry. Poult Sci 40, 651-657
Zaky H, Eichinger H, Pirchner F (1996): Genetic effects on fatty-acid composition of
egg yolk. J Anim Breeding Genet 113, 201-208
Zhang Q, Li M, Ma H, Sun Y, Xing L (2004): Identification and characterization of a
novel delta6-fatty acid desaturase gene from Rhizopus arrhizus. FEBS Lett 556, 81-85
Zhou L, Nilsson A (2001): Sources of eicosanoid precursor fatty acid pools in tissues. J
Lipid Res 42, 1521–1542

10 Acknowledgements
I would like to express my sincere thanks to my Ph.D supervisor, Prof. Karl
Schellander, director of the Institute of Animal Science, University of Bonn, Germany
for his enthusiasm, inspiration and great efforts. He has given me many opportunities
to develop and act on my scientific ambitions. I would like to thank him for all help.
I owe an immense debt of gratitude to my referee, Prof. R. Galensa for his invaluable
guidance and support
My sincere thanks to PD. Dr. Klaus Wimmers, Research Institute for the Biology of
Farm Animals, Dummerstorf, for his answering and explaining things clearly and simply
as well as good teaching and lots of good ideas for the thesis.
My special thanks to Dr. Danyel Jennen for discussing problems such as reading,
correcting and commenting the first drafts and also supporting me intellectually and
morally for the whole time. Thank you all.
I wish to thank PD. Dr. Siriluck Ponsuksili, Research Institute for the Biology of Farm
Animals, Dummerstorf, for her help at the beginning of this thesis.
My sincere thank to Dr. Ernst Tholen for helping to do the statistic analysis on the
genetic model of quail population. I would like to thank Mr. Heiko Buschbells and Mr.
Detert for analysing and teaching the SAS statistic course.
I wish to express my thanks to Dr. Davit Tesfaye for his help at the beginning of my
study.
In addition, I wish to thank Mrs. Helga Brodeßer, Ms. Nadja Wahl for their help to
analyse the fatty acid in the laboratory and Mr. Heinz Biösen for keeping the quail
population as well as collecting the samples.
I am grateful to the secretaries Ms. Bianca Peters, Ms. Ulrike Schroeter and Ms. Nicole
Scholtz for their help all documents to run smoothly and for assisting me in many
different ways. My thanks also go to the technician Peter Müller for computer
assistance.

I wish to express my thanks to Ganesh Kumar and Siriwadee Chomdej, Maria Murrani
and Eddie Murrani for their first guides how to work in the lab.
Thanks to Chiriwat Phatsara, Patama Thumdee, Ali Kandaga, Ashraft El-Sayed,
Parinya Wilaiphan, Saowaluck Yammuen-art and Nasser Ghanem for their help to
collect the liver samples.
I would like to thank Anke Brings, Lisa Jonas and Nguyen Trong Ngu for reading and
providing me with valuable comments on earlier versions of this thesis and Mr. Korakob
Nganvongpanit for having shared the same office with me and for being a good
colleague during the last two years of my PhD period.
I would also like to thank the technician members of the Institute of Animal Science,
especially to Stephanie, Nadin, Jessica, Simone, Nina and Najim for giving their help in
the whole time of my study.
I would also like to thank the PhD. teams of the Institute of Animal Science, University
of Bonn, Germany for giving the feeling of being at home at work and for being your
colleagues.
My sincere thanks to my Vietnamese friends Ms. Hai, Mr. Phap, Mr. Bao, Mr. Dung for
being excellent friends during the time I studied in Bonn. Especially I am obliged to Ms.
Vu Thanh Tam and her family for their endless helps to collect the samples during my
staying in Hanoi, Vietnam.
I also would like to thank Dr. Do Viet Minh, Dr. Vo Hong Son, Mr. Dong, National
Institute of Animal Husbandry, Hanoi, Vietnam and Mr. Dac, National Center for Nature
Science and Technology, Biotechnology Institute, Hanoi, Vietnam for their help to
collect the chicken samples.
During this work I have collaborated with many colleagues for whom I have great
regards, and I wish to extend my warmest thanks to Dr. Tran Kim Tinh, Dr. Nguyen
Van Muoi, Ms. Thao, Ms. Lan and Ms Truc who have helped me with my work in the
laboratory of Cantho University.
My special thanks to my teachers from Cantho University Dr. Do Van Xe, Dr. Le Viet
Dung, Dr. Vo Van Son, Mr. Nguyen Minh Thong, Mr. Nguyen Van Hon, Mrs. La Thi Thu

Minh, Mrs. Le Thi Men and Mrs. Huynh Thi Thu Loan for their supports and
encouragement.
I am grateful to Dr. Preston, University of Tropical Agriculture Foundation and Mr. Hao
in University of Agriculture and Forestry, Ho Chi Minh City for their supports
I would like to thank MOSTE (Ministry of Science, Technology and Environment),
Vietnam and BMBF (Federal Ministry of Education and Research), Germany for the
financial support. Many thanks to PD. Dr. Lothar Mennicken, Deputy Director of BMBF
for his wonderful job in the project and also my thanks to his family for the warmth and
kindness they always offer.
I am very gratefull for my husband, Le Hoang Tam, for allowing me to work on the
thesis as well as all supports and love that he has given me throughout the years.
Lastly but most importantly, I fall a deep sense of gratitude for my parents. They bore
me, raised me, supported me, taught me, and loved me. The encouragement and
motivation that was given to me to carry out my research work by my brothers and
sisters is also remembered.
.
Curriculum Vitae
Name Nguyen Thi Kim Khang
Date of birth August 20, 1973
Place of birth Cantho City
Nationality Vietnamese
Marital status Married
Education
1992-1997 BSc degree - Department of Animal Husbanry, College of
Agriculture, Cantho University, Vietnam
2001-2003 MSc degree - Department of Animal Science and Management,
Swedish University of Agricultural Science
2003-2006 PhD student at the Institute of Animal Science, Animal Breeding
and Husbandry Group, University of Bonn, Germany
Publications
Khang NTK, Ogle B (2004): Effects of dietary protein level and a duckweed supplement
on the growth rate of local breed chicks. Livestock Research for Rural Development,
Volume 16, Number 8
Khang NTK, Ogle B (2004): Effect of replacing roasted soya beans by broken rice and
duckweed on performance of growing Tau Vang chickens confined on-station and
scavenging on-farm. Livestock Research for Rural Development, Volume 16, Number 8
Khang NTK, Ogle B (2004): Effects of duckweed on the performance of local (Tau
Vang) laying hens. Livestock Research for Rural Development, Volume 16, Number 8
Khang NTK, Wimmers K, Jennen D, Ponsuksili S, Mennicken L, Schellander K (2004):
Analysis of FADS1 and FADS2 as candidate genes for egg yolk fatty acid profiles and
ω3 fatty acid contents in Japanese quails. Poster. International Society for Animal
Genetics Conference on 11-16th September 2004, Tokyo, Japan
Khang NTK, Mennicken L, Jennen D, Ponsuksili S, Wimmers K, Schellander K (2004):
Analysis of FADS2 as candidate gene for egg yolk fatty acid profiles and ω3 fatty acid
contents in Japanese quails. Vortragstagung der DGfZ und der GfT am 29. /30.
September 2004, in Rostock, Germany
Menicken L, Ponsuksili S, Tholen E, Khang NTK, Steier K, Petersen J, Schellander K,
Wimmers K (2005): Divergent selection for ω3:ω6 polyunsaturated fatty acid ratio in
quail eggs. Arch Tierz Dummerstorf 48, 527-534
Khang NTK, Jennen D, Mennicken L, Tholen E, Tesfaye D, Hoelker M, Ponsuksili S,
Schellander K, Wimmers K (2006): Genetic variety of the different Vietnamese local
chicken breeds and effect on the FADS1 and FADS2 genes. Poster. Deutscher
Tropentag, 11-13 October 2006, in Bonn. Prosperity and Poverty in a Globalized World
– Challenges for Agricultural Research.
Khang NTK, Jennen D, Mennicken L, Tholen E, Tesfaye D, Ponsuksili S, Murani E,
Hoelker M, Schellander K, Wimmers K (2006): Association of the FADS2 gene with ω-6
and ω-3 PUFA concentration in the egg yolk of Japanese quail. Anim Biotechnol
(Accepted on October 18, 2006)
Wimmers K, Khang NTK, Jennen D, Mennicken L, Tesfaye D, Ponsuksili S,
Schellander K (2006): Effect of genetic variety of different Vietnamese local chicken
breeds on FADS1 and FADS2 genes. (Submitted to Poult Sci)


![Omega 3 Fatty Acids, Gestation and Pregnancy [Autosaved]](https://static.fdocuments.in/doc/165x107/55cf923b550346f57b94c951/omega-3-fatty-acids-gestation-and-pregnancy-autosaved.jpg)


