Biomarkers for Personalizing Omega-3 Fatty Acid...
13
Research Article Biomarkers for Personalizing Omega-3 Fatty Acid Dosing Yan Jiang 1 , Zora Djuric 2 , Ananda Sen 2 , Jianwei Ren 2 , Dmitry Kuklev 3 , Ian Waters 2 , Lili Zhao 4 , Charis L. Uhlson 5 , Yu H. Hong 3 , Robert C. Murphy 5 , Daniel P. Normolle 6 , William L. Smith 3 , and Dean E. Brenner 1,7,8 Abstract Prostaglandin E 2 (PGE 2 ) has been linked to a higher risk of colorectal cancer. PGE 2 in colon tissue can be reduced by increasing dietary eicosapentaenoic acid (EPA). The dose-dependent relationships between dietary EPA, serum EPA:arachidonate (AA) ratio, urinary PGE 2 metabolites, and colonic eicosanoids were evaluated to develop biomarkers for prediction of colonic PGE 2 . Male rats were fed diets containing EPA:w6 fatty acid ratios of 0, 0.1, 0.2, 0.4, or 0.6 for 5 weeks. Increasing the dietary EPA:w6 fatty acid ratio increased EPA:AA ratios in serum and in the proximal, transverse, and distal colon (P < 0.001). The urinary PGE 2 metabolite was reduced (P ¼ 0.006). EPA-rich diets reduced colonic tissue PGE 2 concentrations by 58% to 66% and increased PGE 3 by 19- to 28-fold. Other AA–derived eicosanoids were reduced by 35% to 83%. The changes were not linear, with the largest changes in eicosanoids observed with the lower doses. A mathematical model predicts colonic tissue eicosanoids from the EPA:AA ratio in serum and the EPA dose. Every 10% increase in serum EPA:AA was associated with a 2% decrease in the (geometric) mean of PGE 2 in the distal colon. These mathematical relationships can now be applied to individualized EPA dosing in clinical trials. Cancer Prev Res; 7(10); 1011–22. Ó2014 AACR. Introduction Large, population-based studies have indicated that NSAIDs can reduce the risk of colorectal adenocarci- noma by approximately 50% (1, 2). This effect of NSAIDs may be mediated by inhibition of the cycloox- ygenase (COX) activity of prostaglandin H synthases 1 and 2, also commonly referred to as COX-1 and COX-2. Unfortunately, NSAIDs have unacceptable toxicity pro- files that prevent daily use in otherwise healthy popula- tions (3–6). COX is not the only target of NSAIDs for prevention of colorectal and other cancers. NSAIDs indi- rectly modulate lipoxygenase (LOX) pathways that can affect tissue concentrations of hydroxyeicosatetraenoic acids (HETE), leukotriene (LT), and hydroxyoctadecadie- noic acids (HODE). Lipoxygenases (5-LOX and 12-LOX) and their downstream products have been associated with enhanced carcinogenesis in multiple epithelia (7, 8). 15-LOX expression correlates with increased colonic crypt differentiation, and its main downstream product, 13- S-HODE, decreases during the colonic carcinogenesis process (9, 10). An alternative approach to pharmacologic inhibition of COX and LOX may lie in a nutraceutical approach—mod- ulation of the pool of phospholipid-derived fatty acid substrates. The w3 fatty acid eicosapentanoic acid (EPA) from fish oil is an alternative substrate for COX (11), yielding eicosanoids that are less proinflammatory than the products from w6 fatty acids (12, 13). EPA inhibits COX-2 expression, prostaglandin E2 (PGE 2 ) production, and cyto- kine production in the colon (12–14). Both EPA and docosahexaenoic acids (DHA) from fish oil inhibit the growth of experimental tumors in tissue culture and in animals, including xenografts of human tumors in nude mice (15), yet only EPA can serve as an efficient substrate for COX-2 (16, 17). Although some studies report that DHA can potentially alter the activity of COX-2 (18, 19) and lipoxygenases (20), these effects are via nonmetabolic sub- strate–enzyme competitive interactions. Our in vitro data suggest that the EPA is an effective competitive inhibitor of arachidonic acid (AA) for COX-1 (11, 16, 17). Because COX-1 is the source of most prostaglandins in normal mucosa, our data in vitro suggest that reduction of local colorectal mucosal PGE 2 production in vivo would be more 1 Department of Internal Medicine, University of Michigan Medical School, Ann Arbor, Michigan. 2 Department of Family Medicine, University of Michi- gan Medical School, Ann Arbor, Michigan. 3 Department of Biological Chemistry, University of Michigan Medical School, Ann Arbor, Michigan. 4 Department of Biostatistics, School of Public Health, University of Michi- gan, Ann Arbor, Michigan. 5 Department of Pharmacology, University of Colorado Denver, Aurora, Colorado. 6 Department of Biostatistics, Univer- sity of Pittsburgh, Pittsburgh, Pennsylvania. 7 Department of Pharmacolo- gy, University of Michigan Medical School, Ann Arbor, Michigan. 8 VA Medical Center, Ann Arbor, Michigan. Note: Supplementary data for this article are available at Cancer Prevention Research Online (http://cancerprevres.aacrjournals.org/). Corresponding Author: Dean E. Brenner, University of Michigan Medical School, 2150 Cancer Center, 1500 East Medical Center Drive, Ann Arbor, MI 48109. Phone: 734-647-1417; Fax: 1-734-647-9817; E-mail: [email protected] doi: 10.1158/1940-6207.CAPR-14-0134 Ó2014 American Association for Cancer Research. Cancer Prevention Research www.aacrjournals.org 1011 Research. on May 24, 2018. © 2014 American Association for Cancer cancerpreventionresearch.aacrjournals.org Downloaded from Published OnlineFirst August 19, 2014; DOI: 10.1158/1940-6207.CAPR-14-0134
Transcript of Biomarkers for Personalizing Omega-3 Fatty Acid...
Research Article
Biomarkers for Personalizing Omega-3 Fatty Acid Dosing
Yan Jiang1, Zora Djuric2, Ananda Sen2, Jianwei Ren2, Dmitry Kuklev3, Ian Waters2, Lili Zhao4,Charis L. Uhlson5, Yu H. Hong3, Robert C. Murphy5, Daniel P. Normolle6, William L. Smith3, andDean E. Brenner1,7,8
AbstractProstaglandin E2 (PGE2) has been linked to a higher risk of colorectal cancer. PGE2 in colon tissue
can be reduced by increasing dietary eicosapentaenoic acid (EPA). The dose-dependent relationships
between dietary EPA, serum EPA:arachidonate (AA) ratio, urinary PGE2 metabolites, and colonic
eicosanoids were evaluated to develop biomarkers for prediction of colonic PGE2. Male rats were fed
diets containing EPA:w6 fatty acid ratios of 0, 0.1, 0.2, 0.4, or 0.6 for 5 weeks. Increasing the dietary
EPA:w6 fatty acid ratio increased EPA:AA ratios in serum and in the proximal, transverse, and distal
colon (P < 0.001). The urinary PGE2 metabolite was reduced (P ¼ 0.006). EPA-rich diets reduced
colonic tissue PGE2 concentrations by 58% to 66% and increased PGE3 by 19- to 28-fold. Other
AA–derived eicosanoids were reduced by 35% to 83%. The changes were not linear, with the largest
changes in eicosanoids observed with the lower doses. A mathematical model predicts colonic tissue
eicosanoids from the EPA:AA ratio in serum and the EPA dose. Every 10% increase in serum EPA:AA
was associated with a 2% decrease in the (geometric) mean of PGE2 in the distal colon. These
mathematical relationships can now be applied to individualized EPA dosing in clinical trials. Cancer
Prev Res; 7(10); 1011–22. �2014 AACR.
IntroductionLarge, population-based studies have indicated that
NSAIDs can reduce the risk of colorectal adenocarci-noma by approximately 50% (1, 2). This effect ofNSAIDs may be mediated by inhibition of the cycloox-ygenase (COX) activity of prostaglandin H synthases 1and 2, also commonly referred to as COX-1 and COX-2.Unfortunately, NSAIDs have unacceptable toxicity pro-files that prevent daily use in otherwise healthy popula-tions (3–6). COX is not the only target of NSAIDs forprevention of colorectal and other cancers. NSAIDs indi-rectly modulate lipoxygenase (LOX) pathways that canaffect tissue concentrations of hydroxyeicosatetraenoic
acids (HETE), leukotriene (LT), and hydroxyoctadecadie-noic acids (HODE). Lipoxygenases (5-LOX and 12-LOX)and their downstream products have been associated withenhanced carcinogenesis in multiple epithelia (7, 8).15-LOX expression correlates with increased colonic cryptdifferentiation, and its main downstream product, 13-S-HODE, decreases during the colonic carcinogenesisprocess (9, 10).
An alternative approach to pharmacologic inhibition ofCOX and LOX may lie in a nutraceutical approach—mod-ulation of the pool of phospholipid-derived fatty acidsubstrates. The w3 fatty acid eicosapentanoic acid (EPA)from fish oil is an alternative substrate for COX (11),yielding eicosanoids that are less proinflammatory than theproducts from w6 fatty acids (12, 13). EPA inhibits COX-2expression, prostaglandin E2 (PGE2) production, and cyto-kine production in the colon (12–14). Both EPA anddocosahexaenoic acids (DHA) from fish oil inhibit thegrowth of experimental tumors in tissue culture and inanimals, including xenografts of human tumors in nudemice (15), yet only EPA can serve as an efficient substrate forCOX-2 (16, 17). Although some studies report that DHAcan potentially alter the activity of COX-2 (18, 19) andlipoxygenases (20), these effects are via nonmetabolic sub-strate–enzyme competitive interactions. Our in vitro datasuggest that the EPA is an effective competitive inhibitor ofarachidonic acid (AA) for COX-1 (11, 16, 17). BecauseCOX-1 is the source of most prostaglandins in normalmucosa, our data in vitro suggest that reduction of localcolorectal mucosal PGE2 production in vivowould be more
1Department of Internal Medicine, University of Michigan Medical School,Ann Arbor, Michigan. 2Department of Family Medicine, University of Michi-gan Medical School, Ann Arbor, Michigan. 3Department of BiologicalChemistry, University of Michigan Medical School, Ann Arbor, Michigan.4Department of Biostatistics, School of Public Health, University of Michi-gan, Ann Arbor, Michigan. 5Department of Pharmacology, University ofColorado Denver, Aurora, Colorado. 6Department of Biostatistics, Univer-sity of Pittsburgh, Pittsburgh, Pennsylvania. 7Department of Pharmacolo-gy, University of Michigan Medical School, Ann Arbor, Michigan. 8VAMedical Center, Ann Arbor, Michigan.
Note:Supplementary data for this article are available atCancer PreventionResearch Online (http://cancerprevres.aacrjournals.org/).
Corresponding Author: Dean E. Brenner, University of Michigan MedicalSchool, 2150 Cancer Center, 1500 East Medical Center Drive, Ann Arbor,MI 48109. Phone: 734-647-1417; Fax: 1-734-647-9817; E-mail:[email protected]
doi: 10.1158/1940-6207.CAPR-14-0134
�2014 American Association for Cancer Research.
CancerPreventionResearch
www.aacrjournals.org 1011
Research. on May 24, 2018. © 2014 American Association for Cancercancerpreventionresearch.aacrjournals.org Downloaded from
Published OnlineFirst August 19, 2014; DOI: 10.1158/1940-6207.CAPR-14-0134

contingent upon increasing the colorectal mucosal EPA:w6fatty acid ratios as opposed to DHA.
The goal of the current study was to identify mathe-matical relationships between serum biomarkers thatcould predict colonic PGE2 concentrations in a rat modelwith the goal of translating this information to humans.We focused on distal colon. Proximal and distal coloncancers differ in their etiology and biology (21, 22). Chro-nic inflammation appears to be relatively more import-ant for distal versus proximal colon cancer (23, 24). Here,we document the relationships between dietary dosing,serum EPA:AA, EPA:AA in the distal colon, urinary PGE2metabolites, and distal colorectal tissue PGE2 concentra-tions in an F344 rat model.
Materials and MethodsAnimals and diets
All animal protocols for this experiment were approvedby theUniversity Committee onUse andCare of Animals atthe University of Michigan. Male F344 rats (5 weeks old)were purchased from Harlan Laboratories (Haslett, MI).The pelleted low-fat AIN93-G, high-fat control diet (EPA:w6 fatty acid ratio ¼ 0), and high-fat fish oil diets (EPA: w6fatty acid ratio ¼ 0.1, 0.2, 0.4, 0.6) were prepared by DyetsInc. Supplementary Table S1 shows the composition ofthe experimental diets. The Western blend oil containedcoconut oil (45% by weight), olive oil (30% by weight),corn oil (15%byweight), and soybean oil (10%byweight).The Western blend oil was mixed with menhaden oil toachieve the desired EPA:w6 ratios.
To minimize lipid oxidation, OmegaPure brand men-haden oil from omega protein was stabilized againstoxidation with a combination of mixed tocopherols andtert-butylhydroquinone (TBHQ). This menhaden oil wasthen blended with the "Western" blend oil that was alsostabilized with TBHQ. The fat blend was then added tothe diet and mixed in a planetary mixer in cold conditionswith an average temperature change less than 3�C. Afterpelleting, the diet was air dried (25�C) for 24 hours.During visual inspection before packaging, any dark- ormottled-looking pellets that indicated the fat had oxi-dized were discarded and remade. We stored the dietsfrozen in a �80�C freezer. Small amounts were thawed inthe refrigerator every 2 days for feeding. We replaced thefood in the animal cage on a daily basis to minimize lipidoxidation. The rats were given water ad libitum through-out the experiment. The rats were maintained on a12-hour light/dark cycle.
Sample collection and the experimental designRatswere acclimated to the AIN93-Gdiet for 1week. Sixty
rats used for this experiment were randomly divided intofive groups (12/group) and provided with one of the fivediets: control diet or one of four fish oil diets for fiveconsecutive weeks. Body weight was recorded weekly. Dur-ing the last week of feeding, the rats were individuallyhoused inmetabolic cages for 24 hours for urine collection.
At the end of the study, animals were euthanized by iso-flurane inhalation and decapitation. Blood was collectedfrom the neck, and serum was separated and stored at�80�C. The animals were not fasted before necropsy topreserve the colon biology. The colon was immediatelyremoved from the animal and rinsed with cold PBS con-taining indomethacin (5.6 mg/mL). The colon was cut intothree equal sections horizontally, which were denoted asthe "proximal" (cecal end), "transverse," and "distal" (rectalend) colon. The colonic sections were snap frozen in liquidnitrogen and stored at �80�C before processing. Frozencolonic tissue samples were pulverized in liquid nitrogen,and then 1mL of cold PBS (with indomethacin) was addedto the tissue powder to make a tissue homogenate. Thesuspensionwas sonicated in icewater for 3minutes (20-sec-ond sonication, 20-second cooling cycle) and stored in a�80�C freezer until further analysis. An aliquot of thehomogenate from each sample was used to determineprotein concentrations using the Bradford assay (Bio-RadLaboratories Inc.).
The assays were carried out in batches in a balancedmanner. The design conformed to a completely random-ized block design. There were six batches in all with eachbatch yielding fatty acid and eicosanoid measurementsfrom all three locations of twelve rats. Two rats from eachdiet dose group were analyzed in every batch, making aneven dose distribution within batch.
Synthesis of d5-PGE3
The internal standard d5-EPA was synthesized asdescribed in a recent report (25). This material was usedto synthesize d5-PGE3 using human recombinant COX-2,as described previously (16), making a 800 mg/mL solutionin 50mmol/L PBS. Humanmicrosomal recombinant pros-taglandin E synthase-1 (mPGES-1) was from CaymanChemical. Buffer A (prepared immediately before the reac-tion) contained 0.5 mol/L TrisHCl, pH 8.3 (200 mL),deionized water (800 mL), 1 mmol/L phenol (10 mL), and5 mmol/L hemin in DMSO (1 mL). Buffer B containedNaH2PO4
�H2O (436 mg), Na2HPO4 (971 mg), reducedglutathione (77 mg), EDTA�2Na�2H2O (37 mg), TritonX-100 (320 mg), and 98 mL of water. The d5-EPA (10 mLof a 6 mmol/L solution in ethanol) was added to Buffer A(900 mL) and the sample was mixed well. Recombinanthuman COX-2 was then added (30 mL of a 0.8 mg/mLsolution in 50 mmol/L phosphate-buffered saline). Thesample was mixed vigorously for 120 seconds. Buffer B(180mL)was addedwithmixing and thenmPGES-1 (6mLofa 20mg/mL solution inBuffer B)was added, the samplewasmixed well, and left at room temperature for 10 minutes.The reaction was quenched with 450 mL of acetonitrile/0.2 mol/L citric acid (4:1, v/v). The reaction mixture wastransferred into plastic tubes and centrifuged at 1,300 � gfor 5 minutes to remove precipitated protein.
For purification, the supernatant (750 mL) was injectedonto an HPLC (high-performance liquid chromatorgraph)system equipped with C18-RP-HPLC column (ShodexRSpack DE-413L; 250 mm � 4.6 mm, 5 mm) operated at
Jiang et al.
Cancer Prev Res; 7(10) October 2014 Cancer Prevention Research1012
Research. on May 24, 2018. © 2014 American Association for Cancercancerpreventionresearch.aacrjournals.org Downloaded from
Published OnlineFirst August 19, 2014; DOI: 10.1158/1940-6207.CAPR-14-0134

1mL/minwith a binary gradient of solvent Awith solvent B.Solvent A was acetonitrile/H2O/acetic acid (0:70:0.1, v/v/v). Solvent B was acetonitrile/H2O/acetic acid (90:10:0.1,v/v/v). The gradient was solvent A-100% (5 min), whichwas graduated to solvent B-100% for 15 minutes, solventB-100% for 8 minutes, solvent A-100% for 6 minutes. Thepeak d5-PGE3 was collected between 14.5 and 15.5 min-utes. The separation was performed twice to yield 2 mL ofthe eluate, which was evaporated under vacuum and redis-solved in ethanol. HPLC-MS (ESI, negative ion mode), m/z(I%) (26): 354.2 (100%) [M (deuterated–d5) - H]�.
Eicosanoid analysis by chiral LC-MS/MSThe d5-PGE3 and d5-EPA used in the assays were
synthesized in our laboratory (25). Other eicosanoidstandards were obtained from Cayman Chemical. TheLC-MS/MS method for eicosanoid analysis was adaptedfrom the literature as previously described (27, 28). Forextraction of eicosanoids, 300 mL of the colonic homog-enate was added to 12 � 75 mm glass tubes on ice, alongwith 1 N citric acid (20 mL), 30 mmol/L disodium EDTA(20 mL), and deuterated internal standard. The resultingsolution was then extracted twice with 2-mL hexane:ethylacetate [1:1 v/v, containing 0.1% BHT (w/v)]. The pooledextracts were evaporated and reconstituted with 100 mL ofHPLC mobile phase. Aliquots (20 mL) were injected foranalysis by LC-MS/MS.HPLC separation was performed on a Waters 2695
separations module, using a Chiral-Pak AD-RH analyticalcolumn (2.1 � 150 mm, 5-mm particle size; Chiral Tech-nologies). The column was maintained at 40�C. Mobilephase A was 10 mmol/L ammonium acetate pH 4.1and mobile phase B was acetonitrile. The flow rate was0.2 mL/min. The linear gradient program was as follows:30% to 50% B (0–5 minutes), 50% to 100% B (5–24minutes), 100% B (25–30 minutes), and return to 30% B(30–37 minutes). The effluent was introduced into a Fin-nigan TSQ Quantum Ultra triple quadrupole mass spec-trometer by electrospray ionization (ESI), and detection ofnegative ions was done as previously described (27). Eicos-anoid concentrations in colonic tissue were normalized toprotein concentrations.
Urinary metabolite analysis by LC-MS/MSRat urine samples (1 mL) were processed following the
method of Murphey and colleagues (26). Briefly, LC wasperformed on a Zorbax Eclipse XDB-C18 column (Agi-lent Technologies) attached to a Surveyor MS Pump(Thermo-Finnigan). Detection was done with a Thermo-Finnigan TSQ Quantum triple quadrupole mass spec-trometer operating in the selected reaction monitoringmode. Quantification of urinary metabolite of PGE2,tetranor PGE-M (9,15-dioxo-11a-hydroxy-2,3,4,5-tetra-nor-prostan-1,20-dioc acid, PGE-M) was done using anisotopically labeled internal standard (using m/z 336 and339 ions). Urinary 2,3-dinor-6-keto-PGF1a, a metaboliteproduct of PGI2, also was determined in the urine sam-ples following procedures documented previously (29).
Urinary creatinine was measured using an Autoanalyzer(Technicon). Data were expressed as nanograms permilligram creatinine.
Fatty acid analysis by GC-MSFor quantitation of fatty acids, 10 mL of internal standard
(17:0, 1 mg/mL in hexane) was added to 150 mL of colonhomogenate or serum. The samples were then extractedwith1.5 mL of Folch reagent (chloroform:methanol, 2:1), vor-texed for 2minutes, and centrifuged (200� g for 5minutes).The organic layer was removed to a 10 � 75 mm glass tubeand dried in a SpeedVac. The samples were solubilized in150 mL of hexane:chloroform (1:1) and vortexed. Fatty acidmethyl esters (FAME) were prepared by adding 10 mL ofMETH-PREP II derivatization reagent (0.2mol/Lmethanolic(m-trifluoromethylphenyl) trimethylammonium hydrox-ide; Alltech). GC-MS was conducted as previously describedusing selected ion monitoring (30).
Data analysisDescriptive plots and summarymeasures (mean and SD)
were calculated for fatty acids percentages and eicosanoidconcentrations obtained in serum as well as in differentsegments (transverse, proximal, and distal) of the colon.The primary statistical framework adopted was that of alinear mixed-effect regression model that properlyaccounted for the clustering within the sections of the samecolonic tissue. In the first set of such models, eicosanoidsand EPA:AA ratios were compared across the differentsections in analysis of covariance models with section asa 3-level factor, and a linear and quadratic dose effect ascovariates. The model was further adjusted for variationacross analytical batches by using batch as a categoricalvariable. A random subject effect incorporated clusteringwithin the different sections of the colon. Mathematically,the model for a given measure assumed the analytical form
yijk ¼ mþ ai þ bj þ gk þ d1dij þ d2d2ij þ "ijk; ð1Þ
where yijk was the natural logarithm of the outcome mea-sure (eicosanoid) from the kth section of the colon of ithanimal in the jth batch, i¼ 1,. . .10; j¼ 1,. . ..6; k¼ 1, 2, 3. Inthe model, m denotes the overall mean, ai denotes the ithsubject effect, bj denotes the jth batch effect, and gk denotesthe kth section effect. Furthermore, dij indicates the dose levelfor the i subject in the j batch, and d1 and d2 reflect the linearand quadratic dose effects. The random error eijk and thesubject effect aiwere both assumed to have normal distribu-tions with mean zero and constant variance, independentlyof each other. Post hoc pairwise comparison between sectionswas carried out with Bonferroni adjustment for multiplecomparisons. In a separate set of analogous analysis, theassociation between eicosanoids and, the PGE2, PGE3 ratiowas investigated after controlling for the batch and sectioneffects. A random subject effect was used in the models asbefore. Logarithmic transformation was used for all theeicosanoid measures based on the behavior of the residualsand other model selection criteria such as Akaike informa-tion criterion and Bayesian information criterion.
Personalized Omega-3 Fatty Acid Dosing
www.aacrjournals.org Cancer Prev Res; 7(10) October 2014 1013
Research. on May 24, 2018. © 2014 American Association for Cancercancerpreventionresearch.aacrjournals.org Downloaded from
Published OnlineFirst August 19, 2014; DOI: 10.1158/1940-6207.CAPR-14-0134

To graphically assess the goodness of fit, plots of fittedmean curve of PGE2 and PGE3 as a function of dietaryEPA:w6 ratio were superimposed on the observed values atthe proximal and distal sections of colon. A similar plotdepicted the relationship between PGE2 and PGE3 and EPA:AA in serum. Each plot was further accompanied by 95%point wise confidence intervals of the regression function.We illustrate the construction of the confidence interval bymeans of the dose–response curve that was explained by aregression function of the form
y ¼ aþ b� doseþ c� dose2; ð2Þ
where y was the response [log(PGE2) or log(PGE3)] at agiven colonic section, and a, b, and c were fitted regressioncoefficients. At a given dose d, the lower and upper confi-dence limits of the regression function were calculated as
yðdÞ � 1:96� s:e:fyðdÞg ð3Þ
with the standard error (s.e.) {y(d)} given by
s:e:fyðdÞg¼
ffiffiffiffiffiffiffiffiffiffiffiffiffiffiffiffiffiffiffiffiffiffiffiffiffiffiffiffiffiffiffiffiffiffiffiffiffiffiffiffiffiffiffiffiffiffiffiffiffiffiffiffiffiffiffiffiffiffiffiffiffiffiffiffiffiffiffiffiffiffiffiffiffiffiffiffiffiffiffiffiffiffiffiffiffiffiffiffiffiffiffiffiffiffiffiffiffiffiffiffiffiffiffiffiffiffiffiffiffiffiffiffiffiffiffiffiffiffiffiffiffiffiffiffiffiffiffiffiffiffiffiffiffiffiffiffiffiffiffiffiffivarðaÞþd2varðbÞþd4varðcÞþ2dcovða; bÞþ2d2covða; cÞþ2d3covðb; cÞ;
pð4Þ
where var and cov denote variance and covariance terms,respectively. The confidence limits for PGE2 or PGE3 wereobtained by exponentiating the expressions in Equation (1).
All statistical calculations were carried out in softwareSAS/STAT version 9.3 (SAS Institute Inc.) and R [R CoreTeam (2012). R: A language and environment for statisticalcomputing. R Foundation for Statistical Computing,Vienna, Austria.IISBN 3-900051-07-0, URL http://www.R-project.org/].
ResultsDiets and body weight
The modified AIN93-G diet contained EPA to w6 fattyacids at ratios of 0, 0.1, 0.2, 0.4, and 0.6, while keeping totalfat content constant at 34% of calories using a Westernblend fat (Supplementary Table S1). The fatty acid compo-sition of the diets given in Supplementary Table S1 wasindependently verified by GC-MS (data not shown). Ratsconsumed these experimental diets for 5 weeks. The bodyweight of the rats wasmeasuredweekly.Nodifferenceswerefound in body weight among the means of the five ratgroups (Supplementary Fig. S1).
Colonic and serum fatty acid concentrationsTotal fatty acids were assayed in the colonic sections
and in the serum from the rats without separation of lipidsubfractions (Supplementary Table S2). Because bloodwas obtained in the nonfasting state and fatty acids wereextracted directly from serum, one limitation of the studyis that much of the serum fatty acid would have been fromchylomicrons. We found that percentages of AA in totalfatty acids varied in different anatomic colonic segments;
but, the percentages of EPA did not differ among colonicsegments (Fig. 1A and B). Distal colon had a higherpercentage of AA than the proximal or transverse colon.The percentage of AA in the serum reflected that of thecolon. The percentage of EPA in the serum was higherthan in the three colonic tissue sections in rats fed withEPA-containing diets.
The percentage of EPA in the total fatty acid poolincreased in all three colonic segments as well as in theserum when the dietary EPA: w6 ratio dose was increased(Fig. 1B). We also observed a dose-dependent increase indocosahexaenoic acid (DHA, 22:6) and a decrease inlauric acid (12:0; Supplementary Table S2). EPA:AA ratiosfor the tissues and sera were calculated, and there was aconsistent increase in the EPA:AA ratio upon increasingdietary EPA with changes in serum being the largest andchanges in distal colon being the smallest (Table 1).
Similar to AA, increasing the dose of dietary EPA causedno change in totalw6 polyunsaturated fatty acids (PUFA) inany of the colonic sections or in the serum (Fig. 1C). DietaryEPA caused a dose-dependent increase of w3 PUFAs inboth colon and sera (Fig. 1D). Although serum w6 PUFAswere similar to colonic tissue w6 PUFAs levels, w3 PUFAswere consistently higher in serum than in the three colonictissue segments in the rats fed EPA-enriched diets (Fig. 1Cand D). The average EPA:AA ratios were quite similarin proximal and transverse sections, whereas the EPA:AAratio in the distal section was significantly lower than eitherof the other two sections (Fig. 1E).
Colonic prostaglandin concentrationsThe proximal colonic PGE2 concentrations were three
times higher than the distal PGE2 concentrations, regard-less of the dietary EPA:w6 fed (Supplementary Table S3);the same relative relationship was detected for PGE3.Statistical analyses showed that adjusting for the doseand batch effects, both PGE2 and PGE3 exhibited the fol-lowing significant pattern decreasing the average concen-tration: proximal > transverse > distal (SupplementaryTable S3). Interestingly, even though the highest EPAdose was well above most human dietary intakes, thePGE3 concentrations in the rat colon were less than 10%of the PGE2 concentrations. The major PGE (and eico-sanoid) product in colonic tissue was PGE2 despite largeincreases in dietary w3 fatty acids.
Increased dietary EPA caused a nonlinear, dose-depen-dent reduction in colonic tissue PGE2 concentrations. Thereduction in PGE2 concentrations was maximal with anEPA:w6 diet ratio of 0.4 but small incremental reductionsoccurredwith the 0.6 diet in proximal, transverse, and distalcolon (Fig. 2A). PGE2 concentrations decreased 66% inthe proximal colon, 58% in the transverse, and 61% in thedistal colon with the 0.4 EPA:w6 diet relative to the dietwith no EPA (Supplementary Table S3). Colonic PGE3concentrations increased with increasing dietary EPA:w6fatty acid ratios (P < 0.0001) in all three colonic sections(Fig. 2B and Supplementary Table S3). The highest-doseEPA diet increased the concentrations of PGE3 by 19-fold in
Jiang et al.
Cancer Prev Res; 7(10) October 2014 Cancer Prevention Research1014
Research. on May 24, 2018. © 2014 American Association for Cancercancerpreventionresearch.aacrjournals.org Downloaded from
Published OnlineFirst August 19, 2014; DOI: 10.1158/1940-6207.CAPR-14-0134

the proximal colon, 28-fold in the transverse colon, and19-fold in thedistal colon as comparedwith rats fednoEPA.
Colonic concentrations of HETEs and HODEsWe also measured the concentrations of LOX products
in colonic tissues from rats fed the different diets. The proxi-mal colon consistently had thehighest concentrations of 5-S-HETE and 15-S-HETE (Fig. 2C and D; Supplementary TableS3). The concentrations of 12-S-HETE and 13-S-HODE did
not differ among the three colonic segments from rats inany dietary group (Fig. 2E and F; Supplementary Table S3).
For the 5-S-HETE, 12-S-HETE, and 15-S-HETE, the pat-tern of significant differences among the colonic sectionswas not consistent (Supplementary Table S3). Among thefour HETEs and HODE, increased dietary EPA:w6 fattyacid ratios caused the largest reduction in 12-S-HETE, bymore than 80% in all colonic segments (Fig. 2E and Sup-plementary Table S3). Similarly, consistent decreases by
Figure 1. Fatty acid levels in colonic tissue and sera. Levels of AA (A), EPA (B),w6 PUFAs (C, sum of linoleic acid, dihomo-gamma-linolenic acid, and AA),w3PUFA (D, sum of alpha-linolenic acid, docosahexaenoic acid, and EPA), EPA:AA ratio (E) and w3PUFA:w6PUFA (F) in proximal, transverse, and distal ratcolon and serum samples from the rats fed with diets having different EPA:w6 ratios. Error bars, SEM. Note the different scales for AA and EPA. �, valuessignificantly different from the control diet (P < 0.01). Detailed results of the statistical analyses are presented in Supplementary Table S2.
Personalized Omega-3 Fatty Acid Dosing
www.aacrjournals.org Cancer Prev Res; 7(10) October 2014 1015
Research. on May 24, 2018. © 2014 American Association for Cancercancerpreventionresearch.aacrjournals.org Downloaded from
Published OnlineFirst August 19, 2014; DOI: 10.1158/1940-6207.CAPR-14-0134

dietary EPA were found in all three colonic segments for15-S-HETE (Fig. 2D and Supplementary Table S3), and atrend of decrease was found in 13-S-HODE (Fig. 2F andSupplementary Table S3). The largest reduction for both12-S-HETE and 15-S-HETE occurred with dietary EPA:w6fatty acid ratios between 0 and 0.1. Further increases indietary EPA:w6 fatty acid ratios did not cause changes in5-S-HETE in the three colonic segments. In rats fed thecontrol diet, the relative amount ofR to S isomers of 5-HETEwas 1.2 in the proximal colon, 1.9 in the transverse colon,and 1.7 in the distal colon; for 12-HETE, it was 0.1 in theproximal colon, 0.06 in the transverse colon, and 0.06 inthe distal colon; for 15-HETE, it was 0.4; and for 13-HODE,it was 0.2 in all three anatomic colon segments. Increaseddietary EPA:w6 fatty acid ratios did not cause changes inconcentrations of the R-enantiomers for any of these eico-sanoids in the colonic samples (Supplementary Table S3).
Urinary metabolitesIncreasing the dietary EPA:w6 fatty acid ratio from 0
to 0.4 caused a dose-dependent decline in urinary PGE-Mwith little further change at the highest EPA:w6 dose (Fig. 3and Table 1). Amaximal 43% reductionwas seen in urinaryPGE-M in rats fed the 0.6 EPA:w6 diet (Fig. 3A). Theconcentration of the urinary metabolite of prostacyclin(PGI2-M), 2,3-dinor-6-keto-PGF1a, was not altered byincreased dietary EPA (Fig. 3B).
Mathematical relationship between fatty acids andeicosanoids
Both the linear and the quadratic terms corresponding toEPA dose in the diet were significant for EPA:AA, PGE2, and
PGE3 aswell as their ratio (Table 1). Because of the existenceof the quadratic term, the rate of change in the eicosanoidswas dose dependent. This is consistent with the plateauingpattern demonstrated in Fig. 2A. Although the coefficientin Table 1 corresponding to dose indicated the initialchange in the eicosanoid measurement per unit dose, thedose-squared coefficient contributed to the plateauingeffect.
Dose was significantly associated with urinary PGE-Mbut not 2,3-dinor-6keto-PGF1a. For the HETE’s andHODE’s, the patterns of associations were mixed. Thelinear dose effect was significantly associated with both12-S-HETE and 15-S-HETE, whereas the association wasnot significant for 5-S-HETE or 13-S-HODE. On the otherhand, 12-S-HETE was the only monohydroxy acid thatexhibited any significant association with the quadraticeffect of dose.
Key fatty acid percentages (EPA, w3HUFA, w3PUFA,w6HUFA, and w3PUFA:w6PUFA) demonstrated signifi-cant associations with PGE2 and PGE3 (Table 2) both inthe colonic tissue and the serum. The coefficients corre-sponding from the linear regression on the log–log scalecan be translated into an interpretation of percent change.For the PGE2 and serum EPA:AA relationship (adjustingfor batch and location effect), the relationship reduced tothe equation
PGE2ð ÞIIPGE2ð ÞI
¼ EPA:AAð ÞIIEPA:AAð ÞI
� ��0:2
; ð5Þ
where the ratios of both sides of Equation (5) representfold changes betweendose levels I and II. Thus, to achieve a
Table 1. Effect of dietary EPA dose and EPA dose squared on fatty acid and eicosanoid outcome variables
Dose of EPA EPA dose�EPA dose
Variablesa Coefficientb SE P Coefficientb SE P
EPA:AA 1.370 0.169 <0.0001 �0.140 0.027 <0.0001PGE2 �0.431 0.076 <0.0001 0.048 0.012 <0.0001PGE3 1.431 0.148 <0.0001 �0.155 0.023 <0.0001PGE3: PGE2 2.054 0.193 <0.0001 �0.228 0.031 <0.00015-S-HETE �0.276 0.157 0.080 0.041 0.025 0.09912-S-HETE �0.694 0.122 <0.0001 0.072 0.019 0.00015-S-HETE �0.351 0.126 0.006 0.035 0.020 0.08513-S-HODE 0.126 0.158 0.427 �0.020 0.025 0.421Serum EPA:AA 1.835 0.089 <0.001 �0.208 0.014 <0.001Log tetranor PGE-M �0.141 0.051 0.006 0.008 0.008 0.302Log 2,3-dinor-6keto-PGF1a 0.028 0.045 0.538 0.000 0.007 0.968
NOTE: Data shown as regression coefficients, SE, and statistical significance (P value).aAll outcome variables were transformed using natural logarithm. Unless indicated otherwise, the variables measured were in colonictissue.bCoefficients, SE, andP values are from linearmixed-effect regressionmodels, adjusted for analytical batch and colon section. Serumand urine variables were not adjusted for colonic sections. The dose-squared models were used to account for the curvature in thedose–response data, as used in equation 2 (see Materials and Methods).
Jiang et al.
Cancer Prev Res; 7(10) October 2014 Cancer Prevention Research1016
Research. on May 24, 2018. © 2014 American Association for Cancercancerpreventionresearch.aacrjournals.org Downloaded from
Published OnlineFirst August 19, 2014; DOI: 10.1158/1940-6207.CAPR-14-0134
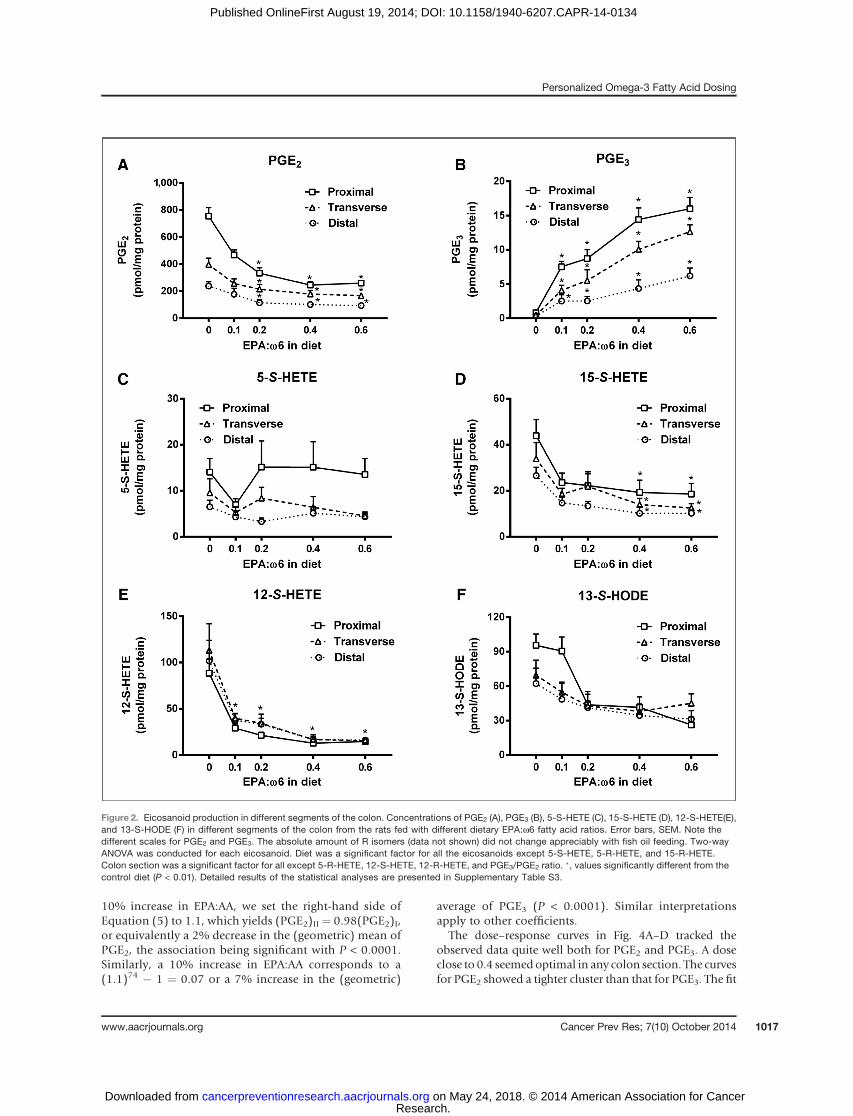
10% increase in EPA:AA, we set the right-hand side ofEquation (5) to 1.1, which yields (PGE2)II ¼ 0.98(PGE2)I,or equivalently a 2% decrease in the (geometric) mean ofPGE2, the association being significant with P < 0.0001.Similarly, a 10% increase in EPA:AA corresponds to a(1.1)74 � 1 ¼ 0.07 or a 7% increase in the (geometric)
average of PGE3 (P < 0.0001). Similar interpretationsapply to other coefficients.
The dose–response curves in Fig. 4A–D tracked theobserved data quite well both for PGE2 and PGE3. A doseclose to 0.4 seemedoptimal in any colon section. The curvesfor PGE2 showed a tighter cluster than that for PGE3. The fit
Figure 2. Eicosanoid production in different segments of the colon. Concentrations of PGE2 (A), PGE3 (B), 5-S-HETE (C), 15-S-HETE (D), 12-S-HETE(E),and 13-S-HODE (F) in different segments of the colon from the rats fed with different dietary EPA:w6 fatty acid ratios. Error bars, SEM. Note thedifferent scales for PGE2 and PGE3. The absolute amount of R isomers (data not shown) did not change appreciably with fish oil feeding. Two-wayANOVA was conducted for each eicosanoid. Diet was a significant factor for all the eicosanoids except 5-S-HETE, 5-R-HETE, and 15-R-HETE.Colon section was a significant factor for all except 5-R-HETE, 12-S-HETE, 12-R-HETE, and PGE3/PGE2 ratio. �, values significantly different from thecontrol diet (P < 0.01). Detailed results of the statistical analyses are presented in Supplementary Table S3.
Personalized Omega-3 Fatty Acid Dosing
www.aacrjournals.org Cancer Prev Res; 7(10) October 2014 1017
Research. on May 24, 2018. © 2014 American Association for Cancercancerpreventionresearch.aacrjournals.org Downloaded from
Published OnlineFirst August 19, 2014; DOI: 10.1158/1940-6207.CAPR-14-0134

through the scatter of serumEPA:AAandPGE2 showed closeconformity to the data (Fig. 4E–H). By contrast, thereseemed to be high variability in PGE3 values over a shortrange of EPA:AA and the fitted curve was driven by a fewoutlying observations.
DiscussionOmega-3 fatty acids in the form of dietary fish oil appear
tohave cancer-preventive effects; however, all studies donotagree, and taking high doses can be problematic in terms ofboth compliance and toxicity (31, 32). Beneficial effects offish oil may be limited by dietary intakes of other fats (33,34). Individualized dosing is an attractive approach foroptimizing the beneficial, preventive effects of w3 fatty acidformulations. Development of mechanism-based, rapidlyassayed, accurate, analytically cost-effective biomarkers willfacilitate such individualized dosing to allow anticarcino-genic efficacy while minimizing toxicity.
We translated our in vitro data demonstrating that the w3fatty acids inhibit the catalytic activity of COX-1(11, 16, 35). Both EPA and DHA can serve as substratesfor ovine and human COX-1 (16, 35); but, they are muchpoorer substrates than AA. Both w3 fatty acids can inhibit
the oxygenation of AA by COX-1 and COX-2 (16). In anonneoplastic epithelium, COX-1 is the primary cycloox-ygenase form present and is the likely target for reducingPGE2. Both DHA and EPA were present in the diet and wereincorporated into colon tissue with similar dose-dependentkinetics. EPA is oxygenated by COX-1 but at 10% of theefficiency of AA (35). EPA competes directly with AA for thecatalytic site of COX-1 (36). DHA is a poor substrate andmodest inhibitor of AA oxygenation by COX-1 (35, 37).Wetherefore chose tomodel PGE2 reduction in colon using theEPA:AA fatty acid ratio.
Although less relevant to the current model, EPA ismetabolized by COX-2 to form PGE3, which has antipro-liferative effects in cancer (38). The small amounts of PGE3found in the colon are likely due to EPA metabolism viaCOX-2.
We were able to establish in F344 rats a quantitative,statistically valid relationship in vivo between serum fattyacids using the EPA:AA ratio, urinary PG metabolites, andcolonic tissue concentrations of PGE2 (Table 2). Dietaryintake of EPA reduced colonic tissue PGE2 concentrations ina log-linear relationship while increasing PGE3 concentra-tions. Previously published data suggest that an increaseddietary w3:w6 ratio is more important than the totalamount of w3 fatty acid intake in altering eicosanoidproduction in rodents (39) and in reducing human colonicepithelial proliferation (33). The doses of EPA or fish oilused in human studies for cancer prevention ranged fromover 7 g/day to as low as 2 g/day, but none of these trialsemployed a dose–response with biomarker approach toindividualize human dosing (33, 40–44). The data pre-sented here provide a working model that predicts therelationship between dietary w3 fatty acids, serum andtissue fatty acid concentrations, and resulting eicosanoidsin an epithelial target the distal colon. Such relationships,based upon known enzymatic substrate–product relation-ships, were translated to in vivo rodent model systems inpreparation for future humanapplications (11, 16, 17).Ourdata support a mathematical model that may be usefulfor designing an individualized human dosing strategy.Currently, our model only incorporates EPA supplementa-tion in healthy individuals without known colonic inflam-matory stress because of our data suggesting the EPAinhibit COX-1 metabolism of AA more efficiently thanDHA. We recognize that DHA has other anticarcinogeniceffects and may have a role in cancer risk reductive inter-ventions with w3 fatty acids (15, 45). In future studies, wewould need to model DHA modulation of cytochromemetabolism to epoxides and COX-2 interactions (19, 20).
Human metabolism may differ from rodents. Publisheddata to date suggest that fatty acids in both rodents andhumans after feedingw3 fatty acids correlatewith intake butfew direct comparisons with comparable doses are known.For example, Stark assayed bioavailability of w3 fatty acidsin rats, pigs, and humans, but nonewere dosed equivalently(46). Previous data suggest a pharmacodynamic relation-ship between fatty acid concentrations in blood or tissuecompartments and eicosanoids in rodents (13) and in
Figure 3. Urinary tetranor PGE-M and 2,3-dinor-6-keto-PGF1a.Quantification of tetranor PGE-M (A) and 2,3-dinor-6-keto-PGF1a (B) in24-hour urine samples from the rats fed diets with different EPA:w6 fattyacid ratios. �, values significantly different from the control diet (P < 0.01).
Jiang et al.
Cancer Prev Res; 7(10) October 2014 Cancer Prevention Research1018
Research. on May 24, 2018. © 2014 American Association for Cancercancerpreventionresearch.aacrjournals.org Downloaded from
Published OnlineFirst August 19, 2014; DOI: 10.1158/1940-6207.CAPR-14-0134

humans (41); but a direct comparison with pharmacody-namic models using rat data and applying it to humans hasnot been published. The data presented here provide arodent-based pharmacodynamicmodel that we are current-ly testing in a human clinical trial of EPA supplementationin humans using a colon eicosanoid endpoint. Such apharmacodynamic trial will permit rodent to human com-parisons in the future.A diet high in EPA from fish oil reduced colonic con-
centrations of PGE2 by at least 50% in all three regions ofcolon, but did not alter percentages of AA orw6 PUFA in thecolon or in serum. This may be important for the requiredphysiologic functions of AA. The increased concentrationsof w3 PUFA can exert their anticarcinogenic effects on bothinitiation and promotion independent of w6 PUFAs, asopposed to substituting for them (47). The present datademonstrate that incremental increases in the dietary intakeof EPA reduced colonic PGE2 by 60%, an effect that is likelyto be reproduced in other epithelial tissues.In addition to the potential utility of serum fatty acids
as biomarkers of colon PGE2, urinary PGE-M has beenreported to be associated with colorectal cancer risk in alarge prospective cohort study (48). In our study, dietaryEPA induced a dose-dependent reduction of PGE-M;however, neither dietary EPA nor PGE-M were as highlycorrelated with tissue eicosanoid concentrations as theEPA:AA ratio in tissue and serum. Changes in urinaryPGE-M represent not only colonic COXs but also systemic
metabolism. Kakutani and colleagues (49) demonstratedthat an AA-enriched diet did not increase urinary PGE-Mconcentrations and did not modulate PGE2 in blood inhumans. However, our data suggest that urinary PGE-Mmay be a useful biomarker for epithelial proinflammatorystate. We observed that an w3 fatty acid diet did notmodulate urinary 2,3-dinor-6-keto PGF1a similar to whatKakutani and colleagues reported (49).
Previously, our group developed a chiral LC/MS-MSmethod to quantify HETEs and HODEs in the colonictissue of rodents (27). The technology permits moreefficient interrogation of eicosanoid products beyondCOX products. Among all the AA-derived eicosanoidsmeasured, colonic PGE2 was the most abundant formfollowed by 12-S-HETE, and 5-S-HETE was the lowest.The w3 fatty acid competition for eicosanoid-metaboliz-ing proteins extends beyond COX. 5-LOX and 12-LOXproducts have mitogenic effects, inducing DNA synthesiswhile inhibiting cell-cycle arrest and caspase release, andpromoting angiogenesis (7). The role of 15-LOX-1 and15-LOX-2 metabolites appears less clear with the predom-inance of data supporting antiinflammatory and antic-arcinogenesis mechanisms via PPAR g-induced apoptosisand DNA-dependent protein kinase activity activation ofp53 (7). Our data suggest that w3 fatty acid supplemen-tation will have useful anticarcinogeneic activity as muchvia LOX pathway modulation as with cyclooxygenasepathway modulation.
Table 2. Effect of colon and serum fatty acid variables on colon prostaglandins
Log PGE3:PGE2 Log PGE2 Log PGE3
Samples Variablesb Coefficienta SE P Coefficienta SE P Coefficienta SE P
Colonic tissue Log AA 0.055 0.139 0.692 �0.043 0.051 0.395 �0.062 0.096 0.515Log w6HUFA �2.456 0.525 <0.0001 0.671 0.163 <0.0001 �1.909 0.364 <0.0001Log w6PUFA 0.073 0.282 0.797 �0.077 0.103 0.454 �0.152 0.194 0.435Log EPA 0.670 0.099 <0.0001 �0.150 0.032 <0.0001 0.485 0.070 <0.0001Log w3HUFA 2.327 0.174 <0.0001 �0.386 0.068 <0.0001 1.608 0.135 <0.0001Log w3PUFA 0.738 0.162 <0.0001 �0.218 0.052 <0.0001 0.526 0.112 <0.0001Log (EPA:AA) 0.911 0.098 <0.0001 �0.173 0.033 <0.0001 0.709 0.068 <0.0001Log (w3:w6PUFA) 1.509 0.172 <0.0001 �0.309 0.057 <0.0001 1.084 0.123 <0.0001
Serum Log AA 0.382 0.908 0.674 0.045 0.230 0.844 0.575 0.657 0.384Log w6HUFA �4.064 0.352 <0.0001 0.829 0.122 <0.0001 �2.870 0.275 <0.0001Log w6PUFA �0.773 1.494 0.606 0.423 0.374 0.261 �0.219 1.090 0.842Log EPA 0.961 0.079 <0.0001 �0.183 0.030 <0.0001 0.709 0.055 <0.0001Log w3HUFA 2.711 0.189 <0.0001 �0.534 0.076 <0.0001 1.955 0.143 <0.0001Log w3PUFA 1.773 0.124 <0.0001 �0.338 0.051 <0.0001 1.298 0.089 <0.0001Log (EPA:AA) 1.021 0.076 <0.0001 �0.198 0.030 <0.0001 0.744 0.055 <0.0001Log (w3:w6PUFA) 1.786 0.118 <0.0001 �0.350 0.049 <0.0001 1.296 0.088 <0.0001
NOTE: Data are shown as regression coefficients, SE, and statistical significance (P value).aCoefficients (with SE and P) are from linear mixed-effect regression models adjusted for analytical batch and, if appropriate, colonsection.bCoefficients represent rate of change per 0.1 unit of dose. All outcome variables were transformed using natural logarithm.
Personalized Omega-3 Fatty Acid Dosing
www.aacrjournals.org Cancer Prev Res; 7(10) October 2014 1019
Research. on May 24, 2018. © 2014 American Association for Cancercancerpreventionresearch.aacrjournals.org Downloaded from
Published OnlineFirst August 19, 2014; DOI: 10.1158/1940-6207.CAPR-14-0134

Disclosure of Potential Conflicts of InterestW.L. Smith is a consultant/advisory boardmember for CaymanChemical
Co. No potential conflicts of interest were disclosed by the other authors.
Authors' ContributionsConceptionanddesign:Y. Jiang, Z.Djuric, A. Sen, I.Waters,D.P.Normolle,W.L. Smith, D.E. BrennerDevelopment ofmethodology: Y. Jiang, Z.Djuric, A. Sen, J. Ren,D. Kuklev,I. Waters, Y.H. Hong, D.P. Normolle, W.L. Smith, D.E. BrennerAcquisitionofdata (provided animals, acquired andmanagedpatients,provided facilities, etc.): Y. Jiang, J. Ren, I.Waters, C.L. Uhlson, Y.H. Hong,R.C. Murphy, W.L. SmithAnalysis and interpretation of data (e.g., statistical analysis, bio-statistics, computational analysis): Y. Jiang, A. Sen, I. Waters, L. Zhao,Y.H. Hong, R.C. Murphy, W.L. Smith, D.E. BrennerWriting, review, and/or revision of the manuscript: Y. Jiang, Z. Djuric,A. Sen, I. Waters, R.C. Murphy, W.L. Smith, D.E. BrennerAdministrative, technical, or material support (i.e., reporting or orga-nizing data, constructing databases): Y. Jiang, J. Ren, D.E. BrennerStudy supervision: Y. Jiang, W.L. Smith, D.E. Brenner
AcknowledgmentsThe authors thank the University of Michigan Unit for Laboratory
Animal Medicine team for assistance with special diet feeding. They alsothank students, Curtis Austin and Gretchen Bentz, for help with theanimal study.
Grant SupportThis study was financially supported byNIHGM068848 (toW.L. Smith),
NIH HL117798 and NIH AT002782 (to R.C. Murphy), and NIH CA130810and VA GRECC (to D.E. Brenner).
The costs of publication of this article were defrayed in part by thepayment of page charges. This article must therefore be hereby markedadvertisement in accordance with 18 U.S.C. Section 1734 solely to indicatethis fact.
Received April 21, 2014; revised July 16, 2014; accepted August 1, 2014;published OnlineFirst August 19, 2014.
References1. Chan AT, Giovannucci EL, Meyerhardt JA, Schernhammer ES,
Curhan GC, Fuchs CS. Long-term use of aspirin and nonsteroidalanti-inflammatory drugs and risk of colorectal cancer. JAMA 2005;294:914–23.
2. Cook NR, Lee IM, Gaziano JM, Gordon D, Ridker PM, Manson JE,et al. Low-dose aspirin in the primary prevention of cancer: theWomen's Health Study: a randomized controlled trial. JAMA 2005;294:47–55.
0–2
00
24
610
02
615
0
100
00
010
206
300
1240
0
0.0 0.1 0.2 0.3
EPA:ω6 in diet
DistalA B
C D
E F
G H
Proximal
PG
E2
PG
E2
PG
E3
PG
E3
PG
E2
PG
E2
PG
E3
PG
E3
0.4 0.5 0.6 0.7 0.0 0.1 0.2 0.3
EPA:ω6 in diet
0.4 0.5 0.6 0.7
0.0
0 1 2Serum EPA:AA
3 4 0 1 2Serum EPA:AA
3 4
0 1 2Serum EPA:AA
3 40 1 2Serum EPA:AA
3 4
0.1 0.2 0.3
EPA:ω6 in diet
0.4 0.5 0.6 0.7 0.0 0.1 0.2 0.3
EPA:ω6 in diet
0.4 0.5 0.6 0.7
Figure 4. Dose–response relationship of PGE2 and PGE3 with diet and serum EPA:AA ratios. A–D, the plots show a fitted mean curve of PGE2 andPGE3 as a function of the dietary EPA:w6 ratio superimposed for the proximal and distal sections of the colon. E–H, relationship between colonic PGE2
or PGE3 and serum EPA:AA ratios.
Jiang et al.
Cancer Prev Res; 7(10) October 2014 Cancer Prevention Research1020
Research. on May 24, 2018. © 2014 American Association for Cancercancerpreventionresearch.aacrjournals.org Downloaded from
Published OnlineFirst August 19, 2014; DOI: 10.1158/1940-6207.CAPR-14-0134

3. Bresalier RS, Sandler RS, Quan H, Bolognese JA, Oxenius B, HorganK, et al.Cardiovascular events associatedwith rofecoxib in acolorectaladenoma chemoprevention trial. N Engl J Med 2005;352:1092–102.
4. SolomonSD,McMurray JJ, PfefferMA,Wittes J, Fowler R, FinnP, et al.Cardiovascular risk associated with celecoxib in a clinical trial forcolorectal adenoma prevention. N Engl J Med 2005;352:1071–80.
5. FitzGerald GA. Nonsteroidal anti-inflammatory drugs, coxibs, andcardio-renal physiology: a mechanism-based approach. Am J Cardiol2002;89:1D–2D.
6. Lanas A. Non-steroidal anti-inflammatory drugs and gastrointestinalbleeding. Ital J Gastroenterol Hepatol 1999;31 Suppl 1:S37–42.
7. Comba A, Pasqualini ME. Primers on molecular pathways - lipoxy-genases: their role as an oncogenic pathway in pancreatic cancer.Pancreatology 2009;9:724–8.
8. Wang D, Dubois RN. Eicosanoids and cancer. Nat Rev Cancer2010;10:181–93.
9. Shureiqi I, Chen D, Day RS, Zuo X, Hochman FL, Ross WA, et al.Profiling lipoxygenase metabolism in specific steps of colorectaltumorigenesis. Cancer Prev Res 2010;3:829–38.
10. Shureiqi I, Wojno KJ, Poore JA, Reddy RG, Moussalli MJ, Spindler SA,et al. Decreased 13-S-hydroxyoctadecadienoic acid levels and 15-lipoxygenase-1 expression in human colon cancers. Carcinogenesis1999;20:1985–95.
11. Wada M, DeLong CJ, Hong YH, Rieke CJ, Song I, Sidhu RS, et al.Enzymes and receptors of prostaglandin pathways with arachidonicacid-derived versus eicosapentaenoic acid-derived substrates andproducts. J Biol Chem 2007;282:22254–66.
12. Smith WL. Cyclooxygenases, peroxide tone and the allure of fish oil.Curr Opin Cell Biol 2005;17:174–82.
13. Rao CV, Hirose Y, Indranie C, Reddy BS. Modulation of experimentalcolon tumorigenesis by types and amounts of dietary fatty acids.Cancer Res 2001;61:1927–33.
14. Gravaghi C, La Perle KM, Ogrodwski P, Kang JX, Quimby F, Lipkin M,et al. Cox-2 expression, PGE(2) and cytokines production are inhibitedby endogenously synthesized n-3 PUFAs in inflamed colon of fat-1mice. J Nutr Biochem 2011;22:360–5.
15. Kato T, Kolenic N, Pardini RS. Docosahexaenoic acid (DHA), a primarytumor suppressive omega-3 fatty acid, inhibits growth of colorectalcancer independent of p53 mutational status. Nutr Cancer 2007;58:178–87.
16. Yuan C, Sidhu RS, Kuklev DV, Kado Y, Wada M, Song I, et al.Cyclooxygenase allosterism: fatty acid mediated cross-talk betweenmonomers of cyclooxygenase homodimers. J Biol Chem 2009;284:10046–55.
17. Sharma NP, Dong L, Yuan C, Noon KR, Smith WL. Asymmetricacetylation of the cyclooxygenase-2 homodimer by aspirin and itseffects on the oxygenation of arachidonic, eicosapentaenoic, anddocosahexaenoic acids. Mol Pharmcol 2010;77:979–86.
18. Swamy MV, Cooma I, Patlolla JM, Simi B, Reddy BS, Rao CV.Modulation of cyclooxygenase-2 activities by the combined action ofcelecoxib and decosahexaenoic acid: novel strategies for colon can-cer prevention and treatment. Mol Cancer Ther 2004;3:215–21.
19. Massaro M, Habib A, Lubrano L, Del Turco S, Lazzerini G, Bourcier T,et al. The omega-3 fatty acid docosahexaenoate attenuates endothe-lial cyclooxygenase-2 induction through both NADP(H) oxidase andPKC epsilon inhibition. PNAS 2006;103:15184–9.
20. Matsumoto K, Morita I, Hibino H, Murota S. Inhibitory effect of doc-osahexaenoic acid-containing phospholipids on 5-lipoxygenase in ratbasophilic leukemia cells. Prostaglandins Leukot Essent Fatty Acids1993;49:861–6.
21. Meza R, Jeon J, Renehan AG, Luebeck EG. Colorectal cancer inci-dence trends in the United States and United kingdom: evidence ofright- to left-sided biological gradients with implications for screening.Cancer Res 2010;70:5419–29.
22. Nawa T, Kato J, Kawamoto H, Okada H, Yamamoto H, Kohno H, et al.Differences between right- and left-sided colon cancer in patientcharacteristics, cancer morphology and histology. J GastroenterolHepatol 2008;23:418–23.
23. SamowitzWS, Albertsen H, Herrick J, Levin TR, Sweeney C,MurtaughMA, et al. Evaluation of a large, population-based sample supports a
CpG island methylator phenotype in colon cancer. Gastroenterology2005;129:837–45.
24. Rubin DC, Shaker A, Levin MS. Chronic intestinal inflammation:inflammatory bowel disease and colitis-associated colon cancer.Front Immunol 2012;3:107.
25. Kuklev DV, Hankin JA, Uhlson CL, Hong YH, Murphy RC, Smith WL.Major urinary metabolites of 6-keto-prostaglandin F2alpha in mice.J Lipid Res 2013;54:1906–14.
26. Murphey LJ, Williams MK, Sanchez SC, Byrne LM, Csiki I, Oates JA,et al. Quantification of the major urinary metabolite of PGE2 by a liquidchromatographic/mass spectrometric assay: determination of cyclo-oxygenase-specific PGE2 synthesis in healthy humans and those withlung cancer. Anal Biochem 2004;334:266–75.
27. Neilson AP, Ren J, HongYH, SenA, SmithWL, BrennerDE, et al. Effectof fish oil on levels of R- and S-enantiomers of 5-, 12-, and 15-hydroxyeicosatetraenoic acids inmouse colonicmucosa. Nutr Cancer2012;64:163–72.
28. Yang P, Felix E, Madden T, Fischer SM, Newman RA. Quantitativehigh-performance liquid chromatography/electrospray ionization tan-dem mass spectrometric analysis of 2- and 3-series prostaglandins incultured tumor cells. Analytical Biochem 2002;308:168–77.
29. Falardeau P, Oates JA, Brash AR. Quantitative analysis of two dinorurinary metabolites of prostaglandin I2. Analytical Biochem 1981;115:359–67.
30. Djuric Z, Ren J, Blythe J, VanLoon G, Sen A. A Mediterranean dietaryintervention in healthy American women changes plasma carotenoidsand fatty acids in distinct clusters. Nutr Res 2009;29:156–63.
31. Burns CP, Halabi S, Clamon GH, Hars V, Wagner BA, Hohl RJ, et al.Phase I clinical study of fish oil fatty acid capsules for patients withcancer cachexia: cancer and leukemia group B study 9473. ClinCancer Res 1999;5:3942–7.
32. Gee JM,WatsonM,Matthew JA, RhodesM, SpeakmanCJ, StebbingsWS, et al. Consumption of fish oil leads to prompt incorporation ofeicosapentaenoic acid into colonicmucosa of patients prior to surgeryfor colorectal cancer, but has no detectable effect on epithelial cyto-kinetics. J Nutr 1999;129:1862–5.
33. Bartram HP, Gostner A, Reddy BS, Rao CV, Scheppach W, DuselG, et al. Missing anti-proliferative effect of fish oil on rectalepithelium in healthy volunteers consuming a high-fat diet: poten-tial role of the n-3:n-6 fatty acid ratio. Eur J Cancer Prev 1995;4:231–7.
34. Broughton KS, Whelan J, Hardardottir I, Kinsella JE. Effect of increas-ing the dietary (n-3) to (n-6) polyunsaturated fatty acid ratio on murineliver and peritoneal cell fatty acids and eicosanoid formation. J Nutr1991;121:155–64.
35. Zou H, Yuan C, Dong L, Sidhu RS, Hong YH, Kuklev DV, et al. Humancyclooxygenase-1 activity and its responses to COX inhibitors areallosterically regulated by nonsubstrate fatty acids. J Lipid Res 2012;53:1336–47.
36. Malkowski MG, Thuresson ED, Lakkides KM, Rieke CJ, Micielli R,Smith WL, et al. Structure of eicosapentaenoic and linoleic acids inthe cyclooxygenase site of prostaglandin endoperoxide H synthase-1.J Biol Chem 2001;276:37547–55.
37. Dong L, Sharma NP, Jurban BJ, Smith WL. Pre-existent asymmetry inthe human cyclooxygenase-2 sequence homodimer. J Biol Chem2013;288:28641–55.
38. Yang P, Jiang Y, Fischer SM. Prostaglandin E3 metabolism andcancer. Cancer Lett 2014;348:1–11.
39. Boudreau MD, Chanmugam PS, Hart SB, Lee SH, Hwang DH. Lack ofdose responsebydietary n-3 fatty acids at a constant ratio of n-3 to n-6fatty acids in suppressing eicosanoid biosynthesis from arachidonicacid. Am J Clin Nutr 1991;54:111–7.
40. Bartram HP, Gostner A, Kelber E, Dusel G, Scheppach W, KasperH. Effect of dietary fish oil on fecal bile acid and neutral sterolexcretion in healthy volunteers. Z Ernahrungswiss 1998;37 Suppl1:139–41.
41. Bartram HP, Gostner A, Scheppach W, Reddy BS, Rao CV, Dusel G,et al. Effects of fish oil on rectal cell proliferation, mucosal fatty acids,and prostaglandin E2 release in healthy subjects. Gastroenterology1993;105:1317–22.
www.aacrjournals.org Cancer Prev Res; 7(10) October 2014 1021
Personalized Omega-3 Fatty Acid Dosing
Research. on May 24, 2018. © 2014 American Association for Cancercancerpreventionresearch.aacrjournals.org Downloaded from
Published OnlineFirst August 19, 2014; DOI: 10.1158/1940-6207.CAPR-14-0134

42. Anti M, Armelao F, Marra G, Percesepe A, Bartoli GM, Palozza P, et al.Effects of different doses of fish oil on rectal cell proliferation inpatients with sporadic colonic adenomas. Gastroenterology 1994;107:1709–18.
43. Anti M, Marra G, Armelao F, Bartoli GM, Ficarelli R, Percesepe A,et al. Effect of omega-3 fatty acids on rectal mucosal cell prolifer-ation in subjects at risk for colon cancer. Gastroenterology 1992;103:883–91.
44. Courtney ED, Matthews S, Finlayson C, Di Pierro D, Belluzzi A,Roda E, et al. Eicosapentaenoic acid (EPA) reduces crypt cellproliferation and increases apoptosis in normal colonic mucosa insubjects with a history of colorectal adenomas. Int J Colorectal Dis2007;22:765–76.
45. Zhang G, Panigrahy D, Mahakian LM, Yang J, Liu JY, Stephen Lee KS,et al. Epoxy metabolites of docosahexaenoic acid (DHA) inhibit angio-genesis, tumor growth, and metastasis. PNAS 2013;110:6530–5.
46. Stark KD. The percentage of n-3 highly unsaturated fatty acids in totalHUFA as a biomarker for omega-3 fatty acid status in tissues. Lipids2008;43:45–53.
47. Davidson LA, Nguyen DV, Hokanson RM, Callaway ES, Isett RB,Turner ND, et al. Chemopreventive n-3 polyunsaturated fatty acidsreprogram genetic signatures during colon cancer initiation and pro-gression in the rat. Cancer Res 2004;64:6797–804.
48. Cai Q, Gao YT, Chow WH, Shu XO, Yang G, Ji BT, et al. Prospectivestudy of urinary prostaglandin E2 metabolite and colorectal cancerrisk. J Clin Oncol 2006;24:5010–6.
49. Kakutani S, Ishikura Y, Tateishi N, Horikawa C, Tokuda H, Kontani M,et al. Supplementation of arachidonic acid-enriched oil increasesarachidonic acid contents in plasma phospholipids, but does notincrease their metabolites and clinical parameters in Japanese healthyelderly individuals: a randomized controlled study. Lipids Health Dis2011;10:241.
Cancer Prev Res; 7(10) October 2014 Cancer Prevention Research1022
Jiang et al.
Research. on May 24, 2018. © 2014 American Association for Cancercancerpreventionresearch.aacrjournals.org Downloaded from
Published OnlineFirst August 19, 2014; DOI: 10.1158/1940-6207.CAPR-14-0134

2014;7:1011-1022. Published OnlineFirst August 19, 2014.Cancer Prev Res Yan Jiang, Zora Djuric, Ananda Sen, et al. Biomarkers for Personalizing Omega-3 Fatty Acid Dosing
Updated version
10.1158/1940-6207.CAPR-14-0134doi:
Access the most recent version of this article at:
Material
Supplementary
1
http://cancerpreventionresearch.aacrjournals.org/content/suppl/2014/08/21/1940-6207.CAPR-14-0134.DCAccess the most recent supplemental material at:
Cited articles
http://cancerpreventionresearch.aacrjournals.org/content/7/10/1011.full#ref-list-1
This article cites 49 articles, 19 of which you can access for free at:
Citing articles
http://cancerpreventionresearch.aacrjournals.org/content/7/10/1011.full#related-urls
This article has been cited by 3 HighWire-hosted articles. Access the articles at:
E-mail alerts related to this article or journal.Sign up to receive free email-alerts
Subscriptions
Reprints and
To order reprints of this article or to subscribe to the journal, contact the AACR Publications Department at
Permissions
Rightslink site. Click on "Request Permissions" which will take you to the Copyright Clearance Center's (CCC)
.http://cancerpreventionresearch.aacrjournals.org/content/7/10/1011To request permission to re-use all or part of this article, use this link
Research. on May 24, 2018. © 2014 American Association for Cancercancerpreventionresearch.aacrjournals.org Downloaded from
Published OnlineFirst August 19, 2014; DOI: 10.1158/1940-6207.CAPR-14-0134
http://cancerpreventionresearch.aacrjournals.org/content/suppl/2014/08/21/1940-6207.CAPR-14-0134.DC1