Genetic Association Analysis under Complex Survey Sampling ...
14
ARTICLE Genetic Association Analysis under Complex Survey Sampling: The Hispanic Community Health Study/Study of Latinos Dan-Yu Lin, 1, * Ran Tao, 1 William D. Kalsbeek, 1 Donglin Zeng, 1 Franklyn Gonzalez II, 1 Lindsay Ferna ´ndez-Rhodes, 2 Mariaelisa Graff, 2 Gary G. Koch, 1 Kari E. North, 2 and Gerardo Heiss 2 The cohort design allows investigators to explore the genetic basis of a variety of diseases and traits in a single study while avoiding major weaknesses of the case-control design. Most cohort studies employ multistage cluster sampling with unequal probabilities to conve- niently select participants with desired characteristics, and participants from different clusters might be genetically related. Analysis that ignores the complex sampling design can yield biased estimation of the genetic association and inflation of the type I error. Herein, we develop weighted estimators that reflect unequal selection probabilities and differential nonresponse rates, and we derive variance estimators that properly account for the sampling design and the potential relatedness of participants in different sampling units. We compare, both analytically and numerically, the performance of the proposed weighted estimators with unweighted estimators that disregard the sampling design. We demonstrate the usefulness of the proposed methods through analysis of MetaboChip data in the Hispanic Community Health Study/Study of Latinos, which is the largest health study of the Hispanic/Latino population in the United States aimed at identifying risk factors for various diseases and determining the role of genes and environment in the occurrence of dis- eases. We provide guidelines on the use of weighted and unweighted estimators, as well as the relevant software. Introduction The cohort design allows for rigorous investigation into a range of diseases and conditions in a single study while reducing important biases inherent in the case-control design. 1–3 Most cohort studies employ multistage, unequal probability, and cluster sampling to select participants, with the intention of achieving particular population pro- files or to enrich the cohort with exposed individuals or those affected by conditions of interest. Such studies include the Family Heart Study, 4 the MONICA Augsburg Surveys, 5 the National Health and Nutrition Examination Survey (NHANES), 6 the National Longitudinal Study of Adolescent Health (Add Health), 7 and the National Chil- dren’s Study, 8 among many others. These cohorts provide a valuable and indispensable resource for identifying ge- netic variants affecting measured risk factors, indicators of subclinical diseases, and clinical manifestations of diseases. 1–3,7–13 However, the implications of the complex sampling design in genetic data analysis have not been well appreciated. Sampling was particularly complex in the Hispanic Community Health Study (HCHS)/Study of Latinos (SOL), which is an ongoing multicenter cohort study of 16,415 Hispanic/Latino individuals with various countries of origin to identify risk factors for multiple diseases and determine the role of genes and environment, including acculturation, in the occurrence of diseases. The HCHS/ SOL cohort was selected through a stratified multistage cluster sampling design. 14 The community areas in four field centers—Bronx, Chicago, Miami, and San Diego— were delineated by census tracts from the 2000 decennial census. The field centers selected the tracts to target nonin- stitutionalized Hispanic/Latino adults aged 18–74 years. At the first stage of sample selection, a stratified simple random sample of census block groups (BGs) was selected for each field center; four strata were formed by cross-clas- sifying BGs by socioeconomic status (SES) (2 levels) and the proportion of individuals who were Hispanic/Latino (2 levels). At the second stage, separate samples of house- hold addresses in each of the sampled BGs were selected from lists of postal addresses stratified by Hispanic/Latino surnames versus all others. Afterward, Bernoulli subsam- pling was used to oversample 45- to 74-year-old Hispanic/ Latino residents within selected households. The HCHS/SOL participants underwent a clinic exam that included blood collection (from which DNA was ex- tracted and analytes measured), an electrocardiogram, and assessments of ankle-brachial index, anthropometry, blood pressure, spirometry, dental, and neurocognitive phenotypes. Participants also completed extensive socio- demographic, medical, behavioral, and lifestyle question- naires. Annual follow-up interviews have been conducted, and endpoints in cardiovascular and lung diseases have been collected. As part of the Population Architecture us- ing Genomics and Epidemiology (PAGE) Consortium, 11 the HCHS/SOL participants were genotyped on the MetaboChip 15 and will soon be genotyped on a new Illu- mina chip for low-frequency and rare exomic variants in ethnically diverse samples. Recently, the Omics in Latinos (OLa) project was launched to conduct genome-wide asso- ciation analysis in the HCHS/SOL participants. 1 Department of Biostatistics, University of North Carolina, Chapel Hill, NC 27599-7420, USA; 2 Department of Epidemiology, University of North Carolina, Chapel Hill, NC 27599-8050, USA *Correspondence: [email protected] http://dx.doi.org/10.1016/j.ajhg.2014.11.005. Ó2014 by The American Society of Human Genetics. All rights reserved. The American Journal of Human Genetics 95, 675–688, December 4, 2014 675
Transcript of Genetic Association Analysis under Complex Survey Sampling ...

ARTICLE
Genetic Association Analysis under Complex SurveySampling: The Hispanic CommunityHealth Study/Study of Latinos
Dan-Yu Lin,1,* Ran Tao,1 William D. Kalsbeek,1 Donglin Zeng,1 Franklyn Gonzalez II,1
Lindsay Fernandez-Rhodes,2 Mariaelisa Graff,2 Gary G. Koch,1 Kari E. North,2 and Gerardo Heiss2
The cohort design allows investigators to explore the genetic basis of a variety of diseases and traits in a single studywhile avoidingmajor
weaknesses of the case-control design. Most cohort studies employ multistage cluster sampling with unequal probabilities to conve-
niently select participants with desired characteristics, and participants from different clusters might be genetically related. Analysis
that ignores the complex sampling design can yield biased estimation of the genetic association and inflation of the type I error. Herein,
we develop weighted estimators that reflect unequal selection probabilities and differential nonresponse rates, and we derive variance
estimators that properly account for the sampling design and the potential relatedness of participants in different sampling units. We
compare, both analytically and numerically, the performance of the proposed weighted estimators with unweighted estimators that
disregard the sampling design. We demonstrate the usefulness of the proposed methods through analysis of MetaboChip data in the
Hispanic Community Health Study/Study of Latinos, which is the largest health study of the Hispanic/Latino population in the United
States aimed at identifying risk factors for various diseases and determining the role of genes and environment in the occurrence of dis-
eases. We provide guidelines on the use of weighted and unweighted estimators, as well as the relevant software.
Introduction
The cohort design allows for rigorous investigation into a
range of diseases and conditions in a single study while
reducing important biases inherent in the case-control
design.1–3 Most cohort studies employ multistage, unequal
probability, and cluster sampling to select participants,
with the intention of achieving particular population pro-
files or to enrich the cohort with exposed individuals or
those affected by conditions of interest. Such studies
include the Family Heart Study,4 the MONICA Augsburg
Surveys,5 the National Health and Nutrition Examination
Survey (NHANES),6 the National Longitudinal Study of
Adolescent Health (Add Health),7 and the National Chil-
dren’s Study,8 among many others. These cohorts provide
a valuable and indispensable resource for identifying ge-
netic variants affecting measured risk factors, indicators
of subclinical diseases, and clinical manifestations of
diseases.1–3,7–13 However, the implications of the complex
sampling design in genetic data analysis have not been
well appreciated.
Sampling was particularly complex in the Hispanic
Community Health Study (HCHS)/Study of Latinos
(SOL), which is an ongoing multicenter cohort study of
16,415 Hispanic/Latino individuals with various countries
of origin to identify risk factors for multiple diseases and
determine the role of genes and environment, including
acculturation, in the occurrence of diseases. The HCHS/
SOL cohort was selected through a stratified multistage
cluster sampling design.14 The community areas in four
field centers—Bronx, Chicago, Miami, and San Diego—
1Department of Biostatistics, University of North Carolina, Chapel Hill, NC 275
Chapel Hill, NC 27599-8050, USA
*Correspondence: [email protected]
http://dx.doi.org/10.1016/j.ajhg.2014.11.005. �2014 by The American Societ
The American
were delineated by census tracts from the 2000 decennial
census. The field centers selected the tracts to target nonin-
stitutionalized Hispanic/Latino adults aged 18–74 years. At
the first stage of sample selection, a stratified simple
random sample of census block groups (BGs) was selected
for each field center; four strata were formed by cross-clas-
sifying BGs by socioeconomic status (SES) (2 levels) and
the proportion of individuals who were Hispanic/Latino
(2 levels). At the second stage, separate samples of house-
hold addresses in each of the sampled BGs were selected
from lists of postal addresses stratified by Hispanic/Latino
surnames versus all others. Afterward, Bernoulli subsam-
pling was used to oversample 45- to 74-year-old Hispanic/
Latino residents within selected households.
The HCHS/SOL participants underwent a clinic exam
that included blood collection (from which DNA was ex-
tracted and analytes measured), an electrocardiogram,
and assessments of ankle-brachial index, anthropometry,
blood pressure, spirometry, dental, and neurocognitive
phenotypes. Participants also completed extensive socio-
demographic, medical, behavioral, and lifestyle question-
naires. Annual follow-up interviews have been conducted,
and endpoints in cardiovascular and lung diseases have
been collected. As part of the Population Architecture us-
ing Genomics and Epidemiology (PAGE) Consortium,11
the HCHS/SOL participants were genotyped on the
MetaboChip15 and will soon be genotyped on a new Illu-
mina chip for low-frequency and rare exomic variants in
ethnically diverse samples. Recently, the Omics in Latinos
(OLa) project was launched to conduct genome-wide asso-
ciation analysis in the HCHS/SOL participants.
99-7420, USA; 2Department of Epidemiology, University of North Carolina,
y of Human Genetics. All rights reserved.
Journal of Human Genetics 95, 675–688, December 4, 2014 675
Genetic association analysis in the HCHS/SOL poses two
major challenges. First, because of unequal selection prob-
abilities and considerable levels of differential nonre-
sponse, the participants are not a simple random sample
of the target population, so genetic associations might be
distorted in the selected cohort. Second, there is a complex
pattern of relatedness: individuals in the same household
are probably related and in addition there is endogamous
mating within the Hispanic/Latino community,16 such
that some households are connected into large pedigrees
that extend beyond the primary sampling units (i.e., BGs).
In this article, we develop a weighted version of the
generalized estimating equations (GEEs)17 to account for
unequal inclusion probabilities and complex patterns of
relatedness. Our approach does not require modeling the
correlation structures of complex pedigrees and is appli-
cable to any trait, including quantitative and binary traits.
We construct two weighted estimators that properly con-
trol the type I error. The first weighted estimator uses the
inverse inclusion probabilities as the weights and provides
unbiased estimation of the overall association in the target
population even when the strength of the association de-
pends on the sampling variables. The second weighted
estimator accounts only for the aspect of the sampling pro-
cess that is not determined by the covariates in the associ-
ation model and tends to be more powerful than the first
one because of the reduced variation of the weights.
We derive variance estimators that are accurate even for
low-frequency SNPs. We compare, both analytically and
numerically, the performance of the proposed weighted
estimators with unweighted estimators that either ignore
the sampling design or include the sampling variables or
inclusion probability as additional covariates. We imple-
ment both types of estimators in a user-friendly software
program and report preliminary results from our ongoing
analysis of MetaboChip data in the HCHS/SOL. We make
recommendations on the choice of weighted versus un-
weighted estimators under various scenarios.
Material and Methods
To address the issue of relatedness, we first perform an identity by
descent (IBD) analysis of study participants by using genome-wide
markers from a GWAS chip or some other chip. We use the IBD in-
formation to identify pairs of individuals who are first-degree or
second-degree relatives. We then create (extended) families by
connecting the households who share first-degree relatives or
either first- or second-degree relatives. The trait values are assumed
to be correlated within families but independent between families.
In our experience, it is sufficient to account for the first-degree
relatedness in association analysis.
Suppose that there are a total of K families in the target popula-
tion, withNkmembers in the kth family (k¼ 1,..., K). For k¼ 1,..., K
and i ¼ 1,..., Nk, let Yki denote the trait of interest for the ith mem-
ber of the kth family, and Xki the corresponding set of covariates,
which can include SNP genotypes, principal components (PCs)
for ancestry, and demographic variables. We relate Yki to Xki
through a regression model characterized by the density function
676 The American Journal of Human Genetics 95, 675–688, Decemb
f ðyjx; qÞ, where q is a set of regression parameters. If all of the indi-
viduals in the target populationwere selected, wewould estimate q
through the following generalized estimating function:17
UðqÞ ¼XKk¼1
XNk
i¼1
UkiðqÞ;
where UkiðqÞ ¼ vlog f ðYkijXki; qÞ=vq.The individuals are selected with unequal probabilities, and
some selected individuals decline to participate in the study. Sup-
pose that a total of ~K families participate in the study, with nk par-
ticipants in the kth family. For k ¼ 1;.; ~K and i ¼ 1,..., nk, let pki
denote the inclusion probability of the ith member of the kth fam-
ily. Then a Horvitz-Thompson18 type ‘‘estimator’’ of U(q) is
bU ðqÞ ¼X~K
k¼1
Xnki¼1
wkiUkiðqÞ;
where wki ¼ 1 / pki. Denote the resulting estimator of q by bqw.We show in Appendix A that bqw is approximately normal
with mean q and a covariance matrix that can be estimated
by bVw ¼ bA�1ðbqwÞbBðbqwÞbA�1ðbqwÞ or ~Vw ¼ bA�1ðbqwÞ~BðbqwÞbA�1ðbqwÞ,where
bAðqÞ ¼ X~K
k¼1
Xnki¼1
wki
vUkiðqÞvq
;
bBðqÞ ¼ X~K
k¼1
Xnki¼1
Xnkj¼1
wkiwkjUkiðqÞU 0kjðqÞ
þX~K
k¼1
Xnki¼1
X~K
lsk;l¼1
Xnlj¼1
wkiwlj
�pkilj � pkiplj
�pkilj
UkiðqÞU 0ljðqÞ
~BðqÞ ¼ �X~K
k¼1
Xnki¼1
w2ki
vUkiðqÞvq
þX~K
k¼1
Xnki¼1
Xnkjsi;j¼1
wkiwkjUkiðqÞU 0kjðqÞ
þX~K
k¼1
Xnki¼1
X~K
lsk;l¼1
Xnlj¼1
wkiwlj
�pkilj � pkiplj
�pkilj
UkiðqÞU 0ljðqÞ;
and pkilj is the probability that the ith member of the kth family and
the jth member of the lth family are both included. Note that ~BðqÞdiffers from bBðqÞ in that the within-subject covariance matrix of
Uki(q) is estimated by the Fisher information matrix �vUkiðqÞ=vqrather than the empirical covariance matrix UkiðqÞU 0
kiðqÞ. The
former estimator is more accurate than the latter for low-fre-
quency SNPs; however, the latter is (asymptotically) valid even
when the association model is misspecified whereas the former
might not be. We refer to bVw and ~Vw as the robust and model-
based variance estimators, respectively.
The calculations of bqw and its covariance matrix estimators bVw
and ~Vw involve only the data from the study participants. This
weighted analysis fully accounts for unequal probabilities of inclu-
sion among study participants and thus produces unbiased esti-
mation of the regression parameters. The correlations among
related individuals are not modeled parametrically but rather are
adjusted for empirically in the variance estimation. Because
different participants receive different weights in the estimating
function, the weighted estimator is statistically inefficient. To
improve statistical efficiency (at the cost of inducing some bias),
we can trim the extreme values ofwki. We might also trim the pair-
wise selection probabilities pkilj in the denominator of the last term
of bB or ~B so as to improve stability.
A statistically more efficient and computationally simpler
approach is to ignore unequal inclusion probabilities and perform
er 4, 2014
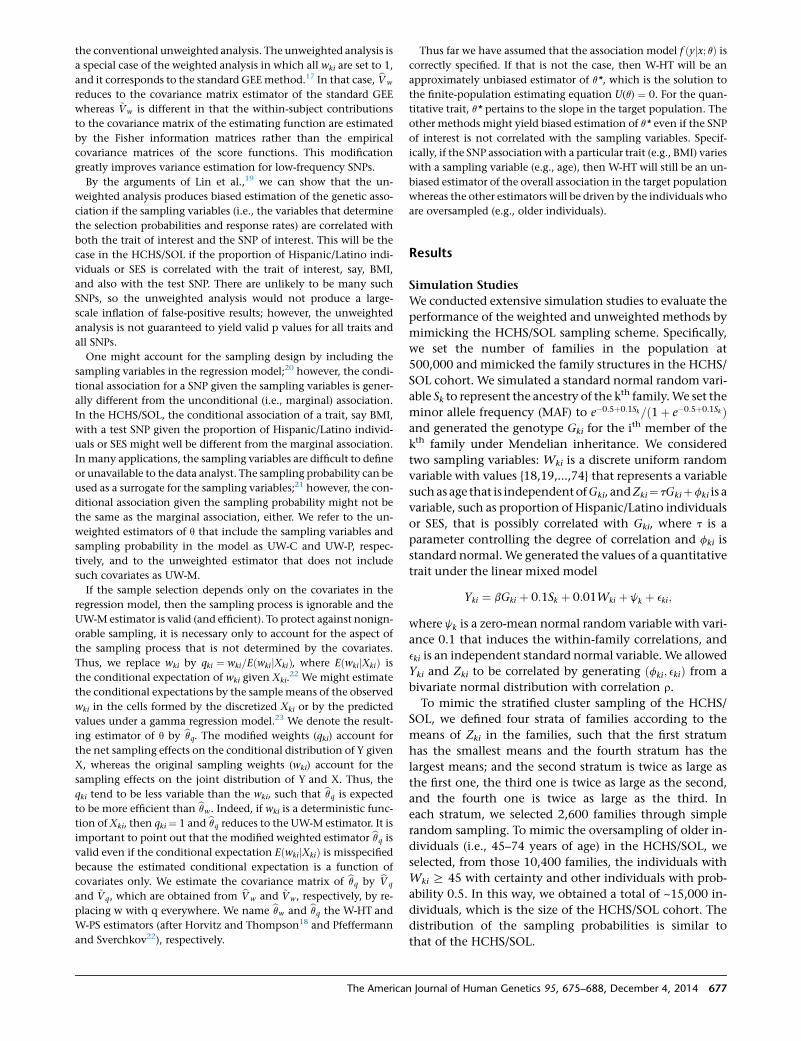
the conventional unweighted analysis. The unweighted analysis is
a special case of the weighted analysis in which all wki are set to 1,
and it corresponds to the standard GEEmethod.17 In that case, bVw
reduces to the covariance matrix estimator of the standard GEE
whereas ~Vw is different in that the within-subject contributions
to the covariance matrix of the estimating function are estimated
by the Fisher information matrices rather than the empirical
covariance matrices of the score functions. This modification
greatly improves variance estimation for low-frequency SNPs.
By the arguments of Lin et al.,19 we can show that the un-
weighted analysis produces biased estimation of the genetic asso-
ciation if the sampling variables (i.e., the variables that determine
the selection probabilities and response rates) are correlated with
both the trait of interest and the SNP of interest. This will be the
case in the HCHS/SOL if the proportion of Hispanic/Latino indi-
viduals or SES is correlated with the trait of interest, say, BMI,
and also with the test SNP. There are unlikely to be many such
SNPs, so the unweighted analysis would not produce a large-
scale inflation of false-positive results; however, the unweighted
analysis is not guaranteed to yield valid p values for all traits and
all SNPs.
One might account for the sampling design by including the
sampling variables in the regression model;20 however, the condi-
tional association for a SNP given the sampling variables is gener-
ally different from the unconditional (i.e., marginal) association.
In the HCHS/SOL, the conditional association of a trait, say BMI,
with a test SNP given the proportion of Hispanic/Latino individ-
uals or SES might well be different from the marginal association.
In many applications, the sampling variables are difficult to define
or unavailable to the data analyst. The sampling probability can be
used as a surrogate for the sampling variables;21 however, the con-
ditional association given the sampling probability might not be
the same as the marginal association, either. We refer to the un-
weighted estimators of q that include the sampling variables and
sampling probability in the model as UW-C and UW-P, respec-
tively, and to the unweighted estimator that does not include
such covariates as UW-M.
If the sample selection depends only on the covariates in the
regression model, then the sampling process is ignorable and the
UW-M estimator is valid (and efficient). To protect against nonign-
orable sampling, it is necessary only to account for the aspect of
the sampling process that is not determined by the covariates.
Thus, we replace wki by qki ¼ wki=EðwkijXkiÞ, where EðwkijXkiÞ is
the conditional expectation of wki given Xki.22 We might estimate
the conditional expectations by the sample means of the observed
wki in the cells formed by the discretized Xki or by the predicted
values under a gamma regression model.23 We denote the result-
ing estimator of q by bqq. The modified weights (qki) account for
the net sampling effects on the conditional distribution of Y given
X, whereas the original sampling weights (wki) account for the
sampling effects on the joint distribution of Y and X. Thus, the
qki tend to be less variable than the wki, such that bqq is expected
to be more efficient than bqw. Indeed, if wki is a deterministic func-
tion ofXki, then qki ¼ 1 and bqq reduces to the UW-M estimator. It is
important to point out that the modified weighted estimator bqq isvalid even if the conditional expectation EðwkijXkiÞ is misspecified
because the estimated conditional expectation is a function of
covariates only. We estimate the covariance matrix of bqq by bVq
and ~Vq, which are obtained from bVw and ~Vw, respectively, by re-
placing w with q everywhere. We name bqw and bqq the W-HT and
W-PS estimators (after Horvitz and Thompson18 and Pfeffermann
and Sverchkov22), respectively.
The American
Thus far we have assumed that the association model f ðyjx; qÞ iscorrectly specified. If that is not the case, then W-HT will be an
approximately unbiased estimator of q*, which is the solution to
the finite-population estimating equation U(q) ¼ 0. For the quan-
titative trait, q* pertains to the slope in the target population. The
other methods might yield biased estimation of q* even if the SNP
of interest is not correlated with the sampling variables. Specif-
ically, if the SNP associationwith a particular trait (e.g., BMI) varies
with a sampling variable (e.g., age), then W-HT will still be an un-
biased estimator of the overall association in the target population
whereas the other estimators will be driven by the individuals who
are oversampled (e.g., older individuals).
Results
Simulation Studies
We conducted extensive simulation studies to evaluate the
performance of the weighted and unweighted methods by
mimicking the HCHS/SOL sampling scheme. Specifically,
we set the number of families in the population at
500,000 and mimicked the family structures in the HCHS/
SOL cohort. We simulated a standard normal random vari-
able Sk to represent the ancestry of the kth family.We set the
minor allele frequency (MAF) to e�0:5þ0:1Sk=ð1þ e�0:5þ0:1SkÞand generated the genotype Gki for the ith member of the
kth family under Mendelian inheritance. We considered
two sampling variables: Wki is a discrete uniform random
variable with values {18,19,...,74} that represents a variable
suchas age that is independent ofGki, andZki¼ tGkiþfki is a
variable, such as proportion of Hispanic/Latino individuals
or SES, that is possibly correlated with Gki, where t is a
parameter controlling the degree of correlation and fki is
standard normal.We generated the values of a quantitative
trait under the linear mixed model
Yki ¼ bGki þ 0:1Sk þ 0:01Wki þ jk þ eki;
where jk is a zero-mean normal random variable with vari-
ance 0.1 that induces the within-family correlations, and
eki is an independent standard normal variable.We allowed
Yki and Zki to be correlated by generating ðfki; ekiÞ from a
bivariate normal distribution with correlation r.
To mimic the stratified cluster sampling of the HCHS/
SOL, we defined four strata of families according to the
means of Zki in the families, such that the first stratum
has the smallest means and the fourth stratum has the
largest means; and the second stratum is twice as large as
the first one, the third one is twice as large as the second,
and the fourth one is twice as large as the third. In
each stratum, we selected 2,600 families through simple
random sampling. To mimic the oversampling of older in-
dividuals (i.e., 45–74 years of age) in the HCHS/SOL, we
selected, from those 10,400 families, the individuals with
Wki R 45 with certainty and other individuals with prob-
ability 0.5. In this way, we obtained a total of ~15,000 in-
dividuals, which is the size of the HCHS/SOL cohort. The
distribution of the sampling probabilities is similar to
that of the HCHS/SOL.
Journal of Human Genetics 95, 675–688, December 4, 2014 677

Figure 1. Simulation Results under theNull HypothesisBias, standard error, mean standard errorestimate, and type I error (divided by thenominal significance level 0.001) forweighted and unweighted methods as afunction of the correlation between thesampling variable and the genotype whenthe correlation between the sampling vari-able and the trait of interest is 0.2 (leftside) and as a function of the correlationbetween the sampling variable and the traitof interest when the correlation betweenthe sampling variable and the genotype is0.2 (right side). The estimates of the biasand type I error are indistinguishable be-tween W-HT and W-PS.
We considered the two weighted estimators, W-HT and
W-PS, and the three unweighted estimators, UW-M,
UW-C, and UW-P. For the first three methods, we fit the
(marginal) linear regression model with covariates Gki, Sk,
and Wki. For W-PS, we estimated qki by the sample mean
of wki in the genotype 3 age (18–44 versus 45–74 years)
category. For UW-C, we added Zki to the model; for
UW-P, we added a cubic function of log(pki). We varied
the value of r, which represents the correlation between
678 The American Journal of Human Genetics 95, 675–688, December 4, 2014
the sampling variable Z and the trait
of interest Y, and we also varied the
value of t to create a range of correla-
tion between the sampling variable Z
and the genotype G.
The results under the null hypothe-
sis (H0 : b ¼ 0) and the alternative hy-
pothesis (H1 : b ¼ 0.06) are displayed
in Figures 1 and 2, respectively. The
W-HT and W-PS estimators are virtu-
ally unbiased, and their variance esti-
mators are very accurate. Thus, the
corresponding association tests have
correct control of the type I error.
The three unweighted estimators
(UW-M, UW-C, and UW-P) are biased
and the corresponding association
tests have inflated type I error unless
the sampling is independent of the ge-
notype or the trait. The reasons for the
bias depend on the estimator: UW-M
is biased when the sampling process
is nonignorable; UW-C and UW-P are
biased because the conditional associ-
ations are different from the marginal
association. The standard errors of the
unweighted estimators are consider-
ably lower than those of the weighted
estimators, such that the unweighted
estimators tend to be more powerful
than the weighted estimators; how-
ever, they can be less powerful when the estimators are
biased substantially toward 0. The W-PS estimator has
smaller standard error than the W-HT estimator and is
thus more powerful than the latter.
To investigate the consequences of model misspecifica-
tion, we generated the quantitative trait values under the
following model
Yki ¼ bGki þ 0:1Sk þ 0:01Wki þ gGkiðWki � 45Þ þ jk þ eki;
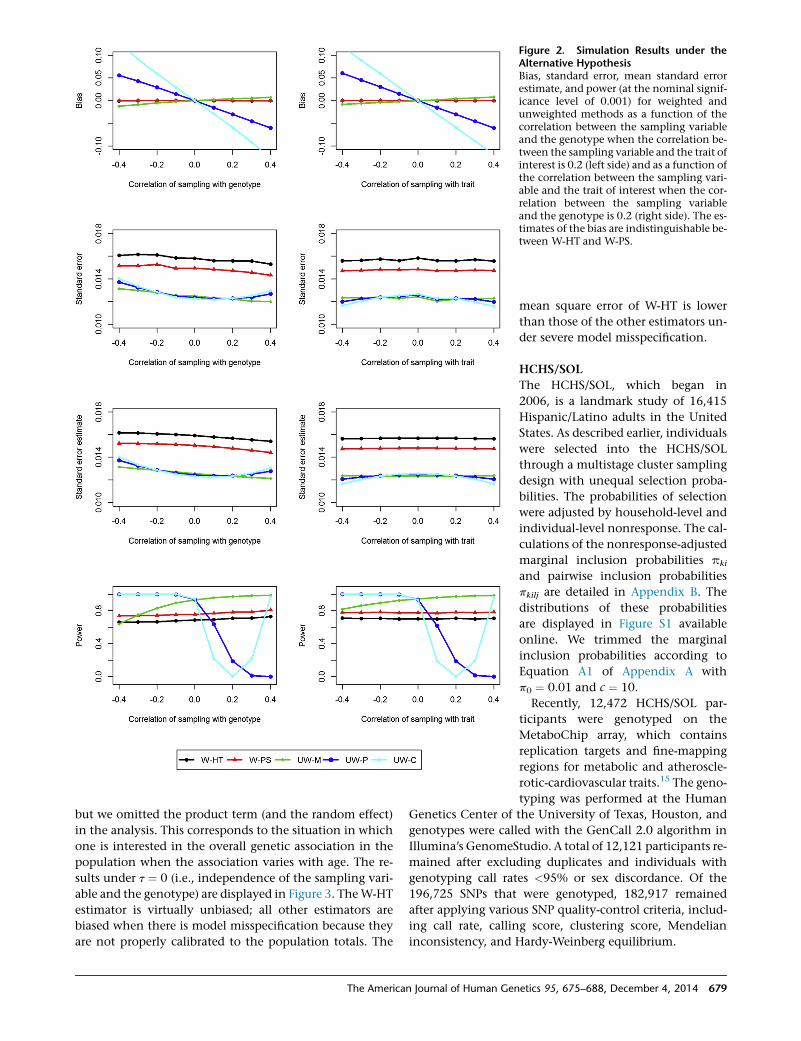
Figure 2. Simulation Results under theAlternative HypothesisBias, standard error, mean standard errorestimate, and power (at the nominal signif-icance level of 0.001) for weighted andunweighted methods as a function of thecorrelation between the sampling variableand the genotype when the correlation be-tween the sampling variable and the trait ofinterest is 0.2 (left side) and as a function ofthe correlation between the sampling vari-able and the trait of interest when the cor-relation between the sampling variableand the genotype is 0.2 (right side). The es-timates of the bias are indistinguishable be-tween W-HT and W-PS.
but we omitted the product term (and the random effect)
in the analysis. This corresponds to the situation in which
one is interested in the overall genetic association in the
population when the association varies with age. The re-
sults under t ¼ 0 (i.e., independence of the sampling vari-
able and the genotype) are displayed in Figure 3. TheW-HT
estimator is virtually unbiased; all other estimators are
biased when there is model misspecification because they
are not properly calibrated to the population totals. The
The American Journal of Human Gen
mean square error of W-HT is lower
than those of the other estimators un-
der severe model misspecification.
HCHS/SOL
The HCHS/SOL, which began in
2006, is a landmark study of 16,415
Hispanic/Latino adults in the United
States. As described earlier, individuals
were selected into the HCHS/SOL
through a multistage cluster sampling
design with unequal selection proba-
bilities. The probabilities of selection
were adjusted by household-level and
individual-level nonresponse. The cal-
culations of the nonresponse-adjusted
marginal inclusion probabilities pki
and pairwise inclusion probabilities
pkilj are detailed in Appendix B. The
distributions of these probabilities
are displayed in Figure S1 available
online. We trimmed the marginal
inclusion probabilities according to
Equation A1 of Appendix A with
p0 ¼ 0.01 and c ¼ 10.
Recently, 12,472 HCHS/SOL par-
ticipants were genotyped on the
MetaboChip array, which contains
replication targets and fine-mapping
regions for metabolic and atheroscle-
rotic-cardiovascular traits.15 The geno-
typing was performed at the Human
Genetics Center of the University of Texas, Houston, and
genotypes were called with the GenCall 2.0 algorithm in
Illumina’s GenomeStudio. A total of 12,121 participants re-
mained after excluding duplicates and individuals with
genotyping call rates <95% or sex discordance. Of the
196,725 SNPs that were genotyped, 182,917 remained
after applying various SNP quality-control criteria, includ-
ing call rate, calling score, clustering score, Mendelian
inconsistency, and Hardy-Weinberg equilibrium.
etics 95, 675–688, December 4, 2014 679

Figure 3. Simulation Results under Mis-specified ModelsBias, standard error, and mean square errorfor weighted and unweighted methods as afunction of the interaction between the ge-notype and age when the correlation be-tween the sampling variable and the traitof interest is 0.2 (left side) and as a functionof the correlation between the samplingvariable and the trait of interest when theinteraction between the genotype and ageis 0.005 (right side). The estimates of thebias are indistinguishable among W-PS,UW-M, UW-C, and UW-P, and the esti-mates of themean square error are indistin-guishable amongUW-M, UW-C, andUW-P.
In order to accommodate the relatives in the HCHS/SOL
when calculating the PCs, we created 20 eigenvectors of ge-
notypes by using six of the 1000 Genomes reference sam-
ples (CEU, YRI, MXL, PUR, CLM, and CHB) with a panel of
44,883 SNPs in low linkage disequilibrium (LD) and then
projected the HCHS/SOL sample along each of the 20
eigenvectors. We performed an IBD analysis of the
12,121 HCHS/SOL participants by using a subset of
13,290 MetaboChip SNPs with MAF > 5% and pairwise
r2 % 0.1 within any 50-SNP window. We identified pairs
of individuals with 0:35 < bp < 0:98 as first-degree relatives
and 0:2 < bp%0:35 as second-degree relatives, where bp is
the estimated IBD proportion. After connecting house-
holds who shared first-degree relatives, we obtained
4,969, 1,930, 555, 206, 62, 34, and 35 extended families
of sizes 1, 2, 3, 4, 5, 6, and R7, respectively. With sec-
ond-degree relatives added, the corresponding numbers
are 4,856, 1,865, 554, 219, 68, 37, and 42. We decided to
680 The American Journal of Human Genetics 95, 675–688, December 4, 2014
account for relatedness according to
the first-degree relatedness and disre-
gard the second degree and beyond
because the latter did not unduly in-
fluence the test statistics.
In order to minimize the influence
of the densely fine-mapped regions
of the MetaboChip on our quantile-
quantile plots and other comparisons,
we pruned the set of 182,917 SNPs
that passed our quality control. Specif-
ically, we used a window of 50 base
pairs and an incremental step of five
SNPs in PLINK24 to prune any SNP in
strong pairwise LD (r2 > 0.8) with
another SNP in a given window. This
process excluded an additional
59,653 SNPs and resulted in a final
set of 123,264 SNPs. Of those SNPs,
there are 91,019 with MAF > 1%,
19,976 with MAF between 0.1% and
1%, and 5,131 with MAF between
0.01% and 0.1%.
We used the weighted estimators, W-HT and W-PS, and
unweighted estimators, UW-M, UW-C, and UW-P, to assess
SNP associations with 16 cardiovascular traits.We included
age, gender, the top ten PCs, field center, and (self-re-
ported) Hispanic/Latino background (Dominican Repub-
lican, Central American, Cuban, Mexican, Puerto Rican,
South American, others) as covariates. For UW-C, we added
the stratification variables. For UW-P, we added a cubic
spline of logpki with two interior knots (at the 33th and
67th percentiles). For W-PS, we estimated qki under the
gamma regression model with the log link function
that includes age, age-square, gender, field center, and
Hispanic/Latino background, as well as all product terms
with p values < 0.1. We winsorised qki to the 95th percen-
tile. The UW-C results are almost identical to those of
UW-P (Figure S2) and thus will not be shown.
Figure 4 compares the performance of the robust and
model-based variance estimators in the association tests
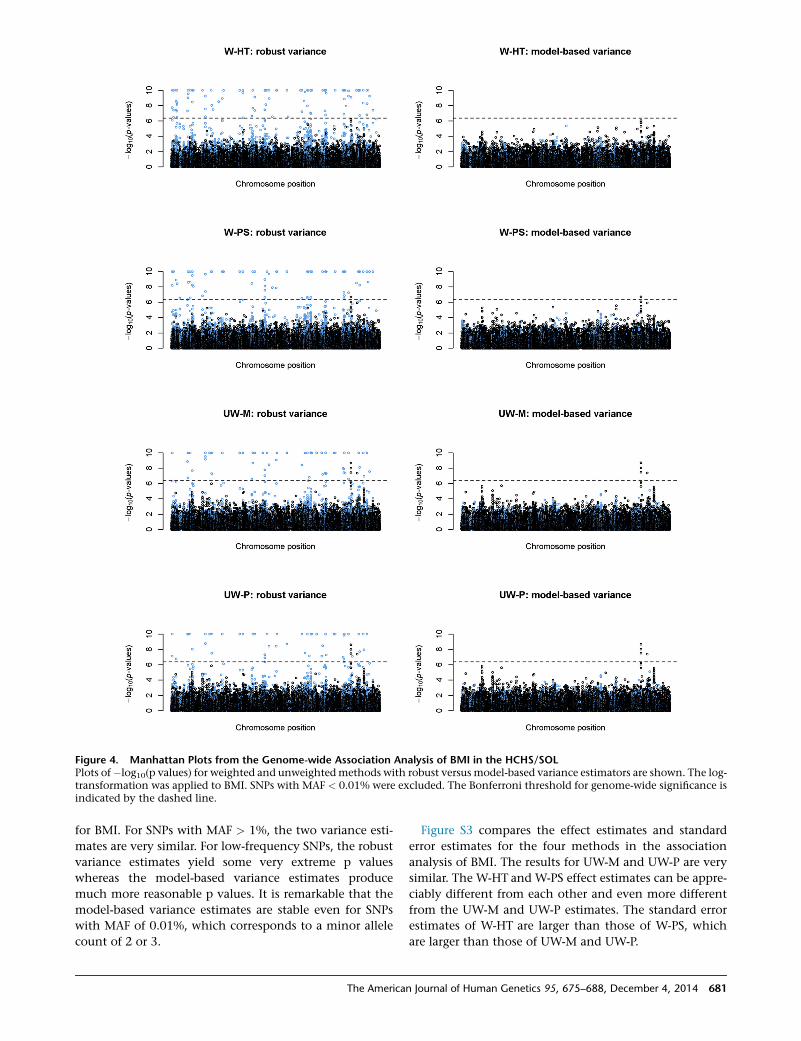
Figure 4. Manhattan Plots from the Genome-wide Association Analysis of BMI in the HCHS/SOLPlots of�log10(p values) for weighted and unweightedmethods with robust versus model-based variance estimators are shown. The log-transformation was applied to BMI. SNPs with MAF < 0.01% were excluded. The Bonferroni threshold for genome-wide significance isindicated by the dashed line.
for BMI. For SNPs with MAF > 1%, the two variance esti-
mates are very similar. For low-frequency SNPs, the robust
variance estimates yield some very extreme p values
whereas the model-based variance estimates produce
much more reasonable p values. It is remarkable that the
model-based variance estimates are stable even for SNPs
with MAF of 0.01%, which corresponds to a minor allele
count of 2 or 3.
The American
Figure S3 compares the effect estimates and standard
error estimates for the four methods in the association
analysis of BMI. The results for UW-M and UW-P are very
similar. The W-HT and W-PS effect estimates can be appre-
ciably different from each other and even more different
from the UW-M and UW-P estimates. The standard error
estimates of W-HT are larger than those of W-PS, which
are larger than those of UW-M and UW-P.
Journal of Human Genetics 95, 675–688, December 4, 2014 681
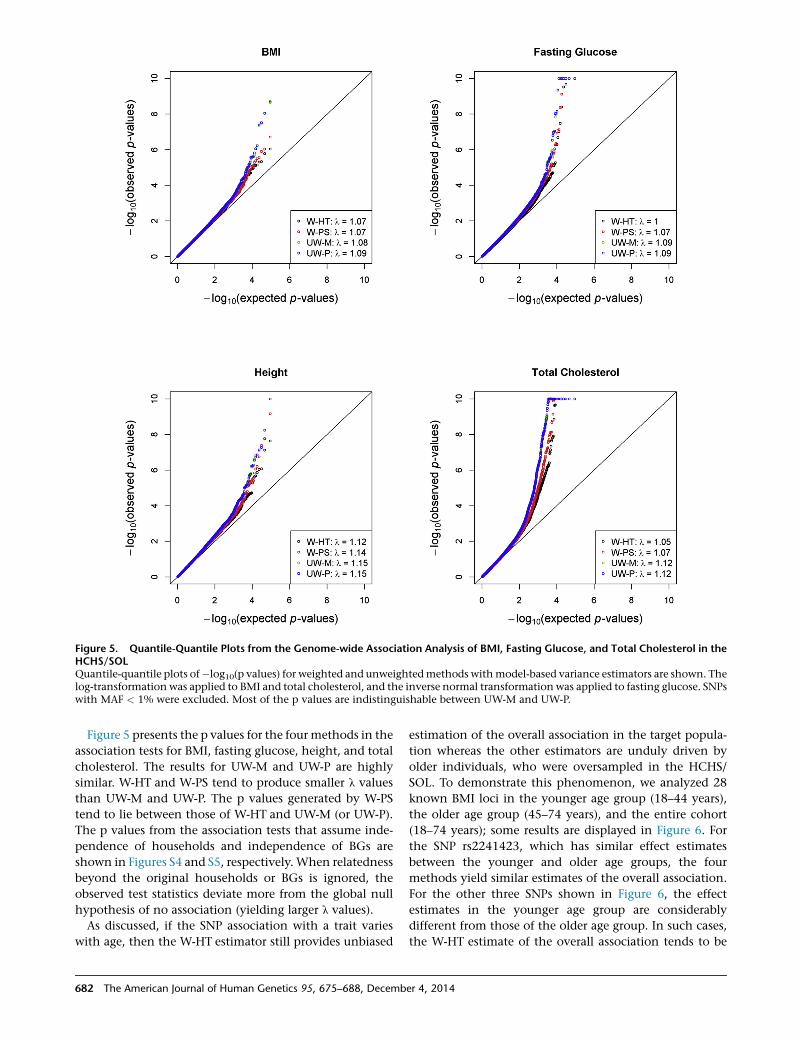
Figure 5. Quantile-Quantile Plots from the Genome-wide Association Analysis of BMI, Fasting Glucose, and Total Cholesterol in theHCHS/SOLQuantile-quantile plots of�log10(p values) for weighted and unweightedmethods withmodel-based variance estimators are shown. Thelog-transformation was applied to BMI and total cholesterol, and the inverse normal transformation was applied to fasting glucose. SNPswith MAF < 1% were excluded. Most of the p values are indistinguishable between UW-M and UW-P.
Figure 5 presents the p values for the four methods in the
association tests for BMI, fasting glucose, height, and total
cholesterol. The results for UW-M and UW-P are highly
similar. W-HT and W-PS tend to produce smaller l values
than UW-M and UW-P. The p values generated by W-PS
tend to lie between those of W-HT and UW-M (or UW-P).
The p values from the association tests that assume inde-
pendence of households and independence of BGs are
shown in Figures S4 and S5, respectively.When relatedness
beyond the original households or BGs is ignored, the
observed test statistics deviate more from the global null
hypothesis of no association (yielding larger l values).
As discussed, if the SNP association with a trait varies
with age, then the W-HT estimator still provides unbiased
682 The American Journal of Human Genetics 95, 675–688, Decemb
estimation of the overall association in the target popula-
tion whereas the other estimators are unduly driven by
older individuals, who were oversampled in the HCHS/
SOL. To demonstrate this phenomenon, we analyzed 28
known BMI loci in the younger age group (18–44 years),
the older age group (45–74 years), and the entire cohort
(18–74 years); some results are displayed in Figure 6. For
the SNP rs2241423, which has similar effect estimates
between the younger and older age groups, the four
methods yield similar estimates of the overall association.
For the other three SNPs shown in Figure 6, the effect
estimates in the younger age group are considerably
different from those of the older age group. In such cases,
the W-HT estimate of the overall association tends to be
er 4, 2014
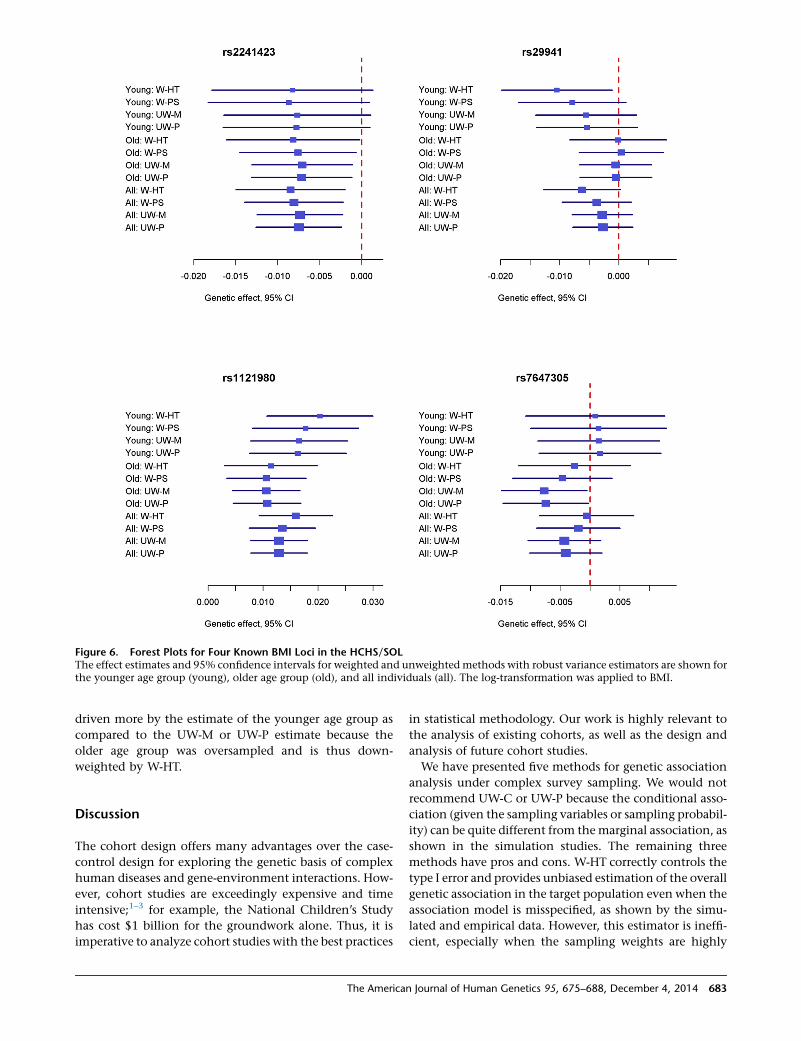
Figure 6. Forest Plots for Four Known BMI Loci in the HCHS/SOLThe effect estimates and 95% confidence intervals for weighted and unweighted methods with robust variance estimators are shown forthe younger age group (young), older age group (old), and all individuals (all). The log-transformation was applied to BMI.
driven more by the estimate of the younger age group as
compared to the UW-M or UW-P estimate because the
older age group was oversampled and is thus down-
weighted by W-HT.
Discussion
The cohort design offers many advantages over the case-
control design for exploring the genetic basis of complex
human diseases and gene-environment interactions. How-
ever, cohort studies are exceedingly expensive and time
intensive;1–3 for example, the National Children’s Study
has cost $1 billion for the groundwork alone. Thus, it is
imperative to analyze cohort studies with the best practices
The American
in statistical methodology. Our work is highly relevant to
the analysis of existing cohorts, as well as the design and
analysis of future cohort studies.
We have presented five methods for genetic association
analysis under complex survey sampling. We would not
recommend UW-C or UW-P because the conditional asso-
ciation (given the sampling variables or sampling probabil-
ity) can be quite different from themarginal association, as
shown in the simulation studies. The remaining three
methods have pros and cons. W-HT correctly controls the
type I error and provides unbiased estimation of the overall
genetic association in the target population even when the
association model is misspecified, as shown by the simu-
lated and empirical data. However, this estimator is ineffi-
cient, especially when the sampling weights are highly
Journal of Human Genetics 95, 675–688, December 4, 2014 683

variable. W-PS also correctly controls the type I error and
tends to be more powerful than W-HT, but it does not pro-
vide unbiased estimation of the association in the target
population under misspecified models. UW-M has the
highest power but yields inflated type I error when the
sampling is correlated with both the trait of interest and
the test SNP. Thus, we recommend UW-M in the discovery
stage, especially when there is a plan to confirm significant
findings; W-PS should be used if proper control of the type
I error is paramount; W-HT should be used if the primary
interest lies in unbiased estimation of the association in
the target population.
There are two major approaches to handling within-
family correlations: mixed and marginal models. The
former approach characterizes the dependence of in-
dividuals by normal random effects and provides
efficient maximum likelihood estimation; the latter
formulates the marginal distribution of each individual
and accounts for the dependence empirically in the
variance estimation. We adopted the latter approach
because it does not require modeling the dependence
structures and can easily handle any type of trait. For
simplicity, we used the independence working correlation
matrix. It is possible to improve efficiency by incorpo-
rating the kinship relationships into the working correla-
tion matrix.25
The prevailing approach to analysis of survey data is
finite-population inference, under which the target popu-
lation is considered fixed and the only randomness stems
from the sampling of individuals from the target popula-
tion, such that the variance of any estimator would be
zero if all individuals in the target population were
selected.20 We adopted the super-population approach,
under which the target population is considered a random
sample from an infinite population and the variance esti-
mation accounts for the variabilities induced by the
sampling of individuals from the target population as
well as the sampling of the target population from the in-
finite population.20,26 For association analysis, super-pop-
ulation inference is more sensible because we are interested
in statistical associations rather than finite-population
quantities.
Existing survey regression methodology cannot be
applied to the HCHS/SOL because endogamous mating in-
duces relatedness of participants among the primary sam-
pling units. To tackle this challenge, we created extended
families by connecting the households who shared first-
degree relatives, and we accounted for the sampling design
in the variance estimation by using pairwise inclusion
probabilities. With the super-population approach, pair-
wise inclusion probabilities appear only in the last terms
of bB and ~B, for individuals from different families. These
probabilities are determined by sampling fractions and
response rates (see Appendix B). The last terms of bB and~B are small compared to the overall values of bB and ~B
and thus can be omitted when pairwise inclusion probabil-
ities are not available.
684 The American Journal of Human Genetics 95, 675–688, Decemb
Our work provides several important contributions.
First, we developed two weighted estimators that properly
account for complex sampling designs and intricate pat-
terns of relatedness. Second, we compared, both theoreti-
cally and empirically, the performance of weighted and
unweighted estimators in the context of genetic associa-
tion analysis and offered practical recommendations.
Third, we provided a modification to the robust variance
estimator that substantially improves the performance of
both weighted and unweighted methods for low-fre-
quency SNPs. Fourth, we developed a software program
that implements all the methods.
Although Hispanics represent one out of every six peo-
ple in the U.S., our knowledge about Hispanic health has
been limited. The HCHS/SOL seeks to investigate many
diseases and conditions of particular importance to the
Hispanic/Latino community in the U.S. and to under-
stand risk factors that could lead to improved preven-
tion/intervention strategies in all communities. Several
working groups have recently formed to analyze
MetaboChip and GWAS data in the HCHS/SOL. Each
group has focused on a particular type of trait (e.g.,
anthropometry, cardiovascular disease, diabetes, lipid,
lung function). These groups have adopted our methods
and software, and their results will be communicated in
future manuscripts.
Our methods are also useful to other complex surveys,
such as those mentioned in the Introduction,4–8 all of
which involve multistage cluster sampling with unequal
probabilities. In the MONICA Augsburg Surveys, three
study populations were recruited in 1984–1985 (subjects
aged 25–64 years), 1989–1990 (subjects aged 25–74 years),
and 1994–1995 (subjects aged 25–74 years) by a two-stage
cluster sampling, with random sampling for the city of
Augsburg and a random selection of 16 communities by
community size in the two adjacent counties.5 NHANES
is a four-stage, national area probability survey with fixed
sample-size targets for sampling domains defined by race
and Hispanic origin, sex, age, and low-income status.6
Add Health is a nationally representative longitudinal
study of more than 20,000 adolescents in the United States
in 1994–1995 who have been followed for 15 years into
adulthood, and the design included oversamples of more
than 3,000 pairs of individuals with varying genetic resem-
blance, including monozygotic twins, dizygotic twins, full
siblings, half siblings, and unrelated siblings who were
raised in the same household.7 The NHANES and Add
Health data, along with design information and sample
weights, are publicly available.
Our article investigates the implications of complex
survey sampling in genetic association analysis. There is
a growing body of literature on the related issue of
extreme-trait sampling.19,27–33 With extreme-trait sam-
pling, the variance formulas for weighted estimators take
simple forms, and efficient likelihood-based methods are
available. With complex survey sampling, the variance
estimation for weighted estimators is delicate, and the
er 4, 2014
construction of valid and efficient estimators remains an
open problem.
Appendix A: Theoretical Properties of Weighted
Estimators
For k¼ 1,..., K and i¼ 1,..., Nk, let xki indicate, by the values
1 versus 0, whether the ith individual of the kth family is
included in the study, and let pki be the corresponding in-
clusion probability. Then the weighted estimating func-
tion can be rewritten as
bU ðqÞ ¼XKk¼1
XNk
i¼1
xki
pki
UkiðqÞ:
Clearly,
bU ðqÞ ¼XKk¼1
XNk
i¼1
UkiðqÞ þXKk¼1
XNk
i¼1
xki � pki
pki
UkiðqÞ:
The two terms on the right side of the above equation are
uncorrelated. By the standard central limit theorem, the
first term is approximately zero-mean normal with covari-
ance matrix
B1ðqÞ ¼XKk¼1
XNk
i¼1
XNk
j¼1
UkiðqÞU 0kjðqÞ:
By the finite-population central limit theorem,34–36 the
second term is approximately zero-mean normal with
covariance matrix
B2ðqÞ ¼XKk¼1
XNk
i¼1
XKl¼1
XNl
j¼1
pkilj � pkiplj
pkiplj
UkiðqÞU 0ljðqÞ;
where pkilj is the probability that the ith member of the kth
family and the jth member of the lth family are both
included. The covariance matrix of bU ðqÞ is the sum of
B1(q) and B2(q), which is
BðqÞ ¼XKk¼1
XNk
i¼1
XNk
j¼1
pkij
pkipkj
UkiðqÞU 0kjðqÞ
þXKk¼1
XNk
i¼1
XKlsk;l¼1
XNl
j¼1
pkilj � pkiplj
pkiplj
UkiðqÞU 0ljðqÞ;
where pkij is the probability that the ith and jth members of
the kth family are both included.
A Horvitz-Thompson estimator of B(q) is
bBðqÞ ¼ XKk¼1
XNk
i¼1
XNk
j¼1
xkixkj
pkipkj
UkiðqÞU 0kjðqÞ
þXKk¼1
XNk
i¼1
XKlsk;l¼1
XNl
j¼1
xkixlj�pkilj � pkiplj
�pkiljpkiplj
UkiðqÞU 0ljðqÞ:
If pkilj ¼ pkiplj, then the second term on the right side of the
above equation is zero, such that pairwise selection proba-
bilities are not needed.
The American
By the Taylor series expansion, bqw is approximately
normal with mean q and covariance matrix bVw ¼bA�1ðbqwÞbBðbqwÞbA�1ðbqwÞ, where
bAðqÞ ¼ XKk¼1
XNk
i¼1
xki
pki
vUkiðqÞvq
:
If the inclusion probabilities are all equal to 1, thenbVw reduces to the usual covariance matrix estimator
for GEE.17 Replacing UkiðqÞU 0kiðqÞ in bBðqÞ by �vUkiðqÞ=vq
yields
~BðqÞ ¼ �XKk¼1
XNk
i¼1
xki
p2ki
vUkiðqÞvq
þXKk¼1
XNk
i¼1
XNk
jsi;j¼1
xkixkj
pkipkj
UkiðqÞU 0kjðqÞ
þXKk¼1
XNk
i¼1
XKlsk;l¼1
XNl
j¼1
xkixlj�pkilj � pkiplj
�pkiljpkiplj
UkiðqÞU 0ljðqÞ:
The corresponding covariance matrix estimator of bbw is
denoted by ~Vw. The estimators bVw and ~Vw are asymptoti-
cally equivalent (under correctly specified models), but
the latter estimator is more stable and more accurate for
low-frequency SNPs. Under misspecified models, bVw con-
tinues to provide valid covariance estimation for bqwwhereas ~Vw might not.
Under the linear regression model
Yki ¼ q0Xki þ eki;
where eki � Nð0; s2Þ, we have
UkiðqÞ ¼�1�s2�ðYki � q0XkiÞXki;
and
vUkiðqÞ�vq ¼ ��
1�s2�XkiX
0ki;
where s2 is estimated by
bs2 ¼XKk¼1
XNk
i¼1
xki
pki
�Yki � bq0Xki
�2,XK
k¼1
XNk
i¼1
xki
pki
:
Under the logistic regression model
logitfPrðYki ¼ 1Þg ¼ q0Xki;
we have
UkiðqÞ ¼�Yki � eq
0Xki
1þ eq0Xki
�Xki;
and
vUkiðqÞ�vq ¼ � eq
0Xki
ð1þ eq0XkiÞ2
XkiX0ki:
Similar expressions are available for the proportional haz-
ards model with age-at-onset data.26
To improve efficiency of estimation (at the cost of
inducing some bias), we trim the marginal inclusion prob-
abilities according to the following formula
Journal of Human Genetics 95, 675–688, December 4, 2014 685

p�ki ¼
�p0 þ ðpki � p0Þ=c0 if pki < p0;pki otherwise;
(Equation A1)
where p0 and c0 are constants. Likewise, we trim the joint
inclusion probabilities as follows
p�kilj ¼
p�kip
�lj
pkiplj
pkilj:
The joint probabilities appear only in the last terms of bBand ~B. With our trimming strategy,
p�kilj � p�
kip�lj
p�kilj
¼ pkilj � pkiplj
pkilj
:
Thus, it is not necessary to explicitly trim the joint
probabilities provided that both the trimmed and
untrimmed versions of the marginal probabilities are
available.
Appendix B: Calculating Inclusion Probabilities for
the HCHS/SOL
Suppose that there are a total of G BGs in a given field cen-
ter. For g ¼ 1,..., G, let Kg denote the number of households
in the gth BG. For g,h ¼ 1,..., G and k,l ¼ 1,..., Kg, we define
the following selection probabilities:
pg ¼ probability of selecting the gth BG;
pgh ¼ joint probability of selecting the gth and hth BGs;
pk j g ¼ probability of selecting the kth household from
the gth BG;
pkl j g ¼ joint probability of selecting the kth and
lth households from the gth BG:
In the first stage of sampling, BGs were selected by strati-
fied simple random sampling without replacement
(SRSWOR). Suppose that there are S strata. For s ¼ 1,..., S,
let Ns denote the total number of BGs in the sth stratum,
and ns the corresponding number of BGs that are selected.
Then pg ¼ ns / Ns if the gth BG lies in the sth stratum. In
addition,
pgh ¼
8>><>>:ns
Ns
ns � 1
Ns � 1
if the gth and hth BGs lie in the sth
stratum;
ns
Ns
nt
Nt
if the gth and hth BGs lie in the sth
and t th strata; sst:
In the second stage, the households were selected by strat-
ified SRSWOR within BGs. Suppose that there are T strata
in the gth BG. For t ¼ 1,..., T, let Mt denote the
total number of households in stratum t, and mt the
corresponding number of households that are selected.
686 The American Journal of Human Genetics 95, 675–688, Decemb
Then pkjg ¼ mt=Mt if the kth household lies in the tth stra-
tum. In addition,
pkl j g ¼
8>><>>:ms
Ms
ms � 1
Ms � 1
if the kth and lth households lie inthe sth stratum;
ms
Ms
mt
Mt
if the kth and lth households lie in
the sth and t th strata; sst:
After sampling at the BG and household levels, indepen-
dent Bernoulli subsampling was used to oversample indi-
viduals 45–74years of age. Twomethodswere used:method
1 (used during initial fieldwork) retained with certainty
eligible households that contained only 45- to 74-year-old
Hispanic/Latino residents and randomly selected all other
households;method 2 (used during later fieldwork) divided
each household into one or two age subclusters (18–44
versus 45–74 years of age) and selected the older subclusters
with certainty and the younger subclusters with lower
probabilities. Let pðHBÞgk denote the probability of selecting
the kth household of the gth BG under method 1, and let
pðSBÞujgk denote the probability of selecting the uth subcluster
of the kth household in the gth BG under method 2.
Adjustments for nonresponse were made at the house-
hold and individual levels. The household-level adjust-
ments were determined by jointly grouping the selected
households by center, BG stratum, and household list
source (Hispanic surname or not); the individual-level
adjustments were determined by a joint grouping of each
center’s selected individuals by age group, gender, and
Hispanic/Latino background to form adjustment cells.
Let rgk denote the household-level response rate for the
kth household of the gth BG. For method 1, let pgki be the
individual-level response rate for the ith individual
belonging to the kth household of the gth BG; for method
2, let pgkui be the individual-level response rate for the ith
individual belonging to the uth subcluster of the kth house-
hold of the gth BG.
The overall inclusion probabilities are determined by the
two-stage stratified SRSWOR and the third-stage Bernoulli
subsampling, as well as the household- and individual-
level nonresponse. Under method 1, the inclusion proba-
bility for the ith individual belonging to the kth household
of the gth BG is pgpkjgpðHBÞgk rgkpgki: Under method 2, the
inclusion probability for the ith individual belonging to
the uth subcluster of the kth household of the gth BG is
pgpkjgpðSBÞujgk rgkpgkui.
The joint probability of inclusion for a pair of individuals
depends on which Bernoulli subsampling method is
applied to each member of the pair. Specifically, the joint
probability for including the ith individual belonging to
the kth household of the gth BG under method 1 and the
jth individual belonging to the vth subcluster of the lth
household of the hth BG under method 2 is
(pgpkl j gp
ðHBÞgk p
ðSBÞv j glrgkrglpgkipglvj if g ¼ h;
pghpk j gpl jhpðHBÞgk p
ðSBÞv jhlrgkrhlpgkiphlvj if gsh:
er 4, 2014

Under method 1, the joint probability for including the ith
individual belonging to the kth household of the gth BG
and the jth individual belonging to the lth household of
the hth BG is8><>:pgpk j gp
ðHBÞgk rgkpgkipgkj if g ¼ h and k ¼ l;
pgpkl j gpðHBÞgk p
ðHBÞgl rgkrglpgkipglj if g ¼ h but ksl;
pghpk j gpl jhpðHBÞgk p
ðHBÞhl rgkrhlpgkiphlj if gsh:
Under method 2, the joint probability for including the ith
individual belonging to the uth subcluster of the kth house-
hold of the gth BG and the jth individual belonging to the
vth subcluster of the lth household of the hth BG is8>>>><>>>>:pgpk j gp
ðSBÞu j gkrgkpgkuipgkuj if g ¼ h; k ¼ l and u ¼ v;
pgpk j gpðSBÞu j gkp
ðSBÞv j gkrgkpgkuipgkvj if g ¼ h; k ¼ l but usv;
pgpkl j gpðSBÞu j gkp
ðSBÞv j glrgkrglpgkuipglvj if g ¼ h but ksl;
pghpk j gpl jhpðSBÞu j gkp
ðSBÞv jhlrgkrhlpgkuiphlvj if gsh:
Supplemental Data
Supplemental Data include five figures and can be found with this
article online at http://dx.doi.org/10.1016/j.ajhg.2014.11.005.
Acknowledgments
This work was supported by NIH awards R01CA082659 (D.-Y.L.,
R.T., D.Z.), R37GM047845 (D.-Y.L., D.Z.), and U01HG004803
(D.-Y.L., R.T., L.F.-R., M.G., K.E.N., G.H.). The authors thank the
staff and participants of the HCHS/SOL for their important contri-
butions. The HCHS/SOL was carried out as a collaborative study
supported by contracts from the National Heart, Lung, and Blood
Institute (NHLBI) to the University of North Carolina (N01-
HC65233), University of Miami (N01-HC65234), Albert Einstein
College of Medicine (N01-HC65235), Northwestern University
(N01-HC65236), and San Diego State University (N01-
HC65237). The following Institutes/Centers/Offices contribute
to the HCHS/SOL through a transfer of funds to the NHLBI:
National Institute on Minority Health and Health Disparities, Na-
tional Institute on Deafness andOther Communication Disorders,
National Institute of Dental and Craniofacial Research, National
Institute of Diabetes and Digestive and Kidney Diseases, National
Institute of Neurological Disorders and Stroke, and NIH Institu-
tion-Office of Dietary Supplements.
Received: September 22, 2014
Accepted: November 11, 2014
Published: December 4, 2014
Web Resources
The URLs for data presented herein are as follows:
Add Health, http://www.cpc.unc.edu/projects/addhealth
NHANES, http://www.cdc.gov/nchs/nhanes.htm
Online Mendelian Inheritance in Man (OMIM), http://www.
omim.org/
SUGEN, http://dlin.web.unc.edu/software/SUGEN/
The American
References
1. Collins, F.S. (2004). The case for a US prospective cohort study
of genes and environment. Nature 429, 475–477.
2. Manolio, T.A., Bailey-Wilson, J.E., and Collins, F.S. (2006).
Genes, environment and the value of prospective cohort
studies. Nat. Rev. Genet. 7, 812–820.
3. Manolio, T.A. (2009). Cohort studies and the genetics of com-
plex disease. Nat. Genet. 41, 5–6.
4. Higgins, M., Province, M., Heiss, G., Eckfeldt, J., Ellison, R.C.,
Folsom, A.R., Rao, D.C., Sprafka, J.M., andWilliams, R. (1996).
NHLBI Family Heart Study: objectives and design. Am. J.
Epidemiol. 143, 1219–1228.
5. Lowel, H., Doring, A., Schneider, A., Heier, M., Thorand, B.,
and Meisinger, C.; MONICA/KORA Study Group (2005). The
MONICA Augsburg surveys—basis for prospective cohort
studies. Gesundheitswesen 67 (1), S13–S18.
6. Johnson, C.L., Dohrmann, S.M., Burt, V.L., and Mohadjer,
L.K. (2014). National Health and Nutrition Examination
Survey: Sample Design, 2011-2014. Vital Health Stat. 2 162,
1–33.
7. Harris, K.M., Halpern, C.T., Haberstick, B.C., and Smolen, A.
(2013). The National Longitudinal Study of Adolescent Health
(Add Health) sibling pairs data. Twin Res. Hum. Genet. 16,
391–398.
8. Guttmacher, A.E., Hirschfeld, S., and Collins, F.S. (2013). The
National Children’s Study—a proposed plan. N. Engl. J. Med.
369, 1873–1875.
9. Meisinger, C., Prokisch, H., Gieger, C., Soranzo, N., Mehta, D.,
Rosskopf, D., Lichtner, P., Klopp, N., Stephens, J., Watkins,
N.A., et al. (2009). A genome-wide association study identifies
three loci associated with mean platelet volume. Am. J. Hum.
Genet. 84, 66–71.
10. Fowler, J.H., Settle, J.E., and Christakis, N.A. (2011). Correlated
genotypes in friendship networks. Proc. Natl. Acad. Sci. USA
108, 1993–1997.
11. Matise, T.C., Ambite, J.L., Buyske, S., Carlson, C.S., Cole, S.A.,
Crawford, D.C., Haiman, C.A., Heiss, G., Kooperberg, C.,
Marchand, L.L., et al.; PAGE Study (2011). The Next PAGE in
understanding complex traits: design for the analysis of
Population Architecture Using Genetics and Epidemiology
(PAGE) Study. Am. J. Epidemiol. 174, 849–859.
12. Berndt, S.I., Gustafsson, S., Magi, R., Ganna, A., Wheeler,
E., Feitosa, M.F., Justice, A.E., Monda, K.L., Croteau-
Chonka, D.C., Day, F.R., et al. (2013). Genome-wide meta-
analysis identifies 11 new loci for anthropometric traits
and provides insights into genetic architecture. Nat. Genet.
45, 501–512.
13. Lange, L.A., Hu, Y., Zhang, H., Xue, C., Schmidt, E.M., Tang,
Z.-Z., Bizon, C., Lange, E.M., Smith, J.D., Turner, E.H., et al.;
NHLBI Grand Opportunity Exome Sequencing Project
(2014). Whole-exome sequencing identifies rare and low-
frequency coding variants associated with LDL cholesterol.
Am. J. Hum. Genet. 94, 233–245.
14. Lavange, L.M., Kalsbeek, W.D., Sorlie, P.D., Aviles-Santa, L.M.,
Kaplan, R.C., Barnhart, J., Liu, K., Giachello, A., Lee, D.J.,
Ryan, J., et al. (2010). Sample design and cohort selection in
the Hispanic Community Health Study/Study of Latinos.
Ann. Epidemiol. 20, 642–649.
15. Voight, B.F., Kang, H.M., Ding, J., Palmer, C.D., Sidore, C.,
Chines, P.S., Burtt, N.P., Fuchsberger, C., Li, Y., Erdmann, J.,
et al. (2012). The metabochip, a custom genotyping array
Journal of Human Genetics 95, 675–688, December 4, 2014 687

for genetic studies ofmetabolic, cardiovascular, and anthropo-
metric traits. PLoS Genet. 8, e1002793.
16. Henn, B.M., Gravel, S., Moreno-Estrada, A., Acevedo-Acevedo,
S., and Bustamante, C.D. (2010). Fine-scale population struc-
ture and the era of next-generation sequencing. Hum. Mol.
Genet. 19 (R2), R221–R226.
17. Liang, K.-Y., and Zeger, S.L. (1986). Longitudinal data analysis
using generalized linear models. Biometrika 73, 13–22.
18. Horvitz, D.G., and Thompson, D.J. (1952). A generalization of
sampling without replacement from a finite universe. J. Am.
Stat. Assoc. 47, 663–685.
19. Lin, D.-Y., Zeng, D., and Tang, Z.-Z. (2013). Quantitative trait
analysis in sequencing studies under trait-dependent sam-
pling. Proc. Natl. Acad. Sci. USA 110, 12247–12252.
20. Korn, E.L., and Graubard, B.I. (2011). Analysis of Health
Surveys (New York: John Wiley & Sons).
21. Little, R.J. (2004). To model or not to model? Competing
modes of inference for finite population sampling. J. Am.
Stat. Assoc. 99, 546–556.
22. Pfeffermann, D., and Sverchkov, M. (1999). Parametric and
semi-parametric estimation of regression models fitted to sur-
vey data. Sankhya 61, 166–186.
23. McCullagh, P., and Nelder, J.A. (1989). Generalized Linear
Models, Second Edition (London: Chapman & Hall).
24. Purcell, S., Neale, B., Todd-Brown, K., Thomas, L., Ferreira,
M.A.R., Bender, D., Maller, J., Sklar, P., de Bakker, P.I.W.,
Daly, M.J., and Sham, P.C. (2007). PLINK: a tool set for
whole-genome association and population-based linkage ana-
lyses. Am. J. Hum. Genet. 81, 559–575.
25. Wang, X., Lee, S., Zhu, X., Redline, S., and Lin, X. (2013). GEE-
based SNP set association test for continuous and discrete
traits in family-based association studies. Genet. Epidemiol.
37, 778–786.
688 The American Journal of Human Genetics 95, 675–688, Decemb
26. Lin, D.Y. (2000). On fitting Cox’s proportional hazardsmodels
to survey data. Biometrika 87, 37–47.
27. Allison, D.B. (1997). Transmission-disequilibrium tests for
quantitative traits. Am. J. Hum. Genet. 60, 676–690.
28. Page, G.P., and Amos, C.I. (1999). Comparison of linkage-
disequilibrium methods for localization of genes influencing
quantitative traits in humans. Am. J. Hum. Genet. 64, 1194–
1205.
29. Xiong, M., Fan, R., and Jin, L. (2002). Linkage disequilibrium
mapping of quantitative trait loci under truncation selection.
Hum. Hered. 53, 158–172.
30. Chen, Z., Zheng, G., Ghosh, K., and Li, Z. (2005). Linkage
disequilibrium mapping of quantitative-trait loci by selective
genotyping. Am. J. Hum. Genet. 77, 661–669.
31. Chen, H.Y., and Li, M. (2011). Improving power and robust-
ness for detecting genetic association with extreme-value sam-
pling design. Genet. Epidemiol. 35, 823–830.
32. Li, D., Lewinger, J.P., Gauderman, W.J., Murcray, C.E., and
Conti, D. (2011). Using extreme phenotype sampling to iden-
tify the rare causal variants of quantitative traits in association
studies. Genet. Epidemiol. 35, 790–799.
33. Barnett, I.J., Lee, S., and Lin, X. (2013). Detecting rare variant
effects using extreme phenotype sampling in sequencing
association studies. Genet. Epidemiol. 37, 142–151.
34. Hajek, J. (1960). Limiting distributions in simple random sam-
pling from a finite population. Publ Math Inst Hungarian
Acad Sci Ser A 5, 361–374.
35. Hajek, J. (1964). Asymptotic theory of rejective sampling with
varying probabilities from a finite population. Ann. Math.
Stat. 35, 1491–1523.
36. Rosen, B. (1972). Asymptotic theory for successive sampling
with varying probabilities without replacement, I. Ann.
Math. Stat. 43, 373–397.
er 4, 2014