Non-invasive Genetic Hair Sampling of a Population of ...savethebilbyfund.com/BNT_Hair sampling...
53
Non-invasive Genetic Hair Sampling of a Population of Bridled Nailtail Wallaby (Onychogalea fraenata) on Avocet Nature Refuge Leanne Henry (Simpson) - 220055558 Master of Scientific Studies – Thesis SCI695 University of New England Supervisor: Stuart Cairns Co-supervisor: Jane Hughes (Griffith University)
Transcript of Non-invasive Genetic Hair Sampling of a Population of ...savethebilbyfund.com/BNT_Hair sampling...

Non-invasive Genetic Hair Sampling of a Population of
Bridled Nailtail Wallaby (Onychogalea fraenata)
on Avocet Nature Refuge
Leanne Henry (Simpson) - 220055558
Master of Scientific Studies – Thesis SCI695
University of New England
Supervisor: Stuart Cairns
Co-supervisor: Jane Hughes (Griffith University)


i
Acknowledgements
I would first like to thank the Spooner family for acknowledging and embracing the natural
values on their cattle property near Springsure and providing a home for one Australia’s most
endangered species. Hugo Spooner provided endless assistance and support throughout the
project and for that I am very grateful. Many thanks must also go to my primary supervisor
Stuart Cairns for all of his guidance, analytical and statistical knowledge, as well as field support.
To my co-supervisor Jane Hughes and research assistant Kathryn Real from Griffith University, I
cannot thank you enough for your direction, assistance and patience with all things genetic.
To the Norman Wettenhall Foundation, the Save the Bilby Fund and the Dept. of National
Parks, Recreation, Sport and Racing's, Queensland Parks and Wildlife Service, all my thanks go to
them for their generous financial contributions and their tremendous support of this project. A
scientific purposes permit (WITK09715411) was granted through the Department of
Environment and Resource Management (now Dept. of Environment and Heritage Protection)
and ethics approval was granted from the University of New England Ethics Approval
Committee (AEC11/053).
To Janelle Lowry from DEHP, with her dedication for all things nailtail and tremendous support
in all aspects of the project, I am unable to thank you enough for your advice and endless
assistance. Also to Alan Horsup, from DEHP who I would like to sincerely thank for sharing his
knowledge of hair sampling and for all of his support and assistance throughout the project.
Many thanks go to Tina Janssen and her family for their hospitality and assistance in the initial
stages of this project.
This project received an enormous amount of support from organisations such as the Fitzroy
Basin Association, in particular Graeme Armstrong who provided an enormous amount of
assistance and direction, and Lyndal Rolfe, the Bridled Nailtail Trust, namely Fiachra Kearney,
the Conservation and Wildlife Management Branch of the SSAA, especially Mark Woods and
Glenys-Julie Harris, Murray Haseler from Bush Heritage and Wild Mob Volunteers Australia. I
would like to sincerely thank them all for providing a significant amount of both advice and field
support which was boundless throughout the project.
This project would not have been possible without the help of the many volunteers who gave
their support and, at times, a significant amount of sweat to help me complete the field
component of this project. Many thanks go to Janelle Lowry, Alan Horsup, Bennett Henry,
Colleen and Ken King, Lorelle Campbell, Graham Armstrong, Lyndy Marshall, Lyndal Rolfe,
Stuart Cairns, Gerhard Koertner, Shellie Cash, Mark Woods and Glenys-Julie Harris.

ii
Many people from the QPWS provided a substantial amount of support and reassurance
throughout the project. In particular, I would like to thank Andrew Dinwoodie, Barry Nolan,
John Augusteyn, Graham Hemson, Rhonda Melzer, Peter Moore and Leigh Harris and special
thanks goes to my work supervisor, Scott Brook for his support and patience over the last 12
months. Thanks also goes to all of the wonderful people from the Griffith University Molecular
Ecology laboratory, for providing endless assistance and opening my eyes to the world of
genetics; in particular Kathryn Real, Dan Schmidt and Joel Huey. Many thanks go to Susan
Nuske from the University of Queensland for her guidance and advice and to Lauren Young and
Kerry Walsh from Central Queensland University for their assistance in the initial stages and
during the analysis stage of this project.
To my very supportive husband-to-be, Bennett Henry I cannot thank you enough for your
patience, hard work and endless support throughout the project. To all of my friends and
colleagues who offered advice, kept me sane and gave me an excuse to take a break, I whole
heartedly thank you.
Videos of this hair sampling study on Avocet NR can be viewed on the YouTube channel ‘Nailtail1’.
http://www.youtube.com/user/Nailtail1

iii
Abstract
Sampling wild animal populations is of fundamental importance particularly when managing rare
and threatened species. This study investigates the use of non-invasive genetic hair sampling to
census a reintroduced population of bridled nailtail wallaby (Onychogalea fraenata) on Avocet
Nature Refuge (NR), and compares the technique to traditional cage trap sampling.
Cage trapping was conducted using 146 metal traps at Avocet NR in June 2011 over four nights.
Hairs for genetic sampling were collected from 180 hair traps (78 runway and 102 triangle) on
Avocet NR in October 2011 over 18 nights. Bridled nailtail wallaby hair was macroscopically
identified before DNA was extracted with chelex for genotyping. Tissue samples from cage
trapped individuals and hair samples were extracted and genotyped on five highly polymorphic
microsatellite loci. Error rates were calculated and incorporated into the results as extracted hair
samples produce low quality and small quantities of DNA.
Cage trapping resulted in a total of 20 captures and the identification of 10 individual bridled
nailtail wallabies. Hair trapping resulted in a total of 422 captures and identified 66 individual
wallabies. The two hair trapping methods used, showed no significant difference in their ability
to capture a hair sample. With the amplification of only 71 samples at four or more loci, only 66
different bridled nailtail wallabies were able to be confidently identified (PI 0.999). The poor
amplification of loci was most likely due to the large fragment length (>150bps) of the loci B29,
B87 and B151. Using two different methods, the effective population size (Ne) of bridled nailtail
wallabies was calculated at 29 (18-50) and 35 (24-61). The initial cost to set up a cage trapping
survey at Avocet NR is $70,676 when compared to $46,613 for a hair trap survey. Ongoing
surveys for cage trapping cost $28,546 and for hair trapping the cost is $40,857, this includes
$12,000 for genetic analysis.
Hair trapping is much more effective in capturing bridled nailtail wallaby samples from the
population than the currently used cage trapping method. A population estimate based on the
capture-mark-recapture (CMR) model was unable to be conducted for either trap survey method
due to the small sample size of identifiable individuals and the low number of recaptures. Using
the current technique, cage trapping is not suitable for estimating population size at Avocet NR.
To improve sample size for non-invasive hair samples, it is recommended to investigate different
extraction methods and establish new highly variable markers with a fragment length <150bps
and that have low error rates. Any additional cost of conducting a non-invasive hair sampling
survey is far outweighed by the level of information gathered (census size and Ne) and the
minimal amount of disruption to the species.

iv
Table of Contents Acknowledgements .................................................................................................................................... i
Abstract .................................................................................................................................................... iii
List of Figures ........................................................................................................................................... v
List of Tables ............................................................................................................................................ v
1. Introduction ......................................................................................................................................... 1
1.1 Bridled nailtail wallaby .................................................................................................................... 2
1.2 Non-invasive genetic hair sampling ................................................................................................. 4
2. Methods ............................................................................................................................................... 7
2.1 Study site ........................................................................................................................................ 7
2.2 Cage trapping .................................................................................................................................. 7
2.3 Hair trapping .................................................................................................................................. 8
2.4 Hair analysis.................................................................................................................................. 10
2.5 Genetic analysis ............................................................................................................................ 11
2.5.1 DNA Extraction .................................................................................................................... 11
2.5.2 Microsatellite genotyping ........................................................................................................ 11
2.5.3 Statistical analysis ................................................................................................................... 12
2.6 Cost effectiveness ......................................................................................................................... 14
3. Results ................................................................................................................................................ 15
3.1 Cage Trapping .............................................................................................................................. 15
3.2 Hair trapping ................................................................................................................................ 15
3.3 Genetic analysis ............................................................................................................................ 17
3.4 Cost comparison ........................................................................................................................... 19
4. Discussion .......................................................................................................................................... 21
4.1 General observations .................................................................................................................... 21
4.2 Trap method ................................................................................................................................. 21
4.2.1 Animal ethics ......................................................................................................................... 24
4.3 Genetic Analysis ........................................................................................................................... 25
4.4 Cost effectiveness ......................................................................................................................... 28
5. Recommendations .............................................................................................................................. 31
5.1 Hair trapping ................................................................................................................................ 31
5.2 Genetic analysis ............................................................................................................................ 31
References .............................................................................................................................................. 34
Appendices ............................................................................................................................................. 38

v
List of Figures
Fig. 1: Bridled nailtail wallaby (Onychogalea fraenata) 3
Fig. 2: Former and current distribution of the bridled nailtail wallaby 4
Fig. 3: Metal cage trap used to capture bridled nailtail wallabies 8
Fig. 4: Two types of hair traps used in this study: triangle hair trap and runway hair trap 9
Fig. 5: The number of bridled nailtail wallaby captures using cage traps 15
Fig. 6: The total number of hair trap sites that collected bridled nailtail wallaby hair 16
Fig. 7: The average number of individual samples collected from each runway and 17
triangle trap
Fig. 8: The COLONY output showing the relationships between the individuals 19
based on genetic data
Fig. 9: Cost associated with the initial setup and ongoing survey for hair and cage trap 20
methods
List of Tables Table 1: Genetic analysis of hair samples including error rates 18

Non-invasive Genetic Hair Sampling Page 1
1. Introduction
Sampling of wild populations is of primary importance in the management of many rare and
threatened species across the world. Estimating the population size of a species enables
managers to monitor for positive or negative trends that may result from particular management
actions. One of the more commonly used population size estimation methods is known as
capture-mark-recapture (CMR) (Attiwill & Wilson 2006). The aim of the CMR method is to
capture individuals from the population, mark them and release them back into the population so
they can be recaptured on subsequent occasions (Amstrup et al. 2005). This method is
commonly used for estimating the population size of many small to medium-sized mammal
species (Minta et al. 1989; Nichols 1992; Attiwill & Wilson 2006; Augusteyn et al. 2010; Ruibal et
al. 2010). The accuracy of the CMR method relies on all individuals having an equal chance of
being captured and then recaptured on subsequent sampling occasions (White et al. 1982;
Amstrup et al. 2005). Using cage or foot-hold traps are effective ways to capture a proportion of
the population so long as the species is abundant with high tradability (Attiwill & Wilson 2006).
Invasive sampling using traps can, however, change the behaviour of individuals. Attractants
(food rewards) may make some individuals ‘trap happy’, while the experience of being trapped
and then handled can make others ‘trap shy’ (Attiwill & Wilson 2006). Live-trap types can also
impact directly on the health of the individual or their young by causing injury or death, or by
increasing the chance of predation (Johnson 1997; Lemckert et al. 2006).
In more recent times, non-invasive genetic sampling methods have been developed to
better estimate the population size, sex ratio, distribution and genetic variability of species where
invasive or other non-invasive methods such as the mark-resight method are not feasible.
Traditional capture methods such as cage or foot-hold trapping have proved ineffective in the
population size estimation of several species; including bears (Mowat & Strobeck 2000; Romain-
Bondi et al. 2004), otters (Depue & Ben-David 2007) and wombats (Hoyle et al. 1995). Cage traps
were used as the capture method to estimate the population size of free-ranging bridled nailtail
wallabies (Onychogalea fraenata) from 1993-1996 (Fisher et al. 2000) and since 2007 (Augusteyn et al.
2010). When applied to CMR models, this capture method produces inconsistencies when
estimating population size. When two trapping events from the same year were compared, the
known minimum population size based on marked individuals was higher than the population
estimate using the CMR model (Augusteyn et al. 2010). Mark-resight data from distance
estimation methods was used prior to 2002 but became unreliable owing to reduced visibility
caused by encroaching introduced grasses (Lundie-Jenkins & Lowry 2005a).

Non-invasive Genetic Hair Sampling Page 2
The use of genetic material in association with wildlife management provides
opportunities for assessing the genetic variability and structure within a population, and how it
interacts with other populations (immigration/emigration). It also provides information on how
individuals interact with each other (breeding patterns), what areas of habitat they use, and
enables the best combinations of individuals to be identified for use in breeding and translocation
programs (Lindenmayer & Burgman 2005; Attiwill & Wilson 2006). This information assists
managers to manage rare and threatened species in the wild or in captivity, more effectively.
Genetic structure is directly related to species’ survival as the greater the variability within a
population the greater the chance that individuals will be equipped to deal with stochastic events
(Attiwill & Wilson 2006). Traditional methods of obtaining DNA from animals involve tissue or
blood samples being collected from confined individuals (Henry & Russello 2011). With
improvements in DNA extraction and polymerase chain reaction (PCR) methods (Taberlet et al.
1996), as well as improvements in the development of analytical methods and user-friendly
analysis software, very small quantities of DNA can now be utilised to genotype individuals
(Henry & Russello 2011). These advances have paved the way for the use of non-invasively
collected genetic material from hair, scats, feathers and urine, to determine the size and structure
of wild animal populations (Dreher et al. 2009; Henry & Russello 2011).
This study examines the use of a non-invasive hair sampling method on a small
population of bridled nailtail wallabies (Onychogalea fraenata) on Avocet Nature Refuge (NR) in
central Queensland. The study aimed to compare two types of hair trap, to genetically identify
individuals from remotely collected hair samples, and from that data, to describe the genetic
structure and estimate the size of the population.
1.1 Bridled nailtail wallaby
The bridled nailtail wallaby (O. fraenata) is one of Australia’s medium sized macropods most at
risk of extinction due to habitat loss, competition with domestic livestock and predation from
introduced animals (Lundie-Jenkins & Lowry 2005a; Van Dyck & Strahan 2008) (Fig. 1). This
species is listed as ‘Endangered’ under Commonwealth legislation, the Environmental Protection and
Biodiversity Conservation Act 1999, and Queensland legislation, the Nature Conservation Act 1992. The
bridled nailtail wallaby is one of three related Australian wallabies possessing a horny spur at the
end of its tail; the other two being the crescent nailtail wallaby (O. lunata) which is declared extinct
and the northern nailtail wallaby (O. unguifera) which is common across northern Australia (Van
Dyck & Strahan 2008).

Non-invasive Genetic Hair Sampling Page 3
Fig. 1. Bridled nailtail wallaby (Onychogalea fraenata) on Avocet Nature Refuge in central Queensland.
The bridled nailtail wallaby weighs between 5-8 kg for males and 4-6 kg for females;
reaching sexual maturity after only 270 days and 136 days, respectively (Hendrikz & Johnson
1999; Lundie-Jenkins & Lowry 2005a). Females exhibit embryonic diapause and have
comparatively high fecundity with the ability to give birth to three young per year under
favourable conditions (Johnson 1997). The bridled nailtail wallaby lives for 6-8 years in the wild
and were previously known to inhabit areas of acacia shrubland and grassy woodland within the
Brigalow Belt bioregion of semi-arid eastern Australia (Van Dyck & Strahan 2008) (Fig. 2).
This medium-sized wallaby was first described in 1840 by John Gould (Flannery et al.
1990). The bridled nailtail wallaby received its name from the distinctive white ‘bridle’ running
from the centre of the neck down behind the forearm and the horny spur on the tip of its tail
(Van Dyck & Strahan 2008). In the 1800s the bridled nailtail wallaby was widespread through the
semi-arid areas of central Queensland to northern Victoria (Gordon & Lawrie 1980). Its
numbers had declined in most areas by the early 1900s, with the last recorded sighting in 1937
(Pople et al. 2001). The bridled nailtail wallaby was presumed extinct until being rediscovered on
two properties in central Queensland near Dingo in 1973 (Gordon & Lawrie 1980; Pople et al.
2001) where they inhabit brigalow (Acacia harpophylla), poplar box (Eucalyptus populnea) and
rosewood (Acacia rhodoxylon) communities (Fisher 2000).
Non-invasive Genetic Hair Sampling Page 4
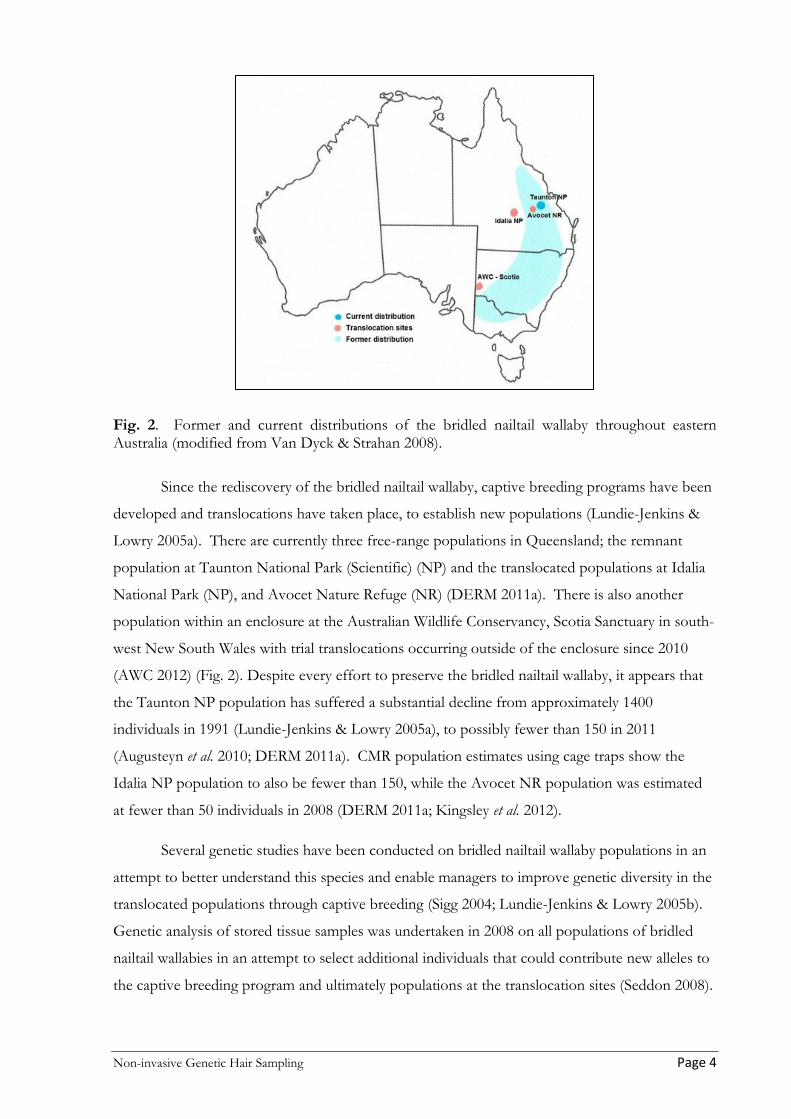
Fig. 2. Former and current distributions of the bridled nailtail wallaby throughout eastern Australia (modified from Van Dyck & Strahan 2008).
Since the rediscovery of the bridled nailtail wallaby, captive breeding programs have been
developed and translocations have taken place, to establish new populations (Lundie-Jenkins &
Lowry 2005a). There are currently three free-range populations in Queensland; the remnant
population at Taunton National Park (Scientific) (NP) and the translocated populations at Idalia
National Park (NP), and Avocet Nature Refuge (NR) (DERM 2011a). There is also another
population within an enclosure at the Australian Wildlife Conservancy, Scotia Sanctuary in south-
west New South Wales with trial translocations occurring outside of the enclosure since 2010
(AWC 2012) (Fig. 2). Despite every effort to preserve the bridled nailtail wallaby, it appears that
the Taunton NP population has suffered a substantial decline from approximately 1400
individuals in 1991 (Lundie-Jenkins & Lowry 2005a), to possibly fewer than 150 in 2011
(Augusteyn et al. 2010; DERM 2011a). CMR population estimates using cage traps show the
Idalia NP population to also be fewer than 150, while the Avocet NR population was estimated
at fewer than 50 individuals in 2008 (DERM 2011a; Kingsley et al. 2012).
Several genetic studies have been conducted on bridled nailtail wallaby populations in an
attempt to better understand this species and enable managers to improve genetic diversity in the
translocated populations through captive breeding (Sigg 2004; Lundie-Jenkins & Lowry 2005b).
Genetic analysis of stored tissue samples was undertaken in 2008 on all populations of bridled
nailtail wallabies in an attempt to select additional individuals that could contribute new alleles to
the captive breeding program and ultimately populations at the translocation sites (Seddon 2008).

Non-invasive Genetic Hair Sampling Page 5
1.2 Non-invasive genetic hair sampling
Non-invasive sampling using collected genetic material has been used successfully to estimate
population size, occupancy, abundance, sex ratio and genetic diversity (Woods et al. 1999;
Bremner-Harrison et al. 2006; Downey et al. 2007). This method has been applied to numerous
mammal species, including felids (Downey et al. 2007), bears (Woods et al. 1999; Mowat &
Strobeck 2000; Romain-Bondi et al. 2004; Gervasi et al. 2008), wombats (Sloane et al. 2000; Banks
et al. 2003; Walker et al. 2006), quolls (Ruibal et al. 2010) and otters (Depue & Ben-David 2007;
Hajkova et al. 2009). This form of population monitoring suits species that have large home
ranges, small population sizes or are cryptic in nature (Taberlet & Luikart 1999; Downey et al.
2007). The use of conventional CMR sampling has proved unreliable for several species because
they are restricted by low sample size and low detection probabilities which violates CMR
assumptions (Williams et al. 2009).
Non-invasive genetic sampling involves the collection of a DNA sample, which is usually
obtained from either hair, feathers, urine or scats. Hair has been collected from wombats for
DNA analysis using double-sided tape across burrow entrances (Sloane et al. 2000) and from
bears collected from a barbed wire enclosure (Woods et al. 1999). In order to identify individuals
from these samples, DNA is extracted and then genotyped (Piggott & Taylor 2003; Waits &
Paetkau 2005; Attiwill & Wilson 2006). A pilot study was conducted in 2010 on collecting and
genotyping hair from bridled naitlatil wallabies, outlining the best hair collection methods and
error rates from DNA analysis (Nuske 2010).
This form of non-invasive sampling enables researchers to obtain DNA from an
individual with minimal to no interaction with the species involved (Henry & Russello 2011).
This improves the power of CMR models by increasing the likelihood of obtaining information
from cryptic species as well as ensuring that samples conform to CMR assumptions (Bremner-
Harrison et al. 2006; Downey et al. 2007; Dreher et al. 2009). Based on the genetic information
gathered from hair sampling an effective population size is able to be calculated. The effective
population size (Ne) is a measure of genetic diversity, being the number of individuals that have
equal opportunity to contribute genes to the next generation (Lindenmayer & Burgman 2005).
Knowledge of Ne is particularly important when managing small populations of isolated species
since genetic diversity is, in most cases, directly related to their ability to persist (Lindenmayer &
Burgman 2005; Janecka et al. 2008).

Non-invasive Genetic Hair Sampling Page 6
The estimation of the effective and actual population size is crucial for establishing a goal
set for endangered species management (Williams et al. 2009). The drawback of using non-
invasive genetic methods is the prevalence of genotyping errors that may result in the over or
under estimation of a population (Creel et al. 2003). Several methods have been established to
account for such errors and conservative methods are recommended when genotyping low
quality and small quantities of DNA as found in hair and scat samples (Taberlet & Luikart 1999;
Pompanon et al. 2005). These methods include repeat PCRs, calculating error rates based on
probability of identity (PI) (Pompanon et al. 2005), using highly polymorphic loci and the use of
dinucleotide repeat motifs and shorter fragment lengths <200bps (Woods et al. 1999; Broquet et
al. 2007).
Using the most efficient and effective way of conducting a population estimate is
important due to the limited amount of funding usually available for conservation management.
Non-invasive genetic sampling aimed at estimating population size can be more cost effective
than invasive methods when applied to species with large home ranges. Larger areas can be
covered over longer periods of time using this method (Mowat & Strobeck 2000; Downey et al.
2007; Gervasi et al. 2008; Poole et al. 2011). Non-invasive sampling may, however, incur higher
costs than invasive trapping methods when estimating the population size of species that are
abundant across small areas. The cost of using invasive capture methods may only be considered
cost effective if large sample sizes are able to be obtained and captures conform to CMR
assumptions. Any detrimental impacts on the species may negate any additional costs involved
with non-invasive genetic sampling.

Non-invasive Genetic Hair Sampling Page 7
2. Methods
2.1 Study site
Avocet Nature Refuge (NR) is an 1140 ha portion of a 4500 ha cattle grazing property located
approximately 37 km south of Emerald and 35 km north of Springsure in central Queensland
(S23o51’12.5” E148o09’54.5”) (H. Spooner, pers. com. 2012) (Fig. 2). Rainfall for this site was
gathered from Hugo Spooner from the Avocet house approximately 4.5 km north-west of
Avocet NR. A Nature Refuge in Queensland is established and gazetted by a legally binding,
perpetual agreement attached to the land title under the Nature Conservation Act 1992 (McCosker
1998; DERM 2011b).
Avocet NR was gazetted at the request of the land holder, Hugo Spooner, in 1998 to
protect an area of endangered native brigalow woodland. Avocet NR receives on average 625
mm of rain annually and contains a mixture of Brigalow, poplar box, silver-leafed ironbark
(Eucalyptus melanophloia), narrow-leafed ironbark (Eucalyptus crebra) and lancewood (Acacia shirleyi)
communities, located within the brigalow belt bioregion (McCosker 1998; DERM 2012). Avocet
NR adjoins the Goonderoo Bush Heritage Reserve which was gazetted a Nature Refuge in 2003
to also protect natural brigalow woodland communities (BHA 2012) (Appendix 1).
Avocet NR was recognised by the Environmental Protection Agency (EPA) (now
Department of Environment and Heritage Protection) in 1998 as a suitable site for the
reintroduction of a population of bridled nailtail wallabies (J. Lowry, pers. com. 2012). With
support and assistance from the Spooner family, as well as Emerald Shire Council (now part of
the Central Highlands Regional Council) and groups such as the Sporting Shooters Association
of Australia (SSAA), Bridled Nailtail Wallaby Trust and the local community, a total of 166
bridled nailtail wallabies were introduced over 14 releases, onto Avocet NR between 2001 to
2005 (MacLeod et al. 2010; Kingsley et al. 2012). Since then, other partners such as the Fitzroy
Basin Association and Minerva Mine have contributed to the recovery of this species.
2.2 Cage trapping
Cage trapping of bridled nailtail wallabies was undertaken on Avocet NR by the Queensland
Parks and Wildlife Service (QPWS) from the 14-18 June 2011. In the three months preceding
cage trapping, the Avocet area received a total of 304 mm of rain (H. Spooner, pers. com. 2012).
Since this area is a cattle grazing property and the attractant used for bridled nailtail wallabies is
also attractive to cattle, the cattle were removed from the cage trapping area prior to the
commencement of the survey. Trapping consisted of setting 146 (380 x 380 x 760 mm) treadle
triggered, wire cage traps lined with marine carpet (Fig. 3) and placed between 100-150 m apart

Non-invasive Genetic Hair Sampling Page 8
(Appendix 2). Cage traps were brought from Taunton NP and laid out by a team of two people
over two days. This included the time it took to conduct minor cage trap repairs (J. Lowry, pers.
com. 2011).
Prior to trapping, traps were pre-fed with premium lucerne hay, in a ‘locked open’
position, on three occasions over a period of one week. During trapping, traps were set about an
hour before dusk and checked twice each night for four consecutive nights (eight occasions).
Traps were then closed at dawn to prevent capture during the day (J. Lowry, pers. com. 2011).
Any lucerne outside of the traps was removed at each visit to increase the chance of bridled
nailtail wallabies entering the traps and triggering the treadle. Each trapped bridled nailtail
wallaby was placed in a hessian bag and processed. This involved taking a 3-mm diameter sterile
biopsy punch of tissue from the ear for DNA analysis and inserting a passive implant
transponder (microchip) between the scapular for ‘first-time captures’ and recording standard
body measurements (Jackson 2003; Nolan 2012). See Appendix 3 for datasheet used. Once this
was completed, the animals were immediately released at the site of capture. Collection of the
cage traps post-trapping involves extensive washing and disinfecting (Virkon) of the traps to
prevent the spread of disease and parasites (Chapman et al. 2005; Nolan 2012).
Fig 3. Metal wire cage trap lined with carpet used in the capture of bridled nailtail wallabies, baited with lucerne.

Non-invasive Genetic Hair Sampling Page 9
2.3 Hair trapping
Two types of hair traps were used to obtain hair samples from bridled nailtail wallabies: triangle
and runway traps (Fig. 4). The types of hair traps used in this study were based on a pilot study
of non-invasive hair trapping of bridled nailtail wallabies conducted at Taunton NP
(Nuske 2010). Triangle hair traps consisted of 8-mm diameter rope tied around three to four
trees or metal stakes in the shape of a triangle. Double-sided tape (4970 TESA tape) was
attached to the undersides of the two to three, 60-80 cm long, sections of the triangle. Runway
hair traps consisted of two stakes or trees located either side of an animal pad about 30-40 cm
apart with double-sided tape strung between them. All hair traps were set at a height of 20-25
cm. A triangle or runway trap was selected depending on their appropriateness to the site (i.e. the
presence of three small trees close together or well used runways). A total of 180 hair traps (78
runways and 102 triangles) were set along 30 km of track on Avocet NR (Appendix 4). Hair
traps were placed every 50-100 m in areas of previous bridled nailtail wallaby captures or
sightings and every 100-300 m apart in areas where bridled nailtail wallabies had not previously
been sighted or where the habitat was deemed to be of less suitable for the bridled nailtail wallaby
(Fisher 2000).
Hair traps were installed during the period from the end of September to the beginning
of October 2011. Selection of sites and installation of ropes and stakes took three full days for
4-5 people. A small amount of attractant (premium lucerne and sweet potato) was placed in the
centre of each triangle and on both sides and through each runway (Fig. 4). During pre-feeding,
Fig. 4. The two trap types used for hair sampling: triangle hair trap with attractant (left) and a runway hair trap with attractant (right).

Non-invasive Genetic Hair Sampling Page 10
hair traps had a 5 cm piece of double-sided tape attached to allow bridled nailtail wallabies to
habituate to the smell of the tape. The traps were baited twice over a one-week period before all
trap sites were set with hair tape. TESA tape was used as it has proven to be very effective in the
capture of wombat hair (Banks et al. 2003; Walker et al. 2006).
Hair traps were set for a total of 18 consecutive nights during the period 7-25 October
2011. All traps were checked on four occasions in this period, every 3-5 days. All hair traps with
hair, had that section of tape carefully removed. The sample was placed flat on grease-proof
paper (Glad Bake), folded and stored in a labelled envelope. Fresh tape was placed across the
section removed and fresh attractant was placed at the site. Fresh attractant was also placed at
the hair traps which had collected no hair. All hair traps were cleared and removed by the end of
October 2011. Envelopes containing hair samples were kept dry in a refrigerator on site (Avocet
NR) until they could be transported to the QPWS laboratory in Rockhampton. The samples
were then kept dry in a container at room temperature until the DNA extraction could be
completed.
2.4 Hair analysis
Collected hairs were distinguished from those of other species by visual identification of
hair colour, pattern and thickness based on the Hair Identification Key for Australian Mammals
(Triggs & Brunner 2002). Using the species list from the Avocet NR evaluation document
(McCosker 1998), a table was created to assist with quick on-site identification of hair (Appendix
5). In order to assist in the confirmation of hair identification, ten motion-sensing infra-red (IR)
cameras (Bushnell Trail Cameras) were set up at hair traps prior to, and during the survey where
attractant was being taken. Hair samples were identified by their appearance and the length and
diameter of guard hairs. Guard hairs are the larger or coarser hairs that form the main part of the
coat (Triggs & Brunner 2002). Bridled nailtail wallaby guard hairs were <20 mm long and about
95 microns in diameter, with a distinct colour band in the shield region, being the area just below
the tip (Appendix 5). Rufous bettongs (Aepyprymnus rufescens) regularly entered the hair traps at
Avocet NR. Rufous bettong hair was easily distinguished from bridled nailtail wallaby hair by
having longer and thicker guard hairs (40 mm and 115 microns, respectively). Samples were
distinguished as clumps of hair on the tape with clear separation between them. Given that
several visits may occur during one sampling occasion, a number of clumps of hair may appear
on the same hair trap; therefore, several hair samples may be collected from the one trap on the
same sampling occasion.

Non-invasive Genetic Hair Sampling Page 11
2.5 Genetic analysis
2.5.1 DNA Extraction
Tissue samples were collected using 3-mm diameter sterile ear biopsy punches during the CMR
cage trapping survey on Avocet NR in June 2011. They were placed in 1.5 ml Eppendorf tubes
containing 90% ethanol and stored in a refrigerator at 4oC before being transported on ice to the
Griffith University Molecular Ecology laboratory. Half of the tissue was digested with 200 µl of
CTAB buffer and 8 µl of proteinase-K and heated to 55oC for approximately five hours. DNA
extraction was carried out using a modified CTAB extraction method (Doyle and Doyle 1987).
The DNA extracts were then stored in a refrigerator at 4oC.
A study conducted in 2010 on the Taunton NP bridled nailtail population confirmed that
DNA from a single bridled nailtail wallaby hair could be successfully genotyped when compared
to DNA extracted from tissue samples (Nuske 2010). In the laboratory, hairs with a clear follicle
(white skin at the base of the hair) were selected for DNA extraction. Given that more than one
individual may have passed under the same piece of tape during the same sampling period, the
use of pooled hair samples was not considered appropriate (Sloane et al. 2000; Roon et al. 2005;
Walker et al. 2006; Depue & Ben-David 2007). Approximately 10 mm was cut from each hair
and placed follicle end down in a 1.5 ml Eppendorf tube containing either 200 µl or 100 µl of 5%
chelex solution, as described in Sloane et al. (2000). Scissors and forceps were sterilised between
the handling of individual hairs. Three replicate individual hairs were collected from each sample
(clump of hair on the tape). The second or third replicate was genotyped only in the event that
the first or second hair failed to amplify. Follicles in chelex solution were boiled for 10 min then
stored in a freezer at -20oC. Extractions were performed in the QPWS laboratory 1-3 months
after hair collection.
2.5.2 Microsatellite genotyping
Tissue and hair samples were transported to the Griffith University Molecular Ecology laboratory
and stored at 4oC prior to genotyping. Five highly polymorphic microsatellite loci (B90, B87,
B29, B151, and YM148) that have previously been used to identify bridled nailtail wallabies were
used for the microsatellite genotyping of extracted hair samples (Pope et al. 1996; Sigg et al. 2005).
Polymerase Chain Reactions (PCRs) were conducted for both the tissue and hair samples.
The PCR for extracted tissue samples contained a 10 µl total solution of 0.5 µl of DNA extract,
1x reaction buffer, 1.5 mM of MgCl2, 0.1 µM of forward primer, 0.4 µM of reverse primer, 0.4
µM of fluorescent tag primer (Real et al. 2009), 0.2 mM of dNTPs and 0.3 u of Red Taq (Astral).

Non-invasive Genetic Hair Sampling Page 12
PCRs for hair samples extracted in 200 µl of chelex contained a total solution of 12.5 µl
consisting of 8.825 µl of DNA extract, 1x reaction buffer, 1.5 mM of MgCl2, 0.1 µM of forward
primer, 0.4 µM of reverse primer, 0.4 µM of fluorescent tag primer (Real et al. 2009), 0.2 mM of
dNTPs and 0.3 u of Red Taq (Astral). Hair samples extracted in 100 µl of chelex contained at
total solution of 10 µl consisting of 4 µl of DNA extract, 1x reaction buffer, 1.5 mM of MgCl2,
0.1 µM of forward primer, 0.4 µM of reverse primer, 0.4 µM of fluorescent tag primer (Real et al.
2009), 0.2 mM of dNTPs and 0.3 u of Red Taq (Astral).
Separate PCRs were conducted for each locus. Tissue and hair sample amplifications for
B90 and YM148 microsatellite loci were carried out at an initial denaturing of 94oC for 5 min
before 35 cycles of 94oC for 30 s of denaturing, 55oC for 30 s of annealing and 72oC for 30 s of
extension before a final 72oC for 10 min of extension. Tissue sample PCR conditions for B29,
B87 and B151 were the same as for B90 and YM148 except for a different annealing temperature
of 58oC. Owing to the poor amplification of B29, B87 and B151 for hair extracts, PCR
conditions were altered for these loci to an initial denaturation of 94oC for 5 min, before 40
cycles of 94oC for 30 s of denaturing, 58oC for 90 s of annealing and 72oC for 90 s of extension
before a final 72oC for 10 min. All loci were pooled for each tissue sample, while for hair
samples they were combined into two pools for genotyping comprising of YM148, B90 and B29,
and B87 and B151 to reduce any further dilution of the amplified fragments. The microsatellite
fragments were run on an ABI 3130 genetic analyser. Scoring of microsatellite genotypes was
undertaken using Genemapper 4.0 (ABI software).
2.5.3 Statistical analysis
The effectiveness of the two types of hair traps was compared using a contingency table analysis
using the Chi-square statistic (Van Emden 2008). The success of the two types of traps in
relation to the number of samples collected from each was compared using a single factor
analysis of variance (ANOVA). A correction factor was calculated for analysing the success of
the trap types (runways and triangles) in collecting samples as the total number of each trap type
was not equal across the survey area (102 triangles and 78 runways).
Corrected No. = 50% x No. successful traps of successful traps Actual %
The size range of each locus was obtained from Sigg (2004). In a genetic data study
conducted on bridled nailtail wallabies in 2008, the Avocet NR population contained an average
of 7.4 alleles (Na) per locus based on the five polymorphic loci used in this study (Seddon 2008).
Additional individuals were introduced after the collection of the samples used to calculate the
2008 Na. In this study microsatellite data were analysed with the MS Excel-based program

Non-invasive Genetic Hair Sampling Page 13
GenAlEx 6 (Peakall & Smouse 2006) to determine the number of alleles (Na) at each locus and
the number of matches to distinguish unique genotypes at two and 4-5 loci. The program Micro-
checker was used to locate and explain any inconsistencies at each locus and also outlined
possible reasons for loci being out of Hardy-Weinberg equilibrium (HWE) (Van Oosterhout et al.
2004).
A Hardy-Weinberg Exact Test was conducted on samples that amplified at five loci using
the program GENEPOP (Raymond & Rousset 1995; Rousset 2008) to establish if each locus
was in HWE, and to also evaluate the inbreeding coefficient (FIS). HWE is based on the main
assumptions that the population is large, mating randomly and there is no selection taking place
(Ridley 2004). The genotypic frequencies of a natural population typically conform to Hardy-
Weinberg expectations (Attiwill & Wilson 2006). If a population is out of HWE, it suggests that
something, such as non-random mating, may be occurring in the population (Ridley 2004).
Inbreeding occurs when naturally random-mating populations are so small that mating with close
relatives results in offspring receiving identical copies of a gene from both parents. This
produces a high proportion of homozygotes within the population (Ridley 2004; Attiwill &
Wilson 2006). The inbreeding coefficient for an individual relative to the subpopulation (FIS), is
the proportion of genes in an individual that are identical because they are derived from a
common ancestor (Lindenmayer & Burgman 2005).
Samples containing low quality and small quantities of DNA, such as in this study, can be
prone to genotyping errors. These are primarily ‘allelic dropout’, which results in a heterozygote
being scored as a homozygote, or ‘false alleles’, where an additional allele is produced to show
three alleles or a false heterozygote (Taberlet et al. 1996; Pompanon et al. 2005). In order to
reduce the likelihood of the occurrence of these errors, any genotypes that differed at only one
locus by the scoring of a heterozygote, were assumed to be the same genotype (Taberlet &
Luikart 1999). Duplicates of the same samples were genotyped and compared to produce a mean
genotyping error rate at each locus (Pompanon et al. 2005). The successful amplification rate was
based on the number of samples, out of the 422 collected that amplified at each locus.
For individuals that could be genotyped at four or more loci, the program Cervus 3.0
(Kalinowski et al. 2007) was used to establish the exclusion probability (PI) for individual and
sibling identity. This is effectively the probability that two individuals or siblings will not share
the same multi-locus genotype by chance. The program Cervus 3.0 is able to accommodate
simple genotyping errors such as null alleles when assigning parentage and exclusion probabilities
(Kalinowski et al. 2007). The aim of selecting primers should be to ensure that the multi-locus

Non-invasive Genetic Hair Sampling Page 14
genotype has an exclusion probability (PI) as close as possible to one; this meaning that there is a
zero probability that they will share the same genotype by chance.
Two programs were used to estimate the effective population size (Ne) based on the
unique genotypes that amplified at four or more loci. COLONY which uses “the maximum
likelihood method to assign individuals in a sample into full-sib families nested within half-sib
families (colonies) using these individuals' multi-locus genotypes without parental information”
(Jones & Wang 2009). ONeSAMP which uses “summary statistics and approximate Bayesian
computation to estimate Ne from a single sample of microsatellite data” (Tallmon et al. 2008).
The effective population size (Ne) is the number of individuals that would experience a loss of
genetic variability at the same rate as a randomly mating hypothetical population (Lindenmayer &
Burgman 2005).
Different programs, such as those that assess effective population size (Ne) and
probability of identity have the ability to account for different levels of missing data. For this
reason, analysis was able to be carried out for samples that amplified on four loci, together with
those that amplified on all five loci (Kalinowski et al. 2007; Tallmon et al. 2008; Jones & Wang
2009).
2.6 Cost effectiveness
The comparison of the cost effectiveness of cage trapping versus hair trapping takes into account
set up costs for establishing and conducting a new survey, as well as ongoing costs for
conducting a survey of the Avocet NR bridled nailtail wallaby population. This analysis assumes
that both cage and hair trapping methods would be undertaken by paid Queensland Government
employees. This comparison does not include costs associated with the initial planning phase of
establishing either method at a new location as it is likely that they would incur a similar
investment. The costs presented in this comparison take into account the cost of materials, fuel,
staff wages ($45/hour), travel allowance ($100/night/staff member) and the cost of data analysis
and genetic analysis (Appendix 6).

Non-invasive Genetic Hair Sampling Page 15
3. Results
Over the three months prior to cage trapping in June 2011, Avocet received a total of 304 mm of
rainfall. No rainfall was recorded during the four nights of cage trapping. In the three months
leading up to and including the first hair sampling period in October 2011, Avocet received a
total of 16 mm of rainfall, predominantly in July. Before the end of the second hair sampling
period, a hail storm went through the sampling area and 18 mm of rainfall was recorded. Prior to
the third collection of samples, another 8 mm fell over Avocet. No rainfall was recorded
between the third and final sampling period.
3.1 Cage Trapping
During the cage trapping survey there was a total of 20 captures of bridled nailtail wallabies,
comprising 10 individuals (Fig. 5). Of the 146 sites of which cage traps were set, 15 captured
bridled nailtail wallabies in close proximity to Ron’s dam (Appendix 2). Four bridled nailtail
wallabies were captured once while the other individuals were recaptured between 1-5 times over
the eight trapping occasions (J. Lowry, pers. com. 2011). The number of new individuals
declined over the survey period, while the total number of captures increased until the final trap
night, when only two individuals were trapped (Fig. 5).
3.2 Hair trapping
A total of 438 hair samples were visually identified as bridled nailtail wallaby from hair trap sites.
Of these, 422 were genetically identified as bridled nailtail wallaby and were collected from 60 of
the 180 hair trap sites (Appendix 4). All bridled nailtail wallaby hair samples were collected
within Regional Ecosystems (REs) dominated by brigalow or poplar box at Avocet NR
(Appendix 1).
Fig. 5. The number of bridled nailtail wallaby (BNTW) captures and new individuals in cage traps at Avocet NR in June 2011. Each trap night contains two trapping occasions.
0
1
2
3
4
5
6
7
8
14-Jun 15-Jun 16-Jun 17-Jun
No.
BN
TW
Trap night
New individuals
Total captures
Non-invasive Genetic Hair Sampling Page 16
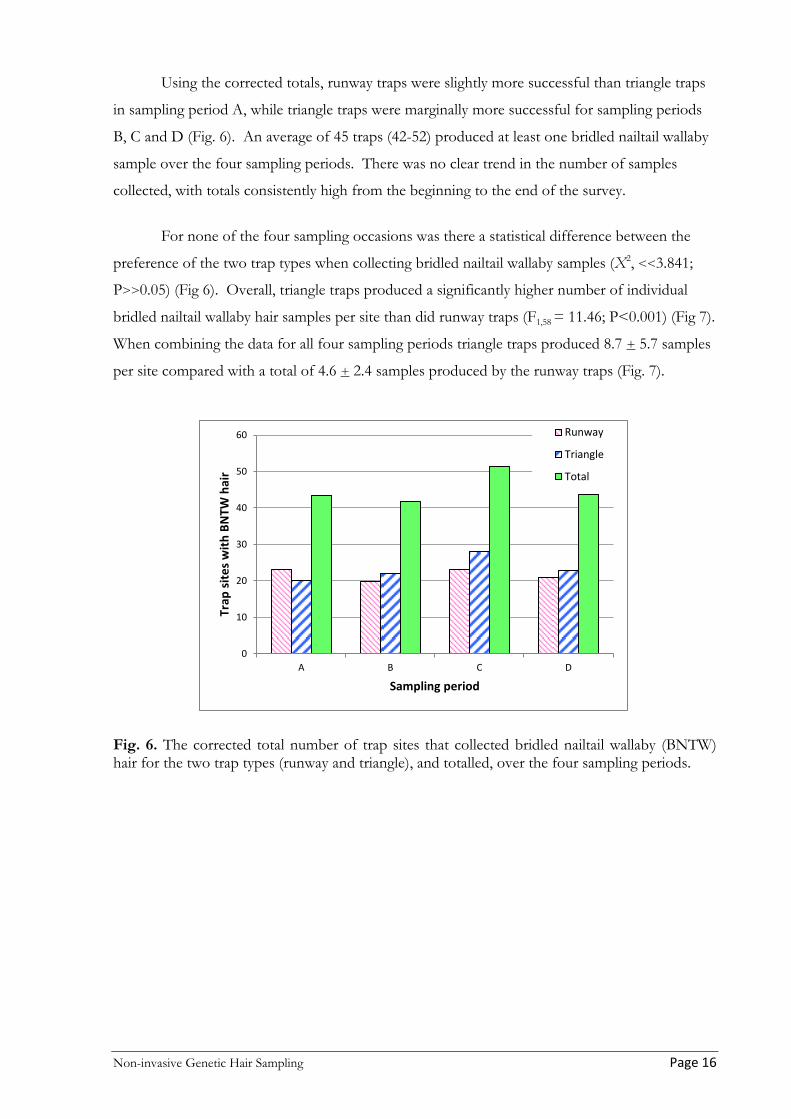
Using the corrected totals, runway traps were slightly more successful than triangle traps
in sampling period A, while triangle traps were marginally more successful for sampling periods
B, C and D (Fig. 6). An average of 45 traps (42-52) produced at least one bridled nailtail wallaby
sample over the four sampling periods. There was no clear trend in the number of samples
collected, with totals consistently high from the beginning to the end of the survey.
For none of the four sampling occasions was there a statistical difference between the
preference of the two trap types when collecting bridled nailtail wallaby samples (X2, <<3.841;
P>>0.05) (Fig 6). Overall, triangle traps produced a significantly higher number of individual
bridled nailtail wallaby hair samples per site than did runway traps (F1,58 = 11.46; P<0.001) (Fig 7).
When combining the data for all four sampling periods triangle traps produced 8.7 + 5.7 samples
per site compared with a total of 4.6 + 2.4 samples produced by the runway traps (Fig. 7).
Fig. 6. The corrected total number of trap sites that collected bridled nailtail wallaby (BNTW) hair for the two trap types (runway and triangle), and totalled, over the four sampling periods.
0
10
20
30
40
50
60
A B C D
Trap
site
s with
BN
TW h
air
Sampling period
Runway
Triangle
Total

Non-invasive Genetic Hair Sampling Page 17
Fig. 7. The average number of individual bridled nailtail wallaby hair samples collected from each runway and triangle trap for each of the four sampling periods. Bars show the minimum and maximum number of samples collected.
3.3 Genetic analysis
Of the 438 hair samples identified using the hair ID key, 422 samples amplified on at least one
locus, 223 amplified at the two loci B90 and YM148, and 71 amplified at four or more loci. Of
the 223 samples that amplified at the B90 and YM148 loci, 93 were unique genotypes. Of the 71
that amplified on at least four loci, 66 were unique genotypes. Based on the samples that
amplified at 4-5 loci (which produced the most reliable result), the minimum number of bridled
nailtail wallabies known to be alive on Avocet NR is at least 66 individuals.
None of the five loci were in Hardy-Weinberg Equilibrium (HWE). However, locus
YM148 was close at 0.049. The FIS value for B90 was negative, indicating an excess of
heterozygotes relative to HWE predictions. All other loci were positive, indicating an excess in
homozygosity (Table 1). Micro-checker indicated homozygote excess at three of the five loci
(B29, B87 and B151). This is most likely to result from null alleles which may be caused by allelic
dropout or mutations at the primer site preventing the large allele from amplifying (Marucco et al.
2011). Given that locus B90 and YM148 showed only small deviations from expected
frequencies, it is possible that additional sampling would reveal this population to be in HWE
(Van Oosterhout et al. 2004).
0
1
2
3
4
5
6
7
8
A B C D
Aver
age
no. s
ampl
es p
er si
te
Sampling period
Runway
Triangle
Non-invasive Genetic Hair Sampling Page 18
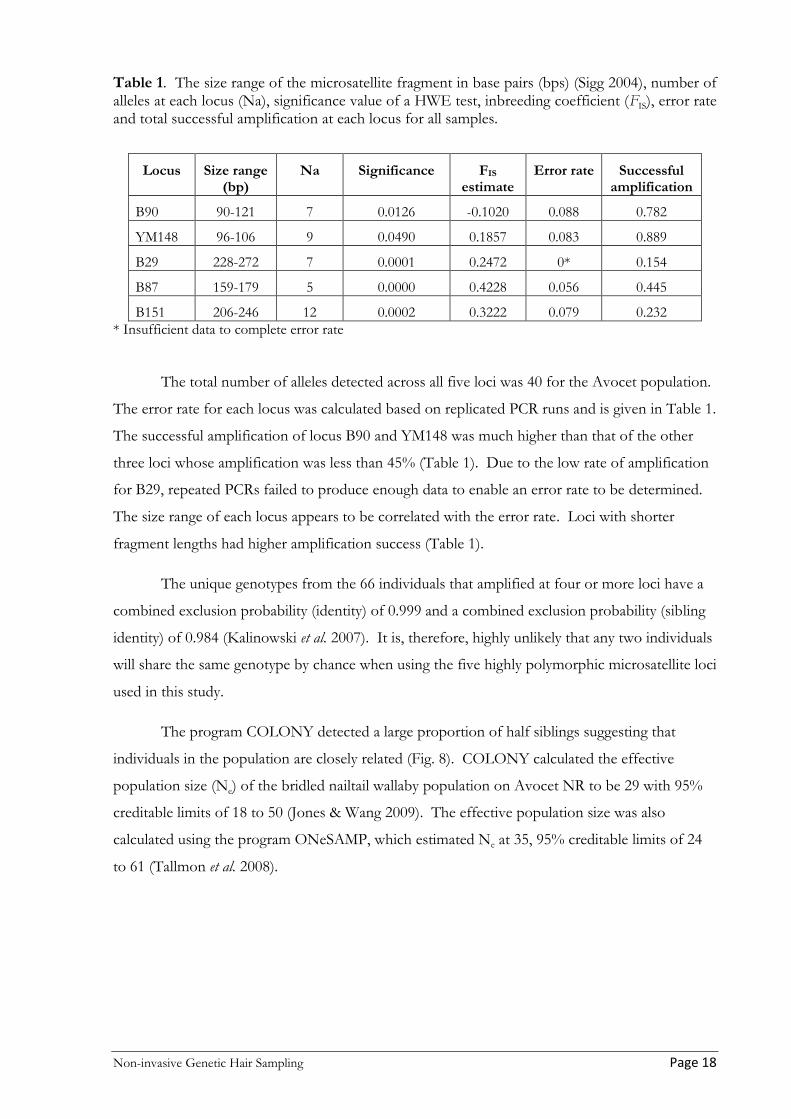
Table 1. The size range of the microsatellite fragment in base pairs (bps) (Sigg 2004), number of alleles at each locus (Na), significance value of a HWE test, inbreeding coefficient (FIS), error rate and total successful amplification at each locus for all samples.
Locus Size range (bp)
Na Significance FIS estimate
Error rate Successful amplification
B90 90-121 7 0.0126 -0.1020 0.088 0.782
YM148 96-106 9 0.0490 0.1857 0.083 0.889
B29 228-272 7 0.0001 0.2472 0* 0.154
B87 159-179 5 0.0000 0.4228 0.056 0.445
B151 206-246 12 0.0002 0.3222 0.079 0.232 * Insufficient data to complete error rate
The total number of alleles detected across all five loci was 40 for the Avocet population.
The error rate for each locus was calculated based on replicated PCR runs and is given in Table 1.
The successful amplification of locus B90 and YM148 was much higher than that of the other
three loci whose amplification was less than 45% (Table 1). Due to the low rate of amplification
for B29, repeated PCRs failed to produce enough data to enable an error rate to be determined.
The size range of each locus appears to be correlated with the error rate. Loci with shorter
fragment lengths had higher amplification success (Table 1).
The unique genotypes from the 66 individuals that amplified at four or more loci have a
combined exclusion probability (identity) of 0.999 and a combined exclusion probability (sibling
identity) of 0.984 (Kalinowski et al. 2007). It is, therefore, highly unlikely that any two individuals
will share the same genotype by chance when using the five highly polymorphic microsatellite loci
used in this study.
The program COLONY detected a large proportion of half siblings suggesting that
individuals in the population are closely related (Fig. 8). COLONY calculated the effective
population size (Ne) of the bridled nailtail wallaby population on Avocet NR to be 29 with 95%
creditable limits of 18 to 50 (Jones & Wang 2009). The effective population size was also
calculated using the program ONeSAMP, which estimated Ne at 35, 95% creditable limits of 24
to 61 (Tallmon et al. 2008).

Non-invasive Genetic Hair Sampling Page 19
Fig. 8. Graph produced by COLONY showing the relationship between individuals based on the 66 genotypes that amplified at four to five loci.
3.4 Cost comparison
The cost of initially setting up and conducting a CMR survey on bridled nailtail wallabies on
Avocet NR was $70,676 for cage trapping and $46,613 for a hair trapping census. The cost of
conducting additional surveys would be $28,546 for cage trapping and $40,857 for hair trapping
(Appendix 6). Cage trapping is therefore, approximately 34% more expensive to set up than hair
trapping, while subsequent surveys for hair sampling cost 30% more due to additional costs
associated with genetic analysis (Fig. 9) (Appendix 6).

Non-invasive Genetic Hair Sampling Page 20
Fig. 9. The initial set up cost to undertake a cage or hair trapping survey assuming all new equipment was purchased. Ongoing costs for additional hair and cage trap surveys including maintenance and small replacement costs. Cost itemised by materials, staff wages, vehicle costs, and analysis which includes modelling and contracted genetic processing.
The cost of the materials (primarily cage traps) for setting up a cage trapping survey, at
over $43,492, is significantly higher than for hair trapping at $3,600. The ongoing analysis costs
of conducting a hair survey are significantly higher due to the $12,000 required to genotype 400
hair samples (Appendix 6). The costs associated with staff time and vehicle costs are relatively
similar for both survey methods (Fig. 9).
$0
$5,000
$10,000
$15,000
$20,000
$25,000
$30,000
$35,000
$40,000
$45,000
Materials Staff Vehicles Analysis
Initial Costs Cage Trap
Hair Trap
$0
$5,000
$10,000
$15,000
$20,000
$25,000
$30,000
$35,000
$40,000
$45,000
Materials Staff Vehicles Analysis
Ongoing Costs Cage Trap
Hair Trap

Non-invasive Genetic Hair Sampling Page 21
4. Discussion
4.1 General observations
In June 2012, Avocet NR had received a total 304 mm of rainfall in the three months leading up
to cage trapping which resulted in much of the area maintaining good grass and herb coverage
prior to pre-feeding. With a high proportion of feed available bridled nailtail wallabies may have
been less likely to enter the cage traps (Barnett & Dutton 1995). For the hair trap survey in
October 2011, Avocet NR was extremely dry with little obvious fresh pasture growth during pre-
feeding and over the first sampling period. Rainfall in the first and second week saw the survey
area get progressively greener, with fresh grass and forb growth across previously bare areas. The
amount of fresh pasture growth appeared to have no influence on the number of successful hair
sites during the 18 night hair trapping survey which remained consistently between 42-52 sites
(Fig. 6). The number of individual bridled nailtail wallabies visiting each site in response to
pasture growth remains untested due the small number of individuals that were able to be
identified genetically.
Bridled nailtail wallaby samples were not obtained from any of the cage or hair traps
around the release site near the northern dam (Alice’s dam) which is surrounded by mature
brigalow with little understorey (Appendices 1 & 2). Fisher (2000) found that bridled nailtail
wallabies from the remnant population at Taunton NP did not inhabit open grassy woodlands,
such as silver-leafed ironbark communities, preferring a vegetation structure that consists of
more woody stems and a dense canopy cover at 0.5 m high (predominantly brigalow regrowth).
The single outlier hair trap that collected numerous bridled nailtail wallaby hair samples was
approximately 1.5 km away from all the other successful hair traps. This hair trap was situated
within a poplar box, brigalow mix community (RE 11.10.12) with some low scrubs on the edge
of a 20-30 m wide cleared fire break that adjoins a cleared paddock (Appendix 1). All the other
hair traps around this block (eastern and northern side) were placed under small sparse regrowth
within the cleared firebreak.
4.2 Trap method
The cage trapping event on Avocet NR conducted in June 2011, appears to have provided an
inaccurate count of the number of bridled nailtail wallabies, trapping a total of 10 individuals.
This is significantly lower than the 66 individuals identified through genotyping of hair trapped
samples in October 2011. The low cage capture rate may have been influenced by factors such as
trap preparation. As a result of the long wet season and the use of the cage traps from other
sites, pre-feeding was only conducted for one week prior to trapping instead of the minimum two
weeks normally undertaken (J. Lowry, pers. com. 2011). Unlike the other two bridled nailtail

Non-invasive Genetic Hair Sampling Page 22
wallaby populations in Qld, the Avocet NR population is infrequently surveyed and animals may
have become unfamiliar with cage traps and attractants, possibly resulting in the low trapping
rates (Barnett & Dutton 1995). If this were the case, then a longer pre-feeding time would need
to be employed to ensure the likelihood that trapping individuals is consistent with that of other
bridled nailtail wallaby populations.
With the likelihood of a small population size of bridled nailtail wallabies on Avocet NR,
rectifying these inconsistencies may improve the capture rate. However, cage trapping is still
unlikely to provide an accurate estimate of population size owing to the small sample size
obtained from live trapping (Henry & Russello 2011). For small population sizes (<100) capture
probabilities of >0.30 are required for accurate population estimates (Marucco et al. 2011), with
recaptures occurring over multiple occasions for all individuals (Minta et al. 1989). Non-invasive
genetic sampling has the advantage of obtaining recaptures from a single sampling session (Petit
& Valiere 2006). Capture heterogeneity can be a concern when using trapping data in models
such as CMR (Minta et al. 1989; Dreher et al. 2009; Ebert et al. 2010). Overall, there appears to be
no substantial evidence to suggest a difference in sex ratio when cage trapping bridled nailtail
wallabies (Kingsley et al. 2012), although this should be tested for hair sampling by sexing DNA
samples from hair trapped individuals.
The use of triangle and runway hair traps across Avocet NR proved very effective. This
technique collected 422 bridled nailtail wallaby hair samples on the four sampling occasions (18
nights), compared to cage trapping returning only 20 captures over eight occasions (four nights).
Triangles produced more hair samples per trap than did runway traps. It is unclear whether these
additional samples provided additional information on the number of individuals or population
size of bridled nailtail wallabies due to the low percentage of identifiable individuals. To
minimise stress and to reduce any major impact live trapping may have on the population, cage
trapping is restricted to four consecutive nights (J. Lowry, pers. com. 2011). The ability to leave
hair traps out for an extended period of time significantly increases the sample size for use in a
CMR population size estimate (Banks et al. 2003; Depue & Ben-David 2007; Henry & Russello
2011). Hair trapping also enables a much larger area to be surveyed given that traps do not have
to be checked at a particular time of day or on a daily basis (Mowat & Strobeck 2000; Stenglein et
al. 2011).
When cage trapping bridled nailtail wallabies, the number of captures generally declines
over the trapping period with many individuals only trapped on one occasion. Cage trapping the
remnant Taunton NP population in 2012 saw 68% of bridled nailtail wallabies trapped only once,
over 11 occasions (A. Dinwoodie, pers. com. 2012). Where species show an avoidance to traps,

Non-invasive Genetic Hair Sampling Page 23
accurate population estimates are unlikely to be obtained (Depue & Ben-David 2007). Previous
CMR population modelling on cage trapped bridled nailtail wallabies have also estimated there to
be a smaller population size than the minimum known to be alive. In 2009, a population size of
40 bridled nailtail wallabies was estimated using the CMR method for Taunton NP while the
minimum known to be alive was found to be 70 (Augusteyn et al. 2010). Nuske (2010) identified
an additional 15 genotypes (individuals) with hair trapping that did not match the 46 bridled
nailtail wallaby genotypes obtained from cage trapping. IR cameras used prior to and during the
hair survey on Avocet NR showed that bridled nailtail wallabies had no hesitation in entering
triangles or approaching runways. Some individuals stayed at both triangle and runway traps for
up to 45 mins. Noisy trap doors and handling from researchers would lead to trap avoidance as
animals associate cage traps to a negative experience (Sloane et al. 2000; Depue & Ben-David
2007).
While live trapping has the advantage of obtaining critical health and age structure
information, the current CMR method appears to be inappropriate for estimating bridled nailtail
wallaby population size, given the inconsistency in recapturing individuals and random placement
of cage traps (Augusteyn et al. 2010). In order for the program MARK to produce an accurate
population size estimate based on CMR data, there must be an equal probability of trapping an
individual on each trapping occasion (Nichols 1992; Attiwill & Wilson 2006). This would require
traps to be placed in a grid pattern across their habitat and individuals to have a higher recapture
rate (Minta et al. 1989). Fisher et al. (2000) concluded that the most likely reason for inaccuracies
in CMR and capture-resight data resulted from the behaviour of bridled nailtail wallabies not
conforming to closed-population CMR assumptions.
CMR models have been successfully used to produce population size estimates using
non-invasive genetic material for northern hairy-nosed wombats (Lasiorhinus krefftii) (Banks et al.
2003), mountain goats (Oreamnos americanus) (Poole et al. 2011), bears (Romain-Bondi et al. 2004;
Gervasi et al. 2008), fishers (Martes pennanti) and American martens (M. Americana) (Williams et al.
2009) and otters (Depue & Ben-David 2007; Hajkova et al. 2009). Studies where hair trap data
have not produced accurate population size estimates may be attributed to ineffective hair
collection devices resulting in a small sample size for analysis with CMR models. Ruibal et al.
(2010) concluded that a food reward is necessary to obtain recaptures when hair sampling quolls.
Nuske (2010) conducted a pilot study on hair trap types and concluded that manufactured wafer
hair funnels were ineffective in collecting hair from bridled nailtail wallabies. She also found that
the use of a food reward attractant gained hair samples approximately three times faster for

Non-invasive Genetic Hair Sampling Page 24
similar trap types to those used in this study. To prevent the use of an inefficient trapping
system, that leads to small sample sizes, it is important to conduct a pilot study using a variety of
hair collection devices and attractants.
The use of hair traps as a means of identifying a larger number of individuals is now a
common method applied to mammal species with large home ranges, low population size or that
are cryptic in nature (Banks et al. 2003; Henry & Russello 2011; Marucco et al. 2011). Gervasi et
al. (2008) found the use of hair-snare based DNA data applied to CMR protocols to be
promising and powerful tools in estimating Apennine brown bear (Ursus arctos) population size.
Woods et al. (1999) found that of the 54 brown bears (U. arctos) identified from hair sampling, in
the Columbia River basin in Canada, only 12 had been previously caught in bear traps. Banks et
al. (2003) found a significant improvement in accuracy and precision when hair sampling
northern hairy-nosed wombats, estimating there to be between 96-150 wombats using this
method, compared to the 43-186 population estimate based on cage trapping data in 1993 (Hoyle
et al. 1995).
Where hairs are able to be macroscopically identified, as is the case with bridled nailtail
wallabies on Avocet NR, hair trapping may provide occupancy data (Mortelliti & Boitani 2008;
Williams et al. 2009) without requiring expensive genotyping. This would provide additional
information on possible survey locations that may be incorporated into survey designs using
other population estimate techniques.
4.2.1 Animal ethics
Live trapping of mammal species incur risks to the population; especially to endangered
populations whose numbers are already critically low (Banks et al. 2003). Live traps, such as cage
and foot-hold traps, are known to cause stress, and in some cases injury or even death. This may
result from direct contact with the trap, an increase in the likelihood of predation or changes in
environmental conditions while confined (overheating or freezing) (Lemckert et al. 2006). An
analysis of small mammal trapping studies, undertaken by Lemckert et al. (2006), found cage trap
mortality to be 0.6%.
Macropods (which include kangaroos and wallabies) are known to expel their young
when stressed and for this reason, after trapping, the pouch of a female carrying a medium to
large joey should be taped shut before release (Jackson 2003; Nolan 2012). The impact of live
trapping on bridled nailtail wallaby young-at-foot and pouch young post-release, as a result of live
trapping, remains unknown. Johnson (1997) conducted a study on bridled nailtail wallaby
reproduction and attributed the loss of pouch young during the study to the examination
procedure. Any disruption to the breeding cycle of an endangered species, particularity short-

Non-invasive Genetic Hair Sampling Page 25
lived species or those with long gestation periods, could be deemed unacceptable and may hinder
the recovery of the population. Hoyle et al. (1995) found a significant drop in the weight of
northern hairy-nosed wombats as a direct result of cage trapping. Using cage traps where animals
defecate inside has the potential to spread disease and parasites throughout the population or into
other populations where cage traps are shared (Jackson 2003; Nolan 2012). Hair traps are placed
at least 20 cm above the ground, are disposable and only used at one location, significantly
reducing any risk of spreading disease or parasites.
While non-invasive hair sampling removes most negative impacts that may be imposed
on an individual during invasive trapping, there may still be some risk of increased predation.
While the types of hair traps used in the study do not confine or impede the animals vision,
continually attracting individuals to a particular site still has the potential to increase the risk of
predation as some predators may become familiar with these sites as ideal hunting locations
(WPSA 2012). This may be reduced by establishing the minimum amount of time required to
conduct an effective survey and by implementing and maintaining a feral animal control program
(Augusteyn et al. 2010).
4.3 Genetic Analysis
Of the 422 hair samples collected, only 71 (17%) samples were able to be used to identify
individuals given that they amplified at four or more loci. While the poor amplification rate of
loci made it difficult to analyse the data, the identity of 66 different individuals was obtained from
hair samples. This is significantly higher than the 10 individuals identified through cage trapping.
For hair samples, the probability of identity (PI) was very high at 99%, showing that the use of
these loci can confidently distinguish between individuals and also siblings at 98%. With only a
small number of samples from known individuals and few recaptures, this study does not
conform to CMR assumptions and a population size estimate based on this model could not be
conducted. White (1982) found that small sample sizes tend to negatively bias population
estimates. Improvements in amplification success are likely to provide enough samples and
recaptures for CMR modelling. Hajkova et al. (2009) was able to establish a population size
estimate from non-invasively collected faecal samples using the CMR program CAPWIRE (Miller
et al. 2005). This program is especially appropriate for small populations (< 100) and
accommodates multiple samples in a single session, and also capture heterogeneity (Miller et al.
2005).

Non-invasive Genetic Hair Sampling Page 26
The results show all five loci to be out of Hardy Weinberg Equilibrium (HWE) meaning
that the population may be undergoing selection, have a small population size and/or individuals
do not mate at random (Ridley 2004). Studies have shown that male bridled nailtail wallabies
weighing >5.5 kg had mating priority and are most likely to sire offspring (Fisher & Lara 1999;
Sigg et al. 2005). Four of the five loci have positive inbreeding (FIS) values which could indicate
that the population is being forced to mate with common ancestors (Lindenmayer & Burgman
2005). DNA analysis from the Avocet population produced a total of 40 alleles for the five loci,
when compared to 55 alleles identified in the Taunton population in 2008, the Avocet population
is much less genetically diverse (Seddon 2008).
There are several reasons this population may appear to be out of HWE. The small
number of individual samples that could be genotyped at all five loci may have missed other
genotypes within the population (Marucco et al. 2011). Genotyping errors may cause alleles to be
incorrectly scored, as allelic dropout is known to occur at higher rates when using low quality
and/or small quantities of genetic material (Taberlet et al. 1996; Kalinowski et al. 2006).
Mutations may have occurred at the primer site, resulting in a failure of the large allele to amplify;
thus displaying a false homozygote (Marucco et al. 2011). The three loci with low amplification
rates (B29, B87 and B151) may have resulted in heterozygotes being scored as homozygotes,
causing these loci to appear out of HWE (Taberlet & Luikart 1999). The program Micro-checker
identified null alleles (which may result from either allelic dropout or mutations at the primer site)
as the most likely reason for three of the loci (B29, B87 and B151) to be out of HWE which
suggests that this population, on further analysis, may not actually deviate from HWE (Van
Oosterhout et al. 2004). The small amount of full siblings illustrated in Fig. 8 supports this
further.
If further sampling were to reveal this population to deviate from HWE it is most likely
owing to the small closed dynamic of the reintroduced Avocet NR bridled nailtail wallaby
population. Small isolated populations may have high levels of homozygosity and therefore, less
diversity as individuals have no choice but to breed with relatives (Hedrick & Kalinowski 2000;
Attiwill & Wilson 2006).
The procedures followed for collecting and extracting the hair samples may have
contributed to the poor amplification of three of the five loci. Poor amplification may have
resulted from the length of time the hair remained on the tape in the field, the time from
collection to extraction or the extraction method itself (chelex). Banks et al. (2003) collected
wombat hair tapes on a daily basis and extracted DNA nightly to improve DNA quality, while
Ruibal et al. (2010) found that tapes left out for a week and extractions performed two weeks

Non-invasive Genetic Hair Sampling Page 27
after collection still provided reliable profiles from quoll hair samples for genotyping. Piggott et
al. (2006) found that the storage time of rock wallaby scats before DNA extraction had no
significant effect on amplification rate or error rate when testing samples stored from one to 48
months. Howler monkey (Alouatta pigra) hairs were extracted between one and seven months
after collection and had a 96% amplification success rate (Amendola-Pimenta et al. 2009). Based
on a study that assessed the preservation of hair samples, it was recommended to extract DNA
within six months of collection or earlier if large mitochondrial fragments are to be amplified
(Roon et al. 2003).
This study extracted DNA by using chelex which may not be the most effective method
for extracting DNA from such a small hair follicle, as is the case for bridled nailtail wallabies.
Nuske (2010) used a hair lysis buffer to extract bridled nailtail wallaby DNA from hair samples
and from the 90 samples identified as bridled nailtail wallaby, 43 amplified at six or more loci
(48%). Amendola-Pimenta et al. (2009) also used a lysis buffer and successfully amplified 86 of
89 samples from howler monkey hair samples (97%). The chelex method used for the Avocet
NR samples saw 71 samples amplify at four or more loci out of the 422 bridled nailtail wallaby
samples identified (17%). Chelex proved to be very successful in the extraction of northern
hairy-nosed wombat hair samples with a success rate of 97% for 10 loci (Banks et al. 2003).
Grizzly bear hair samples were also extracted using chelex and of the 608 extractions used for
fingerprinting, 491 (81%) successfully amplified (Mowat & Strobeck 2000). There are many
other extraction methods available, such as commercially available extraction kits that yield very
high extraction success. However, these kits can be very expensive so their amplification rate in
comparison to the above method should be investigated for cost effectiveness (Henry & Russello
2011).
The bridled nailtail wallaby markers previously designed for use on tissue extractions may
not be appropriate for use on small quantities of low quality DNA. The length of fragment for
each locus appeared to influence the success of amplification, as shown in Table 1. The use of
short fragments can significantly improve amplification and error rates (Taberlet et al. 1999;
Broquet et al. 2007; Henry & Russello 2011). Broquet et al. (2007) also found that small
(dinucleotide) repeat motifs improve amplification and reduce error rates associated with allelic
dropout for non-invasive extractions. Prior to conducting a hair trapping survey on quolls,
Ruibal et al. (2010) redesigned the primers to reduce their fragment length.
Effective population size (Ne) determines the rate at which genes are likely to be lost
from the population. The genetic information gathered from a population is also able to provide
information about mating systems, reproductive demography and fluctuations in population size,

Non-invasive Genetic Hair Sampling Page 28
all of which is crucial for effectively managing wild and captive animal populations (Lindenmayer
& Burgman 2005; Janecka et al. 2008). The programs COLONY and ONeSAMP determined the
genetic structure of the bridled nailtail wallaby population on Avocet NR, showing a high
proportion of relatedness within the population (Fig. 8). Without an estimate of the population
size, it is difficult to establish how genetically diverse the population is as a whole. However, if
we consider the Ne of the Avocet NR bridled nailtail wallaby population to be 33 and the actual
population size to be 66 then the rate of loss of genetic diversity (genetic drift) will be double that
of an ideal randomly mating population (Lindenmayer & Burgman 2005). In this instance, it is
likely that unique genotypes have been missed as a result of poor amplification rates.
With natural increases in genetic diversity occurring at extremely slow rates through
genetic mutations, isolated populations with low genetic variation are likely to undergo increased
rates of genetic drift (homozygosity) (Lindenmayer & Burgman 2005; Attiwill & Wilson 2006).
This can increase the chance that deleterious recessive conditions, that reduce fitness, will
become prevalent and may ultimately lead to a rapid decline and possible local extinction of the
population (Attiwill & Wilson 2006). In most cases, the genetic diversity of a population is
directly related to its survival (Lindenmayer & Burgman 2005) and knowing and being able to
increase the Ne is a critical part of managing populations founded on selected genetic stock
(Lindenmayer & Burgman 2005). Such information will assist in managing genetic diversity and,
therefore, the ability of the individuals to survive and the population to persist.
4.4 Cost effectiveness
Many studies have found that non-invasive genetic sampling is much more cost effective than
traditional methods where species are widespread and secretive (Woods et al. 1999; Gervasi et al.
2010). For both cage and hair trapping the cost of staff wages and vehicle costs are comparable
across both methods. The initial cost of cage trapping is quite substantial given the cost of cage
traps while the cost of analysis for each hair trap survey incurs high genotyping costs (Appendix
6). The cost comparison shows that it would cost less to conduct a cage trap survey than to
conduct a hair trap survey on an annual basis (Fig. 9). If the aim of the survey is to compare a
minimum number of individuals known to be alive as an index of population fluctuation, then
cage trapping may be the most cost effective method if the population is of a trappable size
(Attiwill & Wilson 2006).
However, in order to effectively manage an isolated population of an endangered species,
such as the bridled nailtail wallaby, it is potentially more important to monitor the effective
population size (Ne) as a direct measure of the populations’ response to management actions and
ability to survive over the long-term (Lindenmayer & Burgman 2005; Attiwill & Wilson 2006).

Non-invasive Genetic Hair Sampling Page 29
DNA from cage trapped individuals can be genotyped to analyse their genetic variability at an
additional cost of about $33/sample which is not included in the cost comparison here (K. Real,
pers. com. 2012). In order to establish the rate at which genes are likely to be lost from the
population, an estimate of the population size as well as the Ne is required for effective
management (Lindenmayer & Burgman 2005).
Where the long-term viability of a population is in doubt and management actions are in
place aimed at positively influencing the population, then an accurate population size estimate
and knowing the effective population size (Ne) is essential. Hair trapping, regardless of the cost,
is presently the only method that is likely to provide an accurate estimate of population size and
essentially Ne.
Costs associated with hair trapping may be further reduced by sampling only those areas
that contain the preferred habitat of bridled nailtail wallabies or by testing other hair sampling
approaches such as only using runways or collecting samples over a shorter period of time or
over fewer occasions. As suggested by Marucco et al. (2011) sample size should be increased by
improving laboratory techniques rather than by collecting additional samples.
Conducting a hair trap survey would provide a population estimate and additional
information such as population demography and genetic structure. It would, however, fail to
provide other critical information such as the health and age structure of the population. Hair
sampling should, therefore, be incorporated into a range of other techniques, such as selective
live trapping, aimed at gathering as much information about the population as possible with the
least amount of negative impact. This approach has been successfully adopted for the northern
hairy-nosed wombat (Sloane et al. 2000; Banks et al. 2003). For estimating the population size of
otters (Lutra lutra) a combination of snow tracking and non-invasive genetic faecal sampling was
determined as the most effective method (Hajkova et al. 2009).
The cost of genetic analysis is reducing as new technologies and techniques are adopted
which intern will reduce the cost of hair sampling in the future. Williams et al. (2009)
recommends, using a few highly variable loci to identify individuals and the improvement of
extraction methods to reduce waste of laboratory materials and time. Species identification with
mitochondrial DNA (mtDNA) may assist in instances where hair is difficult to macroscopically
identify or where multiple species are likely to amplify on some or all of the markers, as is the
case with black-stripe wallabies (Macropus dorsalis) and bridled nailtail wallabies (Nuske 2010). The
use of mtDNA to distinguish between species will prevent expensive genotyping of non-target
species (Waits & Paetkau 2005; Williams et al. 2009).

Non-invasive Genetic Hair Sampling Page 30
This method of non-invasive genetic sampling is easily transferable to other species. The
use of triangle and runway traps could be modified for larger or smaller species and a pilot study
would determine the best method. The genetic analysis process would be similar for different
species although different extraction methods may work better depending on the sampling
method and amount of DNA able to be obtained from the sample (Taberlet et al. 1999). Similar
hair sampling methods have also been used in conjunction with other non-invasive methods such
as scat analysis and also invasive live trapping to maximise the sample size of species who are
extremely cryptic or have large or inaccessible home ranges (Williams et al. 2009; Poole et al. 2011;
Stenglein et al. 2011).
Non-invasive Genetic Hair Sampling Page 31
5. Recommendations
5.1 Hair trapping
It is recommended that baited runway and triangle traps, as outlined in this study, be used until
the proportion of individuals trapped by both methods can be tested and compared. The use of
only runway traps may reduce costs in terms of trap materials and staff set-up time. The triangles
may, however, provide additional samples and therefore increase the number of viable DNA
extracts that can be used in the population estimate. Using more runways may negate the need to
use triangles, but this would need to be tested. Multiple collection periods are not necessary
when modelling CMR data. Recaptures can be obtained when using non-invasive genetic hair
samples from a single sampling session (Petit & Valiere 2006). A large number of samples would
need to be collected over one occasion for this method to apply (Miller et al. 2005).
Placement of hair traps should focus on but not be limited to areas most likely to obtain
bridled nailtail wallaby samples. The focus of trap locations should be in brigalow, poplar box
and rosewood communities with a low shrub layer at 0.5 m which are preferred bridled nailtail
wallaby habitat (Fisher 2000). The placement of additional traps south along the eastern
boundary may detect additional bridled nailtail wallabies (Appendix 1). Where there are cleared
areas along the road edges, traps should be walked in and placed along the scrub edge. Radio
tracking has shown that cover is important for bridled nailtail wallabies when feeding at night
(Fisher 2000).
5.2 Genetic analysis
Prior to any further application of this method for bridled nailtail wallaby populations, it
is recommended that the genetic analysis method be refined to reduce the error rate and ensure a
high amplification rate while still allowing for a high individual and sibling exclusion probability
(PI) (Taberlet & Luikart 1999; De Barba & Waits 2010). It is recommended that the sample size
be increased by concentrating on improving amplification success in the laboratory rather than by
increasing the number of samples collected in the field (Marucco et al. 2011). Petit and Valiere
(2006) found that genotyping errors for non-invasive samples did not substantially bias
population size estimates when suitable field and laboratory protocols were followed. Strict
protocols should be in place to prevent contamination such as the addition of extraction and
PCR negatives for each group and repeat genotyping (Stenglein et al. 2010).
Extraction of DNA should take place as soon as possible after collection and trials
should be conducted on different extraction methods for bridled nailtail wallaby hair. This may
include changing the extraction method from chelex to the hair lysis method used by Nuske

Non-invasive Genetic Hair Sampling Page 32
(2010). The drawback of the latter method is that extraction requires the use of a PCR machine
or heat block rather than simply boiling the sample for 10 minutes as required for chelex
extractions. Chelex is, however, not recommended for long term storage. It is known to have a
comparatively shorter storage life than other extraction methods (Waits & Paetkau 2005).
In order to prevent genotyping of non-target species, a small fragment of mitochondrial
DNA (mtDNA) could be used to distinguish between species where macroscopic identification
of hair is difficult. Species can be effectively identified using small mtDNA fragments prior to
genotyping (Mowat & Strobeck 2000; Waits & Paetkau 2005). Downey et al. (2007) successfully
distinguished between gray fox (Urocyonc inereoargente), deer (Odocoileus spp.) and bobcat (Lynx rufus)
hair samples using a sequence-based analysis of the 16S rRNA mitochondrial gene. The use of
microsatellite DNA with clear differentiation of allele sizes between species would prevent the
inclusion of non-target species although still requires expensive genotyping (Gervasi et al. 2010;
Reiners et al. 2011). New microsatellite markers that have a fragment length <150 bps and that
have high amplification and low error rates when tested on hair extractions, need to be developed
to improve efficiency (Taberlet et al. 1999; Broquet et al. 2007; Henry & Russello 2011). Where
possible, markers with short repeat motifs that have high amplification rates with low allelic drop
should be considered (Broquet et al. 2007). Shorter repeat motifs, such as dinucleotide repeat
motifs may, however, be harder to score and increase scoring errors resulting from stutter bands
(Taberlet & Luikart 1999; Hajkova et al. 2009).
Fewer markers with high variability that still maintain a high probability of identity (PI)
should be used when estimating population size. Williams et al. (2009) found that of the 11
martin and 10 fisher loci screened they required only six for each species to achieve the desired
P(ID) and P(ID)sib when using hair samples. To reduce costs, it is recommended to use the smallest
number of highly variable markers possible to unambiguously discriminate individual genotypes
(Waits & Paetkau 2005; Williams et al. 2009). Where homozygous excess is present in
populations the use of additional polymorphic loci is likely to be necessary (Sloane et al. 2000).
Finding a balance between the numbers of loci needed to minimise cost while still allowing for
the calculation of the Ne would be the most effective use of the samples.
Different models aimed at estimating population size, such as in the program CAPTURE
(White et al. 1982) and the CAPWIRE method based on simple urn modelling, should be tested
(Miller et al. 2005).

Non-invasive Genetic Hair Sampling Page 33
This non-invasive genetic hair sampling method, based on a population of bridled nailtail
wallabies on Avocet NR, showed the potential of such a method in the capture of a much larger
proportion of the population when compared to live trapping with cages. This study shows that
hair sampling has the potential to estimate population size based on CMR assumptions and, more
importantly, enables the effective population size to be measured and monitored. Based on the
current techniques, cage trapping is unable to determine an accurate population size estimate of
bridled nailtail wallabies, although it is the only method able to obtain critical health and age
structure information. If an accurate population estimate and ultimately, an estimate of effective
population size (Ne) are crucial for management reasons, it is recommended that a non-invasive
genetic hair sampling program be conducted.

Non-invasive Genetic Hair Sampling Page 34
References
Amendola-Pimenta M., Garcia-Feria L., Serio-Silva J.C. & Rico-Gray V. (2009) Noninvasive Collection of Fresh Hairs From Free-Ranging Howler Monkeys for DNA Extraction. American Journal of Primatology 71, 359-63.
Amstrup S.C., McDonald T.L. & Manly B.F.J. (2005) Handbook of Capture-Recapture Analysis. Princeton University Press, Oxfordshire.
Attiwill P. & Wilson B. (2006) Ecology an Australian Perspective. Oxford University Press, Melbourne, Australia.
Augusteyn J.D., Hemson G., Bennison K.A., Allen L.R., Wyland J., Nolan B.J. & Kerr R.J. (2010) Determining the effectiveness of wild dog control at Taunton National Park (Scientific) and its impacts on the population of bridled nailtail wallabies. In: 2010 Qld Pest Symposium, Gladstone.
AWC (2012) Australian Wildlife Conservancy. URL http://www.australianwildlife.org/Contact-Us.aspx. Banks S.C., Hoyle S.D., Horsup A., Sunnucks P. & Taylor A.C. (2003) Demographic monitoring of an
entire species (the northern hairy-nosed wombat, Lasiorhinus krefftii) by genetic analysis of non-invasively collected material. Animal Conservation 6, 101-7.
Barnett A. & Dutton J. (1995) Expedition Field Techniques, Small Mammals (excluding bats). Royal Geographical Society, London.
BHA (2012) Goonderoo Reserve, Heart of the Brigalow Belt. URL http://www.bushheritage.org.au/our_reserves/state_queensland/reserves_goonderoo.
Bremner-Harrison S., Harrison S.W.R., Cypher B.L., Murdoch J.D., Maldonado J. & Darden S.K. (2006) Development of a single-sampling noninvasive hair snare. Wildlife Society Bulletin 34, 456-61.
Broquet T., Menard N. & Petit E. (2007) Noninvasive population genetics: a review of sample source, diet, fragment length and microsatellite motif effects on amplification success and genotyping error rates. Conservation Genetics 8, 249-60.
Chapman T., Sims C. & Mawson P. (2005) Minimising Disease Risk in Wildlife Management. Department of Conservation and Land Management, Western Australia.
Creel S., Spong G., Sands J.L., Rotella J., Zeigle J., Joe L., Murphy K.M. & Smith D. (2003) Population size estimation in Yellowstone wolves with error-prone noninvasive microsatellite genotypes. Molecular Ecology 12, 2003-9.
De Barba M. & Waits L.P. (2010) Multiplex pre-amplification for noninvasive genetic sampling: is the extra effort worth it? Molecular Ecology Resources 10, 659-65.
Depue J.E. & Ben-David M. (2007) Hair sampling techniques for river otters. Journal of Wildlife Management 71, 671-4.
DERM (2011a) Bridled nailtail wallaby. URL http://www.derm.qld.gov.au/wildlife-ecosystems/wildlife/threatened_plants_and_animals/endangered/bridled_nailtail_wallaby.html.
DERM (2011b) Nature Refuges Information Sheet. (ed. by Management DoEaNR). DERM (2012) Regional Ecosystems. URL http://www.derm.qld.gov.au/wildlife-
ecosystems/biodiversity/regional_ecosystems/introduction.html. Downey P.J., Hellgren E.C., Caso A., Carvajal S. & Frangioso K. (2007) Hair snares for noninvasive
sampling of felids in North America: Do gray foxes affect success? Journal of Wildlife Management 71, 2090-4.
Dreher B.P., Rosa G.J.M., Lukacs P.M., Scribner K.T. & Winterstein S.R. (2009) Subsampling Hair Samples Affects Accuracy and Precision of DNA-Based Population Estimates. Journal of Wildlife Management 73, 1184-8.
Ebert C., Huckschlag D., Schulz H.K. & Hohmann U. (2010) Can hair traps sample wild boar (Sus scrofa) randomly for the purpose of non-invasive population estimation? European Journal of Wildlife Research 56, 583-90.
Fisher D.O. (2000) Effects of vegetation structure, food and shelter on the home range and habitat use of an endangered wallaby. Journal of Applied Ecology 37, 660-71.
Fisher D.O., Hoyle S.D. & Blomberg S.P. (2000) Population dynamics and survival of an endangered wallaby: A comparison of four methods. Ecological Applications 10, 901-10.

Non-invasive Genetic Hair Sampling Page 35
Fisher D.O. & Lara M.C. (1999) Effects of body size and home range on access to mates and paternity in male bridled nailtail wallabies. Animal Behaviour 58, 121-30.
Flannery T., Kendal P. & Wynn-Moylan K. (1990) Australia’s Vanishing Mammals. Readers Digest Pty Ltd, Australia.
Gervasi V., Ciucci P., Boulanger J., Posillico M., Sulli C., Focardi S., Randi E. & Boitani L. (2008) A preliminary estimate of the Apennine brown bear population size based on hair-snag sampling and multiple data source mark-recapture Huggins models. Ursus 19, 105-21.
Gervasi V., Ciucci P., Davoli F., Boulanger J., Boitani L. & Randi E. (2010) Addressing challenges in non invasive capture-recapture based estimates of small populations: a pilot study on the Apennine brown bear. Conservation Genetics 11, 2299-310.
Gordon G. & Lawrie B.C. (1980) The Rediscovery of the Bridled Nail-Tailed Wallaby, Onychogalea fraenata (Gould) (Marsupialia : Macropodidae) in Queensland. Australian Wildlife Research, 339-45.
Hajkova P., Zemanova B., Roche K. & Hajek B. (2009) An evaluation of field and noninvasive genetic methods for estimating Eurasian otter population size. Conservation Genetics 10, 1667-81.
Hedrick P.W. & Kalinowski S.T. (2000) Inbreeding depression in conservation biology. Annual Review of Ecology and Systematics 31, 139-62.
Hendrikz J.K. & Johnson P.M. (1999) Development of the bridled nailtail wallaby, Onychogalea fraenata, and age estimation of the pouch young. Wildlife Research 26, 239-49.
Henry P. & Russello M.A. (2011) Obtaining high-quality DNA from elusive small mammals using low-tech hair snares. European Journal of Wildlife Research 57, 429-35.
Hoyle S.D., Horsup A.B., Johnson C.N., Crossman D.G. & McCallum H. (1995) Live-trapping of the northern hairy-nosed wombat (Lasiorhinus krefftii): Population-size estimates and effects on individuals. Wildlife Research 22, 741-55.
Jackson S. (2003) Australian Mammals Biology and Captive Management. CSIRO Publishing, Collingwood, VIC, Australia.
Janecka J.E., Tewes M.E., Laack L.L., Grassman L.I., Jr., Haines A.M. & Honeycutt R.L. (2008) Small effective population sizes of two remnant ocelot populations (Leopardus pardalis albescens) in the United States. Conservation Genetics 9, 869-78.
Johnson P.M. (1997) Reproduction in the bridled nailtail wallaby, Onychogalea fraenata Gould (Marsupialia: Macropodidae), in captivity. Wildlife Research 24, 411-5.
Jones O. & Wang J. (2009) COLONY: a program for parentage and sibship inference from multilocus genotype data. Molecular Ecology Resources 10, 551–5.
Kalinowski S.T., Taper M.L. & Creel S. (2006) Using DNA from non-invasive samples to identify individuals and census populations: an evidential approach tolerant of genotyping errors. Conservation Genetics 7, 319-29.
Kalinowski S.T., Taper M.L. & Marshall T.C. (2007) Revising how the computer program CERVUS accommodates genotyping error increases success in paternity assignment. Molecular Ecology 16, 1099-106.
Kingsley L., Goldizen A. & Fisher D.O. (2012) Establishment of an Endangered species on a private nature refuge: what can we learn from reintroductions of the bridled nailtail wallaby Onychogalea fraenata? Oryx 46, 240-8.
Lemckert F., Brassil T., Kavanagh R. & Law B. (2006) Trapping small mammals for research and management: how many die and why? Australian Mammalogy, 201-7.
Lindenmayer D. & Burgman M. (2005) Practical Conservation Biology. CSIRO Publishing, Collingwood, VIC, Australia.
Lundie-Jenkins G. & Lowry J. (2005a) Recover plan for the bridled nailtail wallaby (Onychogalea fraenata) 2005-2009. (ed. by Agency EP), Brisbane.
Lundie-Jenkins G. & Lowry J. (2005b) Recovery plan for the bridled nailtail wallaby (Onychogalea fraenata) 2005-2009. Environment Protection Agency, Brisbane, Queensland.
MacLeod N.D., Kearney F.C., Spooner H. & Woods M. (2010) Conservation of critically endangered wildlife species – scope for private landholder and citizens' action. In: Proceedings of the 16th Biennial Conference of the Australian Rangeland Society (ed. by Waters DJEaC), Bourke.

Non-invasive Genetic Hair Sampling Page 36
Marucco F., Boitani L., Pletscher D.H. & Schwartz M.K. (2011) Bridging the gaps between non-invasive genetic sampling and population parameter estimation. European Journal of Wildlife Research 57, 1-13.
McCosker J. (1998) New Area Evaluation - Nature Refuge 'Avocet'. Queensland Deparment of Environment.
Miller C.R., Joyce P. & Waits L.P. (2005) A new method for estimating the size of small populations from genetic mark-recapture data. Molecular Ecology 14, 1991-2005.
Minta S.C., Clark T.W. & Goldstraw P. (1989) Population Estimates and Characteristics of the Eastern Barred Bandicoot in Victoria, with Recommendations of Population Monitoring. In: Management and Conservation of Small Populations (eds. by Clark TW & Seebeck JH), Melbourne, Australia.
Mortelliti A. & Boitani L. (2008) Inferring red squirrel (Sciurus vulgaris) absence with hair tubes surveys: a sampling protocol. European Journal of Wildlife Research 54, 353-6.
Mowat G. & Strobeck C. (2000) Estimating population size of grizzly bears using hair capture, DNA profiling, and mark-recapture analysis. Journal of Wildlife Management 64, 183-93.
Nichols J.D. (1992) CAPTURE-RECAPTURE MODELS. Bioscience 42, 94-102. Nolan B. (2012) Gloucester Island Petrogale persophone Survey Field Guide: 9 July - 27 July 2012.
Department of Environment and Resource Management, Mackay, Queensland. Nuske S. (2010) Can noninvasive genotyping methods be used as an alternative to traditional
population monitoring of the endangered bridled nailtail wallaby, Onchogalea fraenata? In: School of Biological Science, p. 40. University of Queensland.
Peakall R. & Smouse P.E. (2006) GENALEX 6: genetic analysis in Excel. Population genetic software for teaching and research. Molecular Ecology Notes 6, 288-95.
Petit E. & Valiere N. (2006) Estimating population size with noninvasive capture-mark-recapture data. Conservation Biology 20, 1062-73.
Piggott M.P., Banks S.C., Stone N., Banffy C. & Taylor A.C. (2006) Estimating population size of endangered brush-tailed rock-wallaby (Petrogale penicillata) colonies using faecal DNA. Molecular Ecology 15, 81-91.
Piggott M.P. & Taylor A.C. (2003) Remote collection of animal DNA and its applications in conservation management and understanding the population biology of rare and cryptic species. Wildlife Research 30, 1-13.
Pompanon F., Bonin A., Bellemain E. & Taberlet P. (2005) Genotyping errors: Causes, consequences and solutions. Nature Reviews Genetics 6, 847-59.
Poole K.G., Reynolds D.M., Mowat G. & Paetkau D. (2011) Estimating Mountain Goat Abundance Using DNA From Fecal Pellets. Journal of Wildlife Management 75, 1527-34.
Pope L.C., Sharp A. & Moritz C. (1996) Population structure of the yellow-footed rock-wallaby Petrogale xanthopus (Gray, 1854) inferred from mtDNA sequences and microsatellite loci. Molecular Ecology 5, 629-40.
Pople A.R., Lowry J., Lundie-Jenkins G., Clancy T.F., McCallum H.I., Sigg D., Hoolihan D. & Hamilton S. (2001) Demography of bridled nailtail wallabies translocated to the edge of their former range from captive and wild stock. Biological Conservation 102, 285-99.
Raymond M. & Rousset F. (1995) GENEPOP (VERSION-1.2) - POPULATION-GENETICS SOFTWARE FOR EXACT TESTS AND ECUMENICISM. Journal of Heredity 86, 248-9.
Real K.M., Schmidt D.J. & Hughes J.M. (2009) Mogurnda adspersa microsatellite markers: multiplexing and multi-tailed primer tagging. Conservation Genetics Resources 1, 411-4.
Reiners T.E., Encarnacao J.A. & Wolters V. (2011) An optimized hair trap for non-invasive genetic studies of small cryptic mammals. European Journal of Wildlife Research 57, 991-5.
Ridley M. (2004) Evolution. Blackwell Science Ltd, Victoria, Australia. Romain-Bondi K.A., Wielgus R.B., Waits L., Kasworm W.F., Austin M. & Wakkinen W. (2004) Density
and population size estimates for North Cascade grizzly bears using DNA hair-sampling techniques. Biological Conservation 117, 417-28.
Roon D.A., Thomas M.E., Kendall K.C. & Waits L.P. (2005) Evaluating mixed samples as a source of error in non-invasive genetic studies using microsatellites. Molecular Ecology 14, 195-201.

Non-invasive Genetic Hair Sampling Page 37
Roon D.A., Waits L.P. & Kendall K.C. (2003) A quantitative evaluation of two methods for preserving hair samples. Molecular Ecology Notes 3, 163-6.
Rousset F. (2008) GENEPOP ' 007: a complete re-implementation of the GENEPOP software for Windows and Linux. Molecular Ecology Resources 8, 103-6.
Ruibal M., Peakall R., Claridge A., Murray A. & Firestone K. (2010) Advancement to hair-sampling surveys of a medium-sized mammal: DNA-based individual identification and population estimation of a rare Australian marsupial, the spotted-tailed quoll (Dasyurus maculatus). Wildlife Research 37, 27-38.
Seddon J. (2008) Genetic Analysis of Bridled Nailtail Wallaby Dataset. University of Queensland. Sigg D.P. (2004) Population genetics and mating system in the single remnant and translocated
population of the endangered bridled nailtail wallaby, Onychogalea fraenata. In: School of Integrative Biology. The University of Queensland.
Sigg D.P., Goldizen A.W. & Pople A.R. (2005) The importance of mating system in translocation programs: reproductive success of released male bridled nailtail wallabies. Biological Conservation 123, 289-300.
Sloane M.A., Sunnucks P., Alpers D., Beheregaray L.B. & Taylor A.C. (2000) Highly reliable genetic identification of individual northern hairy-nosed wombats from single remotely collected hairs: a feasible censusing method. Molecular Ecology 9, 1233-40.
Stenglein J.L., Waits L.P., Ausband D.E., Zager P. & Mack C.M. (2010) Efficient, Noninvasive Genetic Sampling for Monitoring Reintroduced Wolves. Journal of Wildlife Management 74, 1050-8.
Stenglein J.L., Waits L.P., Ausband D.E., Zager P. & Mack C.M. (2011) Estimating gray wolf pack size and family relationships using noninvasive genetic sampling at rendezvous sites. Journal of Mammalogy 92, 784-95.
Taberlet P., Griffin S., Goossens B., Questiau S., Manceau V., Escaravage N., Waits L.P. & Bouvet J. (1996) Reliable genotyping of samples with very low DNA quantities using PCR. Nucleic Acids Research 24, 3189-94.
Taberlet P. & Luikart G. (1999) Non-invasive genetic sampling and individual identification. Biological Journal of the Linnean Society 68, 41-55.
Taberlet P., Waits L.P. & Luikart G. (1999) Noninvasive genetic sampling: look before you leap. Trends in Ecology & Evolution 14, 323-7.
Tallmon D.A., Koyuk A., Luikart G. & Beaumont M.A. (2008) ONeSAMP: a program to estimate effective population size using approximate Bayesian computation. Molecular Ecology Resources 8, 299-301.
Triggs B. & Brunner H. (2002) Hair ID Version 1.0. CSIRO Publishing, Victoria, Australia. Van Dyck S. & Strahan R. (2008) The Mammals of Australia Third edition. New Holland publishers
(Australia) Pty Ltd, Sydney. Van Emden H.F. (2008) Statistics for Terrified Biologists. Blackwell Publishing Ltd, Australia. Van Oosterhout C., Hutchinson W.F., Wills D.P.M. & Shipley P. (2004) MICRO-CHECKER: software for
identifying and correcting genotyping errors in microsatellite data. Molecular Ecology Notes 4, 535-8.
Waits L.P. & Paetkau D. (2005) Noninvasive genetic sampling tools for wildlife biologists: A review of applications and recommendations for accurate data collection. Journal of Wildlife Management 69, 1419-33.
Walker F.M., Sunnucks P. & Taylor A.C. (2006) Genotyping of "captured" hairs reveals burrow-use and ranging behavior of southern hairy-nosed wombats. Journal of Mammalogy 87, 690-9.
White G.C., Anderson D.R., Burnham K.P. & Otis D.L. (1982) Capture-recapture and removal methods for sampling closed populations. Los Alamos National Laboratory, Los Alamos, New Mexico, USA.
Williams B.W., Etter D.R., Linden D.W., Millenbah K.F., Winterstein S.R. & Scribner K.T. (2009) Noninvasive Hair Sampling and Genetic Tagging of Co-Distributed Fishers and American Martens. Journal of Wildlife Management 73, 26-34.
Woods J.G., Paetkau D., Lewis D., McLellan B.N., Proctor M. & Strobeck C. (1999) Genetic tagging of free-ranging black and brown bears. Wildlife Society Bulletin 27, 616-27.
WPSA (2012) Society Policies. URL http://www.wpsa.org.au/pdf/policy/WPSA_Policies.pdf.

Non-invasive Genetic Hair Sampling Page 38
Appendices
Appendix 1.
Map showing the location of Regional Ecosystems (REs) on and around Avocet NR including positive (green) and negative (red) hair trap locations. Description of major REs on Avocet NR (DERM 2012).
RE Brief description
11.4.9 Acacia harpophylla (brigalow) shrubby open forest to woodland with Terminalia oblongata (yellow-wood) on Cainozoic clay plains.
11.8.5 Eucalyptus orgadophila (mountain coolabah) open woodland on Cainozoic igneous rocks.
11.7.2 Acacia spp. woodland on lateritic duricrust. Scarp retreat zone.
11.9.1 Acacia harpophylla - Eucalyptus cambageana (Brigalow- Dawson blackbutt) open forest to woodland on fine-grained sedimentary rocks.
11.10.12 Eucalyptus populnea (poplar box) woodland on medium to coarse-grained sedimentary rocks.
11.10.3 Acacia catenulata or A. shirleyi open forest on coarse-grained sedimentary rocks. Crests and scarps.

Non-invasive Genetic Hair Sampling Page 39
Appendix 2.
Map of Avocet NR showing cage trap locations as either positive (green) or negative (red) bridled nailtail wallaby trap sites.

Non-invasive Genetic Hair Sampling Page 40
Appendix 3.
Examination form used during cage trapping at Avocet NR.

Non-invasive Genetic Hair Sampling Page 41
Appendix 4.
Map of Avocet NR showing hair trap locations as either positive (green) or negative (red) bridled
nailtail wallaby hair sample sites.

Non-invasive Genetic Hair Sampling Page 42
Appendix 5.
Hair identification sheet for Avocet NR (transcribed from Triggs and Brunner (2002).

Non-invasive Genetic Hair Sampling Page 43
Appendix 6.
Cost breakdown of trapping bridled nailtail wallabies on Avocet NR for cage and hair trapping.
Cage Trapping
Material Costs 130 cage traps
130 cage traps
Item Number Number Cost Total
Item Amount Unit Cost Total Traps inc. carpet 130 ea $265.00 $34,450
Traps inc. carpet 5 ea $265.00 $1,325
Zip ties 85 50pk $20.00 $1,700
Zip ties 5 50pk $20.00 $100
Flagging tape 5 ea $7.00 $35
Flagging tape 5 ea $7.00 $35
Hessian bags 20 ea $7.00 $140
Hessian bags 10 ea $7.00 $70 Microchip reader 4 ea $600.00 $2,400
Microchip reader 0.5 ea $600.00 $300
Spot lights/ torches 6 ea $100.00 $600
Spot lights/ torches 1 ea $100.00 $100
Gps 3 ea $150.00 $450
Gps 0.5 ea $150.00 $75
Ethanol 0.5 litre $20.00 $10
Ethanol 0.5 L $20.00 $10
Eppendorf tubes 1.5 ml 100 ea $0.25 $25
Eppendorf tubes 1.5 ml 60 ea $0.25 $15
Microchips 100 ea $10.00 $1,000
Microchips 60 ea $10.00 $600 Measuring instruments 3 ea $770.00 $2,310
Measuring instruments 0.5 ea $770.00 $385
Lucerne 4 bale $18.00 $72
Lucerne 4 bale $18.00 $72 Virkon (disinfectant) 1 ea $300.00 $300
Virkon (disinfectant) 0.25 ea $300.00 $75
Initial Costs $43,492
Ongoing Costs $3,162
Staff Costs
Item Staff Total Time Hrly rate Total cost TA Totals
Trap preparation (carpet) 1 40 $45.00 $1,800.00* $0.00
Trap Setup 2 40 $45.00 $1,800.00 $300.00
Pre-feed 2 55 $45.00 $2,475.00 $800.00
Check traps/clean 7 323 $45.00 $14,535.00 $2,800.00
Initial Cost $24,510
Ongoing $22,710
Vehicle Costs Analysis Costs
Item Amount Cost Total
Item Staff Time Hrly rate Total cost
Vehicle 5390km $0.25/km $1,348.00
Data analysis 1 21 $45.00 $67.00
Quad 250km $0.10/km $25.00
Modelling 1 8 $45.00 $54.00
Lease 1 $1,200.00 $1,200.00
Initial / Ongoing Cost $121
Initial / Ongoing Cost $2,573
Cage Trap CMR Survey
Initial Cost Total $70,676
Ongoing Cost Total $28,546
* required for initial set up only

Non-invasive Genetic Hair Sampling Page 44
Hair Trapping
Material Costs For 180 traps (102 triangles/78 runways)
For 180 traps (102 triangles/78 runways)
Item Number Unit Cost Total
Item Number Unit Cost Total
IR cameras 10 ea $250.00 $2,500
IR cameras 0.5 ea $250.00 $125
Flagging tape 5 ea $7.29 $36
Flagging tape 5 ea $7.29 $36
Cloth tape (50mmx25m) 4 ea $7.10 $28
Cloth tape (50mmx25m) 4 ea $7.10 $28
Steel bar 100 ea $2.00 $200
Steel bar 5 ea $2.00 $10 Rope (7mmx50m) 14 ea $15.95 $223
Rope (7mmx50m) 2 ea $15.95 $32
Tesa tape 30m roll 15 roll $32.70 $491
Tesa tape 30m roll 15 roll $32.70 $491
Greese proof paper (Glad) 4 ea $7.20 $29
Greese proof paper (Glad) 4 ea $7.20 $29
Envelopes (50/pk) 8 pk $7.10 $57
Envelopes (50/pk) 8 pk $7.10 $57
Sweet potato (donated by a local farmer) 5
20L bucket $0.00 $0
Sweet potato (donated by a local farmer) 5
20L bucket $0.00 $0
Lucerne 2 bale $18.00 $36
Lucerne 2 bale $18.00 $36
Initial Cost $3,600
Ongoing costs $844
Staff Costs
Item Staff Time Hrly rate Total cost TA Totals
Set up traps 4 119 $45.00 $5,355.00 $900.00
Prefeed 2 18 $45.00 $810.00 $0.00
Set traps (attach tape) 4 44 $45.00 $1,980.00 $600.00
Check traps 4 292 $45.00 $13,140.00 $2,400.00
Initial / Ongoing Cost $25,185
Vehicle Costs Analysis Costs
Item Amount Cost Total
Item Number Amount Cost Total cost
Vehicle 5440km $0.25/km $1,360.00
New markers 1 1 $3,000.00 $3,000.00*
Quad 800km $0.10/km $160.00
Genetic analysis inc. consumables 1 400 $30.00 $12,000.00
Lease 1 $1,200.00 $1,200.00
Data analysis 1 8 $45.00 $54.00
Initial /Ongoing $2,720
modelling 1 8 $45.00 $54.00
Initial Cost $15,108
Ongoing $12,108
Hair Trap CMR Survey
Initial Cost Total $46,613
Ongoing Cost Total $40,857
* required for initial set up only


![[PPT]PowerPoint Presentation · Web viewAdjectives and Descriptions Hair Styles and eye color Blonde hair Brown hair Red Hair Straight hair Curly hair Wavy hair Short hair Long hair](https://static.fdocuments.in/doc/165x107/5aae9c247f8b9a190d8c5594/pptpowerpoint-presentation-viewadjectives-and-descriptions-hair-styles-and-eye.jpg)