“Generative Mechanisms and Multivariate Statistical ... · Opportunity Inequality with a...
38
DOI 10.1007/s11135-005-3963-3 Quality & Quantity (2006) 40:721–758 © Springer 2006 “Generative Mechanisms and Multivariate Statistical Analysis: Modeling Educational Opportunity Inequality with a Multi-Matrix Log-Linear Topological Model: Contributions and Limitations” GIANLUCA MANZO ∗ Universit´ e Paris IV – Sorbonne, Groupe d’´ etude des m´ ethodes de l’analyse sociologique (GEMAS), Universit´ e de Trento, Dipartimento di sociologia e ricerca sociale Abstract. Among techniques for the quantitative analysis of categorical data, log-linear mod- els at present occupy a central place in social statistics, their sophistication and complexity having rapidly evolved over the past three decades. The article examines a specific variant of this approach to modeling which consists of log-linear topological models. It starts from the debate which followed introduction of the latter at the end of the 1970s to offer a new evalu- ation of the heuristic and methodological utility of this technique in light of recent discussion more generally concerned with the quantitative variables-based approach. In this regard, the article puts forward two arguments. It first maintains that log-linear topological models, espe- cially in their multi-matrix variant, are extremely useful in integrating sociological theory with empirical quantitative analysis. It then shows that the principal shortcoming of these models is that they only partially allow the accurate modeling of the generative mechanisms underlying all the empirical regularities observed in aggregate data. These models are thus very attractive in that they go beyond the descriptive level of numerous works in quantitative sociology, and yet they are incapable of yielding explanations founded on the notion of generative mecha- nisms. In order not to remain at the abstract level of epistemological reflection, the article will attempt to show the well-foundedness of this thesis by constructing a multi-matrix log-linear topological model for the analysis of a contingency table which cross-classifies social origin with the educational qualification. The model is then tested against French survey data. To the extent that this model attempts to express ideas drawn from a specific theoretical approach – that of ‘rational educational choice’ – the analysis can contribute to both the study and understanding of inequalities in educational opportunity. Key words: empirical quantitative sociology, log-linear topological modeling, generative mech- anisms, rational action, inequalities of educational opportunity ∗ Author for correspondence: 61, Avenue de la Motte Picquet, 75015 Paris, Tel: +0033- 1-56241189; E-mail: [email protected]
Transcript of “Generative Mechanisms and Multivariate Statistical ... · Opportunity Inequality with a...
DOI 10.1007/s11135-005-3963-3Quality & Quantity (2006) 40:721–758 © Springer 2006
“Generative Mechanisms and MultivariateStatistical Analysis: Modeling EducationalOpportunity Inequality with a Multi-MatrixLog-Linear Topological Model: Contributionsand Limitations”
GIANLUCA MANZO∗Universite Paris IV – Sorbonne, Groupe d’etude des methodes de l’analyse sociologique(GEMAS), Universite de Trento, Dipartimento di sociologia e ricerca sociale
Abstract. Among techniques for the quantitative analysis of categorical data, log-linear mod-els at present occupy a central place in social statistics, their sophistication and complexityhaving rapidly evolved over the past three decades. The article examines a specific variant ofthis approach to modeling which consists of log-linear topological models. It starts from thedebate which followed introduction of the latter at the end of the 1970s to offer a new evalu-ation of the heuristic and methodological utility of this technique in light of recent discussionmore generally concerned with the quantitative variables-based approach. In this regard, thearticle puts forward two arguments. It first maintains that log-linear topological models, espe-cially in their multi-matrix variant, are extremely useful in integrating sociological theory withempirical quantitative analysis. It then shows that the principal shortcoming of these models isthat they only partially allow the accurate modeling of the generative mechanisms underlyingall the empirical regularities observed in aggregate data. These models are thus very attractivein that they go beyond the descriptive level of numerous works in quantitative sociology, andyet they are incapable of yielding explanations founded on the notion of generative mecha-nisms. In order not to remain at the abstract level of epistemological reflection, the article willattempt to show the well-foundedness of this thesis by constructing a multi-matrix log-lineartopological model for the analysis of a contingency table which cross-classifies social originwith the educational qualification. The model is then tested against French survey data. To theextent that this model attempts to express ideas drawn from a specific theoretical approach– that of ‘rational educational choice’ – the analysis can contribute to both the study andunderstanding of inequalities in educational opportunity.
Key words: empirical quantitative sociology, log-linear topological modeling, generative mech-anisms, rational action, inequalities of educational opportunity
∗ Author for correspondence: 61, Avenue de la Motte Picquet, 75015 Paris, Tel: +0033-1-56241189; E-mail: [email protected]

722 GIANLUCA MANZO
1. Introduction
Analysis of social stratification phenomena is a field in which the vari-ables-based approach has achieved a very high level of sophistication(Cobalti, 1995; Goldthorpe, 2000; Raftery, 2001; Ballarino and Cobalti,2003). Among the most complex methods used, the type of log-linearmodel known as ‘topological’ has had an unusual history. These modelswere first introduced at the end of the 1970s (Featherman and Hauser,1978, chap. 4; Hauser, 1978, 1979) and thereafter, for around 10 years, theyprovoked wide-ranging technical debate (Hauser, 1981, 1986, 1987; Hope,1981; MacDonald, 1981, 1983; Pontinen, 1982; Jones, 1985, 1986; Kim,1987). Unlike other advanced techniques, this variant of log-linear mod-eling has been used by relatively few studies. With the exception of rareattempts to analyze the relation between origins and educational qualifica-tions (Cobalti, 1992, 1996), the few studies to have undertaken topologi-cal modeling have been confined to analysis of intergenerational mobility(Goldthorpe [and Payne], 1980, chap. 4; Grusky and Hauser, 1984; Joneset al., 1990; Wong, 1990; Erikson and Goldthorpe 1992, chap. 4–5; Cobaltiand Schizzerotto, 1994, chap. 8; Goldthorpe, 1995) or, even more rarely, ofintragenerational mobility (Stier and Grusky, 1990). Moreover, the ‘inno-vation rate’ has been slow: the majority of studies apply a narrow rangeof models, notably Erikson–Goldthorpe’s model originally proposed in TheConstant Flux (1992: 121–131). In this respect, the recent study of inter-generational mobility in eleven European countries directed by RichardBreen (2004) is a significant example: most of the ‘national’ chapters of thisimportant study use – with some variations – Erikson–Golthorpe’s ‘coresocial fluidity model’ (see in particular chapters 4, 5, 8, 10–13).
Could the rarity of these models be due to their weakness? Ever sincetheir introduction, many researchers have commented on their ‘indetermi-nate’ nature, meaning that numerous different matrix specifications couldfit the data equally well (MacDonald, 1981, 1983; Pontinen, 1982; see alsoHout, 1983: 46–51; Jones, 1986; Jones et al., 1990). The ‘equivalent models’problem thus seems to render this class of log-linear models largely vacu-ous. But this criticism is only valid if one acknowledges a major failure inthe field of study in which these models have been applied: the shaky theo-retical bases of studies on stratification phenomena.1 Given solid theories,the extent of the ‘equivalent models’ problem would change radically, forthe choice between different matrix configurations would now be made ontheoretical, not empirical, grounds. From this point of view, the problemwould reside not in the method but in its applications.
In light of recent discussion on the so-called ‘quantitative empirical soci-ology’ approach,2 however, this article will attempt to re-evaluate log-lineartopological models, and in particular their multi-matrix variant. Addressing

GENERATIVE MECHANISMS AND MULTIVARIATE STATISTICAL ANALYSIS 723
the problem from this angle will allow a different perspective to be takenon the method, because an evaluation will be proposed that takes accountas much of its attractions as of its principal limitation.
It is at present widely acknowledged that: a) there is a gap between socio-logical theory and empirical research (Coleman, 1990: chap. 1; Hedstromand Swedberg, 1996; Boudon, 1997, 2002; Goldthorpe, 1997, 2000, intro.and chap. 12, 2003a; Cuin, 2000); and b) that it is impossible to constructgood sociological explanations without drawing upon the sociology of gener-ative mechanisms (Stinchcombre, 1991; Blossfeld, 1996; Bunge, 1997, 1998;Boudon, 1998, 2003; Hechter, 1998; Hedstrom and Swedberg, 1998b; Vanden Berg, 1998; Cherkaoui, 2000, 2004; Barbera, 2004; Hedstrom, 2005).3
This does not argue in favor of ‘empirical quantitative sociology’, where thedecoupling of theory from empirical inquiry is particularly radical (Pawson,1989; Freedman, 1991a, b; Sorensen, 1998; Backman and Edling, 1999;Goldthorpe, 2000, chap. 5: 98; Berger, 2002).4 Undervaluation of the notionof ‘generative mechanism’ traps this approach in a narrow conception of cau-sality (Abell, 1984; Abbott, 1992a, b; Cox, 1992; Cox and Wermuth, 1993;Goldthorpe, 2000 chap. 7); indeed, the absence of modeling by generativemechanisms limits the explanatory capacity of the quantitative approach tosuch an extent that the latter is reduced to being a largely descriptive activ-ity (Bunge, 1997; Elster, 1998, 2003; Hedstrom and Swedberg, 1998b: 17;Sorensen, 1998; Cherkaoui, 2000, 2003; Goldthorpe, 2000, chap. 7: 152, 153;Hedstrom, 2003).
There thus emerges a clear opposition between a methodology centeredon mechanisms and an approach founded on variables; whilst the former isexplanatory, the latter is nothing but a more or less sophisticated descrip-tion.5 Though certain authors recognize the somewhat crude character ofthis opposition (Pawson, 1989: 160–167; Blossfeld, 1996: 185, n. 36; Gruskyand DiCarlo 2001), it cannot be denied that the ‘degree of permeability’of multivariate analysis to the modeling of generative mechanisms is a cru-cial methodological issue. With these problems in mind, it is instructive toreturn to log-linear topological models. On the one hand, the careful use ofthese models suggests that the variable approach can produce theoreticallyoriented and informed empirical analyses. On the other, thorough analysisof this method paradoxically suggests that complete implementation of thenotion of generative mechanism is probably not possible in the context ofmultivariate analysis.
I shall attempt to illustrate the well-foundedness of this thesis by meansof a concrete example. I shall construct a multi-matrix topological modelwith which to analyze the relation between social origin and educationalqualification and then test this model using French empirical data. Thiswill involve:
724 GIANLUCA MANZO
(1) determining the ‘explanandum’ and describing it by means of a con-cise association measure (the Generalized Odds Ratio, GOR);
(2) constructing a set of theoretical hypotheses about ‘mechanisms’ or‘processes’ presumed to be at the origin of the two-way associationdescribed in (1);
(3) translating these hypotheses into a set of level matrices (constructionof a multi-matrix topological model);
(4) estimating the parameters of the model and comparing the theoreticaldata that it produces with the observed data described in (1).
Although in what follows the focus will be more on the methodologi-cal implications of the analysis than on its substantial findings, two impor-tant features of the study should be noted. First, while numerous empiricalstudies have described the structure and temporal evolution of the associ-ation between social origin and educational attainment in France (Garnierand Raffalovich, 1984; Smith and Garnier 1986; Muller and Karle, 1993;Thelot and Vallet, 2000; Vallet, 2004a), very few attempts have been madeto explain that association (Goux and Maurin, 1995: 95–105). It is pre-cisely this explanation that is proposed here, and, moreover, by means ofan unusual method. Secondly, the theoretical model at the origin of phase(2) of the analysis is largely based on what is now termed the ‘rationaleducational choice approach’ (see Section 2). The testing of variants of thismodel has begun in several countries: in Italy (Schizzerotto, 1997; Ballari-no and Bernardi, 2000), Great Britain (Breen and Yaish, 2003), Denmark(Davies et al., 2002), Germany (Becker, 2003; Hillmert and Jacob, 2003),and Sweden (Jonsson and Erikson, 2000). I am not aware of any studiesof this type for France and shall consequently propose one. And I shall doso, moreover, with the help of a technique different from those used in theworks just cited.
1. What needs explaining? The configuration of relativeeducational opportunities
Consider the data set out in Table I,6 which gives an initial idea of inequal-ities of educational opportunity in France at the beginning of the 1990s.7
On comparing row for row the calculated percentages relative to total num-bers for each group (‘outflow’ perspective), one notes that the proportionof individuals attaining higher-level qualifications abruptly diminishes asone descends toward socially underprivileged groups. A similar pattern, butin reverse, is apparent at the middle and lower levels of the educationalsystem.8
Although interesting, these crude figures only show the distribution bysocial group of the total volume of available instruction – the absolute

GENERATIVE MECHANISMS AND MULTIVARIATE STATISTICAL ANALYSIS 725
Table I. Highest educational qualification obtained by social group of the fam-ily of origina. Men and women aged 25–64. Weighted data, FQP survey 1993.Outflow percentages
E1 E2 E3 E4 E5 E6 E7 Tot.
O1 33.6 22.4 10.0 4.7 14.4 10.5 4.3 (1517)O2 20.8 18.0 9.4 7.2 21.4 14.4 8.7 (1218)O3 7.6 12.1 6.4 8.5 35.2 17.6 12.7 (2842)O4 7.5 8.7 5.2 6.4 31.7 20.6 19.8 (1620)O5 3.0 5.1 2.3 3.5 28.2 27.8 30.1 (2747)O6 2.3 5.4 2.4 6.0 35.8 22.1 26.0 (3220)O7 1.3 3.4 1.7 3.9 30.2 24.0 35.4 (2351)Tot. (1286) (1438) (713) (884) (4632) (3211) (3351) (15515)
a See note 8 for the definitions of (O) and (E).
dimension of educational inequality, as it were. They furnish only veryincomplete information on the relative chances of different groups toobtain different qualifications. But it is this relative and relational dimen-sion of inequality that is of principal interest here. Required as a con-sequence is a ‘measure’ capable of concisely expressing this ‘competitive’aspect of educational inequality, of which the row percentages indicated inTable I are only epiphenomena. It seems particularly helpful in this regardto use a coefficient known as the ‘odds ratio’ or, if one prefers, the ‘condi-tional probability ratio’. If Li and Cj (with i = 1, . . . , n and j = 1, . . . ,m)
respectively denote the generic rows and columns of a n, m dimensiontable – so that (Li,Cj ) denote the numbers to be found at the coincidenceof row i and column j – this coefficient can be constructed for four con-tiguous cases according to (1)
[(Li,Cj )/(Li,Cj+1)]/[(Li+1,Cj )/(Li+1,Cj+1)]
= [(Li,Cj )∗(Li+1,Cj+1)]/[/(Li+1,Cj )∗(Li,Cj+1)] (1)
This is easily generalizable to the table’s four non-contiguous cases. Anyvalue between 0 and 1 indicates a negative association; the value 1 repre-sents the absence of association; any value greater than 1 indicates a pos-itive association (Hout, 1983: 16; Bohrnstedt and Knoke, 1998: 162–166;Powers and Xie, 2000: 95–97; Wong, 2003a).9
The way in which the coefficient is constructed has two principal advan-tages. The first is methodological: the value of a ‘conditional probabil-ity ratio’ remains unchanged under a homothetic transformation of rowsand/or columns, or of the table’s size (Bishop et al., 1975: 375, 377;Powers and Xie, 2000: 97–99). The second is substantial: the structureof a ‘conditional probability ratio’ enables comparison between two social

726 GIANLUCA MANZO
groups on the same educational alternative and thus expresses the over-representation or under-representation of one relative to the other at agiven educational level. This measure thus yields a subtle description ofthe configuration of relative advantages and disadvantages in instructionalaccess enjoyed by the different social groups. It is here that lies the rela-tional dimension of inequality mentioned above. An example will clarifythe point. Consider the children of ‘higher professionals’ (O1) in relationto those of ‘unskilled and agricultural workers’ (O7) and compare theirsituations in regard to obtaining an ‘upper tertiary educational qualifica-tion’ (E1) rather than ‘no qualification’ (E7): the ‘conditional probabilityratio’ calculated according to (1) is 212.78. The children born into the firstgroup (O1) thus have a chance of gaining a higher tertiary diploma ‘E1’213 times greater than that of the children of ‘unskilled and agriculturalworkers’. It is easy to demonstrate algebraically that this value correspondsexactly to the ratio between the empirically observed proportion of childrenof ‘O1’ obtaining ‘E1’ and that theoretically given in the case of an ‘oddsratio’ equal to 1. Consequently, this measure of association expresses theover-representation (competitive educational advantage) or under-represen-tation (competitive educational disadvantage) of one social group relativeto another in relation to a specific educational alternative. Furthermore,this coefficient has an additional advantage: it is easily generalizable. Take,for example, group ‘O1’ and qualification ‘E1’. It is possible to calculate aconcise measure which expresses the global educational advantage (or dis-advantage) of group O1 in accessing ‘E1’, taking account of all possibleeducational alternatives as well as all relevant social groups. This can bedone by calculating the geometric mean of the 36 odds ratios expressingeach of these comparisons: this complex function of ‘simple odds ratios’is known in the literature as the ‘generalized odds ratio’ (Kaufman andSchervish, 1986: 719, 721; 1987: 219).
In the context of mobility studies, this measure has sometimes been usedto provide a concise description of relative mobility (Cobalti, 1989b, c;1995; Cobalti and Schizzerotto, 1994; Cobalti and Ballarino, 2003); muchmore rarely, it has been used to express the relative aspect of educationalinequalities (Cobalti, 1992: 139–142). Which is precisely what I propose todo here. The ‘generalized odds ratio’ (henceforth, frequently, ‘GOR’) seema good device with which to describe, parsimoniously and in a sociolog-ically meaningful way, the structure of competitive advantages implied bythe crude percentages in Table I.
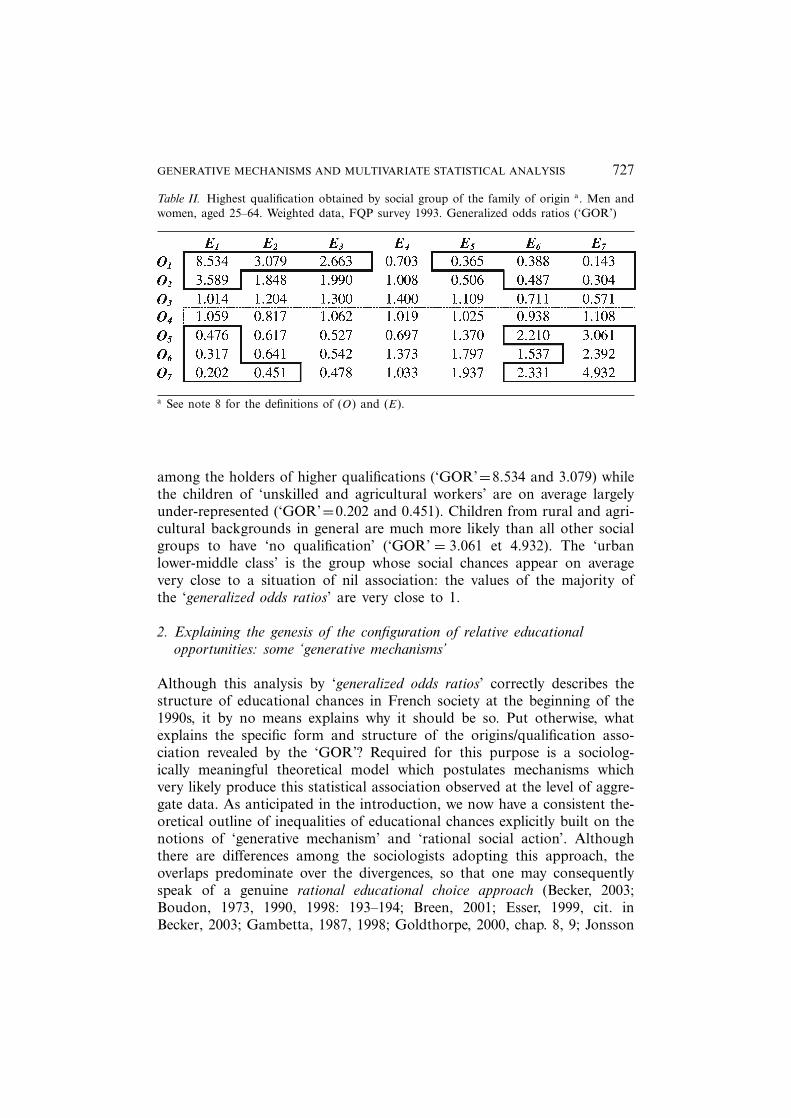
Table II presents the collection of these coefficients.10 Rapid inspec-tion of the table shows that the chances of obtaining different educa-tional qualifications are strongly influenced by social origin: areas of edu-cational advantage as well as disadvantage are clearly identifiable. Thechildren of ‘higher professionals’ are on average largely over-represented
GENERATIVE MECHANISMS AND MULTIVARIATE STATISTICAL ANALYSIS 727
Table II. Highest qualification obtained by social group of the family of origin a. Men andwomen, aged 25–64. Weighted data, FQP survey 1993. Generalized odds ratios (‘GOR’)
a See note 8 for the definitions of (O) and (E).
among the holders of higher qualifications (‘GOR’=8.534 and 3.079) whilethe children of ‘unskilled and agricultural workers’ are on average largelyunder-represented (‘GOR’=0.202 and 0.451). Children from rural and agri-cultural backgrounds in general are much more likely than all other socialgroups to have ‘no qualification’ (‘GOR’ = 3.061 et 4.932). The ‘urbanlower-middle class’ is the group whose social chances appear on averagevery close to a situation of nil association: the values of the majority ofthe ‘generalized odds ratios’ are very close to 1.
2. Explaining the genesis of the configuration of relative educationalopportunities: some ‘generative mechanisms’
Although this analysis by ‘generalized odds ratios’ correctly describes thestructure of educational chances in French society at the beginning of the1990s, it by no means explains why it should be so. Put otherwise, whatexplains the specific form and structure of the origins/qualification asso-ciation revealed by the ‘GOR’? Required for this purpose is a sociolog-ically meaningful theoretical model which postulates mechanisms whichvery likely produce this statistical association observed at the level of aggre-gate data. As anticipated in the introduction, we now have a consistent the-oretical outline of inequalities of educational chances explicitly built on thenotions of ‘generative mechanism’ and ‘rational social action’. Althoughthere are differences among the sociologists adopting this approach, theoverlaps predominate over the divergences, so that one may consequentlyspeak of a genuine rational educational choice approach (Becker, 2003;Boudon, 1973, 1990, 1998: 193–194; Breen, 2001; Esser, 1999, cit. inBecker, 2003; Gambetta, 1987, 1998; Goldthorpe, 2000, chap. 8, 9; Jonsson
728 GIANLUCA MANZO
and Erikson, 2000; Schizzerotto, 1997)11 which has inspired the collectionof ‘mechanisms’ proposed in this article. The endnotes specify the sourceof each of my model’s components.
The general conceptual framework of this explanatory theory can besummarized as follows: the systematic educational asymmetries that existbetween social groups are the result of the aggregate of the intentionalbehaviors of N actors competing, under constraints, for a limited numberof social positions. Three components of this theory must be defined: a)the actors (their aims and social beliefs); b) the resources available to themto achieve their aims; c) the systemic constraints to which they are subject.
Three ‘mechanisms’ define the contours of a stylized actor (component a):
– MA1. The principal aim of actors in the educational system is to obtaina qualification in order to achieve a socio-occupational position atleast as high as that of their family of origin. This first ‘mechanism’thus postulates that the prime concern of actors is to avoid downwardintergenerational mobility.12 Paradoxically, this image of actors alsosuggests that certain social groups will have little need of advanced edu-cation in order to ‘reproduce’. This is particularly the case of those whocan inherit their parent’s capital resources (physical or financial).13
– MA2. It would seem unrealistic to attribute a totalizing dimension tothis first objective of action, since this would tend a priori to reducethe range of the ‘social chances’ available to those born into the mostdisadvantaged groups. I thus postulate that actors, and especially thoseborn into lower social groups, try to take the greatest advantage ofthe educational system in order to obtain the educational qualifica-tions useful to them in their effort to achieve a higher socio-profes-sional position than that of their parents.14
– MA3. The third ‘mechanism’ is the condition for the first two to exist:I hypothesize that, whatever their social group of origin, all individualsare willing to take risks in order to achieve their educational and socialobjectives. Actors have the right to fail as well as to persevere. It is nev-ertheless clear that this ‘risk propensity’ does not have the same mean-ing for all individuals. In the case of higher social groups, risk-takingexpresses an obligation to ‘try’, even when one does not have the nec-essary cognitive and intellectual abilities. For those born into a disad-vantaged context, by contrast, this willingness to take risks expresses adesire ‘to get out at any price’.15
In terms of the typology of social mechanisms proposed by Hedstromand Swedberg (1998b: 22), MA1,MA2, and MA3 are ‘mechanisms of actionformation’: they explain how individuals reason in a specific social context.Here, we are at the micro-individual level. A final specification is necessary:these three mechanisms function provided that the actors share a system
GENERATIVE MECHANISMS AND MULTIVARIATE STATISTICAL ANALYSIS 729
of beliefs on the differential efficiency of qualifications in the labor marketsuch that one can reasonably suppose that, the further one advances in theeducational system, the higher one can hope to climb the social scale. Thisbelief is attributed to the actors in my model.16
Two other ‘mechanisms’ express the resources available to the actors(component b):
– MB1. Education involves costs both direct (study materials, registra-tion fees, transportation, lodging, tutoring, etc.) and indirect (oppor-tunity costs). I assume that these costs increase significantly at highereducational levels. The actors have the material and financial resourceswith which to meet these costs, which vary according to social origin.This mechanism is grounded on the hypothesis that economic resourcesdiminish as one descends the ‘social ladder’.17
– MB2. Success at school requires one to possess the cognitive and cul-tural resources necessary to satisfy the institution’s pedagogical require-ments. I assume that these requirements become much more demandingas one ascends the levels of the educational system. The process ofprimary group socialization, as well as the circumstances of everydayfamily life, affect the degree to which individuals draw upon their cog-nitive and cultural resources in the educational system. Hypothesized inthis case is that, the higher the social group of origin, the more readilyaccessible these immaterial and symbolic resources become.18
In the vocabulary of Hedstrom and Swedberg’s typology of social mech-anisms (1998b: 22), MB1 and MB2 are examples of ‘situational mecha-nisms’ which clarify how the actions of individuals are constrained andinfluenced by structural elements. Here, we are at the level of complex rela-tions between macro and micro, structure and action.19
Finally, two further mechanisms represent the systemic constraints towhich the actors are subject (component c):
– MC1. At specific educational levels, particularly those at the top andbottom of the educational hierarchy, I assume the existence in the edu-cational system of processes which group certain individuals together,increasing their chances of success to the detriment of those of otheractors. One might term this mechanism the ‘mechanism of segmentaryamplification of educational opportunity’.
– MC2. At the same educational levels, I hypothesize the existence of pro-cesses which act in exactly the opposite direction to those discussedabove. These are phenomena that distance certain individuals from theeducational system, reducing their chances of success and increasingthose of others. This mechanism might be termed the ‘mechanism ofsegmentary reduction of educational opportunity.’
730 GIANLUCA MANZO
MC1 and MC2 have a different conceptual status from that of MA1,MA2,MA3,MB1 and MB2, for two main reasons: first, it is not obvious howtheir appropriate analytical level can be determined; second, their theo-retical significance is less clearly defined. It seems that these two mecha-nisms consist of processes that enhance the ‘systemic level’, in that theyconcern aspects of social organization imposed on actors without thesebeing able to modify their intensity or direction. Five specific processescan be cited to clarify the nature of MC1 and MC2: (1) cultural proxim-ity or distance between particular social groups or particular parts of theeducational institution; (2) the educational segregation resulting from insti-tutionally-defined procedures of distributing students; (3) imitation con-nected with membership of peer groups; (4) differential selection related toan educational system’s varying degrees of historical openness; (5) cognitivestimulation deriving from the historically variable degree of social hetero-geneity in educational classes.20 Viewed from the perspective of inequalitiesin educational chances, all these processes share an essential feature: theyproduce opposite effects depending on the social group concerned. MC1and MC2 belong to a class of mechanisms that Elster calls “Type-B mecha-nisms”: processes acting simultaneously but with opposite effects (1998: 50,51, 53, 60, 71; 2003). In contrast to the examples given by Elster, however,here I shall be in a position to determine the ‘net effect’ of these mecha-nisms – strictly as regards the phenomenon under discussion, of course.
My theoretical model of the genesis of the structure of educationalchances thus postulates three groups of mechanisms. The first three – MA1,MA2 and MA3 – operate strictly at the individual level; two others – MB1and MB2 – concern the relationship between structure and action; the lasttwo – MC1 and MC2 – belong to what one might call, faute de mieux, the‘systemic level’.
3. Mathematical modeling: a multi-matrix log-linear topological model
Having formulated the theoretical model, I now need an appropriate proce-dure with which to test it empirically: that is, I must construct a mathemat-ical ‘tool’ and find an algorithm which relates my explanatory hypothesesto the data set out in Tables I and II.
Log-linear topological models, I believe, are particularly well suited tothis purpose. These models regroup the cases of a contingency table intoa limited number of ‘classes’ which differ among themselves by intensityof association. These groupings are often called ‘levels’ – hence the terms‘level models’ (Hauser, 1987) and ‘level-parameter models’ (Pontinen, 1982).The aim of this operation is to ‘dissect’ the original association betweentwo variables in a manner that reveals their deep structure. The model thusobtained is both parsimonious and interpretable because it is characterized

GENERATIVE MECHANISMS AND MULTIVARIATE STATISTICAL ANALYSIS 731
by a number k of interaction parameters (one per level) less than that ofthe saturated model (one parameter per case). A simple topological modelcan thus be expressed in multiplicative or additive form in accordance with(2) and (3) respectively (Featherman and Hauser, 1978: 147–149; Hauser,1978: 929–931, 1979: 415–417; Gilbert, 1993: 86–91; Powers and Xie, 2000:111–114; Wong, 2003a):
Fij =u∗u∗i u
∗juijk (2)
Log(Fij )= log(u)+ log(ui)+ log(uj )+ log(uijk) (3)
where Fij is the frequency obtained with the model for the generic casei, j ; u is the parameter expressing the table’s sum total; ui is the param-eter expressing the effect of the marginal distribution of the row variable;uj is the parameter expressing the effect of the marginal distribution of thecolumn variable; and Uijk is the interaction parameter expressing the levelof association K to which the case i, j has been attributed.
The greatest difficulty with this type of modelling is the construction oflevel matrices: on the basis of what criteria are cases to be attributed tothe different levels of association? I anticipated this problem in the intro-duction: if one prefers a theoretically guided strategy to an inductive andexploratory one, this operation is paradoxically the principal attraction oftopological models. In this case, the researcher is obliged to develop pre-cise theoretical hypotheses in order to justify the attribution of a case –or, rather, a group of cases – to one or other level of association. In otherwords, one must have a priori ‘theoretical mechanisms’ in order to postu-late that the statistical association between the row variable (social origin,in our case) and the column variable (educational qualification) is more orless strong in some particular region of the table. This ‘top–down strategy’becomes all the more constraining and productive when one considerstopological models more sophisticated than one consisting of (2) and (3).Instead of constructing a single level matrix, it is in fact possible toconstruct as many level matrices as there are theoretical hypotheses totest (Gilbert, 1993: 92–95): these are known as “multi-matrix topologicalmodels” (Erikson and Goldthorpe, 1992: 123) or “overlapping topologicalmodels” (Wong, 2003a). This type of model is expressed formally in mul-tiplicative terms by (4):
Fij =u∗u∗i u
∗j
∏n(uijk)n (4)
where (uijk)n denotes the interaction parameter expressing the level of asso-ciation K to which the case i, j has been attributed at one of the n
level matrices. The statistical association in each of the table’s cases isthus expressed by a number n of effects which capture the likely factors

732 GIANLUCA MANZO
responsible for the situation of over-representation or under-representationappropriate to the case in question (in our case, that of each origin/quali-fication pair).
This sophisticated type of topological model has been very rarelyapplied in studies on social stratification (Stier and Grusky, 1990; Eriksonand Goldthorpe, 1992; Cobalti, 1996; Pisati, 1997; see also Jonsson, 2004;Layte and Whelan, 2004; Pisati and Schizzerotto, 2004, for some ‘hybrid’applications which combine these models with association model compo-nents). It is nevertheless significant that those few authors who have usedthis method to analyze social mobility have justified their choice by empha-sizing that a single level matrix tends to synthetically subsume – and, Iwould add, hide and conflate – several mechanisms kept distinct by a plu-rality of matrices. This model thus separates mechanisms in a much moreprecise and explicit manner (Stier and Grusky, 1990: 751; Erickson andGoldthorpe, 1992: 122–123). It is for these reasons of heuristic utility thatI have chosen to construct a multi-matrix log-linear topological model withwhich to implement my theoretical model of the genesis of inequalities ineducational opportunity.
In what follows I shall consider the ‘mechanisms’ postulated in Section2 in turn and translate them into a structured collection of level matrices.These matrixes will be binary and constructed according to the followingprinciple: if a mechanism M is assumed to produce the situation of over-or under-representation appropriate to the case i, j , it will be attributedvalue 1; otherwise it will be attributed value 0.
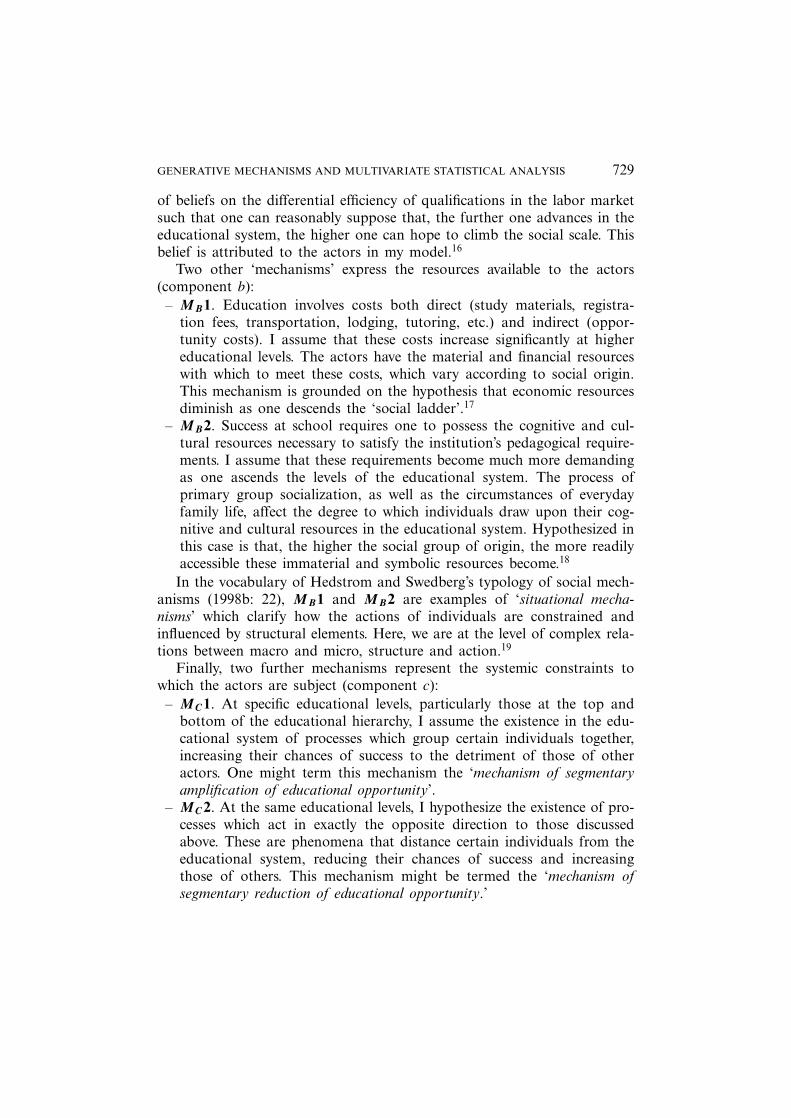
– MA1 (Table III). In the framework of my model, the offspring of‘high-level professionals’ (O1) are attracted by the highest-level socialpositions: they therefore attempt to attain the highest-status and mostadvanced educational levels (E1,E2 and E3). Although individuals from‘upper-middle professions’ (O2) and ‘lower-middle professions’ (O3) mustattain lower social positions, they can content themselves with progres-sively lower-level educational qualifications: we will assume that E2,E3
and E4 maximize the chances of O2 while E3,E4 and E5 represent thequalifications adequate for O3. Under the same logic, even lower edu-cational levels suffice for the offspring of O6 and O7. However, becausethe former have an interest in attaining the upper and specialized stra-tum of the labour force, they must climb a little higher in the educa-tional hierarchy than must the latter (E5,E6 and E7 vs. E6 and E7).Albeit to differing extents, all these groups need to use the qualificationsystem to maintain their social positions. The functioning of MA1, bycontrast, suggests that this is not the case for the offspring of O4 andO5 who want to remain in their group of origin. Because these lattercan rely on the hereditary transmission of physical (or, to a lesser
GENERATIVE MECHANISMS AND MULTIVARIATE STATISTICAL ANALYSIS 733
Table III. Level Matrix for (MA1)
E1 E2 E3 E4 E5 E6 E7
O1 1 1 1 0 0 0 0
O2 0 1 1 1 0 0 0
O3 0 0 1 1 1 0 0
O4 0 0 0 0 0 0 0
O5 0 0 0 0 0 0 0
O6 0 0 0 0 1 1 1
O7 0 0 0 0 0 1 1
extent, financial) capital, education is less indispensable to them. It isfor this reason that I do not consider MA1 – set at zero in the corre-sponding cases – to operate for these two social groups.
The theoretical nature of MA1 makes it a factor of over-representation.If my matrix specification is correct, the log-linear parameter expressing theeffects of this mechanism – call it (uijk)
Ma1 – should thus have a positivevalue.
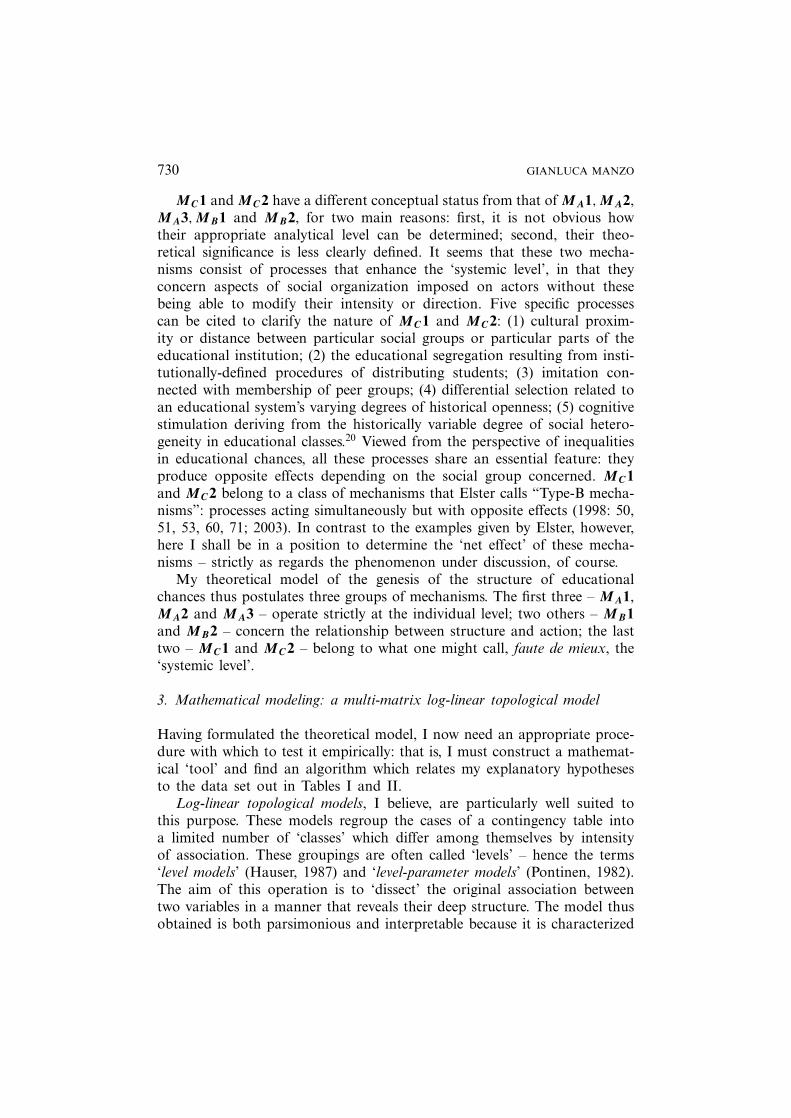
– MA2 (Table IV). Given the image of the social structure discussedabove, one cannot suppose that MA2 operates for the children of ‘O1’:there are no socio-professional positions higher than those from whichthey originate. By contrast, it undoubtedly operates in the case of indi-viduals from ‘O2’ and ‘O3’, who desire to rise socially. For this purposethey must obtain qualifications more advanced than those required forsimple ‘reproduction’. This is the case of E1for the former, and of E1
and E2for the latter. It is equally realistic to assume that certain indi-viduals in groups ‘O4’ and ‘O5’ wish to move out of self-employment. Ishall hypothesize that the vocational and technical tracks of secondaryeducation, E4 (and higher, E2, for the children of O4), can be usefullyexploited for this purpose. In the context of my model, MA2 denotesabove all the desire of individuals from disadvantaged backgrounds to‘climb socially’, and who consequently seek to take advantage of theeducational system even at the most advanced levels. It is for this rea-son that 1 is assigned to the cases (O6,E1), (O6,E2), (O6,E3), (O6,E4)as well as to (O7,E2), (O7,E3), (O7,E4), (O6,E5).
The theoretical significance of MA2 makes it – like MA1 – a factorof over-representation. If my matrix specification is correct, the log-lin-ear parameter expressing these effects – call it (uijk)
Ma.2 – should have apositive value.
– MA3 (Table V). This mechanism is assumed to operate at the highestlevels of the educational system for the children of ‘O1’, because these
734 GIANLUCA MANZO
Table IV. Level Matrix for (MA2)
E1 E2 E3 E4 E5 E6 E7
O1 0 0 0 0 0 0 0
O2 1 0 0 0 0 0 0
O3 1 1 0 0 0 0 0
O4 0 1 0 1 0 0 0
O5 0 0 0 1 0 0 0
O6 1 1 1 1 0 0 0
O7 0 1 1 1 1 0 0
Table V. Level Matrix for (MA3)
E1 E2 E3 E4 E5 E6 E7
O1 1 1 1 0 0 0 0
O2 0 1 1 0 0 0 1
O3 0 1 0 1 0 1 0
O4 0 0 0 0 0 0 0
O5 0 0 0 0 0 0 0
O6 0 1 1 1 1 1 0
O7 0 0 0 1 1 1 1
qualifications are indispensable to them if they are to maintain theirsocial positions.
The offspring of ‘O2’ are in an analogous position, with an importantexception: I assume that they are less protected than the former againsttotal educational failure, E7. The offspring of those with a ‘lower inter-mediate profession’ (O3) take risks at two levels in the educational system:first, at the lower level of tertiary education, E2 (because this may enablethem to improve their social positions); second, in secondary level voca-tional tracks and at the end of primary school (because these qualifica-tions appear indispensable to them if they are not to lose their originalsocial positions). MA3 is assumed not to operate in the case of those whoinherit from O4 and O5. In contrast to all other social groups, the childrenof small self-employed workers who seek to improve their social standingthrough education are relatively well-protected against possible educationalfailure in that they can inherit the physical capital of their parents. Asa consequence of MA2, one must hypothesize that MA3 operates for themost disadvantaged groups. The desire to escape privation among the chil-dren of ‘skilled workers’ and (to a lesser extent) of ‘unskilled and agricul-tural workers’ induces them to accept the risk of failure and the possibility

GENERATIVE MECHANISMS AND MULTIVARIATE STATISTICAL ANALYSIS 735
Table VI. Level Matrix for (MB 1)
E1 E2 E3 E4 E5 E6 E7
O1 0 0 0 0 0 0 0
O2 1 1 0 0 0 0 0
O3 1 1 0 0 0 0 0
O4 1 0 1 0 0 0 0
O5 1 0 1 0 0 0 0
O6 1 1 1 1 0 0 0
O7 1 1 1 1 0 0 0
of deferred educational success – that is, of attempting to obtain higher-level qualifications and ‘persisting’ at lower ones. Assigning 1 to (O6,E2),(O6,E3), (O6, E4), (O6, E5), (O6, E6) as well as (O7, E4), (O7, E5), (O7,E6), (O6,E7) expresses this idea.21
The theoretical significance of MA3 makes it a factor of over-representation.If our matrix specification is correct, the log-linear parameter expressing thismechanism’s effect – call it (uijk)
Ma.3 – should have a positive value.
– MB1 (Table VI). I postulate that O1is able to pay all the costs oftheir children’s formal education: all these cases are therefore assignedvalue 0. A lesser capacity to pay, restricted to higher-level education, isassumed for O2 and O3. There are no theoretical reasons for thinkingthat these two groups differ in this respect. The ‘indirect’ dimension ofthe cost of education justifies the level attributed toO4 and O5: I thusassume that MB1 operates at levels of the educational system wherethe link with the labor market is less immediate or definite (especiallythe general tracks of secondary education, E3, and the long tracks ofhigher education, E1). From the economic point of view implied byMB1,O6 and O7 can be treated in a similar manner: I assume that thedifficulties of meeting the costs of education begin with the full second-ary level.
The theoretical nature of MB1 makes it a factor of under-representation.If my matrix specification is correct, the log-linear parameter expressing thismechanism’s effects – call it (uijk)
Mb1 – should have a negative value.
– MB2 (Table VII). I assume that the children of O1 and O2 have thecognitive and symbolic resources necessary to cope with the pedagogicalrequirements of school: the action of Mb2 is not postulated for individ-uals in these groups.
By contrast, at the most advanced level of higher education, E1, Iassume that the offspring of O3 have cognitive and cultural difficulties.

736 GIANLUCA MANZO
Table VII. Level Matrix for (MB 2)
E1 E2 E3 E4 E5 E6 E7
O1 0 0 0 0 0 0 0
O2 0 0 0 0 0 0 0
O3 1 0 0 0 0 0 0
O4 1 1 0 0 0 0 0
O5 1 1 1 1 0 0 0
O6 1 1 1 0 0 0 0
O7 1 1 1 1 0 0 0
Among the children of the ‘urban petite bourgeoisie’, these symbolic bar-riers also extend to the lower levels of university education, E2. The sameattribution of level to O5 and O7 expresses the idea that the children ofthe agricultural petty bourgeoisie just as much as those from the most mar-ginalized strata of the working class, must overcome cultural obstacles thatbegin with full secondary level of education. By contrast, one may assumethat the children of skilled workers are in a slightly better situation in thetechnical and vocational tracks of secondary instruction: it is for this rea-son that (O6,E4) are set at 0.
The theoretical significance ofMB2 makes it a factor of under-representation.If my matrix specification is correct, the log-linear parameter expressing theeffects of this mechanism – call it (uijk)
Mb2 – should have a negative value.
– MC1 (Table VIII). The nature of this mechanism suggests that itcan only operate in specific and limited zones of the ‘origin/qualifica-tion’ table. One may begin by assuming that processes of ‘opportunityamplification’ for the children of O1 exist quite generally in second-ary and tertiary education, but they only function at the higher levelsfor descendants of ‘upper middle professions’. I next postulate that MC1operates for the children of O5,O6 and O7 in order to represent theirconcentration in the positions of most severe educational privation.Finally, I postulate a particular proximity – a sort of ‘educationalspecialization’ – between children from working-class backgrounds andthe vocational track of secondary school: for which reason (O6,E4) and(O7,E4) are set at 1.
The theoretical significance of MC1 makes it a factor of over-representa-tion. If my matrix specification is correct, the log-linear parameter express-ing the effects of this mechanism – call it (uijk)
Mc1 – should have a positivevalue.
– MC2 (Table XI). The action of this mechanism only really affectsthe social groups situated at the top and bottom of the social scale

GENERATIVE MECHANISMS AND MULTIVARIATE STATISTICAL ANALYSIS 737
Table VIII. Level Matrix for (MC1)
E1 E2 E3 E4 E5 E6 E7
O1 1 1 1 1 0 0 0
O2 1 0 0 0 0 0 0
O3 0 0 0 0 0 0 0
O4 0 0 0 0 0 0 0
O5 0 0 0 0 0 1 1
O6 0 0 0 1 0 0 1
O7 0 0 0 1 0 0 1
Table IX. Level Matrix for (MC2)
E1 E2 E3 E4 E5 E6 E7
O1 0 0 0 0 0 0 1
O2 0 0 0 0 0 0 1
O3 0 0 0 0 0 0 0
O4 0 0 0 0 0 0 0
O5 1 0 0 0 0 0 0
O6 1 0 0 0 0 0 0
O7 1 0 0 0 0 0 0
corresponding to extreme educational outcomes. From this point ofview, giving (O1,E7), (O2,E7), (O5,E1), (O6,E1), (O7,E1) value 1expresses the idea of a particular distance between these social groupsand these specific educational situations.
The theoretical significance of makes MC2 it a factor of under-represen-tation. If my formulation is correct, the log-linear parameter expressing theeffects of this mechanism – call it (uijk)
Mc.2 – should have a negative value.All of the ‘theoretical mechanisms’ have now been translated into the
language of level matrices. My log-linear topological model for Table I cannow be expressed in multiplicative form in accordance with (5):
Fij =u∗u∗i u
∗j (uijk)
Ma.1∗(uijk)Ma.2∗(uijk)
Ma.3∗(uijk)Mb.1∗(uijk)
Mb.2∗
(uijk)Mc.1∗(uijk)
Mc.2 (5)
This formulation states that the totals observed in each of the table’scases can be approximated by the product of three terms representing thestructural aspects of the sample and by seven terms expressing the postu-lated ‘theoretical mechanisms’. Note that not all cases will have the sameparameter structure, in the sense that parameters corresponding to mecha-nisms whose action has not been postulated will be absent: in mathematical

738 GIANLUCA MANZO
Table X. Results of fitting the ‘Multi-Matrix Log-Linear Topological Model’ [5] to the 1993French origins/qualifications table
A) Goodness-of-fit measures
Dl L2 Bic ID rL2 L2/dl
Independence 36 3558.92 (0.000) 3211.54 0.170 − 98.86Topological 29 25.63 (0.645) −254.21 0.015 99.28 0.88
B) Parameters
(uij )Ma1 (uij )
Ma2 (uij )Ma3 (uij )
Mb1 (uij )Mb2 (uij )
Mc1 (uij )Mc2
Multiplicative 1.785 1.427 1.409 0.868 0.549 1.544 0.420Log-additive 0.580 0.355 0.343 −0.142 −0.599 0.434 −0.869S.E. (0.039) (0.047) (0.028) (0.045) (0.049) (0.032) (0.062)
terms, they will have a value of ‘1’ (or ‘0’, if the model is expressed inadditive form). In the context of such a multi-matrix topological model,the parameter of final association of each case will thus be derived fromthe product of the specific effects applying to it, as indicated by the term∏n
(uijk)n in (4).
4. Estimation, evaluation, and statistical analysis of the model
Having translated the theoretical model into a multi-matrix log-lineartopological model, I must now determine whether it does in fact correctlyreproduce the empirical data. Table X reports the principal results of theestimation on the basis of the French data set out in Table I.22
Part (A) of the table reports five goodness-of-fit statistics. Each of themcan be compared to the same statistics calculated for the model of statisti-cal independence between origin and qualification. As common in the lit-erature, this model is considered to be the baseline model.
Given a loss of only seven degrees of freedom relative to the indepen-dence model, the results are undeniably appealing:
(1) L2 expresses the global proximity of theoretical frequencies [Fij ] toobserved frequencies [fij ]: its value is astonishingly low for a model appliedto a sample of 15,515 individuals.23 The statistically non-significant valueof differences between the data produced by the model and the observationdata should be noted: in log-linear analysis, a ‘p-value’ of 0.645 suggeststhat such differences can be considered as resulting from stochastic fluctu-ations, rather than from a poor specification in the theoretical model.
(2) The strongly negative value of Bic indicates that my model achievesa highly satisfactory balance between parsimony and reproduction of theobservation data.24
GENERATIVE MECHANISMS AND MULTIVARIATE STATISTICAL ANALYSIS 739
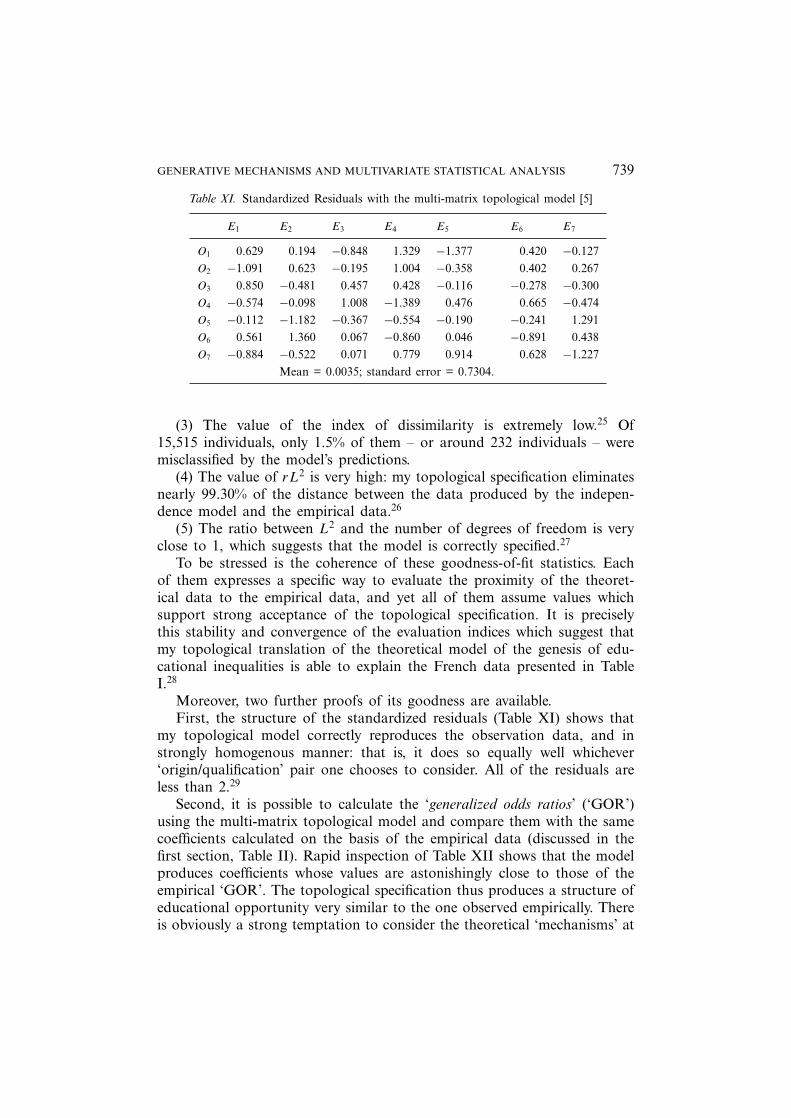
Table XI. Standardized Residuals with the multi-matrix topological model [5]
E1 E2 E3 E4 E5 E6 E7
O1 0.629 0.194 −0.848 1.329 −1.377 0.420 −0.127O2 −1.091 0.623 −0.195 1.004 −0.358 0.402 0.267O3 0.850 −0.481 0.457 0.428 −0.116 −0.278 −0.300O4 −0.574 −0.098 1.008 −1.389 0.476 0.665 −0.474O5 −0.112 −1.182 −0.367 −0.554 −0.190 −0.241 1.291O6 0.561 1.360 0.067 −0.860 0.046 −0.891 0.438O7 −0.884 −0.522 0.071 0.779 0.914 0.628 −1.227
Mean = 0.0035; standard error = 0.7304.
(3) The value of the index of dissimilarity is extremely low.25 Of15,515 individuals, only 1.5% of them – or around 232 individuals – weremisclassified by the model’s predictions.
(4) The value of rL2 is very high: my topological specification eliminatesnearly 99.30% of the distance between the data produced by the indepen-dence model and the empirical data.26
(5) The ratio between L2 and the number of degrees of freedom is veryclose to 1, which suggests that the model is correctly specified.27
To be stressed is the coherence of these goodness-of-fit statistics. Eachof them expresses a specific way to evaluate the proximity of the theoret-ical data to the empirical data, and yet all of them assume values whichsupport strong acceptance of the topological specification. It is preciselythis stability and convergence of the evaluation indices which suggest thatmy topological translation of the theoretical model of the genesis of edu-cational inequalities is able to explain the French data presented in TableI.28
Moreover, two further proofs of its goodness are available.First, the structure of the standardized residuals (Table XI) shows that
my topological model correctly reproduces the observation data, and instrongly homogenous manner: that is, it does so equally well whichever‘origin/qualification’ pair one chooses to consider. All of the residuals areless than 2.29
Second, it is possible to calculate the ‘generalized odds ratios’ (‘GOR’)using the multi-matrix topological model and compare them with the samecoefficients calculated on the basis of the empirical data (discussed in thefirst section, Table II). Rapid inspection of Table XII shows that the modelproduces coefficients whose values are astonishingly close to those of theempirical ‘GOR’. The topological specification thus produces a structure ofeducational opportunity very similar to the one observed empirically. Thereis obviously a strong temptation to consider the theoretical ‘mechanisms’ at

740 GIANLUCA MANZO
Table XII. Generalized Odds Ratios under the multi-matrix topo-logical model [5] – in bold type – and observed Generalized OddsRatios (FQP 1993)
E1 E2 E3 E4 E5 E6 E7
O1 8.084 3.047 2.973 0.588 0.413 0.381 0.1488.534 3.079 2.663 0.703 0.365 0.388 0.143
O2 3.912 1.767 2.092 0.910 0.525 0.484 0.2993.589 1.848 1.990 1.008 0.506 0.487 0.304
O3 0.923 1.255 1.265 1.398 1.114 0.743 0.5901.014 1.204 1.300 1.400 1.109 0.711 0.571
O4 1.096 0.817 0.911 1.243 0.973 0.897 1.1351.059 0.817 1.062 1.019 1.025 0.938 1.108
O5 0.455 0.678 0.545 0.744 1.317 2.191 2.7720.476 0.617 0.527 0.697 1.370 2.210 3.061
O6 0.288 0.564 0.551 1.559 1.806 1.663 2.3840.317 0.641 0.542 1.373 1.797 1.537 2.392
O7 0.239 0.476 0.464 0.927 1.788 2.236 5.1100.202 0.451 0.478 1.033 1.937 2.331 4.932
the basis of this log-linear operationalization as the processes truly respon-sible for inequalities of educational opportunity (in the spatial and tempo-ral context covered by our data, of course).
From this point of view, it is particularly instructive to move fromevaluation of the global adjustment of the model (5) to analysis of thestructure of its parameters: part (B) of Table X. First to be considered isthe following essential feature: the values of the parameter standard errorsshow that these latter are all statistically significant (p < .001, except for(uij )
Mb1 : p < .002). A second important feature should also be noted: allthe signs of these parameters correspond to expectations (see Section 3).Thus
(1) (uijk)Ma1, (uijk)
Ma2 and (uijk)Ma3 are positive, which makes them fac-
tors of over-representation for the relevant cases: which is indeed thedirection in which the mechanisms MA1,MA2 and MA3 operate. Allof them express processes which induce individuals to use educationas a means to achieve individual and social fulfillment.
(2) (uijk)Mb1 et (uijk)
Mb2 are negative, which makes them factors ofunder-representation for the relevant cases: this is the ‘diminishingeffect’ of educational chances implied by the mechanisms MB1 andMB2, both of which represent a lack of resources on the part ofactors with which to exploit of the educational system.

GENERATIVE MECHANISMS AND MULTIVARIATE STATISTICAL ANALYSIS 741
Table XIII. Results of fitting the ‘Multi-Matrix Log-Linear TopologicalModel’ [5] to the 1993 French origins/qualifications table with all itseffects and removing one effect at a time
Dl L2 Bic ID rL2 L2/dl
[5] - uMa
ij
130 248.57 (0.000) −40.92 0.044 93.01 8.29
[5] - uMc
ij
230 248.29 (0.000) −41.20 0.040 93.02 8.23
[5] - uMc
ij
130 207.88 (0.000) −81.61 0.046 94.16 6.93
[5] - uMa
ij
330 183.03 (0.000) −106.45 0.041 94.86 6.10
[5] - uMb
ij
230 175.53 (0.000) −113.95 0.040 95.07 5.85
[5] - uMa
ij
230 83.30 (0.000) −206.18 0.026 97.66 2.78
[5] - uMb
ij
130 35.38 (0.229) −254.10 0.018 99.01 1.20
[5] 29 25.63 (0.645) −254.21 0.015 99.28 0.88
(3) (uijk)Mc1 is positive, which makes it a factor of over-representation
for the relevant cases: this is exactly the meaning of mechanism MC1,which expresses the action of systemic processes increasing the educa-tional opportunities of certain groups.
(4) (uijk)Mc2 is negative, which makes it a factor of under-representation
for the relevant cases: this is perfectly in keeping with the theoreticalinterpretation of mechanism MC2, which postulates the existence ofprocesses that reduce the educational chances of certain social groups.
The structure of the parameters of model (5) thus further evidences thatit is a correct and coherent representation of the processes generating theempirically observed configuration of educational opportunity inequalitiesin French society at the beginning of the 1990s.30
A final analytic operation seems of particular theoretical interest: evalu-ating the relative importance of these ‘mechanisms’. I shall proceed as fol-lows. Starting from the multi-matrix topological model (5), including all itseffects; I shall subtract one parameter at a time and then assess the modelas modified. Analysis of variations in the value of the goodness-of-fit mea-sures should thus yield a relatively precise idea of the contribution madeby each ‘mechanism’ to the global fit of the model. Table XIII reports theresults of this operation after the models have been ordered according tothe values of L2.
Apart from the relatively stable value of the index of dissimilarity in fiveout of seven models, all the statistics go in the same direction. With regardto the complete version of my theoretical formulation, the exclusion of theeffects corresponding to MA1 and MC2 causes the largest decrease in themodel’s fit quality.
742 GIANLUCA MANZO
These two mechanisms respectively correspond to an individual microcomponent and a systemic one: which may well signify that, in order to repre-sent the reality of inequalities educational opportunity correctly, once muststrike the correct balance between voluntarism of action and institutionalconstraints. This seems to be confirmed by two other mechanisms, MC1and MA3, where the suppression of the corresponding parameters stronglydistances (although to a lesser extent in the first case) the theoretical datafrom the observation data. Here, too, the former mechanism expresses sys-temic effects while the latter expresses the risk propensity of social actors.The elimination of parameter (uijk)
Mb2 corresponding to mechanism MB2(expressing constraints of a symbolic nature) as well as that of parameter(uijk)
Ma2 corresponding to mechanism MA2 (which expresses ‘desires’ forsocial advancement) similarly results in a non-negligible deterioration in fitquality – in the former case more so than the latter. Once again we have amechanism, MB2, tied to the structural aspects of social action, as well as amechanism, MA2, of a more micro-individual character. The behavior of themodel after (uijk)
Mb1 – corresponding to mechanism MB1 which expressesthe effects of economic resources on educational choice – being uniquelyremoved has a partly unexpected result: the model adjusts relatively well tothe empirical data. However, the ‘p-value’ is considerably less than that ofthe complete model (5): it would be wrong to accept the former in placeof the latter as a correct representation of the process by which inequalitiesof educational opportunity arise. The probability that discrepancies betweentheoretical data and observation data will be attributed to stochastic varia-tions, when these discrepancies in fact derive from an incorrect model spec-ification, is much greater in the case of a model which does not contain themechanism expressing the costs of education. Contrary to what one mighthave expected, it remains no less true that the relative importance of thismechanism is partially ‘resized’ by a detailed analysis of our model.31
2. Discussion
The principal aim of this article has been to reconsider, from a differentperspective, log-linear topological models, and especially their multi-matrixvariant, the purpose being to evaluate their significance and implications rel-ative to the debate of the 1980s. We can now attempt a general assessment.
The foregoing analysis has shown that the ‘equivalent models’ problemis far from being a major obstacle to application of this method. Theoret-ical and interpretative indeterminacy can be greatly reduced if one rejectsa strategy of inductive and technical construction founded on ‘trial anderror’ and instead adopts a deductive point of view that considers matrix-specification as a technical device to translate theoretical hypotheses explic-itly stated a priori into. Constructing a log-linear topological model implies
GENERATIVE MECHANISMS AND MULTIVARIATE STATISTICAL ANALYSIS 743
that one has a theory capable of generating and explaining the alterna-tion of zones of weak and strong observable concentration – for example,in the ‘qualifications by origin’ table. Sociologists are obliged to explaintheir theoretical hypotheses and, above all, to state how they have movedfrom these to the level matrices indispensable for statistical estimation ofthe model. From an algebraic point of view, it will always be possibleto put together a series of level matrices leading to heterogeneous mod-els but capable of producing equivalent theoretical frequencies. But onewonders whether such an exercise is of anything other than computationalinterest. If a level matrix is theoretically constructed, the discussion movesto how the researcher has operationalized his/her theoretical hypotheses.If it is possible to demonstrate that two (or several) alternative matricesexpress the same relations between the same hypotheses, why should thisbe a danger to sociological interpretation? Conversely, if it is possible todemonstrate that two (or several) alternative matrices expressing differentrelations between different theoretical hypotheses result in similar adjust-ments, why should this disqualify topological models? This would be theclassic case in which several theoretical models compete with one anotherto represent the same phenomenon. Is this a statistical question or rathera problem of rational debate on the model most justifiable from an epis-temological and theoretical point of view? Moreover, there is persuasiveevidence that the use of complex – that is, multi-matrix – versions of topo-logical models further reduces the ‘equivalent model’ problem because itobliges the sociologist to construct an articulated set of analytically dis-tinct theoretical hypotheses. Since these hypotheses will be operationalzedby means of a series of separate level matrices, it is all the more possi-ble to control and criticize the model’s internal coherence, as well as themanner in which its articulation has been translated into specific groups oflevel matrices. Some authors have acknowledged the value of a deductiveand confirmatory strategy of this kind (Goldthorpe and Payne, 1980: 95;Cobalti, 1992) as well as the attraction of multi-matrix variants (Ericksonand Goldthorpe, 1992: 122–123; Cobalti, 1996). The potential of the latterhas also been confirmed by hybrid applications which combine topologi-cal and association models (Pisati, 1997; Jonsson, 2004; Layte and Whelan,2004; Pisati and Schizzerotto, 2004). It is thus possible to move awayfrom the exploratory and incremental approach originally proposed byHauser (Featherman and Hauser, 1978: 140; Hauser, 1979: 435–444).
If one accepts these arguments, one can only conclude that log-lin-ear topological models, and especially their multi-matrix variant, are ofundeniable interest. They introduce theoretical reflection and systematicconceptual elaboration into quantitative data analysis. The methodologicalimplications of such a conclusion are no less significant: this article hasshown (at least for one specific case) that it is entirely possible to construct
744 GIANLUCA MANZO
empirical quantitative analyses that go well beyond the purely descriptivelevel. It is one thing to point out that this is rarely the case among the sup-porters of the variable approach; it is quite another to deny a priori thatany such thing is possible. My analysis has suggested that giving a purelydescriptive task to variable analysis implies an excessively categorical judg-ment which tends to equate the logical possibilities (‘rich’) of this approachwith the research practice (‘poor’) of numerous quantitative sociologists.
However, the real problem with log-linear topological models lies else-where. Even if one were to admit their capacity to relate sociological theoryto empirical data, one is obliged to recognize that they are unable to imple-ment the generative mechanism approach. The debate of the 1980s entirelyneglected this crucial point.
Careful examination of the research approach presented in sections (2),(3), and (4) should suffice to show that the methodological perspective ofgenerative mechanisms has only been partially implemented. Why is thisso? There are two reasons. First, although I have constructed my theory interms of generative mechanisms, the manner in which these latter have been‘restored’ to the empirical data does not constitute the ‘direct modeling’ oftheir structure and action. In other words, the mechanisms postulated as gen-erating inequalities in educational chances have been treated in largely imag-inative and abstract fashion. I have constructed a theoretical representationwithout being able to manipulate it directly. Translating these mechanismsinto a group of level matrices is only a partial solution from the perspectiveof a study aimed at manipulating and testing a series of generative mech-anisms. The relations that the approach is able to establish between theselatter and empirical data are rather weak and, above all, indirect. Indeed,the matrices impose theoretically significant constraints on the model: thetheoretical data thus undeniably result from a rule of production. This latter,however, does not directly represent a process; rather, it is the possible resultthereof. For example, the model was required to place more individuals fromthe socially superior group at the level of the highest qualifications and attri-bute theoretical significance to this constraint by way of level attributions inthe different matrices. Yet it did not directly represent the stylized actors whoattributed different values to different qualifications according to their socialgroup of origin (which is to say, the mechanism, or rather a part of it, ratherthan its effects). Second, certain components of my theory – in particular,Ma1,Ma2 and Ma3 (see note 19) – imply a conception of formal educationas a ‘positional good’, in the sense that the value of a qualification dependson its distribution in the population. This suggests that the actors in themodel are potentially in a situation of interdependence. It is essential to takethis feature into account when offering generative mechanism explanations,because it is precisely this notion of interdependence which authorizes oneto use the concept of emergence. The structure of educational chances can
GENERATIVE MECHANISMS AND MULTIVARIATE STATISTICAL ANALYSIS 745
only be characterized as emergent relative to individual actors if it derivesfrom a network of individuals who determine their actions and choices inrelation to those of the others. Although these features are implicitly pres-ent in the theoretical plan, the matrix specification of the model is entirelyunable to grasp them. Once again, it captures the effects of inter-dependence,not its structure or function. We thus have two formidable difficulties. How-ever sophisticated and theoretically well-grounded my multi-matrix log-lineartopological model may be, it only yields in another form the data with whichwe determined its parameters. The extent of this difficulty has been under-estimated even by methodologists sensitive to the notion of mechanism, suchas Ray Pawson (1989: 171–175), who have placed the uni-matrix topologi-cal model constructed by Goldthorpe and Payne (1980) in the category ofgenerative models.32
These difficulties have implications that extend beyond, I believe, thisspecific method. It is quite likely a major obstacle against any attempt toimplement explanations centered on mechanisms in the context of ‘quan-titative empirical sociology’. The variable approach appears, at least at itspresent state of technical development, unable to describe and implementa theoretical mechanism in dynamic and iterated manner. The parametersof a statistical model, no matter how sophisticated, are at best a repre-sentation (a fiction, we might say) of the effects of mechanisms imaginedat the theoretical level. The estimation algorithms used to produce theseparameters do not have strict relations with these theoretical mechanisms:they do not in the least constitute direct translations of them, because theyhave not been created to describe, activate, or implement them. Moreover,the statistical techniques used to study stratification phenomena privilege arepresentation of data where explanatory factors are summarized one afterthe other, rather than being organized into a structured configuration offactors. The idea of a ‘logic’ of data production processes is thus brokendown into a series of elements each of which separately produces sequen-tial-type effects. However, one could probably move towards solution ofthese difficulties by using a partly different methodological approach. Theattraction of certain simulation techniques is that they dynamically repre-sent the structure and the functioning of a series of mechanisms. In regardto the latter, the computer program that generates the model is explicitlyconceived and constructed to implement the mechanisms postulated at thetheoretical level. If correctly chosen, a specialized programming languageenables one to produce a structured group of algorithms expressing themechanisms of interest. In this sense, one can legitimately speak of the‘direct modeling of mechanisms’: each algorithm is conceived to translate aspecific process into a language comprehensible to the computer. The pur-pose of the algorithm is not to enable statistical estimation of a model’sparameters, to which the researcher then assigns such and such a meaning.
746 GIANLUCA MANZO
On the contrary, it is constructed to represent – and articulate – one orseveral very specific sociological ideas.
I conclude this article by putting forward a strong methodologicalhypothesis: if we wish to get closer to real sociological explanationscentered on the idea of mechanisms, we must leave the methodological con-text of the sociology of variables and enter a somewhat different para-digm: that of simulation methods and techniques.33 Hence, the problem ofquantitative empirical sociology’s ‘degree of permeability’ to the generativemechanism approach must be conceived in terms of the articulation andintegration of different methods; a solution that refuses to go beyond mul-tivariate analysis will very likely not be viable. I have explored the episte-mological presuppositions of this idea elsewhere (Manzo, 2005) and I amat present working on its concrete application to the study of inequalitiesin educational opportunities.
Notes
1. This is openly acknowledged to an increasing extent (Cherkaoui, 2003b; Goldthorpe,2003b; Jonsson, 2004). Few attempts have been made to construct a micro oriented the-ory of relative mobility (Logan, 1996; Pisati, 1997; Goldthorpe, 2000, chap. 11); indeed,doubts have recently been expressed as whether such a theory is possible (Breen andJonsson, 2003; Breen, 2004, chap. 15: 390–392, 402).
2. There are several terms in the literature for this approach: ‘variable-centered method-ology’ (Abell, 1984), ‘variable-oriented approach’ (Ragin, 1987, chap. 4), ‘variable-basedapproach’ (Abbott, 1992a: 441), ‘standard positivist analysis’ (Golthorpe, 2000, chap.5),‘quantitative sociology’ (Backman and Edling, 1999), ‘positivist sociology’ (Cherkaoui,2000, 2000a). I prefer quantitative empirical sociology in order to stress that ‘variablesociology’ does not exhaust quantitative sociology: there is another form of quantitativesociology which is purely theoretical – that is, mathematical sociology – and has its ownstatus and legitimacy (Fararo, 1984: 219; 1997: 91; Collins, 1992: 619–640; Edling, 2002:202). Without wanting to deny the importance of the following question, space pre-cludes its discussion here: Is it legitimate to speak of ‘quantitative sociology’? The episte-mological debate on the ambiguities of the distinction between ‘quantitative approach’and ‘qualitative approach’ no doubt merits closer attention than is possible here (see,for example, Cannavo, 1988; Cardano, 1991; Agodi, 1996).
3. On this point, contemporary sociology is rediscovering its oldest findings: see, in par-ticular, Boudon (1973, 1976, 1979), Fararo (1969, 1989), Harre, Secord (1972), Merton(1967).
4. As Cherkaoui remarked (2003a), this criticism is much older: see Wright Mills (1959).5. If one adds to this criticism the more general attacks on quantitative empirical sociology
set out in such important works as those by Clogg and Haritou (1997) and Esser (1996),one well understands why certain scholars today seek to construct systematic propos-als for improvement in variable sociology. See, for example, Andrew Abbott (1990, withHrycak; 1992a, b; 1995; 2000; 2000, with Tsay), Peter Abell (1984, 1998, 2003), or Hans-Peter Blossfeld (1996, 1998).
6. The data are taken from the 1993 ‘Formation-Qualification professionnelle’ (FQP) surveyconducted by INSEE (the French National Institute of Statistics and Economic Surveys):

GENERATIVE MECHANISMS AND MULTIVARIATE STATISTICAL ANALYSIS 747
I use a sample of 15,515 individuals, men and women aged between 25 and 64s. TheFQP survey data have been widely analyzed by studies on inequalities in educationalopportunity (Goux, 1995; Vallet, 1999, 2004b) and social mobility (Erikson and Gold-thorpe, 1992; Goldthorpe, 1995; Vallet, 1999, 2004b): their quality is largely recognizedat the international level (Breen, 2004). In order to obtain the most representative datapossible, I have adopted a procedure for weighting the 1993 data designed to correctcertain biases introduced by the survey’s sample design. More specifically, I ‘simulate’ asimple random sample (Vallet, 2004c). See also note 22.
7. A bi-dimensional contingency table contrasting origin and educational outcome thusconstitutes the analytic framework of this study. It is not the only possible approach,however. Since the beginning of the 1980s, the better part of studies on inequalitiesin educational opportunity have adopted what is known as the ‘educational transition’perspective, according to which the educational system is ideally fragmented into asequence of levels and points of bifurcation which is used to model the probabilities ofmoving from one level to next as a function of social origin. This perspective was intro-duced by Boudon (1973). Following the work of Robert Mare (1980, 1981), this strategywas implemented by means of logistic regression models: the most important compara-tive study of the 1990s is a clear example of this approach (Shavit and Blossfeld, 1993).This perspective has recently been subject to criticism (Breen and Jonsson, 2000). SeeVallet (2001a) for a detailed account. The present study thus takes a different approach,what Vallet calls a “contingency table approach to educational stratification”.
8. The classification of social groups used here is based upon a re-codification of INSEE’stwo-figure nomenclature of ‘professions and socio-professional categories’ (Desrosieresand Thevenot, 2002: chap 4 and pp. 105–114). In particular: O1: ‘Higher-grade profes-sionals, Liberal Professions, Business Managers’ (PCS 23, 31, 33, 34, 35, 37, 38); O2:‘Higher Intermediate Professions’ (PCS 42, 43, 44, 45, 46); O3: ‘Lower Intermediate Pro-fessions’ (PCS 52, 53, 54, 55, 47); O4: ‘Urban Petite bourgeoisie’ (PCS 21, 22); O5: ‘Agri-cultural petite bourgeoisie’ (PCS 10); O6: ‘Skilled Workers’ (PCS 48, 62, 63, 64, 65);O7: ‘Unskilled and Agricultural Workers’ (PCS 56, 67, 68, 69). Note that these variablesrefer to the ‘social group of family of origin’ in the sense that it considers, by meansof the ‘principal of dominance’ (Erikson and Goldthorpe, 1992: 238–239, 265–266), theprofession of both the mother and the father. See Pisati (2000) and Vallet (2001b) forthe complex debate on determination of ‘social family class’. In order to determinethe proximity between this classification and that typically used at the internationallevel, see, for example, Goldthorpe (1995: 65); Thelot, Vallet (2000: 6) propose a similarre-codification.As regards educational qualifications, the present study adopts a seven-position classi-fication of educational levels based on re-codification of INSEE’s 14 position classifi-cation of educational levels. In particular, E1: ‘Upper tertiary education diplomas’ (code10, 11); E2: ‘Lower tertiary education diplomas’ (code 30, 31, 32, 33); E3: ‘Upper generalsecondary education diplomas’ (code 40, 41); E4 : ‘Upper technical or professional second-ary education diplomas’ (code 42, 43); E5: ‘Short-term professional studies’ (code 50, 51);E6: ‘Primary education diplomas or lower general secondary education diploma’ (code 60,70); E7: ‘No diploma’ (code 71). Similar classifications have been used by Thelot, Vallet(2000: 6) and Vallet (2004b).
9. It is precisely this property which has prompted the decision to abandon other mea-sures of inequality which, by contrast, do not benefit from it. In the case of the studyof the temporal dimensions of educational inequalities, there is long-standing debate onthe use of simple differences or percentage ratios (Mare, 1980, 1981; Barbut, 1984, 1985;Combessie, 1984, 1985; Florens, 1984; Gremy, 1984; Merllie, 1985; Prevot, 1985; Vallet,
748 GIANLUCA MANZO
1988; Cobalti, 1989a). The same holds for studies of mobility (Cobalti, 1989b, c; 1995).The work of John Goldthorpe has had a major role in the spread and acceptance ofthis measure of association for studies of the relative aspect of social inequalities (Gold-thorpe, 1980: chap.3; Erikson and Goldthorpe, 1992: 54–59, 86).
10. Kaufman and Schervish (1987: 233, 251) have shown that the ‘Generalized Odds Ratios’can be calculated (on condition that three-way, or even higher-order, parameters are notpresent in the model) on the basis of bi-variate parameters in the multiplicative form(τij ) of the saturated log-linear model estimated in parameterization of ANOVA-type onthe basis of [τij ](ij)/(i−1)(j−1), i and j being respectively the number of rows and columns.
11. I have described this approach elsewhere: for the details, see Manzo 2004a.12. This individual micro mechanism was already postulated in Boudon (1973; and, more
clearly, 1990: 17, 18); it thereafter became the essential aspect of the rational theory ofeducational choice in the version of Richard Breen and John Goldthorpe (Goldthorpe,2000, chap.8: 175; chap.9: 186,189,196).
13. In the context of a micro theory based on the relative aspect of social mobility, thishypothesis has been explicitly put forward by Goldthorpe (2000, chap.11: 245) and Pisati(1997).
14. On this point, there is an important difference of emphasis between my model and thatavailable in the literature. Although Goldthorpe (2000, chap. 11: 242) admits the exis-tence of this goal in disadvantaged social groups, he attributes a secondary role to itand, in any case, he only raises the point in the context of his more recent sketch of atheory of the relative aspect of social mobility.
15. Whilst the former meaning of the risk-taking mechanism is widely recognized in therational educational choice model (see, for example, Goldthorpe, 2000, chap. 8: 175;chap. 9: 195; chap. 11: 249; Jonsson and Erikson, 2000: 364), I take a much clear andmore definite stance on latter meaning - the propensity for risk-taking in socially disad-vantaged groups. As Grusky and Di Carlo (2001) have stressed, Goldthorpe (2000: 245–247) leans towards a hypothesis of risk aversion among the most disadvantaged. Theresults of recent research suggest the legitimacy of my position: at least in France, thereis empirical evidence for the existence of a strong aspiration for upward social mobilityamong the most disadvantaged social groups (Beaud, 2003).
16. Goldthorpe (2000, chap. 9: 187–188) has emphasized the importance of this assumptionfor the model’s coherence.
17. The mechanism of the economic costs of instruction is largely taken into account by theauthors who have inspired my approach (Goldthorpe, 2000, chap. 8: 173–174; chap. 9;185–186; Gambetta, 1987, 1998; Jonsson and Erikson, 2000). Raymond Boudon attri-butes it a central role in generating inequalities of educational opportunity (1973: 75,115–116, 129–130, 210; 1990: 22, 23, 24, 30).
18. Although the ‘rational model of educational choice’ undeniably takes account of culturalresources, it is also true that the status of the latter is ambiguous. Their importance isrecognized by some authors more than others (see, for example, Jonsson, Erikson [2000]and Gambetta [1987]), but they are often introduced indirectly by means of the effectsthey exercise on educational success in the early phases of a student’s academic career.See, in particular, the distinction between primary and secondary effects (Boudon, 1973:63, 67, 69–70, 72, 103; Goldthorpe, 2000, chap. 8: 171; chap. 9: 186, 190–191, 192). Bycontrast, I maintain that a solid model must attribute a central theoretical role to theeffects of socialization in terms of the immaterial and symbolic resources that this pro-cess transmits to individuals. It is on precisely on this point, moreover, that the rationalmodel of educational choice is most often criticized (Goux and Maurin, 1995; Massot,2000; Esping–Andersen, 2003; Nash, 2003).
GENERATIVE MECHANISMS AND MULTIVARIATE STATISTICAL ANALYSIS 749
19. It is analytically correct to draw an important distinction here between the first threemechanisms and the last two. (MA1), (MA2) and (MA3) imply an instrumental con-ception of education as a positional good (its value depends on what the others do,the number who possess it, and its distribution); (MB1) and (MB2), by contrast, onlyinvolve a view of education as consumption good (‘the more expensive it is, the less itwill be bought’). I shall return to this point later.
20. The existence of these processes has also been well documented by the sociology ofeducation. The existence of processes of type 1) has been widely discussed, thoughsometimes in conceptually cumbersome and inappropriate terms, by a copious, Marx-ist-inspired body of literature: Althusser (1970), Baudelot and Establet (1971), Bourdieu(1966, 1973, 1979, 1986), Bourdieu and Passeron (1967, 1972), and Bowles and Gintis(1973) are significant examples. Processes of type 2) and 3) have recently been describedby the ethnographically oriented research of Stephane Beaud (2003) as well as by MarieDuru–Bellat (2002). Mohamed Cherkaoui (1979, 1986) has especially emphasised theimportance of the phenomena evoked in points 4) and 5). On this see also Duru-Bellatet al. (2004).
21. In this regard, note that in my model the matrix attributions for O6 and O7 on MA2 aswell as MA3 are attempts to mathematically capture statistically improbable educationaloutcomes that nevertheless are sometimes present in social reality.
22. The model was estimated using the Lem program (‘Log-linear and event history analy-sis with missing data using EM algorithm’) written by Jeroen Vermunt of the Universityof Tillburg (see Vermunt, 1997). The estimation was performed by means of a specifictype of maximum likelihood algorithm adapted to the log-linear non-hierarchical model:this being an algorithm known in the literature as a ‘uni-demensional Newton algorithm’(Vermunt, 1996: 27–28, 317–321; 1997: 5, 71, 89). The constraints of parameter identi-fication were of the Anova type (Kaufman and Schervish, 1987; Vermunt, 1996: 10–12;1997; Powers and Xie, 2000: 108). Also to be noted is that the results presented referto the model estimated on data weighted by means of the procedure described in note6. I also estimated model [5] as a weighted log-linear model (Vermunt, 1996: 29; 1997:9). When this alternative strategy was used, the results did not change. The goodness-of-fit statistics for the model estimated under the form (F ij ) = zij ∗ u ∗ ui ∗ uj ∗ uMa.1
ijk ∗uMa.2
ijk ∗uMa.3ijk ∗uMb.1
ijk ∗uMb.2ijk ∗uMc.1
ijk ∗uMc.2ijk , where zij is the coefficient of weighting for the
case i, j , are the following: L2 = 26.51 (0.598); Bic =−253.33; ID = 0.015; rL2 = 99.26;L2/dl =0.91.
23. This statistic was calculated as 2∑i [fij ] log[fij /Fij ] (Gilbert, 1993: 73; Vermunt, 1996:
21; 1997: 74; Wong, 2003b). The significance of this value can also be read relativeto the saturated model (Powers and Xie, 2000: 15). In this case, L2 is 0 because theobserved frequencies are perfectly reproduced by the model: a value close to 25 for myspecification shows that I have reproduced the observation data just as well as the sat-urated model does but with at least 29 independent parameters.
24. This measure can be approximated by L2-[(degree of liberty)∗ (log N)], N being the sam-ple size. The ‘Bayesian information criterion’ (Bic) has been used by studies on socialmobility in order to limit the effects of large sample size on test outcomes. The morenegative the value, the more the model achieves inclusive quality between its number ofparameters and adjustment to the data. This statistic was initially introduced by Raftery(1986a, b), who summarizes the discussion that arose around it in Raftery (2001). Seealso Powers and Xie (2000: 106–107).
25. This measure is calculated as∑ij |fij − Fij |/2N (Vermunt, 1997: 74). It is normally
interpreted as expressing the proportion of cases misclassified by the model.
750 GIANLUCA MANZO
26. This index has been calculated here as {[(L2)ind. − (L2)top.]/(L2)ind.} ∗ 100, which isequivalent to 1 − [(L2)top../(L
2)ind.] ∗ 100. This statistic is often used in studies of socialmobility in order to evaluate the extent to which M reduces the discrepancy betweenthe theoretical data produced by model M’ taken as reference and the observation data.Erikson and Goldthorpe (1992: 88–99 and note 19) discuss the significance of this mea-sure in the context of log-linear models.
27. The [L2/(number of degrees of freedom)] ratio as a goodness-of-fit measure is systemat-ically discussed by Wong (1994, 2003b).
28. I thus adopt the strategy recommended by Powers and Xie (2000: 145–146): i.e. studyingthe behavior of a plurality of fit statistics instead of stopping at the value of one or, atbest, two measures.
29. The mathematical form of this type of residual is rij = [fij −Fij ]/√
Fij . It normally fol-lows a normal distribution with a mean of 0 and a standard error less than 1, if themodel is correct (Di Franco 2003: 86). It is often admitted that a value above 2 indi-cates a mis-adjustment of the model to the empirical data (Cobalti, 1992: 136; Gilbert,1993: 85). Gilbert (ibid.), however, notes that this rule is only truly relevant to a resid-ual form that follows a standardized normal distribution: on dividing the standardizedresiduals by their standard error, one obtains a residual form (adjusted residuals) satis-fying this condition (if the model is correct). I have also calculated this type of residual.The results remained unchanged: all values were less than 2.
30. So that the scope of my results is correctly understood, I would stress that my analysisdoes not address the possible fit variations of the model produced by important vari-ables such as gender or birth cohort. This is no doubt a shortcoming: I have decidedto concentrate on my model’s construction and global test. Some of the results notreported here – available from the author on request – show that the model fit with-stands introduction of the variable ‘gender’. I am also examining the possibility ofcombining my topological specification with log-multiplicative components in order toconduct parsimonious analysis of the temporal variations in the effects of the ‘mecha-nisms postulated’.
31. This result was already visible in the parameter values of the complete version of topo-logical models [5], Table 9, part B: the negative effect of uMb.2
ij was nearly 1.6 timesgreater than that of uMb.1
ij . Moreover, this specific comparison gives me the opportunityto specify that I have not evaluated the relative importance of different parameters bythis means because this would have required numerous comparisons without supplyinga stable term of reference. Given that direct comparison of parameter values have beenexcluded a priori because of the well-known problems of interpreting log-linear param-eters (Erikson and Goldthorpe 1992: 182–186), I have opted for the solution discussedabove. See Stier, Grusky (1990: 743–744) for a clear application of the same strategy.
32. In light of what we have just said, Cherkaoui’s epistemological evaluation (2000: 136,note 1) of Goldthorpe’s first works (1980) is more correct: unlike Pawson, Cherkaoui –who explicitly confronts the latter on this point – denies that this type of research isrelated to generative mechanisms methodology.
33. The literature on the application of simulation methods in the social sciences has bur-geoned since the end of the 1980s. On the specific point at issue here (the relationbetween mechanisms and simulation models) see, among others, Edling (2002: 213),Gilbert, Troitzsch (1999: 17), Goldthorpe (2000, chap 9: 158), Halpin (1999: 1500,1501, 1503), Hanneman, Collins, Mordt (1995: 3, 4, 28, 29, 40), Heise (1995), Macy,Willer (2002: 162). More generally, Fararo, Hummons (1995), Moretti (2000, 2002),and Sawyer (2003) conduct very useful discussion on the application of simulation
GENERATIVE MECHANISMS AND MULTIVARIATE STATISTICAL ANALYSIS 751
models in sociology. I myself have attempted a critical analysis of this copious literature(Manzo, 2004b, 2005).
References
Abbott, A. (1992a). From causes to events. Notes on narrative positivism. SociologicalMethods and Research 20(4).
Abbott, A. (1992b). What do cases do? Some notes on activity in sociological analysis. In:C. C. Ragin and H. S. Becker (eds.), What is a Case? Exploring the Foundations of SocialInquiry. Cambridge: Cambridge University Press.
Abbott, A. (1995). Sequence analysis: new methods for old ideas. Annual Review of Sociology21.
Abbott, A. (2000). Reply to Levine and Wu. Sociological Methods and Research 29(1).Abbott, A. and Hrycak, A. (1990). Measuring resemblance in sequence data: an optimal
matching analysis of musicians careers. American Journal of Sociology 96(1).Abbott, A. and Tsay, A. (2000). Sequence analysis and optimal matching methods in soci-
ology. Sociological Methods and Research 29(1).Abell, P. (1984). Comparative narratives: some rules for study of action. Journal for the
Theory of Social Behaviour 14.Abell, P. (1998). Causality and low frequency complex events: the role of comparative
narratives. communication ISA, Montreal.Abell, P. (2003). The role of rational choice and narrative action theories in sociological
theory. Revue Francaise de Sociologie 44(2).Agodi, M. C. (1996). Qualita e quantita: un falso dilemma e tanti equivoci. In: C. Cipolla
and A. De Lillo (eds.), Il sociologo e le sirene. La sfida dei metodi qualitativi. Milano,FrancoAngeli.
Althusser, L. (1970). Ideologia ed apparati ideologici di stato. In: M. Barbagli (ed.), 1978,Istruzione, legittimazione, Conflitto. Bologna: Il Mulino.
Backman, O. and Edling, C R. (1999). Mathematics matters: on the absence of mathematicalmodels in quantitative sociology. Acta Sociologica 42(1).
Ballarino, G. and Bernardi, F. (2000). Uso di dati time-budget per lo studio delle risorsefamiliari: capitale sociale e culturale dei genitori e disuguaglianza delle opportunita edu-cative. communication Workshop on social capital, Trento, 19-20/10/ 2000.
Ballarino, G. and Cobalti, A. (2003). Mobilita sociale. Roma, Carocci.Barbera, F. (2004). Meccanismi sociali. Elementi di sociologia analitica. Bologna: Il Mulino.Barbut, M. (1984). Note sur quelques indicateurs globaux de l’inegalite. Revue francaise de
sociologie XXV(4).Barbut, M. (1985). Commentaire sur la note de J-C. Combessie. Revue francaise de sociolo-
gie. XXVI(1).Baudelot, C. and Establet, R. (1971). L’ecole capitaliste en France. Paris, Maspero.Beaud, S. (2003)2. 80% au bac . . . et apres? Les enfants de la democratisation scolaire, Paris,
La Decouverte.Becker, R. (2003). Educational expansion and persistent inequality of education. Utilizing
subjective expected utility theory to explain increasing participation rates in upper sec-ondary school in the Federal republic of Germany. European Sociological Review 19(1).
Berger, P. (2002). Non verso lacrime sulla sociologia. La stampa, decembre.Bishop, Y. M. M., Fienberg S. E., and Holland, P. W. (1975). Discrete Multivariate Analysis
Cambridge: MIT Press.Blossfeld, H. -P. (1996). Macro-sociology, rational choice theory, and time. A theoretical per-
spective on the empirical analysis of social processes. European Sociological Review 12(2).
752 GIANLUCA MANZO
Blossfeld, H. -P. (1998). A dynamic integration of micro- and macro-perspective using longi-tudinal data and event history models. In: H. -P. Blossfeld and G. Prein, Rational ChoiceTheory and Large-Scale Data Analysis, Boulder Co., Westview Press, chap. 14.
Bohrnstedt, G. W. and Knoke, D. (1998). Statistica per le scienze sociali, Bologna, Il Mulino,(ed. Or. Statistics for Social Data Analysis, Itasca: Peacock publishers, 1994).
Boudon, R. (1973). L’inegalite des chances. La mobilite sociale dans les societes industrielles,Paris, Colin.
Boudon, R. (1976). Comment on Hauser’s review of education, opportunity, and socialinequality. American Journal of Sociology 81(4).
Boudon, R. (1979). Generating models as a research strategy. In: R. K. Merton, J. S. Cole-man and P.H. Rossi (eds.), Qualitative and Quantitative Social Research. New York: Thefree press.
Boudon, R. (1990). Les causes de l’inegalite des chances scolaires. In: R. Boudon, C.-H.Cuin and A. Massot (eds.), L’axiomatique de l’inegalite des chances, L’Harmattan, Pressede l’universite de Laval.
Boudon, R. (1997). Metodologia della sociologia e delle scienze sociali. Torino: Jaca Book.Boudon, R. (1998). Social mechanisms without black boxes. In: P. Hedstrom and
R. Swedberg, (eds.), 1998a, Social mechanisms. An Analytical Approach to Social Theory.Cambridge: Cambridge University Press.
Boudon, R. (2002). Sociology that really matters. European Sociological Review 18.Boudon, R. (2003). Raison, Bonnes Raisons. Paris, Puf.Bourdieu, P. (1966). La trasmissione dell’eredita culturale. In: M. Barbagli (ed.), Istruzione,
Legittimazione, Conflitto. Bologna: Il Mulino 1978.Bourdieu, P. (1973). Cultural reproduction and social reproduction. In: R. Brown (ed.),
Knowledge, Education and Culture. London: Tavistock.Bourdieu, P. (1979). La distinction. Critique sociale du jugement, Minuit, Paris.Bourdieu, P. (1986). The forms of capital. In: A. H. Halsey et al., (eds.), Education: Culture,
Economy and Society. Oxford: Oxford University Press 1997.Bourdieu, P., Passeron J. -C. (1964). Les heritiers. Les etudiants et la culture. Minuit, ParisBourdieu, P., Passeron J. -C. (1970). La reproduction. Elements pour une theorie du systeme
d’enseignement, Minuit, Paris.Bowles, S. and Gintis H. (1973). Q.I. e struttura di classe negli Stati Uniti. In: M. Barbagli,
(ed.), 1978, Istruzione, legittimazione, conflitto. Bologna: Il Mulino.Breen, R. (2001). A rational choice model of educational inequality. Istituto Juan March,
Madrid, Working Paper 2001/166.Breen, R. (ed.), (2004). Social Mobility in Europe, Oxford: Oxford University Press.Breen, R. and Jonsson, J. O. (2000). Analyzing educational carrers: A multinomial transition
model. American Sociological Review 65 October.Breen, R. and Jonsson, J. O. (2003). Period and Cohort Change in Social Fluidity: Sweden,
1976–1999 unpublished paper.Breen, R. and Yaish, M. (2003). Testing the Breen–Goldthorpe Model of educational deci-
sion making. Working paper, Oxford: Nuffield College.Bunge, M. (1997). Mechanisms and explanation. Philosophy of Social Sciences 27(4).Bunge, M. (1998). Social Science Under Debate: A Philosophical Perspective. University of
Toronto Press.Cannavo, L. (1988). Qualita e quantita: tra metodologia sociologica e sociologia della sci-
enza. Sociologia e ricerca sociale 28.Cardano, M. (1991). Il sociologo e le muse. Qualita e quantita nella ricerca sociologica.
Rassegna italiana di sociologia 32(2).
GENERATIVE MECHANISMS AND MULTIVARIATE STATISTICAL ANALYSIS 753
Cherkaoui, M. (1979). Les paradoxes de la reussite scolaire. Sociologie comparee des systemesd’enseignement. Paris, PUF.
Cherkaoui, M. (1986). Sociologie de l’education. Paris, PUF.Cherkaoui, M. (2000). La strategie des mecanismes generateurs comme logique de l’explica-
tion. In: F. Chazel and J. Baechler (eds.), L’acteur et ses raisons. Paris, Puf.Cherkaoui, M. (2003a). Effets de composition et mecanismes generateurs. In: M. Borlandi
and L. Sciolla (eds.), Teorie e metodi delle scienze sociali. Bologna: Il Mulino.Cherkaoui, M. (2003b). The individual and the collective. On the syntaxes of stratification
theory. European Review 11(4).Clogg, C. C. and Haritou, A. (1997). The regression method of causal inference and a
dilemma confronting this method. In: V. R. McKim and P. S. Turner (eds.), Casualityin Crisis?: University of Notre Dame Press, Indiana, 1997.
Cobalti, A. (1989a). La diseguaglianza delle opportunita educative: problemi di misura delcambiamento nel tempo. In: R. Moscati (dir.), La sociologia dell’educazione in Italia.Centralita e marginalita della scuola. Bologna: Zanichelli.
Cobalti, A. (1989b). A relative mobility table. A modest proposal. Quality and Quantity 23.Cobalti, A. (1989c). L’analise dei dati di mobilita. La tavola di mobilita relativa. Quaderni
di sociologia 12.Cobalti, A. (1992). Origine sociale e livello di istruzione: un modello. Polis 6(1).Cobalti, A. (1995). Lo studio della mobilita sociale. Metodi e prospettive dell’indagine socio-
logica, Roma, Nis.Cobalti A. (1996). Istruzione e mobilita sociale in Italie: recenti analisi dei dati del 1985,
Polis, X, 3.Cobalti, A. and Schizzerotto, A. (1994). La mobilita sociale in Italia. L’influenza dei fattori
di diseguaglianza sul destino educativo, professionale e sociale dei singoli nel nostro paese.Bologna: Il Mulino.
Coleman, J. (1990). The Foundations of Social Theory: Cambridge, Harvard university press.Collins, R. (1992). Teorie Sociologiche. Bologna: Il Mulino.Combessie, J. -C. (1984). L’evolution comparee des inegalites: problemes statistiques. Revue
Francaise de Sociologie XXV.Combessie, J. -C. (1985). Paradoxe des fonctions de concentration. Revue francaise de Soci-
ologie XXVI.Cox, D. R. (1992). Causality: some statistical aspects. Journal of the Royal Statistical Society
155 Series A.Cox, D. R. and Wermuth, N. (1993). Linear dependencies represented by chain graphs. Sta-
tistical Science 8.Cuin, C. -H. (2000). Ce que (ne) font (pas) les sociologues. Petit essai d’epistemologie cri-
tique. Geneve, Droz.Davies, R., Heinesen, E. and Holm, A. (2002). The relative risk aversion hypothesis of edu-
cational choice. Journal of Population Economics 15(4).Desrosieres, A. and Thevenot, L. (2002). Les categories socioprofessionnelles. Paris, La
Decouverte.Di Franco, G. (2003). L’analise multivariata nelle scienze sociali. Modelli log-lineari e variabili
categoriali. Roma, Carocci.Duru-Bellat, M. (2002). Les inegalites sociales a l’ecole. Genese et mythes. Paris, Puf.Duru-Bellat, M., Le Bastard-Landrier, S., Piquee, C., and Suchaut, B. (2004). Tonalite so-
ciale du contexte et experience scolaire des eleves au lycee et a l’ecole primaire. RevueFrancaise de Sociologie 45(3).
Edling, C. R. (2002). Mathematics in sociology. Annual Review of Sociology 28.
754 GIANLUCA MANZO
Elster, J. (1998). A plea for mechanisms. In: P. Hedstrom and R. Swedberg (eds.), 1998a,Social Mechanisms. An Analytical Approach to Social Theory. Cambridge: CambridgeUniversity Press.
Elster, J. (2003). Proverbes, Maximes, Emotions. Puf, Paris.Erikson, R. and Goldthorpe, J. (1992). The constant Flux: A Study of Class Mobility in
Industrial Society. Oxford: Clarendon Press.Esping-Andersen, G. and Mestres, J. (2003). Ineguaglianza delle opportunita ed eredita so-
ciale. Stato e Mercato 67.Esser, H. (1996). What is wrong with ‘variable sociology’? European Sociological Review
12(2).Fararo, T. J. (1969). Stochastic process. In: E. F. Borgatta (ed.), Sociological Methodology.
San Francisco: Jossey-Bass.Fararo, T. J. (1984). Preface. Journal of Mathematical Sociology 10.Fararo, T. J. (1989) The meaning of general theoretical sociology. Tradition and Formalisation,
Cambridge: Cambridge University Press.Fararo, T. J. and Hummon N. P. (1995). The emergence of computational sociology. Journal
of Mathematical Sociology 20(2–3).Featherman, D. L. and Hauser, R. (1978). Opportunity and Change. New York: Academic
Press.Florens. J. -P. (1984). Inegalite et dependance statistique. Revue Francaise de Sociologie.
XXV.Freedman, D. A. (1991a). Statistical analysis and shoe leather. Sociological Methodology 21.Freedman, D. A. (1991b). A rejoinder to Berk, Blalock and Mason. Sociological
Methodology 21.Gambetta, D. (1987). Where They Pushed or Did They Jump? Individual Decision Mechanism
in Education. Cambridge: Cambridge University Press.Gambetta, D. (1998). Concatenations of mechanisms. In: P. Hedstrom and R. Swedberg
(eds.), 1998a, Social Mechanisms. An Analytical Approach to Social Theory. Cambridge:Cambridge University Press.
Garnier, A. M. and Raffalovich, E. L. (1984). The evolution of equality of educationalopportunities in France. Sociology of Education 57.
Gilbert, N. (1993). Analyzing Tabular Data. Loglinear and Logistic Models for SocialResearchers, London: UCL Press.
Gilbert, N. and Troitzsch, K. (1999). Simulation for the Social Scientist, Philadelphia: OpenUniversity Press.
Goldthorpe, J. (avec Llewellyn C., Payne C.) (1980). Social Mobility and Class Structure inModern Britain. Oxford: Clarendon Press.
Goldthorpe, J. (1995). ‘Le noyau dur’: fluidite sociale en Angleterre et en France depuis lesannees 1970 et 1980. Revue Francaise de Sociologie XXXVI(1).
Goldthorpe, J. (2000). On Sociology. Numbers, Narratives, and the Integration of Research andTheory. Oxford: Oxford University Press.
Goldthorpe, J. (2003a). Sociology as social science and cameral sociology: some furtherthoughts. Sociology Working Papers, 2003–07, Department of Sociology, Oxford.
Goldthorpe, J. (2003b). Progress in sociology: The case of social mobility research. SociologyWorking Papers, Paper number 2003–08, Department of Sociology, Oxford.
Goux, D. and Maurin, E. (1995). Origine sociale et destinee scolaire. Revue Francaise deSociologie XXXVI(1).
Gremy, J. -P. (1984). Sur les differences entre pourcentage et leur interpretation. RevueFrancaise de Sociologie XXV.
GENERATIVE MECHANISMS AND MULTIVARIATE STATISTICAL ANALYSIS 755
Grusky, D. B. and Di Carlo, M. (2001). Should Sociologists Plod Along and EstablishDescriptive Regularities or Seek a Grand Explanation of Them? European SociologicalReview 17(4).
Grusky, D. B. and Hauser, R. (1984) Comparative social mobility revisited: models of con-vergence and divergence in 16 Country. American Sociological Review 49.
Halpin, B. (1999). Simulation in sociology. American behavioral scientist 42(10).Hanneman, R. A., Collins R. and Mordt, G. (1995). Discovering theory dynamics by com-
puter simulation: experiments on state legitimacy and imperialist capitalism. SociologicalMethodology 25(1).
Harre, R. (1972). The Philosophies of Science. An Introductory Survey. Oxford: Oxford Uni-versity Press.
Harre, R. and Secord, P. F. (1972). The Explanation of Social Behaviour. Oxford: OxfordUniversity Press.
Hauser, R. (1978). A structural model of the mobility table. Social Forces 56(3).Hauser, R. (1979). Some exploratory methods for modelling mobility tables and other cross-
classified data. In: K. F. Schuessler (ed.), Sociological Methodology, 1980, San Francisco:Jossey-Bass.
Hauser, R. (1981). Hope for the Mobility ratio. Social Forces 60(2).Hauser, R. (1986). Reinventing the Oxcart: Jones’ obsolete proposal for the mobility analy-
sis. Social Forces 64(4).Hauser, R. (1987). Reply to Kim. Social Forces 65(3).Hechter, M. (1998). The future of rational choice theory and its relationships to quantita-
tive macro-sociological research. In: H. -P. Blossfeld and G. Prein (eds.), 1998. RationalChoice Theory and Large-Scale Data Analysis Boulder Co., Westview Press, chap. 17.
Hedstrom, P. (2003). Generative models and explanatory research: on sociology of AageSorensen. http://www.nuff.ox.ac.uk/Sociology/Group/Hedstrom.htm.
Hedstrom, P. (2005). Dissecting the Social: On the Principles of Analytical Sociology. Cam-bridge: Cambridge University Press.
Hedstrom, P. and Swedberg, R. (1996). Rational choice, empirical research, and the socio-logical tradition. European Sociological Review 12(2).
Hedstrom, P. and Swedberg, R. (eds.), (1998a). Social Mechanisms. An Analytical Approachto Social Theory. Cambridge: Cambridge University Press.
Hedstrom, P. and Swedberg, R. (1998b). Social mechanisms: an introductory essay. In: P.Hedstrom and R. Swedberg (eds.), Social Mechanisms. An Analytical Approach to SocialTheory. Cambridge: Cambridge University Press.
Heise, D. (1995). Sociological algorithms: preface. Journal of Mathematical Sociology 20(2–3).
Hillmert, S. and Jacob, M. (2003). Social inequality in higher education. Is vocational train-ing a pathway leading to or away from university? European Sociological Review 19(3).
Hope, K. (1981). The new mobility ratio. Social Forces 60(2).Hout, M. (1983). Mobility Tables. Sage, London.Jones, F. L. (1985). New and (very) old mobility ratio: is there life after Benini. Social Forces
63(3).Jones, F. L. (1986). Reponse to Hauser. Social Forces 64(4).Jones, F. L., Wilson, S. R. and Pittelkow, Y. (1990). Modelling mobility: the use of simula-
tion to choose between near-equivalent models. Quality and Quantity 24.Jonsson, J. O. (2004). Equality at a Halt? Social Mobility in Sweden, 1976–99. In: R. Breen
(ed.), Social Mobility in Europe. Oxford: Oxford University Press 2004, chap. 9.Jonsson, J. O. and Erikson, R. (2000). Understanding educational inequality: the Swedish
experience. L’annee Sociologique 50(2).
756 GIANLUCA MANZO
Kaufman, R. L. and Schervish, P. G. (1986). Using adjusted crosstabulations to interpretlog-linear relationship. American Sociological Review 51 October.
Kaufman, R. L. and Schervish, P. G. (1987). Variations on a theme. More uses of odds ratiosto interpret log-linear parameters. Sociological Methods and Research 16(2).
Kim, J. -O. (1987). Social mobility, status inheritance, and structural constraints: conceptualand methodological considerations. Social Forces 65(3).
Layte, R. and Whelan, C. T. (2004). Class transformation and trends in social fluidity inthe Republic of Ireland 1973–94. In: R. Breen (ed.), Social Mobility in Europe. Oxford:Oxford University press 2004, chap. 7.
Logan, J. A. (1996). Rules of access and shift in demand: a comparison of log-linear andtwo-sided logit models. Social Science Research 25.
MacDonald, K. I. (1981). On the formulation of a structural model of the mobility table.Social Forces 60(2).
MacDonald, K. I. (1983). On the interpretation of a structural model of the mobility table.Quanlity and Quantity 17.
Macy, W. M. and Willer, R. (2002). From factors to actors: computational sociology andagent-based modeling. Annual Review of Sociology 28.
Manzo, G. (2004a). Verso una teoria delle diseguaglianze di opportunita educative. Studi diSociologia 42(1).
Manzo, G. (2004b). Appunti sulla simulazione al computer. Un metodo attraente per la ric-erca sociologica. In: C. Corposanto (dir.), Metodologie non-intrusive nelle science sociali,Franco Angeli, Milano, chap. 9.
Manzo, G. (2005). Variables, mecanismes et simulations. Une combinaison des troismethodes est-elle possible ? Une analyse critique de la litterature. Revue Francaise de So-ciologie 46(1).
Massot, A. (2000). Analyse des processus decisionnels de la scolarisation. In: R. Boudon,C. -H. Cuin and A. Massot (eds.), L’axiomatique de l’inegalite des chances, L’Harmat-tan, Presse de l’universite de Laval.
Mare, R. (1980). Social background and school continuation decisions. Journal of the Amer-ican Statistical Association 75.
Mare, R. (1981). Change and stability in educational stratification. American SociologicalReview 46.
Mills, C. W. (1959). The Sociological Imagination. New York: Oxford University Press.Moretti, S. (2000). Teorie sociologiche e modelli computazionali. Problemi metodologici
nella definizione di un sistema di simulazione nelle science sociali. Sociologia e ricercasociale 63.
Moretti, S. (2002). Computer simulation in sociology: what contribution? Social SciencesComputer Review 20(1).
Merllie, D. (1985). Analyse de l’interaction entre variables. Probleme statistique ou sociolog-ique. Revue Francaise de Sociologie XXVI.
Merton, R. K. (1967). On the sociological theories of the middle range. In: R. K. Merton(ed.), On Theoretical Sociology. Five Essays, Old and New. London: The free press.
Muller, W. and Karle, W. (1993). Social selection in educational systems in Europe. EuropeanSociological Review 9.
Nash, R. (2003). Inequality/difference in education: is a real explanation of primary and sec-ondary effects possible? British Journal of Sociology 54(4).
Pawson, R. (1989). A Measure for Measure: A Manifesto for Empirical Sociology. London,Routledge.
Pisati, M. (1997). Mobility regimes and generative mechanisms: a comparative analysis ofItaly and the United States. European Sociological Review 13(2).

GENERATIVE MECHANISMS AND MULTIVARIATE STATISTICAL ANALYSIS 757
Pisati, M. (2000). La Mobilia Sociale. Bologna: Il Mulino.Pisati, M. (2004). The Italian Mobility Regim: 1985–97, In: R. Breen (ed.), Social Mobility
in Europe. Oxford: Oxford University Press 2004, chap. 6.Pontinen, S. (1982). Models and social mobility research: a comparison of some log-linear
models of a social mobility matrix. Quality and Quantity 16.Powers, D. A. and Xie, Y. (2000). Statistical Methods for Categorical Data Analysis. San
Diego: Academic Press.Prevot, J. (1985). A propos d’indices et de comparaisons de proportions. Revue Francaise de
Sociologie XXVI.Raftery, A. E. (1986a). Choosing models for cross-classifications. American Sociological
Review 51.Raftery, A. E. (1986b). A note on bayes factors for log-linear contingency table models with
vague prior information. Journal of the Royal Statistical Society, Serie B 48.Raftery, A. E. (2001). Statistics in sociology, 1950–2000: A selective review. Sociological
Methodology 2001.Ragin, C. C. (1987). The Comparative Method. Moving Beyond Qualitative and Quantitative
Strategies. Berkeley: University of California Press.Sawyer, R. K. (2003). Artificial societies. Multiagent systems and the micro-macro link in
sociological theory. Sociological Methods and Research 31(3).Schizzerotto, A. (1997). Perche in Italia ci sono pochi diplomati e pochi laureati? Vincoli
strutturali e decisioni razionali degli attori come cause della contenuta espansione dellascolarita superiore. Polis 11(3).
Shavit, Y. and Blossfeld, H. -P. (1993). Persistent Inequality: Changes Educational Attainmentin Thirteen Countries. Boulder: Westwiew Press.
Smith, H. L. and Garnier, M. A. (1986). Association between background and educationalattainment in France. Sociological Methods and Research 14.
Sorensen, A. (1998). Theoretical mechanisms and the empirical study of social processes.In: P. Hedstrom and R. Swedberg (eds.), Social Mechanisms. An Analytical Approach toSocial Theory, Cambridge: Cambridge University Press.
Stier, H. and Grusky D. B. (1990). An overlapping persistence model of career mobility.American Sociological Review 55.
Stinchcombe, A. L. (1991). The condition of fruitfulness of theorizing about mechanism insocial science. Philosophy of the Social Sciences 21(3).
Thelot, C. and Vallet, L. -A. (2000). La reduction des inegalites sociales devant l’ecole de-puis le debut du siecle. Economie et Statistique 4.
Vallet, L. -A. (1988). L’inegalite des chances: un modele d’evolution. Revue Francaise de So-ciologie XXIX 3.
Vallet, L. -A. (1999). Quarante annees de mobilite sociale en France. L’evolution de la flui-dite sociale a la lumiere de modeles recents. Revue Francaise de Sociologie 40(1).
Vallet, L. -A. (2001a). State of the art and current issues in comparative educational strati-fication research. communication, ISA research committee 28, Mannheim, April.
Vallet, L. -A. (2001b). Stratification et mobilite sociale: la place des femmes. In: J. Laufer, C.Marry and M. Maruani (eds), Masculin – Feminin: questions pour les sciences de l’hom-me. Paris, PUF, chap. 4.
Vallet, L. -A. (2004a). The dynamics of educational opportunity in France. Change in theassociation between social background and education in thirteen five-year cohorts (1908–1972). communication, ISA research committee 28, Neuchatel, May.
Vallet, L. -A. (2004b). Change in intergenerational class mobility in France from the 1970sto the 1990s and its explanation: an analysis following the Casmin approach. In: R.Breen (ed.), Social Mobility in Europe. Oxford: Oxford University Press 2004, chap. 5.
758 GIANLUCA MANZO
Vallet, L. -A. (2004c). Modelisation log-lineaire et log-multiplicative des tableaux decontingence – Examples et listing sous LEM. Point-Recherche CREST 20.
Van den Berg, A. (1998). Is sociological theory too grand for social mechanisms ? In:P. Hedstrom and R. Swedberg (eds.), Social Mechanisms. An Analytical Approach toSocial Theory. Cambridge: Cambridge University Press.
Vermunt, J. K. (1996). Log-linear Event History Analysis : A General Approach with MissingData, Unobserved Heterogeneity and Latent Variables. Tillburg: Tillburg University press.
Vermunt, J. K. (1997). Lem: A General Program for the Analysis of Categorical Data. TilburgUniversity (accessible sur le web).
Wong, R. S.-K. (1990). Understanding cross-national variation in occupational mobility.American Sociological Review 55.
Wong, R. S. -K. (1994). Model selection strategies and the use of association models todetect group differences. Sociological Methods and Research 22(4).
Wong, R. S. -K. (2003a). Introduction to Log-linear Modeling. University of California-SantaBarbara (accessible sur le web).
Wong, R. S. -K. (2003b). How sample size and strength of association affect the abilityto detect group differences in cross-classification analysis. communication, ISA researchcommittee 28, Tokyo, March.