GENERATIONAL DIFFERENCES IN SERVANT LEADERSHIP AND …
189
GENERATIONAL DIFFERENCES IN SERVANT LEADERSHIP AND JOB SATISFACTION WITHIN RELIGIOUS NON-PROFIT ORGANIZATIONS ALONG THE US/MEXICO BORDER By Glenn C. Lafitte, B.S., M.P.H. DISSERTATION Presented to the Faculty of the Department of Leadership Studies Our Lady of the Lake University, In Partial Fulfillment of the Requirements For the Degree of Doctor of Philosophy in Leadership Studies Our Lady of the Lake University San Antonio, Texas _______________________________ Barbara Baggerly-Hinojosa, PhD Committee Chair _______________________________ Carol Wheeler, PhD Committee Member _______________________________ Yu Sun, PhD Committee Member
Transcript of GENERATIONAL DIFFERENCES IN SERVANT LEADERSHIP AND …

GENERATIONAL DIFFERENCES IN SERVANT LEADERSHIP AND JOB SATISFACTION WITHIN RELIGIOUS NON-PROFIT
ORGANIZATIONS ALONG THE US/MEXICO BORDER
By
Glenn C. Lafitte, B.S., M.P.H.
DISSERTATION Presented to the Faculty of the
Department of Leadership Studies Our Lady of the Lake University,
In Partial Fulfillment of the Requirements For the Degree of
Doctor of Philosophy in
Leadership Studies
Our Lady of the Lake University San Antonio, Texas
_______________________________ Barbara Baggerly-Hinojosa, PhD
Committee Chair
_______________________________ Carol Wheeler, PhD Committee Member
_______________________________
Yu Sun, PhD Committee Member

ii
DEDICATION
This dissertation is dedicated above all to my Lord and Savior Jesus Christ – the
ultimate Servant Leader. It is also dedicated to my wife Bonnie who encouraged me to
pursue this doctorate, sacrificed more than anyone else during all the years I worked on
it, and never gave up on me. Of her it can truly be said, “Many waters cannot quench
love, neither can the floods drown it” – not even the flood of a Ph. D. program! (Song of
Solomon 8:7). I also dedicate it to my son, Jared, our daughter-in-law, Mandy, and our
granddaughter, Audrey; and our son, Justin, and our daughter-in-law, Glenna. You have
all shown me incredible love and patience during these years of study.

iii
ACKNOWLEDGEMENTS
In acknowledging the many people who have helped me in completing this
dissertation I have two competing fears: the fear of forgetting someone, and the fear that
if I acknowledge everyone who has helped me, this section could be as long as the rest of
the entire dissertation! First of all I must acknowledge Dr. Barbara Baggerly-Hinojosa,
my dissertation committee chair, and professor for many of my Leadership Studies
courses, who patiently guided me through the intricacies of the dissertation process. I also
wish to thank Dr. Carol Wheeler and Dr. Yu Sun, the other members of my dissertation
committee; and Dr. Esther Gergen and Dr. Meghan Carmody-Bubb who examined me
during my pre-public defense. They all provided invaluable insights which have helped
me improve this dissertation. I would also like to acknowledge the other professors at
Our Lady of the Lake University Rio Grande Valley under whom I had the privilege of
studying: Dr. Jared Montoya, Dr. Phyllis Duncan, Dr. Horacio Salinas, Dr. Charles
Chapman, Dr. Roy Sheneman, Dr. Chris Townsend, and Dr. John Swiger. Thank you
fellow members of OLLU RGV Cohort 5: Dr. David Martínez (my carpool companion
during the classroom phase of our program), Dr. Sofía Villarreal, Dr. Mollie Ramón, Dr.
Randy Townley, Dr. Dora Vargas-Bustos, and (soon-to-be) Drs. Roland García, Eddie
Errisuriz, Lucy Leal, and Esther Rodríguez. You have all modeled servant leadership for
me and helped me to persevere.
I wish to thank the board and staff of Inspiracom, the organization with which I
serve, including Dr. Abe Limón who encouraged me to look into the Leadership Studies
program at Our Lady of the Lake University, and the late Dr. Hernán Meneses who was
my friend and mentor for over 35 years and helped me with many of the fine points of the
Spanish language as it pertained to this study. I struggle with not mentioning anyone else

iv
by name from Inspiracom, but this relates to the first sentence of these
Acknowledgments, as there are over 200 of you! A special thanks to Dr. Larry Windle of
Rio Grande Bible Ministries and your organization for all your help. Dr. Jim Laub of the
OLA Group was incredibly helpful and generous with any and everything related to the
Organizational Leadership Assessment (OLA).
My mother-in-law Alice Brawand has been a constant source of encouragement,
as have Bonnie’s and my brothers and their families: David and Christy Brawand, Dr.
John and Anna Brawand, and Bruce Lafitte and Daria Jones; and their children, their
children’s spouses, and their grandchildren. Bonnie’s uncle and aunt, Dr. Leon and
Professor Mary Long have helped and encouraged me in very specific ways. Thank you
also to the rest of the members of our extended family.
Thank you to my “band of brothers”, Dr. Steve Havener, Dr. Matt Johnson, and
Mario Pérez who have met with me for years every Tuesday morning for prayer,
breakfast, and fellowship and have stood by me in friendship. They and their families and
so many other friends all over the world are part of that “great cloud of witnesses”
(Hebrews 12:1) who constantly cheer me on in life. Finally, thank you to my mission
family and my church family who are a constant source of encouragement.
Soli Deo Gloria!
Glenn C. Lafitte
March, 2017

v
TABLE OF CONTENTS
DEDICATION ............................................................................................................... ii
ACKNOWLEDGEMENTS ........................................................................................... iii
TABLE OF CONTENTS ................................................................................................. v
LIST OF TABLES ........................................................................................................ ix
LIST OF FIGURES ......................................................................................................... x EXECUTIVE SUMMARY............................................................................................. xi
Abstract .............................................................................................................. xi
Introduction and Background .............................................................................xii
The Problem .................................................................................................... xiii
Previous Studies ................................................................................................ xiv
Participants .....................................................................................................xxiii
Instruments ..................................................................................................... xxiv
Method ........................................................................................................... xxiv
Results ............................................................................................................. xxv
References .................................................................................................... xxviii
CHAPTER ONE – INTRODUCTION ............................................................................. 1
Introduction ..................................................................................................................... 1
Background ..................................................................................................................... 3
Generational Cohorts ....................................................................................................... 3
Servant Leadership .......................................................................................................... 5
Servant Leadership Models and Instruments .................................................................... 7
Job Satisfaction ............................................................................................................... 9

vi
Servant Leadership and Job Satisfaction ........................................................................ 10
Statement of the Problem ............................................................................................... 11
Purpose of the Study ...................................................................................................... 12
Conceptual Definitions .................................................................................................. 13
Research Questions ....................................................................................................... 17
Leadership Models ........................................................................................................ 18
CHAPTER TWO – LITERATURE REVIEW ............................................................... 20
Introduction ................................................................................................................... 20
Follower’s Generational Cohort and Perception of Servant Leadership .......................... 20
Generational Cohort and Leadership .................................................................. 22
Age and Servant Leadership .......................................................................................... 27
Age and Leadership ........................................................................................... 29
Follower’s Language and Perception of Servant Leadership .......................................... 38
Language and Leadership ................................................................................... 39
Follower’s Tenure and Perception of Servant Leadership ............................................... 40
Tenure and Leadership ....................................................................................... 42
Follower’s Gender and Perception of Servant Leadership .............................................. 44
Gender and Leadership....................................................................................... 45
Follower’s Education and Perception of Servant Leadership .......................................... 51
Education and Leadership .................................................................................. 52
Follower’s Organizational Level and Perception of Servant Leadership ......................... 55
Follower’s Generational Cohort and Job Satisfaction ..................................................... 59
Age and Job Satisfaction .................................................................................... 61

vii
Follower’s Language and Job Satisfaction ..................................................................... 65
Follower’s Tenure and Job Satisfaction ......................................................................... 67
Follower’s Gender and Job Satisfaction ......................................................................... 70
Follower’s Education and Job Satisfaction ..................................................................... 72
Follower’s Organizational Level and Job Satisfaction .................................................... 74
Perception of Servant Leadership and Follower’s Job Satisfaction ................................. 75
Leadership and Job Satisfaction ......................................................................... 79
CHAPTER THREE – METHODOLOGY ..................................................................... 81
Overview ....................................................................................................................... 81
Sampling Plan ............................................................................................................... 81
Research Study Instruments ........................................................................................... 82
Operational Definitions for Independent and Control Variables ..................................... 86
Operational Definitions for Dependent Variables ........................................................... 87
Research Design ............................................................................................................ 88
Null Hypotheses ............................................................................................................ 89
Procedure ...................................................................................................................... 89
Data Collection and Analysis ......................................................................................... 91
Ethical Considerations ................................................................................................... 92
CHAPTER FOUR – RESULTS ..................................................................................... 94
Overview ....................................................................................................................... 94
Data Collected ............................................................................................................... 94
Descriptive Statistics ..................................................................................................... 96
Participants’ Demographic Variables ................................................................. 96

viii
Servant Leadership ........................................................................................... 102
Job Satisfaction ................................................................................................ 103
Findings ...................................................................................................................... 104
Correlations ................................................................................................................. 104
Null Hypothesis 1 ........................................................................................................ 105
Null Hypothesis 2 ........................................................................................................ 109
Null Hypothesis 3 ........................................................................................................ 113
CHAPTER FIVE – DISCUSSION AND CONCLUSION ........................................... 115
Summary ..................................................................................................................... 115
Discussion of Findings ................................................................................................ 116
Implications ................................................................................................................. 118
Limitations .................................................................................................................. 119
Recommendations for Future Research ........................................................................ 120
References ................................................................................................................... 122
Appendices .................................................................................................................. 133
A. OLLU IRB approval letter ........................................................................... 133
B. Recruitment message in English and Spanish ............................................... 134
C. Informed Consent Form in English and Spanish .......................................... 137
D. Permission letter from World Radio Network .............................................. 142
E. Permission letter from Rio Grande Bible Ministries .................................... 143
F. Demographic Form in English and Spanish ................................................. 144
G. Permission email from Dr. James Laub to use the OLA ............................... 146
H. The OLA in English and Spanish................................................................. 148

ix
LIST OF TABLES
Table 1. Study’s Cronbach’s Alphas .............................................................................. 86
Table 2. Participant Language Comparison .................................................................... 96
Table 3. Participant Gender Comparison ........................................................................ 98
Table 4. Participant Education ....................................................................................... 99
Table 5. Participant Organizational Level .................................................................... 100
Table 6. Participant Generational Cohort ..................................................................... 101
Table 7. Pearson Correlation Matrix ............................................................................ 104
Table 8. ANCOVA of Servant Leadership ................................................................... 106
Table 9. ANCOVA of Job Satisfaction ........................................................................ 110
Table 10. Multiple Regression Model Summary – Job Satisfaction .............................. 114

x
LIST OF FIGURES
Figure 1. Dimensions of Laub’s Servant Leadership Model ........................................... 18
Figure 2. Dimensions of Laub’s Job Satisfaction Model ................................................ 19
Figure 3. Relationship between Servant Leadership and Job Satisfaction ....................... 19
Figure 4. Language Comparison of Participants ............................................................. 96
Figure 5. Tenure Distribution of Participants ................................................................. 97
Figure 6. Gender Comparison of Participants ................................................................. 98
Figure 7. Education Comparison of Participants ............................................................ 99
Figure 8. Organizational Level Comparison of Participants.......................................... 100
Figure 9. Generational Cohort Comparison of Participants........................................... 101
Figure 10. Distribution of Servant Leadership Scores .................................................. 102
Figure 11. Distribution of Job Satisfaction Scores ........................................................ 103
Figure 12. Generational Cohort/Gender Interaction on Servant Leadership .................. 107
Figure 13. Scatterplot of Servant Leadership and Tenure ............................................. 108
Figure 14. Generational Cohort/Gender Interaction on Job Satisfaction ....................... 111
Figure 15. Scatterplot of Job Satisfaction and Tenure................................................... 112
Figure 16. Scatterplot of Servant Leadership and Job Satisfaction ................................ 114

xi
EXECUTIVE SUMMARY
Abstract
This study has investigated generational differences among two religious non-
profit organizations along the US/Mexico border on measures of followers’ perception of
servant leadership and followers’ job satisfaction. A convenience sample was recruited
by electronic means from the board and staff of World Radio Network, Inc., and the
board, staff, and students of Rio Grande Bible Ministries. Participants took the online
version of the Organizational Leadership Assessment (OLA) (Laub, 1999). Language
was determined by the language the participant selected to take the OLA. A sample of
n = 152 completed the demographic survey and the OLA. This was a non-experimental
descriptive research design. The respondents’ generational cohort as a categorical
independent variable was compared with composite scores on the servant leadership scale
and the job satisfaction scale of the OLA as dependent variables, controlling for
language, tenure, gender, education, and organizational level employing factorial analysis
of covariance (ANCOVA) methodology. Separate ANCOVAs were conducted for
generational differences on the servant leadership scale of the OLA, and on generational
differences on the job satisfaction scale of the OLA. In addition, multiple regression
analysis was used to analyze composite scores on the servant leadership scale of the OLA
as a predictor of composite scores on the job satisfaction scale of the OLA. The
demographic variables of generational cohort, language, tenure, gender, education, and
organizational level were entered as control variables into the hierarchical regression
analysis.
xii
Introduction and Background
This study has investigated generational differences on measures of followers’
perception of servant leadership and followers’ job satisfaction among two religious non-
profit organizations along the US/Mexico border. The concepts of generational
differences and servant leadership have received attention for some time now in the
popular and practitioner literature (Gibson, Greenwood, & Murphy, 2009; Parry &
Urwin, 2011; Spears, 2005). In recent years, the empirical support for both concepts has
increased (Twenge, 2010; Green, Rodríguez, Wheeler, & Baggerly-Hinojosa, 2015).
There has been little research to date that has combined the two concepts (Zimmerer,
2013).
Sessa, Kabacoff, Deal, and Brown (2007) state “a generation is a group of people
of the same age in a similar social location experiencing similar social
events…predisposing them for a certain characteristic mode of thought” (p. 49). They go
on to say “these [generational] effects are stable over time, and these life experiences
tend to distinguish one cohort from another” (p. 49). Still later they say “empirical
research is beginning to suggest that generational cohorts do exist in the United States
and can be differentiated from each other….However, at this point, labels and exact years
those labels represent are often inconsistent” (p. 49).
This study has focused on generational differences and job satisfaction as applied
to the servant leadership model of which Robert Greenleaf is regarded as the founder. In
the essay “The servant as leader” (Greenleaf, 2003, pp. 29-74), written in 1970 which
forms part 1 of The Servant-Leader Within, he articulated his model of the servant leader.
Among the elements to be found in the servant leader are that he or she inspires trust,
xiii
listens with attention, and searches for understanding. He or she raises questions so that
others may question their assumptions and be persuaded to make needed changes. The
servant leader promotes healing and sees that everyone is heard (Greenleaf, 2003).
Laub (1999) developed both a servant leadership scale and a job satisfaction scale
for the Organizational Leadership Assessment (OLA). He found a strong positive
correlation between the servant leadership scale and the job satisfaction scale in his
original field research. In his model, servant leaders are defined as those who display
authenticity, value people, develop people, build community, provide leadership, and
share leadership. Job satisfaction in followers is defined as working at a high level of
productivity, feeling good about one’s contribution to the organization, feeling that one’s
job is important to organizational success, enjoying working for the organization, being
able to be creative in one’s job, and being able to use one’s gifts and abilities in the job.
Other researchers have found a strong positive correlation between the servant leadership
scale of the OLA and other measures of job satisfaction (Thompson, 2002; Cerit, 2009;
Jordan, 2015).
The Problem
There has been little research to date on generational attitudes towards work
environment, leadership, and job satisfaction as measured by valid and reliable servant
leadership and job satisfaction instruments (Zimmerer, 2013). Organizations must adapt
to change as the younger generations inevitably assume positions of leadership now held
by the older generations (Parry & Urwin, 2011). The organizations in this study are
religious non-profits located on the US/Mexico border (World Radio Network, 2016a;
Rio Grande Bible Ministries, 2016). They continue to grow in number of donors and

xiv
income after decades of existence. This growth has occurred in the face of dramatic
changes along the US/Mexico border over the past several decades. These organizations
must continue to be able to adapt to change as the younger generations assume positions
of leadership now held by the older generations. The board and staff members of both
World Radio Network, Inc. and Rio Grande Bible Ministries fall into the four categories
of generations that serve as the independent variable for this study. Older board and staff
members will inevitably leave the organization and be replaced by members of younger
generations. Members of younger generations will inevitably assume positions of
leadership previously held by older generations. If the different generations react and
respond differently to circumstances in the workplace, it is conceivable they would
display varied levels of response to assessments of servant leadership and job satisfaction
that measure their attitudes towards work environment and leadership.
Previous Studies
This dissertation has explored generational differences in followers’ perception of
servant leadership and job satisfaction when controlling for language, tenure, gender,
education, and organizational level. A review of the literature did not reveal any meta-
analyses of servant leadership. There have been a limited number of meta-analyses of
generational cohorts. Where the literature has been limited, this section has been
expanded to include followers’ age in the case of generational cohort, and perception of
leadership in general in the case of servant leadership.
Generational Cohorts and Servant Leadership
There has been only one study to date that has investigated differences between
followers’ generational cohort and perception of servant leadership. That is the study by
xv
Zimmerer (2013). She found no statistical difference between followers’ generational
cohort and perception of servant leadership.
Researchers found mixed results when reporting followers’ generational cohort
and perception of leadership. Sessa, Kabacoff, Deal, and Brown (2007) found significant
generational differences in attributes perceived to be most important in leaders including
credibility, dedication, focus, optimism, farsightedness, and listening. However, they
found that some of the differences were only partially supported, and were more due to
maturational than to generational cohort effects. Lester, Standifer, Schultz, and Windsor
(2012) found some generational differences in followers’ perception of leadership values
but also found some of the differences to be perceived rather than actual differences in
leadership values. Rodriguez, Green, and Ree (2003) found significant differences
between Baby Boomers and Generation Xers in preferred leadership behaviors.
Researchers found mixed results when reporting followers’ age and perception of
servant leadership. The original field research for the Organizational Leadership
Assessment (OLA) (Laub, 1999) found no significant differences among age categories
on perception of servant leadership but did find a small but significant positive
relationship between followers’ increasing age and perception of servant leadership.
Subsequent research with the OLA by Horsman (2001) found significant differences
among age categories unrelated to increasing age in perception of servant leadership.
Rodríguez-Rubio and Kiser (2013) also found significant differences among age
categories unrelated to increasing age in perception of servant leadership.
Researchers found mixed results when reporting followers’ age and perception of
leadership. Shirom, Gilboa, Fried, and Cooper (2008) found that as tenure and age

xvi
increased, and as percentage of women and age increased, there was a reduction in the
negative correlation between role ambiguity and job performance. Kabacoff and Stoffey
(2001) found higher ratings for younger managers in the areas of overall leadership
effectiveness than for older managers. O-Campo, Joyner, and Green (2012) in their study
of language spoken at home and leadership preferences, did not find age to be a
significant covariate. Ng and Feldman (2010) found a positive relationship between
followers’ increasing age and leader-member exchange (LMX) dyad formation. Kooij,
Jansen, Dikkers, and Lange (2010) found employee perceptions of leadership practices of
training, rewards, participation, information sharing, and teamwork to be positively
correlated with affective commitment and age. Gilbert, Collins, and Brenner (1990)
found the effect size between age of a leader, and his or her effectiveness from the point
of view of the follower to be small. Lok and Crawford (2003) did not find a significant
relationship between the age of participants and scores on the Leader Behavior
Descriptive Questionnaire (LBDQ) (Stogdill, 1974). Barbuto, Matkin, and Marx (2007)
found differences in followers’ perceptions of leadership between age categories
unrelated to increasing age. Kearney and Gebert (2009) found transformational
leadership to be a significant moderator of the relationship of age on some, but not all,
team outcomes.
Servant Leadership and Control Variables
Previous research has not revealed significant differences in perception of servant
leadership based on followers’ language. Dannhauser and Boshoff (2006) did not find
significant differences between Afrikaans and English speakers in perception of servant
leadership as measured by the Servant Leadership Questionnaire (SLQ) (Barbuto &

xvii
Wheeler, 2006). Irving and McIntosh (2007) found similar reliability coefficients
between English and Spanish versions of the OLA (Laub, 1999). McIntosh and Irving
(2010) found similar reliability coefficients between English and Spanish versions on
three of the four dimensions of the Servant Leadership Assessment Instrument (SLAI)
(Dennis & Bocarnea, 2005).
In other measures of leadership, followers’ language did not reveal differences in
perception of leadership. Lok and Crawford (2003) did not find significant mean
differences on either LBDQ (Stogdill, 1974) factor between English-speaking Australian
and Chinese-speaking Hong Kong managers. O-Campo et al. (2012) found a significant
interaction between gender and language in two of the GLOBE (House, Hanges, Javidan,
Dorfman, & Gupta, 2004) leadership preferences. However, the interactions were within
the same language group, not between language groups.
Research has revealed mixed results in the relationship between followers’ tenure
and perception of servant leadership. The original research for the development of the
OLA (Laub, 1999) did not find a significant relationship between tenure and servant
leadership. Additional research by Salameh (2011) using the OLA found significant
differences based on years of tenure group category, but they were unrelated to increasing
tenure and servant leadership.
Research has found mixed results in the relationship between followers’ tenure
and perception of leadership. Lok and Crawford (2003) found a negative relationship
between tenure and consideration and a positive relationship between tenure and
initiating structure in research utilizing the LBDQ (Stogdill, 1974). Sin, Nahrgang, and
Morgeson (2009) found that the longer the tenure the greater the degree of LMX dyad
xviii
formation. Kooij et al. (2010) found that tenure had a significantly negative moderating
effect between some HR practices and affective commitment and no significant
moderating effect between other HR practices and affective commitment.
Research has not revealed a significant difference in followers’ perception of
servant leadership based on gender. The original research for the OLA (Laub, 1999) and
later research by Horsman (2001) using the OLA did not find significant differences
between men and women on perception of servant leadership. Research by Dannhauser
and Boshoff (2006) using the SLQ (Barbuto & Wheeler, 2006) also did not find
significant differences between men and women on perception of servant leadership.
Research has found mixed results in followers’ perception of leadership based on
gender. A meta-analysis by Eagly, Johannesen-Schmidt, and van Engen (2003) found
female leaders were more transformational and engaged in more contingent reward
behaviors than male leaders. In the meta-analysis of Paustian-Underdahl, Walker, and
Woehr (2014), followers rated women significantly higher than men as leaders, whereas
men rated themselves significantly higher as leaders than women did. Shirom et al.
(2008) found that as percentage of women and age increased among followers, there was
a reduction in the negative correlation between followers’ role ambiguity and job
performance. Lok and Crawford (2003) did not find a significant mean difference
between men and women on either the initiating structure or consideration dimension of
the LBDQ (Stogdill, 1974). Barbuto et al. (2007) found some significant differences
between men and women followers in their study of the effect of leaders’ gender,
educational level, and age categories on a leader’s use of full range leadership behaviors
as rated by followers. The Cuadrado, Morales, and Recio (2008) experimental study of

xix
leadership style and gender regarding women’s access to managerial positions did not
find statistical differences between men and women followers in perception of leadership.
Elsesser and Lever (2011) found the effect size to be small between men and women
followers in their study of gender bias against female leaders. O-Campo et al. (2012)
discovered a main effect for gender in their study of gender and language spoken at home
as applied to the six GLOBE (House et al., 2004) leadership preferences.
Research has indicated mixed results based on followers’ level of education and
perception of servant leadership. The original field research by Laub (1999) for the
development of the Organizational Leadership Assessment (OLA) did not discover
differences in perception of servant leadership based on educational level. Later research
by Horsman (2001) with the OLA revealed increased perception of servant leadership
with increasing level of education. Research by Salameh (2011) with the OLA and
Dannhauser and Boshoff (2006) with the SLQ (Barbuto & Wheeler, 2006) did not find
significant differences in perception of servant leadership by followers based on
educational level.
Research has indicated significant differences between both leaders’ and
followers’ educational level and followers’ perception of leadership. Leaders with
advanced degrees were perceived by followers as exhibiting individualized consideration
more than those without an advanced degree in the Barbuto et al. (2007) study. The Lok
and Crawford (2003) study found significant differences between increasing followers’
educational level and their perception of leaders’ consideration on the LBDQ (Stogdill,
1974). Kearney and Gebert (2009) found that transformational leadership moderated the
effect of followers’ education on team performance. When transformational leadership is

xx
high the effect of followers’ education on team performance is high. In the Rodriguez et
al. (2003) assessment of generational differences between followers in preferences for
leadership behaviors, there were significant differences especially among Generation
Xers in preferences for several leadership behaviors by educational level of the follower.
Research has indicated mixed results in followers’ organizational level and
perception of servant leadership. The original field research for the Organizational
Leadership Assessment (OLA) Laub (1999) found that the higher one’s level within the
organization the higher the perception of servant leadership. Research by Horsman
(2001) and Ledbetter (2003) with the OLA had similar findings as Laub’s (1999) original
research. Subsequent research with the OLA by Thompson (2002) found no difference in
perception of servant leadership among followers’ organizational level. Drury (2004)
found a significantly higher perception by top leadership than hourly workers of servant
leadership within an organization as measured by the OLA.
Generational Cohorts and Job Satisfaction
Research has revealed mixed results between followers’ generational cohort and
job satisfaction. The Hansen and Leuty study (2012) found significant generational
differences for women in the areas of followers’ satisfaction with working conditions,
advancement, and relationships with coworkers. They found significant generational
differences for men in the areas of followers’ satisfaction with overall comfort, working
conditions, job security, and authority. The Zimmerer (2013) study did not find any
differences between generational cohorts and followers’ job satisfaction. The Costanza,
Badger, Fraser, Severt, and Gade (2012) meta-analysis of generational comparisons

xxi
revealed that Matures exhibited slightly more job satisfaction than Baby Boomers and
Generation X.
Research has revealed mixed results in the relationship of followers’ age with job
satisfaction. Several studies found a positive relationship between followers’ age and job
satisfaction (Ng & Feldman, 2010; Laub, 1999; Lok & Crawford, 2003; Dobrow Riza,
Ganzach, & Liu, 2014). The Ng, Eby, Sorensen, and Feldman (2005) meta-analysis did
not find a correlation between followers’ age and career satisfaction. Gittell, Weinberg,
Pfefferle, and Bishop (2008) found that followers’ age was not a significant predictor of
job satisfaction. The Kooij et al. (2010) meta-analysis revealed that employee perceptions
of HR practices were positively correlated with job satisfaction and increased with age.
Job Satisfaction and Control Variables
Results have been mixed for differences in followers’ job satisfaction by
language. The Yousef (2000) and Gittell et al. (2008) studies did not reveal followers’
language to be a significant predictor of job satisfaction. The Lok and Crawford (2003)
study revealed significant differences in job satisfaction between language groups. Irving
and McIntosh (2007) obtained similar reliability coefficients in English and Spanish for
the job satisfaction scale of the OLA (Laub, 1999).
Results of research on the relationship between followers’ tenure and job
satisfaction have been mixed. Both the Ng et al. (2003) and the Gittell et al. (2008)
studies found that followers’ job tenure was not a significant predictor of job satisfaction.
The Ng and Feldman (2010) meta-analysis of age and job attitudes revealed a significant
moderating effect of followers’ tenure on job satisfaction. As tenure increased job
satisfaction increased. The Kooij et al. (2010) meta-analysis found that followers’ tenure

xxii
had a significantly negative moderating effect on the association between the HR
practices of training, information sharing, and staffing, and job satisfaction. The Laub
(1999) study revealed a positive relationship between tenure and job satisfaction. Both
the Lok and Crawford (2003) and the Dobrow Riza et al. (2014) studies revealed a
negative relationship between followers’ tenure and job satisfaction.
Researchers found mixed results when reporting followers’ gender and job
satisfaction. Several studies did not find followers’ gender to be a significant predictor of
job satisfaction (Lok & Crawford, 2003; Ng et al. (2005); Gittell et al., 2008). The Ng
and Feldman (2010) meta-analysis of age and job attitudes revealed a significant
moderating effect of gender on job satisfaction. The Aydin, Uysal, and Sarier (2012)
meta-analysis found a small effect in favor of males on job satisfaction of teachers in
Turkey.
Results of research have been mixed on followers’ education and job satisfaction.
Lok and Crawford (2003) and Ng et al. (2005) found followers’ educational level to be a
significant predictor of job satisfaction. The Ng and Feldman (2010) meta-analysis of age
and job attitudes revealed a significant moderating effect of college education on job
satisfaction. Gittell et al. (2008) did not find followers’ educational level to be a
significant predictor of job satisfaction.
Researchers have found mixed results in followers’ level of job satisfaction based
on organizational level. Salyadain (1977) and Laub (1999) found that job satisfaction
increased with increasing organizational level. Jordan (2015) did not find significant
differences in job satisfaction between organizational levels.
xxiii
Servant Leadership and Job Satisfaction
Studies have indicated a significant relationship between servant leadership and
job satisfaction. The original research for the development of the Organizational
Leadership Assessment (OLA) (Laub, 1999) and subsequent studies (Drury, 2004; Irving,
2004; Anderson, 2005) have indicated a strong positive correlation between the servant
leadership and job satisfaction scales of the OLA. Subsequent research has indicated a
strong positive correlation between the servant leadership scale of the OLA and other
measures of job satisfaction (Thompson, 2002; Cerit, 2009; Jordan, 2015). Other
measures of servant leadership besides the OLA have shown a strong positive correlation
with measures of job satisfaction (Van Dierendonck & Nuijten, 2011; Zimmerer, 2013).
Previous studies have indicated a significant relationship between leadership style
and followers’ job satisfaction (Yousef, 2000; Lok & Crawford, 2003). The Ng et al.
(2005) meta-analysis revealed a significant positive correlation between career
sponsorship, supervisor support, training and skill development opportunities, and
followers’ career satisfaction. In the Kooij et al. (2010) meta-analysis, there was a
positive correlation between the high commitment HR practices of internal promotion,
training, job enrichment, job security, rewards, participation, information sharing,
teamwork, work-life policies, flexible work schedules, staffing, and performance
management, and followers’ job satisfaction.
Participants
A convenience sample was recruited from the board and staff of World Radio
Network, Inc. and Rio Grande Bible Ministries (and also from the students of Rio Grande
Bible Ministries) by electronic means. After giving informed consent by electronic

xxiv
means, participants provided information by online survey regarding date of birth, tenure
with the organization, gender, education, and organizational level. Participants took the
online version of the Organizational Leadership Assessment (OLA) (Laub, 1999).
Language was determined by the language the participant selected to take the
Organizational Leadership Assessment (OLA) (Laub, 1999). Out of approximately 900
potential participants, 152 completed the demographic survey and the OLA for a
response rate of 16.9%.
Instruments
The participants took an online survey in the language of their choice – English or
Spanish - that included date of birth, language, tenure, gender, education, and
organizational level. They also took the online version in the language of their choice –
English or Spanish – of the Organizational Leadership Assessment (OLA) (Laub, 1999).
The OLA is a 66-item, 5-point Likert scale format instrument that includes a 60-item
servant leadership scale and a 6-item job satisfaction scale.
Method
This was a non-experimental descriptive research design. The respondents’
generation as a categorical independent variable was compared with composite scores on
the servant leadership scale and the job satisfaction scale of the OLA as dependent
variables, controlling for language, tenure, gender, education, and organizational level
employing factorial Analysis of Covariance (ANCOVA) methodology. Separate
ANCOVAs were conducted for generational differences on the servant leadership scale
of the OLA, and on generational differences on the job satisfaction scale of the OLA.
Analysis of Covariance (ANCOVA) was employed to control for the effect of the

xxv
continuous variable of tenure on the relationship between the categorical variable of
generational cohort and scores on the servant leadership and job satisfaction scales of the
OLA, as well as to control for the effect of the variables of language, gender, education,
and organizational level on the relationship between the categorical variable of
generation cohort and scores on the servant leadership and job satisfaction scales of the
OLA. ANCOVAs were analyzed for any main effect of generational cohort or control
variables on the dependent variables of servant leadership scores and job satisfaction
scores of the OLA, as well as any interactions between generational cohort and the
control variables on the dependent variables of servant leadership scores and job
satisfaction scores of the OLA. Pearson’s r correlations, t-tests, and ANOVAs were
conducted as appropriate.
In addition, multiple regression analysis was used to analyze composite scores on
the servant leadership scale of the OLA as a predictor of composite scores on the job
satisfaction scale of the OLA. The demographic variables of generational cohort,
language, tenure, gender, education, and organizational level were entered as control
variables into the hierarchical regression analysis. R2, Δ R2, βeta weights, and partial
correlations were conducted for the regression analysis. Pearson’s r correlations, t-tests,
and ANOVAs were conducted as appropriate.
Results
This study employed factorial analysis of covariance (ANCOVA) to test
differences in scores on the servant leadership scale of the Organizational Leadership
Assessment (OLA) (Laub, 1999) by generational cohort when controlling for language,
tenure, gender, education, and organizational level. While there was not a significant

xxvi
main effect between generational cohort and scores on the servant leadership scale of the
OLA, there was a significant interaction between Generational Cohort and Gender:
F(3, 89) = 2.802, p = .044. Tenure was also a significant covariate: F(1, 89) = 8.132,
p = .005. This suggests that in the presence of both gender and tenure, there are some
generational differences in followers’ perception of servant leadership. For the oldest and
youngest generation, men have a slightly higher perception of servant leadership than
women. For the middle two generations, women have a slightly higher perception of
servant leadership than men.
Factorial analysis of covariance (ANCOVA) was also employed to test
differences in scores on the job satisfaction scale of the Organizational Leadership
Assessment (OLA) (Laub, 1999) by generational cohort when controlling for language,
tenure, gender, education, and organizational level. Again, while there was not a
significant main effect between generational cohort and scores on the job satisfaction
scale of the OLA, there was a significant interaction between Generational Cohort and
Gender: F(3, 89) = 2.710, p = .050. Again, tenure was a significant covariate:
F(1, 89) = 6.957, p = .010. This suggests that in the presence of both gender and tenure,
there are some generational differences in followers’ job satisfaction. For the oldest and
youngest generation, men have a slightly higher level of job satisfaction than women. For
the middle two generations, women have a slightly higher level of job satisfaction than
men. There was a significant main effect for language: F(1, 89) = 7.873, p = .006. The
results of a t-test (t(150) = -2.91, p = .004) revealed that English speakers had a lower
mean score on the job satisfaction scale of the OLA (M = 4.14) than Spanish speakers
(M = 4.50).
xxvii
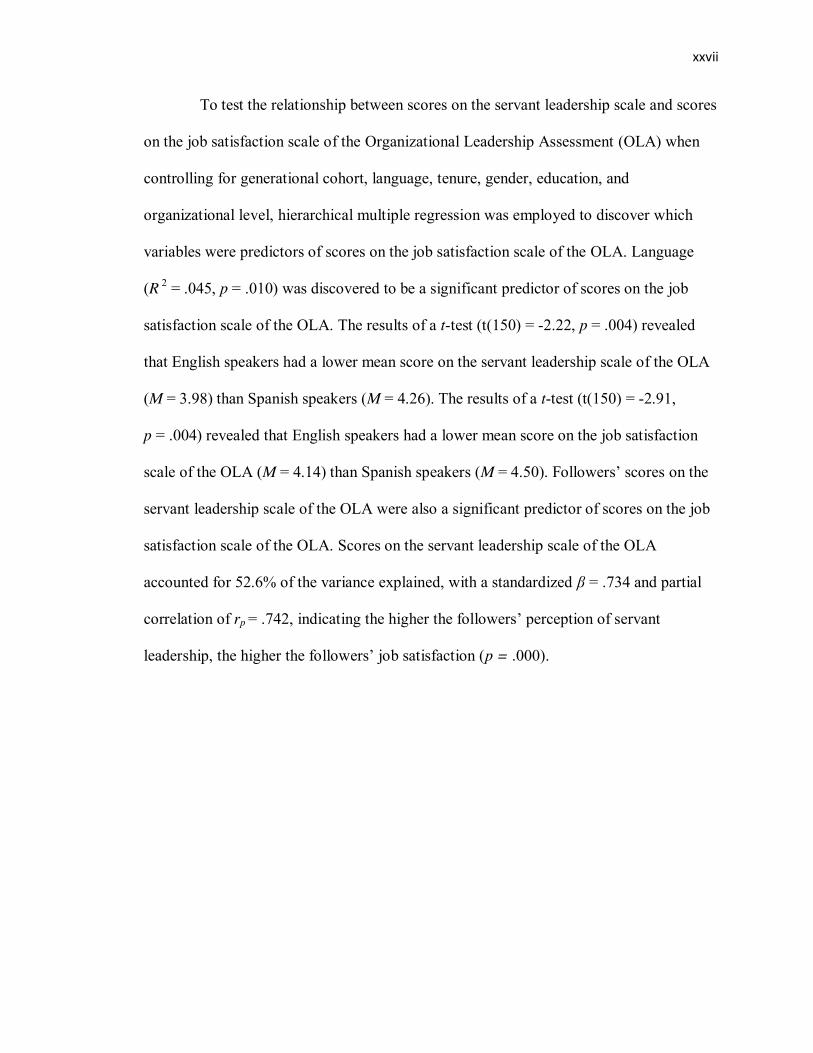
To test the relationship between scores on the servant leadership scale and scores
on the job satisfaction scale of the Organizational Leadership Assessment (OLA) when
controlling for generational cohort, language, tenure, gender, education, and
organizational level, hierarchical multiple regression was employed to discover which
variables were predictors of scores on the job satisfaction scale of the OLA. Language
(R 2 = .045, p = .010) was discovered to be a significant predictor of scores on the job
satisfaction scale of the OLA. The results of a t-test (t(150) = -2.22, p = .004) revealed
that English speakers had a lower mean score on the servant leadership scale of the OLA
(M = 3.98) than Spanish speakers (M = 4.26). The results of a t-test (t(150) = -2.91,
p = .004) revealed that English speakers had a lower mean score on the job satisfaction
scale of the OLA (M = 4.14) than Spanish speakers (M = 4.50). Followers’ scores on the
servant leadership scale of the OLA were also a significant predictor of scores on the job
satisfaction scale of the OLA. Scores on the servant leadership scale of the OLA
accounted for 52.6% of the variance explained, with a standardized β = .734 and partial
correlation of rp = .742, indicating the higher the followers’ perception of servant
leadership, the higher the followers’ job satisfaction (p = .000).

xxviii
References
Anderson, K. (2005). A correlational analysis of servant leadership and job satisfaction
in a religious educational organization (Doctoral dissertation, University of
Phoenix).
Aydin, A., Uysal, S., & Sarier, Y. (2012).The effect of gender on job satisfaction of
teachers: A meta-analysis study. Social and Behavioral Sciences, 46(2012), 356-
362.
Barbuto, J. & Wheeler, D. (2006). Scale development and construct clarification of
servant leadership. Group & Organization Management, 31(3), 300-326.
Barbuto, J., Fritz, S., Matkin, G., & Marx, D. (2007). Effects of gender, education, and
age upon leaders’ use of influence tactics and full range leadership behaviors. Sex
Roles, 56, 71-83.
Cerit, Y. (2009). The effects of servant leadership behaviours of school principals on
teachers’ job satisfaction. Educational Management Administration &
Leadership, 37(5), 600-623.
Costanza, D., Badger, J., Fraser, R., Severt, J., & Gade, P. (2012). Generational
differences in work-related attitudes: A meta-analysis. Journal of Business
Psychology, 27(4), 375-394.
Cuadrado, I., Morales, F., & Recio, P. (2008). Women’s access to managerial positions:
An experimental study of leadership styles and gender. The Spanish Journal of
Psychology, 11(1), 55-65.

xxix
Dannhauser, Z. & Boshoff, A. (2006). The relationships between trust, team
commitment and demographic variables. Servant Leadership Research
Roundtable, August, 2006, 1-14.
Dennis, R. & Bocarnea, M. (2005). Development of the servant leadership assessment
instrument. Leadership & organization development journal, 26(8), 600-615.
Dobrow Riza, S., Ganzach, Y., & Liu, Y. (2014, January). Job satisfaction over time: A
longitudinal study of the differential roles of age and tenure. Academy of
Management Proceedings (pending), 1-22.
Drury, S. (2004). Servant leadership and organizational commitment: Empirical findings
and workplace implications. Servant Leadership Research Roundtable, August,
2004, 1-14.
Eagly, A., Johannesen-Schmidt, M., & van Engen, M. (2003). Transformational,
transactional and laissez-faire leadership styles: A meta-analysis comparing
women and men. Psychological Bulletin, 129(4), 569-591.
Elsesser, K. & Lever, J. (2011). Does gender bias against female leaders persist?
Quantitative and qualitative data from a large-scale survey. Human Relations,
64(12), 1555-1578.
Gibson, J., Greenwood, R., & Murphy, E. (2009). Generational differences in the
workplace: Personal values, behaviors, and popular beliefs. Journal of Diversity
Management, 4 (3), 1-8.
Gilbert, G., Collins, R., & Brenner, R. (1990). Age and leadership effectiveness: From
the perceptions of the follower. Human Resource Management, 29(2), 187-196.

xxx
Gittell, J., Weinberg, D., Pfefferle, S., & Bishop, C. (2008). Impact of relational
coordination on job satisfaction and quality outcomes: A study of nursing homes.
Human Resource Management Journal, 18(2), 154-170.
Green, M., Rodríguez, R., Wheeler, C., & Baggerly-Hinojosa, B. (2015). Servant
leadership: A quantitative review of instruments and related findings. Servant
Leadership: Theory and Practice, 2(2), 76-96.
Greenleaf, R. (2003). The Servant-leader within: A transformative path. Mahwah, NJ:
Paulist Press.
Hansen, J. & Leuty, M. (2012). Work values across generations. Journal of Career
Assessment, 20(1), 34-52.
Horsman, J. (2001). Perspectives of servant-leadership and spirit in organizations.
(Unpublished doctoral dissertation). Gonzaga University, Spokane, Washington.
House, R., Hanges, P., Javidan, M., Dorfman, P., & Gupta, V. (Eds.). (2004). Culture,
leadership, and organizations: The GLOBE study of 62 societies. Thousand Oaks,
CA: Sage publications.
Irving, J. (2004). Servant leadership and the effectiveness of teams: Findings and
implications. Servant Leadership Research Roundtable, August, 2004, 1-12.
Irving, J. & McIntosh, T. (2007). Evaluating the reliability of the evaluación
organizacional de liderazgo among Spanish speaking Latin Americans.
Proceedings of ASBBS, 14(1), 786-805.
Jordan, M. (2015). Determining the relationship between servant leadership and job
satisfaction among U.S. Navy personnel. (Unpublished doctoral dissertation).
Northcentral University, Prescott Valley, Arizona.

xxxi
Kabacoff, R. & Stoffey, R. (2001). Age differences in organizational leadership.
Management Research Group, 1-33.
Kearney, E. & Gebert, D. (2009). Managing diversity and enhancing team outcomes: The
promise of transformational leadership. Journal of Applied Psychology, 94(1), 77-
89.
Kooij, D., Jansen, P., Dikkers, J., & Lange, A. (2010). The influence of age on the
associations between HR practices and both affective commitment and job
satisfaction: A meta-analysis. Journal of Organizational Behavior, 31, 1111-
1136.
Laub, J. (1999). Assessing the servant organization: Development of the organizational
leadership assessment (SOLA) instrument. (Unpublished doctoral dissertation).
Florida Atlantic University, Boca Raton, FL.
Ledbetter, D. (2003). Law enforcement leaders and servant leadership: A reliability study
of the organizational leadership assessment (Unpublished doctoral dissertation).
Regent University, Virginia Beach, Virginia.
Lester, S., Standifer, R., Schultz, N., & Windsor, J. (2012). Actual versus perceived
generational differences at work: An empirical examination. Journal of
Leadership and Organizational Studies, 19(3), 341-354.
Lok, P. & Crawford, J. (2003). The effect of organisational culture and leadership style
on job satisfaction and organisational commitment: A cross-national comparison.
Journal of Management Development, 23(4), 321-388.

xxxii
McIntosh, T. & Irving, J. (2010). Evaluating the instrumento de contribución al liderazgo
de siervo (ICLS) for reliability in Latin America. The Journal of Global
Leadership, 1(1), 30-49.
Ng, T. & Feldman, D. (2010). The relationship of age with job attitudes: A meta-analysis.
Personnel Psychology, 63, 677-718.
Ng, T., Eby, L., Sorensen, K., & Feldman, D. (2005). Predictors of objective and
subjective career success: A meta-analysis. Personnel Psychology, 58, 367-408.
O-Campo, E., Joyner, N., & Green, M. (2012). The impact of the language spoken at
home when growing up and Hispanic preferences in leadership. Sam Houston
State University, Fourth Annual General Business Conference, Proceedings,
Volume III, 106-119.
OLAgroup (2016). http://www.olagroup.com/
Parry, E. & Urwin, P. (2011). Generational differences in work values: A review of
theory and evidence. International Journal of Management Reviews, 13(1), 79-96.
Paustian-Underdahl, S., Walker, L., & Woehr, D. (2014). Gender and perceptions of
leadership effectiveness: A meta-analysis of contextual moderators. Journal of
Applied Psychology, 99(6), 1129-1145.
Rio Grande Bible Ministries (2016). http://www.riogrande.edu/en
Rodriguez, R., Green, M., & Ree, M. (2003). Leading Generation X: Do the old rules
apply? Journal of Leadership & Organizational Studies, 9(4), 67-75.
Rodríguez-Rubio, A. & Kiser, A. (2013). An examination of servant leadership in the
United States and Mexico: Do age and gender make a difference? The Global
Studies Journal, 5(2), 127-149.

xxxiii
Salameh, K. (2011). Servant leadership practices among school principals in educational
directorates in Jordan. International Journal of Business and Social Science,
2(22).
Salyadain, M. (1977). Organization levels and job satisfaction. Vikalpa, 2(1), 29-39.
Sessa, V., Kabacoff, R., Deal, J., & Brown, H. (2007). Generational differences in leader
values and leadership behaviors. The Psychologist-Manager Journal, 10(1), 47-
74.
Shirom, A., Gilboa, S., Fried, Y., & Cooper, C. (2008). Gender, age and tenure as
moderators of work-related stressors’ relationships with job performance: A meta-
analysis. Human Relations, 61(10), 1371-1398.
Sin, H-K., Nahrgang, J., & Morgeson, F. (2009). Understanding why they don’t see eye
to eye: An examination of leader-member exchange (LMX) agreement. Journal of
Applied Psychology, 94(4), 1048-1057.
Spears, L. (2005). The understanding and practice of servant leadership. Servant
Leadership Research Roundtable, August, 2005.
Stogdill, R. (1974). Handbook of leadership: A survey of theory and research. New
York: Free Press.
Thompson, R. (2002). The perception of servant leadership characteristics and job
satisfaction in a church-related college. (Unpublished doctoral dissertation)
Indiana State University, Terre Haute, Indiana.
Van Dierendonck, D. (2010). Servant leadership: A review and synthesis. Journal of
Management. Advance online publication, 1-34. doi: 10.1177/0149206310380462

xxxiv
Van Dierendonck, D. & Nuitjen, I. (2011). The servant leadership survey: Development
and validation of a multidimensional measure. Journal of Business Psychology,
26, 249-267. doi 10.1007/s10869-010-9194-1
World Radio Network, Inc. (2016a). Workers’ Manual, Articles of Incorporation, By-
Laws.
Yousef, D. (2000). Organizational commitment: A mediator of the relationships of
leadership behavior with job satisfaction and performance in a non-western
country. Journal of Managerial Psychology, 15(1), 6-28.
Zimmerer, T. (2013). Generational perceptions of servant leadership: A mixed methods
study. (Unpublished doctoral dissertation). Capella University, Minneapolis, MN.

1
CHAPTER ONE: INTRODUCTION
Introduction
This study has investigated generational differences on measures of followers’
perception of servant leadership and followers’ job satisfaction among two religious non-
profit organizations along the US/Mexico border. The concepts of generational
differences and servant leadership have received attention for some time now in the
popular and practitioner literature (Gibson, Greenwood, & Murphy, 2009; Parry &
Urwin, 2011; Spears, 2005). In recent years, the empirical support for both concepts has
increased (Twenge, 2010; Green, Rodríguez, Wheeler, & Baggerly-Hinojosa, 2015).
There has been little research to date that has combined the two concepts (Zimmerer,
2013).
The first of two organizations included in this study, World Radio Network, Inc.,
is a Protestant evangelical, interdenominational 501 (c) (3) religious non-profit
organization comprised of 14 FM radio stations - nine in Spanish and five in English
(http://www.inspiracom.org). In addition, the World Radio Network, Inc. operates several
unmanned repeater stations and a Bible correspondence school in Spanish. The World
Radio Network, Inc. was incorporated in 1982 under the auspices of World Radio
Missionary Fellowship, Inc., and became a separate legal entity from that organization in
2005 (World Radio Network, 2016a).
According to its governing documents, the World Radio Network, Inc. is
governed by a board of non-compensated members (World Radio Network, 2016b).
The organization is staffed with approximately 200 individuals in three categories:
missionaries, who are supported by churches and individuals to serve with the World

2
Radio Network, Inc.; volunteers, who give from two to twenty or more hours a week of
their time to the operations of the organization; and employees, many of whom served as
volunteers before being employed (Dr. A. Limón, personal communication, December 1,
2015). Many of the staff members have served with the World Radio Network, Inc. for
more than twenty years. They serve in 11 locations on the US side of the Mexico border
from the Gulf of Mexico to the Arizona/California border. The board members of the
World Radio Network, Inc. live in various parts of the United States. The missionary,
employee, and volunteer staff members are from the United States, Canada, and Latin
America (primarily Mexico) (Dr. A. Limón, personal communication, December 1,
2015).
The other organization included in this study, Rio Grande Bible Ministries, was
established in 1946 and is located on a 68-acre campus in Edinburg, Texas, in the Lower
Rio Grande Valley (http://www.riogrande,edu/en). It offers a four-year program in
Spanish in Biblical Studies and a two-semester Spanish language course for non-Spanish
speakers preparing for ministry to Spanish speakers (http://www.riogrande,edu/en). It
also operates three radio stations, a bookstore, and a coffee shop. Like World Radio
Network, Inc., Rio Grande Bible Ministries is a Protestant evangelical,
interdenominational 501 (c) (3) religious non-profit organization
(http://www.riogrande,edu/en). The membership of Rio Grande Bible Ministries
represents a population of approximately 700 missionaries, employees, volunteers, and
students from the United States, Canada, and all over Latin America, as well as board
members who live in various parts of the United States and Canada (Dr. L. Windle,
personal communication, December 1, 2015). In addition to local volunteers, many of the

3
volunteers are retired people from the northern United States and Canada who spend the
winter months serving with Rio Grande Bible Ministries. They are housed on campus or
at a nearby campground owned by the institute (Rio Grande Bible Ministries, 2016).
Background
This study has focused on generational differences and job satisfaction as applied
to the servant leadership model of which Robert Greenleaf is regarded as the founder. In
the essay “The servant as leader” (Greenleaf, 2003, pp. 29-74), written in 1970 which
forms part 1 of The Servant-Leader Within, he articulated his model of the servant leader.
Among the elements to be found in the servant leader are that he or she inspires trust,
listens with attention, and searches for understanding. He or she raises questions so that
others may question their assumptions and be persuaded to make needed changes. The
servant leader promotes healing and sees that everyone is heard (Greenleaf, 2003).
Generational Cohorts
Parry and Urwin (2011) discuss the profusion of popular and practitioner
literature in reference to the matter of generations in the current workforce that assigns
workers to four generations. They note the four generations are assigned different names
and range of birth years in the literature, but make these general observations concerning
three of the four generations:
Baby Boomers (born 1943-1960) lived to work and respected hierarchy
and authority in the workplace, but were resistant to learning new things
and to using technology. Generation X (born 1961-1981) responded to
instant gratification, worked to live and expected to be rewarded
quickly….Generation Y (or Millennials, born 1982 or after) believed in

4
collective action and teamwork, were optimistic, trusted centralized
authority, took technology for granted (Parry & Urwin, 2011, p. 87).
Parry and Urwin (2011) do not provide this kind of commentary for Veterans (also
known as Traditionalists, Matures, or the Silent Generation, born 1925-1942). They state
that “the grouping of individuals within these four generations is motivated by the belief
that they each share a different set of values and attitudes, as a result of shared events and
experiences” (p. 80). They then go on to discuss how “the practitioner literature suggests
that differences in work values influence the requirements for all aspects of people
management: recruitment, training and development, career development, rewards and
working arrangements, and management style” (p. 80).
Sessa, Kabacoff, Deal, and Brown (2007) state “a generation is a group of people
of the same age in a similar social location experiencing similar social
events…predisposing them for a certain characteristic mode of thought” (p. 49). They go
on to say “these [generational] effects are stable over time, and these life experiences
tend to distinguish one cohort from another” (p. 49). Still later they say “empirical
research is beginning to suggest that generational cohorts do exist in the United States
and can be differentiated from each other….However, at this point, labels and exact years
those labels represent are often inconsistent” (p. 49). For their study, they identify the
following four generational cohorts by birth year: Mature Generation (1925-1945), Baby
Boomers (1946-1963); Generation X (1964-1982) and Millennials (1983-onward) (Sessa,
et al., 2011).

5
Servant Leadership
In the “Introduction: Understanding the growing impact of servant-leadership”
(Greenleaf, 2003, pp. 13-27) to The Servant-Leader Within, Larry Spears quotes Robert
Greenleaf. “The servant-leader is servant first. It begins with the natural feeling that one
wants to serve. Then conscious choice brings one to aspire to lead. The best test is: do
those served grow as persons; do they, while being served, become healthier, wiser, freer,
more autonomous, more likely themselves to become servants?” (p. 13). Van
Dierendonck (2010), and McClellan (2007) both cite portions of this same quotation. It
serves as a conceptual definition of sorts of the thoughts, words, and actions of the kind
of person who would have the potential to become a servant leader. It also points to a
potential measure of outcomes in those being served. Spears (2005) himself has
scrutinized the writings of Greenleaf and has developed a list of characteristics of the
servant leader. They are listening, empathy, healing, awareness, persuasion,
conceptualization, foresight, stewardship, commitment to the growth of people, and
building community.
Since 1970 when Greenleaf (2003) wrote “The servant as leader” (Greenleaf,
2003, pp. 29-74), which forms Part 1 of The Servant-Leader Within, interest in research
and application of the theory of servant leadership has expanded. Van Dierendonck
(2010) references over 120 books and articles in his review article. He also includes an
appendix referencing “Peer-Reviewed Studies on Servant Leadership and Follower
Outcomes” (Van Dierendonck, 2010, pp. 28-29) conducted between 2003 and 2009.
Williams and Jones (2009) have compared the differences between transformational and
servant leadership. They conclude that the main difference is in the focus of the leader.

6
The transformational leader focuses on a transformation in the values of the follower to
support the goals of the organization. The servant leader focuses on serving the followers.
Brown and Bryant (2015) in their review article examine servant leadership at the
individual, dyadic, and group or organizational level. They compare the “egoistic nature
of transformational leadership…with the altruistic nature of servant leadership” (p. 14).
At one point they state, “At the foundational level, the most serious issue with the theory
of servant leadership is construct clarity” (p. 11).
Parris and Peachey (2013) conducted a review of the literature of servant
leadership theory employing a systematic literature review (SLR) methodology. Criteria
for inclusion in the study included that the article be peer-reviewed, that it be in English,
and that the keywords, “servant leadership” be found in the article. The articles were
published between the years 2004 and 2011. The authors found strong evidence in
support of the following aspects of servant leadership theory: cross-cultural adaptability,
promotes increased leader and organizational trust, fosters organizational citizenship
behavior, is associated with procedural justice, increases team effectiveness, increases
employee job satisfaction, promotes a positive work environment, enhances employee
creativity and helping behaviors, improves follower well-being, lowers employee
turnover, and increases job commitment. The aspect of enhancing collaboration was only
moderately supported. There was insufficient evidence to support the application of
servant leadership theory being associated with workplace spirituality, differences among
demographic variables, understanding of servant leadership theory affecting its adoption,
or a positive relationship with succession planning.

7
Servant Leadership Models and Instruments
Green et al. (2015) reviewed six instruments which have demonstrated empirical
support in the peer-reviewed literature and which measure constructs related to servant
leadership. In the same article they summarize the models of servant leadership
associated with those six instruments. The Laub (1999) model includes valuing people,
building community, providing leadership, developing people, displaying authenticity,
and sharing leadership. The Ehrhart (2004) model includes forming relationships with
subordinates, empowering subordinates, helping subordinates grow and succeed,
behaving ethically, putting subordinates first, having conceptual skills, and creating value
for those outside the organization. The Barbuto and Wheeler (2006) model includes
altruistic calling, wisdom, emotional healing, organizational stewardship, and persuasive
mapping. The Liden, Wayne, Zhao, and Henderson (2008) model includes emotional
healing, creating value for the community, helping subordinates grow and succeed,
conceptual skills, putting subordinates first, behaving ethically, and empowering. The
Sendjaya, Sarros, and Santora (2008) model includes voluntary subordination, authentic
self, covenantal relationship, responsible morality, transcendental spirituality, and
transforming influence. The Van Dierendonck and Nuijten (2011) model includes
empowerment, standing back, authenticity, interpersonal acceptance, accountability,
humility, courage, and stewardship.
Green (2013) describes the servant leadership instruments that have been
developed in relation to the models discussed in the preceding paragraph. According to
Green, the Laub (1999) Organizational Leadership Assessment (OLA) produced
Cronbach’s alpha scores for its various sub-scales in the .90 to .93 range. The Ehrhart

8
(2004) Servant Leadership Scale was developed and administered along with the LMX-7
(Graen & Uhl-Bien, 1995) and the MLQ 5X (Bass & Avolio, 1995) and “lent some
support that the Servant Leadership Scale seemed to measure something different from
Transformational Leadership or Leader Member Relations” (p. 344). In the search for
measures of reliability and validity for the Barbuto and Wheeler (2006) Servant
Leadership Questionnaire, the subscales “were correlated with the overall LMX-7 score
in the range of .55 to .73” and with the overall Transformational score from the MLQ 5X
“in the range of .25 to .34” (p. 347). The dimensions of the Liden et al. (2008) Servant
Leadership Scale were “correlated strongly with Transformational Leadership (.43 to.79)
and the Leader-Member Exchange global scores from the LMX-MDM (.48 to .75) (Liden
& Maslyn, 1998)” and “weakly to moderately correlated with the Affective Commitment
scale of the Organizational Commitment Questionnaire (.18 to .45) (Mowday, Steers, &
Porter, 1979)” (p. 349). Sendjaya et al. (2008) developed the Servant Leadership
Behavior Scale for which the “Cronbach’s alpha for each scale ranged from .72 to .93”
(p. 351). The Van Dierendonck and Nuitjen (2011) Servant Leadership Survey was
developed in several stages that resulted in Cronbach’s alpha scores in the range of .69 to
.91 for the eight dimensions of the survey. “Seven of the eight scales from the Servant
Leadership Survey were correlated in the range of .47 to .85 with the seven scales of the
Servant Leadership Scale [of Liden et al. (2008)]” (p. 353).
The Organizational Leadership Assessment (OLA) (Laub, 1999) was developed
as part of Laub’s doctoral dissertation. He elaborated a question bank based on his review
of the servant leadership literature and enlisted the aid of several servant leadership
experts who participated in a three-step Delphi process. This resulted in an 80-item

9
instrument which was field-tested on 828 participants. The instrument was later reduced
to 60 items (Green et al., 2015). The Organizational Leadership Assessment (OLA)
evaluates followers’ perception of servant leadership at the organizational level as
defined by the following constructs: “Displays Authenticity, Values People, Develops
People, Builds Community, Provides Leadership [and] Shares Leadership” (Laub, 1999,
p. 83).
Job Satisfaction
The literature on job satisfaction as a theoretical construct indicates that
individual self-report has often been employed to ascertain job satisfaction (Wanous,
Reichers, & Hudy, 1997; Yousef, 2000; Gittell, Weinberg, Pfefferle, & Bishop, 2008;
Dobrow Riza, Ganzach, & Liu, 2014). Salyadain, (1977) discusses self-esteem,
autonomy, and self-actualization as key elements of job satisfaction. Yousef (2000) and
other researchers (Lok & Crawford, 2003; Kooij, Jansen, Dikkers, & Lange, 2010;
Costanza, Badger, Fraser, Severt, & Gade, 2012; Zimmerer, 2013) have noted the
relationship between job satisfaction and the three-component model of affective,
normative and continuance organizational commitment but emphasize that job
satisfaction and organizational commitment are different theoretical constructs. Clark
(2015) recognizes income, flexible work schedule, opportunities for advancement, job
security, interesting work, autonomy, being able to help others, and a sense of usefulness
as dimensions of job satisfaction but emphasizes that the relative importance of these
dimensions will vary from person to person or even within the same person over time.
Aydin, Uysal, and Sarier (2012) discuss various dimensions of job satisfaction including
opportunity to use one’s gifts, abilities, and talents; flexibility; autonomy; role clarity;

10
financial rewards; and relationship with peers and superiors. Gittell et al. (2008) include
having the necessary resources to perform one’s work, and having high quality
relationships with co-workers, as important elements of job satisfaction. Dobrow Riza et
al. (2014) among many other researchers employ a single-item job satisfaction measure
that utilizes a 5-point Likert scale from “1 (dislike very much) to...5 (like very much)” (p.
8) to assess job satisfaction. Wanous et al. (1997) conducted a meta-analysis of
correlations of single-item measures of overall job satisfaction with scale measures and
found “a minimum estimated reliability for the single-item measure close to .70” (p. 250).
Laub (1999) includes six items in the job satisfaction scale of the Organizational
Leadership Assessment (OLA) that assess feelings of productivity, contribution,
importance, enjoyment, creativity, and use of gifts and abilities.
Servant Leadership and Job Satisfaction
There is strong empirical support for a relationship between leadership practices
and job satisfaction in followers. A meta-analysis by Ng, Eby, Sorensen, and Feldman
(2005) revealed that leadership practices such as career sponsorship, supervisor support,
training and skill development opportunities, and organizational resources are significant
predictors of subjective career success defined as career satisfaction. A meta-analysis by
Kooij et al. (2010) indicated a strong positive correlation between job satisfaction and
leadership practices such as internal promotion, training, job enrichment, rewards,
participation, information sharing, and teamwork.
Servant leadership has been demonstrated to have a significant positive
correlation with job satisfaction. The Van Dierendonck and Nuijten (2011) Servant
Leadership Survey (SLS) measures the dimensions of empowerment, standing back,
11
authenticity, interpersonal acceptance, accountability, humility, courage, and
stewardship. In their original field test they found positive correlations ranging from
r = .20 to r = .62 for seven of the eight dimensions, and satisfaction in followers with
leadership, management, work environment, and co-workers.
Laub (1999) developed both a servant leadership scale and a job satisfaction scale
for the Organizational Leadership Assessment (OLA). He found a strong positive
correlation between the servant leadership scale and the job satisfaction scale in his
original field research. In his model, servant leaders are defined as those who display
authenticity, value people, develop people, build community, provide leadership, and
share leadership. Job satisfaction in followers is defined as working at a high level of
productivity, feeling good about one’s contribution to the organization, feeling that one’s
job is important to organizational success, enjoying working for the organization, being
able to be creative in one’s job, and being able to use one’s gifts and abilities in the job.
Researchers found high positive correlation between the servant leadership scale of the
OLA and other job satisfaction measures (Thompson, 2002; Cerit, 2009; Jordan, 2015).
Statement of the Problem
There has been little research to date on generational attitudes towards work
environment, leadership, and job satisfaction as measured by valid and reliable servant
leadership and job satisfaction instruments (Zimmerer, 2013). Organizations must adapt
to change as the younger generations inevitably assume positions of leadership now held
by the older generations (Parry & Urwin, 2011). The organizations in this study are
religious non-profits located on the US/Mexico border (World Radio Network, 2016a;
Rio Grande Bible Ministries, 2016). They continue to grow in number of donors and

12
income after decades of existence. This growth has occurred in the face of dramatic
changes along the US/Mexico border over the past several decades. These organizations
must continue to be able to adapt to change as the younger generations assume positions
of leadership now held by the older generations. The board and staff members of both
World Radio Network, Inc. and Rio Grande Bible Ministries fall into the four categories
of generations that serve as the independent variable for this study. Older board and staff
members will inevitably leave the organization and be replaced by members of younger
generations. Members of younger generations will inevitably assume positions of
leadership previously held by older generations. If the different generations react and
respond differently to circumstances in the workplace, it is conceivable they would
display varied levels of response to assessments of servant leadership and job satisfaction
that measure their attitudes towards work environment and leadership.
Purpose of the Study The purpose of this research has been to study differences among members of
four generations in their composite scores on measures of servant leadership and job
satisfaction while controlling for language, tenure, gender, education, and organizational
level. A convenience sample has been drawn from the board and staff of the World Radio
Network, Inc., and Rio Grande Bible Ministries which represent populations of
approximately 200 and 700 individuals respectively. The Organizational Leadership
Assessment (OLA) (Laub, 1999) was made available to the participants in reliable,
validated versions in both English and Spanish which represented the first languages of
the membership of both organizations (Irving & McIntosh, 2007). Approval was obtained
from the World Radio Network, Inc. president, the Rio Grande Bible Ministries

13
president, the OLAgroup, the principal investigator’s dissertation committee, and the
Institutional Review Board of Our Lady of the Lake University, after which informed
consent was obtained from the participants. All members of the study sample have taken
the Laub (1999) Organizational Leadership Assessment (OLA) online in their language
of preference, English or Spanish. The respondents’ generation as a categorical
independent variable has been compared with composite scores on the servant leadership
and job satisfaction scales of the Laub (1999) Organizational Leadership Assessment
(OLA), as dependent variables while controlling for language, tenure, gender, education,
and organizational level. A multiple regression analysis has been conducted on scores of
the servant leadership scale of the OLA as a predictor of scores on the job satisfaction
scale of the OLA while controlling for language, tenure, gender, education, and
organizational level. This study has been important for several reasons. Among the
desired outcomes of the study has been to add to the body of knowledge of generational
attitudes towards work environment and leadership as measured by a validated and
reliable instrument available in both English and Spanish, that contains both a servant
leadership scale and a job satisfaction scale, while controlling for language, tenure,
gender, education, and organizational level (Laub, 1999; Irving & McIntosh, 2007).
Conceptual Definitions Generation – “the grouping of individuals within [one of] four
generations…motivated by the belief that they each share a different set of values and
attitudes, as a result of shared events and experiences” (Parry & Urwin, 2011, p. 80). For
the purposes of this study the Sessa et al. (2007) designations and their representative
characteristics have been followed which are:

14
Mature Generation (born 1925-1945)
• Practical
• Patient
• Loyal
• Hardworking
• Respectful of Authority
• Rule-followers
Baby Boomers (born 1946-1963)
• Consensus building
• Optimistic
• Ambitious
• Teamwork
• Cooperation
• Workaholic
Generation X (born 1964-1982)
• Individualistic
• Technically competent
• Comfortable with diversity
• Multitasking
• Balance life and work
Millennials (born 1983-onward)
• Technically “wired”
• Value diversity and change

15
• Distrustful of institutions
• Value meaningful work
• Value lifelong learning
Servant Leadership – A theoretical construct first described by Greenleaf (2003)
in 1970, and for the purposes of this study measured by the servant leadership scale of the
Organizational Leadership Assessment (OLA) (Laub, 1999) which includes the following
dimensions and characteristics:
Displays Authenticity through
• trust
• integrity
• accountability
• openness
• willingness to learn from others
Values People through
• receptive listening
• trusting others
• serving the needs of others first
Develops People through
• providing opportunities to learn
• encouraging and building up others
• modeling appropriate behaviors
Builds Community through
• collaborative effort

16
• valuing differences within the community
• developing strong relationships
Provides Leadership through
• clarifying goals
• taking the initiative
• giving a vision of the future
Shares Leadership through
• empowering others to make decisions
• according worth and privileges to all
• developing a shared vision
Job Satisfaction - For the purposes of this study job satisfaction was defined by
the dimensions of the job satisfaction scale of the Organizational Leadership Assessment
(OLA) (Laub, 1999) which are the following:
• Works at high level of productivity
• Feels good about contribution to organization
• Job important to organizational success
• Enjoys working for organization
• Able to be creative in job
• Able to use gifts and abilities in job
Language – The language - English or Spanish - in which a participant in the
study elected to take the online version of the Organizational Leadership Assessment
(OLA) (Laub, 1999)

17
Tenure - years of service with the organization regardless of multiple categories
(volunteer, employee, board member, etc.) or interruptions of service
Gender – male or female
Education – The highest level of education completed of the following four
categories: less than high school, high school diploma or equivalent, bachelor’s degree,
graduate or professional degree
Organizational level – These included the following levels: top leadership,
managers/supervisor, workforce
Research Questions The research questions considered in this study were as follows:
1. Are there differences in scores on the servant leadership scale of the
Organizational Leadership Assessment (OLA) (Laub, 1999) by generational
cohort when controlling for language, tenure, gender, education, and
organizational level?
2. Are there differences in scores on the job satisfaction scale of the Organizational
Leadership Assessment (OLA) (Laub, 1999) by generational cohort when
controlling for language, tenure, gender, education, and organizational level?
3. Is there a relationship between scores on the servant leadership scale of the
Organizational Leadership Assessment (OLA) (Laub, 1999) and scores on the job
satisfaction scale of the Organizational Leadership Assessment (OLA) (Laub,
1999) when controlling for generational cohort, language, tenure, gender,
education, and organizational level?

18
Leadership Models
The following illustration demonstrates the dimensions of the Laub (1999)
Servant Leadership model.
Figure 1: Dimensions of the Laub (1999) Servant Leadership model
The Servant Leader
Values People
Provides Leadership Builds Community
Displays Authenticity
Develops People
Shares Leadership

19
The following illustration demonstrates the dimensions of the Laub (1999) Job
Satisfaction model.
Figure 2: Dimensions of the Laub (1999) Job Satisfaction model
The following model illustrates the relationship between servant leadership and
job satisfaction:
Figure 3: Relationship between servant leadership and follower job satisfaction
Servant Leadership
Follower
Job Satisfaction
Follower
Job Satisfaction
Enjoys working for the organization
High productivity level Feels good about contribution to organization
Job important to organizational
success
Able to use gifts and abilities in job
Able to be creative in job

20
CHAPTER TWO: LITERATURE REVIEW
Introduction
This study has explored generational differences in followers’ perception of
servant leadership and job satisfaction when controlling for language, tenure, gender,
education, and organizational level. A review of the literature did not reveal any meta-
analyses of servant leadership. There have been a limited number of meta-analyses of
generational cohorts. Where the literature has been limited, this review has been
expanded to include followers’ age in the case of generational cohort, and perception of
leadership in general in the case of servant leadership.
Follower’s Generational Cohort and Perception of Servant Leadership
In the only study to date investigating generational cohort perception of servant
leadership, Zimmerer (2013) investigated generational cohort differences in response to
the van Dierendonck and Nuitjen (2011) Servant Leadership Survey (SLS) as a
dependent variable. Job satisfaction, organizational commitment, and turnover intent
were also included as dependent variables. A stratified probability sample of 550 working
adults in the United States ages 18 to 65 were recruited through an online research
organization with a data base of over 1.2 million individuals. Of those recruited, 452
returned usable surveys. The study sample consisted of 150 Baby Boomers (born 1946-
1964), 151 GenXers (born 1965-1981), and 151 GenYers (born 1982-2002). The
following research questions were investigated:
Research Question 1 (RQ1): Is there a difference in the levels of job
satisfaction when exposed to servant leadership among Baby Boomer,
GenX and GenY employees?

21
Research Question 2 (RQ2): Is there a difference in the levels of
organizational commitment when exposed to servant leadership among
Baby Boomer, GenX and GenY employees?
Research Question 3 (RQ3): Is there a difference in the levels of turnover
intent when exposed to servant leadership among Baby Boomer, GenX
and GenY employees? (Zimmerer, 2013, pp. 92-93)
Followers’ perception of servant leadership was measured using the SLS.
Followers’ job satisfaction was measured using the Abridged Job in General Index (aJIG)
(Russell et al., 2004) and the Abridged Job Descriptive Scale (aJDI) (Stanton et al.,
2001). Followers’ organizational commitment was measured using the Affective
Commitment Scale (ACS) (Meyer, Allen, & Smith, 1993). Turnover intent was assessed
as a “composite of all three scales by generation” (pp. 126-127) in the qualitative portion
of Zimmerer’s (2013) study. A one-way multiple analysis of variance (MANOVA) was
conducted on generational cohort as the independent variable, “servant leadership,
affective commitment, job in general, and job descriptive index being the dependent
variables” (p. 132). The Wilks’ Lambda (λ) value was .95, with F(3,892) = 2.81, p = .004.
However, follow up ANOVAs did not reveal any statistical differences between
generational cohorts and any of the dependent variables. The significance level of the
ANOVA by generational cohort for the Servant Leadership Survey (SLS) was p = .19.
Summary of Follower’s Generational Cohort and Perception of Servant Leadership
There has been only one study to date that has investigated differences between
followers’ generational cohort and perception of servant leadership. That is the study by

22
Zimmerer (2013). She found no statistical difference between followers’ generational
cohort and perception of servant leadership.
Generational Cohort and Leadership
Rodriguez, Green, and Ree (2003) developed a survey “based on Bass and
Avolio’s [1994] definition of transformational leadership to formulate a leadership
preference associated with the five themes” (p. 69) of fulfillment, technology, flexibility,
monetary environment, and work environment. The survey was comprised of pairs of
statements, one of which was expected to be preferred by each of two generations: Baby
Boomers (born 1946-1964) and Generation X (born 1965-1979). The two generations
represented a categorical independent variable, and each of the choices on the leadership
preference survey represented ten dependent variables. The survey was distributed to
1000 employees of the telecommunications industry from four regions of the United
States of which 805 returned valid surveys. Multivariate analysis of variance
(MANOVA) was conducted. The Wilks’ Lambda (λ) “was significant at
F(1,803) = 11.694, p < .05” (p. 71). There was a significant difference between Baby
Boomers and Generation X on all but one of the ten dependent variables of the leadership
preference survey.
Sessa et al. (2007) tested the following four hypotheses:
1. There are generational differences in today’s U. S. managers in terms of
attributes perceived to be most important for leaders.
2. There are generational differences in today’s U. S. managers in terms of
leadership behaviors as perceived by the managers themselves.

23
3a. There are generational differences in today’s U. S. managers in terms
of leadership characteristics as perceived by their subordinates.
3b. There are generational differences in today’s U. S. managers in terms
of leadership characteristics as perceived by their bosses (Sessa et al., pp.
54-55).
To test Hypothesis 1 the authors selected a subset (N = 447) limited to those who
were born and working in the United States out of a data base of 4,810 from the Center
for Creative Leadership of individuals throughout the world. Members of the study
sample were identified as belonging to one of the following generational cohorts: Mature
Generation (born 1925-1945), Early Baby Boomers (born 1946-1954), Late Baby
Boomers (born 1955-1963), Early Gen-Xers (born 1964-1976), Late Gen-Xers (born
1977-1982) or Millennials (born 1983 or later). The study sample consisted of 34
Matures, 95 Early Baby Boomers, 114 Late Baby Boomers, 138 Early Gen-Xers, 15 Late
Gen-Xers and 51 Millennials. Women comprised 55.9% of the sample, and 84.9%
identified themselves as being White. The study sample participated in a 20-minute
online survey that measured year of birth and answers to the Leadership Descriptives Sort
(adapted from Campbell, 2002) to identify attributes they considered most important in a
leader. The top twelve rankings of attributes for each generational cohort were
determined. The Kruskal-Wallace nonparametric rank test (χ2) was employed to
determine significant differences among the six generational cohorts. Those attributes
that were found to be significantly different were subjected to a Mann-Whitley
nonparametric rank test (U test) to determine significant differences between cohort pairs.
Millennials differed from all the other generations in ranking the attribute of credible as
24
less important (χ2 = 37.41, p < .01) and the attribute of dedicated as more important
(χ2 = 35.17, p <. 01). Millennials also differed significantly from all other cohorts except
Late Gen-Xers in ranking focused (χ2 = 18.39, p < .01) and optimistic (χ2 = 13.99,
p < .05) as being more important. Millennials differed significantly from Early and Late
Boomers and Early Gen-Xers in rating farsighted (χ2 = 18.35, p < .01) as less important.
In the dimension of listens well, Late Boomers rated it as less important than did Early
Boomers, Late Gen-Xers and Millennials, and Early Gen-Xers rated it as less important
than Early Boomers and Millennials (χ2 = 13.92, p < .05). Thus Hypothesis 1 was
supported.
To test Hypotheses 2, 3a, and 3b above, Sessa et al. (2007) administered the
Leadership 360 instrument (Management Research Group, 1992) which measures 22
dimensions of leadership behavior, to 20,640 business professionals from 6000 North
American companies representing 23 industries in 48 states. The sample was 54% male
and distributed among the following generational cohorts: 2,440 Matures, 6,631 Early
Baby Boomers, 7,722 Late Baby Boomers, and 3,847 Gen-Xers combining both Early
and Late Gen-Xers. Millennials were not included in this study due to low numbers in the
data pool. Scores on the 22 dimensions were subjected to canonical discriminant analysis
as predictors against the four generational categories as outcomes. The authors concluded
that Hypotheses 2, 3a, and 3b were only partially supported, and that differences in
ratings of leadership dimensions were due more to maturational than generational cohort
effects.
Lester, Standifer, Schultz, and Windsor (2012) reviewed the literature of
generational preferences for leadership practices to develop a Likert-type survey of 15

25
items. They distributed the survey online to 466 employees of an organization located in
the Midwestern United States. They received 263 valid responses. Participants were
assigned to three generational cohorts: Baby Boomers (born 1945 to 1964, N = 102),
Generation X (born 1965-1981, N = 99), Generation Y or Millennials (born after 1982,
N = 62). They tested the following hypotheses:
Hypothesis 1: Actual differences exist regarding the extent to which
technology, face-to-face communication, e-mail communication, social
media, formal authority, and fun-at-work are valued.
Hypothesis 2: There are more perceived value differences between
generations than actual differences (Lester et al., 2013, pp. 344-345).
Participants were asked to rate the extent to which they would personally value each item
on the survey from “1 = No extent to 6 = Very great extent” (p. 345). They were then
“asked to rate the same items based on the extent to which they believed each of the three
generations valued the items” (p. 346). Multivariate analysis was conducted with
generational cohort, gender, ethnicity, and educational level as fixed factors and the 15
value items as dependent variables.
For the Lester et al. (2012) study, “because the variable measured by the
difference (…pairwise comparison of values from each generation) was insensitive to
which component score is larger, absolute difference scores were deemed appropriate”
(p. 347). For the personal value ratings, Generation Y had a significantly higher mean
difference score than Baby Boomers regarding preference for e-mail communication
(Mean Difference = .71, p < .01). Generation Y indicated a higher preference for social
media than Generation X (Mean Difference = 1.16, p < .001). Generation Y also

26
indicated a higher preference for social media than Baby Boomers
(Mean Difference = 1.50, p < .001). Generation Y indicated a higher preference for fun-
at-work than Generation X (Mean Difference = .69, p < .01). Generation Y also indicated
a higher preference for fun-at-work than Baby Boomers (Mean Difference = .66, p < .01).
Generation Y indicated a higher preference for continuous learning than Baby Boomers
(Mean Difference = .51, p < .05). Baby Boomers indicated a higher preference for
professionalism than Generation X (Mean Difference = .38, p < .05). Hypothesis 1 was
partially supported as generational cohort differences were found in three of the five
items from the 15-item survey which were hypothesized to differ between the
generations.
In the Lester et al. (2012) study, Hypothesis 2 involved each generational cohort
rating their own and the other two generations on their perception of that generation’s
rating for each of the 15 items of the survey. This resulted in 45 potential differences in
values of which 27 were significant. Hypothesis 2, which involved testing a higher
number of perceived rather than real differences, was thus supported.
Summary of Follower’s Generational Cohort and Perception of Leadership
Researchers found mixed results when reporting followers’ generational cohort
and perception of leadership. Sessa et al. (2007) found significant generational
differences in attributes perceived to be most important in leaders including credibility,
dedication, focus, optimism, farsightedness, and listening. However, they found that
some of the differences were only partially supported, and were more due to maturational
than to generational cohort effects. Lester et al. (2012) found some generational
differences in followers’ perception of leadership values but also found some of the

27
differences to be perceived rather than actual differences in leadership values. Rodríguez
et al. (2003) found significant differences between Baby Boomers and Generation Xers in
preferred leadership behaviors.
Age and Servant Leadership
Laub (1999) developed the Organizational Leadership Assessment (OLA) as part
of his doctoral research to assess organizational health. The OLA was established through
a Delphi Survey process involving experts in the field of servant leadership. In the course
of the 3-part Delphi process the experts arrived at a consensus on the characteristics of
the servant organization. The original 80-item instrument (which contained 74 servant
leadership items and six job satisfaction items) was field tested among 828 participants
from 41 organizations, one of which was in the Netherlands and the rest in the United
States, representing religious, secular non-profit and for profit organizations, and public
agencies. No significant differences between age categories and perception of servant
leadership were discovered. There was a small but significant positive correlation
between age and scores on the OLA (r = .076, p < .05).
Horsman (2001) administered the OLA (Laub, 1999) to 608 participants from 34
community service, for profit, educational, religious, government, and health care
organizations in the Pacific Northwest of the United States and the Canadian province of
Alberta. He conducted a one-way Analysis of Variance (ANOVA) on the following age
categories: 20-29 years, 30-39 years, 40-49, years, 50+ years. The ANOVA revealed a
significant difference among the different age categories, F(3, 534) = 4.021, p = .008.
Bonferroni post-hoc analysis revealed that the 30-39 years age group had a significantly

28
different OLA mean score from the 20-29 years and 50+ years age groups which had
similar mean scores.
Rodríguez-Rubio and Kiser (2013) investigated the following research questions:
Research Question 1: Are cultural values that point towards the
acceptance of servant leadership different for men and women in the US
and Mexico?
Research Question 2: Are servant leadership oriented values of older and
younger generations in the US and Mexico different? (Rodríguez-Rubio &
Kiser, 2013, p. 130)
Data were collected from wave 4 (1999-2004) of the World Values Survey (WVS)
(World Values Survey, 2012) (http://www.worldvaluessurvey.org ) on 2133 men and
women from the United States and Mexico. “A total of 32 variables were selected to
compare the differences between gender and among age groups” (p. 130). Twenty five of
the variables were categorical, and the other nine were continuous. “The variables were
selected as proxies of different values and attitudes of the servant leader” (p. 131). For
the continuous variables, analysis of variance (ANOVA) was conducted for the following
age categories by country: 15 to 29 years old; 30 to 49 years old; 50 years old and older.
Significant differences were found among the different age groups in Mexico for the
following variables: importance of work in life, importance of service to others, freedom
of choice, and control. Among the different age groups in the US the following variables
had significant differences: importance of friends, importance of work, importance of
service to others, satisfaction with life, and respect for individual rights. For the
categorical variables by age group for Mexico, (Chi square) χ2 analysis revealed
29
significant differences for the following variables: membership in religious organizations,
voluntary work with the elderly, voluntary work with religious organizations, voluntary
work with women’s groups, importance of job to meet one’s abilities, and following
instructions at work. For the categorical values by age group for the US, χ2 analysis
revealed significant differences for the following variables: membership in religious
organizations, voluntary work with the elderly, voluntary work with religious
organizations, voluntary work with youth groups, voluntary work with women’s groups,
most people can be trusted, good human relationships, opportunity to use initiative at
work, how business and industry should be managed, less emphasis on money and
material possessions, greater respect for authority, and more emphasis on family life.
Summary of Age and Servant Leadership
Researchers found mixed results when reporting followers’ age and perception of
servant leadership. The original field research for the Organizational Leadership
Assessment (OLA) (Laub, 1999) found no significant differences among age categories
on perception of servant leadership, but did find a small but significant positive
relationship between followers’ increasing age and perception of servant leadership.
Subsequent research with the OLA by Horsman (2001) found significant differences
among age categories unrelated to increasing age in perception of servant leadership.
Rodríguez-Rubio and Kiser (2013) also found significant differences among age
categories unrelated to increasing age in perception of servant leadership.
Age and Leadership
Shirom, Gilboa, Fried, and Cooper (2008) conducted a meta-analysis of the
moderating effect of gender, age, and tenure on role conflict and role ambiguity with job

30
performance. Mean age had a moderating effect between role ambiguity and job
performance. As age increased, the negative correlation between role ambiguity and job
performance decreased. Weighted Least Squares (WLS) regression analysis was used to
estimate the moderating effect of age with the following results for the direct effect of
age on the meta-correlation of role ambiguity with general performance: (N = 7,657,
k = 30, β = .47, p < .05). As tenure and age increased, there was a reduction in the
negative correlation between role ambiguity and job performance (N = 7,657, k = 30,
β = .48, ΔR2 = .14, F = 1.57, p < .05). As percentage of women and age increased, there
was a reduction in the negative correlation between role ambiguity and job performance
(N = 7,657, k = 30, β = -.44, ΔR2 = .12, F = 2.44, p < .05).
Ng and Feldman (2010) conducted a meta-analysis of the relationship between
age and 35 job attitudes including work tasks, colleagues, supervisors, and organizations.
They included over 800 studies in their meta-analysis. Organizational tenure, race,
gender, educational level, and year of study moderated the relationship between age and
job attitudes. The relationship of increasing age with employee perceptions of leadership
in terms of leader-member exchange dyad formation revealed the following: (N = 5,562,
k = 22, rc = .06).
Kooij et al. (2010) conducted a validity general meta-analysis of the effect of age
on the association between HR practices and affective commitment and job satisfaction.
Correlations were corrected for sampling error yielding mean true score correlations. The
researchers applied the 75 percent rule in performing moderator analyses when 25
percent or more of variance remained after accounting for statistical artifacts. They tested
the following hypotheses:

31
Hypothesis 1a: High commitment HR practices are positively related to
affective commitment.
Hypothesis 1b: High commitment HR practices are positively related to
job satisfaction.
Hypothesis 2: The associations between high commitment HR practices
that relate to the maintenance HR bundle and both affective commitment
and job satisfaction will strengthen in older age.
Hypothesis 3: The associations between high commitment HR practices
that relate to the development HR bundle and both affective commitment
and job satisfaction will weaken in older age. (Kooij et al., 2010, pp. 1113,
1116).
Weighted least squares regression analysis was performed to test the moderating
effect of age in Hypotheses 2 and 3. Mean sample age (controlling for tenure) was the
independent variable and the correlation coefficient between HR practices, affective
commitment, and job satisfaction. The researchers tested for the linear and curvilinear
effects of age. Their analysis of 83 studies revealed that employee perceptions of
maintenance leadership practices including job security, staffing, rewards, participation,
information sharing, flexible work schedules, and teamwork were positively correlated
with affective commitment (N = 31,515, k = 50, ρ = .42) and strengthened with age.
Gilbert, Collins, and Brenner (1990) studied the relationship between age of a
leader and his or her effectiveness from the point of view of the follower. A random
sample of employees (N = 1,634) was surveyed in the years 1987, 1988, and 1989 from
17 public and private organizations in the United States and Jamaica including police,

32
hotel, manufacturing, engineering, hospital, education, retail, and government
organizations. Of the respondents, 18% were 30 years or less, 34% were 31 to 40 years of
age, 32% were 41 to 50 years of age, and 15% were 51 years or older. A Likert-type
instrument developed by one of the authors was administered to measure the performance
of the leader on 12 dimensions in the areas of mission accomplishment, empowering
behaviors, and relationship behaviors from the perception of the follower. Analysis of
variance (ANOVA) was employed to determine differences between the age of the
leaders and respondents’ ratings of the leaders on the 12 dimensions. Eta-squared (η2)
statistics were applied as a post-hoc test of effect size to account for statistical differences
due to age rather than sample size. Older leaders were found to be more effective at
delegating than younger leaders (η2 = .13, F = 8.934, p = .000). Younger leaders had
more of a calming influence on followers than older leaders (η2 = .07, F = 2.634,
p = .048). Younger leaders received higher ratings than older leaders in the areas of
friendship (η2 = .08, F = 3.433, p = .016) and enjoyableness (η2 = .12, F = 7.992,
p = .000). The η2 values suggest that the influence of leader age on effectiveness is not
strong.
Kabacoff and Stoffey (2001) studied age differences in organizational leadership
behavior. Matched groups of younger (25-35) and older (45-55) North American mid-
level managers (n = 1,280) were evaluated by self, supervisor, peers, and direct reports on
22 leadership behaviors and 3 leadership effectiveness measures (business skills, people
skills, and overall leadership effectiveness) using the Leadership Effectiveness Analysis
instrument (Management Research Group, 2012). A second study using the same
procedures compared younger (25-35) and older North American division heads and vice

33
presidents. In the first study multiple analysis of variance (MANOVA) of supervisor
ratings were significant for all three leadership effectiveness variables
(Wilks’ Lambda (λ) = .91, F (3, 1276) = 40.01, p < .0001). One-way analysis of variance
(ANOVA) was conducted which indicated a significant main effect and with the
following effect sizes: supervisors rating younger managers higher than older managers
on business skills (d = -.34), people skills (d = -.30), and overall leadership effectiveness
(d = -.59). Multiple analysis of variance (MANOVA) of peer ratings was also significant
(Wilks’ Lambda (λ) = .93, F (3, 1219) = 32.57, p < .0001). Younger managers were rated
higher by their peers with effect sizes on business skills of (d = -.15) and overall
leadership effectiveness of (d = -.41). Finally MANOVAs for direct reports were also
significant (Wilks’ Lambda (λ) = .97, F (3, 1276) = 14.82, p < .0001), with significant
main effect of direct reports rating younger managers higher than older managers on
business skills (d = -.14), people skills (d = -.12), and overall leadership effectiveness
(d = -.32).
The second Kabacoff and Stoffey (2001) study mirrored the results of the first
study. Multiple analysis of variance (MANOVA) of supervisor ratings were significant
for all three leadership effectiveness variables (Wilks’ Lambda (λ) = .88,
F (3, 250) = 11.71, p < .0001). One-way analysis of variance (ANOVA) was conducted
which indicated a significant main effect and with the following effect sizes: supervisors
rating younger managers higher than older managers on business skills (d = -.26), people
skills (d = -.25), and overall leadership effectiveness (d = -.61). Multiple analysis of
variance (MANOVA) of peer ratings was also significant (Wilks’ Lambda (λ) = .92,
F (3, 241) = 6.85, p < .0002). Younger managers were rated higher by their peers with

34
effect size on overall leadership effectiveness of (d = -.47). Finally MANOVA for direct
reports was also significant (Wilks’ Lambda (λ) = .89, F (3, 250) = 9.92, p < .0001), with
significant main effect of direct reports rating younger managers higher than older
managers on business skills (d = -.26) and overall leadership effectiveness (d = -.51).
Lok and Crawford (2003) studied the effect of organizational culture and
leadership style on job satisfaction and organizational commitment on a sample of 337
managers from Hong Kong and Australia. Leadership style was measured by the Leader
Behavior Descriptive Questionnaire (LBDQ) (Stogdill, 1974), and job satisfaction was
measured by the Warr job satisfaction questionnaire (Warr, Cook, & Wall, 1979). No
significant relationship was found between the age of the participants and scores on the
LBDQ.
Barbuto, Fritz, Matkin, and Marx (2007) studied the effect of gender, education,
and age on influence tactics and full range leadership behaviors. They collected data from
the Multi-factor Leadership Questionnaire (MLQ-rater version) (Bass, 1985) and Yukl’s
Influence Behavior Questionnaire (IBQ) (Yukl & Falbe, 1990) for 56 leaders and 234
followers from a variety of industries in rural and urban settings in the United States.
Multivariate analysis of variance (MANOVA) was conducted on the independent
variables of gender, education, and age, and the dependent variables of the MLQ and the
IBQ. For the independent variable of age (Wilks’ Lambda (λ) = .83, F = 1.46,
p = .079 (sic). One-way analysis of variance (ANOVA) was conducted which indicated a
significant main effect for the 46+ age group of leaders being rated higher than the 22-35
and 36-45 age groups in transformational leadership, (F = 4.24, p = .016), idealized
influence, (F = 5.48, p = .017), and individualized consideration, (F = 4.84, p = .009).

35
Kearney and Gebert (2009) studied transformational leadership as a moderator of
the relationship of age, nationality, and educational background on team outcomes among
62 research and development teams within a multinational pharmaceutical company
headquartered in Germany. Surveys were sent by e-mail and valid surveys received from
339 members of the 62 teams. Educational and demographic information on the
participants was provided by the human resources department of the company. Team
leaders rated team performance longitudinally six months after collection of team
member data. Transformational leadership was measured by the MLQ-5X Short (Avolio
& Bass, 2004). The following hypotheses were tested:
Hypothesis 1: Transformational leadership moderates the relationship of
age, nationality, and educational diversity with team performance such
that this relationship is positive when levels of transformational leadership
are high but negative or nonsignificant when levels of transformational
leadership are low.
Hypothesis 2: The elaboration of task-relevant information fully mediates
the moderating effect of transformational leadership on the relationship of
age, nationality, and educational diversity with team performance.
Hypothesis 3: Collective team identification partially mediates the
moderating effect of transformational leadership on the relationship of
age, nationality, and educational diversity with the elaboration of task-
relevant information (Kearney & Gebert, 2009, pp. 80-81).
Hierarchical regression analysis was conducted on the data. The researchers set
significance levels at p < .10 for findings involving interactions because of the inherently
36
low power in field studies for detecting moderators. In support of Hypothesis 1, the
multiple squared correlation coefficient indicated a significant change after adding the
interaction terms of age, nationality, and education (ΔR2 = .17, p < .01). The interaction
of transformational leadership with age was significant (b = 2.23, p < .05). “When
transformation leadership was low, team performance was negatively related to age
(b = -2.00, t = -1.72, p < .10)”, p. 85), but when transformational leadership was high, the
relationship of age to team performance was not significant. In support of Hypothesis 2,
the interaction of transformational leadership with age, nationality, and education
indicated a significant change in the multiple squared correlation coefficient (ΔR2 = .19,
p < .01). “When transformational leadership was high, the elaboration of task-relevant
information was positively related to age (b = 1.67, t = 2.17, p < .05)” pp. 85-86). The
indirect or mediated effect of age with transformational leadership via task-relevant
information on team performance was significant (b = 0.66, SE = 0.42, p < .05). In
support of Hypothesis 3, the interaction of transformational leadership with age,
nationality, and education also indicated a significant change in the multiple squared
correlation coefficient (ΔR2 = .18, p < .01). “When transformational leadership was high,
collective team identification was positively related to diversity concerning age (b = 1.43,
t = 2.21, p < .05)”, p. 86).
O’Campo, Joyner, and Green (2012) studied language spoken at home and
leadership preference among employees in Texas of two Fortune 500 companies who
were recruited through social networking which provided a link to an on-line survey.
Valid surveys were returned from 106 participants. Analysis of covariance (ANCOVA)
was applied to the categorical independent variables of gender and language spoken at
37
home with the covariate of age. The dependent variables were the six GLOBE (House,
Hanges, Javidan, Dorfman, & Gupta, 2004) leadership preferences. The ANCOVA did
not reveal age to be a significant covariate.
Summary of Age and Leadership
Researchers found mixed results when reporting followers’ age and perception of
leadership. Shirom et al. (2008) found that as tenure and age increased, and as percentage
of women and age increased, there was a reduction in the negative correlation between
role ambiguity and job performance. Kabacoff and Stoffey (2001) found higher ratings
for younger managers in the areas of overall leadership effectiveness than for older
managers. O’Campo et al. (2012) in their study of language spoken at home and
leadership preferences did not find age to be a significant covariate. Ng and Feldman
(2010) found a positive relationship between followers’ increasing age and leader-
member exchange (LMX) dyad formation. Kooij et al. (2010) found employee
perceptions of leadership practices of training, rewards, participation, information
sharing, and teamwork to be positively correlated with affective commitment and age.
Gilbert et al. (1990) found the effect size between age of a leader, and his or her
effectiveness from the point of view of the follower to be small. Lok and Crawford
(2003) did not find a significant relationship between the age of participants and scores
on the LBDQ (Stogdill, 1974). Barbuto et al. (2007) found differences in followers’
perceptions of leadership between age categories unrelated to increasing age. Kearney
and Gebert (2009) found transformational leadership to be a significant moderator of the
relationship of age on some, but not all, team outcomes.

38
Follower’s Language and Perception of Servant Leadership
Dannhauser and Boshoff (2006) studied the relationship between followers’
perception of servant leadership, trust, team commitment, and demographic variables.
They administered the Barbuto and Wheeler (2006) Servant Leadership Questionnaire
(SLQ), the Workplace Trust Survey (WTS) (Ferres & Travaglione, 2003) and the Team
Commitment Survey (TCS) (personal communication between H. F. Bennett and A. B.
Boshoff, June, 1997) to 417 sales people from the automobile industry in South Africa.
Demographic information was obtained on the participants’ age, tenure, religious
affiliation, ethnicity, educational level, language, and gender. Participants were recruited
electronically. Analysis of the data was conducted as appropriate by Pearson Product-
Moment correlation, multiple regression, t-test, and analysis of variance (ANOVA).
Analysis of participants’ language differences as Afrikaans or English speakers did not
reveal a significant difference in means by t-test in perception of servant leadership as
measured by the SLQ.
Irving and McIntosh (2007) evaluated the reliability of the Spanish version of the
Organizational Leadership Assessment (OLA) (Laub, 1999). They administered the
Spanish version of the OLA to a convenience sample of 78 leaders in Lima, Peru of
which 60 provided usable data for the servant leadership scale of the OLA, and 78
provided usable data for the job satisfaction scale of the OLA. Their research revealed a
Cronbach’s alpha of .9862 (N = 60) for the Spanish version of the servant leadership
scale of the OLA. Laub’s (1999) original field research for the OLA revealed a
Cronbach’s alpha of .98 for the English version of the servant leadership scale.

39
McIntosh and Irving (2010) administered a Spanish translation of the Dennis and
Bocarnea (2005) Servant Leadership Assessment Instrument (SLAI) to a convenience
sample of 78 students and professors from an evangelical Christian seminary in Lima,
Peru. The original English version of the SLAI had the following reliability coefficients
for the four dimensions of the SLAI: Love (Cronbach’s alpha = .94); Empowerment
(Cronbach’s alpha = .83); Vision (Cronbach’s alpha = .89); Humility
(Cronbach’s alpha = .92). The Spanish translation of the SLAI had the following
reliability coefficients for the four dimensions of the SLAI:
Love (Cronbach’s alpha = .84); Empowerment (Cronbach’s alpha = .92);
Vision (Cronbach’s alpha = .90); Humility (Cronbach’s alpha = .50).
Summary of Follower’s Language and Perception of Servant Leadership
Previous research has not revealed significant differences in perception of servant
leadership based on followers’ language. Dannhauser and Boshoff (2006) did not find
significant differences between Afrikaans and English speakers in perception of servant
leadership as measured by the SLQ (Barbuto & Wheeler, 2006). Irving and McIntosh
(2007) found similar reliability coefficients between English and Spanish versions of the
OLA (Laub, 1999). McIntosh and Irving (2010) found similar reliability coefficients
between English and Spanish versions on three of the four dimensions of the SLAI
(Dennis & Bocarnea, 2005).
Language and Leadership
In the Lok and Crawford (2003) study the LBDQ (Stogdill, 1974) was
administered to 337 managers from a wide variety of industries in Australia (N = 129)
and Hong Kong (N = 208). A t-test was conducted as appropriate on mean factor scores

40
of the LBDQ for consideration and initiating structure for Australian and Hong Kong
managers. There was no significant mean difference on either LBDQ factor between
English-speaking Australian and Chinese-speaking Hong Kong managers.
In the O-Campo et al. (2012) study, three-way analysis of covariance (ANCOVA)
did not reveal a significant main effect for language differences between English and
Spanish speakers in GLOBE (House et al., 2004) leadership preferences. There was a
significant interaction between gender and language in two of the GLOBE leadership
preferences. However, the interactions were within the same language group - not
between language groups (interaction between gender and language for Participative
Leadership for English speakers, and interaction between gender and language for
Humane-Oriented Leadership for Spanish speakers.
Summary of Follower’s Language and Perception of Leadership
In other measures of leadership, followers’ language did not reveal differences in
perception of leadership. Lok and Crawford (2003) did not find significant mean
differences on either LBDQ (Stogdill, 1974) factor between English-speaking Australian
and Chinese-speaking Hong Kong managers. O-Campo et al. (2012) found a significant
interaction between gender and language in two of the GLOBE (House et. al) leadership
preferences. However, the interactions were within the same language group, not between
language groups.
Follower’s Tenure and Perception of Servant Leadership
In the Laub (1999) study for the original field test for the development of the
Organizational Leadership Assessment (OLA), tenure categories were investigated for
differences with scores on the servant leadership scale of the OLA. The categories were

41
as follows: less than one year of service, 1-3 years, 4-6 years, 7-10 years, 10-15 years,
more than 15 years. Analysis of variance (ANOVA) did not reveal significant differences
between tenure categories (F (5,810) = .606, p > .05).
Salameh (2011) investigated teachers’ perception of servant leadership practices
among school principals in the country of Jordan. The Organizational Leadership
Assessment (OLA) (Laub, 1999) was administered to a random sample of 432 Jordanian
teachers. Demographic data was collected on gender, experience (tenure), and academic
qualification (educational level). The researcher conducted an analysis of all six
dimensions of the OLA servant leadership scale as continuous dependent variables with
gender, tenure, and educational level as categorical independent variables. Multiple
analysis of variance (MANOVA) was employed to investigate followers’ perception of
servant leadership among school principals based on the teachers’ gender, tenure
category, and educational level. The result of the MANOVA indicated there were
significant differences in teachers’ perception of servant leadership practices of their
principals based on the teachers’ gender and tenure category (Wilks’ Lambda (λ) = .49,
F(12) = 28.33, p = .000). Analysis of variance (ANOVA) indicated significant
differences among tenure categories on the servant leadership dimensions of Builds
Community (F(2,430) = 125.56, p = .000) and Develops People (F(2,430) = 113.35,
p = .000). Scheffé post-hoc analysis found that those with less than 5 years tenure
(M = 3.62) scored higher than those with 5 to 9 years of tenure (M = 3.29), or those with
10 or more years of tenure (M = 3.32) on the dimension of Develops Others. On the
dimension of Builds Community those with 5 to 9 years of tenure (M = 4.02) scored

42
higher than those with less than 5 years tenure (M = 3.48) or those with 10 or more years
of tenure (M = 3.77).
Summary of Follower’s Tenure and Perception of Servant Leadership
Research has revealed mixed results in the relationship between followers’ tenure
and perception of servant leadership. The original research for the development of the
OLA (Laub, 1999) did not find a significant relationship between tenure and servant
leadership. Additional research by Salameh (2011) using the OLA found significant
differences based of years of tenure group category, but they were unrelated to increasing
tenure and servant leadership.
Tenure and Leadership
In the Shirom et al. (2008) meta-analysis, there was no moderating effect of
tenure on the relationship of role ambiguity and role conflict with job performance except
when tenure interacts with age. As age and tenure increased, the meta-correlation of role
ambiguity with general performance decreased. Weighted Least Squares (WLS)
regression analysis was used to estimate the moderating effect of tenure with the
following results for the interaction of tenure with age on the meta-correlation of role
ambiguity with general performance: (N = 7,657, k = 30, β = .48, ΔR2 = .14, F = 2.44,
p < .05).
Sin, Nahrgang, and Morgeson (2009) combined meta-analytic methods and
primary data collection to study leader-member exchange (LMX) dyads. Their meta-
analytic sample included 63 studies representing 64 independent participant samples.
Their study revealed that the longer the relationship tenure and intensity of the
relationship, the greater the degree of LMX dyad formation (N = 10,844, k = 64, ρ = .37).

43
Kooij et al. (2010) controlled for the moderating effect of tenure on age in their
meta-analysis of the effect of age on the association between HR practices and both
affective commitment and job satisfaction. Weighted least squares (WLS) multiple
regression analysis revealed that tenure had a significantly negative moderating effect
between some HR practices and affective commitment: training (β = - .74, p < .001) and
teamwork (β = - .78, p < .05). There was no significant moderating effect of tenure
between other HR practices such as promotion, rewards, participation, information
sharing, and affective commitment.
In the Lok and Crawford (2003) study, the LBDQ (Stogdill, 1974) was
administered to 337 managers in a variety of industries in Australia and Hong Kong.
There was a negative correlation between tenure and consideration (r = -.13, p < .05).
There was a positive correlation between tenure and initiating structure (r = .21,
p < .01).
Summary of Tenure and Leadership
Research has found mixed results in the relationship between followers’ tenure
and perception of leadership. Lok and Crawford (2003) found a negative relationship
between tenure and consideration and a positive relationship between tenure and
initiating structure in research utilizing the LBDQ (Stogdill, 1974). Sin et al. (2009)
found that the longer the tenure the greater the degree of LMX dyad formation. Kooij et
al. (2010) found that tenure had a significantly negative moderating effect between some
HR practices and affective commitment and no significant moderating effect between
other HR practices and affective commitment.
44
Follower’s Gender and Perception of Servant Leadership
In the original research for the development of the Organizational Leadership
Assessment (OLA), Laub (1999) conducted an analysis of variance (ANOVA) on six
categorical demographic variables and participants’ composite scores on the servant
leadership scale of the OLA. Among the categorical variables submitted to ANOVA was
gender. There was no significant mean difference in scores on the servant leadership
scale of the OLA between men and women (F(1,789) = .998, p > .05).
In the Horsman (2001) study, analysis of variance (ANOVA) was conducted on
categorical demographic variables and composite scores on the servant leadership scale
of the Organizational Leadership Assessment (OLA) (Laub, 1999). A one-way ANOVA
was conducted for gender and composite servant leadership scores on the OLA. There
was no significant difference in servant leadership scores between male and female
participants: (F(1,538) = 3.572, p = .059).
In the Dannhauser and Boshoff (2006) study a t-test was conducted on composite
scores on the Servant Leadership Questionnaire (SLQ) (Barbuto & Wheeler, 2006) to
determine if the mean scores differed significantly between males and females. The
results were not significant, t(162) = -1.027, p = .306. The means for males and females
were not statistically different.
Summary of Follower’s Gender and Perception of Servant Leadership
Research has not revealed a significant difference in followers’ perception of
servant leadership based on gender. The original research for the OLA (Laub, 1999) and
later research by Horsman (2001) using the OLA did not find significant differences
between men and women on perception of servant leadership. Research by Dannhauser

45
and Boshoff (2006) using the SLQ (Barbuto & Wheeler, 2006) also did not find
significant differences between men and women on perception of servant leadership.
Gender and Leadership
Eagly, Johannesen-Schmidt, and van Engen (2003) conducted a meta-analysis of
45 studies in which they compared men and women on transformational, transactional,
and laissez-faire leadership styles as defined by the MLQ-5X (Bass & Avolio, 1995).
Weighted mean effect sizes (d) were calculated with a negative effect meaning that
women had higher scores than men. They found that female leaders were more
transformational (k = 44, d = -.10) and engaged in more contingent reward behaviors
(k = 21, d = -.13) than male leaders.
Shirom et al. (2008) conducted a meta-analysis of the moderating effect of
gender, age, and tenure on role conflict and role ambiguity with job performance.
Weighted least squares (WLS) regression analysis did not reveal gender to have a
significant moderating effect between role ambiguity and job performance or between
role conflict and job performance. As percentage of women and age increased, there was
a reduction in the negative correlation between role ambiguity and job performance
(N = 7,657, k = 30, β = -.44, ΔR2 = .12, F = 1.57, p < .05).
Paustian-Underdahl, Walker, and Woehr (2014) conducted a meta-analysis of
gender and leadership effectiveness. They included 99 independent samples from 95
studies in their meta-analysis. When all leadership contexts were taken into
consideration, there was no difference between women and men in perceptions of their
effectiveness as leaders. However, when leadership effectiveness was rated by their
followers, women were rated significantly more effective than men (N = 96,893, k = 78,

46
d = -.120). In self-ratings, men rated themselves significantly more effective as leaders
than women did of themselves (N = 4711, k = 19, d = .206).
Lok and Crawford (2003) measured the effect of organizational culture and
leadership style on job satisfaction and organizational commitment among 377 managers
in various industries in Australia and Hong Kong. Perception of leadership style was
measured by the LBDQ (Stogdill, 1974). There was no significant mean difference
between men and women on either the initiating structure or consideration dimension of
the LBDQ.
Barbuto et al. (2007) studied the effect of leaders’ gender, educational level, and
age categories on a leader’s use of full range leadership behaviors as rated by followers
using the MLQ (Bass, 1985), and influence behaviors as rated by followers using the IBQ
(Yukl & Falbe, 1990) in a variety of settings in the United States. Multiple analysis of
variance (MANOVA) was used to analyze the effect of the categorical independent
variables of gender, educational level, and age categories on the continuous dependent
variables of the dimensions of the MLQ and IBQ. There was no significant main effect of
leaders’ gender on followers’ perception of leadership as measured by the MLQ, nor was
there a significant interaction between leaders’ age and gender on followers’ perception
of leadership as measured by the MLQ. There was a significant interaction between
leaders’ gender and educational level at the high school level on followers’ perception of
almost all full range leadership behaviors with the following Weighted Least Squares
(WLS) means: Management by Exception Active (M (men) = 0.67, M (women) = 1.88,
p < .05); Contingent Reward (M (men) = 3.52, M (women) = 2.53, p < .05);
Transformational (M (men) = 3.55, M (women) = 2.52, p < .05); Inspirational Motivation
47
(M (men) = 3.68, M (women) = 2.75, p < .05); Idealized Influence (M (men) = 3.59,
M (women) = 2.58, p < .05); Intellectual Stimulation (M (men) = 3.52,
M (women) = 2.38, p < .05); Individualized Consideration (M (men) = 3.36,
M (women) = 2.32, p < .05). There was a significant interaction between leaders’ gender
and educational level at the graduate level on followers’ perception of Individualized
Consideration with the following Weighted Least Squares (WLS) means:
(M (men) = 3.41, M (women) = 3.13, p < .05). Male leaders at the high school level of
education were rated higher by their followers in all transformational dimensions than
women leaders at the high school level of education. Male leaders at the graduate level of
education were rated higher by their followers on the transformational dimension of
Individualized Consideration than women leaders at the high school level of education.
Cuadrado, Morales, and Recio (2008) conducted experimental research on
leadership style and gender regarding women’s access to managerial positions. Their
study sample consisted of 136 psychology students at a university in Spain who were
randomly assigned to one of four groups of equal size (34 in each group) which were
each assigned a different experimental scenario. The study sample was 53% female and
47% male. They tested the following four hypotheses:
Hypothesis 1: Female leaders will receive less favorable evaluations than
male leaders when they adopt stereotypically masculine leadership styles
(autocratic and task-oriented).
Hypothesis 2: Male leaders will not receive less favorable evaluations than
female leaders when they adopt stereotypically feminine leadership

48
behaviors (democratic, relationship-oriented, individualized
consideration).
Hypothesis 3: Female leaders will receive worse evaluations from male
evaluators than from female evaluators.
Hypothesis 4: Male leaders will receive similar evaluations from male and
female evaluators (Cuadrado et al., 2008, p. 58).
The study participants by experimental group were presented with one of four different
narratives that varied by the leader’s gender (male or female) and leadership style
(stereotypically masculine or feminine). The participants then rated each leader on three
7-point Likert-type scale evaluations of leadership qualities (adjective list), leadership
capacity, and leadership effectiveness. Analysis of variance (ANOVA) was conducted to
test the hypotheses. There was no significant main effect between the leader’s gender and
the three evaluations of the leader by the participants. Thus Hypothesis 1 was not
supported. The lack of a significant main effect between the leader’s gender and the three
evaluations of the leader by the participants supported Hypothesis 2 in that there was no
difference between male and female leaders in their evaluations by the participants. There
was no significant main effect based on the participants’ gender in evaluations of female
leaders on the three evaluations of the leader by the participants. Thus Hypothesis 3 was
not supported. There was no significant main effect based on the participants’ gender in
evaluations of male leaders on the three evaluations of the leader by the participants.
Thus Hypothesis 4 was supported.
Elsesser and Lever (2011) conducted a large-scale study of gender bias against
female leaders. Data was obtained from a national survey based in the United States. The

49
researchers participated in the development of a 37-item survey which was posted on the
msnbc.com website in 2007 for a period of 10 days. Valid surveys were returned by
60,740 participants from a broad spectrum of employment environments. The participants
were asked to respond to questions regarding their current supervisor as to relationship
quality, competence, and sensitivity. Participants were also asked to respond to questions
regarding the gender with whom they compete most frequently at work and their
preference for a male or female supervisor. Demographic information was obtained as to
the respondents’ gender, age, marital status, educational level, salary, and gender of
supervisor. To analyze the data the researchers utilized t-tests, χ2 (Chi-square) analysis,
and factorial analysis of variance (ANOVA) as appropriate. Effect sizes were determined
applying Cohen’s d calculations. Male participants rated female supervisors higher on
competence than female participants rated female supervisors, t(29692) = 2.90, p < .004,
d = .06. Female participants rated male supervisors higher on competence than female
supervisors, t(30744) = -5.69, p < .001, d = .08. Female participants reported having
better relationships with male supervisors than female supervisors, t(30744) = 13.75,
p < .001, d = .15. There was no significant difference in the rating of relationships of
male participants with male or female supervisors, t(29692) = -1.06, p < .29, d = .01.
Where the t-test indicated a significant difference, the effect size was small.
O-Campo et al. (2012) studied gender and language spoken at home with the
covariate of age as applied to the six GLOBE (House et al., 2004) leadership preferences.
Analysis of covariance (ANCOVA) revealed a significant main effect for gender. Female
Spanish speaking followers (M = 5.71) felt that being a participative leader contributed to

50
outstanding leadership more than did Male Spanish speaking followers (M = 5.29),
p = .05.
Summary of Gender and Leadership
Research results have been mixed in followers’ perception of leadership based on
gender. A meta-analysis by Eagly et al. (2003) found female leaders were more
transformational and engaged in more contingent reward behaviors than male leaders. In
the meta-analysis of Paustian-Underdahl et al. (2014), followers rated women
significantly higher than men as leaders, whereas men rated themselves significantly
higher as leaders than women did. Shirom et al. (2008) found that as percentage of
women and age increased among followers, there was a reduction in the negative
correlation between followers’ role ambiguity and job performance. Lok and Crawford
(2003) did not find a significant mean difference between men and women on either the
initiating tructure or consideration dimension of the LBDQ (Stogdill, 1974). Barbuto et
al. (2007) found some significant differences between men and women followers’ in their
study of the effect of leaders’ gender, educational level, and age categories on a leader’s
use of full range leadership behaviors as rated by followers. The Cuadrado et al. (2008)
experimental study of leadership style and gender regarding women’s access to
managerial positions did not find statistical differences between men and women
followers in perception of leadership. Elsesser and Lever (2011) found the effect size to
be small between men and women followers in their study of gender bias against female
leaders. O-Campo et al. (2012) discovered a main effect for gender in their study of
gender and language spoken at home as applied to the six GLOBE (House et al., 1974)
leadership preferences.

51
Follower’s Education and Perception of Servant Leadership
In the original research for the development of the Organizational Leadership
Assessment (OLA), Laub (1999) conducted an analysis of variance (ANOVA) on six
categorical demographic variables and participants’ composite scores on the servant
leadership scale of the OLA. Among the categorical variables submitted to ANOVA was
educational level. There was no significant mean difference in scores on the servant
leadership scale of the OLA between educational levels (F(5,807) = 2.699, p > .05).
In the Horsman (2001) study, analysis of variance (ANOVA) was conducted on
categorical demographic variables and composite scores on the servant leadership scale
of the Organizational Leadership Assessment (OLA) (Laub, 1999). A one-way ANOVA
was conducted for educational level and composite servant leadership scores on the OLA,
F(2,538) = 15.076, p = .000. Bonferonni post-hoc analysis indicated significant
differences in perception of servant leadership between those with no undergraduate
degree and those with undergraduate or graduate degrees. Increasing mean scores from
those with no undergraduate degree to those with graduate degrees suggested “that on
average as the educational level of respondents increased, the higher the OLA score”
(p. 129).
In the Dannhauser and Boshoff (2006) study, followers’ perception of servant
leadership was measured by the Servant Leadership Questionnaire (SLQ) (Barbuto &
Wheeler, 2006). Two levels of education – secondary and post-secondary – were
analyzed by t-test to measure differences in followers’ perception of servant leadership
by educational level. The results of the t-test were not significant, t(386) = .250, p = .803.

52
In the Salameh (2011) study, teachers’ perception of servant leadership among
high school principals in the country of Jordan was measured using the servant leadership
scale of the Organizational Leadership Assessment (OLA) (Laub, 1999). Differences of
perception of servant leadership by teachers related to the gender, tenure, and educational
level of their principals were assessed by multivariate analysis of variance (MANOVA).
The results of the MANOVA were not significant for educational level. Therefore
additional analysis of variance (ANOVA) and post-hoc analysis were not indicated.
Summary of Follower’s Education and Perception of Servant Leadership
Research has indicated mixed results based on followers’ level of education and
perception of servant leadership. The original field research by Laub (1999) for the
development of the Organizational Leadership Assessment (OLA) did not discover
differences in perception of servant leadership based on educational level. Later research
by Horsman (2001) with the OLA revealed increased perception of servant leadership
with increasing level of education. Research by Salameh (2011) with the OLA and
Dannhauser and Boshoff (2006) with the SLQ (Barbuto & Wheeler, 2006) did not find
significant differences in perception of servant leadership by followers based on
educational level.
Education and Leadership
Lok and Crawford (2003) studied the effect of organizational culture and
leadership style on job satisfaction and organizational commitment. Leadership style was
measured by the Leader Behavior Descriptive Questionnaire (LBDQ) (Stogdill, 1974).
Demographic information was obtained on the participants for the variables of national
culture, gender, age, tenure, and educational level. A significant positive correlation was
53
found between increasing years of education and the dimension of consideration on the
LBDQ, r = .13, p < .05.
Rodriguez et al. (2003) assessed generational differences between followers in
preferences for leadership behaviors. Demographic information was obtained on
participants’ ethnicity and educational level in addition to generational cohort. Multiple
analysis of variance (MANOVA) was conducted on the data. The Wilks’ Lamba
multivariate test for the independent variable of educational level was significant,
F(1,803) = 5.016, p < .05. For Generation Xers, significant mean differences were found
in preferred leadership style for several dependent variables by educational level. For
fulfillment (challenging tasks), F(1,803) = 7.757, p = .005, those with greater than 12
years of education (M = 2.95) scored higher than those with 12 years of education
(M = 2.66). For technology use, F(1,803) = 11.869, p = .001, those with greater than 12
years of education (M = 2.48) scored higher than those with 12 years of education
(M = 2.08). For work flexibility, F(1,803) = 8.892, p = .003, those with greater than 12
years of education (M = 3.35) scored higher than those with 12 years of education
(M = 3.03). For work environment, F(1,803) = 4.963, p = .026, those with greater than 12
years of education (M = 2.33) scored higher than those with 12 years of education
(M = 2.00). For Baby Boomers a significant mean difference was found in preferred
leadership style for the dependent variable of monetary benefits by educational level,
F(1,803) = 39.757, p = .000. Those with greater than 12 years of education (M = 3.06)
scored lower than those with 12 years of education (M = 3.95).
Barbuto et al. (2007) studied the relationship of gender, age, and education on
leadership style and influence tactics. They examined 56 leaders and 234 followers using

54
the MLQ (rater version) (Bass, 1985) and Yukl’s Influence Behavior Questionnaire
(IBQ) (Yukl & Falbe, 1990). Multivariate analysis of variance (MANOVA) was
conducted on the independent variables of gender, education, and age, and the dependent
variables of the MLQ and the IBQ. “MANOVA results revealed that leader’s gender and
education explained significant differences in followers’ ratings of leadership behaviors”
(p. 77). One-way Analysis of Variance (ANOVA) was conducted which indicated a
significant main effect for education, F = 4.58, p = .011. Leaders with advanced degrees
were perceived by followers as exhibiting individualized consideration more than those
without an advanced degree.
Kearney and Gebert (2009) studied transformational leadership as measured by
the MLQ Short (Avolio & Bass, 2004) as a moderator of the relationship of age,
nationality, and educational background on team outcomes. Hierarchical regression
analysis was conducted on the data. The researchers set significance levels at p < .10 for
findings involving interactions because of the inherently low power in field studies for
detecting moderators. The multiple squared correlation coefficient indicated a significant
change after adding the interaction terms of age, nationality, and education (ΔR2 = .17,
p < .01). The interaction of transformational leadership with education was significant,
b = 1.04, p < .05. Transformational leadership moderated the effect of education on team
performance. When transformational leadership was high, the effect of education on team
performance was high, b = 1.37, t = 2.55, p < .05.
Summary of Education and Leadership
Research has indicated significant differences between both leaders’ and
followers’ educational level and followers’ perception of leadership. Leaders with

55
advanced degrees were perceived by followers as exhibiting individualized consideration
more than those without an advanced degree in the Barbuto et al. (2007) study. The Lok
and Crawford (2003) study found significant differences between increasing followers’
educational level and their perception of leaders’ consideration on the LBDQ (Stogdill,
1974). Kearney and Gebert (2009) found that transformational leadership moderated the
effect of followers’ education on team performance. When transformational leadership
was high, the effect of followers’ education on team performance was high. In the
Rodriguez et al. (2003) assessment of generational differences between followers in
preferences for leadership behaviors, there were significant differences especially among
Generation Xers in preferences for several leadership behaviors by educational level of
the follower.
Follower’s Organizational Level and Perception of Servant Leadership
In the original research for the development of the Organizational Leadership
Assessment (OLA), Laub (1999) conducted an analysis of variance (ANOVA) on six
categorical demographic variables and participants’ composite scores on the servant
leadership scale of the OLA. Among the categorical variables submitted to ANOVA was
organizational level. There was a significant difference in scores on the servant
leadership scale of the OLA (F(2,807) = 9.611, p < .05) between top leadership
(M = 297.98), and both management/supervision (M = 278.59), and workforce
(M = 274.88). The higher one’s position in the organization, the higher the scores on the
servant leadership scale of the OLA.
In the Horsman (2001) study, analysis of variance (ANOVA) was conducted on
categorical demographic variables and composite scores on the servant leadership scale
56
of the Organizational Leadership Assessment (OLA) (Laub, 1999). A one-way ANOVA
was conducted for organizational level and composite servant leadership scores on the
OLA. There was a significant difference in servant leadership scores between
organizational levels of the participants: (F(2,538) = 4.686, p = .010). Bonferonni post-
hoc analysis indicated a significant difference between top leadership (M = 230.90) and
workforce (M = 210.75), indicating the higher one’s level in the organization, the higher
the perception of servant leadership.
Thompson (2002) studied the perception of servant leadership and job satisfaction
at a church-related college in the United States. He administered the Organizational
Leadership Assessment (OLA) (Laub, 1999) and the Minnesota Satisfaction
Questionnaire (MSQ) (Weiss, Dawis, England, & Lofquist, 1967) to 170 employees of
the college. Demographic information was obtained on the participants’ gender,
educational level, tenure, and organizational level. One-way analysis of variance
(ANOVA) was conducted for organizational level and composite servant leadership
scores on the OLA. There was no significant difference in perception of servant
leadership among followers by organizational level, F(3,112) = 2.322, p = .079.
Ledbetter (2003) conducted a test-retest reliability study on perception of servant
leadership as measured by the servant leadership scale of the Organizational Leadership
Assessment (OLA) (Laub, 1999) among law enforcement officers in the United States.
Participants were recruited from an association of chiefs of police. Demographic
information was obtained on participants’ age, gender, race/ethnicity, tenure, educational
level, type of organization, and organizational level. A total of 1584 surveys were
distributed to a sample of 792 individuals from 12 agencies who were asked to complete
57
and return two identical surveys at an interval of two weeks. A total of 466 surveys were
returned by 263 respondents representing 260 surveys for OLA test 1 and 206 surveys for
OLA retest. A total of 138 surveys from the test and 138 from the retest were paired from
the same respondents to analyze correlation and reliability between the test and retest.
Analysis of variance (ANOVA) indicated mean differences between organizational levels
on the test: top leadership (M = 230.00); management (M = 184.86) and workforce
(M = 200.62); and on the retest: top leadership (M = 225.50); management (M = 212.63)
and workforce (M = 222.50).
Drury (2004) studied the relationship between servant leadership and
organizational commitment. Hourly workers and faculty differed in their perceptions of
servant leadership and organizational commitment. Her research revealed a significantly
higher perception by top leadership than hourly workers of servant leadership within the
organizations studied. Perceptions of servant leadership and job satisfaction were
measured with the Organizational Leadership Assessment (OLA) (Laub, 1999). She
tested the following three null hypotheses: “(a) There is no difference in categories of
employees in their perception of servant leadership, (b) There is no correlation between
servant leadership and job satisfaction, and (c) There is no correlation between servant
leadership and organizational commitment” (p. 2) In her first null hypothesis she was
looking at the relationship between organizational level and servant leadership. Her study
population was drawn from a non-traditional college in the United States and included
top leadership, salaried management, full time faculty, and hourly workers (N = 170). For
perception of servant leadership the ANOVA results were F (3,164) = 3.085, p = .029.
Bonferroni post-hoc analysis revealed that hourly workers differed most from full time
58
faculty. There was a significantly higher perception by top leadership than hourly
workers of servant leadership within the organization.
Black (2010) conducted a correlational analysis of perception of servant
leadership with perception of school climate. The Organizational Leadership Assessment
(OLA) (Laub, 1999) and the Organizational Climate Description Questionnaire-Revised
(OCDQ-RE) (Hoy, Tarter & Kottkamp, 1991) were administered to a random sample of
231 teachers and 15 principals in Roman Catholic elementary schools in the province of
Ontario, Canada. Canonical correlation analysis revealed a significant relationship
between the OLA construct of Values People and the OCDQ-RE dimension of
Supportive of 0.66; between the OLA construct of Develops People and the OCDQ-RE
dimension of Collegial of 0.54; and between the OLA construct of Displays Authenticity
and the OCDQ-RE dimension of Intimate of 0.36. Principals reported higher levels of
perception of servant leadership than teachers did on the following dimensions of the
OLA: Values People: Principals (M = 39.88), Teachers (M = 38.12); Develops People:
Principals (M = 36.77), Teachers (M = 33.39); Builds Community: Principals
(M = 43.05), Teachers (M = 38.60); Displays Authenticity: Principals (M = 49.61),
Teachers (M = 43.88); Provides Leadership: Principals (M = 38.05), Teachers
(M = 33.63); and Shares Leadership: Principals (M = 41.83), Teachers (M = 36.58).
Summary of Follower’s Organizational Level and Perception of Servant Leadership
Research has indicated mixed results in followers’ organizational level and
perception of servant leadership. The original field research for the Organizational
Leadership Assessment (OLA) Laub (1999) found that the higher one’s level within the
organization the higher the perception of servant leadership. Research by Horsman

59
(2001) and Ledbetter (2003) with the OLA had similar findings as Laub’s (1999) original
research. Subsequent research with the OLA by Thompson (2002) found no difference in
perception of servant leadership among followers’ organizational level. Drury (2004)
found a significantly higher perception by top leadership than hourly workers of servant
leadership within a non-traditional college as measured by the OLA. Black (2010) found
a higher perception by principals than teachers of servant leadership within Roman
Catholic elementary schools in Canada as measured by the OLA.
Follower’s Generational Cohort and Job Satisfaction
Costanza et al. (2012) conducted a meta-analysis of 20 studies containing 18 pairs
of generational comparisons (Traditionals, Baby Boomers, Generation Xers, and
Millennials) (N = 19,961) on the criteria of job satisfaction, organizational commitment,
and intent to turnover. The authors identified 329 studies of which 20 met their criteria
that the study tested hypotheses on generational differences in an empirical and
quantitative manner; investigated at least one of the dimensions of job satisfaction,
organizational commitment, or intent to turnover; and were capable of meta-analysis. The
studies included in the meta-analysis were conducted between 1995 and 2009 all within
the United States except one each from Canada and Europe, and two from New Zealand.
Meta-analysis with corrected d levels revealed that Traditionals experienced slightly
more job satisfaction than Boomers (N = 2182, k = 2, d =.18) and Generation Xers
(N = 1398, k = 2, d =.25). The authors, however, concluded that their meta-analysis did
not support significant differences among the generations, as the majority of comparisons
had d levels of “less than one-quarter of a standard deviation when corrected for
unreliability” (p. 387).

60
Hansen and Leuty (2012) studied work values across generations. Clients of a
vocational assessment clinic in the United States represented 1689 participants from three
generations: Silent Generation (born 1925 to 1945, N = 371); Baby Boomers (born 1946
to 1964, N = 1179); and Generation X (born 1965 to 1980, N = 139). Job satisfaction was
assessed by the Minnesota Importance Questionnaire (MIQ) (Gay, Weiss, Hendel, Dawis,
& Lofquist, 1971) which assesses a range of work values including achievement,
comfort, status, autonomy, working conditions, security, relationships with coworkers,
and compensation. Participants gave their permission for data from the MIQ that had
been collected to be used in the study. Analysis of covariance (ANCOVA) by
generational cohort and gender was employed to control for the covariate of age because
of significant differences in age between each generational group at the time they took
the MIQ. Age was a significant covariate, F(2,1689) = 341.89, p < .001. For women,
significant generational differences were found for working conditions, (F(2,757) = 5.89,
p < .01); advancement, (F(2,757) = 4.74, p < .01); and relationships with coworkers,
(F(2,757) = 5.48, p < .01). For men, significant generational differences were found for
overall comfort, (F(2,932) = 4.85, p < .01); working conditions, (F(2,932) = 10.27,
p < .001); job security (F(2,932) = 4.67, p < .01); and authority, (F(2,932) = 5.62,
p < .01).
Zimmerer (2013) studied generational differences in followers’ job satisfaction,
organizational commitment, and turnover intent when exposed to servant leadership.
Followers’ job satisfaction was measured using the Abridged Job in General Index (aJIG)
(Russell et al., 2004) and the Abridged Job Descriptive Scale (aJDI) (Stanton et al.,
2001). Followers’ perception of servant leadership was measured using the Servant
61
Leadership Survey (SLS) (Van Dierendonck & Nuitjen, 2011). Multiple analysis of
variance (MANOVA) was conducted on the categorical independent variable of
generational cohort and the dependent variables of followers’ perception of servant
leadership, job satisfaction, organizational commitment, and turnover intent. The Wilks’
Lambda value was .95, with F(3,892) = 2.81, p = .004. However, follow up analysis of
variance (ANOVA) did not reveal any statistical differences between generational
cohorts and job satisfaction for either the Abridged Job in General Index (aJIG),
F(3,449) = .25, p = .78, or the Abridged Job Descriptive Scale (aJDI), F(3,449) = .89,
p = .42.
Summary of Follower’s Generational Cohort and Job Satisfaction
Research has revealed mixed results between followers’ generational cohort and
job satisfaction. The Hansen and Leuty study (2012) found significant generational
differences for women in the areas of followers’ satisfaction with working conditions,
advancement, and relationships with coworkers. They found significant generational
differences for men in the areas of followers’ satisfaction with overall comfort, working
conditions, job security, and authority. The Zimmerer (2013) study did not find any
differences between generational cohorts and followers’ job satisfaction. The Costanza et
al. (2012) meta-analysis of generational comparisons revealed that Matures exhibited
slightly more job satisfaction than Baby Boomers and Generation X.
Age and Job Satisfaction
Ng et al. (2005) conducted a meta-analysis on predictors of objective and
subjective career success. Predictors included organizational sponsorship as defined by
career sponsorship, supervisor support, training and skill development opportunities, and
62
organizational resources; human capital; socio-demographics, and stable individual
differences. Subjective career success was defined as career satisfaction. Demographic
information was obtained for gender, race (White or non-White), marital status (married
or unmarried), and age. There was not a significant correlation between age and career
satisfaction (N = 11,913, k = 26, rc = .00).
Ng and Feldman (2010) conducted a meta-analysis of the relationship of age with
job attitudes. The researchers controlled for the effect of tenure as age and tenure are
likely to be significantly correlated. They found that there was a weakly positive
correlation between age and overall job satisfaction (N = 151,105, k = 388, rc = .18).
Kooij et al. (2010) conducted a meta-analysis of the effect of age on the
association between HR practices and affective commitment and job satisfaction. The
researchers controlled for the effect of tenure. Weighted least squares (WLS) regression
analysis was performed to test for the moderating effect of age on the relationship
between HR practices and job satisfaction. Their analysis revealed that employee
perceptions of the HR practices of teamwork, flexible work schedules, performance
management, rewards, and information sharing were positively correlated with job
satisfaction (N = 37,261, k = 56, ρ = .34) and increased with age.
In the original field test for Laub’s (1999) development of the Organizational
Leadership Assessment (OLA) a six-item job satisfaction scale was developed. A
Pearson’s r correlation was calculated for the relationship of followers’ age and scores
on the job satisfaction scale of the OLA. There was a significant positive relationship
between age and job satisfaction (r = .177, p <. 05).

63
Lok and Crawford (2003) studied the effect of organizational culture and
leadership style on job satisfaction and organizational commitment on a sample of
managers from Hong Kong and Australia. Leadership style was measured by the Leader
Behavior Descriptive Questionnaire (LBDQ) (Stogdill, 1974), and job satisfaction was
measured by the Warr job satisfaction questionnaire (Warr et al., 1979). Their research
indicated a positive correlation between age and job satisfaction, r = .16, p < .01.
Gittell et al. (2008) studied the effect of relational coordination on nursing aide
job satisfaction and quality of life outcomes for nursing home residents. A cross-sectional
study was conducted in 15 nursing home facilities in the United States. A 38-item Likert-
type questionnaire was administered in face-to-face interviews to 105 nursing home
residents, and an 82-item Likert-type questionnaire was administered in face-to-face
interviews to 252 nursing aides. The nursing aide questionnaire was available in English,
Spanish, and Haitian Creole according to the language preference of the nursing aide.
Demographic information was obtained on nursing home residents’ age, length of stay,
and gender. For nursing aides, demographic information was obtained on their age,
tenure, language, gender, and educational level. Relational coordination for nursing aides
assessed problem solving communication, shared goals, shared knowledge, and mutual
respect. A 1-item job satisfaction Likert-type question scored from 1- very dissatisfied to
5 - very satisfied asked, “Overall, how satisfied are you with your job?” (p. 159).
Resident quality of life assessed “privacy, spiritual well-being, meaningful activity,
enjoyment of food, individuality, and global quality of life” (p. 159). Random effects
linear regression was used to analyze the relationship between relational coordination and
nursing aide job satisfaction with nursing aide (N = 231) as the unit of analysis, and

64
nursing home facility (N = 15) as the random effect. The control variables were nursing
aide age, tenure, gender, language, and education. Nursing aide age was not a significant
predictor of nursing aide job satisfaction.
Dobrow Riza et al. (2014) studied the effect of age and tenure on job satisfaction.
Their study included 21,670 participants in 34 waves of data collection over a 40-year
period from two nationally representative samples in the United States. The first sample
(N = 12,686) consisted of Americans born between 1957 and 1964 as part of the 1979
cohort of the National Longitudinal Survey of Youth (NLSY79, US Department of
Labor, Bureau of Labor Statistics). The second sample (N = 8,984) consisted of
Americans born between 1980 and 1984 as part of the 1997 cohort of the National
Longitudinal Survey of Youth (NLSY97, US Department of Labor, Bureau of Labor
Statistics). Job satisfaction was measured by a single-item Likert-type question from
1 - dislike very much to 4 - like very much in the NLSY79 and 1 - dislike very much to
5 - like very much in the NLSY97. They tested the following three hypotheses:
Hypothesis 1: Holding all else constant (and in particular controlling for
tenure), job satisfaction increases as people age.
Hypothesis 2: Holding all else constant (and in particular controlling for
age), job satisfaction decreases as organizational tenure increases.
Hypothesis 3: Pay mediates the relationship between both (a) age and (b)
tenure with job satisfaction, such that age and tenure both have a positive
relationship with pay, which in turn has a positive relationship with job
satisfaction (Dobrow Riza et al., 2014, p. 6).

65
In their analysis they were interested in individuals’ job satisfaction over time across
career paths. They used multilevel modeling techniques, and a three-level nested
structure at the within-organization (for tenure), between organization (for age), and
between-person levels to account for differences between persons and organizations
within both the NLSY79 and the NLSY97. Correlations between age and job satisfaction
were positive for both the NLSY79 (r = .14, p < .01) and the NLSY97 (r = .11, p < .01).
The results indicate that job satisfaction increased with age.
Summary of Age and Job Satisfaction
Research has revealed mixed results in the relationship of followers’ age with job
satisfaction. Several studies found a positive relationship between followers’ age and job
satisfaction (Ng & Feldman, 2010; Laub, 1999; Lok & Crawford, 2003; Dobrow Riza et
al., 2014). The Ng et al. (2005) meta-analysis did not find a correlation between
followers’ age and career satisfaction. Gittell et al. (2008) found that followers’ age was
not a significant predictor of job satisfaction. The Kooij et al. (2010) meta-analysis
revealed that employee perceptions of HR practices were positively correlated with job
satisfaction and increased with age.
Follower’s Language and Job Satisfaction
Yousef (2000) studied the mediator role of organizational commitment between
leadership behavior and job satisfaction and performance in the United Arab Emirates
(UAE). Leadership behavior of superiors as perceived by respondents was measured by
the Likert (1967) leadership questionnaire. Job satisfaction was measured by a single
question on a 7-point Likert scale that inquired about a participant’s overall job
satisfaction. A random sample of 600 employees from 30 organizations received the

66
survey instrument of which 430 returned usable surveys. The study sample consisted of
47% UAE nationals (Arabic-speaking), 45% Arabic-speaking expatriates, and 8% Asian
nationals. Regression analysis did not reveal language (national culture) to be a
significant predictor of job satisfaction.
Lok and Crawford (2003) studied the effect of organizational culture and
leadership style on job satisfaction and organizational commitment on a sample of
managers from Hong Kong and Australia. Leadership style was measured by the Leader
Behavior Descriptive Questionnaire (LBDQ) (Stogdill, 1974), and job satisfaction was
measured by the Warr job satisfaction questionnaire (Warr et al, 1979). There was a
significant mean difference between managers from Australia (English-speaking,
M = .23, SD = .95) and managers from Hong Kong (Chinese-speaking, M = -.14,
SD = .98) in job satisfaction, t(335) = 3.37, p < .01.
Irving and McIntosh (2007) evaluated the Spanish version of the Organizational
Leadership Assessment (OLA) (Laub, 1999). Their research revealed a Cronbach’s alpha
of .8715 (N = 78) for the job satisfaction scale of the OLA. The original field research for
the OLA revealed a Cronbach’s alpha of .81 (N = 828) for the job satisfaction scale of
the OLA (Laub, 1999).
Gittell et al. (2008) studied the effect of relational coordination on nursing aide
job satisfaction and quality-of-life outcomes for nursing home residents. An 82-item
Likert-type questionnaire was administered in face-to-face interviews to 252 nursing
aides. The nursing aide questionnaire was available in English, Spanish, and Haitian
Creole according to the language preference of the nursing aide. Random effects linear
regression was used to analyze the relationship between relational coordination and

67
nursing aide job satisfaction with nursing aide (N = 231) as the unit of analysis and
nursing home facility (N = 15) as the random effect. The control variables were nursing
aide age, tenure, gender, language, and education. Nursing aide language was not a
significant predictor of nursing aide job satisfaction.
Summary of Follower’s Language and Job Satisfaction
Results have been mixed for differences in followers’ job satisfaction by
language. The Yousef (2000) and Gittell et al. (2008) studies did not reveal followers’
language to be a significant predictor of job satisfaction. The Lok and Crawford (2003)
study revealed significant differences in job satisfaction between language groups. Irving
and McIntosh (2007) obtained similar reliability coefficients for the job satisfaction scale
of the OLA (Laub, 1999).
Follower’s Tenure and Job Satisfaction
Ng et al. (2005) conducted a meta-analysis on predictors of objective and
subjective career success. Predictors included organizational sponsorship as defined by
career sponsorship, supervisor support, training and skill development opportunities, and
organizational resources; human capital; socio-demographics, and stable individual
differences. Subjective career success was defined as career satisfaction. Demographic
information was obtained for gender, race (White or non-White), marital status (married
or unmarried), and age. Information was also obtained for tenure. Job tenure was not a
significant predictor of career satisfaction.
Kooij et al. (2010) conducted a meta-analysis of the effect of age on the
association between HR practices and affective commitment and job satisfaction. The
researchers controlled for the effect of tenure. Weighted least squares (WLS) regression

68
analysis was performed to test for the moderating effect of age on the relationship
between HR practices and job satisfaction. Tenure had a significantly negative
moderating effect on the association between the HR practices of training, information
sharing, and staffing, and job satisfaction.
Ng and Feldman (2010) conducted a meta-analysis of the relationship between
age and 35 job attitudes including work tasks, colleagues, supervisors, and organizations.
They included over 800 studies in their meta-analysis. Organizational tenure, race,
gender, education level, and year of study moderated the relationship between age and
job attitudes. There was a significant moderating effect of job tenure on job satisfaction
(tenure < 7 years, N = 2,149, k = 11, rc = .16; tenure > 7 years, N = 12,029, k = 11,
rc = .24).
In the original field test for Laub’s (1999) development of the Organizational
Leadership Assessment (OLA) a six-item job satisfaction scale was included. A
Pearson’s r correlation was calculated for the relationship of followers’ tenure and scores
on the job satisfaction scale of the OLA. There was a significant positive correlation
between participants’ tenure and scores on the job satisfaction scale of the OLA, r = .118,
p < .05.
Lok and Crawford (2003) studied the effect of organizational culture and
leadership style on job satisfaction and organizational commitment on a sample of
managers from Hong Kong and Australia. Leadership style was measured by the Leader
Behavior Descriptive Questionnaire (LBDQ) (Stogdill, 1974), and job satisfaction was
measured by the Warr job satisfaction questionnaire (Warr et al, 1979). There was a

69
significant negative correlation between participants’ tenure and participants’ job
satisfaction (r = -.15, p < .01).
Gittell et al. (2008) studied the effect of relational coordination on nursing aide
job satisfaction and quality of life outcomes for nursing home residents. An 82-item
Likert-type questionnaire was administered in face-to-face interviews to 252 nursing
aides. The nursing aide questionnaire was available in English, Spanish, and Haitian
Creole according to the language preference of the nursing aide. Random effects linear
regression was used to analyze the relationship between relational coordination and
nursing aide job satisfaction with nursing aide (N = 231) as the unit of analysis, and
nursing home facility (N = 15) as the random effect. The control variables were nursing
aide age, tenure, gender, language, and education. Nursing aide tenure was not a
significant predictor of nursing aide job satisfaction.
Dobrow Riza et al. (2014) studied the effect of age and tenure on job satisfaction.
Their study included 21,670 participants in 34 waves of data collection over a 40-year
period from two nationally representative samples in the United States. The first sample
(N = 12,686) consisted of Americans born between 1957 and 1964 as part of the 1979
cohort of the National Longitudinal Survey of Youth (NLSY79). The second sample
(N = 8,984) consisted of Americans born between 1980 and 1984 as part of the 1997
cohort of the National Longitudinal Survey of Youth (NLSY97). Correlations between
tenure and job satisfaction were negative for both the NLSY79 (r = -.07, p < .01) and the
NLSY97 (r = -.13, p < .01).

70
Summary of Follower’s Tenure and Job Satisfaction
Results of research on the relationship between followers’ tenure and job
satisfaction have been mixed. Both the Ng et al. (2003) and the Gittell et al. (2008)
studies found that followers’ job tenure was not a significant predictor of job satisfaction.
The Ng and Feldman (2010) meta-analysis of age and job attitudes revealed a significant
moderating effect of followers’ tenure on job satisfaction. As tenure increased, job
satisfaction increased. The Kooij et al. (2010) meta-analysis found that followers’ tenure
had a significantly negative moderating effect on the association between the HR
practices of training, information sharing, and staffing and job satisfaction. The Laub
(1999) study revealed a positive relationship between tenure and job satisfaction. Both
the Lok and Crawford (2003) and the Dobrow Riza et al. (2014) studies revealed a
negative relationship between followers’ tenure and job satisfaction.
Follower’s Gender and Job Satisfaction
Ng et al. (2005) conducted a meta-analysis on predictors of objective and
subjective career success. Predictors included organizational sponsorship as defined by
career sponsorship, supervisor support, training and skill development opportunities, and
organizational resources; human capital; socio-demographics, and stable individual
differences. Subjective career success was defined as career satisfaction. Demographic
information was obtained for gender, race (White or non-White), marital status (married
or unmarried), and age. Gender was not a significant predictor of career satisfaction.
Ng and Feldman (2010) conducted a meta-analysis of the relationship between
age and 35 job attitudes including work tasks, colleagues, supervisors, and organizations.
They included over 800 studies in their meta-analysis. Organizational tenure, race,

71
gender, education level, and year of study moderated the relationship between age and
job attitudes. There was a significant moderating effect of gender on job satisfaction
(women < 50%, N = 7,886, k = 17, rc = .13; women > 50%, N = 3,862, k = 17, rc = -.05).
Aydin et al. (2012) conducted a meta-analysis of the effect of gender on job
satisfaction of teachers in Turkey. They included ten studies in their meta-analysis
(k = 10) representing a sample of 2,775 participants (N = 2775) all from within the
country of Turkey. Meta-analytic procedures were used to calculate a standardized effect
size (Cohen’s d). A mean effect size of d = -.02 was calculated indicating a small effect
of job satisfaction in favor of males.
Lok and Crawford (2003) studied the effect of organizational culture and
leadership style on job satisfaction and organizational commitment on a sample of
managers from Hong Kong and Australia. Leadership style was measured by the Leader
Behavior Descriptive Questionnaire (LBDQ) (Stogdill, 1974), and job satisfaction was
measured by the Warr job satisfaction questionnaire (Warr et al, 1979). Hierarchical
regression analysis did not reveal gender to be a significant predictor of job satisfaction.
Gittell et al. (2008) studied the effect of relational coordination on nursing aide
job satisfaction and quality of life outcomes for nursing home residents. An 82-item
Likert-type questionnaire was administered in face-to-face interviews to 252 nursing
aides. The nursing aide questionnaire was available in English, Spanish, and Haitian
Creole according to the language preference of the nursing aide. Random effects linear
regression was used to analyze the relationship between relational coordination and
nursing aide job satisfaction with nursing aide (N = 231) as the unit of analysis, and
nursing home facility (N = 15) as the random effect. The control variables were nursing
72
aide age, tenure, gender, language, and education. Nursing aide gender was not a
significant predictor of nursing aide job satisfaction.
Summary of Follower’s Gender and Job Satisfaction
Researchers found mixed results when reporting followers’ gender and job
satisfaction. Several studies did not find followers’ gender to be a significant predictor of
job satisfaction (Lok & Crawford, 2003; Ng et al., 2005; Gittell et al., 2008). The Ng and
Feldman (2010) meta-analysis of age and job attitudes revealed a significant moderating
effect of gender on job satisfaction. The Aydin et al. (2012) meta-analysis found a small
effect in favor of males on job satisfaction of teachers in Turkey.
Follower’s Education and Job Satisfaction
Ng et al. (2005) conducted a meta-analysis on predictors of objective and
subjective career success. Predictors included organizational sponsorship as defined by
career sponsorship, supervisor support, training and skill development opportunities, and
organizational resources; human capital; socio-demographics, and stable individual
differences. Subjective career success was defined as career satisfaction. Demographic
information was obtained for gender, race (White or non-White), marital status (married
or unmarried), and age. Educational level was a significant predictor of career satisfaction
(N = 11,890, k = 24, rc = .03, p < .05).
Ng and Feldman (2010) conducted a meta-analysis of the relationship between
age and 35 job attitudes including work tasks, colleagues, supervisors, and organizations.
They included over 800 studies in their meta-analysis. Organizational tenure, race,
gender, educational level, and year of study moderated the relationship between age and
job attitudes. The study revealed a significant moderating effect of college education on

73
job satisfaction (college education < 70%, N = 20,351, k = 51, rc = .27;
college education > 70%, N = 13,963, k = 56, rc = .16).
Lok and Crawford (2003) studied the effect of organizational culture and
leadership style on job satisfaction and organizational commitment on a sample of
managers from Hong Kong and Australia. Leadership style was measured by the Leader
Behavior Descriptive Questionnaire (LBDQ) (Stogdill, 1974), and job satisfaction was
measured by the Warr job satisfaction questionnaire (Warr et al, 1979). Hierarchical
regression analysis revealed that level of education was a significant predictor of job
satisfaction, (β = -.16, p < .01), indicating participants with higher levels of education
had lower levels of job satisfaction.
Gittell et al. (2008) studied the effect of relational coordination on nursing aide
job satisfaction and quality of life outcomes for nursing home residents. An 82-item
Likert-type questionnaire was administered in face-to-face interviews to 252 nursing
aides. The nursing aide questionnaire was available in English, Spanish, and Haitian
Creole according to the language preference of the nursing aide. Random effects linear
regression was used to analyze the relationship between relational coordination and
nursing aide job satisfaction with nursing aide (N = 231) as the unit of analysis, and
nursing home facility (N = 15) as the random effect. The control variables were nursing
aide age, tenure, gender, language, and education. Nursing aide level of education was
not a significant predictor of nursing aide job satisfaction.
Summary of Follower’s Education and Job Satisfaction
Results of research have been mixed on followers’ education and job satisfaction.
Lok and Crawford (2003) and Ng et al. (2005) found followers’ educational level to be a

74
significant predictor of job satisfaction. The Ng and Feldman (2010) meta-analysis of age
and job attitudes revealed a significant moderating effect of college education on job
satisfaction. Gittell et al. (2008) did not find followers’ educational level to be a
significant predictor of job satisfaction.
Follower’s Organizational Level and Job Satisfaction
Salyadain (1977) studied the effect of organizational level on job satisfaction
among 84 employees from four organizational levels within a research and teaching
organization in India. The lowest level was Class Four Employees (CFEs) followed in
increasing organizational level by Lower Division Clerks (LDCs), Upper Division Clerks
(UPCs), and Stenographers (STGs). Job satisfaction was measured by the 13-item Porter
Need Satisfaction Questionnaire (PNSQ) (Porter, 1961) which measures a Maslow-type
needs hierarchy of security, social needs, esteem, autonomy, and self-actualization. The
Job Satisfaction Index (JSI) (Brayfield & Rothe, 1951) was also administered to the
participants. The correlation between the PNSQ and the JSI was r = .80, p < .05. One-
way analysis of variance (ANOVA) revealed significant mean differences between
organizational levels for esteem (F(3,80) = 3.52, p < .05), autonomy (F(3,80) = 4.78,
p < .01), and self-actualization (F(3,80) = 6.54, p < .01). A comparison of means on these
segments of the PNSQ between organizational levels indicated a general trend of the
higher the organizational level the higher the level of job satisfaction as measured by the
PNSQ.
In the original field test for Laub’s (1999) development of the Organizational
Leadership Assessment (OLA) a six-item job satisfaction scale was included. “A
significant (p < .01) negative relationship of -.234 existed between position and job

75
satisfaction” (p. 74). The positions were listed from highest to lowest indicating the
higher the position, the higher the job satisfaction level.
Jordan (2015) studied the relationship between servant leadership and job
satisfaction. He administered the Organizational Leadership Assessment (OLA) (Laub,
1999) and the Minnesota Satisfaction Questionnaire (MSQ) (Weiss et al., 1967) to 140
active duty and reserve members of a U. S. Navy Reserve organization. Demographic
information was obtained on the participants’ gender, tenure, and rank. Analysis of
Covariance (ANCOVA) was conducted to control for rank. Rank was a significant
covariate, F(3,136) = 7.545, p = .000. Analysis of variance (ANOVA) and Bonferroni
post-hoc analysis did not reveal a significant difference between ranks on job satisfaction.
Summary of Follower’s Organizational Level and Job Satisfaction
Researchers have found mixed results in followers’ level of job satisfaction based
on organizational level. Salyadain (1977) and Laub (1999) found that job satisfaction
increased with increasing organizational level. Jordan (2015) did not find significant
differences in job satisfaction between organizational levels.
Perception of Servant Leadership and Follower’s Job Satisfaction
Laub (1999) developed the Organizational Leadership Assessment (OLA) for his
doctoral dissertation. It contains a servant leadership scale and a job satisfaction scale.
The OLA was field tested among 828 participants from 40 organizations in the United
States and one organization in the Netherlands. His research indicated a correlation of
r = .634, p < .01 between the servant leadership scale and the job satisfaction scale of the
OLA.

76
Thompson (2002) administered the Organizational Leadership Assessment (OLA)
(Laub, 1999) and the Minnesota Satisfaction Questionnaire (MSQ) (Weiss et al., 1967) to
a sample of 116 staff members from the Academic Affairs and Student Services
department of a church-related college in the United States. The results of a Pearson
correlation between the servant leadership scale of the OLA and the MSQ were as
follows: r = .704, p < .01, two-tailed.
Drury (2004) studied the relationship between servant leadership and job
satisfaction at a non-traditional college in the U. S. The servant leadership scale and the
job satisfaction scale of the Organization Leadership Assessment (OLA) (Laub, 1999)
were administered to 170 staff members. There was a strong positive correlation between
servant leadership and job satisfaction (r = .631, p = .000, two-tailed).
Irving (2004) studied the relationship between servant leadership and the
effectiveness of teams within churches, non-profits, and businesses in the U. S. He
administered the servant leadership scale and the job satisfaction scale of the
Organization Leadership Assessment (OLA) (Laub, 1999) to 202 participants. He found a
strong positive correlation between servant leadership and job satisfaction (r = .625,
p = .000).
Anderson (2005) studied the relationship between perception of servant
leadership and job satisfaction among employees of the Church Educational System of
the Church of Jesus Christ of Latter Day Saints. She administered the Organizational
Leadership Assessment (OLA) (Laub, 1999) to 145 administrators and 285 teachers. The
OLA contains both a servant leadership scale and a job satisfaction scale. Rather than
employ a single composite score for the servant leadership scale, she chose to conduct

77
Pearson correlations between the six highly correlated subscales of the servant leadership
scale of the OLA with the job satisfaction scale. This resulted in correlations between
perception of servant leadership and job satisfaction for administrators ranging from
r = .521 to r = .616 for the various servant leadership subscales of the OLA, and between
r = .634 to r = .718 for teachers at the p < .01 level.
Cerit (2009) examined the effect of servant leadership behaviors of 29 primary
school principals on the level of job satisfaction of 595 teachers in Turkey. The
Organizational Leadership Assessment (OLA) (Laub, 1999) was used to measure servant
leadership, and the job satisfaction scale of A. Mohrman, Cooke, S. Mohrman, Duncan,
and Zaltman (1977) was used to measure job satisfaction. Regression analysis indicated
that servant leadership behavior of primary school principals was a significant predictor
of job satisfaction among teachers accounting for 58.3% of the variance (R = .764;
R2 = .583; F(593) = 829.446; p < .01).
Van Dierendonck & Nuijten (2011) developed the Servant Leadership Survey
(SLS) through analysis of a sample of 1571 participants from the Netherlands and the
UK. As part of their exploration of the criterion-related validity of the SLS, they
conducted a study of a sample of 362 participants of the correlation between the SLS and
job satisfaction, as measured by questions adapted from the Michigan Organizational
Assessment Questionnaire (Cammann, Fichman, Jenkins, & Klesh, 1979) related to
global job satisfaction, and satisfaction with leadership, management in general, work
environment, and coworkers. Significant correlations between seven of the eight
dimensions of the SLS and job satisfaction ranged from r = .20 (p < .01) for the
dimension of forgiveness to r = .62 (p < .05) for the dimension of empowerment.
78
Zimmerer (2013) studied the relationship between levels of servant leadership
perception among three generational cohorts and their levels of job satisfaction. She
administered the Servant Leadership Survey (SLS) (van Dierendonck & Nuitjen, 2011),
the Abridged Job in General Index (aJIG) (Russell et al., 2004), and the Abridged Job
Descriptive Scale (aJDI) (Stanton et al., 2001) to 150 Baby Boomers, 151 GenXers, and
151 GenYers. For Baby Boomers, the correlation between scores on the SLS and the
aJDI was (r = .62, p < .01, two-tailed) and between the SLS and the aJIG was (r = .49,
p < .01, two-tailed). For GenExers, the correlation between scores on the SLS and the
aJDI was (r = .56, p < .01, two-tailed) and between the SLS and the aJIG was (r = .30,
p < .01, two-tailed). For GenYers, the correlation between scores on the SLS and the
aJDI was (r = .66, p < .01, two-tailed) and between the SLS and the aJIG was (r = .61,
p < .01, two-tailed).
Jordan (2015) studied the relationship between servant leadership and job
satisfaction among U. S. Navy personnel. The Organizational Leadership Assessment
(OLA) (Laub, 1999) and the Minnesota Satisfaction Questionnaire (MSQ) (Weiss et al.,
1967) were administered to 140 active duty and reserve members of a U. S. Navy
Reserve organization. There was a strong positive correlation between servant leadership
and overall job satisfaction (r = .725, p < .0005, two-tailed).
Summary of Perception of Servant Leadership and Follower’s Job Satisfaction
Studies have indicated a significant relationship between Servant Leadership and
Job Satisfaction. The original research for the development of the Organizational
Leadership Assessment (OLA) (Laub, 1999) and subsequent studies (Drury, 2004; Irving,
2004; Anderson, 2005) have indicated a strong positive correlation between the servant

79
leadership and job satisfaction scales of the OLA. Subsequent research has indicated a
strong positive correlation between the servant leadership scale of the OLA and other
measures of job satisfaction (Thompson, 2002; Cerit, 2009; Jordan, 2015). Other
measures of servant leadership besides the OLA have shown a strong positive correlation
with measures of job satisfaction (Van Dierendonck & Nuijten, 2011; Zimmerer, 2013).
Leadership and Job Satisfaction
Ng et al. (2005) conducted a meta-analysis on predictors of objective and
subjective career success. Predictors included organizational sponsorship as defined by
career sponsorship, supervisor support, training and skill development opportunities, and
organizational resources. Subjective career success was defined as career satisfaction.
Their analysis revealed a significant positive correlation between career sponsorship and
career satisfaction (N = 6,255, k = 18, rc = .44); between supervisor support and career
satisfaction (N = 1,653, k = 6, rc = .46); and between training and skill development
opportunities and career satisfaction (N = 5,048, k = 18, rc = .38).
Kooij et al. (2010) conducted a meta-analysis of 83 studies on the influence of age
on the association between high commitment HR practices and affective commitment and
job satisfaction. High commitment HR practices included internal promotion, training,
job enrichment, job security, rewards, participation, information sharing, teamwork,
work-life policies, flexible work schedules, staffing, and performance management.
There was a positive correlation between all HR practices and job satisfaction
(N = 37,261, k = 56, rc = .34).
Yousef (2000) studied the mediator role of organizational commitment between
leadership behavior and job satisfaction and performance in the United Arab Emirates.

80
Leadership behavior of superiors as perceived by respondents was measured by the Likert
(1967) leadership questionnaire. Job satisfaction was measured by a single question on a
7-point Likert scale that inquired about a participant’s overall job satisfaction. A random
sample of 600 employees from 30 organizations received the survey instrument of which
430 returned usable surveys. There was a significant positive correlation between
leadership behavior and job satisfaction (r = .40, p < .01).
Lok and Crawford (2003) studied the effect of organizational culture and
leadership style on job satisfaction and organizational commitment on a sample of 337
managers from Hong Kong and Australia. Leadership style was measured by the Leader
Behavior Descriptive Questionnaire (LBDQ) (Stogdill, 1974), and job satisfaction was
measured by the Warr job satisfaction questionnaire (Warr et al., 1979). There was a
positive correlation between consideration and job satisfaction (r = .50, p < .01) and a
negative correlation between initiating structure and job satisfaction (r = -.35, p < .01).
Summary of Leadership and Job Satisfaction
Previous studies have indicated a significant relationship between leadership style
and followers’ job satisfaction (Yousef, 2000; Lok & Crawford, 2003). The Ng et al.
(2005) meta-analysis revealed a significant positive correlation between career
sponsorship, supervisor support, training and skill development opportunities, and
followers’ career satisfaction. In the Kooij et al. (2010) meta-analysis, there was a
positive correlation between the high commitment HR practices of internal promotion,
training, job enrichment, job security, rewards, participation, information sharing,
teamwork, work-life policies, flexible work schedules, staffing, and performance
management, and followers’ job satisfaction.

81
CHAPTER THREE: METHODOLOGY
Overview
The purpose of this research has been to study differences among members of
four generations in their composite scores on the servant leadership scale, and their
composite scores on the job satisfaction scale of the Organizational Leadership
Assessment (OLA) (Laub, 1999) when controlling for language, tenure, gender,
education, and organizational level. This study also looked at the relationship between
scores on the servant leadership scale and scores on the job satisfaction scale of the OLA
when controlling for generational cohort, language, tenure, gender, education, and
organizational level. This chapter provides details of the sampling plan, instruments used
to measure the variables, operational definitions, research design, null hypotheses,
procedures, data collection and analysis, and ethical considerations.
Sampling Plan
A convenience sample was recruited from the board and staff of World Radio
Network, Inc. and Rio Grande Bible Ministries (and also from the students of Rio Grande
Bible Ministries) by electronic means. After giving informed consent by electronic
means, participants provided information by online survey regarding date of birth, tenure
with the organization, gender, education, and organizational level. Participants took the
online version of the Organizational Leadership Assessment (OLA) (Laub, 1999).
Language was determined by the language the participant selected to take the
Organizational Leadership Assessment (OLA) (Laub, 1999).

82
Research Study Instruments
Demographic Survey – The demographic survey asked for the following information:
1. Year of birth _____
2. Years with organization (regardless of category, organizational level, or
interruption of service) _____
3. Gender: Male ___ Female ___
4. Level of education
a. Less than High School_____
b. High School Diploma or Equivalent____
c. Bachelor’s Degree_____
d. Graduate or Professional Degree____
Organizational Leadership Assessment (OLA)
The Organizational Leadership Assessment (OLA) (Laub, 1999) is a 66-item,
5-point Likert scale format instrument that includes a 60-item servant leadership scale
and a 6-item job satisfaction scale. Dr. James Laub developed the OLA as part of his
doctoral research to assess organizational health. This in turn “produced a comprehensive
model of servant leadership applied to organizational life” (OLAgroup, 2017, OLA
section, Development subsection, para.1).
The Organizational Leadership Assessment (OLA) was established through a
Delphi Survey process involving experts in the field of servant leadership. In the course
of the 3-part Delphi process the experts arrived at a consensus on the characteristics of
the servant organization. The process identified the following dimensions and
characteristics:

83
Displays Authenticity through
• trust
• integrity
• accountability
• openness
• willingness to learn from others
Values People through
• receptive listening
• trusting others
• serving the needs of others first
Develops People through
• providing opportunities to learn
• encouraging and building up others
• modeling appropriate behaviors
Builds Community through
• collaborative effort
• valuing differences within the community
• developing strong relationships
Provides Leadership through
• clarifying goals
• taking the initiative
• giving a vision of the future
Shares Leadership through
84
• empowering others to make decisions
• according worth and privileges to all
• developing a shared vision (Laub, 1999; OLAGroup, 2017)
The above dimensions and characteristics were used to write the 60 items that make up
the servant leadership scale of the Organizational Leadership Assessment (OLA) (Laub,
1999). The OLA was designed to be taken by all organizational levels within an
institution to include Top Leadership, Managers/Administrator, and Workforce
(OLAgroup, 2017).
The OLA was field tested with 41 organizations representing 828 participants.
The research revealed that these six dimensions listed above were highly correlated with
each other. Only the composite score for the 60-item servant leadership scale and
composite score for the 6-item job satisfaction scale of the OLA should be used for
research purposes (Laub, 1999; OLAgroup, 2017).
The original field test of the OLA revealed a reliability score of .9802 using the
Cronbach’s alpha coefficient. In the same original field test, the lowest item-to-item
correlation was .41 and the highest was .77, indicating that all of the items have a strong
correlation with the entire instrument. Horsman (2001) determined a Cronbach’s alpha
coefficient of .9870 for the OLA. Ledbetter’s study (2003) also closely approximated the
original research in that the Cronbach’s alpha coefficient was .9814 for the overall
instrument, and the lowest item-to-item correlation was .44 and the highest was .78. The
job satisfaction scale of the OLA revealed a Cronbach’s alpha of .81 in the original field
test (Laub, 1999).

85
Ledbetter (2003) investigated test-retest reliability of the OLA in which means
and standard deviations between the Test and the Retest remained consistent when
administered two weeks apart. For this portion of his study, 138 participants from 12
police agencies in 7 states of the US took part in the study. The group mean for the first
test out of a total possible score of 300 was M = 210.52, SD = 39.16. For the retest the
group mean was M = 214.80, SD = 36.76 (Ledbetter, 2003).
Irving and McIntosh (2007) evaluated the Spanish version of the Organizational
Leadership Assessment (OLA) (Laub, 1999). A Cronbach’s alpha of .9862 (N = 60) was
obtained for the servant leadership scale of the Spanish language OLA. A Cronbach’s
alpha of .8715 (N = 78) was obtained for the job satisfaction scale of the Spanish
language OLA. These reliability coefficients were comparable to the original field test of
the OLA which resulted in a Cronbach’s alpha of .9802 for the servant leadership scale
and a Cronbach’s alpha of .81 for the job satisfaction scale (Laub, 1999).
Construct validity was established in the development phase of the Organizational
Leadership Assessment (OLA) for Laub’s (1999) original research through a three-stage
Delphi process involving a panel of experts in the field of servant leadership. This
determined the characteristics of servant leadership that became the 60 items of the
servant leadership scale. Face validity was determined in the development phase
involving over 100 adult graduate students as to the accuracy of the descriptors of the six
dimensions of servant leadership in the Laub (1999) model. There was consistency of
perception of accuracy across full-page descriptions of all six dimensions of the model
(Laub, 1999; OLAGroup, 2017).

86
Thompson (2002) conducted a Pearson’s r correlation between the job
satisfaction scale of the OLA and the Minnesota Satisfaction Questionnaire (MSQ)
(Weiss et al., 1967). There was a significant positive correlation between the two
instruments (r (114) = .721, p < .01, two-tailed). This is indicative of strong concurrent
validity between the two measures of job satisfaction (Thompson, 2002).
The present study obtained the following Cronbach's alpha reliability statistics
found in Table 1 below:
Table 1
Present study’s reliability statistics for Organizational Leadership Assessment (OLA)
Servant Leadership Scale Cronbach's alpha N of Items
.987 60
Job Satisfaction Scale Cronbach's alpha N of Items
.865 6
Operational Definitions for Independent Variables
Generation - self report and assignment by birth year to one of the following
generations (Sessa, Kabacoff, Deal, & Brown, 2007):
a. Mature Generation (born 1925-1945)
b. Baby Boomers (born 1946-1963)
c. Generation X (born 1964-1982)
d. Millennials (born 1983-onward)

87
Operational Definitions for Control Variables
1. Language - English or Spanish - in which the respondent chooses to take the
Organizational Leadership Assessment (OLA) (Laub, 1999)
2. Tenure - years with the organization regardless of multiple categories (volunteer,
employee, board member, etc.) or interruptions of service
3. Gender - male or female
4. Education - Level of education completed
a. Less than High School Diploma
b. High School Diploma or Equivalent
c. Bachelor’s Degree
d. Graduate or Professional Degree
5. Organizational Level (Laub, 1999)
a. Top Leadership (top level of leadership)
b. Management (supervisor, manager)
c. Workforce (staff member, worker)
Operational Definitions for Dependent Variables
6. Servant Leadership - composite score on the servant leadership scale of the
Organizational Leadership Assessment (OLA) (Laub, 1999)
7. Job Satisfaction - composite score on the job satisfaction scale of the
Organizational Leadership Assessment (OLA) (Laub, 1999)

88
Research Design
This was a non-experimental descriptive research design. The respondents’
generation as a categorical independent variable was compared with composite scores on
the servant leadership scale and the job satisfaction scale of the OLA as dependent
variables, controlling for language, tenure, gender, education, and organizational level
employing factorial analysis of covariance (ANCOVA) methodology. Separate
ANCOVAs were conducted for generational differences on the servant leadership scale
of the OLA, and on generational differences on the job satisfaction scale of the OLA.
Analysis of covariance (ANCOVA) was employed to control for the effect of the
continuous variable of tenure on the relationship between the categorical variable of
generational cohort and scores on the servant leadership and job satisfaction scales of the
OLA, as well as to control for effect of the variables of language, gender, education, and
organizational level on the relationship between the categorical variable of generational
cohort and scores on the servant leadership and job satisfaction scales of the OLA.
ANCOVAs were analyzed for any main effect of generational cohort or control variables
on the dependent variables of servant leadership scores and job satisfaction scores of the
OLA, as well as any interactions between generational cohort and the control variables on
the dependent variables of servant leadership scores and job satisfaction scores of the
OLA. Pearson’s r correlations, t-tests, and analyses of variance (ANOVAs) were
conducted as appropriate.
In addition, multiple regression analysis was used to analyze composite scores on
the servant leadership scale of the OLA as a predictor of composite scores on the job
satisfaction scale of the OLA. The demographic variables of generational cohort,

89
language, tenure, gender, education, and organizational level were entered as control
variables into the hierarchical regression analysis. R2, Δ R2, βeta weights, and partial
correlations were conducted for the regression analysis. Pearson’s r correlations, t-tests,
and ANOVAs were conducted as appropriate.
Null Hypotheses
H01: There are no differences in scores on the servant leadership scale of the
Organizational Leadership Assessment (OLA) (Laub, 1999) by generational cohort when
controlling for language, tenure, gender, education, and organizational level.
H02: There are no differences in scores on the job satisfaction scale of the
Organizational Leadership Assessment (OLA) (Laub, 1999) by generational cohort when
controlling for language, tenure, gender, education, and organizational level.
H03: There is no relationship between scores on the servant leadership scale of the
Organizational Leadership Assessment (OLA) (Laub, 1999) and scores on the job
satisfaction scale of the Organizational Leadership Assessment (OLA) (Laub, 1999)
when controlling for generational cohort, language, tenure, gender, education, and
organizational level.
Procedure
The study sample was drawn from the board and staff of the World Radio
Network, Inc., and Rio Grande Bible Ministries which represented populations of
approximately 200 and 700 individuals respectively. The presidents of both organizations
had given permission to conduct the study within their respective organizations and had
given access to staff contact information. Permission was obtained from the OLAGroup
to use the Organizational Leadership Assessment (OLA) (Laub, 1999) for this research.

90
After appropriate approvals were received from the principal researcher’s dissertation
committee and the Institutional Review Board (IRB) of Our Lady of the Lake University,
recruitment of the study populations was conducted by electronic means.
A convenience sample was recruited by electronic means from both the World
Radio Network, Inc., and Rio Grande Bible Ministries through access to staff contact
information, and the electronic and print resources of both organizations. All the
participants took the demographic survey and Organizational Leadership Assessment
(OLA) (Laub, 1999) online after having been recruited electronically by the principal
investigator. They were provided an electronic version of the recruitment/informed
consent message which served as their copy. Once they had read those, they were
allowed to proceed to the OLA website to take the survey. At that point they indicated
that they had given informed consent before proceeding to take the demographic survey
and the OLA as described in the Sampling Plan above. Data were collected during the
months of April, May, June, and July of 2016.
Participants age 18 or over took part in this study. After they read the informed
consent form attached to the electronic recruitment message, and decided to participate in
this study, they were asked to go to the following website: http://www.olagroup.com.
They typed in the username and pin that pertained to their organization. They selected
"Take the OLA" at the upper right of the screen. They chose the "Standard Version."
They selected the language - English or Spanish - with which they were most
comfortable. They found (a) a demographic survey that asked if they had read the
informed consent document and were in agreement; their year of birth (for assignment to
the appropriate generational cohort); their number of years with the organization

91
(regardless of staff category, organizational level, or interruption of service); their
gender; and their level of education (b) instructions for taking the Organizational
Leadership Assessment (OLA) (Laub, 1999) which included asking for their
organizational level - top leadership/board member; supervisor/manager; or
staff/member/worker/student/volunteer. It took the participants about 30 minutes to read
the informed consent form, take the demographic survey, and the Organizational
Leadership Assessment (OLA) (Laub, 1999).
Data Collection and Analysis
The administration of the Organizational Leadership Assessment (OLA) (Laub,
1999) was coordinated with Dr. James Laub of OLA group to set up each of the
organizations being studied on the www.olagroup.com site. Access codes and directions
for taking the OLA were provided to those participating in the study. Dr. Laub provided
access to the site to the principal investigator in order to monitor the progress of each
organization taking the OLA. Once all assessments were completed by the research
participants, Dr. Laub provided:
1) an OLA report for each organization in pdf. format, as well as
2) a copy of the raw data in MicroSoft Excel format. These were transferred from
the Excel file into SPSS for data analysis.
Descriptive statistics were determined from the raw data derived from the
demographic survey and the servant leadership and job satisfaction scales of the
Organizational Leadership Assessment OLA from the respondents. Those statistics
included the following: distribution of respondents by generational cohort; by tenure; by
language of response (English or Spanish); by gender; by educational level; and by

92
organizational level. Distribution of composite scores for the servant leadership and job
satisfaction scales of the OLA were calculated. The categorical variables of generational
cohort, language, gender, educational level, and organizational level were dummy-coded.
Range, mean, standard deviation, and skewness for the continuous variable of tenure, and
for the servant leadership and job satisfaction scales of the OLA were calculated.
Pearson’s r correlations of the continuous variable of tenure with the composite
servant leadership scale scores and with the job satisfaction scale scores of the OLA were
calculated. A Pearson’s r correlation of the composite servant leadership scale scores
with the job satisfaction scale scores of the OLA was also calculated. A t-test was
calculated for response by language to composite scores of the servant leadership and job
satisfaction scales of the OLA. A confidence level of p < .05 was established for all
inferential statistical calculations.
Ethical Considerations
Approval was obtained from the World Radio Network, Inc. president, and the
Rio Grande Bible Ministries president to recruit participants from their respective
organizations. Dr. James Laub of the OLAgroup gave permission to use the
Organizational Leadership Assessment (OLA) (Laub, 1999) for research purposes. The
principal investigator’s dissertation committee and the Institutional Review Board of Our
Lady of the Lake University gave permission to conduct the research. Informed consent
was obtained from the participants. In order to preserve anonymity, all participants from
each organization used the same organizational code and pin for their respective
organization to take the demographic survey and the Organizational Leadership
Assessment (OLA) (Laub, 1999). Only the principal investigator and the co-investigators

93
– Dr. Baggerly-Hinojosa, Dr. Wheeler, and Dr. Sun - had access to the data. The data was
downloaded onto the researcher’s and/or the co-investigators’ computer for analysis. The
data was deleted by the researcher after the analysis was complete. Reasonable
precautions were taken to preserve the anonymity of the study data. The participants were
identified only by number. The raw data from the demographic survey and the
Organizational Leadership Assessment (OLA) were kept in locked premises, and only the
researcher and co-investigators had access to the data.

94
CHAPTER FOUR: RESULTS
Overview
The purpose of this research was to study differences among members of four
generations in their composite scores on the servant leadership scale, and their composite
scores on the job satisfaction scale of the Organizational Leadership Assessment (OLA)
(Laub, 1999) when controlling for language, tenure, gender, education, and
organizational level. The researcher also looked at scores on the servant leadership scale
as a predictor of scores on the job satisfaction scale of the OLA when controlling for
generational cohort, language, tenure, gender, education, and organizational level. This
chapter provides an analysis of the data, statistical analysis of the demographic, predictor
and criterion variables, and covariate; the null hypotheses, and results of the analyses.
Data Collected
Participants were recruited from two religious non-profit organizations along the
US/Mexico border. The first group of participants was from the board and staff
(comprised of missionaries, employees, and volunteers) of World Radio Network, Inc.
representing approximately 200 individuals (Personal communication, Dr. A. Limon,
December 1, 2015). The second group of participants was from the board and staff
(comprised of missionaries, employees, and volunteers) of Rio Grande Bible Ministries,
and also from the students of Rio Grande Bible Ministries, representing approximately
700 individuals (Personal communication, Dr. L. Windle, December 1, 2015). A
convenience sample was recruited by mass email to the respective organizations.
Participants were given a description of the study in detail, an electronic informed
consent form, and a link to the online survey. The researcher had been informed by both

95
organizations that due to many volunteer staff members it was not possible to know if all
volunteer staff members had access to email or if each email address represented one or
more volunteer staff members in cases where one or more members of a family
volunteered. Thus, estimates of response rates for each organization are approximate.
From World Radio Network, Inc., the response rate was 87 participants out of
approximately 200 potential participants or 43.5%. From Rio Grande Bible Ministries the
response rate was 65 participants out of approximately 700 potential participants or 9.3%.
The combined response rate was 152 participants out of approximately 900 potential
participants or 16.9%.

96
Descriptive Statistics
Participants’ Demographic Variables
Table 2
Language Comparison ____________________________
N Percent
English 114 75.0
Spanish 38 25.0
Total 152 100.0
Figure 4 illustrates the language comparison of English speaking and Spanish
speaking participants. The language distribution resulted in 75% (n = 114) English
speakers, and 25% (n = 38) Spanish speakers.
Figure 4. Language comparison of participants
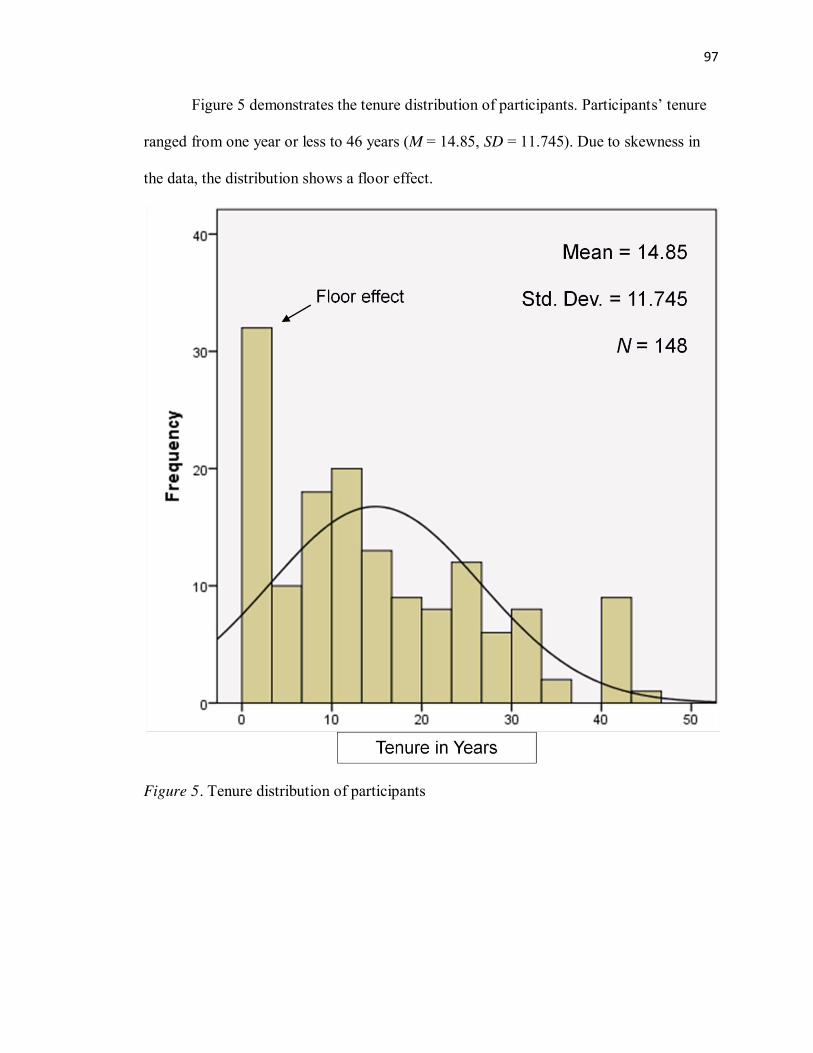
97
Figure 5 demonstrates the tenure distribution of participants. Participants’ tenure
ranged from one year or less to 46 years (M = 14.85, SD = 11.745). Due to skewness in
the data, the distribution shows a floor effect.
Figure 5. Tenure distribution of participants

98
Table 3
Gender Comparison ____________________________
N Percent
Male 74 49.0
Female 77 51.0
Total 151 100.0
Figure 6 illustrates the gender comparison of male and female participants. The
language distribution resulted in 49% (n = 74) male, and 51% (n = 77) female.
Figure 6. Gender comparison of participants

99
Table 4
Participants’ Education ____________________________
N Percent
High School 40 26.3
Bachelors 57 37.5
Graduate/ Professional 55 36.2 Total 152 100.0
Figure 7 illustrates the education of participants. The education distribution
resulted in 26.3% (n = 40) with high school diploma or equivalent, 37.5% (n = 57) with
bachelors degree, and 36.2% (n = 55) with graduate or professional degree.
Figure 7. Education of participants

100
Table 5
Participants’ Organizational Level ____________________________
N Percent
Top Leadership 20 13.2
Management 26 17.1
Workforce 106 69.7 Total 152 100.0
Figure 8 illustrates the organizational level of participants. The organizational
level distribution resulted in 13.2% (n = 20) in top leadership, 17.1% (n = 26) in
management, and 69.7% (n = 106) in the workforce.
Organizational Level
Figure 8. Organizational level of participants

101
Table 6
Participants’ Generational Cohort ____________________________
N Percent
Mature Generation 34 22.5
Baby Boomers 57 37.7
Generation X 39 25.8
Millennials 21 13.9 Total 151 100.0
Figure 9 illustrates the generational cohort of participants. The generational
cohort distribution resulted in 22.5% (n = 34) in the Mature Generation, 37.7% (n = 57)
Baby Boomers, 25.8% (n = 39) Generation X, and 13.9% (n = 21) Millennials.
Figure 9. Generational cohort of participants

102
Figure 10 demonstrates the distribution of participants’ scores on the servant
leadership scale of the Organizational Leadership Assessment (OLA) (Laub, 1999). The
mean and standard deviation for servant leadership scores were (M = 4.05, SD = .69).
Figure 10. Distribution of participants’ scores on the servant leadership scale of the OLA

103
Mean = 4.23
Std. Dev. = .662
N = 152
Figure 11 demonstrates the distribution of participants’ scores on the job
satisfaction scale of the Organizational Leadership Assessment (OLA) (Laub, 1999). The
mean and standard deviation for job satisfaction scores were (M = 4.23, SD = .662).
Figure 11. Distribution of participants’ scores on the job satisfaction scale of the OLA

104
Findings
Correlations
Pearson’s r correlations were calculated for the continuous variables of
participants’ tenure, and for scores on the servant leadership scale and the job satisfaction
scale of the Organizational Leadership Assessment (OLA) (Laub, 1999). There was a
significant negative relationship between participant tenure and scores on both the
servant leadership scale of the OLA (r = -.219, p < .01) and the job satisfaction scale of
the OLA (r = -.195, p < .01). There was a significant positive relationship between
participant scores on the servant leadership scale of the OLA and participant scores on
the job satisfaction scale of the OLA (r = .749, p < .01). Table 7 illustrates the significant
relationships between tenure, and scores on servant leadership and the job satisfaction
scales of the OLA. Probability level for the Pearson’s r correlations was set at the .05
level.
Table 7
Pearson Correlation Matrix
________________________________________________________________________ Job Satisfaction Tenure Servant Leadership Job Satisfaction
Tenure -.195**
Servant Leadership .749** -.219** ________________________________________________________________________ Note: Correlation Matrix for Tenure, Job Satisfaction, and Servant Leadership, **p < .01.

105
Null Hypothesis One: Generational Cohorts and Servant Leadership
H01: There are no differences in scores on the servant leadership scale of the
Organizational Leadership Assessment (OLA) by generational cohort when controlling
for language, tenure, gender, education, and organizational level.
Factorial analysis of covariance (ANCOVA) was employed to control for the
effect of the continuous variable of tenure on the relationship between the categorical
variable of generational cohort and scores on the servant leadership scale of the OLA, as
well as to control for effect of the variables of language, gender, education, and
organizational level on the relationship between the categorical variable of generational
cohort and scores on the servant leadership scale of the OLA. (See Table 8). The results
showed no significant main effect for Generational Cohort, F(3, 89) = 2.411, p = .072. As
a result there was a failure to reject H01. A significant interaction was found between
Generational Cohort and Gender, F(3, 89) = 2.802, p = .044. (See Figure 12).
Additionally the covariate of tenure was significant, F(1, 89) = 8.132, p = .005. Pearson r
correlation analysis revealed a significant negative relationship between participant
tenure and scores on the servant leadership scale of the OLA (r = -.219, p < .01). (See
Figure 13).

106
Table 8
Six-Way Analysis of Co-Variance on Servant Leadership ________________________________________________________________________ Source Type III Sum
of Squares df Mean
Squares F Sig.
Tenure (T) 3.472 1 3.472 8.132* 0.005 Generational Cohort (GC) 3.089 3 1.03 2.411 0.072 Language (L) 1.544 1 1.544 3.617 .060 Gender (G) .618 1 .618 1.447 .232 Education E) .225 2 .112 .263 .769 Organizational Level (OL) .219 2 .110 .257 .774 GC * L .833 2 .417 .976 .381 GC * G 3.589 3 1.196 2.802* .044 GC * E 2.336 6 .389 .912 .490 GC * OL 1.472 4 .368 .862 .490 L * G .685 1 .685 1.605 .208 L * E 1.046 2 .523 1.225 .299 L * OL .379 2 .189 .443 .643 G * E 1.332 2 .666 1.560 .216 G * OL .109 3 .054 .127 .881 E * OL .444 2 .148 .347 .792 GC * L * E .452 3 .226 .529 .591 GC * G * E 3.087 2 1.029 2.410 .072 GC * E * OL 1.764 0 .882 2.066 .133 GC * L * G * E * OL .000
Error 37.999 89 .427 Total 2469.122 146
Corrected Total 68.143 145

107
Figure 12: Interaction of Generational Cohort and Gender on Servant Leadership Scores

108
Figure 13: Scatterplot for Servant Leadership Scores and Tenure

109
Null Hypothesis Two: Generational Cohorts and Job Satisfaction
H02: There are no differences in scores on the job satisfaction scale of the
Organizational Leadership Assessment (OLA) by generational cohort when controlling
for language, tenure, gender, education, and organizational level.
Factorial analysis of covariance (ANCOVA) was employed to control for the
effect of the continuous variable of tenure on the relationship between the categorical
variable of generational cohort and scores on the job satisfaction scale of the OLA, as
well as to control for the effect of the variables of language, gender, education, and
organizational level on the relationship between the categorical variable of generational
cohort and scores on the servant leadership scale of the OLA. (See Table 9). The results
showed no significant main effect for Generational Cohort, F(3, 89) = 2.067, p = .110. As
a result there was a failure to reject H02. There was a significant main effect for
Language, F(1, 89) = 7.873, p = .006. Results of a t-test were as follows for mean
difference between English speakers and Spanish speakers on the job satisfaction scale of
the OLA: t(150) = -2.91, p = .004 (two-tailed), M (English) = 4.14, SD = .71 and
M (Spanish) = 4.50, SD = .41. A significant interaction was found between Generational
Cohort and Gender, F(3, 89) = 2.710, p = .050. (See Figure 14). Additionally the
covariate of tenure was significant, F(1, 89) = 6.957, p = .010. Pearson r correlation
analysis revealed a significant negative relationship between participant tenure and scores
on the job satisfaction scale of the OLA (r = -195, p < .01). (See also Figure 15).

110
Table 9
Six-Way Analysis of Co-Variance on Job Satisfaction ________________________________________________________________________ Source Type III
Sum of Squares
df Mean Squares F Sig.
Tenure (T) 2.595 1 2.595 6.957* 0.01
Generational Cohort (GC) 2.313 3 2.067 2.067 0.11 Language (L) 2.937 1 2.937 7.873* .006 Gender (G) .039 1 .039 .104 .748 Education E) .025 2 .012 .033 .967 Organizational Level (OL) .721 2 .361 .967 .384 GC * L 1.636 2 .818 2.193 .118 GC * G 3.033 3 1.011 2.710* .050 GC * E 1.167 6 .195 .522 .791 GC * OL 1.200 4 .300 .804 .526 L * G .000 1 .000 .000 .985 L * E .048 2 .024 .064 .938 L * OL .608 2 .304 .815 .446 G * E .161 2 .081 .216 .806 G * OL .213 2 .106 .285 .753 E * OL 1.233 3 .411 1.102 .353 GC * L * E .439 2 .219 .588 .558 GC * G * E 3.842 3 1.281 3.433 .020 GC * E * OL 2.127 2 1.064 2.851 .063 GC * L * G * E * OL .000
Error 33.199 89 .373 Total 2691.972 146
Corrected Total 60.511 145
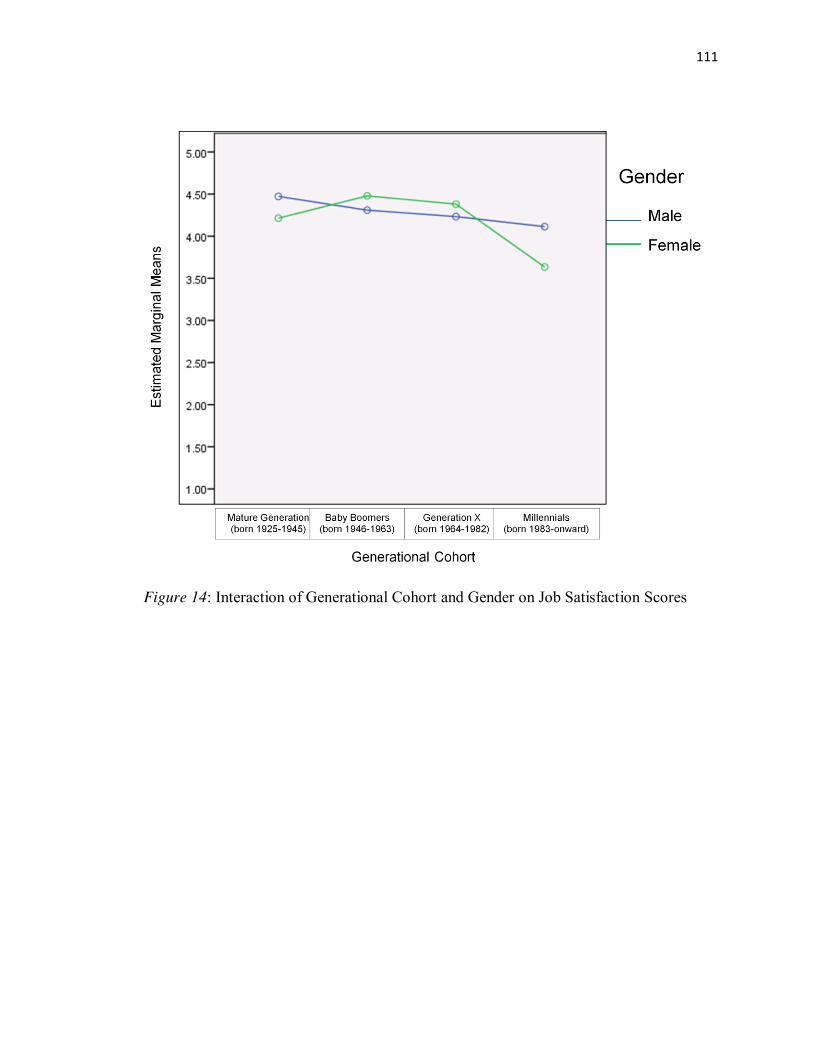
111
Figure 14: Interaction of Generational Cohort and Gender on Job Satisfaction Scores

112
Figure 15: Scatterplot for Job Satisfaction Scores and Tenure

113
Null Hypothesis Three: Servant Leadership and Job Satisfaction
H03: There is no relationship between scores on the servant leadership scale and
scores on the job satisfaction scale of the Organizational Leadership Assessment (OLA)
when controlling for generational cohort, language, tenure, gender, education, and
organizational level.
Multiple regression analysis was used to predict the relationship between
participants’ scores on the servant leadership scale of the OLA and participants’ scores
on the job satisfaction scale of the OLA beyond the impact of generational cohort,
language, tenure, gender, education, and organizational level. Model 1 of the model
summary table (Table 10) shows that Language was the only demographic variable to
predict job satisfaction scores on the OLA (R 2 = .045, p = .010). Results of a t-test for
language and job satisfaction scores were as follows: t(150) = -2.91, p = .004 (two-
tailed), M (English) = 4.14, SD = .71 and M (Spanish) = 4.50, SD = .41; and for language
and servant leadership scores on the OLA as follows: t(150) = -2.22, p = .028 (two-
tailed), M (English) = 3.98, SD = .73 and M (Spanish) = 4.26, SD = .49. Model 2
demonstrates that servant leadership scores on the OLA are a predictor of job satisfaction
scores on the OLA and account for an additional 52.6% of the variance (Δ R 2 = .526,
β = .734, rp = .742, p = .000). (See also Figure 16). As language and servant leadership
scores on the OLA have been shown to be significant predictors of job satisfaction scores
on the OLA, H03 was rejected.

114
Table 10: Model summary of Multiple Regression – Job Satisfaction ________________________________________________________________________
Model R R Square R Square Change
F Change
βeta rp df1 df2 Sig. F
Change
1 .212a .045
6.838
1 146 .010
2 .755b .570 .526 177.318 .734 .742 1 145 .000
Note: (a) Language, (b) Servant Leadership
Figure 16: Scatterplot for Servant Leadership and Job Satisfaction Scores

115
CHAPTER FIVE – DISCUSSION AND CONCLUSION
Summary
This chapter will discuss findings of the ratings by generational cohort of board
and staff members of two religious non-profit organizations along the US/Mexico border
of his or her servant organizational leadership as well as his or her job satisfaction. Only
the Zimmerer (2013) study so far has looked at generational differences in followers’
perception of servant leadership. Other studies have looked at generational differences in
job satisfaction with mixed results (Costanza et al., 2012; Hansen & Leuty, 2012;
Zimmerer, 2013). Although Zimmerer (2013) employed different instruments to measure
perception of servant leadership and job satisfaction, as in the case of this study, she did
not find significant differences between the generations in perception of servant
leadership or job satisfaction. For differences or relationships of the demographic
variables of language, tenure, gender, education, and organizational level with followers
perception of servant leadership and job satisfaction, the results have been mixed with the
exception of language and gender and followers’ perception of servant leadership.
Previous studies have not revealed differences in followers’ perception of servant
leadership by language or gender. This study found significant differences in followers’
perception of servant leadership by language and a significant interaction between
generational cohort and gender in the presence of the significant covariate of tenure in
followers’ perception of servant leadership. Several studies have reported a significant
positive correlation between followers’ perception of servant leadership and job
satisfaction (Laub, 1999; Thompson, 2002; Drury, 2004; Irving, 2004; Anderson, 2005;
Cerit, 2009; Van Dierendonck & Nuitjen, 2011; Zimmerer, 2013; Jordan, 2015). The

116
literature review did not reveal previous studies that had controlled for demographic
variables in the relationship between followers’ perception of servant leadership and job
satisfaction. Thus, this study has employed multiple regression analysis in looking at the
relationship between followers’ perception of servant leadership and job satisfaction
while controlling for generational cohort, language, tenure, gender, education, and
organizational level. The following sections discuss the findings of this study as well as
its implications, limitations, and recommendations for future research.
Discussion of Findings
This study employed factorial analysis of covariance (ANCOVA) to test
differences in scores on the servant leadership scale of the Organizational Leadership
Assessment (OLA) (Laub, 1999) by generational cohort when controlling for language,
tenure, gender, education, and organizational level (H01). While there was not a
significant main effect between generational cohort and scores on the servant leadership
scale of the OLA, there was a significant interaction between generational cohort and
gender: F(3, 89) = 2.802, p = .044. Tenure was also a significant covariate:
F(1, 89) = 8.132, p = .005. This suggests that in the presence of both gender and tenure,
there are some generational differences in followers’ perception of servant leadership.
For the oldest and youngest generation, men have a slightly higher perception of servant
leadership than women. For the middle two generations, women have a slightly higher
perception of servant leadership than men. (See Figure 12, p. 107).
Factorial analysis of covariance (ANCOVA) was also employed to test
differences in scores on the job satisfaction scale of the Organizational Leadership
Assessment (OLA) (Laub, 1999) by generational cohort when controlling for language,
117
tenure, gender, education, and organizational level (H02). Again, while there was not a
significant main effect between generational cohort and scores on the job satisfaction
scale of the OLA, there was a significant interaction between generational cohort and
gender: F(3, 89) = 2.710, p = .050. Again, tenure was a significant covariate:
F(1, 89) = 6.957, p = .010. This suggests that in the presence of both gender and tenure,
there are some generational differences in followers’ job satisfaction. For the oldest and
youngest generation, men have a slightly higher level of job satisfaction than women. For
the middle two generations, women have a slightly higher level of job satisfaction than
men. (See Figure 14, p. 111.) There was a significant main effect for Language:
F(1, 89) = 7.873, p = .006. The results of a t-test (t(150) = -2.91, p = .004) revealed that
English speakers had a lower mean score on the job satisfaction scale of the OLA
(M = 4.14) than Spanish speakers (M = 4.50).
To test the relationship between scores on the servant leadership scale and scores
on the job satisfaction scale of the Organizational Leadership Assessment (OLA) when
controlling for generational cohort, language, tenure, gender, education, and
organizational level, hierarchical multiple regression was employed to discover which
variables were predictors of scores on the job satisfaction scale of the OLA. Language
(R 2 = .045, p = .010) was discovered to be a significant predictor of scores on the job
satisfaction scale of the OLA. The results of a t-test (t(150) = -2.22, p = .004) revealed
that English speakers had a lower mean score on the servant leadership scale of the OLA
(M = 3.98) than Spanish speakers (M = 4.26). The results of a t-test (t(150) = -2.91,
p = .004) revealed that English speakers had a lower mean score on the job satisfaction
scale of the OLA (M = 4.14) than Spanish speakers (M = 4.50). Followers’ scores on the
118
servant leadership scale of the OLA were also a significant predictor of scores on the job
satisfaction scale of the OLA. Scores on the servant leadership scale of the OLA
accounted for 52.6% of the variance explained, with a standardized β = .734 and partial
correlation of rp = .742, indicating the higher the followers’ perception of servant
leadership, the higher the followers’ job satisfaction (p = .000).
Implications
This study revealed differences by followers’ language in perceptions of servant
leadership not previously described in the literature. Spanish speakers indicated a higher
perception of servant leadership and job satisfaction than English speakers. Language
differences in perception of servant leadership and job satisfaction could suggest the need
for differences in training based on language. This study also revealed an interaction of
followers’ generational cohort with gender in perceptions of servant leadership not
previously described in the literature. Interaction between generational cohort and gender
could suggest the need for differences in training based on generational cohort by gender.
Finally, this study revealed a negative relationship between follower’s tenure and
perception of servant leadership not previously described in the literature. Both
follower’s perception of servant leadership and follower’s level of job satisfaction
decreased with increasing tenure. Although follower performance was not measured in
this study, negative correlations between tenure and perception of servant leadership and
job satisfaction could suggest the need for increased awareness of job evaluation and
performance review with increasing tenure.

119
Limitations
This study failed to find a significant difference between followers’ generational
cohort and followers’ perception of servant leadership or job satisfaction, although it did
find a significant interaction in the presence of a significant covariate of tenure between
followers’ generational cohort and gender for both followers’ perception of servant
leadership and job satisfaction. Gender, education, and organizational level did not have a
significant main effect in the presence of the significant covariate of tenure on either
scores on the servant leadership scale or the job satisfaction scale of the OLA. While
tenure was a significant covariate for both generational differences in followers’
perception of servant leadership and job satisfaction, it was not a significant predictor of
job satisfaction in the multiple regression. Language was a significant predictor of job
satisfaction and had a significant main effect in the presence of the significant covariate
of tenure on scores on the job satisfaction scale of the OLA. However, language did not
have a significant main effect in the presence of the significant covariate of tenure on
scores on the servant leadership scale of the OLA. With the exception of followers’
language and gender, and perception of servant leadership, several previous studies have
discovered significant differences or relationships between followers’ language, tenure,
gender, education, and organizational level and perception of servant leadership. A
possible explanation for the failure to find significant differences or relationships for
several of the demographic variables could be the small sample size of this study
(N = 152) potentially limiting statistical power. The small sample size might have been
due in part to the study being limited to two religious non-profits on the US/Mexico
border. The larger of the two organizations is primarily an educational institution. The
120
resident population drops to about ten percent from mid-May to mid-August compared to
the rest of the year. Due to unavoidable delays, recruitment for the study did not begin
until the end of April and ended in early July of 2016.
Another limitation of this study was the skewness of the continuous variables of
servant leadership scores, job satisfaction scores, and especially tenure, which had a floor
effect. Due to range restriction, the correlations between the continuous variables could
have been underestimated. The fact that the servant leadership and job satisfaction scales
were obtained from the same instrument is a limitation. This study and previous studies
have found a strong positive correlation between the two scales. There could be a concern
that they measure the same rather than different constructs. Finally, the results of this
study can only be generalized to the population from which the sample was taken.
Recommendations for Future Research
Future research into generational differences in followers’ perception of servant
leadership and job satisfaction would benefit from a larger study sample. This researcher
had an interest in religious non-profits with high numbers of both English and Spanish
speakers. It would perhaps be possible to recruit a larger sample by electronic means
through one of the accrediting agencies to which many religious non-profits belong.
Other measures of servant leadership and job satisfaction besides the OLA (Laub, 1999)
could be employed to investigate followers’ generational differences. In this study, tenure
was a significant covariate in the analysis of followers’ generational differences in
perception of servant leadership and job satisfaction. Future studies could investigate
generational differences for those who all have the same tenure. Significant differences or
relationships were found in this study by language and tenure in both the perception of

121
servant leadership and job satisfaction. Future research could investigate other factors
that might explain language and tenure differences in perception of servant leadership
and job satisfaction.

122
References
Anderson, K. (2005). A correlational analysis of servant leadership and job satisfaction
in a religious educational organization (Doctoral dissertation, University of
Phoenix).
Avolio, B. & Bass, B. (2004). MLQ: Multifactor leadership questionnaire. Menlo Park,
CA: Mind Garden.
Aydin, A., Uysal, S., & Sarier, Y. (2012).The effect of gender on job satisfaction of
teachers: A meta-analysis study. Social and Behavioral Sciences, 46(2012), 356-
362.
Barbuto, J. & Wheeler, D. (2006). Scale development and construct clarification of
servant leadership. Group & Organization Management, 31(3), 300-326.
Barbuto, J., Fritz, S., Matkin, G., & Marx, D. (2007). Effects of gender, education, and
age upon leaders’ use of influence tactics and full range leadership behaviors. Sex
Roles, 56, 71-83.
Bass, B. (1985). Leadership and performance beyond expectations. New York: Free
Press.
Bass, B. & Avolio, B. (1994). Improving organizational effectiveness through
transformational leadership. Thousand Oaks, CA: Sage.
Bass, B. & Avolio, B. (1995). Multifactor leadership questionnaire: Manual leader form,
rater, and scoring key for MLQ (Form 5x-Short). Redwood City, CA: Mind
Garden.
Black, G. (2010). Correlational analysis of servant leadership and school climate. Journal
of Catholic Education, 13(4).

123
Brayfield, A. & Rothe, E. (1951). An index of job satisfaction. Journal of Applied
Psychology, 35, 307-311.
Brown, S. & Bryant, P. (2015). Getting to know the elephant: A call to advance servant
leadership through construct consensus, empirical evidence, and multilevel
theoretical development. Servant Leadership: Theory and Practice, 2(1), 10-35.
Cammann, C., Fichman, M., Jenkins, D., & Klesh, J. (1979). The Michigan
organizational assessment questionnaire. Unpublished manuscript, University of
Michigan, Ann Arbor.
Campbell, D. (2002). Campbell Leadership Descriptor – Facilitator’s Guide. Hoboken,
NJ: John Wiley & Sons.
Cerit, Y. (2009). The effects of servant leadership behaviours of school principals on
teachers’ job satisfaction. Educational Management Administration &
Leadership, 37(5), 600-623.
Clark, A. (2015). What makes a good job? Job quality and job satisfaction. IZA World of
Labor, ISSN 2054-9571, Iss. 215, http://dx.doi.org/10.15185/izawol.215
Costanza, D., Badger, J., Fraser, R., Severt, J., & Gade, P. (2012). Generational
differences in work-related attitudes: A meta-analysis. Journal of Business
Psychology, 27(4), 375-394.
Cuadrado, I., Morales, F., & Recio, P. (2008). Women’s Access to managerial positions:
an experimental study of leadership styles and gender. The Spanish Journal of
Psychology, 11(1), 55-65.

124
Dannhauser, Z. & Boshoff, A. (2006). The relationships between trust, team
commitment and demographic variables. Servant Leadership Research
Roundtable, August, 2006, 1-14.
Dennis, R. & Bocarnea, M. (2005). Development of the servant leadership assessment
instrument. Leadership & organization development journal, 26(8), 600-615.
Dobrow Riza, S., Ganzach, Y., & Liu, Y. (2014, January). Job satisfaction over time: A
longitudinal study of the differential roles of age and tenure. Academy of
Management Proceedings (pending), 1-22.
Drury, S. (2004). Servant leadership and organizational commitment: Empirical findings
and workplace implications. Servant Leadership Research Roundtable, August,
2004, 1-14.
Eagly, A., Johannesen-Schmidt, M., & van Engen, M. (2003). Transformational,
transactional and laissez-faire leadership styles: A meta-analysis comparing
women and men. Psychological Bulletin, 129(4), 569-591.
Ehrhart, M. (2004). Leadership and procedural justice climate as antecedants of unit-level
organizational citizenship behavior. Personnel Psychology, 57, 61-94.
Elsesser, K. & Lever, J. (2011). Does gender bias against female leaders persist?
Quantitative and qualitative data from a large-scale survey. Human Relations,
64(12), 1555-1578.
Ferres, N. & Travaglione, T., 2003). The development and validation of the workplace
trust survey (WTS): Combining qualitative and quantitative methodologies.
Mexico: APROS.
125
Gay, E., Weiss, D., Hendel, D., Dawis, R., & Lofquist, L. (1971). Manual for the
Minnesota Importance Questionnaire. Minnesota Studies in Vocational
Rehabilitation, 28.
Gibson, J., Greenwood, R., & Murphy, E. (2009). Generational differences in the
workplace: Personal values, behaviors, and popular beliefs. Journal of Diversity
Management, 4 (3), 1-8.
Gilbert, G., Collins, R., & Brenner, R. (1990). Age and leadership effectiveness: From
the perceptions of the follower. Human Resource Management, 29(2), 187-196.
Gittell, J., Weinberg, D., Pfefferle, S., & Bishop, C. (2008). Impact of relational
coordination on job satisfaction and quality outcomes: A study of nursing homes.
Human Resource Management Journal, 18(2), 154-170.
Graen, G. & Uhl-Bien, M. (1995). Relationship-based approach to leadership:
Development of leader-member exchange (LMX) theory of leadership over 25
years: Applying a multi-level multi-domain perspective. The leadership quarterly,
6(2), 219-247.
Green, M. (2013). Graduate leadership: A review of the science of leadership. N.
Charleston, SC: CreateSpace and Leadership Studies.
Green, M., Rodríguez, R., Wheeler, C., & Baggerly-Hinojosa, B. (2015). Servant
leadership: A quantitative review of instruments and related findings. Servant
Leadership: Theory and Practice, 2(2), 76-96.
Greenleaf, R. (2003). The Servant-leader within: A transformative path. Mahwah, NJ:
Paulist Press.

126
Hansen, J. & Leuty, M. (2012). Work values across generations. Journal of Career
Assessment, 20(1), 34-52.
Horsman, J. (2001). Perspectives of servant-leadership and spirit in organizations.
(Unpublished doctoral dissertation). Gonzaga University, Spokane, Washington.
House, R., Hanges, P., Javidan, M., Dorfman, P., & Gupta, V. (Eds.). (2004). Culture,
leadership, and organizations: The GLOBE study of 62 societies. Thousand Oaks,
CA: Sage publications.
Hoy, W., Tarter, C., & Kottkamp, R. (1991). Open schools, healthy schools: Measuring
organizational climate. Thousand Oaks, CA: Corwin Press.
Irving, J. (2004). Servant leadership and the effectiveness of teams: Findings and
implications. Servant Leadership Research Roundtable, August, 2004, 1-12.
Irving, J. & McIntosh, T. (2007). Evaluating the reliability of the evaluación
organizacional de liderazgo among Spanish speaking Latin Americans.
Proceedings of ASBBS, 14(1), 786-805.
Jordan, M. (2015). Determining the relationship between servant leadership and job
satisfaction among U.S. Navy personnel. (Unpublished doctoral dissertation).
Northcentral University, Prescott Valley, Arizona.
Kabacoff, R. & Stoffey, R. (2001). Age differences in organizational leadership.
Management Research Group, 1-33.
Kearney, E. & Gebert, D. (2009). Managing diversity and enhancing team outcomes: The
promise of transformational leadership. Journal of Applied Psychology, 94(1), 77-
89.

127
Kooij, D., Jansen, P., Dikkers, J., & Lange, A. (2010). The influence of age on the
associations between HR practices and both affective commitment and job
satisfaction: A meta-analysis. Journal of Organizational Behavior, 31, 1111-
1136.
Laub, J. (1999). Assessing the servant organization: Development of the organizational
leadership assessment (SOLA) instrument. (Unpublished doctoral dissertation).
Florida Atlantic University, Boca Raton, FL.
Ledbetter, D. (2003). Law enforcement leaders and servant leadership: A reliability study
of the organizational leadership assessment (Unpublished doctoral dissertation).
Regent University, Virginia Beach, Virginia.
Lester, S., Standifer, R., Schultz, N., & Windsor, J. (2012). Actual versus perceived
generational differences at work: An empirical examination. Journal of
Leadership and Organizational Studies, 19(3), 341-354.
Liden, R. & Maslyn, J. (1998). Multidimensionality of leader-member exchange: An
empirical assessment through scale development. Journal of management, 24(1),
43-72.
Liden, R., Wayne, S., Zhao, H., & Henderson, D. (2008). Servant leadership:
Development of a multidimensional measure and multi-level assessment. The
Leadership Quarterly, 19, 161-177.
Likert, R. (1967). The Human Organization: Its Management and Values. New York:
McGraw-Hill.

128
Lok, P. & Crawford, J. (2003). The effect of organisational culture and leadership style
on job satisfaction and organisational commitment: A cross-national comparison.
Journal of Management Development, 23(4), 321-388.
Management Research Group, (1992). Leadership effectiveness analysis. Portland, ME:
Author.
McClellan, J. (2007). The advisor as servant: The theoretical and philosophical relevance
of servant-leadership to academic training. NACADA Journal, 27(2), 41-49.
McIntosh, T. & Irving, J. (2010). Evaluating the instrumento de contribucion al liderazgo
de siervo (ICLS) for reliability in Latin America. The Journal of Global
Leadership, 1(1), 30-49.
Meyer, J., Allen, N., & Smith, C. (1993). Commitment to organizations and occupations:
Extension and test of a three-component conceptualization. Journal of applied
psychology, 78(4), 538-551.
Mohrman, A., Cooke, R., Mohrman, S., Duncan R., & Zaltman, G. (1977). An
Assessment of a Structural Task Approach to Organizational Development of a
School System. Washington, DC: National Institute of Education.
Mowday, R., Steers, R., & Porter, L. (1979). The measurement of organizational
commitment. Journal of vocational behavior, 14(2), 224-247.
Ng, T. & Feldman, D. (2010). The relationship of age with job attitudes: A meta-analysis.
Personnel Psychology, 63, 677-718.
Ng, T., Eby, L., Sorensen, K., & Feldman, D. (2005). Predictors of objective and
subjective career success: A meta-analysis. Personnel Psychology, 58, 367-408.
129
O-Campo, E., Joyner, N., & Green, M. (2012). The impact of the language spoken at
home when growing up and Hispanic preferences in leadership. Sam Houston
State University, Fourth Annual General Business Conference, Proceedings,
Volume III, 106-119.
OLAgroup (2016). http://www.olagroup.com/
Parris, D. & Peachey, J. (2013). A systematic literature review of servant leadership
theory in organizational contexts. Journal of Business Ethics, 113(3), 377-393.
Parry, E. & Urwin, P. (2011). Generational differences in work values: A review of
theory and evidence. International Journal of Management Reviews, 13(1), 79-96.
Paustian-Underdahl, S., Walker, L., & Woehr, D. (2014). Gender and perceptions of
leadership effectiveness: A meta-analysis of contextual moderators. Journal of
Applied Psychology, 99(6), 1129-1145.
Porter, L. (1961). A study of perceived need satisfaction in bottom and middle
management jobs. Journal of Applied Psychology, 46, 1-10.
Rio Grande Bible Ministries (2016). http://www.riogrande.edu/en
Rodriguez, R., Green, M., & Ree, M. (2003). Leading Generation X: Do the old rules
apply? Journal of Leadership & Organizational Studies, 9(4), 67-75.
Rodríguez-Rubio, A. & Kiser, A. (2013). An examination of servant leadership in the
United States and Mexico: Do age and gender make a difference? The Global
Studies Journal, 5(2), 127-149.
Russell, S., Lin, L., Spitzmueller, C., Stanton, J., Smith, P., & Ironson, G. (2004). Shorter
can also be better: The abridged job in general scale. Educational and
Psychological Measurement, 64(5), 878-893.
130
Salameh, K. M. (2011). Servant leadership practices among school principals in
educational directorates in Jordan. International Journal of Business and Social
Science, 2(22).
Salyadain, M. (1977). Organization levels and job satisfaction. Vikalpa, 2(1), 29-39.
Sendjaya, S., Sarros, J., & Santora, J. (2008). Defining and measuring servant leadership
behavior in organizations. Journal of Management Studies, 45(2), 402-424.
Sessa, V., Kabacoff, R., Deal, J., & Brown, H. (2007). Generational differences in leader
values and leadership behaviors. The Psychologist-Manager Journal, 10(1), 47-
74.
Shirom, A., Gilboa, S., Fried, Y., & Cooper, C. (2008). Gender, age and tenure as
moderators of work-related stressors’ relationships with job performance: A meta-
analysis. Human Relations, 61(10), 1371-1398.
Sin, H-K., Nahrgang, J., & Morgeson, F. (2009). Understanding why they don’t see eye
to eye: An examination of leader-member exchange (LMX) agreement. Journal of
Applied Psychology, 94(4), 1048-1057.
Spears, L. (2005). The understanding and practice of servant leadership. Servant
Leadership Research Roundtable, August, 2005.
Stanton, J., Sinar, E., Balzer, W., Julian, A., Thoresen, P., & Aziz, S. (2001).
Development of a compact measure of job satisfaction: The abridged job
descriptive index. Educational and Psychological Measurement, 61(6), 1104-
1122.
Stogdill, R. (1974). Handbook of leadership: A survey of theory and research. New
York: Free Press.

131
Thompson, R. (2002). The perception of servant leadership characteristics and job
satisfaction in a church-related college. (Unpublished doctoral dissertation)
Indiana State University, Terre Haute, Indiana.
Twenge, J. (2010). A review of the empirical evidence on generational differences in
work attitudes. Journal of Business Psychology, 25, 201-210.
Van Dierendonck, D. (2010). Servant leadership: A review and synthesis. Journal of
Management. Advance online publication, 1-34. doi: 10.1177/0149206310380462
Van Dierendonck, D. & Nuitjen, I. (2011). The servant leadership survey: Development
and validation of a multidimensional measure. Journal of Business Psychology,
26, 249-267. doi 10.1007/s10869-010-9194-1
Wanous, J., Reichers, A., & Hudy, M. (1997). Overall job satisfaction: How good are
single-item measures? Journal of Applied Psychology, 82, 242-252.
Warr, P., Cook, J. & Wall, T. (1979). Scales for the measure of some work attitude and
aspects of psychological well-being. Journal of Occupational Psychology,52,
129-148.
Weiss, D., Dawis, R., England, G., & Lofquist, L. (1967). Manual for the Minnesota
Satisfaction Questionnaire. Minneapolis: University of Minnesota
Williams, S. & Jones, F. (2009). Transformational leadership and servant leadership: Is
there a difference? Connexions Module: m27080, 1-5.
World Radio Network, Inc. (2016a). Workers’ Manual.
World Radio Network, Inc. (2016b). Board of trustees: Agenda books, minutes, motions
and action points, 1996-2016.
World Values Survey, 2012. http://www.worldvaluessurvey.org.

132
Yousef, D. (2000). Organizational commitment: A mediator of the relationships of
leadership behavior with job satisfaction and performance in a non-western
country. Journal of Managerial Psychology, 15(1), 6-28.
Yukl, G. & Falbe, C. (1990). Influence tactics and objectives in upward, downward, and
lateral influence attempts. Journal of Applied Psychology, 75, 132-140.
Zimmerer, T. (2013). Generational perceptions of servant leadership: A mixed methods
study. (Unpublished doctoral dissertation). Capella University, Minneapolis, MN.
133
APPENDIX A

134
APPENDIX B
Our Lady of the Lake University
Institutional Review Board
Recruitment message/Texto de hoja de reclutamiento (received electronically by potential participants)
(English) “Greetings board members, administrators, staff members, students, missionaries, employees and volunteers of Rio Grande Bible Ministries and World Radio Network, Inc.: (Spanish) “Saludos miembros de la mesa directiva, administradores, colaboradores, estudiantes, misioneros, empleados y voluntarios del Ministerios Bíblicos del Rio Grande y de World Radio Network, Inc./Inspiracom: (English) Hello. My name is Glenn Lafitte. I have been a missionary since 1981 with HCJB/Reach Beyond, and have been part of World Radio Network, Inc/Inspiracom since 1989. I studied Spanish at Rio Grande Bible Institute in 1981-1982 before going to Ecuador for missionary service. Since 2012 I have been working on a Ph. D. in Leadership Studies at the Rio Grande Valley campus of Our Lady of the Lake University. I have been approved by the university to begin the research for my dissertation. Dr. Larry Windle, president of Rio Grande Bible Ministries; and Dr. Abe Limón, president of World Radio Network, Inc., have given approval for me to conduct research within their respective organizations. I would like to invite you to participate in my research. (Spanish) Hola. Mi nombre es Glenn Lafitte. He sido misionero desde 1981 con HCJB/Reach Beyond y miembro de World Radio Network, Inc./Inspiracom desde 1989. Fui alumno en el programa de español en el Seminario Bíblico del Rio Grande en 1981-1982 antes de ir al Ecuador como misionero. Desde el 2012 he tomado estudios de doctorado en liderazgo en Our Lady of the Lake University en La Feria. Estoy aprobado por la universidad para comenzar mis investigaciones para mi disertación. El Dr. Larry Windle, presidente de Ministerios Bíblicos del Rio Grande; y el Dr. Abelardo Limón, presidente de Inspiracom me han aprobado para iniciar investigaciones dentro de sus respectivas organizaciones. Por medio de la presente quisiera invitarle a usted también a ser parte en mis investigaciones. (English) The purpose of this study is to determine if there are differences in attitudes towards servant leadership and job satisfaction among the different generations of members of Rio Grande Bible Ministries and World Radio Network, Inc. Both organizations are experiencing younger generations assuming positions of leadership now held by the older generations. There is little research to date on generational attitudes towards work environment, leadership, and job satisfaction as measured by valid and reliable servant leadership and job satisfaction instruments.

135
(Spanish) El propósito de esta investigación es determinar si hay diferencias en actitudes sobre el liderazgo de siervo y satisfacción de trabajo dentro de las distintas generaciones de los colaboradores de Ministerios Bíblicos del Rio Grande y de Inspiracom. Ambas organizaciones enfrentan la realidad de las nuevas generaciones tomando los lugares de liderazgo ocupados por las generaciones anteriores. Hasta el momento hay muy poca investigación sobre actitudes de ambiente de trabajo, liderazgo, y satisfacción de trabajo medida por encuestas válidas y confiables de liderazgo de siervo y satisfacción de trabajo. (English) "You must be age 18 or over to participate in this study. After you have read the informed consent form attached to this electronic message, and decide to participate in this study, you are asked to go to the following website: http://www.olagroup.com. You will type in the username and pin that pertains to your organization. You will select "Take the OLA" at the upper right of the screen. You will choose the "Standard Version". You will select the language - English or Spanish - with which you are most comfortable. You will find 1) a demographic survey that asks if you have read the informed consent document and are in agreement; your year of birth (for assignment to your appropriate generational cohort); your number of years with the organization (regardless of staff category, organizational level, or interruption of service); your gender; and your level of education 2) instructions for taking the Organizational Leadership Assessment (OLA) which will include asking for your organizational level - top leadership/board member; supervisor/manager; or staff/member/worker/student/volunteer. It will take you about 30 minutes to read the informed consent form, take the survey, and the Organizational Leadership Assessment (OLA)." Thank you again for taking time out of your busy work day to respond.” (Spanish) Es necesario tener 18 anos de edad o mas para participar en esta investigación. Una vez que ha leído usted el Formulario de Consentimiento Informado adjunto a este mensaje electrónico, y ha tomado la decisión de participar en esta investigación, favor de abrir el siguiente sitio del internet: http://www.olagroup.com. Una vez en este sitio en el internet favor de incluir el nombre del usuario y la clave de su organización de Ministerios Bíblicos del Rio Grande o World Radio Network, Inc/Inspiracom. Favor de seleccionar “Take the OLA” en la parte arriba y a la derecha en la pantalla. Favor de seleccionar “Standard Version”. Favor de seleccionar el idioma – inglés o español – que le sirva mejor. Debe llenar una breve encuesta que afirma que ha leído y está de acuerdo con el Formulario de Consentimiento Informado; su año de nacimiento (para asignarle a su generación apropiada); sus años como colaborador en la respectiva organización (a pesar de su categoría como miembro, nivel de trabajo o lapsos en colaboración); su género; y su nivel educacional. Después usted va a leer las

136
instrucciones para la Evaluacion Organizacional de Liderazgo y va a indicar su nivel organizacional –Alto ejecutivo/miembro de la mesa directiva (alto nivel de liderazgo), Gerencia (supervisor, gerente, coordinador de unidad), o Fuerza de trabajo (personal, miembro, trabajador, estudiante, voluntario). Requiere más o menos unos 30 minutos para tomar la encuesta y la Evaluacion Organizacional de Liderazgo.
Gracias otra vez por tomar tiempo dentro de su día ocupada para responder.”

137
APPENDIX C
Adult Electronic Informed Consent Form
1. Título de la Investigación (English) Title of Research Study Generational Differences in Servant Leadership and Job Satisfaction within Religious Non-Profit Organizations along the US/Mexico Border (Spanish) Diferencias generacionales dentro de organizaciones religiosas sin fines de lucro en medidas de liderazgo de siervo y satisfacción de trabajo en la frontera de Estados Unidos y México
2. Invitación
(English) Invitation
Hello. My name is Glenn Lafitte. I have been a missionary since 1981 with HCJB/Reach Beyond, and have been part of World Radio Network, Inc./Inspiracom since 1989. I studied Spanish at Rio Grande Bible Institute in 1981-1982 before going to Ecuador for missionary service. Since 2012 I have been working on a Ph. D. in Leadership Studies at the Rio Grande Valley campus of Our Lady of the Lake University. I have been approved by the university to begin the research for my dissertation. Dr. Larry Windle, president of Rio Grande Bible Ministries; and Dr. Abe Limon, president of World Radio Network, Inc., have given their approval for me to conduct research within their respective organizations. I would like to invite you to participate in my research. This form is meant to help you decide whether or not you would like to participate. If you have any questions please do not hesitate to get in touch with me through the contact information I will provide below.
(Español) Hola. Mi nombre es Glenn Lafitte. He sido misionero desde 1981 con HCJB/Reach Beyond y miembro de World Radio Network, Inc./Inspiracom desde 1989. Fui alumno en el programa de español en el Seminario Bíblico del Rio Grande en 1981-1982 antes de ir al Ecuador como misionero. Desde el 2012 he tomado estudios de doctorado en liderazgo en Our Lady of the Lake University en La Feria. Estoy aprobado por la universidad para comenzar mis investigaciones para mi disertación. El Dr. Larry Windle, presidente de Ministerios Bíblicos del Rio Grande; y el Dr. Abelardo Limón, presidente de Inspiracom me han aprobado para iniciar investigaciones dentro de sus respectivas organizaciones. Por medio de la presente quisiera invitarle a usted también a ser parte en mis investigaciones. Este formulario tiene el propósito de ayudarle a usted a tomar las decisiones necesarias en cuanto a su participación en mis investigaciones. Si tiene alguna pregunta con

138
toda confianza por favor póngase en contacto conmigo en unas de las maneras indicadas abajo.
3. ¿Cuál es el propósito de esta investigación?
(English) What is the reason for doing this research study?
The purpose of this study is to determine if there are differences in attitudes towards servant leadership and job satisfaction among the different generations of members of Rio Grande Bible Ministries, Inc. and World Radio Network, Inc. Both organizations are experiencing younger generations assuming positions of leadership now held by the older generations. There is little research to date on generational attitudes towards work environment, leadership, and job satisfaction as measured by valid and reliable servant leadership and job satisfaction instruments.
(Spanish) El propósito de esta investigación es determinar si hay diferencias en actitudes sobre el liderazgo de siervo y satisfacción de trabajo dentro de las distintas generaciones de los colaboradores de Ministerios Bíblicos del Rio Grande y de Inspiracom. Ambas organizaciones enfrentan la realidad de las nuevas generaciones tomando los lugares de liderazgo ocupados por las generaciones anteriores. Hasta el momento hay muy poca investigación sobre actitudes de ambiente de trabajo, liderazgo, y satisfacción de trabajo medida por encuestas válidas y confiables de liderazgo de siervo y satisfacción de trabajo.
4. ¿Qué se hará durante la investigación?
(English) What will be done during this research study?
You must be age 18 or over to participate in this study. After you have read this informed consent form and decide to participate in this study you are asked to go to the following website: http://www.olagroup.com. You will type in the username and pin that pertains to your organization. You will select “Take the OLA” at the upper right of the screen. You will choose the “Standard Version”. You will select the language – English or Spanish - with which you are most comfortable. You will find 1) a demographic survey that asks if you have read the informed consent document and are in agreement; your year of birth (for assignment to your appropriate generational cohort); your number of years with the organization (regardless of staff category, organizational level, or interruption of service); your gender; and your level of education 2) instructions for taking the Organizational Leadership Assessment (OLA) which will include asking for your organizational level – top leadership/board member; supervisor/manager; or

139
staff/member/worker/student/volunteer. It will take you about 20 minutes to take the survey and the Organizational Leadership Assessment (OLA).
(Spanish) Es necesario tener 18 años de edad o más para participar en esta investigación. Una vez que ha leído usted el Formulario de Consentimiento Informado y ha tomado la decisión de participar esta investigación, favor de abrir el siguiente sitio del internet: http://www.olagroup.com. Una vez en este sitio en el internet favor de incluir el nombre del usuario y la clave de su organización de Ministerios Bíblicos del Rio Grande o World Radio Network, Inc/Inspiracom. Favor de seleccionar “Take the OLA” en la parte arriba y a la derecha en la pantalla. Favor de seleccionar “Standard Version”. Favor de seleccionar el idioma – inglés o español – que le sirva mejor. Debe llenar una breve encuesta que afirma que ha leído y está de acuerdo con el Formulario de Consentimiento Informado; su año de nacimiento (para asignarle a su generación apropiada); sus años como colaborador en la respectiva organización (a pesar de su categoría como miembro, nivel de trabajo o lapsos en colaboración); su género; y su nivel educacional. Después usted va a leer las instrucciones para la Evaluación Organizacional de Liderazgo y va a indicar su nivel organizacional –Alto ejecutivo/miembro de la mesa directiva (alto nivel de liderazgo), Gerencia (supervisor, gerente, coordinador de unidad), o Fuerza de trabajo (personal, miembro, trabajador, estudiante, voluntario). Requiere más o menos unos 20 minutos para tomar la encuesta y la Evaluación Organizacional de Liderazgo.
5. ¿Cuáles son los posibles riesgos asociados con su participación en la investigación?
(English) What are the possible risks of being in this research study?
There are no known risks to you from being in this research study.
(Spanish) No hay ningún riesgo identificado en cuanto a su participación en esta investigación.
6. ¿Cuáles son los posibles beneficios para usted?
(English) What are the possible benefits to you?
You are not expected to get any direct benefit from being in this research study.
(Spanish) No hay ningún beneficio directo en cuanto a su participación en esta investigación.
7. ¿Cuáles son los posibles beneficios para otras personas?
(English) What are the possible benefits to other people?
140
This research will contribute in general to the field of Leadership Studies, and in particular to the understanding of the relationship between a person’s generation and his or her attitude towards servant leadership and job satisfaction. There is not a lot of valid and reliable information so far about generational differences and servant leadership.
(Spanish) Esta investigación representa una contribución a los estudios en liderazgo en general y en lo particular a la relación entre la generación de un grupo de colaboradores y las actitudes de aquella generación hacia liderazgo de siervo y satisfacción de trabajo. No hay mucha información válida y confiable hoy en día sobre las distintas generaciones y liderazgo de siervo.
8. ¿Qué le costará su participación en esta investigación?
(English) What will participation in this research study cost you?
There is no cost to you to be in this research study.
No hay ningún costo para usted por su participación en esta investigación.
9. ¿Cómo se protegerá su información?
(English) How will information about you be protected?
All data collected in this study is anonymous. This means that no names or identifying information will be recorded during the study. There is no way to connect your identity with any of your responses.
(Spanish) Todos los datos recaudados en esta investigación son anónimos. Esta implica que no hay uso de nombres ni información tomada que se pueda usar para identificarle a usted durante esta investigación. No hay manera de conectar su identidad con sus respuestas a la encuesta o a la Evaluación Organizacional de Liderazgo.
10. ¿Qué sucederá si usted decide no participar o negar su colaboración en la investigación?
(English) What will happen if you decide not to be in this study or if you decide to stop participation during the study?
Participation in this study is completely voluntary. If you choose to participate, you may stop participation at any time without penalty and without losing any benefits that are a part of this study.

141
(Spanish) Participación en esta investigación es completamente voluntaria. Si usted decide participar, tiene la libertad de dejar de hacerlo en cualquier momento sin ningún perjuicio o pérdida de beneficios que sean parte de esta investigación.
11. ¿Qué se debe hacer si hay preguntas o dudas sobre esta investigación?
(English) What should you do if you have questions or concerns about this research study?
If you have any questions or concerns during or after this study, you may contact me:
Glenn Lafitte 1703 Terrace Drive Mission, Texas 78572 956-451-1324 (cell or text) [email protected] or my dissertation chair: Dr. Barbara Baggerly-Hinojosa Our Lady of the Lake University-RGV 505 N. Villarreal/P.O. Box 420 La Feria, Texas 78559 956-277-0146 [email protected]
12. ¿A quién puede usted contactar si tiene preguntas sobre sus derechos como participante?
(English) Who can you contact if you have questions about your rights as a participant?
You can contact me or my dissertation chair above or you can contact the Our Lady of the Lake Institutional Review Board Chair: Puede contactar al investigador o al Consejo de Revisión Institucional de la Universidad Dr. Chris Carmichael Our Lady of the Lake University 411 SW 24th Street San Antonio, Texas 78207 210-434-6711, ext. 2402 [email protected]

142
APPENDIX D

143
APPENDIX E

144
APPENDIX F
Online Demographic Survey
1. I have read and agree with the Informed Consent Document Yes____ No ____
2. Year of birth (for generational cohort assignment) _____
3. Years with organization (regardless of category, organizational level or interruption of service) _____
4. Gender: Male ___ Female ___
5. Level of education Less than High School_____ High School Diploma or Equivalent____ Some Post High School_____ Bachelor’s Degree_____ Graduate or Professional Degree____

145
(Spanish Version of Online Demographic Survey)
Encuesta Demográfica por internet
1. He leído y estoy de acuerdo con el Formulario de Consentimiento Informado Sí ____ No ___
2. Año de nacimiento (para asignarle a su generación
apropiada) ______
3. Años como colaborador con la organización (a pesar de su categoría como miembro, nivel de trabajo o lapsos en colaboración) _______
4. Género: Masculino _____ Femenino _______
5. Nivel educacional Menos de escuela secundaria _____ Diploma de escuela secundaria o equivalente ____ Algunos estudios post-secundarios_____ Bachillerato _____ Post-bachillerato o estudios profesionales_____

146
APPENDIX G
From: JIM LAUB Sent: Tuesday, October 13, 2015 3:09 PM To: Glenn Lafitte Subject: Glenn Lafitte - OLA for research Glenn – I like your plan and I see it adding to the body of research around the OLA and servant leadership. I would be glad for you to use the OLA for your study. I have attached a document that lists the information I will need to set up your organizations for the OLA. Let me know when you are ready to move forward. Jim Laub, Ed.D. Professor of Leadership The MacArthur School of Leadership Palm Beach Atlantic University 901 South Flagler Drive West Palm Beach, FL 33416-4708 From: Glenn Lafitte Sent: Wednesday, October 07, 2015 3:38 PM To: JIM LAUB Cc: Lafitte, Glenn C. Subject: Inquiry about Using the OLA for Academic Research Purposes October 7, 2015 Glenn Lafitte Ph. D. Candidate Our Lady of the Lake University Rio Grande Valley Campus Jim Laub, Ed.D. President, OLAgroup Dear Dr. Laub, I may be premature in writing to you at this point. I have completed three years of study in the Ph. D. program in Leadership Studies at the Rio Grande Valley Campus of Our Lady of the Lake University. I have recently completed my written and oral comprehensive exams, have been appointed my dissertation chair and committee, and am a Ph. D. candidate. I have been working on a tentative research proposal and my PDLR for some time now. My next step will be to receive research concept approval from my dissertation committee which will then be followed by my research proposal defense. I have been aware of your work for some time now and would very much like to use the OLA in my dissertation research. I have copied the information below from the OLA website and have read through the other parts of the site and feel that the OLA would be an excellent instrument for the research I hope to conduct. I have attached a summary of my research plan as you have

147
indicated. My dissertation committee must approve my research concept followed by a more rigorous research proposal defense and approval by the Institutional Review Board of the University before I can begin my research. My dissertation chair encouraged me to get in touch with you at this point even before my committee has approved my research concept. Thank you for your consideration of my request, and please let me know any questions or comments you have for me at this point. Yours sincerely, Glenn Lafitte
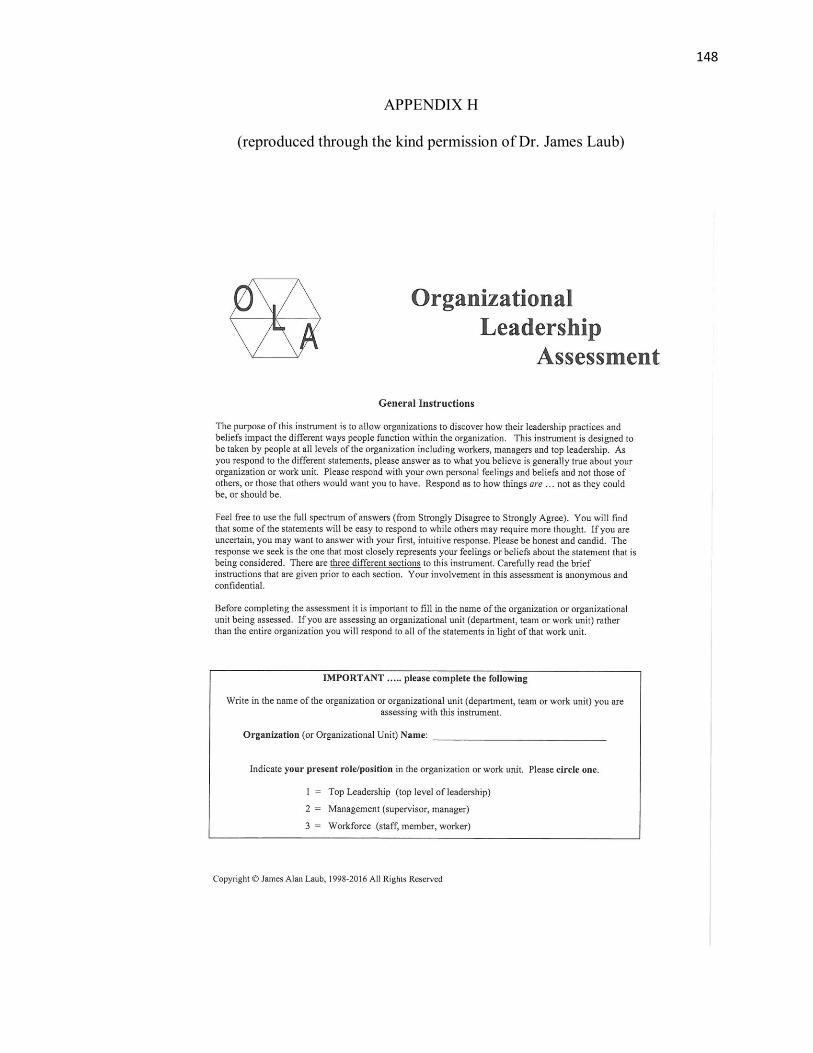
148
APPENDIX H
(reproduced through the kind permission of Dr. James Laub)

149

150

151

152
(Spanish version of the Organizational Leadership Assessment)

153

154
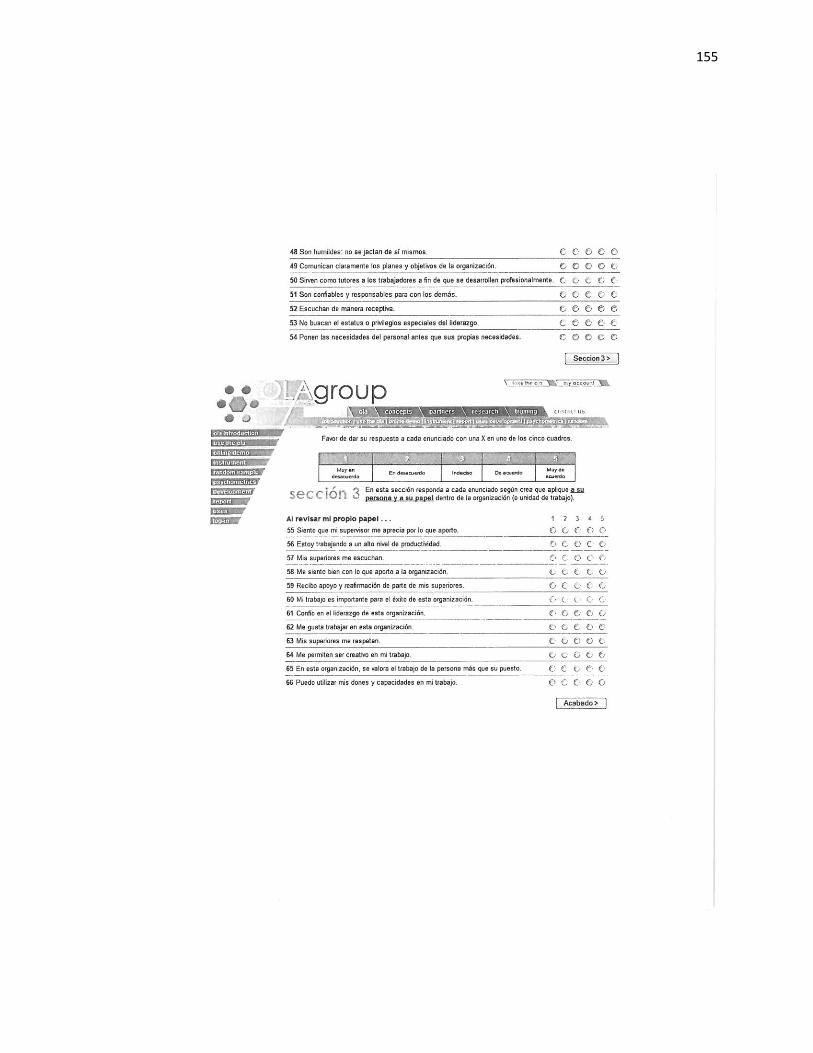
155