GENERATIONAL DIFFERENCES IN WORK PREFERENCES
57
GENERATIONAL DIFFERENCES IN WORK PREFERENCES Master thesis Business Administration Human Resource Management Joost Hoff September 2010 Committee: Dr. M.J. Van Riemsdijk Mw. Drs. K. Hage Msc Dr. P.A.T.M. Geurts Mw. Ing. S.J.J. Hendriks-Klijnhout Msc
Transcript of GENERATIONAL DIFFERENCES IN WORK PREFERENCES
GENERATIONAL DIFFERENCES IN
WORK PREFERENCES
Master thesis Business Administration
Human Resource Management
Joost Hoff
September 2010
Committee:
Dr. M.J. Van Riemsdijk Mw. Drs. K. Hage Msc
Dr. P.A.T.M. Geurts Mw. Ing. S.J.J. Hendriks-Klijnhout Msc
Generational differences in work preferences - J. Hoff
1
PREFACE
This master thesis is the result of a seven-month period of research at TNO Science and Industry. Together with the
process of coming up with an interesting subject, a suitable research design and writing this final report, I have
dedicated the last nine months to this project. One of the requirements I had for the subject of my master thesis was
that the subject had to be concerned with a current issue. Also, my research had to have direct practical relevance.
My supervisor of the University, Maarten, introduced the generational issues that seem to give problems in practice
which I translated into my own research design. TNO provided me with the freedom to transform my own ideas into
a research design that was also of practical relevance for them. This process did not always go as smooth as I might
have wished. Thanks to the help of my supervisors at TNO, Kitty and Saskia, and my supervisors at the university,
Maarten and Peter, I was able to ‘stay on the road’ (be it with some detours) resulting in this final report.
I would like to thank Kitty and Saskia and the entire HRD-team of TNO Science and Industry for their contribution to
this report. Not only for their valuable feedback on my thesis but also for the opportunities to look around within
TNO, develop myself and learn about the practice of HR.
Of course both my supervisors had a great influence on the process of this study. Having a tendency to be reluctant
on asking for help and trying things on my own, their feedback helped me to regain the focus on the main issues
instead of side-issues. This resulted in recovered motivation after every meeting and a clear view on what to do next.
Finally I would like to thank my close environment -family and friends - for their interest in my research. Their help in
seeing things in perspective and reviewing my report were crucial for the results.
Thanks for your support!
Joost Hoff
Generational differences in work preferences - J. Hoff
2
SUMMARY
This study aimed at getting more insight in the work preferences of the youngest generation (born after 1985) and
the differences with work preferences of older generations. The increasing numbers and influence of the youngest
generation on the labor force brings up the necessity for organizations to become attractive as an employer.
Using type of work and work environment as predictors of the recruitment outcomes organizational attraction and
acceptance intentions, a questionnaire was developed which operationalizes the constructs that are mentioned by
the youngest generation as being the most important. This questionnaire consisted of 7 constructs which in turn
were measured by a total of 15 scales. Two samples of respondents were used (students and workers) which also
made it possible to distinguish on work experience.
The results showed that there were two types of differences. On the one hand differences in kinds of preferences,
expressed by different operationalizations of the constructs. This was the case for the constructs; ‘challenge’, ‘task
significance’, ‘transformational leadership’ and ‘promotion opportunities’. On the other hand differences in the
levels of preferences were found which indicate that some aspects were preferred more or less by the youngest
generation. Three scales were valued higher by youngsters. This was the case for ‘social support’, ‘transactional
leadership, management-by-exception’ and ‘promotion opportunities’. Contrary, four other scales were valued
significantly lower by the youngest generation. This was the case for ‘task significance’, ‘flexibility’, ‘transformational
leadership’ and ‘social responsibility’.
It can be concluded that there are differences in work preferences between the youngest and older generations. The
results can be used to shape the aspects that are most preferred to the definition as used by this youngest
generation. However, as the found differences were relatively small and more similarities could be noted, the overall
conclusion is that the youngest generation does not seem to be as drastically different as popular press suggests.

Generational differences in work preferences - J. Hoff
3
INDEX
Preface ......................................................................................................................................................................... 1
Summary ...................................................................................................................................................................... 2
Index............................................................................................................................................................................. 3
1. Introduction ............................................................................................................................................................. 4
2. Theoretical framework ............................................................................................................................................ 5
2.1 Organizational attractiveness ............................................................................................................................ 5
2.2 Work design..................................................................................................................................................... 10
2.3 Generations ..................................................................................................................................................... 14
2.4 Generational preferences ............................................................................................................................... 16
2.5 Research model and question ......................................................................................................................... 24
3. Methodology ......................................................................................................................................................... 26
3.1 Samples ........................................................................................................................................................... 26
3.2 Instrumentation .............................................................................................................................................. 27
4. Results.................................................................................................................................................................... 30
4.1 Factor analysis ................................................................................................................................................. 30
4.2 Reliability analysis ........................................................................................................................................... 39
4.3 Exploring differences ....................................................................................................................................... 41
5. Discussion .............................................................................................................................................................. 46
5.1 Main findings ................................................................................................................................................... 46
5.2 Implications ..................................................................................................................................................... 50
5.3 Limitations ....................................................................................................................................................... 51
5.4 Suggestions for further research ..................................................................................................................... 52
6. References ............................................................................................................................................................. 53
Generational differences in work preferences - J. Hoff
4
1. INTRODUCTION
One of the biggest challenges for organizations in the coming years is the retirement of a large number of older
workers and replacing them with a new generation of workers (Twenge, Campbell, Hoffman, & Lance, 2010). In the
Netherlands, 1.5 million people will leave the workforce in the next ten years. In the same time period though, 1.6
million youngsters are expected to enter the workforce (CBS, 2009). However of the people that will leave the
workforce, approximately one third has a technical background opposed to only one fourth in the group that will
enter the workforce (De Beer, 2006). This larger outflow means that workers with a technical background might
become scarce in the near future. Moreover, employees nowadays also have to be able to keep up with the fast pace
of change in environment and technologies. Since young people grew up with most of the newest technologies, they
are expected to be more capable in making good use of the newest trends (Burke & Ng, 2006). This quality of the
youngest generation will make the ‘war for (technical) talent’ for the best and brightest youngsters even harder.
With 1.6 million youngsters entering the labour market, this generation will play a considerable role in the Dutch
labour force. This might be the cause of an even bigger challenge in attracting young talent. In the last few years
research suggested that the newest generation of workers has its own view on work (Twenge et al., 2010) and a
drastically different work mentality compared to that of older generations (Manpower, 2006; (Cennamo & Gardner,
2008). In order to be able to become and stay attractive for young talent, organizations will have to understand the
way this youngest generation of workers thinks about work and what they prefer. The literature on work preferences
of this new generation is yet still limited and most research is targeted to a general population. However, it has been
proven that other variables such as academic achievement (Trank, Rynes, & Bretz, 2002) and sector also play a
considerable role in the preferences for work (Gilbert, Sohi, & McEachern, 2008).
Therefore, the present study attempts to get more insight into the work preferences of a specific group of
members of the youngest generation. For this purpose the research was conducted within TNO which is a large
Dutch research organization. People who work at TNO generally are highly educated and have a technical
background. As most organizations, TNO finds itself in the war for talent and acknowledges the need for a better
understanding of the youngest generation in order to become an attractive organization for young talent.
All of the above results in the following question: Do the work preferences of technical youngsters differ
significantly from that of older technical generations, and if so, on which aspects? Thus, the goal of this study is
twofold; on the one hand, testing whether the youngest generation really has work preferences that are
characteristic for its generation in comparison with older generations. On the other hand an attempt is made to
get more nuanced information of which aspects of work or organizations are especially preferred by a specific
group of the youngest generation. More specifically, a questionnaire is designed that operationalizes work related
constructs to a more concrete level.
Generational differences in work preferences - J. Hoff
5
2. THEORETICAL FRAMEWORK
In this first chapter the theoretical concepts relevant for this research are explored and elaborated. First,
organizational attractiveness and its predictors are discussed. Second, the theoretical background of work
design is elaborated and third the influence of generations is explored. This will eventually result in the main
research question and research model.
2.1 ORGANIZATIONAL ATTRACTIVENESS
In the ‘war for (technical) talent’ organizations have to distinguish themselves from their competitors. In
order to do so, they have to become attractive as a potential employer for this group of talent. Therefore in
the next part the following question will be addressed: What is organizational attractiveness and how can it
be achieved?
In their attempt to examine the dimensionality of organizational attraction Highhouse, Lievens & Sinar (2003)
recognize three ways of looking at organizational attractiveness as seen from the perspective of an individual. One
way is to look at attractiveness in a strict sense, consisting of affective and attitudinal thoughts individuals have
about an organization as a possible employer. An example of a question that assesses attitudes is: ‘This company is
attractive to me as a place of employment’. In a wider sense, organizational attractiveness could also encompass
intentional components. Intentional components refer to the intentions individuals have towards performing certain
behavior. To asses specific intentions items are stated as follows: ‘I would exert a great deal of effort to work for this
company’. Finally, attractiveness can be conceptualized by prestige components. These components represent a
consensus about positive and/or negative characteristics of an organization. A question that concerns prestige
components is: ‘There are probably many who would like to work at this company’.
Hedund, Andersson & Rosén (2009) define attractive work as follows: ‘work/organization is attractive if a person is
interested to apply for it, wants to stay and is engaged in it’. This definition implicates that there are several stages in
which attractiveness can be evaluated. In every stage an individual can use one or more of the ways of looking at
attractiveness as described by Van Hoye & Lievens (2006).
This idea of several stages of attractiveness is also represented in Barber’s model of recruitment (1998). This model
recognizes three stages of recruitment and instead uses an organizational perspective. The first stage concerns the
generation of applicants, and is all about persuading some portion of the population to apply for positions. The
second stage, maintaining of the applicant status, considers keeping the applicant interested after initial contact has
been made. The third stage, influencing job choice, can be seen as the final effort to persuade the applicant to work
for the company. In this research, the main question is concerned with what makes an organization attractive in the
first place. Maintaining an applicant’s status or influencing job choice (stage 2 and 3) are therefore not yet relevant.
For this reason, I will concentrate on the first stage of the recruitment process.
Generational differences in work preferences - J. Hoff
6
2.1.1 THEORETICAL APPROACHES OF ORGANIZATIONAL ATTRACTION
In this first stage, the main goal is to attract potential applicants to apply. There are several theories that try to
explain why some individuals are attracted to specific organizations where others are not. First of all, two streams of
theories on attractiveness can be distinguished.
The first stream states that it is mainly factors outside a person’s individual characteristics that influence the
perceived attractiveness of a company and thus leaving personal characteristics out of consideration. Three
fundamental theories have been presented in this stream of research (Behling, Labovitz, & Gainer, 1968): critical
contact theory or signaling theory, objective factors theory and subjective factors theory. Critical contact theory
assumes that, because people don’t have sufficient knowledge about potential employers, they base their evaluation
of a companies’ attractiveness on their contact with agents of the company. Objective factors theory on the other
hand states that, rather than the contact with a company, it are the objective and economic factors like pay, fringe
benefits and location of the company that determine the attractiveness of an organization. Finally, the subjective
factors theory disagrees with the importance of objective factors and states that it is mostly the prestige or
possibilities for self actualization that determine the attractiveness of a company. There have been evidence for all
three theories, but later on I will discuss which of these theories is most influential in my research.
The second stream of research does incorporate these personal characteristics and states that the attractiveness of
an organization in the exact same circumstances can differ due to individual differences. Some people for example,
only like to work for a large company whereas others prefer to work in smaller organizations. Part of the second
stream is the more elaborated Attraction-Selection-Attrition-framework (ASA) of Schneider (Schneider, 1987). This
framework distinguishes three phases which eventually should lead to a match between the interests and personality
of a person and that of the company. In the attraction phase, individuals evaluate their level of attraction to a
company. Subsequently the organization makes the same consideration in the selection phase resulting in the
selection decision. Finally, after entering an organization, employees that do not fit the company after all will leave
the company in the attrition phase. The ASA-framework implicates the importance of a ‘fit’ between a person and an
organization (Kristof-Brown, Zimmerman, & Johnson, 2005). According to Piasentin & Chapman (2006) there are
three ways to conceptualize this fit. First of all a distinction can be made between a supplementary and a
complementary fit, describing a fit based on similarity versus a fit based on added value through diversity. Second, a
fit can be based on a demands and abilities framework. This fit focuses on matching the knowledge, skills and
abilities of a person with the requirements of the job. The third type of fit is the fit based on needs and supplies. This
form of fit occurs when employees’ needs, desires, or preferences in a broad way are met by the jobs that they
perform (Kristof-Brown et al., 2005). The broadest way of conceptualizing fit is the person-environment fit which
encompasses the evaluation of a fit on values, goals, interest and personality between a person, an organization, a
job, a group and/or a supervisor. Especially the fit on personality has received a lot of attention with the RIASEC-
personality types of Holland (1985) being the most influential model. Since fit can be perceived on different aspects,
all three theories of Behling could be used in the fit approach. In the next part though, I will discuss the outcomes of
a meta-analysis that provides insight in which theory/theories will be most influential in my research.
Generational differences in work preferences - J. Hoff
7
2.1.2 PREDICTORS AND OUTCOMES OF ORGANIZATIONAL ATTRACTIVENESS
In an effort to explore the relations between predictors and recruitment outcomes, Chapman et al. (Chapman,
Uggerslev, Carroll, Piasentin, & Jones, 2005) combined 70 studies concerning the evaluation of attractiveness by
applicants in a meta-analysis to try to find out which factors are the best predictors of recruitment outcomes. The
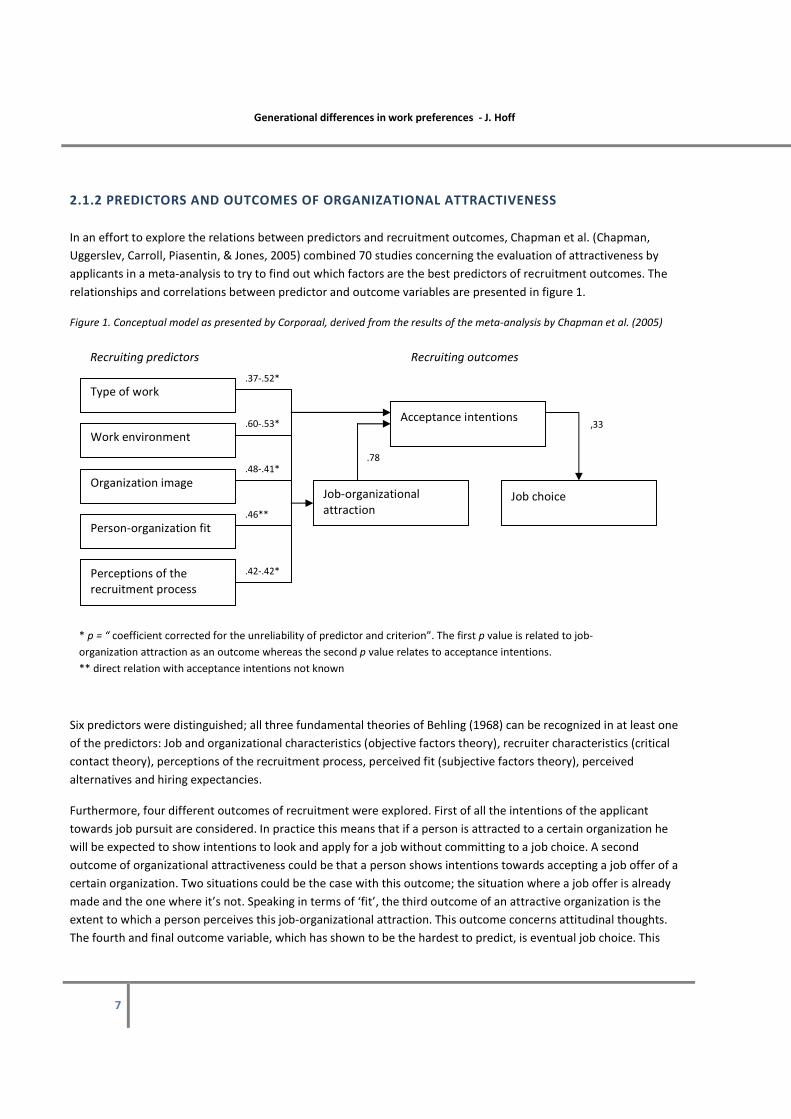
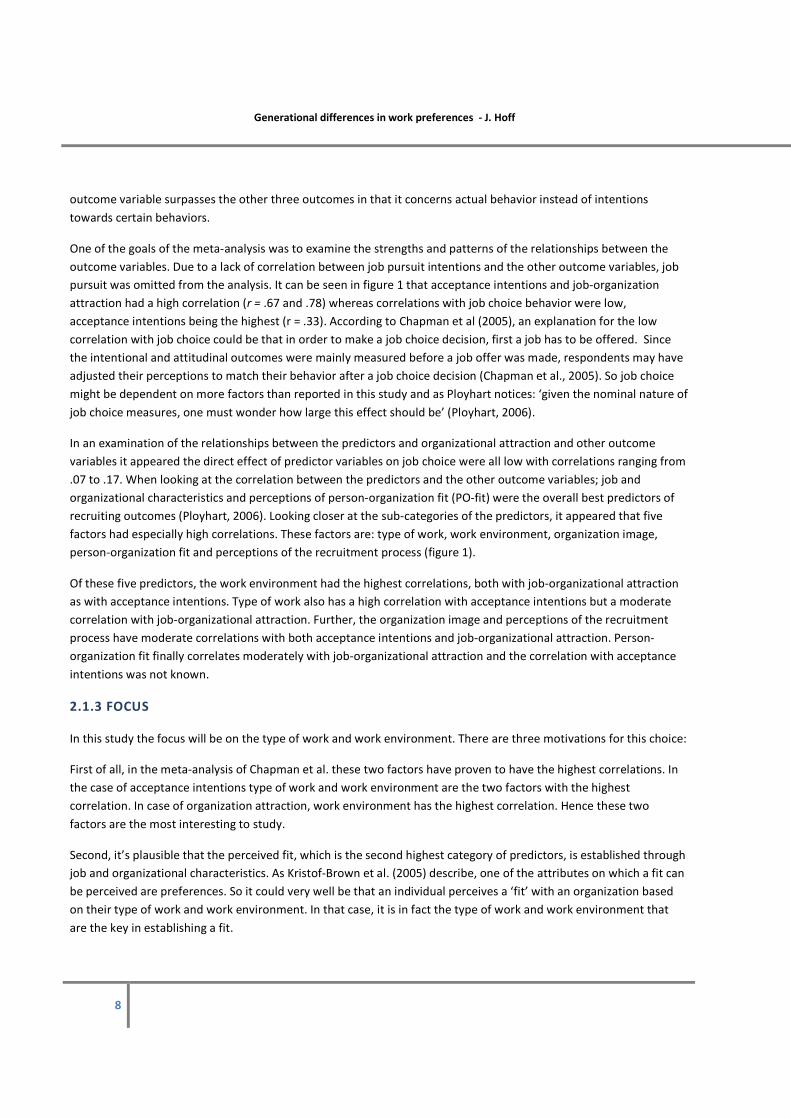
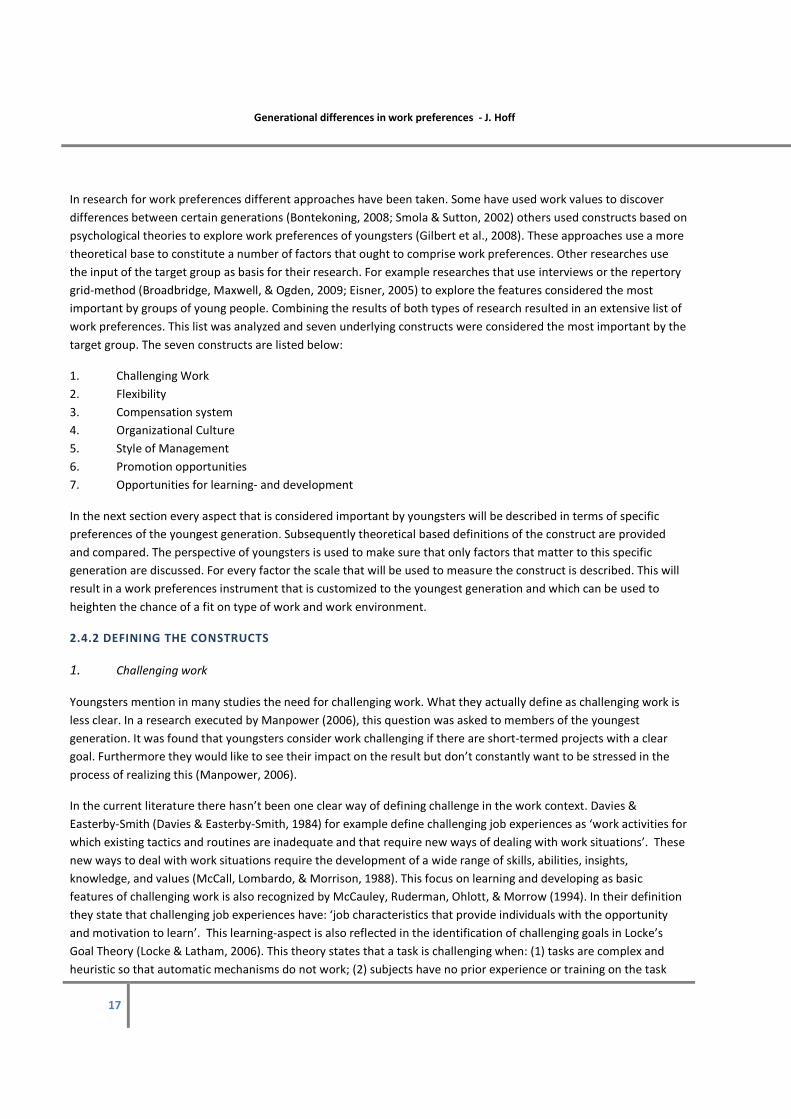
relationships and correlations between predictor and outcome variables are presented in figure 1.
Figure 1. Conceptual model as presented by Corporaal, derived from the results of the meta-analysis by Chapman et al. (2005)
Six predictors were distinguished; all three fundamental theories of Behling (1968) can be recognized in at least one
of the predictors: Job and organizational characteristics (objective factors theory), recruiter characteristics (critical
contact theory), perceptions of the recruitment process, perceived fit (subjective factors theory), perceived
alternatives and hiring expectancies.
Furthermore, four different outcomes of recruitment were explored. First of all the intentions of the applicant
towards job pursuit are considered. In practice this means that if a person is attracted to a certain organization he
will be expected to show intentions to look and apply for a job without committing to a job choice. A second
outcome of organizational attractiveness could be that a person shows intentions towards accepting a job offer of a
certain organization. Two situations could be the case with this outcome; the situation where a job offer is already
made and the one where it’s not. Speaking in terms of ‘fit’, the third outcome of an attractive organization is the
extent to which a person perceives this job-organizational attraction. This outcome concerns attitudinal thoughts.
The fourth and final outcome variable, which has shown to be the hardest to predict, is eventual job choice. This
* p = “ coefficient corrected for the unreliability of predictor and criterion”. The first p value is related to job-
organization attraction as an outcome whereas the second p value relates to acceptance intentions.
** direct relation with acceptance intentions not known
Type of work
Work environment
Organization image
Person-organization fit
Perceptions of the
recruitment process
Job-organizational
attraction
Acceptance intentions
Job choice
.37-.52*
.60-.53*
.48-.41*
.46**
.42-.42*
.78
.33
Recruiting predictors Recruiting outcomes
,33
Generational differences in work preferences - J. Hoff
8
outcome variable surpasses the other three outcomes in that it concerns actual behavior instead of intentions
towards certain behaviors.
One of the goals of the meta-analysis was to examine the strengths and patterns of the relationships between the
outcome variables. Due to a lack of correlation between job pursuit intentions and the other outcome variables, job
pursuit was omitted from the analysis. It can be seen in figure 1 that acceptance intentions and job-organization
attraction had a high correlation (r = .67 and .78) whereas correlations with job choice behavior were low,
acceptance intentions being the highest (r = .33). According to Chapman et al (2005), an explanation for the low
correlation with job choice could be that in order to make a job choice decision, first a job has to be offered. Since
the intentional and attitudinal outcomes were mainly measured before a job offer was made, respondents may have
adjusted their perceptions to match their behavior after a job choice decision (Chapman et al., 2005). So job choice
might be dependent on more factors than reported in this study and as Ployhart notices: ‘given the nominal nature of
job choice measures, one must wonder how large this effect should be’ (Ployhart, 2006).
In an examination of the relationships between the predictors and organizational attraction and other outcome
variables it appeared the direct effect of predictor variables on job choice were all low with correlations ranging from
.07 to .17. When looking at the correlation between the predictors and the other outcome variables; job and
organizational characteristics and perceptions of person-organization fit (PO-fit) were the overall best predictors of
recruiting outcomes (Ployhart, 2006). Looking closer at the sub-categories of the predictors, it appeared that five
factors had especially high correlations. These factors are: type of work, work environment, organization image,
person-organization fit and perceptions of the recruitment process (figure 1).
Of these five predictors, the work environment had the highest correlations, both with job-organizational attraction
as with acceptance intentions. Type of work also has a high correlation with acceptance intentions but a moderate
correlation with job-organizational attraction. Further, the organization image and perceptions of the recruitment
process have moderate correlations with both acceptance intentions and job-organizational attraction. Person-
organization fit finally correlates moderately with job-organizational attraction and the correlation with acceptance
intentions was not known.
2.1.3 FOCUS
In this study the focus will be on the type of work and work environment. There are three motivations for this choice:
First of all, in the meta-analysis of Chapman et al. these two factors have proven to have the highest correlations. In
the case of acceptance intentions type of work and work environment are the two factors with the highest
correlation. In case of organization attraction, work environment has the highest correlation. Hence these two
factors are the most interesting to study.
Second, it’s plausible that the perceived fit, which is the second highest category of predictors, is established through
job and organizational characteristics. As Kristof-Brown et al. (2005) describe, one of the attributes on which a fit can
be perceived are preferences. So it could very well be that an individual perceives a ‘fit’ with an organization based
on their type of work and work environment. In that case, it is in fact the type of work and work environment that
are the key in establishing a fit.
Generational differences in work preferences - J. Hoff
9
Third, as stated before this study concerns general attractiveness of any organization. This implicates that
attractiveness is evaluated without one particular organization in mind. Since perceptions of the recruitment process
are established after going through a part of a companies’ recruiting process, this predictor is not yet relevant.
With the focus on type of work and work environment, the focus area is expressed in terms of the theories that are
presented above. As stated before, type of work and work environment are subcategories of the predictor job- and
organizational characteristics. This predictor category best suits Behlings’ objective factor approach (1968). However,
as the meta-analysis showed that the person-organization fit also has a moderate correlation with job-organizational
attraction, the fit approach is also relevant. When combined, these two theories form the approach of individuals
evaluating attractiveness of an organization by the perceived fit on the type of work and work environment of an
organization.
2.1.4 LIMITATIONS
Despite these conclusions, a few limitations of the meta-analysis remain which have to be mentioned. There seem to
be three problematic issues: first of all, as already mentioned by the authors in the meta-analysis, the respondents in
the research are mostly college graduates from American universities. Since I will execute my research in The
Netherlands some cultural differences may come into play as Hofstede (Hofstede, 2005) shows that the Netherlands
and the US differ on some cultural dimensions. For example, the Netherlands score much lower on Hofstede’s
masculinity-dimension than the US, which could lead to differences in the preference for masculine work
characteristics (Hofstede, Neuijen, Ohayv, & Sanders, 1990).
Second, the respondents are discriminated on age, gender and the nature of the respondents (true applicants or
experimentally acting applicants). However, as Trank et al. (2002) found in their research, the achievement level of
applicants also influences work preferences. When students have high academic or social achievement they tend to
prefer different work characteristics compared to their lower performing colleagues (Trank et al., 2002). For example,
high performing students seem to place greater importance on interesting and challenging work compared to other
students (Trank et al., 2002).
Third, the study of Gilbert et al. (Gilbert et al., 2008) shows us that work preferences differ between professions. For
example people that work in marketing and budget & finance value an influence on time management significantly
more than people working in other sectors. Therefore the sector in which I will perform my research might also
influence the outcomes and generalizability of the results.
In conclusion
In the part above it became clear that organizational attractiveness can be interpreted and predicted in different
ways. Looking from a job-seeker perspective, job organizational attraction and acceptance intentions seem to be the
most valuable outcomes. The most important predictors for these outcomes seem to be the type of work and the
work environment. In the next part I will further discuss these two factors of interest: type of work and work
environment.
Generational differences in work preferences - J. Hoff
10
2.2 WORK DESIGN
Following from the previous, there seem to be two factors that can best be used in this study to predict
organizational attraction. Because these two broad factors can be conceptualized in different manners, the
next part will answer the following question: How can the type of work and work environment be
characterized and measured?
Type of work and work environment, are somewhat attached to each other and can be combined in the construct
work design (Morgeson & Humphrey, 2008). In order to define both constructs a short summary of the history of
work design will be given.
2.2.1 OVERVIEW OF WORK DESIGN
Ever since the introduction of the Scientific Management approach by Taylor (1911) the focus has been on work
design as a way to improve performance. Taylor focused on the division of labor to simplify work and consequently
use incentive systems to shape and control worker behaviors.
The first insight into the influence of social work characteristics came from the famous Hawthorne studies conducted
between 1924 and 1933 (Morgeson & Humphrey, 2008). In an initial attempt to evaluate the effect of brightness of
light on productivity a different effect was accidentally discovered. It showed that it was not altering the brightness
of light that increased productivity but rather the attention of researchers. This was the first proof of the strength of
social aspects in work.
Building on the concept of influencing workers behavior a next breakthrough in work design research was the work
of Herzberg, Mausner & Snyderman (Herzberg, Mausner, & Snyderman, 1959). In their work they developed the
motivator-hygiene theory. This theory distinguishes intrinsic and extrinsic factors. The intrinsic factors concern
aspects of the work itself and can result in job satisfaction (motivators). The extrinsic factors concern aspects of the
broader work context and result in no job satisfaction (hygiene factors). This theory was the first to state that job
satisfaction and no job satisfaction have different causes and that only intrinsic factors determine job satisfaction.
Since this theoretical separation of intrinsic and extrinsic motivations, scholars have given the most attention to the
intrinsic factors affecting job satisfaction. Hackman & Oldham (1975) subdivided intrinsic motivations into five
different categories: skill variety, task identity, task significance, autonomy and feedback from the job itself. For
several decades these categories have been widely used in explaining job satisfaction through work design.
However, with the focus on the intrinsic factors, the influence of social- and contextual characteristics have long
been neglected (Humphrey, Nahrgang, & Morgeson, 2007). Morgeson & Humphrey (Morgeson & Humphrey, 2006)
stress the importance of this social dimension once again, their reason to do this however, is quite new. They looked
at work design with the costs and benefits balancing issue in the back of their heads. As expected, task and
knowledge characteristics were motivating factors in work design. However, these factors are also associated with
training and compensation requirements which bring along extra costs. In their research they hypothesized that the
social dimension were able to increase motivation without increasing the training and compensation requirements
and accompanying costs. Proof was found for this hypothesis and suggests that social dimensions can add to the

Generational differences in work preferences - J. Hoff
11
motivation of personnel with the extra benefit of negative correlation with training requirements and accompanying
costs (Morgeson & Humphrey, 2006).
2.2.2 DEFINITIONS
With this development in mind ‘type of work’ can be defined as: ‘the aspects that are directly related to the job
activity’ (Jelstad, 2005). This definition incorporates the intrinsic as well as the extrinsic factors associated with work.
The work environment can be defined as: ‘the day-to-day social and physical environment in which you currently do
most or all of your work’ (Amabile, Conti, Coon, Lazenby, & Herron, 1996). By definition, a healthy work environment
is: a work setting in which policies, procedures, and systems are designed so that employees are able to meet
organizational objectives and achieve personal satisfaction in their work (Shirey, 2006).
2.2.3 MEASURES USED IN THE PAST
Work design instruments
One of the most widely used instruments to measure work design is the Job Characteristics Model (JCM) developed
by Hackman and Oldham (Hackman & Oldham, 1975). This model measures five factors that together constitute
intrinsic motivations to work. The instrument was designed to determine a Motivating Potential Score (MPS). In
establishing this MPS, autonomy and feedback from the job were given relatively more weight than the other three
factors; skill variety, task identity and task significance.
Additionally, an important moderator variable had to be reckoned with as well: the individual growth-need-strength
(GNS). This GNS encompasses someone’s need for challenge, development and learning, was found to be of crucial
importance. Even though the JCM is a much validated scale it is limited in its use since it only uses intrinsic factors. As
said earlier, intrinsic factors can be associated with job satisfaction where extrinsic factors are associated with job
dissatisfaction. Since the evaluation the attractiveness of a job/organization is concerned with positive as well as
negative aspects, the JCM won’t suffice to measure work preferences.
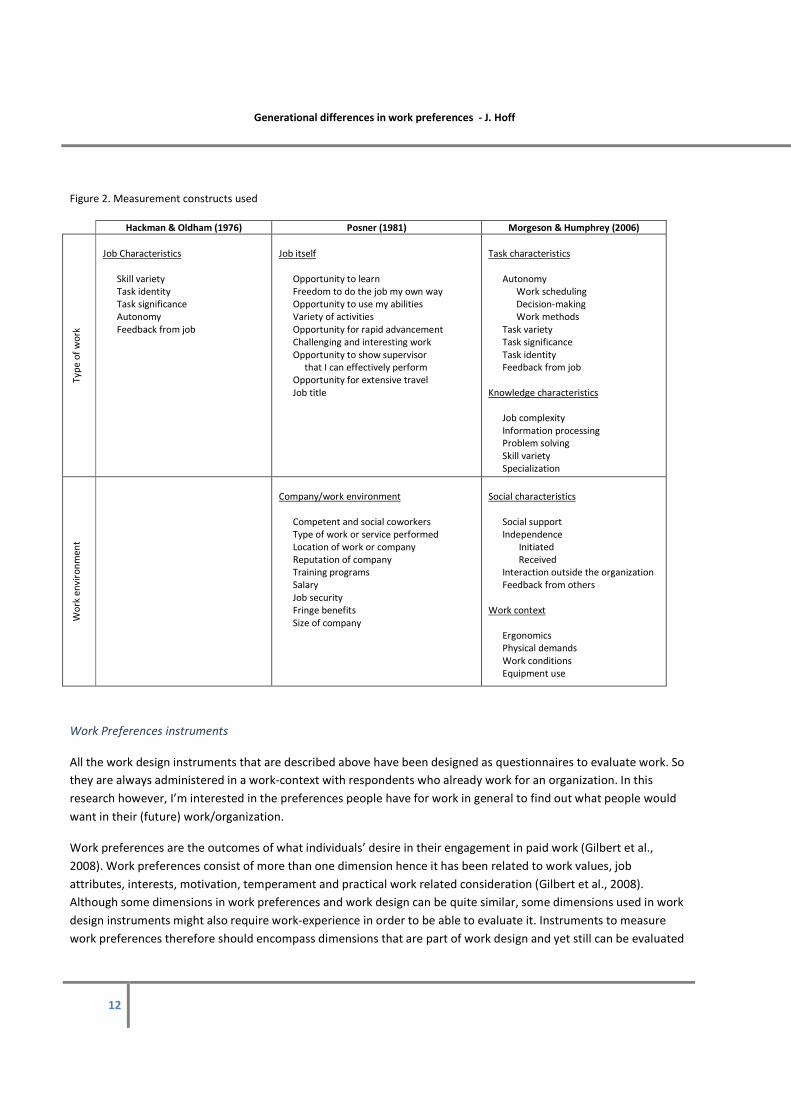
The first attempt to add to the sole us of intrinsic factors of the JCM was by Posner (Posner, 1981). He broadened the
scope of the JCM by adding the work environment. In his work he clearly distinguished two categories; the job itself
and the company/work environment. He further elaborated type of work and work environment into 9 distinct
categories for each construct (figure 2). This scale however is stated in very general terms. For example, one of the
items asks for the need for challenging and interesting work, which of course is subject to interpretation. Since I’m
interested in more specific preferences concerning work content, this general scale also won’t suffice.
In the development of the Work Design Questionnaire (WDQ), Morgeson & Humphrey (2006) reviewed existing
instruments to create a more complete picture of work design. In addition to the task characteristics, which hold all
five factors of the JCM, they introduced three other domains: knowledge characteristics, social characteristics and
work context. By doing this, they also introduced a social perspective to work design. Looking at the earlier described
developments in the nature of work, the knowledge characteristics and social characteristics especially are valuable
additions to work design instruments. The work context on the other hand, has more to do with work that concerns
hands-on labor as is found in factories for example.
Generational differences in work preferences - J. Hoff
12
Figure 2. Measurement constructs used
Hackman & Oldham (1976) Posner (1981) Morgeson & Humphrey (2006)
Ty
pe
of
wo
rk
Job Characteristics
Skill variety
Task identity
Task significance
Autonomy
Feedback from job
Job itself
Opportunity to learn
Freedom to do the job my own way
Opportunity to use my abilities
Variety of activities
Opportunity for rapid advancement
Challenging and interesting work
Opportunity to show supervisor
that I can effectively perform
Opportunity for extensive travel
Job title
Task characteristics
Autonomy
Work scheduling
Decision-making
Work methods
Task variety
Task significance
Task identity
Feedback from job
Knowledge characteristics
Job complexity
Information processing
Problem solving
Skill variety
Specialization
Wo
rk e
nv
iro
nm
en
t
Company/work environment
Competent and social coworkers
Type of work or service performed
Location of work or company
Reputation of company
Training programs
Salary
Job security
Fringe benefits
Size of company
Social characteristics
Social support
Independence
Initiated
Received
Interaction outside the organization
Feedback from others
Work context
Ergonomics
Physical demands
Work conditions
Equipment use
Work Preferences instruments
All the work design instruments that are described above have been designed as questionnaires to evaluate work. So
they are always administered in a work-context with respondents who already work for an organization. In this
research however, I’m interested in the preferences people have for work in general to find out what people would
want in their (future) work/organization.
Work preferences are the outcomes of what individuals’ desire in their engagement in paid work (Gilbert et al.,
2008). Work preferences consist of more than one dimension hence it has been related to work values, job
attributes, interests, motivation, temperament and practical work related consideration (Gilbert et al., 2008).
Although some dimensions in work preferences and work design can be quite similar, some dimensions used in work
design instruments might also require work-experience in order to be able to evaluate it. Instruments to measure
work preferences therefore should encompass dimensions that are part of work design and yet still can be evaluated
Generational differences in work preferences - J. Hoff
13
by people who do not have work experience. There are just a few instruments that have been developed to measure
these preferences.
The mostly used work preference instrument is the Work Preference Inventory as developed by Amabile et al.
(1996). This instrument was designed as: ‘a direct, explicit assessment of individual differences in the degree to which
adults perceive themselves to be intrinsically and extrinsically motivated toward what they do’ (Amabile et al., 1996)l,
1994).
Two main things that can be derived from this purpose are that it looks for individual differences and it is concerned
with both intrinsic and extrinsic motivational orientations. The outcome of this instrument is an insight into the
motivational orientation of a person and ignores the other dimensions in preferences for type of work or work
environment.
Other authors used different instruments to measure more specific work preferences. In their research Trank et al.
(2002) use a questionnaire that encompasses items that assess preferences concerning several dimensions of
preferences. In this survey, work characteristics like pay, promotion opportunities and the work itself are considered.
Although these scales seem to be useful in my research, they have not been reported as being used in many other
researches.
In an attempt to develop a work preference instrument that can be used to gain easy-to-use and quick to gauge
constructs that pertain to individual work preferences Gilbert et al. (2008) developed the Work Preference Indicator.
This instrument consists of 17 constructs based on psychological areas of study that are conceptualized in a 77-item
scale. Regarding the different dimensions of work preferences, the Work Preference Indicator uses learning styles,
work values, interests and personality temperament. Not much extra information on this instrument could be
derived since the instrument is proprietary.
2.2.4 CONCLUSIONS
As stated before, the main interest of this study is the preferences of youngsters for a certain type of work and work
environment. The reviewed work preference instruments don’t seem to be entirely suitable to this goal. First of all,
Amabile’s WPI focuses solely on intrinsic and extrinsic motivational aspects of work and by doing this it misses
aspects of the work environment. The scales of Trank et al (2002) seem useful but also don’t seem to grasp the full
notice of type of work and work environment as defined above. Finally, the WPI of Gilbert et al. is proprietary and
therefore cannot be properly evaluated. Also, as described the nature of work has changed which resulted in some
aspects getting more important whereas others became less important.
After evaluating the existing work preference instruments, it can be concluded that all instruments use approaches
that provide valuable and usable information. However, a different and more important conclusion is that there is
not yet an instrument that suits the purpose of this study. In attempt to explore the work preferences of the
youngest generation, an instrument is needed that is customized to this goal and only uses variables that are relevant
for this generation. In order to adequately evaluate a company’s attractiveness for young talent, the way youngsters
nowadays operationalize the two factors of interest has to be explored.
Generational differences in work preferences - J. Hoff
14
In conclusion
In this part the history of conceptualizations of type of work and work environment have been described. Using a job-
seeker perspective, the need for a new work preference instrument is established. In the next part, the target group
in this research is defined and a description of their work preferences follows.
2.3 GENERATIONS
As stated in the beginning, the group of interest is young, technical talents. Every group has its own
characteristics. To be able to understand these specific characteristics, the following question has to be
answered: Who are these talents?
The talents we are talking about are highly educated knowledge workers. This group of people starts to look for a job
after finishing their studies. Therefore, in this research I’m especially interested in students who are in the final phase
of their studies. The average age for Dutch students to graduate for a Masters study is approximately 25 (CBS, 2009).
Furthermore, almost 90% of Dutch Master Graduates are 29 years old or younger, meaning students who are born
after 1981. To find out some characteristics of this group of 20-somethings I turn to generation studies.
2.3.1 GENERATIONS BACKGROUND
Early in the 19th
century the first extensive sociological research on generations was conducted (Bontekoning, 2007).
With these influence as the basis of more recent theories, generations can be defined as: ‘groups of people who feel
connected to their peers in age due to a shared life-history or time experience, shared life circumstances and a shared
zeitgeist’ (Bontekoning, 2007). Others cluster people together in a generation on the basis of a ‘peer personality’
(Howe & Strauss, 1991). More practically, people from the same generation share birth years, age location, and
significant life events at critical developmental stage (Kupperschmidt, 2000).
This directly brings us to the explanation of how generations are formed.
When growing up everyone goes through a formative period. In this period you are especially susceptible for culture-
or value changes (Becker, 1992 in Bontekoning, 2007). Mannheim considers people at the top of their formative
period when they are seventeen years old. Becker (1992) however considers the formative period to last from age
fifteen to twenty five. He further explains that it is breaches of trends that result in the development of different
generations. Examples are events that have a national or international impact like economic crises or acts of war. It is
especially these similar historical and social life experiences that stay relatively stable over time that distinguishes
one generation from another (Jurkiewicz & Brown, 1998). One should note that new generations do not develop
from scratch. All the environmental influences in the formative period are often results of actions of previous
generations. Therefore, some interaction between generations always exists. It has been found however, that there
are substantial differences between generations. These differences consist of work- and life values but also different
preferences which all result in deviate behavioral patterns (Bontekoning, 2007; Smola & Sutton, 2002). An example
of this is a difference in tendency towards taking risk which results in more conservative or proactive behavior
(Bontekoning, 2007).
Generational differences in work preferences - J. Hoff
15
2.3.2 GENERATIONS ON THE WORK FLOOR
Knowing what constitutes generations brings me to discuss the classification of relevant generations. When
reviewing the literature on generational classification, I soon noticed that the variance in years of birth and names to
distinguish different generations is considerable. These differences can be explained by the fact that some events
that form a generation only have a national impact. So where in one country or culture a significant event gives birth
to a new generation, in other countries or cultures this event may rest unnoticed. This makes generalizations of
characteristics of generational members across countries or cultures quite difficult.
I will discuss two ways of classification, one as used in the US and the other one as used by Dutch authors. Despite
the fact that this research will be conducted in the Netherlands, the American classification is still relevant as I will
also explore the literature from the US in the next step.
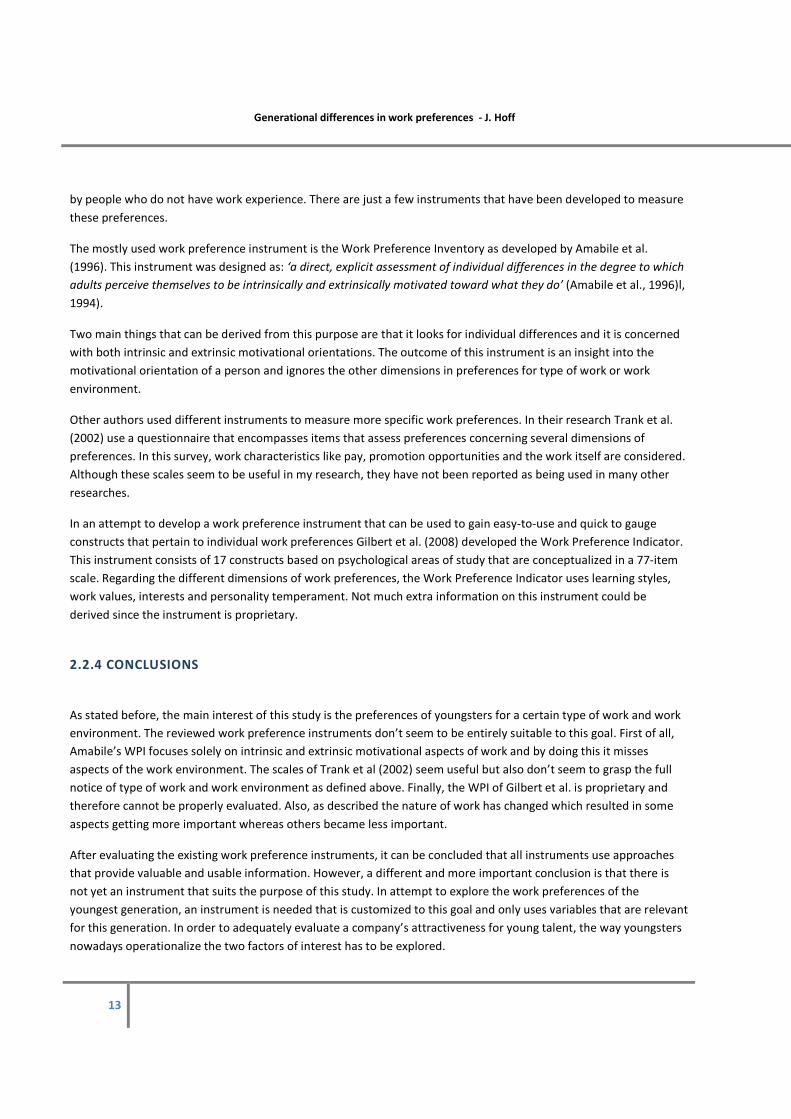
American classification
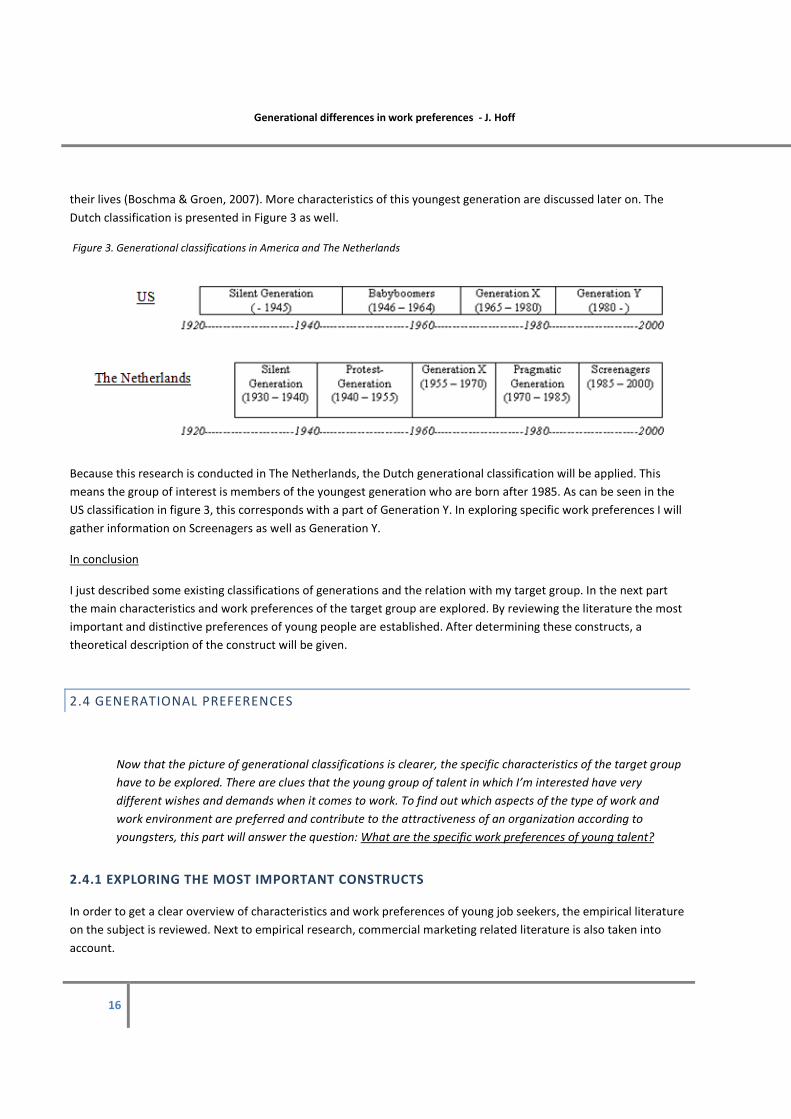
In the US, the first and oldest generation that is still present in the workplace is the Greatest Generation or also
called Silent generation and Traditionalists or Veterans (Eisner, 2005). This generation is born between 1920 and
1946, but sometimes scholars suffice by labeling it as pre-1946 (Zemke et al. 2000). The next generation is born
roughly between 1946 and 1960 and is labeled as the Babyboomers. The birth year of where this generation begins
vary between 1960 (Zemke et al. 2000) and 1964 (Kupperschmidt, 2000). The next generation is called Generation X
and people born broadly between 1960 and 1981 fall into this category. Once again the determined years of birth
years vary a lot. For example Eisner (2005) considers people born in the period 1965 – 1980 as Generation X’ers
whereas others use the years of birth 1964 – 1976 (Borchardt, 2008). The final generation American scholars
distinguish is Generation Y or also called Millenials, Nexters, Echo Boomers, Screenagers or Internet Generation
(Eisner, 2005; Smola & Sutton, 2002). The birth years that are considered as borders for Generation Y vary also for
example between 1977 and 1994 (Borchardt, 2008), 1982 and 2000 (Zemke et al. 2000) or just people born after
1980 (Eisner, 2005). The four generations as distinguished in American literature are presented in Figure 3.
Dutch classification
In the Netherlands a different generational classification is used compared to that in American literature. Becker
(Becker, 1992) and later Van Steensel (2000) and Jeekel (2005) recognized five distinct generation of which the oldest
is the Silent generation; born between 1930 and 1940. The next generation is labeled as Babyboomers or Protest
Generation but the birth years associated with this classification differ from the American way since this generation
concerns people born between 1940 and 1955. In the Netherlands this generation has been characterized by using a
power or forcing strategy to convince others and having strong ambitions (Becker in Bontekoning, 2007). The next
generation is born between 1955 and 1970 and is labeled as Generation X. Examples of characteristics that have
been attributed to this generation are that they are considered conservative and modest and show a low tendency
towards protesting (Becker in Bontekoning, 2007). After that, the so called Pragmatic Generation is distinguished
with members being born between 1970 and 1985. Characteristics that have been ascribed to this generation are for
example their individuality, hard working and having a high participation of female and ethnic minorities (Becker in
Bontekoning, 2007). The youngest generation is called The Screenagers and consists of people who are born between
1985 and 2000. In the Netherlands this generation is considered to value authenticity, freedom and self development
(Van Steensel in Bontekoning, 2007). Furthermore, they consider ‘being happy’ and ‘learning’ as most important in
Generational differences in work preferences - J. Hoff
16
their lives (Boschma & Groen, 2007). More characteristics of this youngest generation are discussed later on. The
Dutch classification is presented in Figure 3 as well.
Figure 3. Generational classifications in America and The Netherlands
Because this research is conducted in The Netherlands, the Dutch generational classification will be applied. This
means the group of interest is members of the youngest generation who are born after 1985. As can be seen in the
US classification in figure 3, this corresponds with a part of Generation Y. In exploring specific work preferences I will
gather information on Screenagers as well as Generation Y.
In conclusion
I just described some existing classifications of generations and the relation with my target group. In the next part
the main characteristics and work preferences of the target group are explored. By reviewing the literature the most
important and distinctive preferences of young people are established. After determining these constructs, a
theoretical description of the construct will be given.
2.4 GENERATIONAL PREFERENCES
Now that the picture of generational classifications is clearer, the specific characteristics of the target group
have to be explored. There are clues that the young group of talent in which I’m interested have very
different wishes and demands when it comes to work. To find out which aspects of the type of work and
work environment are preferred and contribute to the attractiveness of an organization according to
youngsters, this part will answer the question: What are the specific work preferences of young talent?
2.4.1 EXPLORING THE MOST IMPORTANT CONSTRUCTS
In order to get a clear overview of characteristics and work preferences of young job seekers, the empirical literature
on the subject is reviewed. Next to empirical research, commercial marketing related literature is also taken into
account.
Generational differences in work preferences - J. Hoff
17
In research for work preferences different approaches have been taken. Some have used work values to discover
differences between certain generations (Bontekoning, 2008; Smola & Sutton, 2002) others used constructs based on
psychological theories to explore work preferences of youngsters (Gilbert et al., 2008). These approaches use a more
theoretical base to constitute a number of factors that ought to comprise work preferences. Other researches use
the input of the target group as basis for their research. For example researches that use interviews or the repertory
grid-method (Broadbridge, Maxwell, & Ogden, 2009; Eisner, 2005) to explore the features considered the most
important by groups of young people. Combining the results of both types of research resulted in an extensive list of
work preferences. This list was analyzed and seven underlying constructs were considered the most important by the
target group. The seven constructs are listed below:
1. Challenging Work
2. Flexibility
3. Compensation system
4. Organizational Culture
5. Style of Management
6. Promotion opportunities
7. Opportunities for learning- and development
In the next section every aspect that is considered important by youngsters will be described in terms of specific
preferences of the youngest generation. Subsequently theoretical based definitions of the construct are provided
and compared. The perspective of youngsters is used to make sure that only factors that matter to this specific
generation are discussed. For every factor the scale that will be used to measure the construct is described. This will
result in a work preferences instrument that is customized to the youngest generation and which can be used to
heighten the chance of a fit on type of work and work environment.
2.4.2 DEFINING THE CONSTRUCTS
1. Challenging work
Youngsters mention in many studies the need for challenging work. What they actually define as challenging work is
less clear. In a research executed by Manpower (2006), this question was asked to members of the youngest
generation. It was found that youngsters consider work challenging if there are short-termed projects with a clear
goal. Furthermore they would like to see their impact on the result but don’t constantly want to be stressed in the
process of realizing this (Manpower, 2006).
In the current literature there hasn’t been one clear way of defining challenge in the work context. Davies &
Easterby-Smith (Davies & Easterby-Smith, 1984) for example define challenging job experiences as ‘work activities for
which existing tactics and routines are inadequate and that require new ways of dealing with work situations’. These
new ways to deal with work situations require the development of a wide range of skills, abilities, insights,
knowledge, and values (McCall, Lombardo, & Morrison, 1988). This focus on learning and developing as basic
features of challenging work is also recognized by McCauley, Ruderman, Ohlott, & Morrow (1994). In their definition
they state that challenging job experiences have: ‘job characteristics that provide individuals with the opportunity
and motivation to learn’. This learning-aspect is also reflected in the identification of challenging goals in Locke’s
Goal Theory (Locke & Latham, 2006). This theory states that a task is challenging when: (1) tasks are complex and
heuristic so that automatic mechanisms do not work; (2) subjects have no prior experience or training on the task

Generational differences in work preferences - J. Hoff
18
and thus have no knowledge of suitable task strategies; and (3) there is pressure to perform well in a short time
period, so that there is little freedom or time to experiment with different ways of performing the task (Locke &
Latham, 2006). It should be added however that the relation between job demands and job performance or
satisfaction is not linear but rather works in an inverted-U shape. More demands will work motivating in a job until a
certain level is reached where motivation will decrease again; a situation called ’over-challenge’ (Dewettinck &
Buyens, 2006). It seems apparent that because of the dislike of ‘being stressed in the process’ youngsters are quite
wary for the situation of over-challenge.
In their Kaleidoscope Career Model, Mainiero & Sullivan (Mainiero & Sullivan, 2006) looked at aspects that constitute
challenging work. In their research they found five main motives in the search for challenge in work. First of all, in
accordance with previous research, the need for employees to develop and grow is also recognized as an important
aspect of challenging work. Second, people seek to gain motivation through challenging work. This means people
will consider work as challenging when they constantly get motivated by it. Third, challenge is described as a way to
obtain validation. With this, the opportunities people have to show themselves and others what they’ve got. Fourth,
challenge is seen as a way to have an impact. In this way, work will be considered challenging if there’s the possibility
to have an impact (on others) with your work. Fifth, challenge can be considered a way to establish expertise. In this
approach work is rated more challenging when there is a chance to becoming an expert in a particular field of work.
These wide descriptions of motives for and dimensions of challenge are also represented by the number of ways
challenge has been measured. The most basic way of measuring job challenge is asking to rate jobs on how
challenging they are. Other multi-item measure of challenge in a work-context focus on learning opportunities (Hall
& Las Heras, 2010), responsibility in individually determining work content and process (Huang, Lawler, & Lei, 2007),
the extent to which a job is meaningful (Idsoe, 2006) and the room that’s present for creativity and own ideas
(Holmes & Srivastava, 2002).
In this study, I have chosen to use the challenge-measure of Amabile, Hill, Henessy & Tighe (1996). Contrary to other
questionnaires, this instrument is already formulated in a work preference context and therefore suitable for this
study. The measure is part of the Work Preference Inventory (Amabile et al., 1996) and has been extensively
developed and tested resulting in the final scale which consists of 7 items. These items represent the learning and
development focus which is related to challenge but also complexity and novelty of problems in a work context and
the extent to which a person has to stretch his abilities. With an alpha of .74 and factor loadings ranging from .36 to
.79 it have proved to be a reliable and valid instrument to measure preferences for challenge. An example of this
scale is: ‘I want my work to provide me with opportunities for increasing my knowledge and skills’. A full list of the
items is presented in table 4 (p. 32).
In order to also reflect the need for work with impact, I added a reworded version of the task significance scale from
the WDQ (Morgeson & Humphrey, 2006). This scale is normally used as an evaluative instrument concerning task
significance of part of work design. For this study though, I used the scale to measure preferences of workers and
students with no work experience. The scale consisted of 4 items that measure the effect people want to have on
other people’s lives and the importance their work has to have in a broad sense. The scale has proven to be a reliable
instrument to measure the construct (α = .86). An example of an item of this scale is: ‘I want a job that has a large
impact on people outside the organization’. A full list of the items is presented in table 5 (p. 33)
Generational differences in work preferences - J. Hoff
19
2. Flexibility
Youngsters constantly rate flexibility as one of the most important characteristics of work. They want to be able to
(partly) determine when, where, how much and on what they work. They are used to change and uncertainty and
therefore accustomed to the need for flexibility. The motive for this search for flexibility can be found in the self
declared fact that they ‘work to live’ which emphasizes their need to spend time with friends and family (Manpower,
2006; Broadbridge et al. 2009).
Flexibility in a work-context can be defined and categorized in different ways. Some authors have made a distinction
between flexibility related to the job and flexibility related to the environment. Job related flexibility, or so called
functional flexibility, is mainly concerned with job content, job descriptions and job structure (Hunter et al. 1993).
Work environment related flexibility is called numerical flexibility and features type of contract and number of hours
worked. Within the work environment flexibility, three more types of flexibility can be structured (Kossek & Van
Dyne, 2008): Time flexibility, which can be defined as flexibility in the number of hours worked. An example of this is
part-time work. Timing flexibility, this is defined as flexibility in when work occurs. Examples of this type of flexibility
are variation in begin and end times of work and compressed workweeks. Place flexibility can be described as
flexibility in where work occurs. An example of this is telecommuting, where one works from a location different
from the main organizational building (Kossek & Van Dyne, 2008). An encompassing construct for numerical
flexibility as well as the three types of flexibility as distinguished by Kossek & Van Dyne (2008) is that of flexible work
arrangements (FWA’s) (Rau, 2003). Flexible work arrangements can be defined as: ‘alternative work options that
allow work to be accomplished outside of the traditional temporal and/or spatial boundaries of a standard workday’
(Rau, 2003). The original standard workday being monday to friday, 35-40 daytime hours (Tausig & Fenwick, 2001).
The last couple of years, flexibility in the work context received much interest. Formulated as ‘the new way of work’,
flexible working options like a compressed work week or teleworking have become very popular. These options are
often addressed in terms of benefits for employers. In this case however, FWA’s are considered as benefits for
employees since the arrangements provide them with a greater freedom in determining their place and hours of
work.
As youngsters state they want to be able to determine when, where, how much and on what they work, both job
αrelated flexibility and spatial and temporal flexibility will be measured. In order to measure job-flexibility, a scale
develop by Trank et al. (2002) is used. In their study, Trank et al. (2002) used a group of students (sophomores,
juniors and seniors) as respondents. The job-flexibility scale proved to be reliable (α = .70). The scale consists of 4
items and concerns the job description and structure. An example of an item of this scale is: I want to work for a
company where job descriptions are loose and fluid’. A full list of the items is presented in table 13 (p. 39).
In order to measure the importance of spatial and temporal flexible work options, a scale of Swanberg & Simmons
(2008) is used consisting of 6 items. Originally this scale was used as an evaluative instrument to measure access to
spatial and temporal flexibility options. It has been used in a survey performed under a representative sample of the
US labor force. For this research the same items could be used however the introductory question differed. Instead
of asking whether there is access to a certain type of flexibility it was stated in a preference context. An example of
this is: ‘I want to work a compressed work week’ A full list of the items is presented in table 14 (p. 39).
Generational differences in work preferences - J. Hoff
20
3. Compensation system
Regarding compensation systems, youngsters seem to have a desire for constant feedback and instant gratification
(Broadbridge et al., 2009). In practice this means they like to hear what they can improve and especially get appraisal
for what they do well (Martin, 2005).
Rewards that are association with a compensation system can be subdivided into two types of rewards; monetary
and non-monetary. Monetary rewards can be seen as factors that influence extrinsic motivation whereas non-
monetary have to do with intrinsic motivation.
Monetary rewards are one of the most studied variables in relation to job choice. However, research also has shown
that salary affects the job choice process according to Tversky’s non-compensatory elimination-by-aspects theory
(1972). This means that a certain minimum level has to be reached in order for a job offer to be taken into
consideration in the first place. Research has shown that salary is an example of such a non-compensatory factor
(Rynes, 1991). Besides the level of pay, companies can vary in their pay systems. For example pay can be based on
individual performance, on merit, on seniority or team-based. Also a distinction can be made between pay incentives
and fixed salary. As youngsters like to be appraised for what they do well, the base of pay might be important in the
pay system. Especially pay based on individual performance might be attractive for this generation.
Non-monetary rewards consist of all incentives to do better that are not expressed in money. Most important in this
category are rewards such as praise and recognition (Jansen, Merchant, & Van der Stede, 2009). In their study, they
compare results from the same study conducted in the US with their own results. It is concluded that in Dutch
companies non-monetary rewards are much more prevalent and especially recognition is emphasized by managers
of Dutch organizations (Jansen et al., 2009). Since youngsters also seem to consider praise and recognition very
important in work (Martin, 2005) this type of reward will also be taken into account. Also, the strong need for
feedback seems important.
The non-monetary reward system was measured using the scale of Trank et al. (2002) that measures praise and
recognition (α = .72) and consists of 4 items. An example item of this scale is: ‘It is very important that my supervisors
appreciate the work I do’. A full list of the items is presented in table 6 (p. 33). The monetary reward system can be
measured by scales of Trank et al. (2002) measuring pay preferences (α = .71) which consists of 7 items. An example
of an item of this scale is: ‘I want my pay to be determined strictly by my individual performance’. A full list of the
items is presented in table 7 (p. 34).
Preferences for feedback were measured by a modified version of the direct inquiry feedback seeking scale as used
by Roberson, Deitch, Brief & Block (2003). In this study the internal consistency coefficient proved to be high (α =
.81). An example of an item of this scale is: ‘I directly ask my supervisor for information on my achievements’. This
scale was intended to measure the extent to which someone uses a direct feedback seeking strategy. The
respondents however were American professionals in the utilities industries, which possibly could have led to a bias
in the results. A full list of the items is presented in table 8 (p. 36).
4. Organizational culture
Youngsters are said to have high expectations of future employers. They want to work in a good working
environment, within a positive company culture that also performs well in terms of social responsibility and
Generational differences in work preferences - J. Hoff
21
sustainability (Broadbridge et al., 2009). Youngsters also greatly value the social aspects of a workplace wanting
interaction with colleagues and possibilities to develop friendships with them. The finding that youngsters intensively
use their networks consisting of family and social networking sites like Facebook and MySpace can be seen as an
example for the importance of this social aspect.
In the literature organizational culture is by many authors regarded as of great importance for bringing about
organizational change (Jung et al., 2009). Therefore the practical need to understand, manage and adjust
organizational culture to meet organizational needs has arisen (Jung et al., 2009). Despite the fact that culture is a
widely studied construct, a universal definition has not been conceptualized. In the literature over 100 dimensions
have been associated with culture and moreover the number of existing definitions in the literature almost reaches
300. In an attempt to structure the vast amount of dimensions, Schein (Schein, 1990) divided the many dimensions
into three levels of culture: artifacts, values and basic assumptions. The first level concerns the most visible and
tangible aspects including the physical environment, products, technologies and the patterns of behavior. The second
level is concerned with the values that underlie behavior incorporating moral and ethical codes, ideologies and
philosophies. The third level also consists of beliefs but differs from values in that assumptions are internalized to the
point that the beliefs are not conscious anymore.
The process of defining organizational culture becomes even harder when considering the notion that there is no
such thing as one organizational culture but moreover an interwoven web of subcultures (Jaskyte & Dressler, 2004).
These subcultures, especially present in organizations with separate subdivisions, might diverge or coincide with the
general organizational culture possibly resulting in a counterculture (J. Martin & Siehl, 1983).
Some authors respond on this unclearness by stating that because culture is such an elaborate construct, scholars
should use the definition most appropriate for their purpose and context.
The debate on how the full essence of organizational culture can be captured is also reflected by the number of
existing measures. In a review of 70 measures for organizational culture Jung et al (Jung et al., 2009)(2009) conclude
that there is no ‘ideal’ way to measure organizational culture. Instead, the instrument to measure culture should be
chosen on terms of “fit for purpose”. In their review of instruments measuring organizational culture, Jung et al.
(2009) describe the dimensions that constitute culture and which instruments use this particular dimension.
In this study, I will use the dimensions of organizational culture that are stated as being the most important by the
youngest generation. As youngsters find social responsibility and sustainability important cultural aspects a scale for
social responsibility will be incorporated in the questionnaire. Additionally, as the social aspects of organizational
culture are stressed by the youngest generation, a scale measuring these social aspects is also used. Finally, since
TNO, where this research is conducted, is a highly innovative organization, an extra scale measuring innovation
orientation is also added to the questionnaire.
To measure social responsibility, a subscale of a revision of O’Reilly’s Organizational Culture Profile (1999) as
performed by Sarros, Gray, Densten & Cooper (2005) was used. This 4-item scale, intends to measure social
responsibility and has proven be a reliable subscale (α = .74). An example of an item of this scale is: I want to work for
an organization that has a clear guiding philosophy’. A full list of the items is presented in table 16 (p. 40). To
measure social support, a reworded version of the scale of the Work Design Questionnaire (Morgeson & Humphrey,
2006) was used. This scale proved to have a good internal consistency (α = .82). An example of an item of this scale is:
´In my work I want to have the opportunity to develop close friendships’. A full list of the items is presented in table
Generational differences in work preferences - J. Hoff
22
11 (p. 37). To measure orientation towards innovation I used the scale as developed by Detert, Schroeder & Mauriel
(2000). This dimension consists of 3 items and also has a sufficient reliability (α = .71). An example of an item of this
scale is: ‘employees are encouraged to make all kinds of proposals for change’. A full list of the items is presented in
table 15 (p. 40).
5. Style of management
Concerning supervisors, youngsters like to work with open and supportive bosses that appreciate them as human
beings and give them regular feedback. They hate to be micromanaged and like an inclusive style of management
(Broadbridge et al., 2009).
In the literature, two main styles of management/leadership can be recognized: Transactional and transformational
leadership.
Transactional leadership is based on rewards and punishment to gain compliance from followers. It builds on a
relationship between leader and follower based on business related transactions. When followers realize the
expected results they will be rewarded. This style has got two distinctive dimensions. The first is contingent rewards,
which means; rewards are only provided if a satisfactory level of performance is reached. The other dimension is
management-by-exceptions, which means dealing with errors in an active manner (Bass & Avolio, 1995). The essence
of transactional leadership is making clear what the goals and accompanying rewards are and control the progress
towards these goals (De Hoogh, Den Hartog, & Koopman, 2004).
Transformational leadership can be defined as: ‘a process that occurs when one or more persons engage with others
in such a way that leaders and followers raise one another to higher levels of motivation and morality’ (Batista-Taran,
Shuck, Gutierrez, & Baralt, 2009). Transformational leadership can also be divided into dimensions according to Bass
and Avolio (1995). First of all, a transformational leader presents himself as an inspiring motivator who
enthusiastically communicates his vision. Second, transformational leaders have individual interest in their followers,
focusing on their development, and if necessary coach them. Third, a transformational leader challenges his
followers intellectually by regularly asking followers for their opinion concerning business issues. By doing this he
tries to get followers to critically evaluate daily business and organizational problems. Transformational leaders can
be characterized as leaders who show behavior aimed to enhance employee’s self-esteem and capacity in performing
their job (De Hoogh et al., 2004).
As can be seen in the short description of preferences of the youngest generation for managers both leadership
styles can be recognized. On the one hand, youngsters seem to value clear feedback of their supervisor and like to
have clear goals and rewards for performance; all characteristics of a transactional leader. On the other hand,
youngsters also want open, supportive managers who appreciate them as human beings; which are characteristics
that belong more to a transformational leader. Since both styles seem to be appreciated to a certain extent, both
leadership styles were measured in the questionnaire.
To measure transformational leadership (11 items) a scale from the CLIO is used (De Hoogh et al. 2004). This scale
proved to have good internal consistency (α = .80) (Hoogh et al. 2004). An example of an item of this scale is: ‘I want
a leader that is capable of making others enthusiastic for his plans’. A full list of the items is presented in table 8 (p.
36)
Generational differences in work preferences - J. Hoff
23
To measure transactional leadership, a scale is used from the Multifactor Leadership Questionnaire (MLQ) as
developed by Bass & Avolio (1995). This scale consists of 2 subscales representing the two dimensions. Both
dimensions comprise 4 items. Research has found internal consistency estimates (coefficient alpha) for the
transactional subscales ranging from .69 to .90 (Tejeda, Scandura, & Pillai, 2001). An example of an item of the
subscale contingent reward is: ´I want a leader who makes clear what one can expect to receive when performance
goals are achieved’. For the subscale management-by-exception an example of an item is: ‘I want a leader who
directs my attention toward failures to meet standards’. A full list of the items is presented in table 10 (p. 37)
6. Promotion opportunities
Youngsters are said to be quite ambitious. This is expressed by their interest in the promotion opportunities a
company provides (Yeaton, 2008). This is particularly the case for the group of youngsters with high social- and
academic achievement as they have a stronger preference for clear and fast-track promotion tracks than their lower
performing colleagues (Trank et al., 2002). Furthermore, youngsters feel they deserve a higher entry level than non-
graduates and because of a strong feeling of entitlement they also feel they deserve a promotion without having to
earn it by working hard for several years (Twenge et al., 2010).
In attracting the best and brightest students, organizations should take into account their specific preferences. When
it comes to promotion opportunities, it seems that students with highest achievement have a preference for the
presence of fast-track promotion tracks. Therefore, scales for fast-tracks and promotion opportunities are used in the
study.
To measure this construct, a scale from Trank et al. (2002) was used that measures Promotion opportunities (7
items). An example of an item of this scale is: ‘I want a job where there are lots of opportunities for upward mobility’.
In their research a shorter 4-item version of this scale was used that proved to be reliable (α = .75). The extra 3 items
that were in the original scale as developed by Trank et al. (2002) however might add qualitative information to the
variable and are on these grounds added to the scale. These three additional items concern alternatives for linear
promotions such as lateral promotion, training and job rotation, which occur more often in organizations with a
flattened structure. These alternatives for linear promotion might be attractive options for the youngest generation
as organizations nowadays often move to more flat structures. A full list of the items is presented in table 18 (p. 38).
Also the presence of ‘fast-tracks’ are taken into account using another subscale of Trank et al. (2000) consisting of 6
items. An example of this scale is: ‘I’d rather work for a company where it isn’t clear whether you’re on a fast track or
not’. Of this scale a shorter version (4 items) proved to be reliable (α = .67) however, to gather some additional
information, I chose to also use two items concerning fast-tracks from a job-seeker perspective and an aspect of
justice. A full list of the items is presented in table 17 (p. 40).
7. Opportunities for learning and development
Other things youngsters really seem to value in future work is the amount of opportunities it provides to grow
personally as well as professionally. Personally they like to meet their own goals, take responsibility for their own
career and become a better person. Professionally they like to be offered continuous learning and development
opportunities.
In an attempt to measure learning and development strategies and goals, Tones & Pillay (2008) developed the
learning and development questionnaire. Based on theories on goal selection, goal engagement and goal
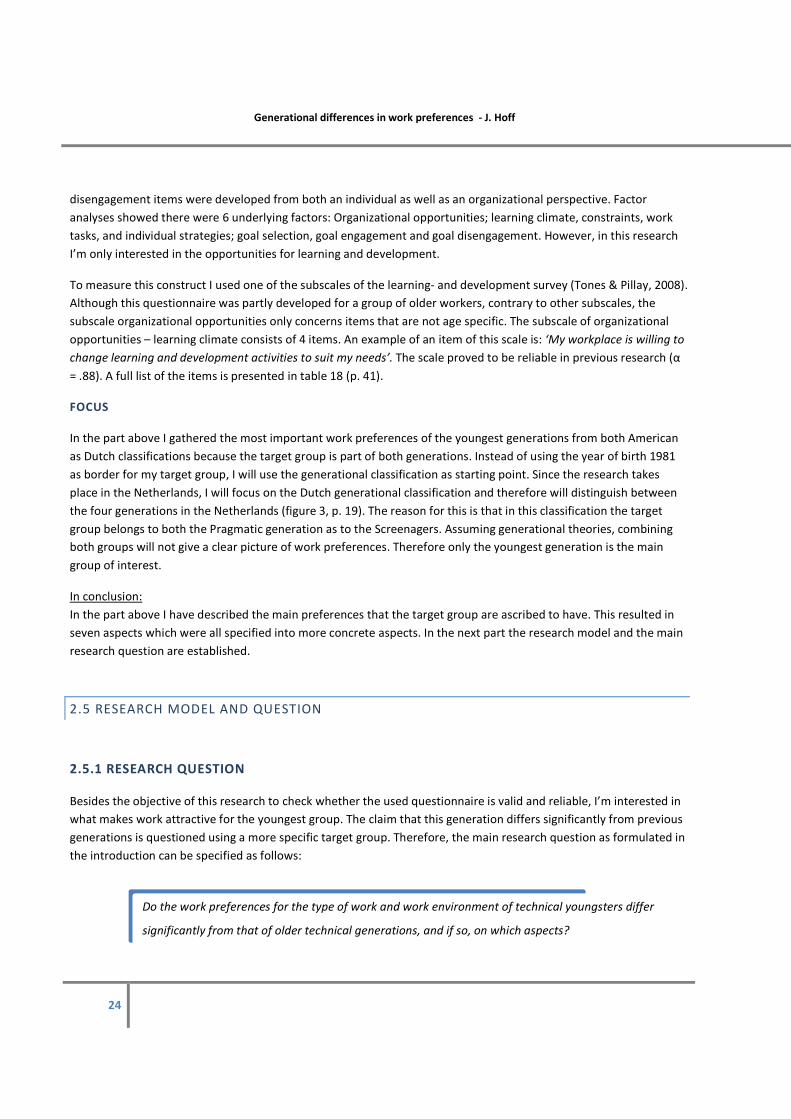
Generational differences in work preferences - J. Hoff
24
disengagement items were developed from both an individual as well as an organizational perspective. Factor
analyses showed there were 6 underlying factors: Organizational opportunities; learning climate, constraints, work
tasks, and individual strategies; goal selection, goal engagement and goal disengagement. However, in this research
I’m only interested in the opportunities for learning and development.
To measure this construct I used one of the subscales of the learning- and development survey (Tones & Pillay, 2008).
Although this questionnaire was partly developed for a group of older workers, contrary to other subscales, the
subscale organizational opportunities only concerns items that are not age specific. The subscale of organizational
opportunities – learning climate consists of 4 items. An example of an item of this scale is: ‘My workplace is willing to
change learning and development activities to suit my needs’. The scale proved to be reliable in previous research (α
= .88). A full list of the items is presented in table 18 (p. 41).
FOCUS
In the part above I gathered the most important work preferences of the youngest generations from both American
as Dutch classifications because the target group is part of both generations. Instead of using the year of birth 1981
as border for my target group, I will use the generational classification as starting point. Since the research takes
place in the Netherlands, I will focus on the Dutch generational classification and therefore will distinguish between
the four generations in the Netherlands (figure 3, p. 19). The reason for this is that in this classification the target
group belongs to both the Pragmatic generation as to the Screenagers. Assuming generational theories, combining
both groups will not give a clear picture of work preferences. Therefore only the youngest generation is the main
group of interest.
In conclusion:
In the part above I have described the main preferences that the target group are ascribed to have. This resulted in
seven aspects which were all specified into more concrete aspects. In the next part the research model and the main
research question are established.
2.5 RESEARCH MODEL AND QUESTION
2.5.1 RESEARCH QUESTION
Besides the objective of this research to check whether the used questionnaire is valid and reliable, I’m interested in
what makes work attractive for the youngest group. The claim that this generation differs significantly from previous
generations is questioned using a more specific target group. Therefore, the main research question as formulated in
the introduction can be specified as follows:
Do the work preferences for the type of work and work environment of technical youngsters differ
significantly from that of older technical generations, and if so, on which aspects?
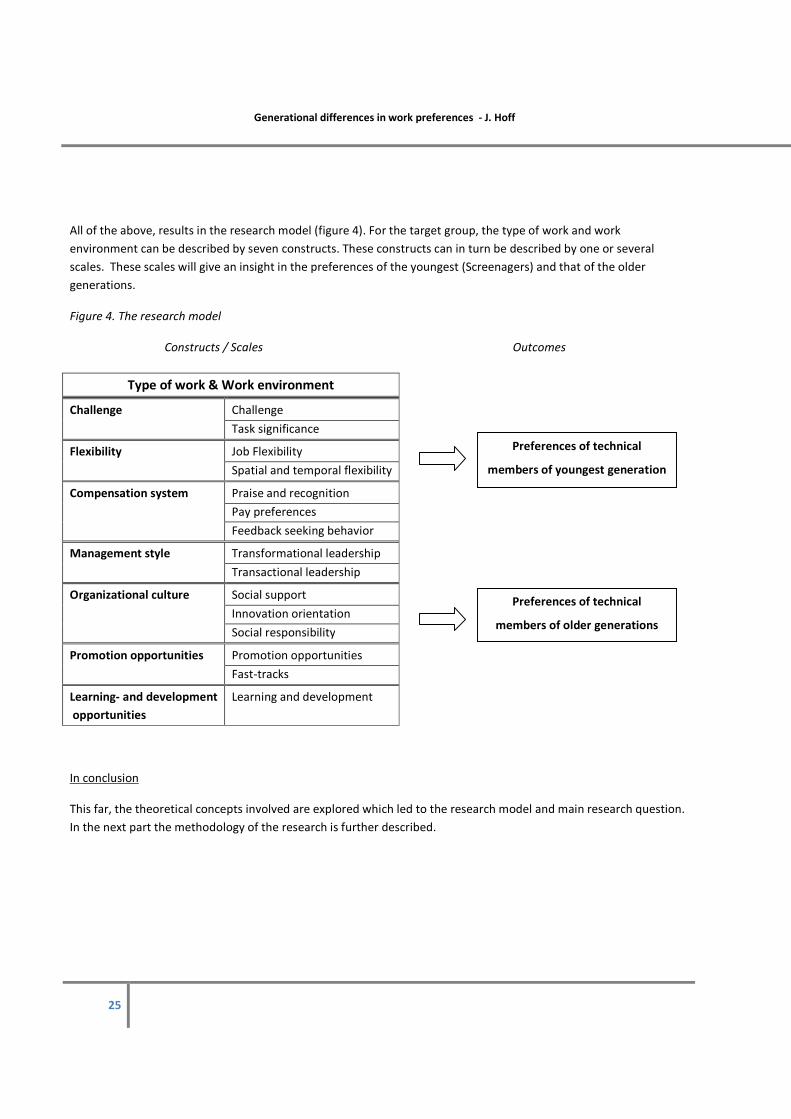
Generational differences in work preferences - J. Hoff
25
All of the above, results in the research model (figure 4). For the target group, the type of work and work
environment can be described by seven constructs. These constructs can in turn be described by one or several
scales. These scales will give an insight in the preferences of the youngest (Screenagers) and that of the older
generations.
Figure 4. The research model
Constructs / Scales Outcomes
Type of work & Work environment
Challenge Challenge
Task significance
Flexibility Job Flexibility
Spatial and temporal flexibility
Compensation system Praise and recognition
Pay preferences
Feedback seeking behavior
Management style Transformational leadership
Transactional leadership
Organizational culture Social support
Innovation orientation
Social responsibility
Promotion opportunities Promotion opportunities
Fast-tracks
Learning- and development
opportunities
Learning and development
In conclusion
This far, the theoretical concepts involved are explored which led to the research model and main research question.
In the next part the methodology of the research is further described.
Preferences of technical
members of youngest generation
Preferences of technical
members of older generations
Generational differences in work preferences - J. Hoff
26
3. METHODOLOGY
In this chapter the methodological aspects of the research are discussed. First the samples are described,
after that the reliability of the scales is discussed and finally the statistical methods that are to be used are
described.
3.1 SAMPLES
There were two samples of respondents used in this study. On the one hand there was a group of technical students,
on the other hand a group of people working in a Dutch technical research company. The student sample was used
to find out the specific work preferences of future job-seekers. The worker sample was used to get respondents with
similar backgrounds but also representing older generations in order to be able to compare between generations. By
making a comparison, the characteristic work preferences of the youngest generation can be explored. Also, the use
of a student sample as well as a worker sample makes it possible to test the potential effects of work experience.
3.1.1 STUDENT SAMPLE
For the group of students, courses of the masters Applied Physics and Mechanical Engineering were visited where
students were asked to fill in the questionnaire. All of the respondents were in their final year(s) of their study. Of the
in total 69 respondents, 68 were male and only 1 was female (table 1). Year of birth ranged from 1982 to 1989 with
one outlier of 1972 and an average of 1986. The respondents studied at three different universities across the
Netherlands which are the three technical universities in the country. Of the total number of respondents, 29 were
students at the University of Twente, 21 were studying at the University of Delft and 19 were enrolled at the
University of Eindhoven.
3.1.2 WORKER SAMPLE
For the worker sample a different strategy was used. Since this research was performed as an internship at TNO, I
could easily use a web-based questionnaire to acquire respondents. This web-based questionnaire was sent to a total
number of 816 employees. Most of these employees have an academic background whereas others have favored
other types of higher education. After sending a reminder after one week 273 people had filled in the questionnaire
meaning a response rate of 33%. After analyzing the responses it appeared that some questionnaire were only
partially finished where others seemed to be just opened and closed again without filling it in. After removing these
incomplete responses, a number of 194 respondents remained, resulting in a response rate of 24%. Of the total
sample, 18% was female and 82% was male (table 1) and 40% had children whereas 60% did not. The age of
participants ranged from approximately 20 years to 70 years. In exploring the generational diversity of the sample
the Dutch classification was used. It showed that 15% belonged to the Screenagers, 47% to the Pragmatic
Generation, 27% to Generation X and the other 11% were Babyboomers. To check how the sample relates to the full
population, a comparison was made with an overview of all employees at TNO. In the full TNO population only 5% is
member of the Screenagers, 46% of the Pragmatic generation, 35% of Generation X and 14% of the Babyboomers.
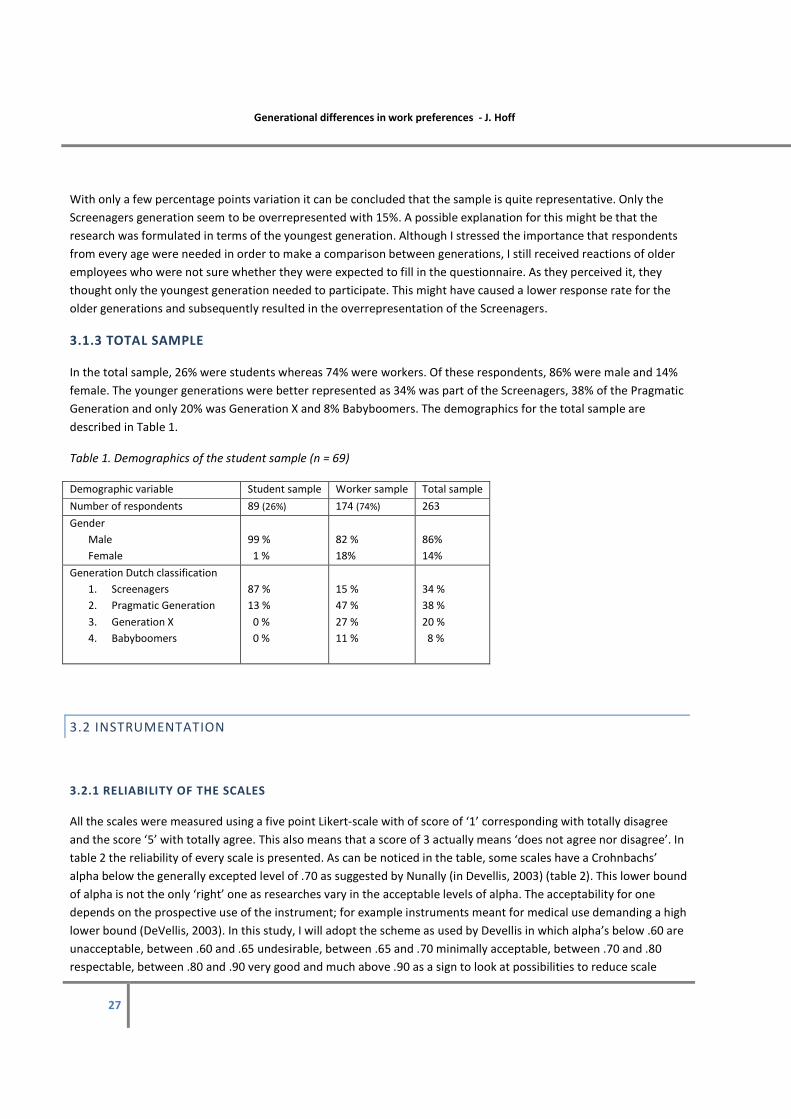
Generational differences in work preferences - J. Hoff
27
With only a few percentage points variation it can be concluded that the sample is quite representative. Only the
Screenagers generation seem to be overrepresented with 15%. A possible explanation for this might be that the
research was formulated in terms of the youngest generation. Although I stressed the importance that respondents
from every age were needed in order to make a comparison between generations, I still received reactions of older
employees who were not sure whether they were expected to fill in the questionnaire. As they perceived it, they
thought only the youngest generation needed to participate. This might have caused a lower response rate for the
older generations and subsequently resulted in the overrepresentation of the Screenagers.
3.1.3 TOTAL SAMPLE
In the total sample, 26% were students whereas 74% were workers. Of these respondents, 86% were male and 14%
female. The younger generations were better represented as 34% was part of the Screenagers, 38% of the Pragmatic
Generation and only 20% was Generation X and 8% Babyboomers. The demographics for the total sample are
described in Table 1.
Table 1. Demographics of the student sample (n = 69)
Demographic variable Student sample Worker sample Total sample
Number of respondents 89 (26%) 174 (74%) 263
Gender
Male
Female
99 %
1 %
82 %
18%
86%
14%
Generation Dutch classification
1. Screenagers
2. Pragmatic Generation
3. Generation X
4. Babyboomers
87 %
13 %
0 %
0 %
15 %
47 %
27 %
11 %
34 %
38 %
20 %
8 %
3.2 INSTRUMENTATION
3.2.1 RELIABILITY OF THE SCALES
All the scales were measured using a five point Likert-scale with of score of ‘1’ corresponding with totally disagree
and the score ‘5’ with totally agree. This also means that a score of 3 actually means ‘does not agree nor disagree’. In
table 2 the reliability of every scale is presented. As can be noticed in the table, some scales have a Crohnbachs’
alpha below the generally excepted level of .70 as suggested by Nunally (in Devellis, 2003) (table 2). This lower bound
of alpha is not the only ‘right’ one as researches vary in the acceptable levels of alpha. The acceptability for one
depends on the prospective use of the instrument; for example instruments meant for medical use demanding a high
lower bound (DeVellis, 2003). In this study, I will adopt the scheme as used by Devellis in which alpha’s below .60 are
unacceptable, between .60 and .65 undesirable, between .65 and .70 minimally acceptable, between .70 and .80
respectable, between .80 and .90 very good and much above .90 as a sign to look at possibilities to reduce scale
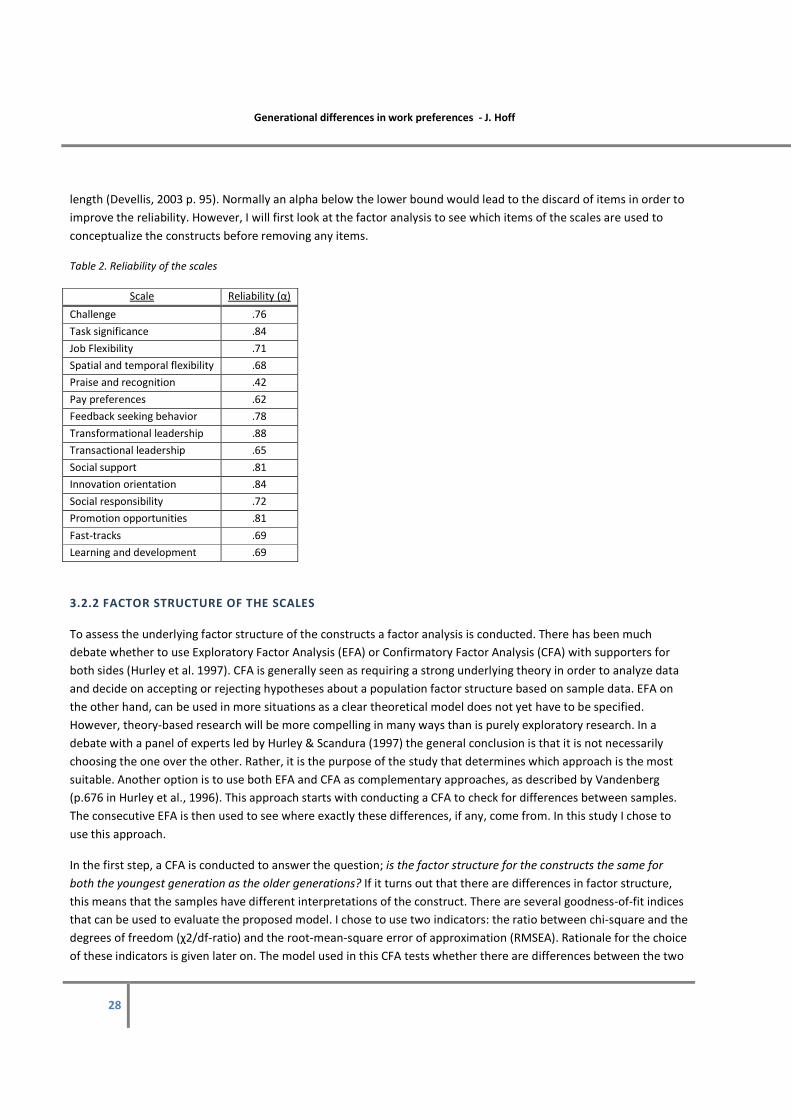
Generational differences in work preferences - J. Hoff
28
length (Devellis, 2003 p. 95). Normally an alpha below the lower bound would lead to the discard of items in order to
improve the reliability. However, I will first look at the factor analysis to see which items of the scales are used to
conceptualize the constructs before removing any items.
Table 2. Reliability of the scales
Scale Reliability (α)
Challenge .76
Task significance .84
Job Flexibility .71
Spatial and temporal flexibility .68
Praise and recognition .42
Pay preferences .62
Feedback seeking behavior .78
Transformational leadership .88
Transactional leadership .65
Social support .81
Innovation orientation .84
Social responsibility .72
Promotion opportunities .81
Fast-tracks .69
Learning and development .69
3.2.2 FACTOR STRUCTURE OF THE SCALES
To assess the underlying factor structure of the constructs a factor analysis is conducted. There has been much
debate whether to use Exploratory Factor Analysis (EFA) or Confirmatory Factor Analysis (CFA) with supporters for
both sides (Hurley et al. 1997). CFA is generally seen as requiring a strong underlying theory in order to analyze data
and decide on accepting or rejecting hypotheses about a population factor structure based on sample data. EFA on
the other hand, can be used in more situations as a clear theoretical model does not yet have to be specified.
However, theory-based research will be more compelling in many ways than is purely exploratory research. In a
debate with a panel of experts led by Hurley & Scandura (1997) the general conclusion is that it is not necessarily
choosing the one over the other. Rather, it is the purpose of the study that determines which approach is the most
suitable. Another option is to use both EFA and CFA as complementary approaches, as described by Vandenberg
(p.676 in Hurley et al., 1996). This approach starts with conducting a CFA to check for differences between samples.
The consecutive EFA is then used to see where exactly these differences, if any, come from. In this study I chose to
use this approach.
In the first step, a CFA is conducted to answer the question; is the factor structure for the constructs the same for
both the youngest generation as the older generations? If it turns out that there are differences in factor structure,
this means that the samples have different interpretations of the construct. There are several goodness-of-fit indices
that can be used to evaluate the proposed model. I chose to use two indicators: the ratio between chi-square and the
degrees of freedom (χ2/df-ratio) and the root-mean-square error of approximation (RMSEA). Rationale for the choice
of these indicators is given later on. The model used in this CFA tests whether there are differences between the two
Generational differences in work preferences - J. Hoff
29
samples. A good fit of the model leads to the conclusion that there are no differences between youngsters and non-
youngsters on the relevant construct. A bad fit on the other hand suggests that there are differences in factor
structure between the samples.
The χ2/df-ratio is also referred to as a badness-of-fit measure in the sense that large values correspond to a bad fit
and small values to good fit (Jöreskog & Sörbom, 1989). To determine what values are ‘low’, different lower bounds
have been used with lower values indicating good fit. In the construction of the WDQ for example, Morgeson &
Humphrey (2006) followed Arbuckle as they used a ratio of 2.0 to indicate a good fit. However, as Mueller (1996)
notes, other researchers have used values of 3 or 4 as indicators of good fit. Because I’m looking for differences in
factor structure I will use the relatively high value of 4 which means that relatively high values are required in order
to conclude that there is a difference in factor structure. This high value is chosen to exclude the possibility of
capitalizing on chance.
The RMSEA tries to answer the following question: how well would the model, with unknown but optimally chosen
parameters, fit the population covariance matrix if it were available? The general scheme used to evaluate values is
as follows: values below .05 indicate a good fit, values between .05 and .08 indicate a reasonable fit, values between
.08 and .10 a mediocre fit and values of ≥.10 a poor fit. Once again, as I’m consciously looking for differences, my
interest lies in constructs that show a poor fit. Therefore I will use the relatively high lower bound of .10 in order to
be sure that the conclusions are made.
The next step in exploring differences in kinds of preferences is an EFA. The results from the CFA only show that
there are differences in the factor structure of the construct between the two samples. The EFA can give insight in
where exactly these differences occur; is it caused by one specific item that did not load on the construct or are there
several items in a scale that show different patterns. After reviewing item content, this analysis will result in insight in
the core aspects of certain constructs and differences between samples on these core aspects. There are several
options in method of extraction and rotation in performing an EFA. As extraction method I used the maximum
likelihood approach as Fabrigar, Wegener, MacCallum and Strahan (1999) argue that if data are relatively normally
distributed, maximum likelihood is the best choice. This is because “it allows for the computation of a wide range of
indexes of the goodness of fit of the model [and] permits statistical significance testing of factor loadings and
correlations among factors and the computation of confidence intervals.” (p. 277) (as cited in Costello & Osborne,
2005). The rotation method used, is the orthogonal method of varimax. In order to be able to correctly interpret the
results of the EFA, there are a few conditions the sample has to meet. The average communalities, the Kaiser-Meyer-
Olkin measure and Bartlett’s test of sphericity all have to have certain values. These conditions are checked before
conducting the EFA.
In conclusion
In this chapter, the procedure of the research and the respondent samples are described. Also, the reliability of the
scales is given. In the next part the results of the analyses will be presented.
Generational differences in work preferences - J. Hoff
30
4. RESULTS
In this chapter, the results of the factor analyses are discussed. Subsequently the results of the reliability
analysis on the reduced scales are discussed. Eventually, the results of the t test are presented to compare
levels of preferences of several samples.
The results of the analysis can be distinguished into two types. On the hand the types of results that help answer the
question whether there are differences between youngsters and non-youngsters. These results will give insight in
differences in kinds of preferences. On the other hand there are the types of results that point out whether
youngsters really do value the used constructs more than non-youngsters, as suggested in the literature. These
results will give insight in differences in level of preferences.
4.1 FACTOR ANALYSIS
4.1.1 CONFIRMATORY FACTOR ANALYSIS
There were some scales that showed to have difference in factor structure and others that did not. Results are
presented in table 3. As can be seen there are nine scales that exceed the .10 threshold for the RMSEA. Job flexibility,
flexibility, innovation orientation, social responsibility, fast-tracks and learning and development all had values of
RMSEA below .10. Thus these scales did not reveal significant differences in factor structure and consequently do not
differ in use of core aspects of the construct. The nine scales that do show differences are the constructs where the
youngest generation and older generations have different ways of operationalizing the construct (marked in red in
table 3). In other words, youngsters seem to use different definitions for some work-related constructs than older
generations do.
So it can be concluded that the youngest generation and older generations do differ in kinds of preferences they
have. Where these differences exactly occur and how they are expressed is shown in results of the EFA below.
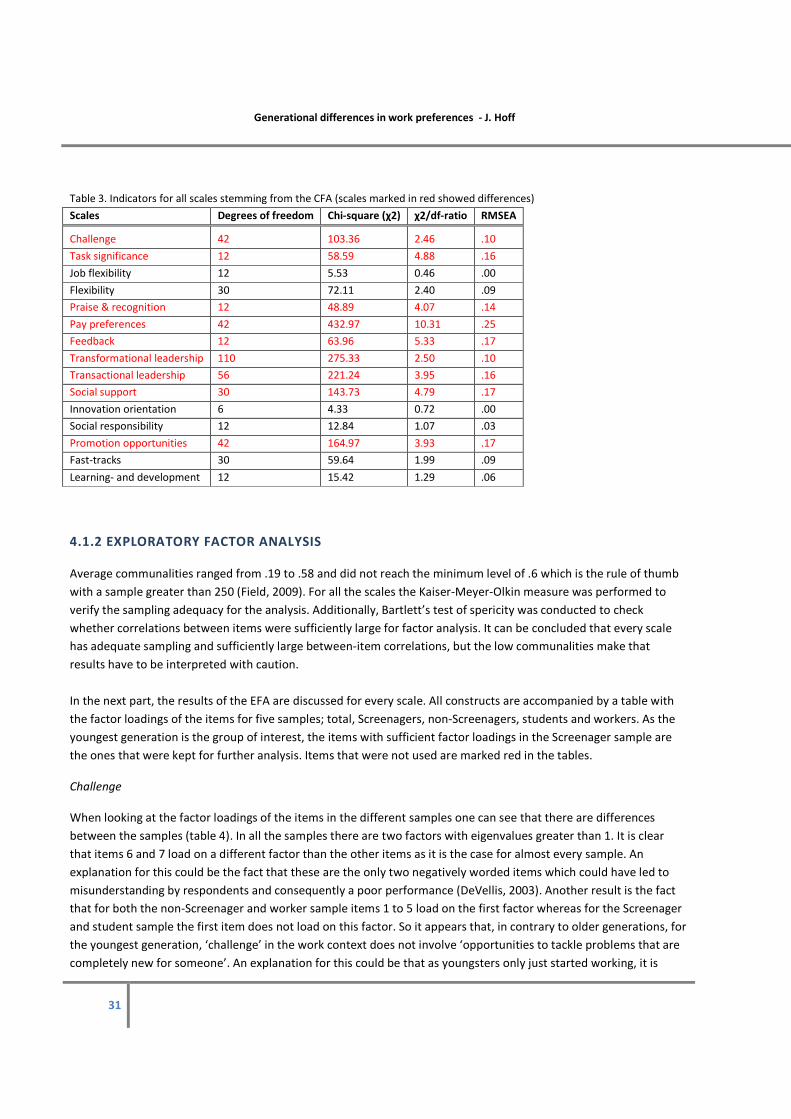
Generational differences in work preferences - J. Hoff
31
Table 3. Indicators for all scales stemming from the CFA (scales marked in red showed differences)
Scales Degrees of freedom Chi-square (χ2) χ2/df-ratio RMSEA
Challenge 42 103.36 2.46 .10
Task significance 12 58.59 4.88 .16
Job flexibility 12 5.53 0.46 .00
Flexibility 30 72.11 2.40 .09
Praise & recognition 12 48.89 4.07 .14
Pay preferences 42 432.97 10.31 .25
Feedback 12 63.96 5.33 .17
Transformational leadership 110 275.33 2.50 .10
Transactional leadership 56 221.24 3.95 .16
Social support 30 143.73 4.79 .17
Innovation orientation 6 4.33 0.72 .00
Social responsibility 12 12.84 1.07 .03
Promotion opportunities 42 164.97 3.93 .17
Fast-tracks 30 59.64 1.99 .09
Learning- and development 12 15.42 1.29 .06
4.1.2 EXPLORATORY FACTOR ANALYSIS
Average communalities ranged from .19 to .58 and did not reach the minimum level of .6 which is the rule of thumb
with a sample greater than 250 (Field, 2009). For all the scales the Kaiser-Meyer-Olkin measure was performed to
verify the sampling adequacy for the analysis. Additionally, Bartlett’s test of spericity was conducted to check
whether correlations between items were sufficiently large for factor analysis. It can be concluded that every scale
has adequate sampling and sufficiently large between-item correlations, but the low communalities make that
results have to be interpreted with caution.
In the next part, the results of the EFA are discussed for every scale. All constructs are accompanied by a table with
the factor loadings of the items for five samples; total, Screenagers, non-Screenagers, students and workers. As the
youngest generation is the group of interest, the items with sufficient factor loadings in the Screenager sample are
the ones that were kept for further analysis. Items that were not used are marked red in the tables.
Challenge
When looking at the factor loadings of the items in the different samples one can see that there are differences
between the samples (table 4). In all the samples there are two factors with eigenvalues greater than 1. It is clear
that items 6 and 7 load on a different factor than the other items as it is the case for almost every sample. An
explanation for this could be the fact that these are the only two negatively worded items which could have led to
misunderstanding by respondents and consequently a poor performance (DeVellis, 2003). Another result is the fact
that for both the non-Screenager and worker sample items 1 to 5 load on the first factor whereas for the Screenager
and student sample the first item does not load on this factor. So it appears that, in contrary to older generations, for
the youngest generation, ‘challenge’ in the work context does not involve ‘opportunities to tackle problems that are
completely new for someone’. An explanation for this could be that as youngsters only just started working, it is

Generational differences in work preferences - J. Hoff
32
inevitable that most problems will be new. Older people on the other hand, probably have regularly encountered the
same problems, so if a problem is completely new for them this will be more likely to be considered challenging. In
summary, aspects that are considered challenging work by the youngest generation are: ‘solving complicated
problems, the notion that the more complex the problem the more fun, work that offers opportunities to develop
knowledge skills and curiosity as a driving force’. In the process of developing a questionnaire for the work
preferences of young people I will use the conceptualization of the Screenager sample to explore the data further.
For the challenge scales this means I will use items 2, 3, 4 and 5.
Table 4. Factor loadings for the challenge-scale
Task significance
Although there were significant differences in the factor structure between generations, all samples extracted one
factor. The differences can therefore be found in the factor loadings of the items. In the Screenager sample, items 3
and 4 both have loadings greater than .9, item 1 a reasonable loading of .68 and item 2 just barely reaches the limit
of .4 (table 5). In the student sample the same tendency can be noticed, with item 2 loading below .40. When looking
at item content, this could be explained by the fact that item 2 deviates from the other three. Where items 1, 3 and 4
are concerned with the influence or effect one’s work has on a specific entity, ‘lifes of other people’ or ‘people
outside the organization’, item 2 is formulated much more general as it concerns ‘importance in a broad sense’. So
when it comes to the significance of a task, youngsters seem to interpret this as concerning the influence on other
people rather than in a general sense. In the non-Screenager sample the loadings have less variance with a loading of
.86 being the highest and .65 the lowest. In this sample, item 2 even has a higher factor loading than item 1. This is
the same for the worker sample. So in contrary to youngsters, non-youngsters and workers do not seem to
distinguish between ‘influence/effect on others’ and ‘meaningfulness in a broad sense’ when it comes to task
significance. Nevertheless, as all items still have a sufficient loading I will continue to use all four items in further
analysis.
Total
sample Screenagers
Non-
Screenagers Students Workers
Challenge 1 2 1 2 1 2 1 2 1 2
Ik wil werk dat de mogelijkheid biedt om problemen
aan te pakken die helemaal nieuw voor me zijn ,523 ,616 ,577
In mijn werk wil ik ingewikkelde problemen oplossen ,760 ,693 ,485 ,761 ,832 ,437 ,743
Hoe moeilijker een probleem, hoe leuker ik het vind
om het op te lossen ,606 ,486 ,638 ,485 ,621
Ik wil werk dat mij kansen biedt om mijn kennis en
vaardigheden te vergroten ,474 ,415 ,504 ,508
Nieuwsgierigheid is de drijvende kracht achter veel
van wat ik doe ,555 ,440 ,603 ,439 ,602
Ik heb liever werk waarvan ik weet dat ik het kan dan,
dan werk waarbij het uiterste van mijn vaardigheden
wordt gevraagd (R)
,996 ,999 ,994 ,998 ,995
Ik wil werk met vrij eenvoudige, eenduidige taken (R) ,421 ,447 ,447 ,410
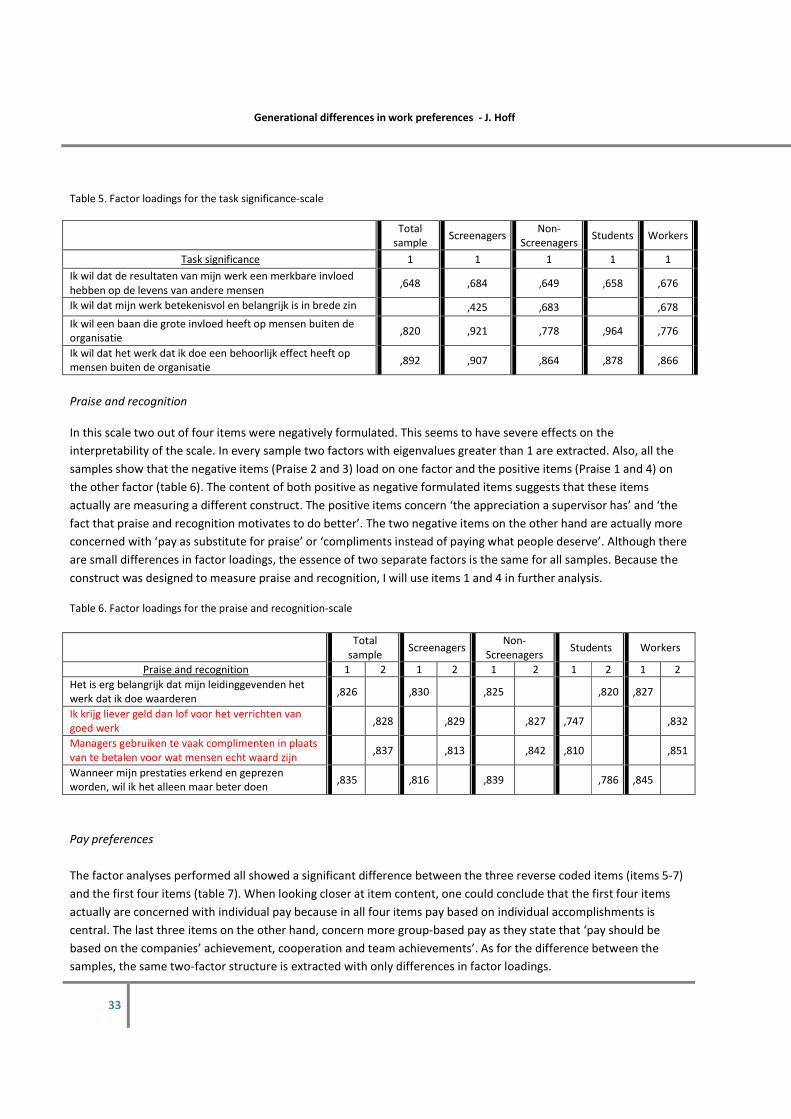
Generational differences in work preferences - J. Hoff
33
Table 5. Factor loadings for the task significance-scale
Total
sample Screenagers
Non-
Screenagers Students Workers
Task significance 1 1 1 1 1
Ik wil dat de resultaten van mijn werk een merkbare invloed
hebben op de levens van andere mensen
,648 ,684 ,649 ,658 ,676
Ik wil dat mijn werk betekenisvol en belangrijk is in brede zin
,425 ,683 ,678
Ik wil een baan die grote invloed heeft op mensen buiten de
organisatie
,820 ,921 ,778 ,964 ,776
Ik wil dat het werk dat ik doe een behoorlijk effect heeft op
mensen buiten de organisatie
,892 ,907 ,864 ,878 ,866
Praise and recognition
In this scale two out of four items were negatively formulated. This seems to have severe effects on the
interpretability of the scale. In every sample two factors with eigenvalues greater than 1 are extracted. Also, all the
samples show that the negative items (Praise 2 and 3) load on one factor and the positive items (Praise 1 and 4) on
the other factor (table 6). The content of both positive as negative formulated items suggests that these items
actually are measuring a different construct. The positive items concern ‘the appreciation a supervisor has’ and ‘the
fact that praise and recognition motivates to do better’. The two negative items on the other hand are actually more
concerned with ‘pay as substitute for praise’ or ‘compliments instead of paying what people deserve’. Although there
are small differences in factor loadings, the essence of two separate factors is the same for all samples. Because the
construct was designed to measure praise and recognition, I will use items 1 and 4 in further analysis.
Table 6. Factor loadings for the praise and recognition-scale
Pay preferences
The factor analyses performed all showed a significant difference between the three reverse coded items (items 5-7)
and the first four items (table 7). When looking closer at item content, one could conclude that the first four items
actually are concerned with individual pay because in all four items pay based on individual accomplishments is
central. The last three items on the other hand, concern more group-based pay as they state that ‘pay should be
based on the companies’ achievement, cooperation and team achievements’. As for the difference between the
samples, the same two-factor structure is extracted with only differences in factor loadings.
Total
sample Screenagers
Non-
Screenagers Students Workers
Praise and recognition 1 2 1 2 1 2 1 2 1 2
Het is erg belangrijk dat mijn leidinggevenden het
werk dat ik doe waarderen
,826 ,830 ,825 ,820 ,827
Ik krijg liever geld dan lof voor het verrichten van
goed werk
,828 ,829 ,827 ,747 ,832
Managers gebruiken te vaak complimenten in plaats
van te betalen voor wat mensen echt waard zijn
,837 ,813 ,842 ,810 ,851
Wanneer mijn prestaties erkend en geprezen
worden, wil ik het alleen maar beter doen
,835 ,816 ,839 ,786 ,845
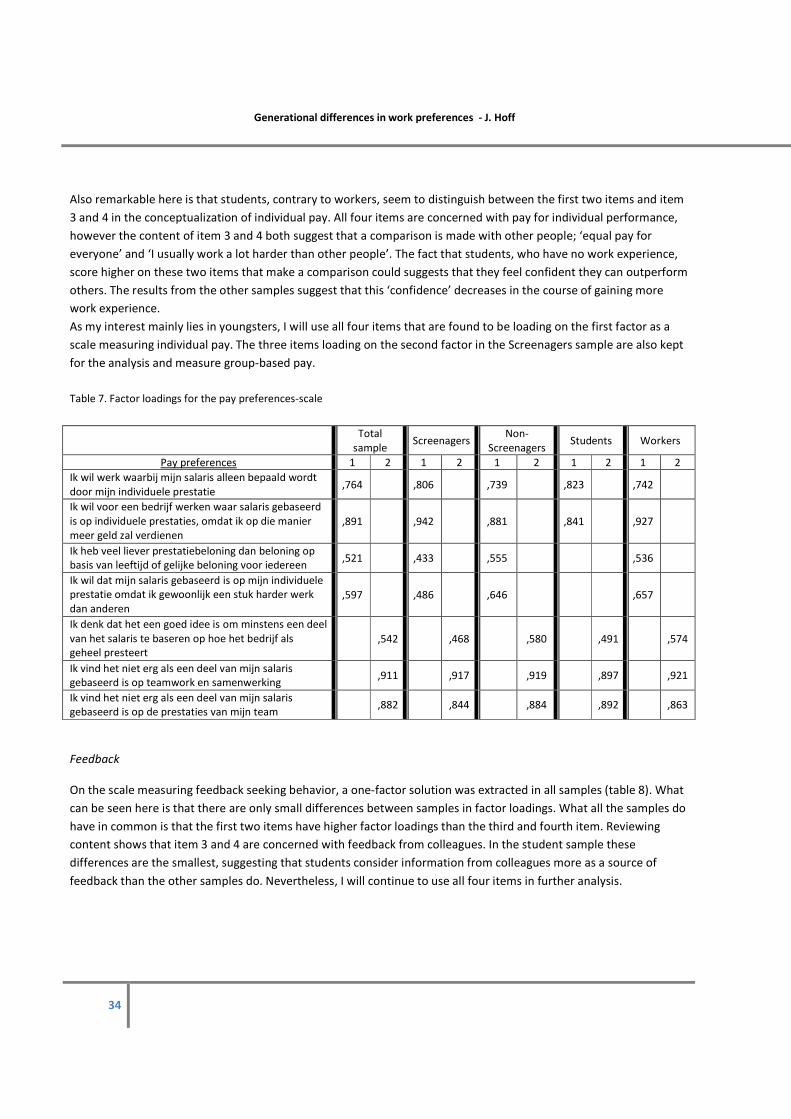
Generational differences in work preferences - J. Hoff
34
Also remarkable here is that students, contrary to workers, seem to distinguish between the first two items and item
3 and 4 in the conceptualization of individual pay. All four items are concerned with pay for individual performance,
however the content of item 3 and 4 both suggest that a comparison is made with other people; ‘equal pay for
everyone’ and ‘I usually work a lot harder than other people’. The fact that students, who have no work experience,
score higher on these two items that make a comparison could suggests that they feel confident they can outperform
others. The results from the other samples suggest that this ‘confidence’ decreases in the course of gaining more
work experience.
As my interest mainly lies in youngsters, I will use all four items that are found to be loading on the first factor as a
scale measuring individual pay. The three items loading on the second factor in the Screenagers sample are also kept
for the analysis and measure group-based pay.
Table 7. Factor loadings for the pay preferences-scale
Feedback
On the scale measuring feedback seeking behavior, a one-factor solution was extracted in all samples (table 8). What
can be seen here is that there are only small differences between samples in factor loadings. What all the samples do
have in common is that the first two items have higher factor loadings than the third and fourth item. Reviewing
content shows that item 3 and 4 are concerned with feedback from colleagues. In the student sample these
differences are the smallest, suggesting that students consider information from colleagues more as a source of
feedback than the other samples do. Nevertheless, I will continue to use all four items in further analysis.
Total
sample Screenagers
Non-
Screenagers Students Workers
Pay preferences 1 2 1 2 1 2 1 2 1 2
Ik wil werk waarbij mijn salaris alleen bepaald wordt
door mijn individuele prestatie
,764 ,806 ,739 ,823 ,742
Ik wil voor een bedrijf werken waar salaris gebaseerd
is op individuele prestaties, omdat ik op die manier
meer geld zal verdienen
,891 ,942 ,881 ,841 ,927
Ik heb veel liever prestatiebeloning dan beloning op
basis van leeftijd of gelijke beloning voor iedereen
,521 ,433 ,555 ,536
Ik wil dat mijn salaris gebaseerd is op mijn individuele
prestatie omdat ik gewoonlijk een stuk harder werk
dan anderen
,597 ,486 ,646 ,657
Ik denk dat het een goed idee is om minstens een deel
van het salaris te baseren op hoe het bedrijf als
geheel presteert
,542 ,468 ,580 ,491 ,574
Ik vind het niet erg als een deel van mijn salaris
gebaseerd is op teamwork en samenwerking
,911 ,917 ,919 ,897 ,921
Ik vind het niet erg als een deel van mijn salaris
gebaseerd is op de prestaties van mijn team
,882 ,844 ,884 ,892 ,863

Generational differences in work preferences - J. Hoff
35
Table 8. Factor loadings for the feedback seeking behavior-scale
Total
sample Screenagers
Non-
Screenagers Students Workers
Feedback seeking behavior 1 1 1 1 1
vraag ik rechtstreeks aan mijn leidinggevende naar
informatie over mijn prestaties
,910 ,894 ,915 ,846 ,914
vraag ik rechtstreeks aan mijn leidinggevende om een
informele beoordeling van mijn werk
,872 ,827 ,891 ,747 ,911
zoek ik naar informatie van mijn collega’s over mijn
prestaties
,436 ,430 ,447 ,563 ,417
vraag ik aan mijn collega’s om feedback terwijl ik bezig ben
,452 ,444 ,456 ,508 ,450
Transformational leadership
The transformational leadership scale seemed to have a simple one factor structure following from the factor
analysis on the total sample. However, when distinguishing between generations and work experience remarkable
differences were found. While some samples had only one factor, others found a three-factor structure (table 9).
According to the structure that is extracted in the Screenager-sample, seven of the eleven items load on the factor
that measures transformational leadership. In other words, these seven aspects are the key terms in which
transformational leadership can be described according to the youngest generation.
There is one item that seems to be distinctive for the youngest generation. This is the item that states that a leader
should have ‘vision and a clear picture of the future’. So according to youngsters a leader should have and convey
clear thoughts on which direction to go in the future. The items that are not included in the definition for the
youngest generation but are for the older generations, concern the following characteristics of leaders: ‘stimulating
employees to think about problems in a new way, encourages employees to think independently and delegates
challenging responsibilities to employees’. These three items can be characterized by behavior that is aimed at
empowering employees and facilitating in the process of employee influence. Apparently, the youngest generation
does not consider these behavioral patterns as distinctive for a transformational leader. Further, the student sample
on its turn has its own pattern of items loading on the first factor. Characteristic of the items used in their
operationalization is that they are all concerned with active involvement and empowerment of employees. The
worker sample eventually seems to use the broadest way of defining transformational leadership. Their experience in
work and consequently with several leaders could explain the wide arrange of behavior a transformational leader
could (and should) display. In the analysis I will use the items that are extracted on the first factor by the Screenagers
sample. This means I will discard items 2, 4, 5 and 11 and carry on with items 1, 3, and 6-10.
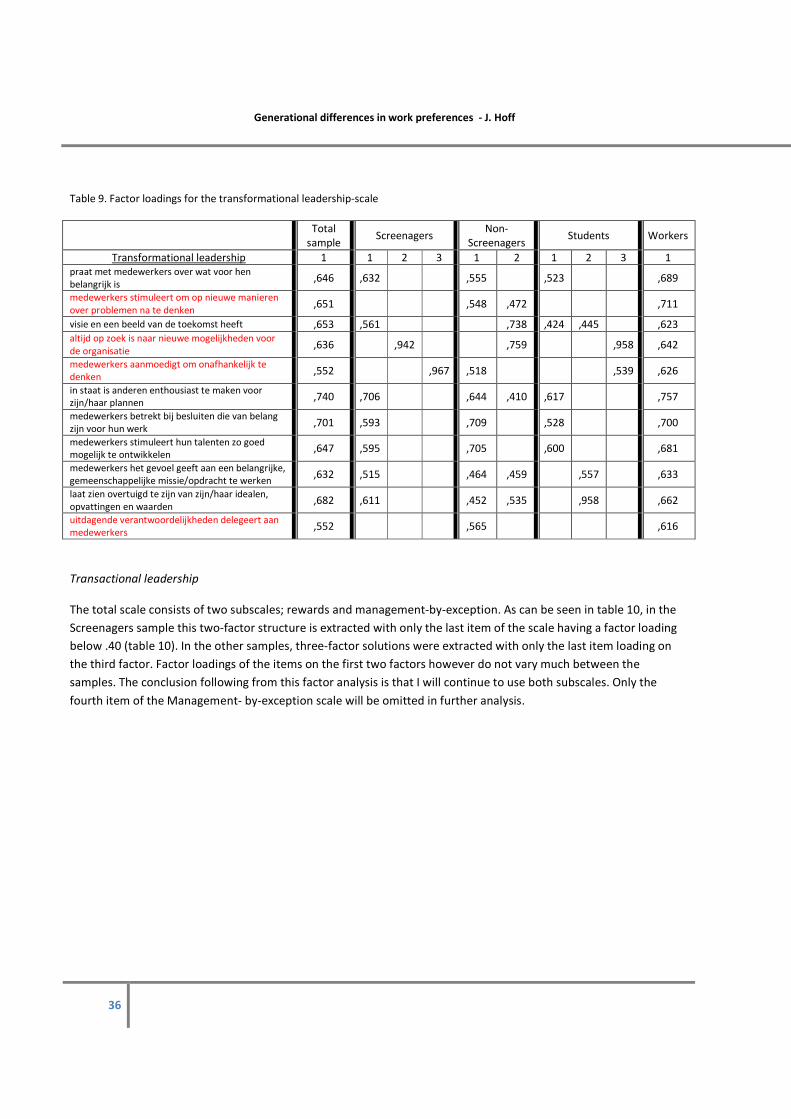
Generational differences in work preferences - J. Hoff
36
Table 9. Factor loadings for the transformational leadership-scale
Total
sample Screenagers
Non-
Screenagers Students Workers
Transformational leadership 1 1 2 3 1 2 1 2 3 1
praat met medewerkers over wat voor hen
belangrijk is ,646 ,632 ,555 ,523 ,689
medewerkers stimuleert om op nieuwe manieren
over problemen na te denken ,651 ,548 ,472 ,711
visie en een beeld van de toekomst heeft ,653 ,561 ,738 ,424 ,445 ,623
altijd op zoek is naar nieuwe mogelijkheden voor
de organisatie ,636 ,942 ,759 ,958 ,642
medewerkers aanmoedigt om onafhankelijk te
denken ,552 ,967 ,518 ,539 ,626
in staat is anderen enthousiast te maken voor
zijn/haar plannen ,740 ,706 ,644 ,410 ,617 ,757
medewerkers betrekt bij besluiten die van belang
zijn voor hun werk ,701 ,593 ,709 ,528 ,700
medewerkers stimuleert hun talenten zo goed
mogelijk te ontwikkelen ,647 ,595 ,705 ,600 ,681
medewerkers het gevoel geeft aan een belangrijke,
gemeenschappelijke missie/opdracht te werken ,632 ,515 ,464 ,459 ,557 ,633
laat zien overtuigd te zijn van zijn/haar idealen,
opvattingen en waarden ,682 ,611 ,452 ,535 ,958 ,662
uitdagende verantwoordelijkheden delegeert aan
medewerkers ,552 ,565 ,616
Transactional leadership
The total scale consists of two subscales; rewards and management-by-exception. As can be seen in table 10, in the
Screenagers sample this two-factor structure is extracted with only the last item of the scale having a factor loading
below .40 (table 10). In the other samples, three-factor solutions were extracted with only the last item loading on
the third factor. Factor loadings of the items on the first two factors however do not vary much between the
samples. The conclusion following from this factor analysis is that I will continue to use both subscales. Only the
fourth item of the Management- by-exception scale will be omitted in further analysis.
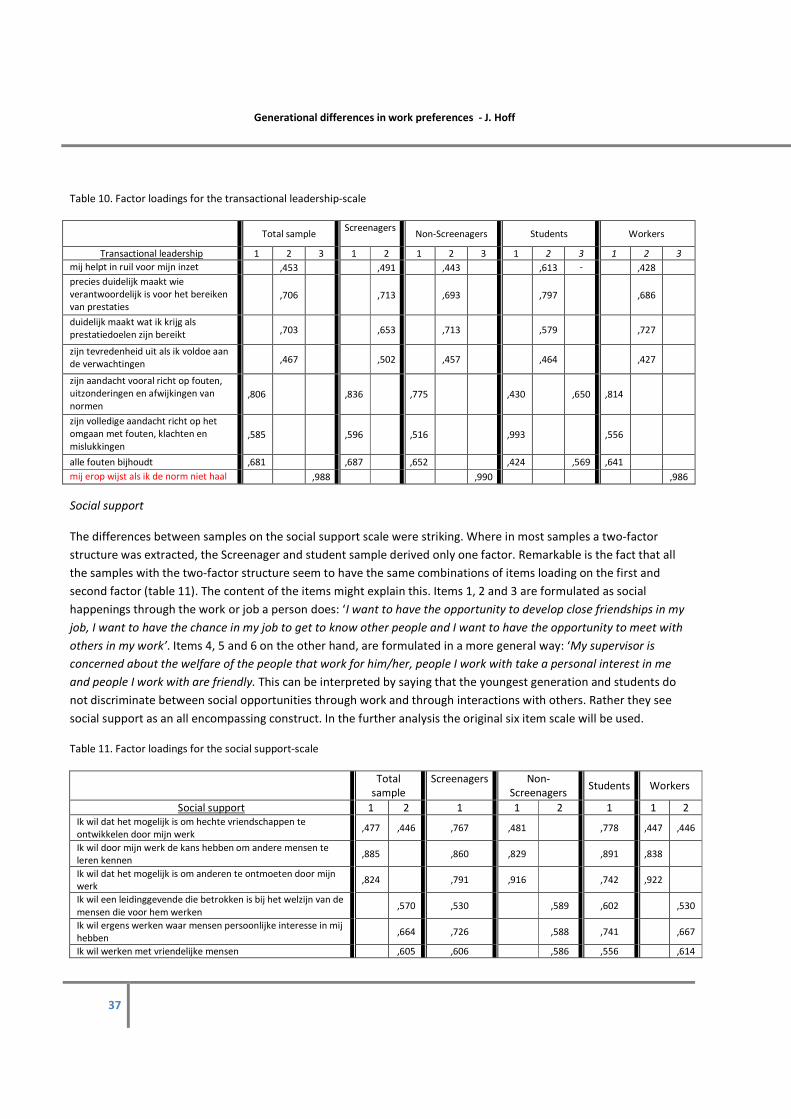
Generational differences in work preferences - J. Hoff
37
Table 10. Factor loadings for the transactional leadership-scale
Total sample
Screenagers
Non-Screenagers Students Workers
Transactional leadership 1 2 3 1 2 1 2 3 1 2 3 1 2 3
mij helpt in ruil voor mijn inzet
,453 ,491 ,443 ,613 -
,611
,428
precies duidelijk maakt wie
verantwoordelijk is voor het bereiken
van prestaties
,706 ,713 ,693 ,797 ,686
duidelijk maakt wat ik krijg als
prestatiedoelen zijn bereikt
,703 ,653 ,713 ,579 ,727
zijn tevredenheid uit als ik voldoe aan
de verwachtingen
,467 ,502 ,457 ,464 ,427
zijn aandacht vooral richt op fouten,
uitzonderingen en afwijkingen van
normen
,806 ,836 ,775 ,430 ,650 ,814
zijn volledige aandacht richt op het
omgaan met fouten, klachten en
mislukkingen
,585 ,596 ,516 ,993 ,556
alle fouten bijhoudt ,681 ,687 ,652 ,424 ,569 ,641
mij erop wijst als ik de norm niet haal
,988 ,990 ,986
Social support
The differences between samples on the social support scale were striking. Where in most samples a two-factor
structure was extracted, the Screenager and student sample derived only one factor. Remarkable is the fact that all
the samples with the two-factor structure seem to have the same combinations of items loading on the first and
second factor (table 11). The content of the items might explain this. Items 1, 2 and 3 are formulated as social
happenings through the work or job a person does: ‘I want to have the opportunity to develop close friendships in my
job, I want to have the chance in my job to get to know other people and I want to have the opportunity to meet with
others in my work’. Items 4, 5 and 6 on the other hand, are formulated in a more general way: ‘My supervisor is
concerned about the welfare of the people that work for him/her, people I work with take a personal interest in me
and people I work with are friendly. This can be interpreted by saying that the youngest generation and students do
not discriminate between social opportunities through work and through interactions with others. Rather they see
social support as an all encompassing construct. In the further analysis the original six item scale will be used.
Table 11. Factor loadings for the social support-scale
Total
sample
Screenagers
Non-
Screenagers Students Workers
Social support 1 2 1 1 2 1 1 2
Ik wil dat het mogelijk is om hechte vriendschappen te
ontwikkelen door mijn werk ,477 ,446 ,767 ,481 ,778 ,447 ,446
Ik wil door mijn werk de kans hebben om andere mensen te
leren kennen ,885 ,860 ,829 ,891 ,838
Ik wil dat het mogelijk is om anderen te ontmoeten door mijn
werk ,824 ,791 ,916 ,742 ,922
Ik wil een leidinggevende die betrokken is bij het welzijn van de
mensen die voor hem werken ,570 ,530 ,589 ,602 ,530
Ik wil ergens werken waar mensen persoonlijke interesse in mij
hebben ,664 ,726 ,588 ,741 ,667
Ik wil werken met vriendelijke mensen ,605 ,606 ,586 ,556 ,614
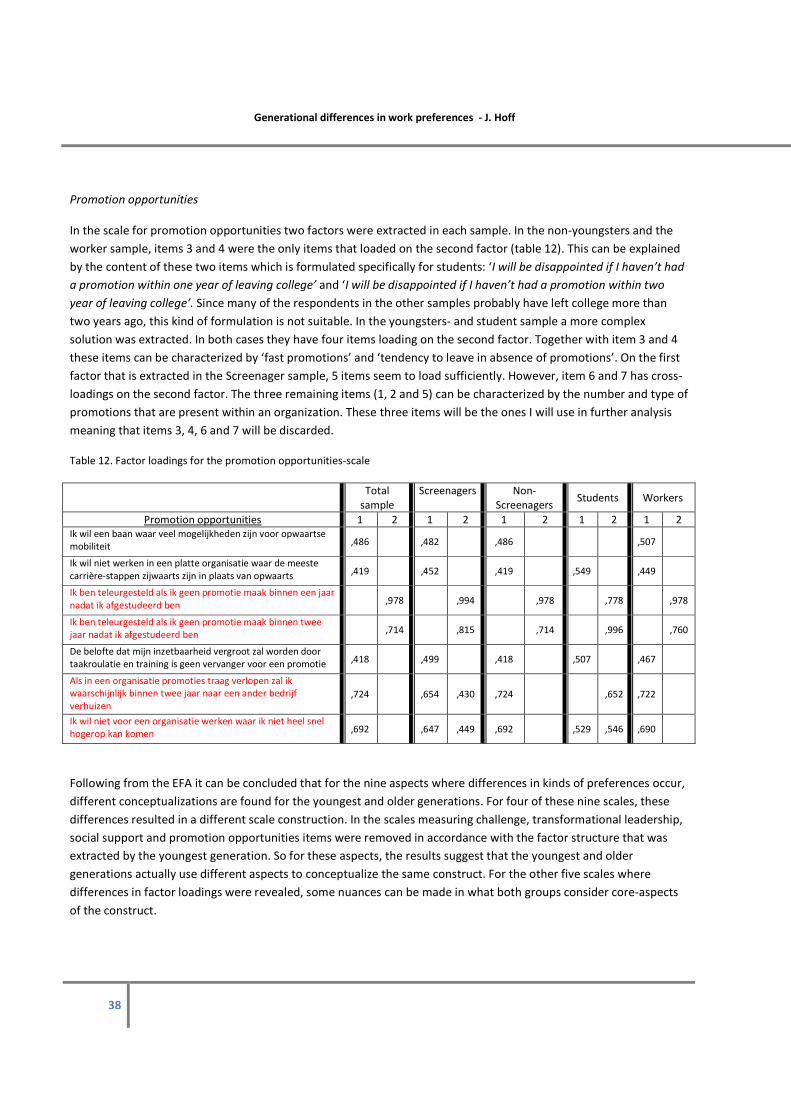
Generational differences in work preferences - J. Hoff
38
Promotion opportunities
In the scale for promotion opportunities two factors were extracted in each sample. In the non-youngsters and the
worker sample, items 3 and 4 were the only items that loaded on the second factor (table 12). This can be explained
by the content of these two items which is formulated specifically for students: ‘I will be disappointed if I haven’t had
a promotion within one year of leaving college’ and ‘I will be disappointed if I haven’t had a promotion within two
year of leaving college’. Since many of the respondents in the other samples probably have left college more than
two years ago, this kind of formulation is not suitable. In the youngsters- and student sample a more complex
solution was extracted. In both cases they have four items loading on the second factor. Together with item 3 and 4
these items can be characterized by ‘fast promotions’ and ‘tendency to leave in absence of promotions’. On the first
factor that is extracted in the Screenager sample, 5 items seem to load sufficiently. However, item 6 and 7 has cross-
loadings on the second factor. The three remaining items (1, 2 and 5) can be characterized by the number and type of
promotions that are present within an organization. These three items will be the ones I will use in further analysis
meaning that items 3, 4, 6 and 7 will be discarded.
Table 12. Factor loadings for the promotion opportunities-scale
Total
sample
Screenagers
Non-
Screenagers Students Workers
Promotion opportunities 1 2 1 2 1 2 1 2 1 2
Ik wil een baan waar veel mogelijkheden zijn voor opwaartse
mobiliteit
,486 ,482 ,486 ,507
Ik wil niet werken in een platte organisatie waar de meeste
carrière-stappen zijwaarts zijn in plaats van opwaarts
,419 ,452 ,419 ,549 ,449
Ik ben teleurgesteld als ik geen promotie maak binnen een jaar
nadat ik afgestudeerd ben
,978 ,994 ,978 ,778 ,978
Ik ben teleurgesteld als ik geen promotie maak binnen twee
jaar nadat ik afgestudeerd ben
,714 ,815 ,714 ,996 ,760
De belofte dat mijn inzetbaarheid vergroot zal worden door
taakroulatie en training is geen vervanger voor een promotie
,418 ,499 ,418 ,507 ,467
Als in een organisatie promoties traag verlopen zal ik
waarschijnlijk binnen twee jaar naar een ander bedrijf
verhuizen
,724 ,654 ,430 ,724 ,652 ,722
Ik wil niet voor een organisatie werken waar ik niet heel snel
hogerop kan komen
,692 ,647 ,449 ,692 ,529 ,546 ,690
Following from the EFA it can be concluded that for the nine aspects where differences in kinds of preferences occur,
different conceptualizations are found for the youngest and older generations. For four of these nine scales, these
differences resulted in a different scale construction. In the scales measuring challenge, transformational leadership,
social support and promotion opportunities items were removed in accordance with the factor structure that was
extracted by the youngest generation. So for these aspects, the results suggest that the youngest and older
generations actually use different aspects to conceptualize the same construct. For the other five scales where
differences in factor loadings were revealed, some nuances can be made in what both groups consider core-aspects
of the construct.
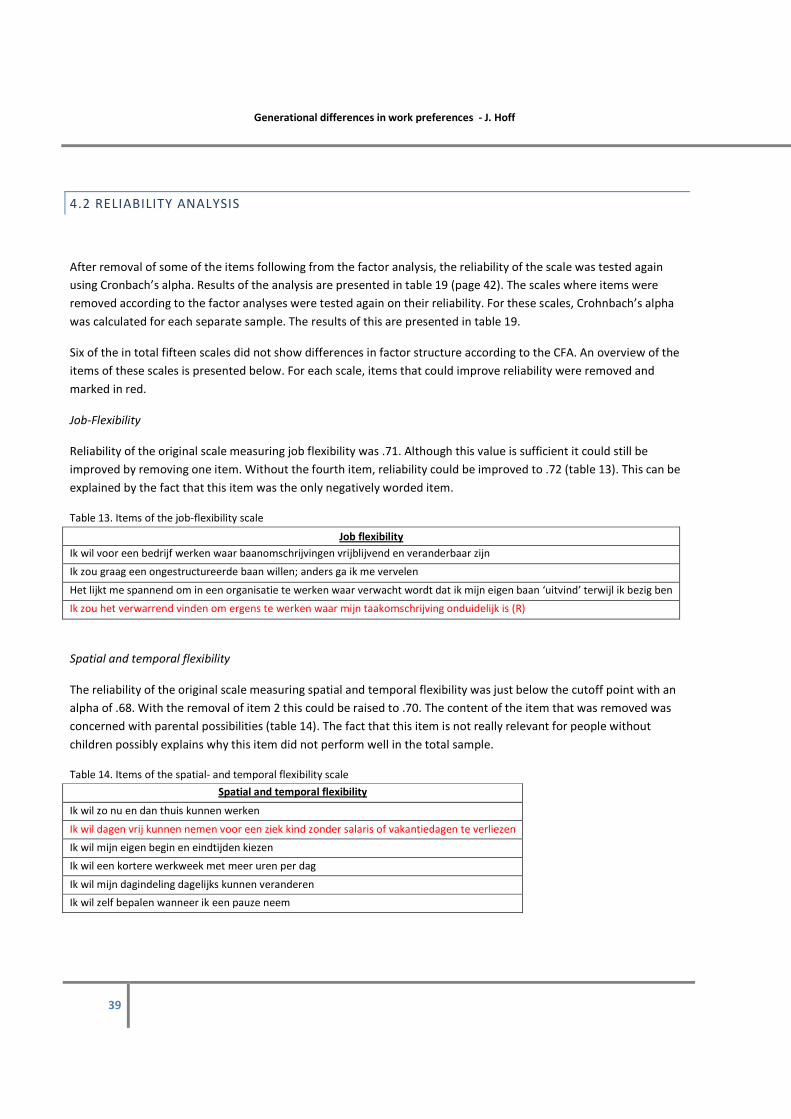
Generational differences in work preferences - J. Hoff
39
4.2 RELIABILITY ANALYSIS
After removal of some of the items following from the factor analysis, the reliability of the scale was tested again
using Cronbach’s alpha. Results of the analysis are presented in table 19 (page 42). The scales where items were
removed according to the factor analyses were tested again on their reliability. For these scales, Crohnbach’s alpha
was calculated for each separate sample. The results of this are presented in table 19.
Six of the in total fifteen scales did not show differences in factor structure according to the CFA. An overview of the
items of these scales is presented below. For each scale, items that could improve reliability were removed and
marked in red.
Job-Flexibility
Reliability of the original scale measuring job flexibility was .71. Although this value is sufficient it could still be
improved by removing one item. Without the fourth item, reliability could be improved to .72 (table 13). This can be
explained by the fact that this item was the only negatively worded item.
Table 13. Items of the job-flexibility scale
Job flexibility
Ik wil voor een bedrijf werken waar baanomschrijvingen vrijblijvend en veranderbaar zijn
Ik zou graag een ongestructureerde baan willen; anders ga ik me vervelen
Het lijkt me spannend om in een organisatie te werken waar verwacht wordt dat ik mijn eigen baan ‘uitvind’ terwijl ik bezig ben
Ik zou het verwarrend vinden om ergens te werken waar mijn taakomschrijving onduidelijk is (R)
Spatial and temporal flexibility
The reliability of the original scale measuring spatial and temporal flexibility was just below the cutoff point with an
alpha of .68. With the removal of item 2 this could be raised to .70. The content of the item that was removed was
concerned with parental possibilities (table 14). The fact that this item is not really relevant for people without
children possibly explains why this item did not perform well in the total sample.
Table 14. Items of the spatial- and temporal flexibility scale
Spatial and temporal flexibility
Ik wil zo nu en dan thuis kunnen werken
Ik wil dagen vrij kunnen nemen voor een ziek kind zonder salaris of vakantiedagen te verliezen
Ik wil mijn eigen begin en eindtijden kiezen
Ik wil een kortere werkweek met meer uren per dag
Ik wil mijn dagindeling dagelijks kunnen veranderen
Ik wil zelf bepalen wanneer ik een pauze neem
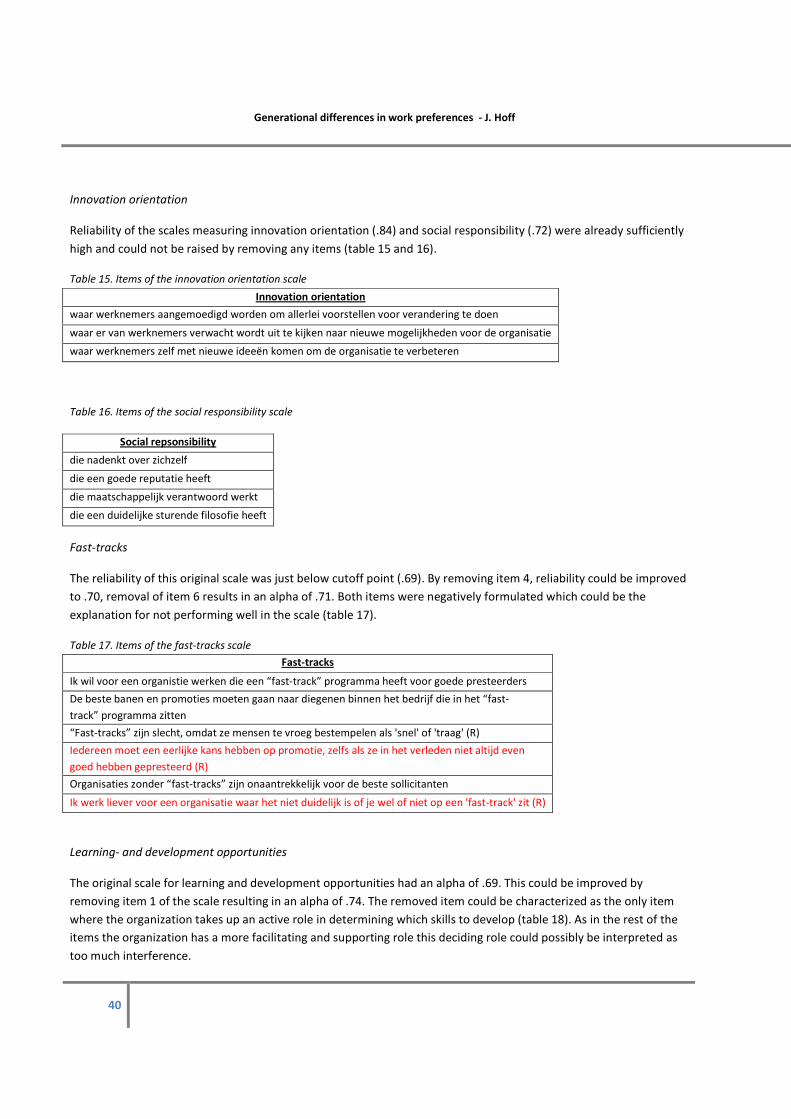
Generational differences in work preferences - J. Hoff
40
Innovation orientation
Reliability of the scales measuring innovation orientation (.84) and social responsibility (.72) were already sufficiently
high and could not be raised by removing any items (table 15 and 16).
Table 15. Items of the innovation orientation scale
Innovation orientation
waar werknemers aangemoedigd worden om allerlei voorstellen voor verandering te doen
waar er van werknemers verwacht wordt uit te kijken naar nieuwe mogelijkheden voor de organisatie
waar werknemers zelf met nieuwe ideeën komen om de organisatie te verbeteren
Table 16. Items of the social responsibility scale
Social repsonsibility
die nadenkt over zichzelf
die een goede reputatie heeft
die maatschappelijk verantwoord werkt
die een duidelijke sturende filosofie heeft
Fast-tracks
The reliability of this original scale was just below cutoff point (.69). By removing item 4, reliability could be improved
to .70, removal of item 6 results in an alpha of .71. Both items were negatively formulated which could be the
explanation for not performing well in the scale (table 17).
Table 17. Items of the fast-tracks scale
Fast-tracks
Ik wil voor een organistie werken die een “fast-track” programma heeft voor goede presteerders
De beste banen en promoties moeten gaan naar diegenen binnen het bedrijf die in het “fast-
track” programma zitten
“Fast-tracks” zijn slecht, omdat ze mensen te vroeg bestempelen als 'snel' of 'traag' (R)
Iedereen moet een eerlijke kans hebben op promotie, zelfs als ze in het verleden niet altijd even
goed hebben gepresteerd (R)
Organisaties zonder “fast-tracks” zijn onaantrekkelijk voor de beste sollicitanten
Ik werk liever voor een organisatie waar het niet duidelijk is of je wel of niet op een 'fast-track' zit (R)
Learning- and development opportunities
The original scale for learning and development opportunities had an alpha of .69. This could be improved by
removing item 1 of the scale resulting in an alpha of .74. The removed item could be characterized as the only item
where the organization takes up an active role in determining which skills to develop (table 18). As in the rest of the
items the organization has a more facilitating and supporting role this deciding role could possibly be interpreted as
too much interference.
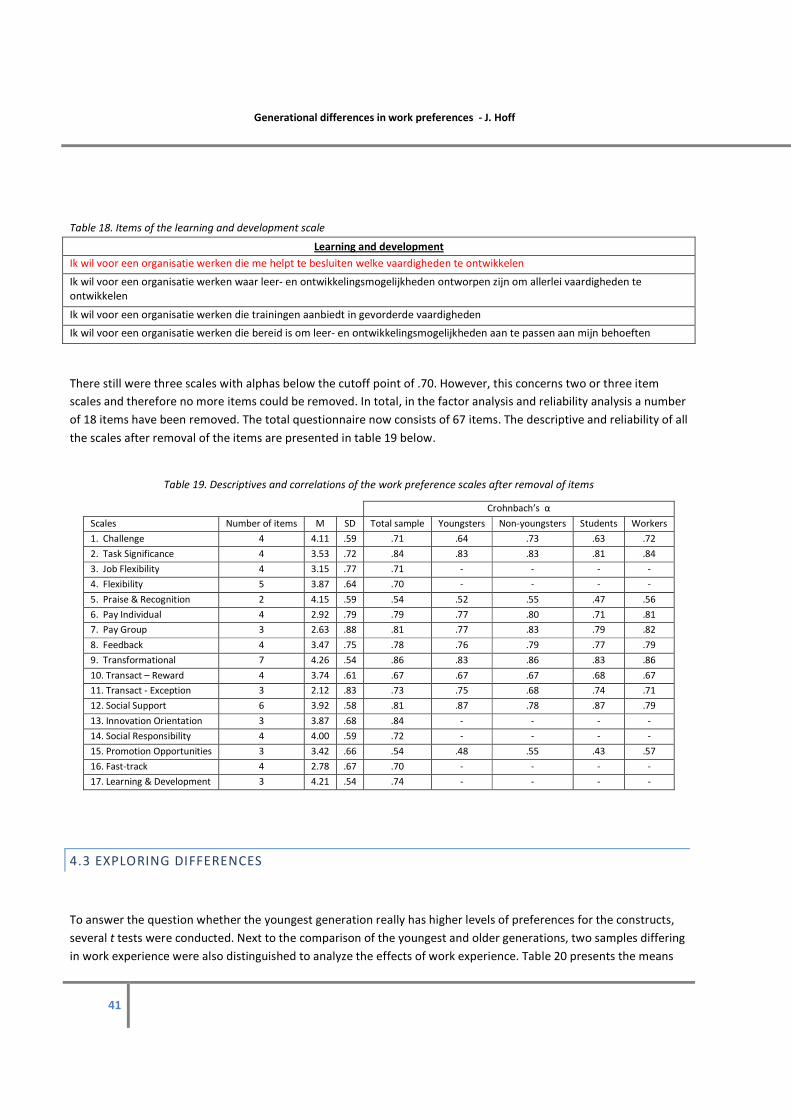
Generational differences in work preferences - J. Hoff
41
Table 18. Items of the learning and development scale
Learning and development
Ik wil voor een organisatie werken die me helpt te besluiten welke vaardigheden te ontwikkelen
Ik wil voor een organisatie werken waar leer- en ontwikkelingsmogelijkheden ontworpen zijn om allerlei vaardigheden te
ontwikkelen
Ik wil voor een organisatie werken die trainingen aanbiedt in gevorderde vaardigheden
Ik wil voor een organisatie werken die bereid is om leer- en ontwikkelingsmogelijkheden aan te passen aan mijn behoeften
There still were three scales with alphas below the cutoff point of .70. However, this concerns two or three item
scales and therefore no more items could be removed. In total, in the factor analysis and reliability analysis a number
of 18 items have been removed. The total questionnaire now consists of 67 items. The descriptive and reliability of all
the scales after removal of the items are presented in table 19 below.
Table 19. Descriptives and correlations of the work preference scales after removal of items
4.3 EXPLORING DIFFERENCES
To answer the question whether the youngest generation really has higher levels of preferences for the constructs,
several t tests were conducted. Next to the comparison of the youngest and older generations, two samples differing
in work experience were also distinguished to analyze the effects of work experience. Table 20 presents the means
Crohnbach’s α
Scales Number of items M SD Total sample Youngsters Non-youngsters Students Workers
1. Challenge 4 4.11 .59 .71 .64 .73 .63 .72
2. Task Significance 4 3.53 .72 .84 .83 .83 .81 .84
3. Job Flexibility 4 3.15 .77 .71 - - - -
4. Flexibility 5 3.87 .64 .70 - - - -
5. Praise & Recognition 2 4.15 .59 .54 .52 .55 .47 .56
6. Pay Individual 4 2.92 .79 .79 .77 .80 .71 .81
7. Pay Group 3 2.63 .88 .81 .77 .83 .79 .82
8. Feedback 4 3.47 .75 .78 .76 .79 .77 .79
9. Transformational 7 4.26 .54 .86 .83 .86 .83 .86
10. Transact – Reward 4 3.74 .61 .67 .67 .67 .68 .67
11. Transact - Exception 3 2.12 .83 .73 .75 .68 .74 .71
12. Social Support 6 3.92 .58 .81 .87 .78 .87 .79
13. Innovation Orientation 3 3.87 .68 .84 - - - -
14. Social Responsibility 4 4.00 .59 .72 - - - -
15. Promotion Opportunities 3 3.42 .66 .54 .48 .55 .43 .57
16. Fast-track 4 2.78 .67 .70 - - - -
17. Learning & Development 3 4.21 .54 .74 - - - -
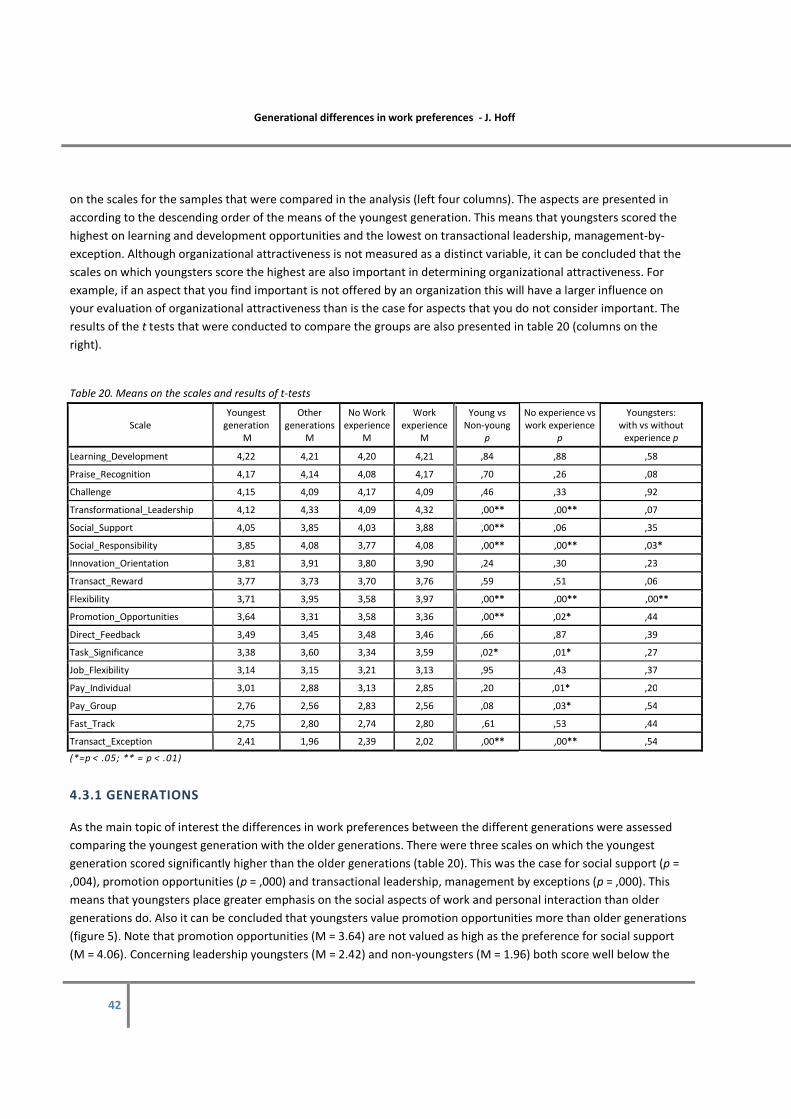
Generational differences in work preferences - J. Hoff
42
on the scales for the samples that were compared in the analysis (left four columns). The aspects are presented in
according to the descending order of the means of the youngest generation. This means that youngsters scored the
highest on learning and development opportunities and the lowest on transactional leadership, management-by-
exception. Although organizational attractiveness is not measured as a distinct variable, it can be concluded that the
scales on which youngsters score the highest are also important in determining organizational attractiveness. For
example, if an aspect that you find important is not offered by an organization this will have a larger influence on
your evaluation of organizational attractiveness than is the case for aspects that you do not consider important. The
results of the t tests that were conducted to compare the groups are also presented in table 20 (columns on the
right).
Table 20. Means on the scales and results of t-tests
Scale
Youngest
generation
M
Other
generations
M
No Work
experience
M
Work
experience
M
Young vs
Non-young
p
No experience vs
work experience
p
Youngsters:
with vs without
experience p
Learning_Development 4,22 4,21 4,20 4,21 ,84 ,88 ,58
Praise_Recognition 4,17 4,14 4,08 4,17 ,70 ,26 ,08
Challenge 4,15 4,09 4,17 4,09 ,46 ,33 ,92
Transformational_Leadership 4,12 4,33 4,09 4,32 ,00** ,00** ,07
Social_Support 4,05 3,85 4,03 3,88 ,00** ,06 ,35
Social_Responsibility 3,85 4,08 3,77 4,08 ,00** ,00** ,03*
Innovation_Orientation 3,81 3,91 3,80 3,90 ,24 ,30 ,23
Transact_Reward 3,77 3,73 3,70 3,76 ,59 ,51 ,06
Flexibility 3,71 3,95 3,58 3,97 ,00** ,00** ,00**
Promotion_Opportunities 3,64 3,31 3,58 3,36 ,00** ,02* ,44
Direct_Feedback 3,49 3,45 3,48 3,46 ,66 ,87 ,39
Task_Significance 3,38 3,60 3,34 3,59 ,02* ,01* ,27
Job_Flexibility 3,14 3,15 3,21 3,13 ,95 ,43 ,37
Pay_Individual 3,01 2,88 3,13 2,85 ,20 ,01* ,20
Pay_Group 2,76 2,56 2,83 2,56 ,08 ,03* ,54
Fast_Track 2,75 2,80 2,74 2,80 ,61 ,53 ,44
Transact_Exception 2,41 1,96 2,39 2,02 ,00** ,00** ,54
(*=p < .05; ** = p < .01)
4.3.1 GENERATIONS
As the main topic of interest the differences in work preferences between the different generations were assessed
comparing the youngest generation with the older generations. There were three scales on which the youngest
generation scored significantly higher than the older generations (table 20). This was the case for social support (p =
,004), promotion opportunities (p = ,000) and transactional leadership, management by exceptions (p = ,000). This
means that youngsters place greater emphasis on the social aspects of work and personal interaction than older
generations do. Also it can be concluded that youngsters value promotion opportunities more than older generations
(figure 5). Note that promotion opportunities (M = 3.64) are not valued as high as the preference for social support
(M = 4.06). Concerning leadership youngsters (M = 2.42) and non-youngsters (M = 1.96) both score well below the

Generational differences in work preferences - J. Hoff
43
neutral score of 3 and actually prefer this aspect the least. This means that, although the samples differ significantly,
both samples don’t seem to have a preference for a leader who uses a management-by-exception style.
Figure 5. Scales on which youngsters score significantly higher
Contrary to expectations, the older generations scored higher on four scales. This was the case for task significance (p
= ,021), social responsibility (p = ,003), flexibility (p = ,003) and transformational leadership (p = ,003). So it seems
that in comparison with the youngest generation, older generations place greater emphasis on the influence their
work has on others and the extent to which the organization is socially responsible. Further, older generations value
flexible options more and a leader who shows transformational behavior is appreciated. Note that although the
differences are significant it is only the level of preference that differs between the samples. It is not the case that
one sample prefers the construct where the other sample dislikes the construct.
Overall it can be concluded that for most constructs the expectations are not met. As the scales used in the
questionnaire were chosen based on the preferences of the youngest generation and the factor structure as
extracted by this generation, these youngsters were expected to have higher levels of preferences. With only three
scales on which youngsters score significantly higher and four scales on which they score significantly lower this is
clearly not the case. It has to be said however, that except for four scales, youngsters showed a (small) preference.
Only the two types of pay, fast-tracks and transactional leadership management by exception scored below the
neutral score of 3. This implicates that these aspects are not the factors which the youngest generation find
important.
Generational differences in work preferences - J. Hoff
44
4.3.2 WORK EXPERIENCE
In exploring the differences on the work preference scales, work experience was also assessed as an alternative
explanation of differences. In the comparison between a sample without work experience and a sample that does
have work experience there were eight scales that showed significant differences. On four scales, people without
work experience scored significantly higher. This was the case for; individual pay (p = .01), group-based pay (p = .03),
promotion opportunities (p = .02) and transactional leadership, management-by-exception (p = .00). So before
someone starts to work, these four aspects are significantly more preferred than by people that do have work
experience. Compared with generational differences, it appears that both individual pay and group-based pay show
differences that could be ascribed to effects of work experience. It should be noted although that the means for pay
all lie under or around the neutral score of 3 implicating that even for the student sample pay does not seem to be
very important. The differences on the scales measuring promotion opportunities and transactional leadership
management-by-exception could be ascribed to effects of both generations as work experience. On four other scales,
people that do have work experience scored significantly higher, this was the case for task significance (p = .01),
social responsibility (p = .00), flexibility (p = .00) and transformational leadership (p = .00). These are the same scales
that were preferred by the group of older generations which means that both work experience and generation
effects could explain these differences.
4.3.3 GENERATION VS WORK EXPERIENCE
From the analysis above it appears that on six scales significant differences were found that could be explained by
both generation and work experience effects. Entangling which effect really determines these differences is hard.
When comparing between generations and work experience in the scales that showed significant differences, it can
be seen that one scale could be ascribed to difference in generation. In the preferences for social support, significant
differences were only found in the comparison of generations. This implicates that the high level of preference for
social support is characteristic for the youngest generation rather than being caused by a lack of work experience. On
the other hand, significant differences in the preferences of both individual pay and group-based pay were only
found in the comparison on work experience. This implicates that the relatively higher preference for pay can be
explained by a lack of work experience rather than being characteristic for the youngest generation.
To assess the effect of work experience for the youngest generation a t test was also conducted to compare a group
of youngsters with work experience with a group without work experience. This analysis showed that youngsters
who do have work experience have higher levels of preference for social responsibility (p = .03) and flexibility (p =
.00). This implicates that after first experiences with the working life, youngsters will value the social responsibility
and flexible work options even more than before they started working (figure 6). So these results suggest that the
importance of these two aspects can be ascribed to work experience.
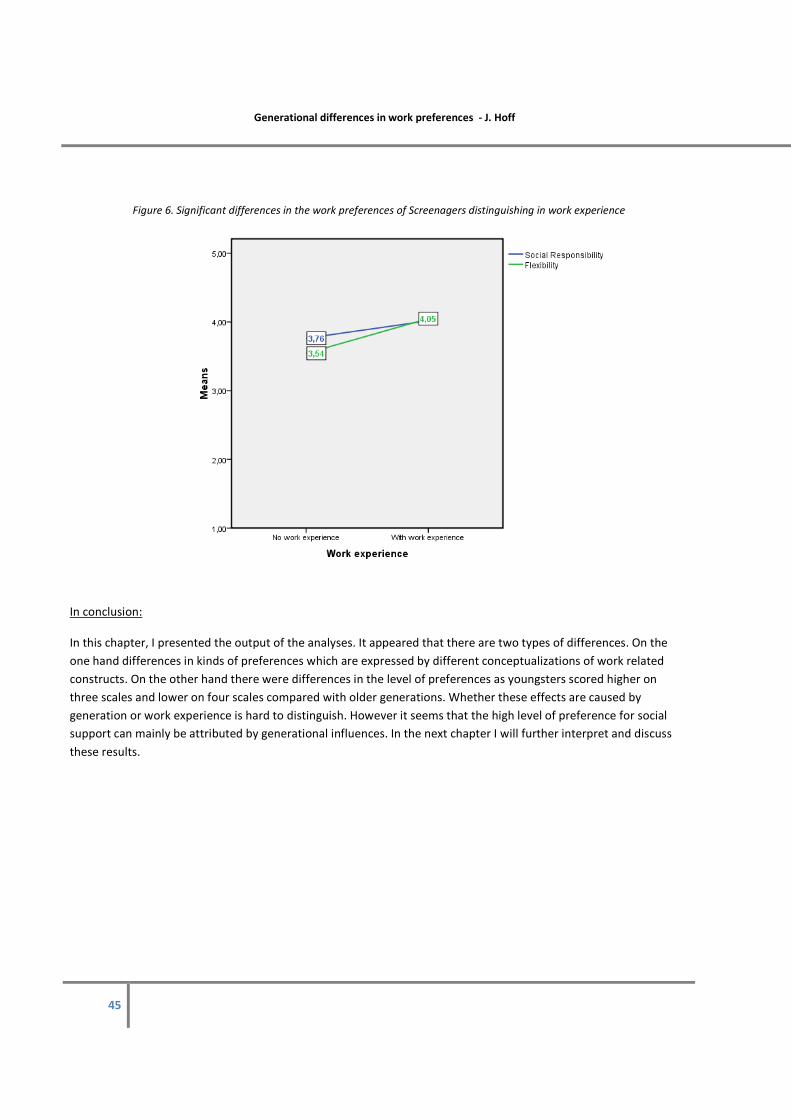
Generational differences in work preferences - J. Hoff
45
Figure 6. Significant differences in the work preferences of Screenagers distinguishing in work experience
In conclusion:
In this chapter, I presented the output of the analyses. It appeared that there are two types of differences. On the
one hand differences in kinds of preferences which are expressed by different conceptualizations of work related
constructs. On the other hand there were differences in the level of preferences as youngsters scored higher on
three scales and lower on four scales compared with older generations. Whether these effects are caused by
generation or work experience is hard to distinguish. However it seems that the high level of preference for social
support can mainly be attributed by generational influences. In the next chapter I will further interpret and discuss
these results.
Generational differences in work preferences - J. Hoff
46
5. DISCUSSION
Using the results from the conducted analyses in the previous chapter, the information is interpreted. After
that, the theoretical and practical implications of this are explained. Further, the limitations of the research
are described as well as some suggestions for further research.
5.1 MAIN FINDINGS
The overall conclusion that can be derived from the results is that the differences between generations are not as
sweeping as stated in popular press. As only three scales were valued higher by youngsters, there were more
similarities than there were differences. Although contradictory to the statements of popular press, this finding is
consistent with the sparse empirical research that also reports on generational differences. These researches also
found few differences between generations with mostly relatively small effect sizes (Deal, Altman, & Rogelberg,
2010).
The discussion of the findings for each of the aspects will further be structured by the two types of results that
have been found. First, the differences in kinds of preferences are be discussed and after that the differences in
levels of preferences will be commented on.
5.1.1 DIFFERENCES IN KIND OF PREFERENCES
These differences provide valuable information because they give the insight that although different groups prefer
the same construct, the real meaning behind the construct could be different for each group. The issue of difference
in meaning behind a construct is an issue that has been rarely studied in this context (Deal et al., 2010). As many
studies do not control for measurement equivalence, this may have resulted in faulty conclusions.
‘Challenge’ - In the construct ‘challenge’ it appeared that young people mainly conceptualize ‘challenge’ as work that
allows them to deal with difficult problems, offers opportunities to develop new skills and demands a great deal of
curiosity. Contrary to older generations, dealing with problems that are completely new, as stated in the first item, is
not conceptualized as ‘challenge’. So apparently youngsters consider work challenging when they come across
problems that are difficult but not necessarily new. An explanation for this could be that for youngsters, who just
started working, most problems they come across will be new. Looking back on the definition of challenging work in
the Manpower study (2006), one of the characteristics was that youngsters do not like to be stressed in the process
of work. In this light, completely new problems could result in a stressful situation and are therefore not considered
as challenging.
‘Task significance’ – In this construct more subtle differences were found. No items were omitted in the rest of the
research as only differences were found in height of the factor loadings. Nevertheless, from these differences it could
Generational differences in work preferences - J. Hoff
47
be derived that youngsters and students consider ‘having an effect on and influencing other people’ as core-aspects
of task significance. This implicates that youngsters especially want to ‘make a difference’ in an interpersonal
context. This could be explained by the fact that youngsters value social approval higher than older generations
(Kowske, Rasch & Wiley, 2010).
‘Transformational leadership’ – Regarding the characteristics of a transformational leader the youngest and older
generations agree on some important behavioral aspects. However, both groups use aspects to conceptualize
transformational behavior which are specific for their generation. For the youngest generation this specific aspect
concerns leaders who have vision and a clear picture of the future. This could be explained by the fact that because
of their age, this generation probably does not yet have developed a vision or clear picture of the future themselves.
It could also be that for youngsters, the vision and picture of the leader represents the direction in which the
organization is heading. This underlying direction of the organization has proven to be of importance for this
youngest generation (Ng, Schweitzer, & Lyons, 2010). Older generations were found to have specific preference for
aspects of leadership involving empowerment of employees and facilitation of employee influence. This finding
contradicts previous findings which stated that for the youngest generation; aspects involving employee influence
were expected to be included in the definition of a ‘good’ leader (Broadbridge et al., 2009). As stated before,
youngsters are said to like an inclusive style of management and therefore would expect their leaders to actively
involve them in daily business (Broadbridge et al., 2009).
‘Social support’ - The construct ‘social support’ appeared to consist of more aspects for the youngest generation
than it did for the older generations. Older generations clearly distinguished between social aspects through work
and social aspects through colleagues. For young people however, the fact that all the items loaded on one factor
gives us the insight that Screenagers do not see ‘social support’ through work and through people as distinct
constructs. Rather, social support is a construct that encompasses all kinds of social aspects. These results are in line
with previous research which concluded that youngsters see their working life as an opportunity to expand their
social life. So instead of just seeing work solely as work, youngsters expect a lot of workplace interaction and to
develop relationships at work (Myers & Sadaghiani, 2010). As Boschma & Groen (2007) found, the line between
social life and working life gets vaguer for this youngest group.
‘Promotion opportunities’ - Youngsters clearly distinguished ‘the basis for promotions’ and ‘type of opportunities
that are offered’ as the core-aspects of this construct whereas ‘fast promotions’ and ‘tendency to leave in absence of
opportunities’ were less clear as they loaded on two factors. Conversely, the older generations only distinguished
between promotion opportunities and promotion within one or two years after leaving college. As youngsters are
ascribed to have expectations of rapid promotion, this conceptualization is remarkable as the item of the scale that
reflected this preference for rapid promotions was not considered to be one of the core-aspects of promotion
opportunities. This suggests that for the youngest generation, promotional issues can be divided into opportunities
offered by an organization and the speed of promotions, intentions to leave in absence. This finding has to be
interpreted with caution though as the found differences can partly be ascribed to the fact that two items were not
suitable for the worker and non-Screenager sample. This could also have led to the differences in factor structure.
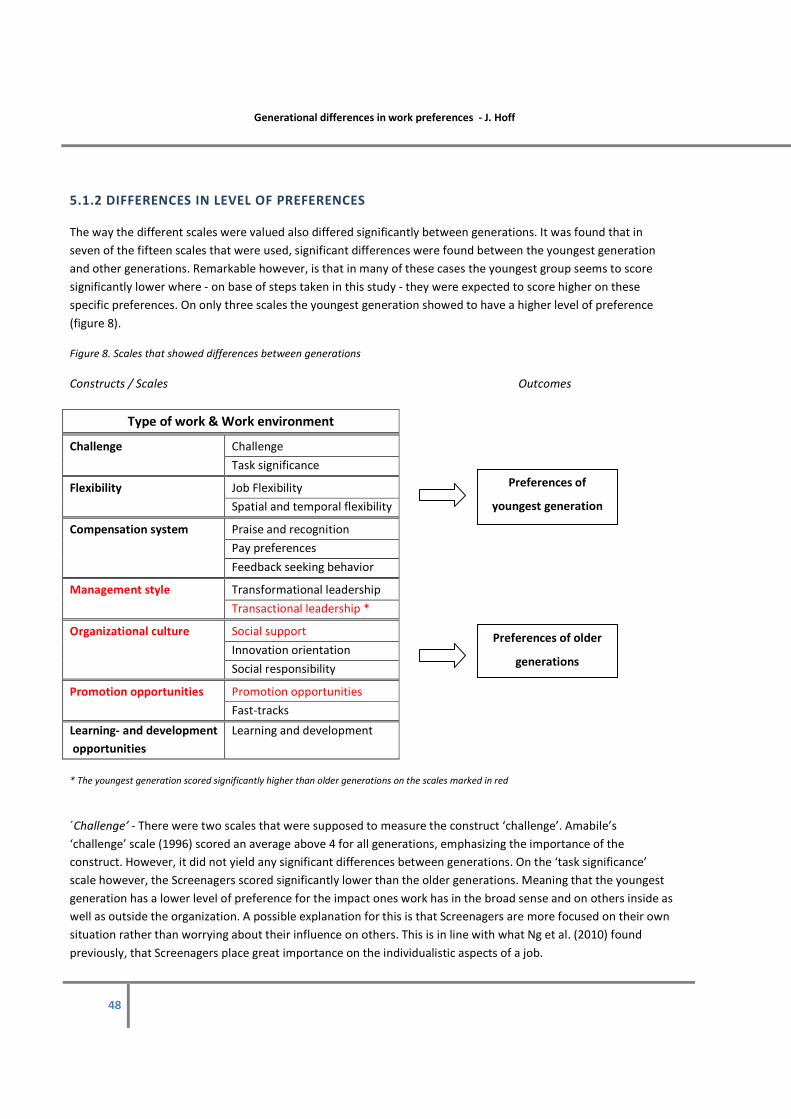
Generational differences in work preferences - J. Hoff
48
5.1.2 DIFFERENCES IN LEVEL OF PREFERENCES
The way the different scales were valued also differed significantly between generations. It was found that in
seven of the fifteen scales that were used, significant differences were found between the youngest generation
and other generations. Remarkable however, is that in many of these cases the youngest group seems to score
significantly lower where - on base of steps taken in this study - they were expected to score higher on these
specific preferences. On only three scales the youngest generation showed to have a higher level of preference
(figure 8).
Figure 8. Scales that showed differences between generations
Constructs / Scales Outcomes
Type of work & Work environment
Challenge Challenge
Task significance
Flexibility Job Flexibility
Spatial and temporal flexibility
Compensation system Praise and recognition
Pay preferences
Feedback seeking behavior
Management style Transformational leadership
Transactional leadership *
Organizational culture Social support
Innovation orientation
Social responsibility
Promotion opportunities Promotion opportunities
Fast-tracks
Learning- and development
opportunities
Learning and development
* The youngest generation scored significantly higher than older generations on the scales marked in red
´Challenge’ - There were two scales that were supposed to measure the construct ‘challenge’. Amabile’s
‘challenge’ scale (1996) scored an average above 4 for all generations, emphasizing the importance of the
construct. However, it did not yield any significant differences between generations. On the ‘task significance’
scale however, the Screenagers scored significantly lower than the older generations. Meaning that the youngest
generation has a lower level of preference for the impact ones work has in the broad sense and on others inside as
well as outside the organization. A possible explanation for this is that Screenagers are more focused on their own
situation rather than worrying about their influence on others. This is in line with what Ng et al. (2010) found
previously, that Screenagers place great importance on the individualistic aspects of a job.
Preferences of
youngest generation
Preferences of older
generations
Generational differences in work preferences - J. Hoff
49
´Flexibility’ - Of the two scales that measured ‘flexibility’, only one resulted in significant differences. Where
flexibility in job content did not yield any differences, flexibility in choosing your own place and time of work did.
Although all samples scored relatively high on this scale, the youngest generation valued it significantly lower than
the older generations. A possible explanation for the high score of this older group is that for older generations the
family and child obligations are more relevant. Flexibility options in this essence are seen as ways to manage work
and family time demands (Lewis & Roper, 2008). This explanation would mean that this difference is more a stage-
of-life effect rather than being a generation effect. When distinguishing the youngest group on work experience it
was found that youngsters with work experience value flexibility higher than youngsters without work experience.
This suggest that the higher scores on flexibility can be explained by work experience.
‘Compensation system’ - Concerning the scales that together encompassed the ‘compensation system’ all three
scales did not reveal significant differences between generations. ‘Praise and recognition’, ‘direct feedback seeking
behavior’ as well as ‘pay preferences’ were not rated significantly higher by any of the generations. Note that both
individual as group-based pay were valued higher by the sample without work experience. This indicates that
there are differences in preferences for this construct that can be ascribed to work experience rather than
generation effects. All samples scored very high on praise and recognition, suggesting the importance of being
praised for achievements.
‘Management style’ - This is clearly one of the constructs on which the most differences were found. Regarding
the factor structure, we saw that ‘transformational leadership’ was conceptualized in a different manner by the
youngest generation. Furthermore, the older generations seemed to value a transformational leader higher than
the youngest generation. On the other hand, the transactional leader, who shows management-by-exception
behavior, is valued more by the youngest group compared to the older groups. One explanation for these
significant differences is that the youngest generation has not had much experience with supervisors yet. Maybe
this lack of experience with supervisors makes it harder for youngsters to evaluate and value certain
characteristics of a leader. A different explanation could be that the items in the transactional leadership scale
were all focused on receiving control and feedback from a supervisor. It could be that the older groups perceive
this purely as control as it limits their freedom whereas the youngest group perceives this more as supervision.
Yet, this youngest group has little experience and can therefore benefit from all the feedback they can get. This
need for clear feedback from their supervisor is also recognized by previous findings (Manpower, 2006).
‘Organizational culture’ - The organizational culture consisted of three different scales. It appeared that the
‘orientation for innovation’ of an organization is valued reasonably high by all generations. ‘Social support’
however was valued more by the youngest group. This underlines the importance of social contacts for this
generation. As described in literature on generations, young people highly value their social life and they will try to
organize their work life in such a manner that it will never intervene with their social life. This result also implicates
that youngsters are looking to broaden their social life through their work. They would like to see work as a place
to get to know new people and get along well with everybody. The other scale of culture, social responsibility, also
showed significant differences. It is said that by growing up in a world in which environmental issues have always
been highly visible and living environmentally responsible is stressed, young people are said to be socially
responsible (Steensel, 2000). This research has shown however, that the youngest group values social
responsibility significantly lower than the older groups. A possible explanation for this could be that the youngest
generation is more focused on themselves than their environment (Ng et al., 2010).
Generational differences in work preferences - J. Hoff
50
‘Promotion opportunities’ – Of the two subscales in this aspect, one yields significant differences where the other
does not. On the scale measuring ‘fast-tracks’ both samples scored low without any significant differences. So the
clear presence of fast-tracks within an organization is not important for all generations. ‘Promotion opportunities’
on the other hand did show significant differences, with the youngest generation scoring significantly higher than
older generations. This probably comes from the fact that some older workers have already had a promotion
which makes it less important for them. Although the youngest group considers these aspects significantly more
important than older generations, promotion opportunities do not seem to be their main priority. Compared with
the means of other aspects, there are nine scales that score higher than promotion opportunities (M = 3.64). The
low score for promotion opportunities could be an effect of the Dutch culture which is characterized by low
masculinity (Hofstede, 2005) while promotion opportunities are an example of masculine aspects of work
(Terjesen, Vinnicombe & Freeman, 2007).
‘Learning- and development opportunities’ - Considering the last construct that was measured the findings showed
that there were no significant differences between generations. This aspect scored the highest in the Screenager
sample and second in the non-Screenager sample. Apparently all generations have a very high level of preference
for learning and development opportunities. These results suggest that although youngsters find learning and
development important, it is not characteristic for their generation. Rather it is important that sufficient learning
and development opportunities are present for employees of all generations.
The above described results have led to an answer on the main research question:
Do the work preferences of technical Screenagers differ significantly from that of older technical
generations, and if so, on which aspects?
It has been found that technical Screenagers do differ from older technical generations, both in kinds of
preferences as in levels of preferences. Differences in the kinds of preferences are expressed in different
conceptualizations of the following constructs: challenge, transformational leadership, social support and
promotion opportunities. Differences in levels of preferences were found in seven scales. On three aspects the
youngest generation scored higher: social support, promotion opportunities and transactional leadership.
Contrary to expectations, technical Screenagers also value some aspects lower than older generations; this is the
case for task significance, social responsibility, spatial and temporal flexibility and transformational leadership.
Although there were some significant differences in levels of preference, they were only expressed by a slightly
lower or higher level of preference.
5.2 IMPLICATIONS
5.2.1 THEORETICAL IMPLICATIONS
First of all this research adds to the relatively small number of existing work preference instruments. The instrument
that was developed for this study takes on a different approach than that of other instruments. It uses different
constructs that are mentioned by the youngest generation as being the most important. Existing scales that were

Generational differences in work preferences - J. Hoff
51
designed to measure these constructs were combined to form a general work preference instrument. This resulted in
a questionnaire which is the first step to a work preference instrument tailored to the youngest generation.
Second, this study is one of the few that controls for measurement equivalence. Where most research focuses only
on differences in levels of preferences, this research gives insight into differences in underlying meaning of
constructs. More specifically, valuable information is gathered on the concepts the youngest generation uses to
operationalize work related constructs.
Third, this study analyzed both generation and work experience effects in an attempt to isolate the differences that
can be attributed to effects of generations. It appeared that most of the results can be explained by both generation -
and work experience effects. The results suggest that only the difference in preferences for social support can be
attributed to generation effects.
5.2.2 PRACTICAL IMPLICATIONS
The results of this study contribute to the question what an organization can do to increase its attractiveness. First of
all, organization could use the differences between generations in conceptualizations of work related constructs to
specifically address certain generations. By using the definitions of the youngest generation in their advertisements,
job offers and other communications they would more easily draw the attention of potential applicants. For example,
the social aspects within the organization have to be embedded in everyday work. Also the vision and clear picture
of managers should receive plenty attention.
Second, the small differences between generations suggest that organizations do not necessarily have to distinguish
between generations in their policies and practices. Only the social opportunities within an organization have to be
adopted and secured especially for the youngest generation. On the other aspects, it seems like the extra costs of
specifying policies to specific generations are not in balance with the potential benefits.
Third, the results give insight on which aspects youngsters have the highest levels of preferences. Learning and
development opportunities are important for all generations so everybody should have sufficient access to these
opportunities. If present, these opportunities should also be communicated outside. Other aspects that seem
important for youngsters are transformational leaders, challenging work and praise & recognition. In order to
become attractive as an organization, these aspects seem to be of importance as youngsters value these the most. So
these aspects should receive special attention when it comes to the recruitment and management of youngsters.
5.3 LIMITATIONS
As with every research, this study has a few limitations. First of all, the issue of age versus generation effects limits
the conclusions. As with every research on generations there is the methodological difficulty of establishing
differences between generation effects and age-effects (Wong, Gardiner, Lang, & Coulon, 2008). Although the results
are interpreted as generation effects this could also be effects of stage-of-life or time period.
Second, even though the response rate was quite good the total pool of respondents was still too small. For
conducting t tests and comparing means an ‘n’ of 263 is no problem, but the factor analysis actually required a
greater number of respondents. This could have influenced the conclusions on the factor structure of the scales and
consequently the comparisons between generations.
Generational differences in work preferences - J. Hoff
52
Third, although it is concluded that younger people differ from older groups, I have to stress that the results are not
generalizable to the complete population. I assessed a specific group of people; young technical people. This sample
also was not randomly selected. The biggest part of the respondents was a group of people working at TNO and the
student sample all took part in selected courses. This might also explain some of the contradictory results.
Fourth, the scales that were used to measure the constructs could also have influenced the outcomes. Most of the
items are originally used in an evaluative context and were reworded into a preference context. Normally the
adapted scales as used to compare means should first be validated with another sample. Due to a lack of time this
was not possible.
Fifth, the larger context in which the study took place might also have influenced the results. At this time we still feel
the effects of the global economic recession which probably has its effect on the expectations of youngsters. As Deal
et al. (2010) also state that ‘before the recession everyone – regardless of generation – expected more than they do
now in a depressed economy’.
5.4 SUGGESTIONS FOR FURTHER RESEARCH
The limitations together with some other issues lead to suggestions for further research. First, longitudinal research
is needed to determine whether it really is generations that cause these differences and not period or stage-of-life
effects. A design such as used by Kowske et al. (2010), which controls for effects of age and time period, is a good
attempt in trying to disentangle the effects on work preferences and other related outcomes.
Second, in order for the instrument to become a good work preference instrument it needs more development in the
future. First of all another sample is needed to validate the instrument. Also, in order to be able to derive any
conclusions on a generational level, different samples are needed to test the generalizability of the instrument.
Third, an aspect that should receive attention in the future is the relation of the preferences for the constructs used
in this study and recruitment outcomes. As a basis for this study, I used the type of work and work environment
because of their relatively high relations with recruitment outcomes. In this study however, the relation with
recruitment outcomes was not tested. In future research, the relations of the constructs in the designed work
preference instruments with recruitment outcomes should be tested. Especially the outcome ‘job choice’, which has
been proven to be very hard to predict, should receive extensive attention.
In conclusion:
In this study an attempt was made to develop a work preference instrument tailored to the preferences of the
youngest generation. When comparing the youngest generation with older generations it can be concluded that this
study resulted in some valuable insights in the work preferences of youngsters. It appeared that there are many
similarities between generations and only a few significant differences. For some aspects these concerned
differences in the underlying meaning of the construct whereas for other constructs these concerned higher or lower
levels of preferences. The overall feeling that remains is that, although some differences were found, the enormous
differences as mentioned in the popular press were not supported by these findings. However, reflected by the
contradictory results in previous studies, the subject requires further attention in order to be able to conclude on
this.
Generational differences in work preferences - J. Hoff
53
6. REFERENCES
Amabile, T., Conti, R., Coon, H., Lazenby, J., & Herron, M. (1996). Assessing the work environment for creativity. The
Academy of Management Journal, 39(5), 1154-1184.
Barber, A. (1998). Recruiting employees: Individual and organizational perspectives: Sage Publications Thousand
Oaks, CA.
Bass, B. M., & Avolio, B. J. (1995). MLQ Multifactor Leadership Questionnaire. Technical Report.
Redwood City, CA: Mindgarden.
Batista-Taran, L., Shuck, M., Gutierrez, C., & Baralt, S. (2009). The Role of Leadership Style in Employee Engagement.
COERC 2009, 15.
Becker, H. (1992). Generaties en hun kansen. Amsterdam: Meulenhoff.
Behling, O., Labovitz, G., & Gainer, M. (1968). College recruiting: A theoretical base. Personnel Journal, 47(1), 13-19.
Bontekoning, A. (2007). Generaties in organisaties. Tilburt University.
Borchardt, J. (2008). Generations in the Workplace. Managing the Modern Laboratory, 9(2).
Boschma, J., & Groen, I. (2007). Generatie Einstein: slimmer, sneller, socialer. Communiceren met jongeren.
Broadbridge, A., Maxwell, G., & Ogden, S. (2009). Selling retailing to Generation Y graduates: recruitment challenges
and opportunities. The International Review of Retail, Distribution and Consumer Research, 19(4), 405-420.
Burke, R., & Ng, E. (2006). The changing nature of work and organizations: Implications for human resource
management. Human Resource Management Review, 16(2), 86-94.
Cennamo, L., & Gardner, D. (2008). Generational differences in work values, outcomes and person-organisation
values fit. Journal of Managerial Psychology, 23(8), 891-906.
Chapman, D., Uggerslev, K., Carroll, S., Piasentin, K., & Jones, D. (2005). Applicant attraction to organizations and job
choice: A meta-analytic review of the correlates of recruiting outcomes. Journal of Applied Psychology,
90(5), 928-944.
Davies, J., & Easterby-Smith, M. (1984). Learning and developing from managerial work experiences Journal of
Management Studies, 21, 2.
De Hoogh, A., Den Hartog, D., & Koopman, P. (2004). De ontwikkeling van de CLIO: een vragenlijst voor charismatisch
leiderschap in organisaties. Gedrag and Organisatie, 17, 5.
Deal, J., Altman, D., & Rogelberg, S. (2010). Millennials at Work: What We Know and What We Need to Do (If
Anything). Journal of Business and Psychology, 25(2), 191-199.
Detert, J., Schroeder, R., & Mauriel, J. (2000). A framework for linking culture and improvement initiatives in
organizations. Academy of Management Review, 25(4), 850-863.
DeVellis, R. (2003). Scale development: Theory and applications: Sage Publications, Inc.
Dewettinck, K., & Buyens, D. (2006). The job challenge construct revisited: conceptualization, antecedents, and
consequences of experienced challenge and overchallenge in the job. Vlerick Leuven Gent Management
School Working Paper Series.
Eisner, S. (2005). Managing generation Y. SAM Advanced Management Journal, 70(4), 4-15.
Fabrigar, L., Wegener, D., MacCallum, R., & Strahan, E. (1999). Evaluating the use of exploratory factor analysis in
psychological research. Psychological methods, 4(3), 272-299.
Generational differences in work preferences - J. Hoff
54
Field, A. (2009). Discovering statistics using SPSS: SAGE publications Ltd.
Gilbert, G., Sohi, R., & McEachern, A. (2008). Measuring work preferences. Career Development International, 13(1),
56-78.
Hackman, J., & Oldham, G. (1975). Development of the job diagnostic survey. Journal of Applied Psychology, 60(2),
159-170.
Hall, D., & Las Heras, M. (2010). Reintegrating job design and career theory: Creating not just good jobs but smart
jobs. Journal of Organizational Behavior, 31(2-3), 448-462.
Hedlund, A., Andersson, I., & Rosén, G. (2009). Attractive Work Process.
Herzberg, M., Mausner, B., & Snyderman, B. B. (1959). The Motivation to work. New York.
Highhouse, S., Lievens, F., & Sinar, E. (2003). Measuring attraction to organizations. Educational and Psychological
Measurement, 63(6), 986.
Hofstede, G. (2005). Geert Hofstede’s Homepage.
Hofstede, G., Neuijen, B., Ohayv, D., & Sanders, G. (1990). Measuring organizational cultures: A qualitative and
quantitative study across twenty cases. Administrative Science Quarterly, 35(2).
Holland, J. (1985). Making vocational choices: A theory of vocational personalities and work environments: Prentice-
Hall Englewood Cliffs, NJ.
Holmes, T., & Srivastava, R. (2002). Effects of job perceptions on job behaviors:: Implications for sales performance.
Industrial Marketing Management, 31(5), 421-428.
Howe, N., & Strauss, W. (1991). Generations: The history of America’s future, 1584 to 2069. New York (NY): William
Morrow and Company, Inc.
Huang, T., Lawler, J., & Lei, C. (2007). The effects of quality of work life on commitment and turnover intention. Social
Behavior and Personality: an international journal, 35(6), 735-750.
Humphrey, S., Nahrgang, J., & Morgeson, F. (2007). Integrating motivational, social, and contextual work design
features: A meta-analytic summary and theoretical extension of the work design literature. Journal of
Applied Psychology, 92(5), 1332-1356.
Hunter L, McGregor A, MacInnes J and Sproull A 1993 The ‘flexible firm’: strategy and Segmentation, British Journal
of Industrial Relations, 31, 383–407.
Hurley, A.E. & Scandura, T.A. (1997). Exploratory and confirmatory factor analysis: guidelines, issues, and
alternatives, Journal of organizational behavior, 18, 667-683
Idsoe, T. (2006). Job aspects in the School Psychology Service: Empirically distinct associations with positive challenge
at work, perceived control at work, and job attitudes. European Journal of Work and Organizational
Psychology, 15(1), 46-72.
Jansen, E., Merchant, K., & Van der Stede, W. (2009). National differences in incentive compensation practices: The
differing roles of financial performance measurement in the United States and the Netherlands. Accounting,
Organizations and Society, 34(1), 58-84.
Jaskyte, K., & Dressler, W. (2004). Studying culture as an integral aggregate variable: Organizational culture and
innovation in a group of nonprofit organizations. Field Methods, 16(3), 265.
Jeekel, H. (2005). De ontbrekende dialoog. Sdu uitgevers, Den Haag.
Jelstad, B. (2005). Job characteristics and its outcomes.
Jöreskog, K., & Sörbom, D. (1989). LISREL 7: A guide to the program and applications: Spss.
Jung, T., Scott, T., Davies, H., Bower, P., Whalley, D., McNally, R., et al. (2009). Instruments for Exploring
Organizational Culture: A Review of the Literature. Public Administration Review, 69(6), 1087-1096.
Generational differences in work preferences - J. Hoff
55
Jurkiewicz, C., & Brown, R. (1998). Generational Comparisons of Public Employee Motivation. Review of Public
Personnel Administration, 18(4), 18.
Kossek, E., & Van Dyne, L. (2008). Face-time matters: A cross-level model of how work-life flexibility influences work
performance of individuals and groups. Handbook of Work-Family Integration, 305-330.
Kowske, B., Rasch, R., & Wiley, J. (2010). Millennials’(Lack of) Attitude Problem: An Empirical Examination of
Generational Effects on Work Attitudes. Journal of Business and Psychology, 25(2), 265-279.
Kristof-Brown, A., Zimmerman, R., & Johnson, E. (2005). Consequences of Individuals' Fit at Work: A Meta-Analysis of
Person-Job, Person-Organization, Person-Group, and Person-Supervisor Fit. Personnel Psychology, 58(2),
281-320.
Kupperschmidt, B. (2000). Multigeneration employees: strategies for effective management. The Health Care
Manager, 19(1), 65&hyhen.
Lewis, S., & Roper, I. (2008). Flexible working arrangements: from work-life to gender equity policies.
Lievens, F. (2006). Handboek human resource management: back to basics: Lannoo Uitgeverij.
Locke, E., & Latham, G. (2006). New directions in goal-setting theory. Current Directions in Psychological Science,
15(5), 265.
Mainiero, L., & Sullivan, S. (2006). The opt-out revolt: Why people are leaving companies to create kaleidoscope
careers: Davies-Black Publishing.
Manpower (2006). De nieuwe werknemer. Amsterdam: Manpower Nederland.
Martin. (2005). From high maintenance to high productivity. Industrial and Commercial Training, 37(1), 39–44.
Martin, J., & Siehl, C. (1983). Organizational culture and counterculture: An uneasy symbiosis. Organizational
Dynamics, 12(2), 52-64.
McCall, M., Lombardo, M., & Morrison, A. (1988). The lessons of experience: Lexington Books Lexington, MA.
McCauley, C., Ruderman, M., Ohlott, P., & Morrow, J. (1994). Assessing the developmental components of
managerial jobs. Journal of Applied Psychology, 79(4), 544-560.
Morgeson, F., & Humphrey, S. (2006). The Work Design Questionnaire (WDQ): Developing and validating a
comprehensive measure for assessing job design and the nature of work. Journal of Applied Psychology,
91(6), 1321-1339.
Morgeson, F., & Humphrey, S. (2008). Job and team design: Toward a more integrative conceptualization of work
design. Research in personnel and human resource management, 27, 39–92.
Mueller, R. (1996). Basic principles of structural equation modeling: An introduction to LISREL and EQS: Springer
Verlag.
Munro, R. (2009). Mentoring Needs and Expectations of Generation-Y Human Resources Practitioners: Preparing the
Next Wave of Strategic Business Partners. Journal of Management Research, 1(2).
Myers, K., & Sadaghiani, K. (2010). Millennials in the Workplace: A Communication Perspective on Millennials’
Organizational Relationships and Performance. Journal of Business and Psychology, 25(2), 225-238.
Ng, E., Schweitzer, L., & Lyons, S. (2010). New Generation, Great Expectations: A Field Study of the Millennial
Generation. Journal of Business and Psychology, 25(2), 281-292.
Piasentin, K., & Chapman, D. (2006). Subjective person-organization fit: Bridging the gap between conceptualization
and measurement. Journal of Vocational Behavior, 69(2), 202-221.
Ployhart, R. (2006). Staffing in the 21st century: New challenges and strategic opportunities. Journal of Management,
32(6), 868.
Posner, B. (1981). Comparing recruiter, student, and faculty perceptions of important applicant and job
characteristics. Personnel Psychology, 34(2), 329-339.

Generational differences in work preferences - J. Hoff
56
Rau, B. (2003). Flexible work arrangements. Sloan Work and Family Encyclopedia.
Roberson, L., Deitch, E., Brief, A., & Block, C. (2003). Stereotype threat and feedback seeking in the workplace.
Journal of Vocational Behavior, 62(1), 176-188.
Rynes, S.L. (1991). Recruitment, job choice and post-hire consequences: a call for new research directions. In
Dunnette, M.D. & Hough, L.M. (eds) Handbook of industrial and organizational psychology. Palo Alto, VA:
Consulting psychologists press.
Sarros, J.C., Gray, J., Densten, I.L. & Cooper, B. (2005). The Organizational Culture Profile Revisited and Revised: An
Australian Perspective, Australian Journal of Management, 30(1), 159-182.
Schein, E. (1990). Organizational culture. American psychologist, 45(2), 109-119.
Schneider, B. (1987). The people make the place. Personnel Psychology, 40(3), 437-453.
Shirey, M. (2006). Authentic leaders creating healthy work environments for nursing practice. American Journal of
Critical Care, 15(3), 256.
Smola, K., & Sutton, C. (2002). Generational differences: revisiting generational work values for the new millennium.
Journal of Organizational Behavior, 363-382.
Steensel, K. (2000). van–Internetgeneratie, de broncode ontcijferd: SMO.
Swanberg, J., & Simmons, L. (2008). Quality jobs in the new millennium: Incorporating flexible work options as a
strategy to assist working families. Social Service Review, 82(1), 119-147.
Tausig, M., & Fenwick, R. (2001). Unbinding time: Alternate work schedules and work-life balance. Journal of Family
and Economic Issues, 22(2), 101-119.
Taylor, F. (1911). Scientific management. New York.
Tejeda, M. J., Scandura, T. A., & Pillai, R. (2001). The MLQ revisited – Psychometric properties and recommendations.
Leadership Quarterly, 12, 31-52.
Terjesen, S., Vinnicombe, S., & Freeman, C. (2007). Attracting generation Y graduates. Career Development
International, 12(6), 504-522.
Tones, M. & Pillay, H. (2008). Further evaluation of the learning and development survey: psychometric properties,
Australian Journal of Educational and Developmental Psychology, 8, 85-97.
Trank, C. Q., Rynes, S. L., & Bretz, R. D. (2002). Attracting applicants in the war for talent: Differences in work
preferences among high achievers. Journal of Business and Psychology, 16(3), 331-345.
Tversky, Amos (1972), “Elimination by Aspects: A Theory of Choice,” Psychological Review, 79, 281–99.
Twenge, J., Campbell, S., Hoffman, B., & Lance, C. (2010). Generational differences in work values: Leisure and
extrinsic values increasing, social and intrinsic values decreasing. Journal of Management.
Wong, M., Gardiner, E., Lang, W., & Coulon, L. (2008). Generational differences in personality and motivation. Journal
of Managerial Psychology, 23(8), 878-890.
Yeaton, K. (2008). Recruiting and Managing theWhy?'Generation: Gen Y. CPA JOURNAL, 78(4), 68.
Zemke, R., Raines, C., & Filipczak, B. (2000). Generations at work: Managing the clash of veterans, Boomers, Xers,
and Nexters in your workplace. New York: Amacom/American Management Association.