Generating Contours from a Digital Terrain Model (DTM) in ...
15
Generating Contours from a Digital Terrain Model (DTM) in ArcMap 9.0 The following is a procedure guide detailing the process for generating contours from original DTM data. Several interpolation methods exist when creating raster images for contour generation including Spline, Inverse Distance Weighting (IDW) and Kriging. Once a raster image is produced, contours can be generated from it. In this example, a DTM created by J. D. Barnes First Base Solutions 1 was used to create the contour layer. Toronto DTMs originate in Autocad format and feature a .dwg file extension. The first step is to add the .dwg point file to the ArcGIS 9 Data Frame. Step 1 – Launch ArcMap by clicking Start – Programs – ArcGIS – ArcMap. Step 2 – Add the ‘Point’ layer from the DTM to the Data Frame by clicking the ‘Plus Sign’ circled in Figure 1 below. Then navigate to the desired file and click on it. Figure 1
Transcript of Generating Contours from a Digital Terrain Model (DTM) in ...

Generating Contours from a Digital Terrain Model (DTM) in ArcMap 9.0
The following is a procedure guide detailing the process for generating contours from original DTM data. Several interpolation methods exist when creating raster images for contour generation including Spline, Inverse Distance Weighting (IDW) and Kriging. Once a raster image is produced, contours can be generated from it. In this example, a DTM created by J. D. Barnes First Base Solutions1 was used to create the contour layer. Toronto DTMs originate in Autocad format and feature a .dwg file extension. The first step is to add the .dwg point file to the ArcGIS 9 Data Frame. Step 1 – Launch ArcMap by clicking Start – Programs – ArcGIS – ArcMap. Step 2 – Add the ‘Point’ layer from the DTM to the Data Frame by clicking the ‘Plus Sign’ circled in Figure 1 below. Then navigate to the desired file and click on it.
Figure 1

Step 3 – After adding the DTM to the Data Frame, the file should resemble the image in Figure 2 below.
Figure 2

Step 4 - Create a point shapefile by exporting the .dwg point file, circled in Figure 3 below. To do this, right click on the .dwg point file in the data frame, scroll down to Data and select Export Data.
Figure 3

Step 5 – In the Export Data dialogue box, designate a location for the ‘Output shapefile or feature class’ in Figure 4 below. When prompted to ‘Add the exported data to the map as a layer, Click OK.
Figure 4

Step 6 – Generate a raster image from the point shapefile created in Step 5. Click the Red Toolbox button circled in Figure 5 below to launch ArcToolbox. In the ArcToolbox menu, drill down to 3D Analyst Tools – Raster Interpolation – Spline. Double click Spline to open a dialogue box (Figure 6 on the next page).
Figure 5

Step 7 - After clicking on the spline tool, fill out the dialogue box, as illustrated in Figure 6 below. Input point features refer to the point shapefile created in Step 5. The Z value field will contain the elevation or z-value associated with each point feature. In the TOPoints file, the field name is ‘Elevation’. Output raster is the name and destination for the raster image to be created. Output cell size is the resolution of the raster image. See Step 8 for instructions on how to measure the output cell size. Accept the default values for the Spline type, Weight and Number of points fields.
Figure 6

Step 8 – When using JD Barnes DTMs, the output cell size should measure 10m both horizontally and vertically. To measure the output cell size, zoom into an area on the TOPoints shapefile, as illustrated below in Figure 7. Click on the measure tool circled below and use it to measure horizontally or vertically between any two points featured in the grid. The distance will appear in the bottom left corner of the Arcmap screen.
Figure 7 Distance Measure

If the interpolated surface is created successfully, the raster image should resemble Figure 8 below. Note: The output you create will be based on different elevation values. Thus, the raster surface should differ from the image illustrated in Figure 8 below.
Figure 8

Step 9 - To create a contour shapefile from the raster image, use the Contour tool within the ArcToolbox. To open the ArcToolbox click the red tool box located near the top of your screen (see circled toolbox in figure 9 below). In the ArcToolbox menu, drill down to Spatial Analyst Tools – Surface – Contour. Double click Contour to open the Contour dialogue box (Figure 10 on the next page).
Figure 9

Step 10 - After clicking on the Contour tool in ArcToolbox, fill in the dialogue box, as illustrated in Figure 10 below. Input raster refers to the raster surface (Figure 8) created in Step 7. Output polyline features is the name and destination for the contour shapefile to be created. Set the Contour interval to 1 metre, and accept the default values for the Base contour and Z factor fields. Click OK.
Figure 10

If the contour shapefile is created successfully, the vector image should resemble Figure 11 below. If you want to view the contour layer exclusively, deselect the check boxes circled in Figure 11 below.
Figure 11

Step 11 - Zoom in on the contour surface illustrated in Figure 11, to view the contours illustrated in Figure 12 using the Zoom tool circled below. The contours in Figure 12 appear jagged. To improve the contour display, smooth the contour lines. This process is described next in Step 12.
Figure 12

Step 12 - In the ArcToolbox menu, drill down to Data Management Tools – Generalization – Smooth Line. Double click Smooth Line to open a dialogue box (Figure 14 on the next page).
Figure 13
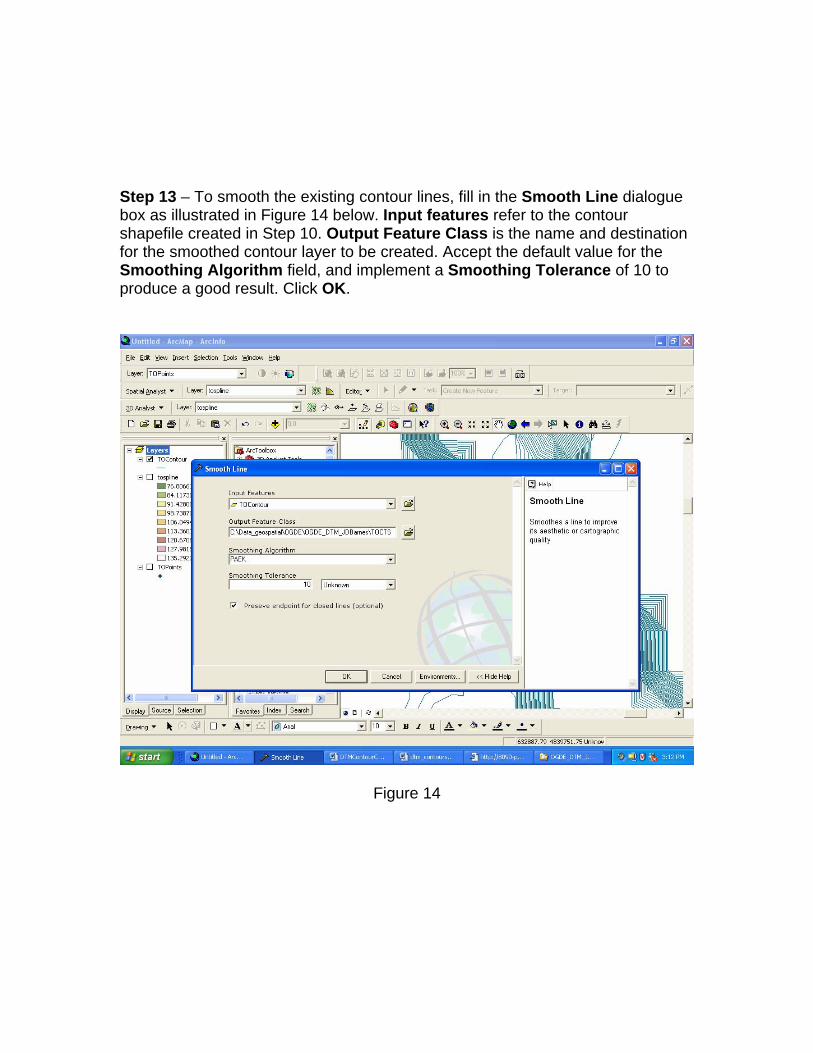
Step 13 – To smooth the existing contour lines, fill in the Smooth Line dialogue box as illustrated in Figure 14 below. Input features refer to the contour shapefile created in Step 10. Output Feature Class is the name and destination for the smoothed contour layer to be created. Accept the default value for the Smoothing Algorithm field, and implement a Smoothing Tolerance of 10 to produce a good result. Click OK.
Figure 14

If the smoothed contour surface is created successfully, the image should resemble Figure 15 below. If you want to view the contour features in 3-Dimensions, continue with the procedure titled, ‘3D Visualization of Contours and Orthophotos in ArcScene 9.’
Figure 15 1 Supplied under an Educational agreement with the Ontario Geospatial Data Exchange. Produced by D. Jakubek, October 2005, Ryerson University Library