Generali Group 9M 2008 Results
37
Milan, October 30, 2008 Generali Group 9M 2008 Results
-
Upload
generali -
Category
Economy & Finance
-
view
304 -
download
0
Transcript of Generali Group 9M 2008 Results

Milan, October 30, 2008
Generali Group 9M 2008 Results

Assicurazioni Generali Group – 9M 2008 results
2Agenda
I. Overview
II. Group financials
III. Final remarks
IV. Backup

Assicurazioni Generali Group – 9M 2008 results
3Agenda
I. OverviewStrategic overview
Financial position
9 months 2008 results at a glance

Assicurazioni Generali Group – 9M 2008 results
4
The end of a financial model based on high leverage, excesses & short termism
Lack of confidence within the financial markets
Need for tighter & better coordinated regulation
Globally defined actions are needed
State intervention is changing the competitive landscape
Strategic overview
In the midst of the financial storm
I. OVERVIEW
Our position
Solvency and financial resiliency are confirmed
Always a clear vision: align interests & maximize long term value creation of all our stakeholders
Exposure to toxic assets is minimal
Consistent industrial model: retail oriented, multi channel, key role of proprietary channels, more than 50 m clients

Assicurazioni Generali Group – 9M 2008 results
5
12.512.2
Our financial position remains strong
Resilient IFRS Shareholder’s Equity(Euro bn)
9M081H08
“Own Investments”(1) (Euro 293 bn): a well diversified portfolio
Resilient shareholder’s equity thanks to a high quality & diversified investment portfolio Further equity markets drop and widening of credit spreads during the 3rd quarter have been partially offset by positive development of Government bondsOur solvency position remains strong (>200% on Economic basis)
56.2%
43.8%
CorporateGovernment
71.4%
8.1%
9.7%
4.8%6.0%
Other(2)
Real estate
Equity
FixedIncome
(1) Own investments relates only to own capital and insurance funds (i.e. unit linked excluded)(2) Including investments in subsidiaries, associated companies and JVs, derivatives, receivables from banks or customers(3) Including mortgage loans, policy loans, deposits under reinsurance business accepted, term deposits with credit institutions and other financial investments, other loans(4) Debt securities
3
4
I. OVERVIEW

Assicurazioni Generali Group – 9M 2008 results
69 months 2008 results(1) at a glance
(Euro m)
-0.3% pts95.195.4P&C CoR (%)
+15.53,5903,108Life and health APE
+6.651,66148,447Gross written premiums
1,670
3,471
9M 2008
2,364
4,110
9M 2007
-29.4Net Result
-15.6Operating Result
∆ historical (%)
I. OVERVIEW
Growth continues…
...keeping technical profitability…
…but results are hit by financial markets
(1) Generali Group has elected not to apply the new reclassifications of financial instruments introduced by the amendments to IAS 39 and IFRS 7 by the IASB, endorsed by the European Commission on October 15th in European Regulation n. 1004/2008. At year-end Generali Group is going to apply those amendments, considering also the incoming legislative evolution.

Assicurazioni Generali Group – 9M 2008 results
7Agenda
II. Group financialsProfit & loss review
Shareholders’ equity
Life & P&C profitability

Assicurazioni Generali Group – 9M 2008 results
8Revenues development by segment
+15.5
∆ historical(%)
+10.53,589.83,107.8Life Annual Premium Equivalent
∆ like for like(3)
(%)9M
20089M
2007(Euro m)
II. GROUP FINANCIALS
+4.9
+7.5
+6.6
∆ historical(%)
+5.135,235.132,791.9Life(2)
+4.451,660.648,446.9Gross written premiums
+2.716,425.515,655.0P&C
∆ like for like(1)
(%)9M
20089M
2007(Euro m)
(1) Calculated considering equivalent exchange rates and scope of consolidation (divestiture of Nuova Tirrena in Italy and Generali-PPF deal in CEE)(2) Including investment contracts for Euro 3,156.6 m in 9M 2008 and Euro 1,006.4 m in 9M 2007
(3) Neutralizing impacts of variations in exchange rates and scope of consolidation (inclusion of Central Kranken, divestiture of Nuova Tirrena, effects of Generali-PPF deal)

Assicurazioni Generali Group – 9M 2008 results
9
3,470.6
-254.1
-218.3
243.3
1,728.1
1,971.8
4,110.0
-19.1
-201.7
299.7
1,652.4
2,378.8
n.m.Consolidation adjustments
-15.6Total operating result
-18.8Financial services operating result
+4.6P&Coperating result
-8.2Operating holdingexpenses
-17.1Life operating result
9M08
9M07
historical (%)
Operating result by segment (Euro m)
Operating result by segmentII. GROUP FINANCIALS
Impairments: Euro 1,582.2 m

Assicurazioni Generali Group – 9M 2008 results
10From operating result to net result
(501.2)(468.8)Interest expenses on financial debt
(523.0)(490.7)Non-operating holding expenses
(21.8)(21.9)Other non-operating holding expenses
368.9342.6Minority interests
-29.02,738.83,858.8Consolidated result of the period before taxes and minority interests
(699.9)(1,151.9)Income taxes
(732.0)(251.3)Total non operating result
112.0443.7Non operating investment income
-15.63,470.64,110.0Total operating result
-29.41,669.92,364.3Net result of the period
(321.0)(204.3)Net other non operating expenses
historical %9M089M07
(Euro m)
II. GROUP FINANCIALS
Impairments: Euro 563.6 m

Assicurazioni Generali Group – 9M 2008 results
11
2,024
(69)(915) (1,144)
326
(486)
12,51012,178
14,790
15263136
(229)
210
IFRS Shareholders’ equity roll forward
∆ CurrencyTranslation
Reserve
3Q 2008Net Result
Shareholders’Equity FY07
Other Shareholders’Equity 9M08
∆ Cash Flow Hedge Reserve
∆ in AFS Reserve
Shareholders’Equity 1H08
+2.7%
II. GROUP FINANCIALS
OtherAFS Reserve FY07
AFS Reserve 9M08
Impact Bond Investments
Impact Equity Investments
AFS Reserve 1H08
IFRS Shareholders’ equity roll forward (Euro mln)
Change in AFS reserve (Euro mln)
Assicurazioni Generali Group – 9M 2008 results
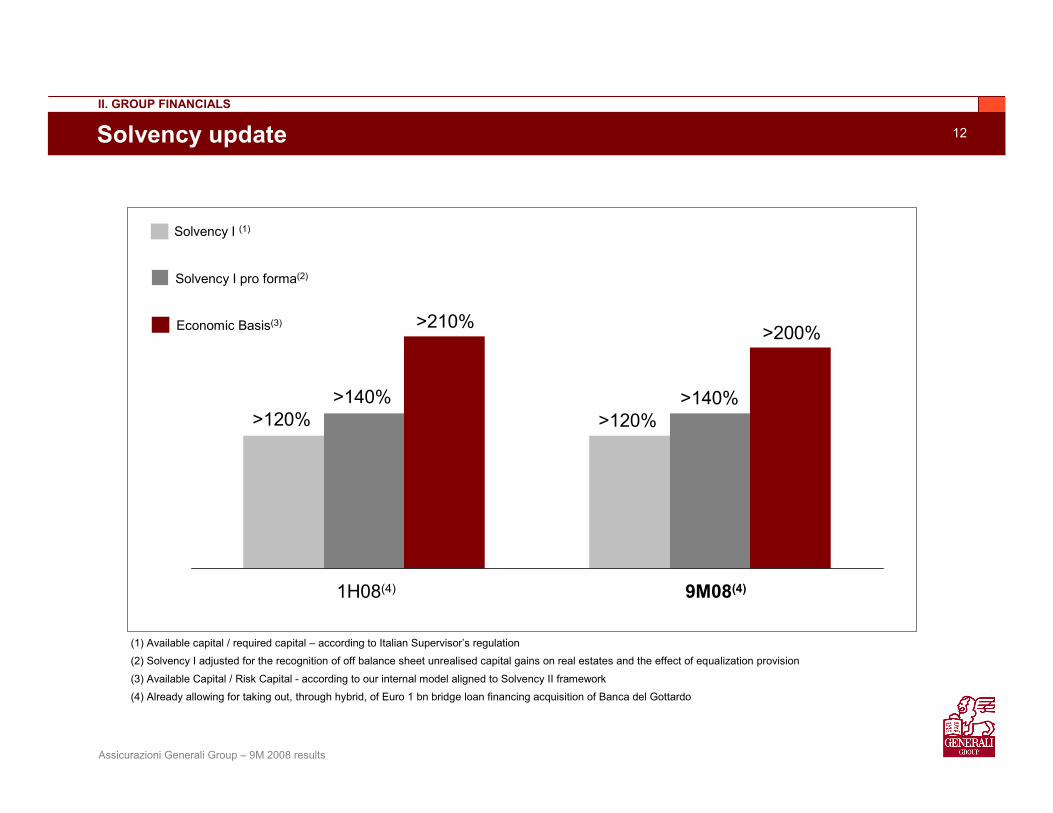
12Solvency update
Solvency I (1)
Solvency I pro forma(2)
Economic Basis(3)
9M08(4)1H08(4)
>120%>140%
>210%
>120%>140%
>200%
II. GROUP FINANCIALS
(1) Available capital / required capital – according to Italian Supervisor’s regulation
(2) Solvency I adjusted for the recognition of off balance sheet unrealised capital gains on real estates and the effect of equalization provision
(3) Available Capital / Risk Capital - according to our internal model aligned to Solvency II framework
(4) Already allowing for taking out, through hybrid, of Euro 1 bn bridge loan financing acquisition of Banca del Gottardo

Assicurazioni Generali Group – 9M 2008 results
13Life & Health: New Business Annual Premium Equivalent
Continuing robust growth of APE in all countries
II. GROUP FINANCIALS
28.9%50.0%799533Germany
3.5%3.5%868838France
15.5%
14.0%
13.3%
8.4%
Historical%
10.5%
3.4%
9.3%
9.2%
Like for like(1)
%
312274RoW
3,5903,108Total
579511RoE
1,032952Italy
9M 20089M 2007
Italy: continuing growth of APE driven by proprietary channel (+25%) and annual premiums (+11%)
France: despite slowdown of unit-linked business, positive growth off beating the rest of the market in all key lines of business
Germany: excellent growth boosted by success of “Riester” policies; even normalizing the impact of one-off “Riester-step” effect, APE increases by a very positive 7.2%
Rest of Europe: excellent performance in Eastern Europe (+17.1% on a like for like basis) and Benelux (+51.1%)
Rest of World: overall positive development (+3.4% on a like for like basis), amplified on a historical basis (+14.0%) by the strengthening of most foreign currencies against Euro
(Euro m)
(1) Neutralizing impacts of variations in exchange rates and scope of consolidation (inclusion of Central Kranken, divestiture of Nuova Tirrena, effects of Generali-PPF deal)
Assicurazioni Generali Group – 9M 2008 results
14
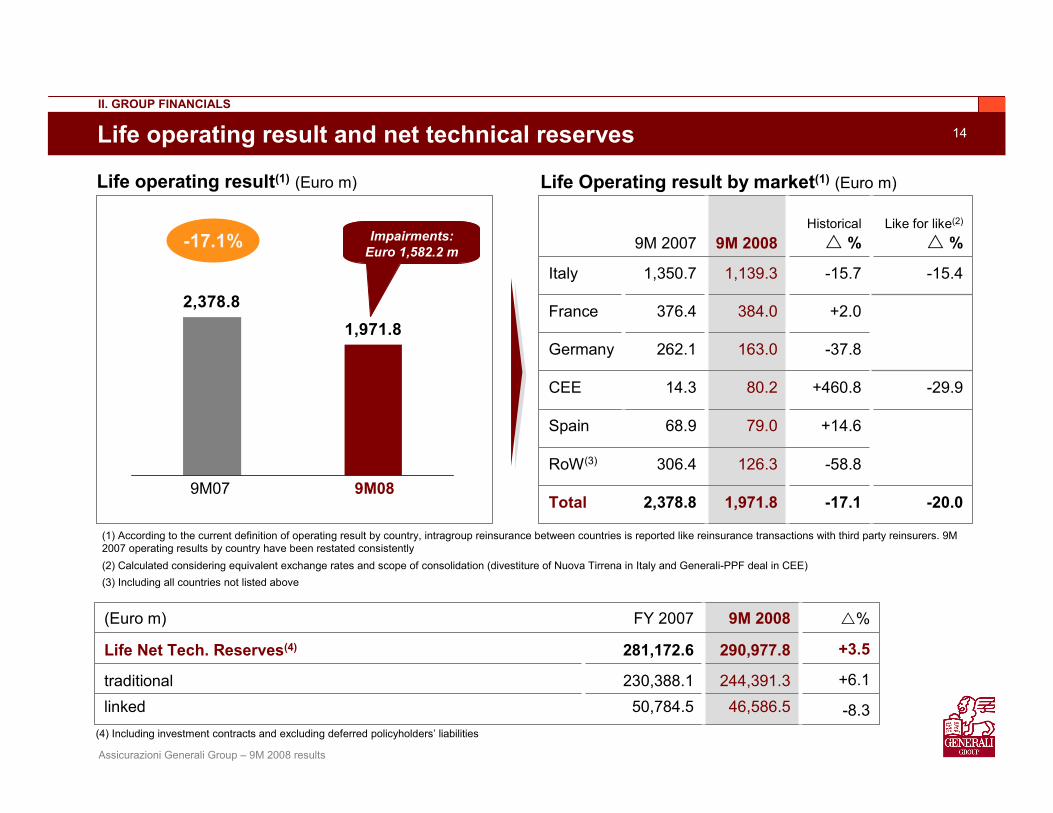
1,971.82,378.8
Life operating result and net technical reserves
Life operating result(1) (Euro m)
9M089M07
-17.1%
II. GROUP FINANCIALS
Life Operating result by market(1) (Euro m)
46,586.5244,391.3
290,977.8
9M 2008
-8.350,784.5linked
+6.1230,388.1traditional
+3.5281,172.6Life Net Tech. Reserves(4)
%FY 2007(Euro m)
(4) Including investment contracts and excluding deferred policyholders’ liabilities
-17.1
-58.8
+14.6
+460.8
-37.8
+2.0
-15.7
Historical%
79.068.9Spain
163.0262.1Germany
-20.0
-29.9
-15.4
Like for like(2)
%
126.3306.4RoW(3)
1,971.82,378.8Total
80.214.3CEE
384.0376.4France
1,139.31,350.7Italy
9M 20089M 2007Impairments: Euro 1,582.2 m
(1) According to the current definition of operating result by country, intragroup reinsurance between countries is reported like reinsurance transactions with third party reinsurers. 9M 2007 operating results by country have been restated consistently(2) Calculated considering equivalent exchange rates and scope of consolidation (divestiture of Nuova Tirrena in Italy and Generali-PPF deal in CEE)(3) Including all countries not listed above

Assicurazioni Generali Group – 9M 2008 results
15P&C Gross Written Premiums
Growth continues despite a challenging environment
II. GROUP FINANCIALS
+14.2+148.81,868.7751.2CEE
+2.8+2.72,884.72,808.9France
+4.9
+2.9
+2.3
+0.6
-9.8
Historical%
+2.7
+3.9
+2.3
+0.6
-0.3
Like for like(1)
%
1,202.71,175.6Spain
2,921.82,839.2RoW(2)
16,425.515,655.0Total
2.529.62,514.6Germany
5,018.05,565.4Italy
9M 20089M 2007
(1) Calculated considering equivalent exchange rates and scope of consolidation (divestiture of Nuova Tirrena in Italy and Generali-PPF deal in CEE)(2) Including all countries not listed above
(Euro m) Italy: decrease in motor premiums (-2.6%), in line with market trend, also due to cancellation of non profitable fleet contracts; confirmed the positive trend in non motor retail lines (+3.4%) and stability in corporate lines
France: strong growth in retail incl. assistance (+14.9%), multi-risks (+4.7%) and accident & health (+2%); off-setting lower trends in motor (-2.4%), due to cancellation of non profitable fleets, and transportation
Germany: stable growth in profitable non motor lines (+2.7%) more than compensates the decrease in motor business (-2.3%), penalised by ongoing strong price competition

Assicurazioni Generali Group – 9M 2008 results
16P&C profitability – net combined ratio
(0.9)0.6
9M089M07
Combined ratio (%)
Expense ratio
Loss ratio
-0.3 pts.
II. GROUP FINANCIALS
Combined ratio by country (%)
-6.483.589.9CEE
+1.497.896.4RoW(2)
+0.897.596.7France
-0.3
+1.6
-0.9
+1.3
%pts
95.195.4Total
90.689.0Spain
96.096.9Germany
96.495.1Italy(1)
9M 20089M 2007
(1) Excluding foreign branches(2) Including all countries not listed above
26.8
68.3
26.2
69.2
95.195.4
Loss ratio Expense ratio

Assicurazioni Generali Group – 9M 2008 results
17
1,728.11,652.4
P&C profitability – operating result
P&C operating result(1) (Euro m)
9M089M07
+4.6%
II. GROUP FINANCIALS
P&C Operating result by market(1) (Euro m)
+4.6
-9.8
+1.9
+567.6
+10.8
+2.8
-39.5
Historical%
156.7153.7Spain
288.1280.1France
-10.1
+27.4
-32.5
Like for like(2)
%
258.1286.2RoW(3)
1,728.11,652.4Total
373.255.9CEE
267.6241.5Germany
384.4635.0Italy
9M 20089M 2007
(1) According to the current definition of operating result by country, intragroup reinsurance between countries is reported like reinsurance transactions with third party reinsurers. 9M 2007 operating results by country have been restated consistently(2) Calculated considering equivalent exchange rates and scope of consolidation (divestiture of Nuova Tirrena in Italy and Generali-PPF deal in CEE)(3) Including all countries not listed above
Assicurazioni Generali Group – 9M 2008 results
18
III. Final Remarks
Agenda

Assicurazioni Generali Group – 9M 2008 results
19Final remarks
Insurers are different to banks -we are much less exposed to both liquidity and asset issues
Revenues growth continues
Generali: a safe harbour for all stakeholders
III. FINAL REMARKS
Our solvency position remains strong
We remain committed on efficiency improvement

Assicurazioni Generali Group – 9M 2008 results
20Agenda
IV. Backup
Assicurazioni Generali Group – 9M 2008 results
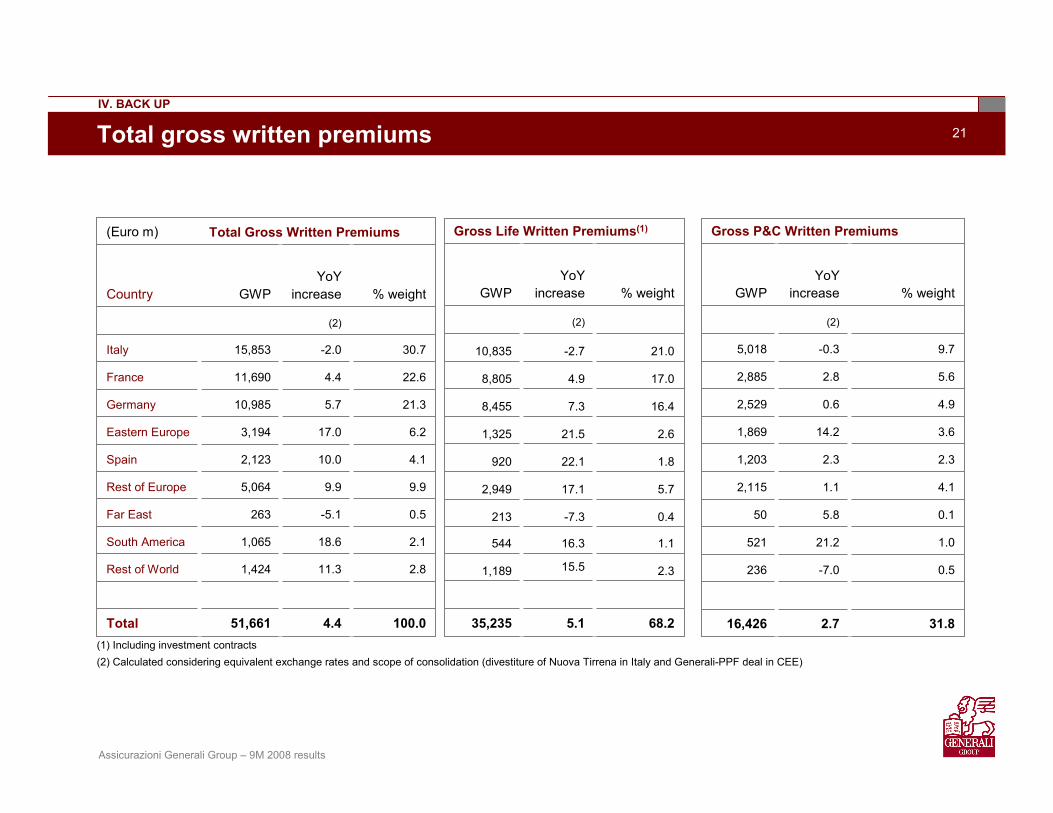
21Total gross written premiums
22.64.411,690France
Total Gross Written Premiums(Euro m)
(2)
100.04.451,661Total
2.811.31,424Rest of World
2.118.61,065South America
0.5-5.1263Far East
9.99.95,064Rest of Europe
4.110.02,123Spain
6.217.03,194Eastern Europe
21.35.710,985Germany
30.7-2.015,853Italy
% weightYoY
increaseGWPCountry
16.47.38,455
Gross Life Written Premiums(1)
68.25.135,235
2.315.51,189
1.116.3544
0.4-7.3213
5.717.12,949
1.822.1920
2.621.51,325
17.04.98,805
21.0-2.710,835
(2)
% weightYoY
increaseGWP
4.90.62,529
Gross P&C Written Premiums
31.82.716,426
0.5-7.0236
1.021.2521
0.15.850
4.11.12,115
2.32.31,203
3.614.21,869
5.62.82,885
9.7-0.35,018
(2)
% weightYoY
increaseGWP
(2) Calculated considering equivalent exchange rates and scope of consolidation (divestiture of Nuova Tirrena in Italy and Generali-PPF deal in CEE)(1) Including investment contracts
IV. BACK UP

Assicurazioni Generali Group – 9M 2008 results
22Life premiums by country & business line
Life 9M08
8,454.80.1%5.6%18.0%28.3%48.1%Germany
8,696.70.5%7.2%7.3%13.7%71.2%France
9.1%
0.0%
44.2%
9.0%
0.0%
0.0%
34.4%
18.1%
Investment contracts
Total life gross direct premiums
34,627.610.0%7.6%14.4%58.9%
1,583.851.3%10.7%6.5%31.5%Rest of World
1,496.424.1%1.1%5.6%25.1%Other Europe
597.70.4%1.1%67.1%22.4%Switzerland
844.40.0%18.3%37.0%44.7%Austria
920.333.3%0.0%1.8%64.9%Spain
1,325.12.4%9.9%18.8%34.6%Eastern Europe
10,708.58.1%0.0%2.1% 71.7%Italy
TotalGroupHealthUnit/index
linkedTraditional(Euro m)
IV. BACK UP

Assicurazioni Generali Group – 9M 2008 results
23P&C premiums by country & business line
P&C 9M08
2,730.220.5%36.8%12.1%30.6%France
20.7%
30.3%
29.5%
0.7%
15.3%
38.2%
21.3%
9.0%
22.8%
Commercial
Total P&C gross direct premiums
16,104.321.3%13.6%44.3%
790.94.2%7.3%58.1%Rest of World
555.813.6%13.7%43.2%Other Europe
434.523.8%20.3%55.1%Switzerland
1,044.227.5%10.1%47.1%Austria
1,185.917.6%10.4%33.9%Spain
1,853.813.7%10.3%54.6%Eastern Europe
2,526.335.7%13.6%41.6%Germany
4,982.611.2%17.7%48.3%Italy
TotalOther
personalAccident/
HealthMotor(1)(Euro m)
IV. BACK UP
(1) Including fleets

Assicurazioni Generali Group – 9M 2008 results
24Life & Health: New Business Annual Premium Equivalent
7.1%7.1%9690Spain
17.1%25.9%139110CEE
28.9%50.0%799533Germany
3.5%3.5%868838France
15.5%
14.0%
13.3%
8.4%
Historical%
10.5%
3.4%
9.3%
9.2%
Like for like(1)
%
312274RoW
3,5903,108Total
579511RoEof which:
1,032952Italy
9M 20089M 2007(Euro m)
IV. BACK UP
(1) Neutralizing impacts of variations in exchange rates and scope of consolidation (inclusion of Central Kranken, divestiture of Nuova Tirrena, effects of Generali-PPF deal)

Assicurazioni Generali Group – 9M 2008 results
25
Loss ratio
Expenseratio
Life – Expense ratio (%) P&C – Combined ratio (%)
Total – Expense ratio (%)
68.369.2
26.2 26.8
15.6 15.9
11.0 11.2
9M089M07
9M089M07
9M089M07
95.4 95.1
RatiosIV. BACK UP

Assicurazioni Generali Group – 9M 2008 results
26Ratios by country
29.0
20.0
90.0
83.5
30.5
28.5
59.5
55.0
CEE
7.4
7.7
96.7
97.5
27.2
27.3
69.4
70.2
FRA
11.220.615.25.015.48.59M08
11.017.717.75.515.08.69M07
Life expense ratios by country (%)
Combined ratio
Expense ratio
Loss ratio
95.4
95.1
26.2
26.8
69.2
68.3
Consolidated
96.8
92.0
25.7
28.6
71.1
63.4
SWI
97.4
96.5
29.3
28.4
68.2
68.1
AUT
89.0
90.6
23.1
23.6
65.9
67.0
SPAGER
95.1
96.4
21.5
21.9
73.6
74.5
96.99M07
96.09M08
30.29M07
29.69M08
9M07
9M08
66.7
66.4
ITAP&C ratios by country (%)
IV. BACK UP

Assicurazioni Generali Group – 9M 2008 results
27Combined ratio reconciliation
9M 20089M 2007
95.4
26.2
69.2
3,664.3
848.3
41.5
889.8
2,816.0
9,683.1
13,997.0
95.1Combined ratio(B+C)/A
26.8Expense ratioC/A
68.3Loss ratioB/A
3,978.1Total acquisition and administration costsC
904.0Insurance activity related consolidated administration costs
53.9Non insurance activity related administration costs(1)
958.0Consolidated administration costs
3,074.0Consolidated acquisition costs
10,149.7Consolidated net claimsB
14,858.8Net earned premiums (net of consolidation adjustments)A
(1) Administration expenses related to service companies, real estate and other companies not belonging to P&C segment
(Euro m)
IV. BACK UP

Assicurazioni Generali Group – 9M 2008 results
28Operating result by country
P&C operating result by market (Euro m)Life operating result by market (Euro m)
-37.8163.0262.1Germany
+34.331.723.6Austria
+460.880.214.3CEE
1,971.8
60.2
34.4
79.0
384.0
1,139.3
9M08
-45.162.7Switzerland
-72.6220.0RoW(1)
-17.12,378.8Total
+14.668.9Spain
+2.0376.4France
-15.71,350.7Italy
%9M07
+31.386.565.9Austria
+567.6373.255.9CEE
1,728.1
121.5
50.1
156.7
267.6
288.1
384.4
9M08
+62.030.9Switzerland
-35.8189.5RoW(1)
+4.61,652.5Total
+1.9153.7Spain
+10.8241.5Germany
+2.8280.1France
-39.5635.0Italy
%9M07
IV. BACK UP
(1) Including all countries not listed above (1) Including all countries not listed above

Assicurazioni Generali Group – 9M 2008 results
29Reclassified P&L account
(523.0)(490.7)Non-operating holding expenses
2,364.3342.6
2,706.9(1,151.9)
3,858.8(204.3)
(21.9)
(468.8)
443.7(251.3)(280.0)(201.7)
11,774.2427.3
(7,508.5)(45,272.2)
45,170.94,110.09M 2007
1,669.9Group result of the period 368.8Result of the period attributable to minority interests
2,038.7Consolidated result of the period(699.9)Income taxes2,738.6Earnings before taxes(321.0)Net other non-operating expenses
(21.8)Other non-operating holding expenses
(501.2)Interest expenses on financial debt
112.0Non-operating income from investments(732.0)Non-operating result(1)(434.1)Net other operating expenses(218.3)Operating holding expenses1,820.8Operating income from investments
507.7Net fee and commission income and net income from financial service activities(8,290.6)Acquisition and administration costs
(36,290.3)Net insurance benefits and claims46,375.4Net earned premiums3,470.6Operating result(1)9M 2008
Total(Euro m)
IV. BACK UP
(1) Refer to the Methodological note on alternative performance measures included in the Consolidated Quarterly Report

Assicurazioni Generali Group – 9M 2008 results
30
(692.4)
-
(490.7)
-
(490.7)
-
(201.7)
-
-
-
-
-
(201.7)
Unallocated holding
expenses
(490.7)----Non-operating holding expenses
(201.7)----Operating holding expenses
3,858.8
(204.3)
443.7
(251.3)
(280.0)
11,774.2
427.3
(7,508.5)
(45,272.2)
45,170.9
4,110.0
Total
(19.4)
-
(0.3)
(0.3)
10.9
(47.0)
(50.2)
-
67.1
0.1
(19.1)
Consolidation adjustments
271.9
(39.8)
12.0
(27.8)
(6.4)
234.4
407.7
(336.0)
0.0
0.0
299.7
Financial(2)Non life
2,349.8
(40.9)
11.8
(29.1)
(50.7)
10,308.7
69.8
(3,466.7)
(35,656.1)
31,173.8
2,378.8
1,949.0Earnings before taxes
(123.6)Net other non-operating expenses
420.2Non-operating income from investments
296.6Non-operating result(1)
(233.8)Net other operating expenses
1,278.1Operating income from investments
0.0Net fee and commission income and net income from financial service activities
(3,705.8)Acquisition and administration costs
(9,683.1)Net insurance benefits and claims
13,997.0Net earned premiums
1,652.4Operating result(1)
Life(Euro m)
Reclassified P&L account by segment – 9M 2007IV. BACK UP
(1) Refer to the Methodological note on alternative performance measures included in the Consolidated Quarterly Report(2) Not reclassified according to the new layout based on operating margins and presented in the Consolidated Quarterly Report

Assicurazioni Generali Group – 9M 2008 results
31
(741.3)
-
(523.0)
-
(523.0)
-
(218.3)
-
-
-
-
-
(218.3)
Unallocated holding
expenses
(523.0)----Non-operating holding expenses
(218.3)----Operating holding expenses
2,738.6
(321.0)
112.0
(732.0)
(434.1)
1,820.8
507.7
(8,290.6)
(36,290.3)
46,375.4
3,470.6
Total
(255.6)
-
(1.5)
(1.5)
17.7
(193.1)
(78.8)
-
-
-
(254.1)
Consolidation adjustments
203.4
(47.6)
7.7
(39.9)
(83.0)
287.1
514.6
(475.4)
0.0
0.0
243.3
Financial(2)Non life
1,626.9
(123.4)
(221.5)
(344.9)
(125.0)
442.2
71.9
(3,793.3)
(26,140.7)
31,516.6
1,971.8
1,905.3Earnings before taxes
(150.0)Net other non-operating expenses
327.3Non-operating income from investments
177.3Non-operating result(1)
(243.8)Net other operating expenses
1,284.5Operating income from investments
0.0Net fee and commission income and net income from financial service activities
(4,021.8)Acquisition and administration costs
(10,149.7)Net insurance benefits and claims
14,858.8Net earned premiums
1,728.1Operating result(1)
Life(Euro m)
IV. BACK UP
Reclassified P&L account by segment – 9M 2008
(1) Refer to the Methodological note on alternative performance measures included in the Consolidated Quarterly Report(2) Not reclassified according to the new layout based on operating margins and presented in the Consolidated Quarterly Report

Assicurazioni Generali Group – 9M 2008 results
32Investments
52.5177,94753.8180,933Available for sale
100.0
21.9
0.4
20.7
0.9
3.6
% on total
100.0
23.4
0.3
18.2
0.8
3.5
% on total
339,101336,617Total investments
74,33678,522Fin. Instr. at fair value thr. P&L
1,3641,148Held to maturity
70,15461,371Loans
2,9992,736Group Participations
12,30311,907Real Estate(1)
9M08FY07(Euro m)
(1) Excluding real estate mutual funds
IV. BACK UP

Assicurazioni Generali Group – 9M 2008 results
33
292.8
46.3
79.2
285.9
50.7
61.4
Assets Under Management
398.0
Fixed incomeinstruments (2)
79.5%Other (3)
6.0%
Real Estate (4)
4.8%
Equity9.7%
(1) “Own Investments” exclude real estate for own use. With this asset class “Own Investments” would amount to € 296.0 bn, compared to € 288.7 bn at the end of 2007
Unit Linked
Third partiesAUM
“OwnInvestments” (1)
(4) Including real estate mutual funds
FY07 9M08
(Euro bn)
418.3
+5.1%
(3) Including investments in subsidiaries, associated companies and JVs, derivatives, receivables from banks or customers
(2) Including mortgage loans, policy loans, deposits under reinsurance business accepted, term deposits with credit institutions and other financial investments, other loans
IV. BACK UP

Assicurazioni Generali Group – 9M 2008 results
34
12,510
14,790
(3,168)
1,670
(782)
IFRS Shareholders’ equity roll forward
(Euro m)
Other Shareholders’ Equity 9M08
9M 2008Net Result
Change in AFS reserve
Shareholders’ Equity FY07
-15.4%
IV. BACK UP

Assicurazioni Generali Group – 9M 2008 results
35Investor Relations team
Paola Buratti – Head of Investor Relations(Tel.: +39-040-671157)
Email: [email protected]
Stefano Burrino (Tel.: +39-040-671202)
Email: [email protected]
Emanuele Marciante (Tel.: +39-040-671347)
Email: [email protected]
Veronica Cherini (Tel.: +39-040-671488)
Email: [email protected]
Assicurazioni Generali P.za Duca degli Abruzzi 2 34132 Trieste, Italy
Website: www.generali.com
Tel.: +39 040 671402 Fax: +39 040 671338 e-mail: [email protected]

Assicurazioni Generali Group – 9M 2008 results
36Disclaimer
Certain of the statements contained herein are statements of future expectations and other forward-looking statements.
These expectations are based on management's current views and assumptions and involve known and unknown risks and uncertainties.
The user of such information should recognise that actual results, performance or events may differ materially from such expectations because they relate to future events and circumstances which are beyond our control including, among other things, general economic and sector conditions.
Neither Assicurazioni Generali SpA nor any of its affiliates, directors, officers employees or agents owe any duty of care towards any user of the information provided herein nor any obligation to update any forward-looking information contained in this document.
The manager responsible for the preparation of the company’s financial reports, Raffaele Agrusti, declares, pursuant to paragraph 2 of article 154-bis of the Consolidated Law on Financial Intermediation, that, on the basis of the information available to him by virtue of his position, the accounting information (IAS 1, paragraph 8) contained in thispresentation corresponds to internal documentation, accounting books and accounting records.

Milan, October 30, 2008
Generali Group 9M 2008 Results