9M 2016 Results - ir.tlg.eu · 9M 2016 Results Presentation9M 2016 Results Presentation HIGHLIGHTS...
23
9M 2016 Results Presentation 9M 2016 Results TLG IMMOBILIEN AG November 2016
Transcript of 9M 2016 Results - ir.tlg.eu · 9M 2016 Results Presentation9M 2016 Results Presentation HIGHLIGHTS...

9M 2016 Results Presentation
9M 2016 ResultsTLG IMMOBILIEN AG
November 2016
9M 2016 Results Presentation
DISCLAIMER
This presentation includes statements, estimates, opinions and projections with respect to anticipated future performance of TLG
IMMOBILIEN ("Forward-Looking Statements") which reflect various assumptions concerning anticipated results taken from TLG
IMMOBILIEN’s current business plan or from public sources which have not been independently verified or assessed by TLG
IMMOBILIEN and which may or may not prove to be correct. Any Forward-Looking Statements reflect current expectations based on
the current business plan and various other assumptions and involve significant risks and uncertainties and should not be read as
guarantees of future performance or results and will not necessarily be accurate indications of whether or not such results will be
achieved. Any Forward-Looking Statements only speak as at the date this presentation. Various known and unknown risks.
uncertainties and other factors could lead to material differences between the actual future results, financial situation, development or
performance of TLG IMMOBILIEN and the estimates given here. These factors include those discussed in TLG IMMOBILIEN’s public
reports which are available on TLG IMMOBILIEN’s website at www.tlg.de. It is up to the reader of this presentation to make its own
assessment of the validity of any Forward-Looking Statements and other assumptions and no liability is accepted by TLG
IMMOBILIEN in respect of the achievement of such Forward-Looking Statements or other assumptions.
TLG IMMOBILIEN has no obligation whatsoever to update or revise any of the information, Forward-Looking Statements or the
conclusions contained herein or to reflect new events or circumstances or to correct any inaccuracies which may become apparent
subsequent to the date hereof.
2

9M 2016 Results Presentation
AGENDA
1 Highlights 9M 2016
2 Portfolio
3 Operations and Financials
4 Outlook
5 Appendix
3
9M 2016 Results Presentation9M 2016 Results Presentation
HIGHLIGHTS 9M 2016
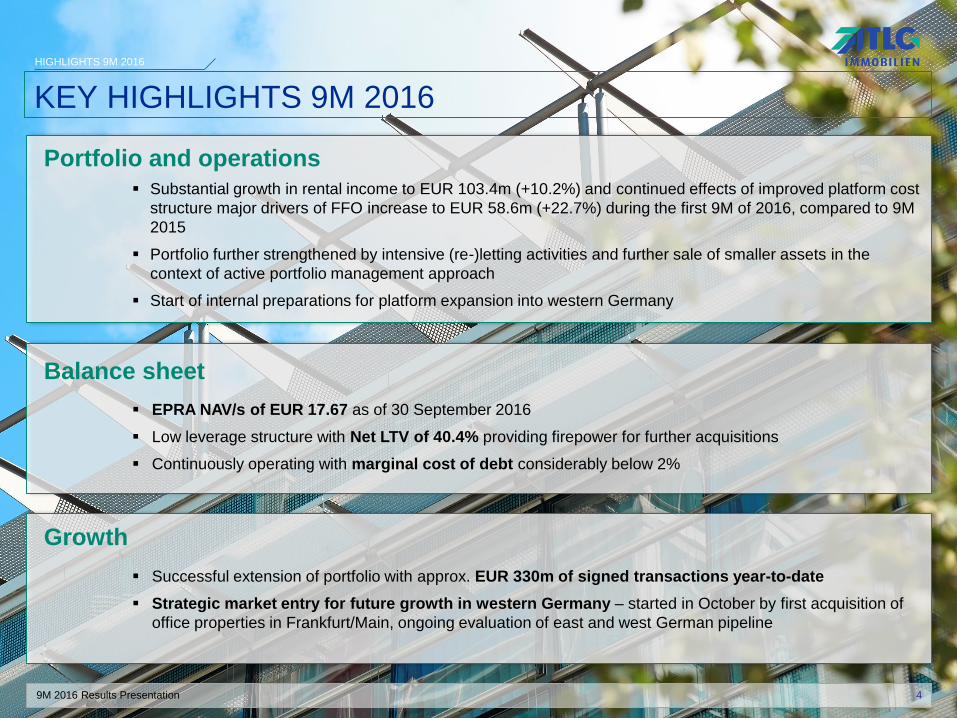
KEY HIGHLIGHTS 9M 2016
Balance sheet
Growth
Portfolio and operations Substantial growth in rental income to EUR 103.4m (+10.2%) and continued effects of improved platform cost
structure major drivers of FFO increase to EUR 58.6m (+22.7%) during the first 9M of 2016, compared to 9M
2015
Portfolio further strengthened by intensive (re-)letting activities and further sale of smaller assets in the
context of active portfolio management approach
Start of internal preparations for platform expansion into western Germany
EPRA NAV/s of EUR 17.67 as of 30 September 2016
Low leverage structure with Net LTV of 40.4% providing firepower for further acquisitions
Continuously operating with marginal cost of debt considerably below 2%
Successful extension of portfolio with approx. EUR 330m of signed transactions year-to-date
Strategic market entry for future growth in western Germany – started in October by first acquisition of
office properties in Frankfurt/Main, ongoing evaluation of east and west German pipeline
4

9M 2016 Results Presentation
AGENDA
1 Highlights 9M 2016
2 Portfolio
3 Operations and Financials
4 Outlook
5 Appendix
5
9M 2016 Results Presentation
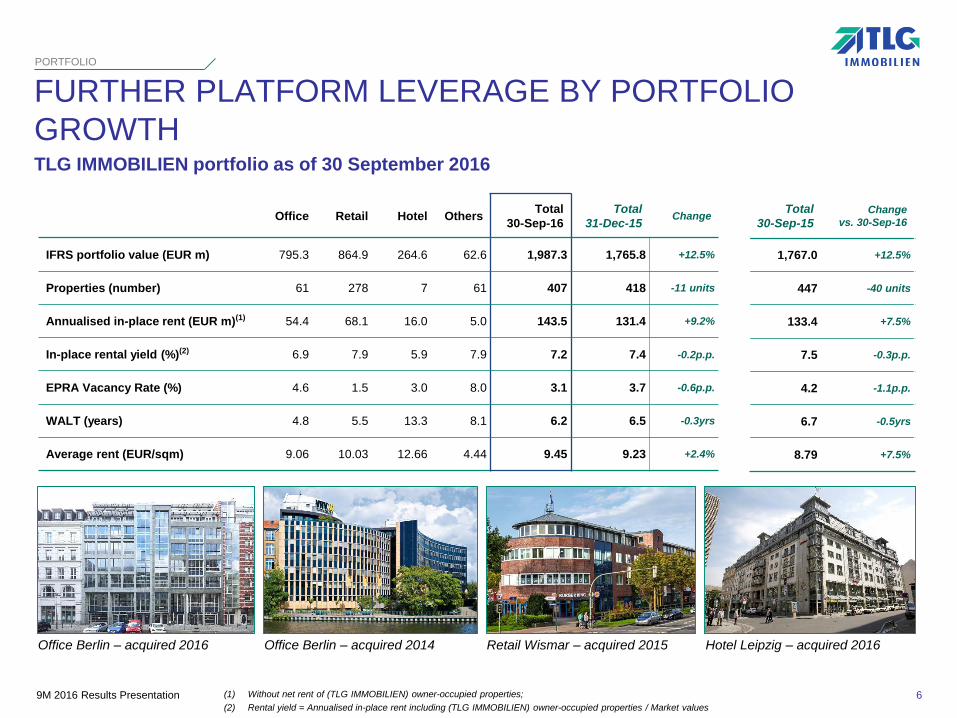
FURTHER PLATFORM LEVERAGE BY PORTFOLIO
GROWTH
PORTFOLIO
Office Retail Hotel OthersTotal
30-Sep-16
Total
31-Dec-15Change
IFRS portfolio value (EUR m) 795.3 864.9 264.6 62.6 1,987.3 1,765.8 +12.5%
Properties (number) 61 278 7 61 407 418 -11 units
Annualised in-place rent (EUR m)(1) 54.4 68.1 16.0 5.0 143.5 131.4 +9.2%
In-place rental yield (%)(2) 6.9 7.9 5.9 7.9 7.2 7.4 -0.2p.p.
EPRA Vacancy Rate (%) 4.6 1.5 3.0 8.0 3.1 3.7 -0.6p.p.
WALT (years) 4.8 5.5 13.3 8.1 6.2 6.5 -0.3yrs
Average rent (EUR/sqm) 9.06 10.03 12.66 4.44 9.45 9.23 +2.4%
TLG IMMOBILIEN portfolio as of 30 September 2016
(1) Without net rent of (TLG IMMOBILIEN) owner-occupied properties;
(2) Rental yield = Annualised in-place rent including (TLG IMMOBILIEN) owner-occupied properties / Market values
Total
30-Sep-15
Change
vs. 30-Sep-16
1,767.0 +12.5%
447 -40 units
133.4 +7.5%
7.5 -0.3p.p.
4.2 -1.1p.p.
6.7 -0.5yrs
8.79 +7.5%
6
Office Berlin – acquired 2016 Office Berlin – acquired 2014 Retail Wismar – acquired 2015 Hotel Leipzig – acquired 2016
9M 2016 Results Presentation
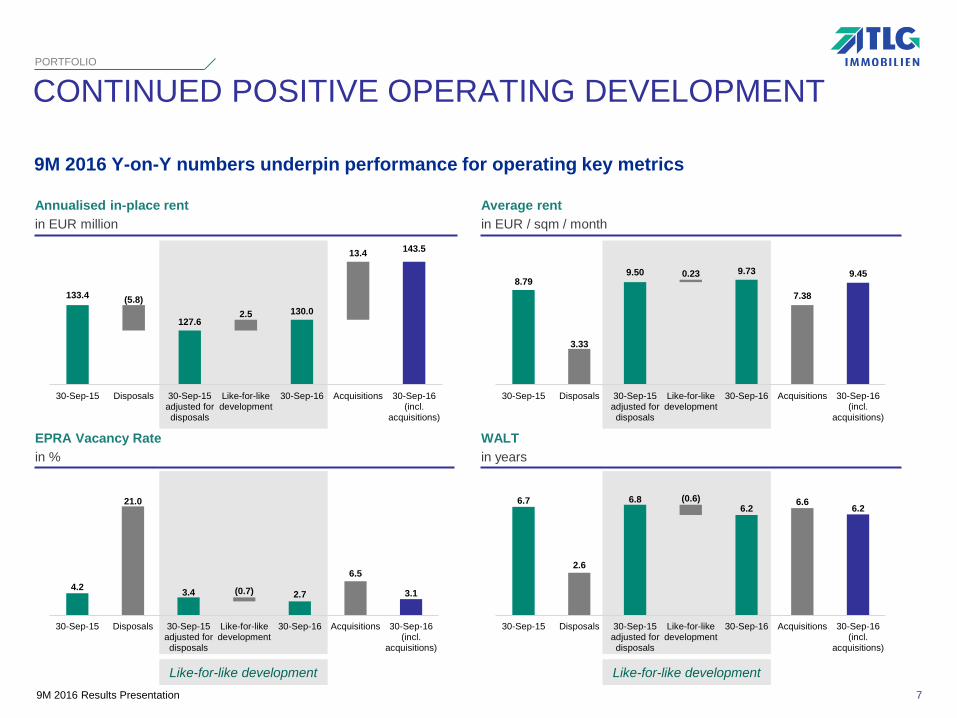
CONTINUED POSITIVE OPERATING DEVELOPMENTPORTFOLIO
Annualised in-place rent
in EUR million
EPRA Vacancy Rate
in %
WALT
in years
Average rent
in EUR / sqm / month
9M 2016 Y-on-Y numbers underpin performance for operating key metrics
Like-for-like development Like-for-like development
7
133.4
127.6130.0
143.5
(5.8)
2.5
13.4
30-Sep-15 Disposals 30-Sep-15adjusted fordisposals
Like-for-likedevelopment
30-Sep-16 Acquisitions 30-Sep-16(incl.
acquisitions)
8.79
3.33
9.50 9.73
7.38
9.450.23
30-Sep-15 Disposals 30-Sep-15adjusted fordisposals
Like-for-likedevelopment
30-Sep-16 Acquisitions 30-Sep-16(incl.
acquisitions)
4.2
21.0
3.4 2.7
6.5
3.1(0.7)
30-Sep-15 Disposals 30-Sep-15adjusted fordisposals
Like-for-likedevelopment
30-Sep-16 Acquisitions 30-Sep-16(incl.
acquisitions)
6.7
2.6
6.86.2
6.66.2
(0.6)
30-Sep-15 Disposals 30-Sep-15adjusted fordisposals
Like-for-likedevelopment
30-Sep-16 Acquisitions 30-Sep-16(incl.
acquisitions)
9M 2016 Results Presentation
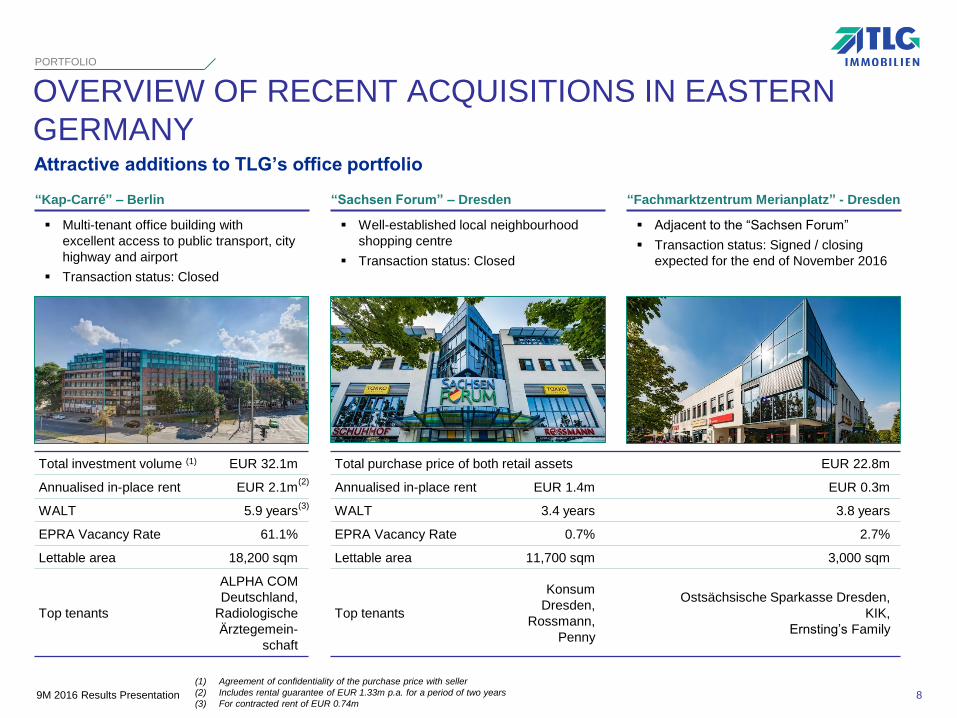
OVERVIEW OF RECENT ACQUISITIONS IN EASTERN
GERMANY
PORTFOLIO
“Kap-Carré” – Berlin
Attractive additions to TLG’s office portfolio
8
“Sachsen Forum” – Dresden “Fachmarktzentrum Merianplatz” - Dresden
Total investment volume (1) EUR 32.1m
Annualised in-place rent EUR 2.1m
WALT 5.9 years
EPRA Vacancy Rate 61.1%
Lettable area 18,200 sqm
Top tenants
ALPHA COM
Deutschland,
Radiologische
Ärztegemein-
schaft
Multi-tenant office building with
excellent access to public transport, city
highway and airport
Transaction status: Closed
Well-established local neighbourhood
shopping centre
Transaction status: Closed
Adjacent to the “Sachsen Forum”
Transaction status: Signed / closing
expected for the end of November 2016
(2)
(3)
(1) Agreement of confidentiality of the purchase price with seller
(2) Includes rental guarantee of EUR 1.33m p.a. for a period of two years
(3) For contracted rent of EUR 0.74m
Total purchase price of both retail assets EUR 22.8m
Annualised in-place rent EUR 1.4m EUR 0.3m
WALT 3.4 years 3.8 years
EPRA Vacancy Rate 0.7% 2.7%
Lettable area 11,700 sqm 3,000 sqm
Top tenants
Konsum
Dresden,
Rossmann,
Penny
Ostsächsische Sparkasse Dresden,
KIK,
Ernsting’s Family
9M 2016 Results Presentation
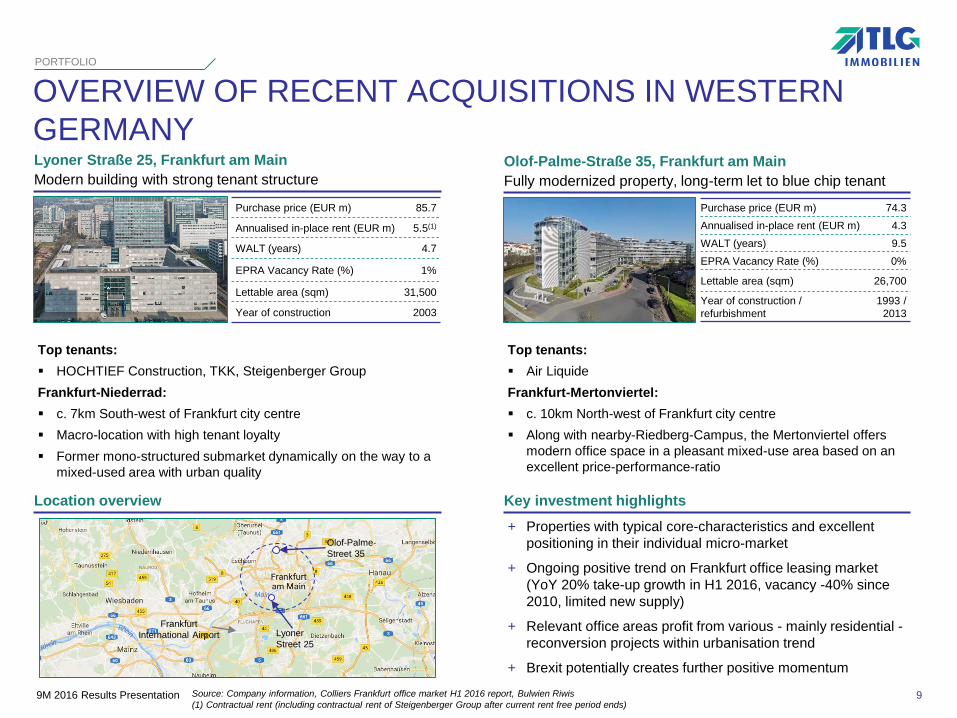
OVERVIEW OF RECENT ACQUISITIONS IN WESTERN
GERMANY
PORTFOLIO
9Source: Company information, Colliers Frankfurt office market H1 2016 report, Bulwien Riwis
(1) Contractual rent (including contractual rent of Steigenberger Group after current rent free period ends)
Key investment highlights
Lyoner Straße 25, Frankfurt am Main
Modern building with strong tenant structure
Top tenants:
HOCHTIEF Construction, TKK, Steigenberger Group
Frankfurt-Niederrad:
c. 7km South-west of Frankfurt city centre
Macro-location with high tenant loyalty
Former mono-structured submarket dynamically on the way to a
mixed-used area with urban quality
Top tenants:
Air Liquide
Frankfurt-Mertonviertel:
c. 10km North-west of Frankfurt city centre
Along with nearby-Riedberg-Campus, the Mertonviertel offers
modern office space in a pleasant mixed-use area based on an
excellent price-performance-ratio
+ Properties with typical core-characteristics and excellent
positioning in their individual micro-market
+ Ongoing positive trend on Frankfurt office leasing market
(YoY 20% take-up growth in H1 2016, vacancy -40% since
2010, limited new supply)
+ Relevant office areas profit from various - mainly residential -
reconversion projects within urbanisation trend
+ Brexit potentially creates further positive momentum
Location overview
Olof-Palme-
Street 35
Lyoner
Street 25
Frankfurt
International Airport
Purchase price (EUR m) 85.7
Annualised in-place rent (EUR m) 5.5(1)
WALT (years) 4.7
EPRA Vacancy Rate (%) 1%
Lettable area (sqm) 31,500
Year of construction 2003
Olof-Palme-Straße 35, Frankfurt am Main
Fully modernized property, long-term let to blue chip tenant
Purchase price (EUR m) 74.3
Annualised in-place rent (EUR m) 4.3
WALT (years) 9.5
EPRA Vacancy Rate (%) 0%
Lettable area (sqm) 26,700
Year of construction /
refurbishment
1993 /
2013
9M 2016 Results Presentation
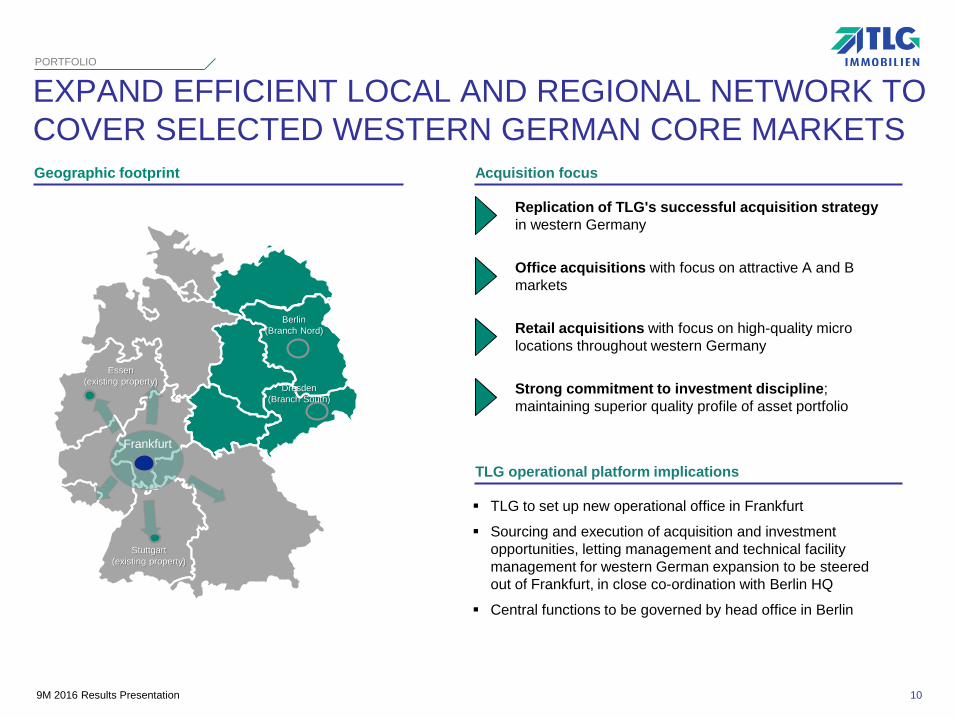
EXPAND EFFICIENT LOCAL AND REGIONAL NETWORK TO
COVER SELECTED WESTERN GERMAN CORE MARKETS
PORTFOLIO
10
Geographic footprint
Stuttgart
(existing property)
Essen
(existing property)
Berlin
(Branch Nord)
Dresden
(Branch South)
Frankfurt
Replication of TLG's successful acquisition strategy
in western Germany
Acquisition focus
Office acquisitions with focus on attractive A and B
markets
Retail acquisitions with focus on high-quality micro
locations throughout western Germany
TLG operational platform implications
TLG to set up new operational office in Frankfurt
Sourcing and execution of acquisition and investment
opportunities, letting management and technical facility
management for western German expansion to be steered
out of Frankfurt, in close co-ordination with Berlin HQ
Central functions to be governed by head office in Berlin
Strong commitment to investment discipline;
maintaining superior quality profile of asset portfolio
9M 2016 Results Presentation
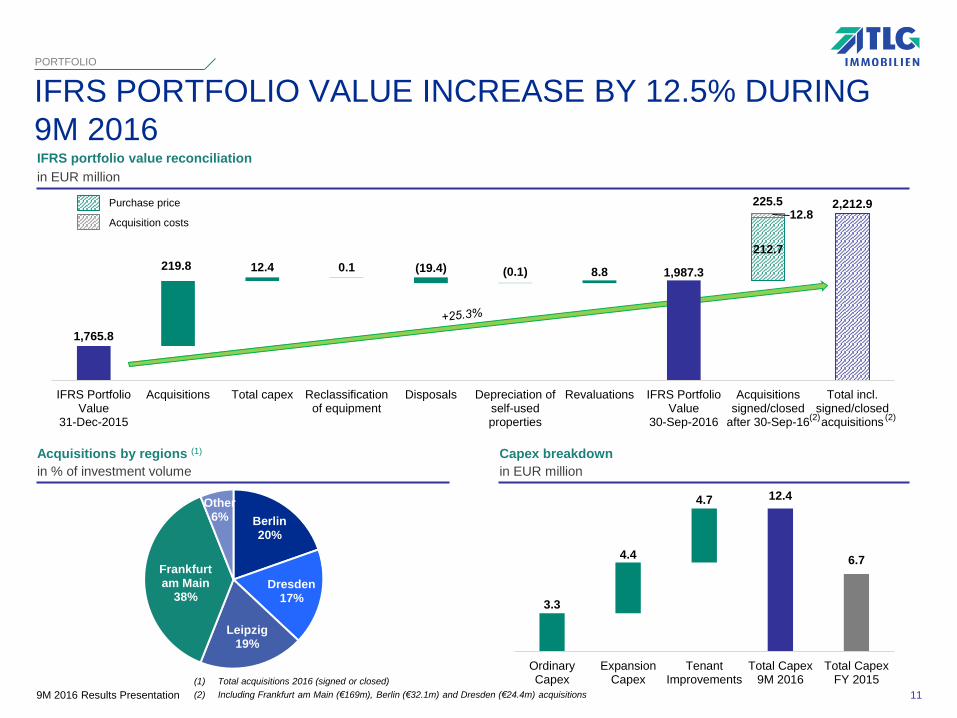
1,765.8
1,987.3
2,212.9
219.8 12.4 0.1 (19.4) (0.1) 8.8
212.7
12.8
IFRS PortfolioValue
31-Dec-2015
Acquisitions Total capex Reclassificationof equipment
Disposals Depreciation ofself-usedproperties
Revaluations IFRS PortfolioValue
30-Sep-2016
Acquisitionssigned/closed
after 30-Sep-16
Total incl.signed/closedacquisitions
IFRS PORTFOLIO VALUE INCREASE BY 12.5% DURING
9M 2016
PORTFOLIO
IFRS portfolio value reconciliation
in EUR million
11
Acquisitions by regions (1)
in % of investment volume
Capex breakdown
in EUR million
(1) Total acquisitions 2016 (signed or closed)
(2) Including Frankfurt am Main (€169m), Berlin (€32.1m) and Dresden (€24.4m) acquisitions
3.3
12.4
6.74.4
4.7
OrdinaryCapex
ExpansionCapex
TenantImprovements
Total Capex9M 2016
Total CapexFY 2015
Berlin20%
Dresden17%
Leipzig19%
Frankfurt am Main
38%
Other6%
225.5
(2)
Purchase price
Acquisition costs
(2)

9M 2016 Results Presentation
AGENDA
1 Highlights 9M 2016
2 Portfolio
3 Operations and Financials
4 Outlook
5 Appendix
12
9M 2016 Results Presentation
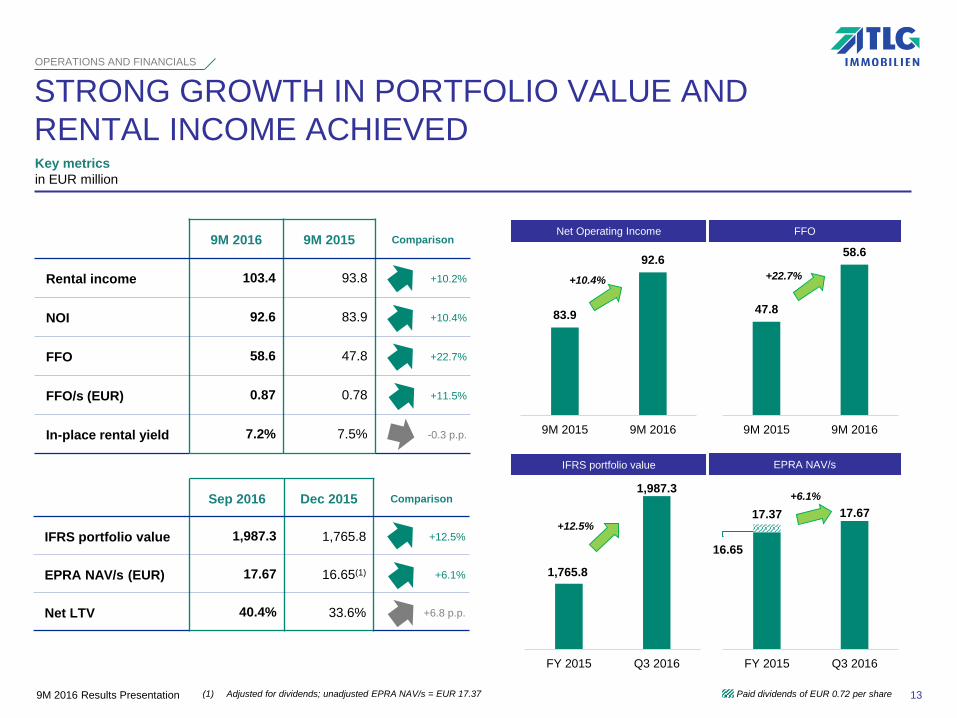
16.65
17.67 17.37
FY 2015 Q3 2016
1,987.3
1,765.8
Q3 2016FY 2015
58.6
47.8
9M 20169M 2015
92.6
83.9
9M 20169M 2015
9M 2016 9M 2015 Comparison
Rental income 103.4 93.8 +10.2%
NOI 92.6 83.9 +10.4%
FFO 58.6 47.8 +22.7%
FFO/s (EUR) 0.87 0.78 +11.5%
In-place rental yield 7.2% 7.5% -0.3 p.p.
STRONG GROWTH IN PORTFOLIO VALUE AND
RENTAL INCOME ACHIEVED
OPERATIONS AND FINANCIALS
Key metrics
in EUR million
Sep 2016 Dec 2015 Comparison
IFRS portfolio value 1,987.3 1,765.8 +12.5%
EPRA NAV/s (EUR) 17.67 16.65(1) +6.1%
Net LTV 40.4% 33.6% +6.8 p.p.
+12.5%
13
+6.1%
FFONet Operating Income
+10.4% +22.7%
IFRS portfolio value EPRA NAV/s
(1) Adjusted for dividends; unadjusted EPRA NAV/s = EUR 17.37 Paid dividends of EUR 0.72 per share
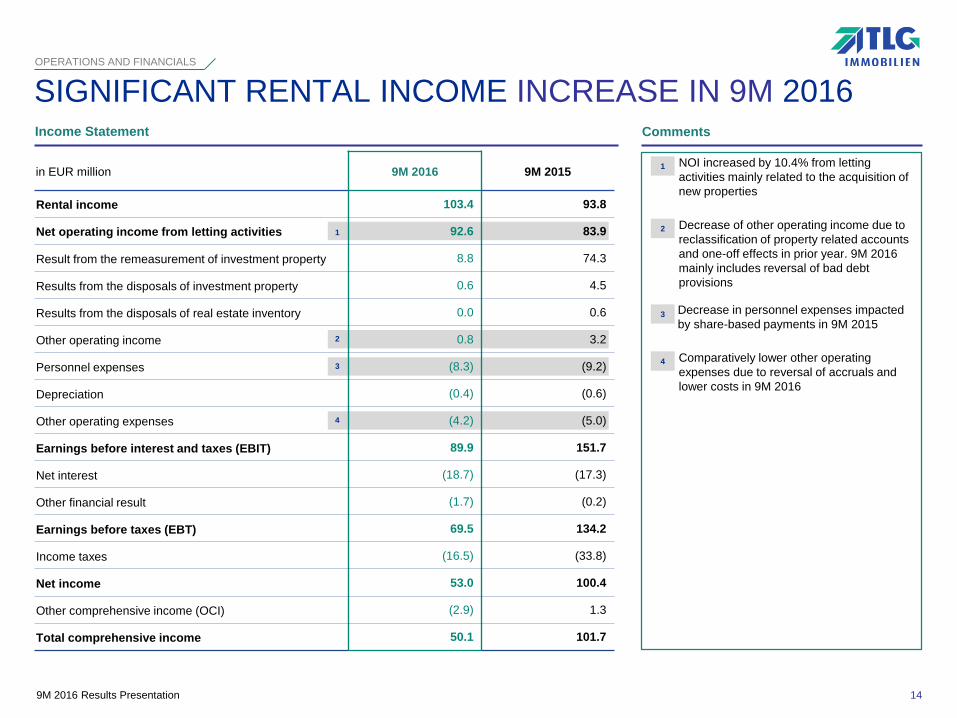
9M 2016 Results Presentation
Comparatively lower other operating
expenses due to reversal of accruals and
lower costs in 9M 2016
Decrease of other operating income due to
reclassification of property related accounts
and one-off effects in prior year. 9M 2016
mainly includes reversal of bad debt
provisions
NOI increased by 10.4% from letting
activities mainly related to the acquisition of
new properties
Decrease in personnel expenses impacted
by share-based payments in 9M 20152
4
OPERATIONS AND FINANCIALS
Income Statement Comments
SIGNIFICANT RENTAL INCOME INCREASE IN 9M 2016
1
3
2
4
1
3
in EUR million 9M 2016 9M 2015
Rental income 103.4 93.8
Net operating income from letting activities 92.6 83.9
Result from the remeasurement of investment property 8.8 74.3
Results from the disposals of investment property 0.6 4.5
Results from the disposals of real estate inventory 0.0 0.6
Other operating income 0.8 3.2
Personnel expenses (8.3) (9.2)
Depreciation (0.4) (0.6)
Other operating expenses (4.2) (5.0)
Earnings before interest and taxes (EBIT) 89.9 151.7
Net interest (18.7) (17.3)
Other financial result (1.7) (0.2)
Earnings before taxes (EBT) 69.5 134.2
Income taxes (16.5) (33.8)
Net income 53.0 100.4
Other comprehensive income (OCI) (2.9) 1.3
Total comprehensive income 50.1 101.7
14
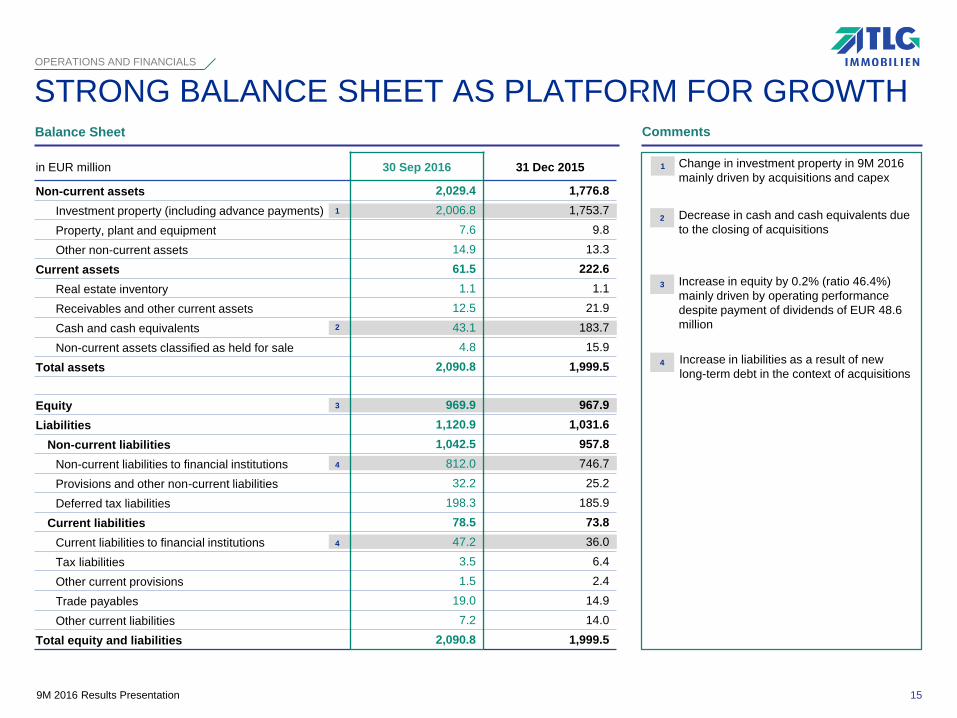
9M 2016 Results Presentation
Change in investment property in 9M 2016
mainly driven by acquisitions and capex
Increase in equity by 0.2% (ratio 46.4%)
mainly driven by operating performance
despite payment of dividends of EUR 48.6
million
Increase in liabilities as a result of new
long-term debt in the context of acquisitions
Decrease in cash and cash equivalents due
to the closing of acquisitions
2
4
3
OPERATIONS AND FINANCIALS
Balance Sheet
1
STRONG BALANCE SHEET AS PLATFORM FOR GROWTH
4
3
4
2
15
1
Comments
in EUR million 30 Sep 2016 31 Dec 2015
Non-current assets 2,029.4 1,776.8
Investment property (including advance payments) 2,006.8 1,753.7
Property, plant and equipment 7.6 9.8
Other non-current assets 14.9 13.3
Current assets 61.5 222.6
Real estate inventory 1.1 1.1
Receivables and other current assets 12.5 21.9
Cash and cash equivalents 43.1 183.7
Non-current assets classified as held for sale 4.8 15.9
Total assets 2,090.8 1,999.5
Equity 969.9 967.9
Liabilities 1,120.9 1,031.6
Non-current liabilities 1,042.5 957.8
Non-current liabilities to financial institutions 812.0 746.7
Provisions and other non-current liabilities 32.2 25.2
Deferred tax liabilities 198.3 185.9
Current liabilities 78.5 73.8
Current liabilities to financial institutions 47.2 36.0
Tax liabilities 3.5 6.4
Other current provisions 1.5 2.4
Trade payables 19.0 14.9
Other current liabilities 7.2 14.0
Total equity and liabilities 2,090.8 1,999.5
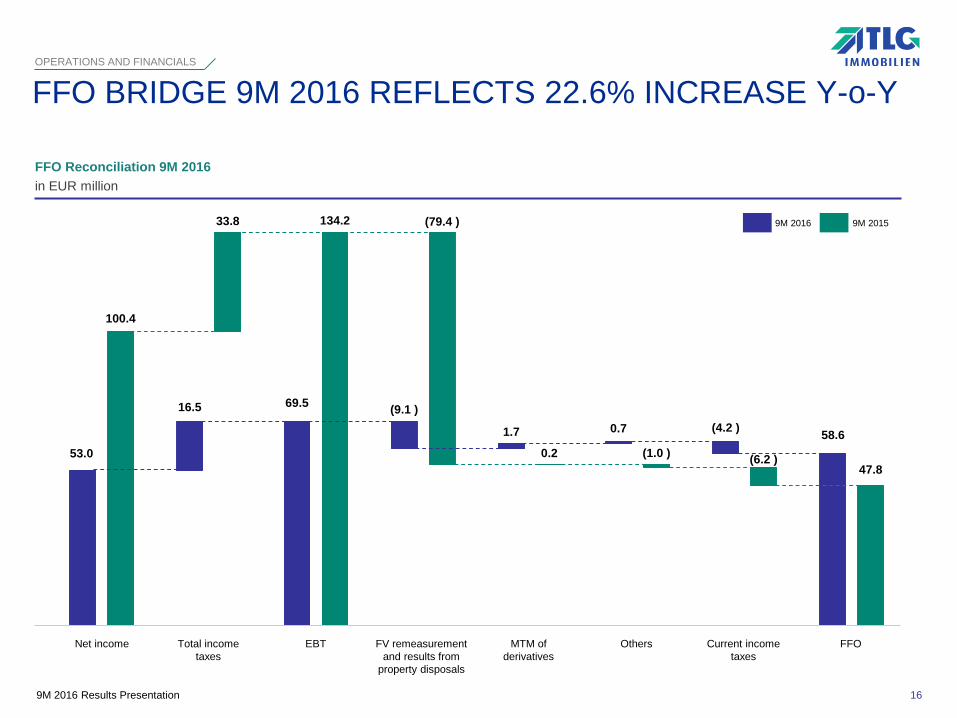
9M 2016 Results Presentation
53.0
69.5
58.6
16.5 (9.1 )
1.7 0.7 (4.2 )
100.4
134.2
47.8
33.8 (79.4 )
0.2 (1.0 )(6.2 )
FFO BRIDGE 9M 2016 REFLECTS 22.6% INCREASE Y-o-Y
OPERATIONS AND FINANCIALS
9M 2016 9M 2015
Net income Total income
taxes
EBT FV remeasurement
and results from
property disposals
MTM of
derivatives
Others Current income
taxes
FFO
16
FFO Reconciliation 9M 2016
in EUR million
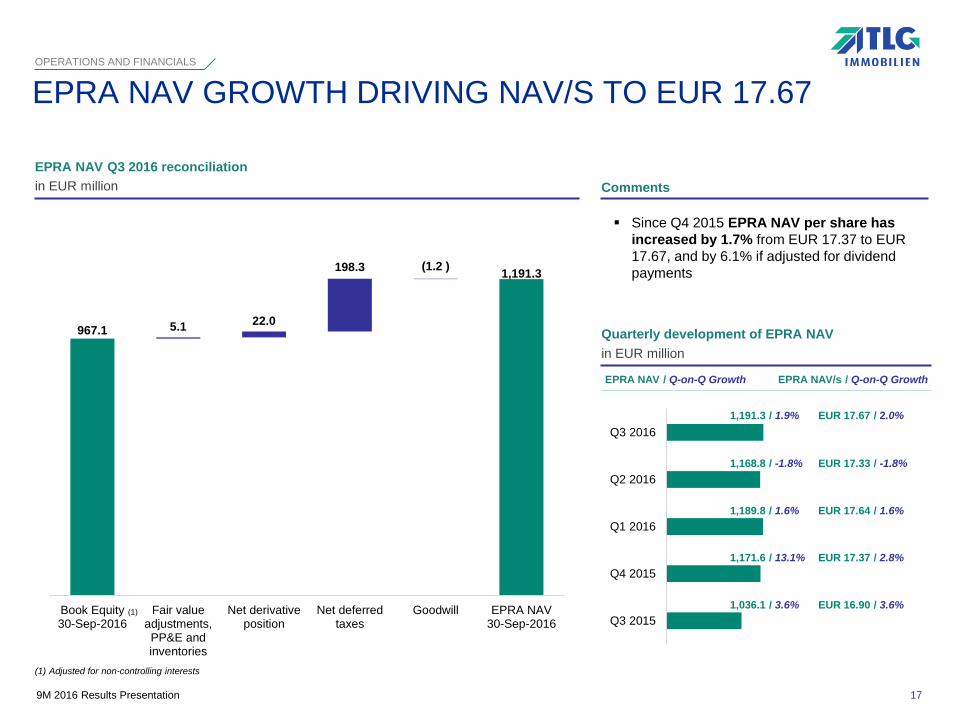
9M 2016 Results Presentation
967.1
1,191.3
5.1 22.0
198.3 (1.2 )
Book Equity30-Sep-2016
Fair valueadjustments,PP&E andinventories
Net derivativeposition
Net deferredtaxes
Goodwill EPRA NAV30-Sep-2016
OPERATIONS AND FINANCIALS
EPRA NAV Q3 2016 reconciliation
in EUR million
EPRA NAV GROWTH DRIVING NAV/S TO EUR 17.67
Comments
(1) Adjusted for non-controlling interests
(1)
Quarterly development of EPRA NAV
in EUR million
EPRA NAV / Q-on-Q Growth EPRA NAV/s / Q-on-Q Growth
EUR 16.90 / 3.6%1,036.1 / 3.6%
Since Q4 2015 EPRA NAV per share has
increased by 1.7% from EUR 17.37 to EUR
17.67, and by 6.1% if adjusted for dividend
payments
1,171.6 / 13.1% EUR 17.37 / 2.8%
1,168.8 / -1.8% EUR 17.33 / -1.8%
17
1,189.8 / 1.6% EUR 17.64 / 1.6%
Q3 2016
Q2 2016
Q1 2016
Q4 2015
Q3 2015
1,191.3 / 1.9% EUR 17.67 / 2.0%
9M 2016 Results Presentation
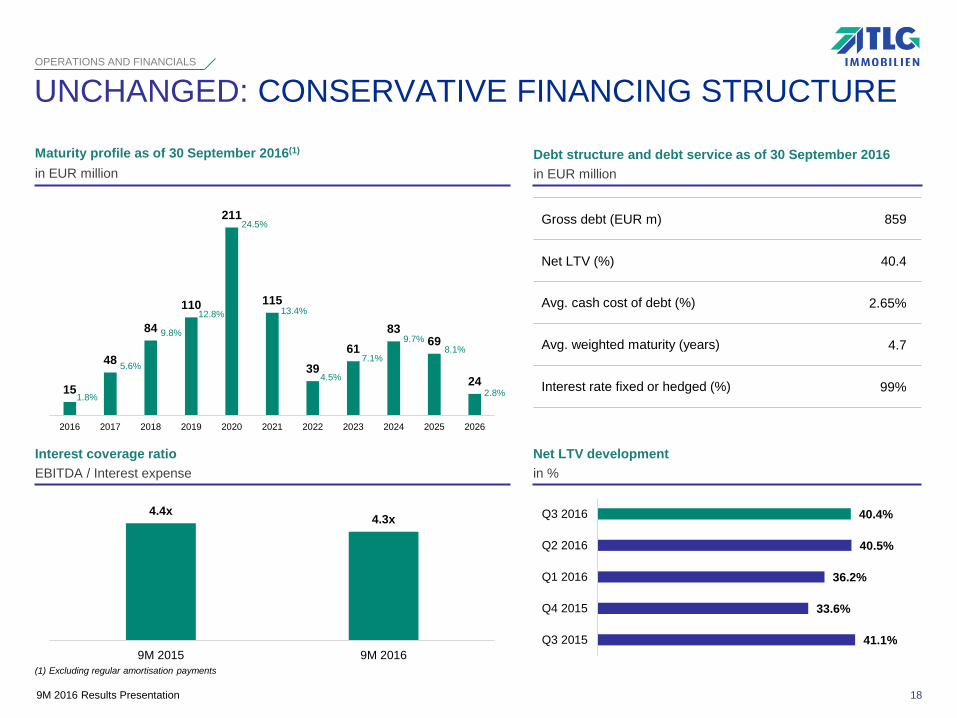
15
48
84
110
211
115
39
61
8369
24
2016 2017 2018 2019 2020 2021 2022 2023 2024 2025 2026
Maturity profile as of 30 September 2016(1)
in EUR million
Debt structure and debt service as of 30 September 2016
in EUR million
Gross debt (EUR m) 859
Net LTV (%) 40.4
Avg. cash cost of debt (%) 2.65%
Avg. weighted maturity (years) 4.7
Interest rate fixed or hedged (%) 99%
UNCHANGED: CONSERVATIVE FINANCING STRUCTUREOPERATIONS AND FINANCIALS
(1) Excluding regular amortisation payments
1.8%
Net LTV development
in %
Interest coverage ratio
EBITDA / Interest expense
18
5.6%
9.8%
12.8%
24.5%
13.4%
4.5%
7.1%
9.7%8.1%
40.4%
40.5%
36.2%
33.6%
41.1%
Q3 2016
Q2 2016
Q1 2016
Q4 2015
Q3 2015
4.4x4.3x
9M 2015 9M 2016
2.8%

9M 2016 Results Presentation
AGENDA
1 Highlights 9M 2016
2 Portfolio
3 Operations and Financials
4 Outlook
5 Appendix
19
9M 2016 Results Presentation9M 2016 Results Presentation
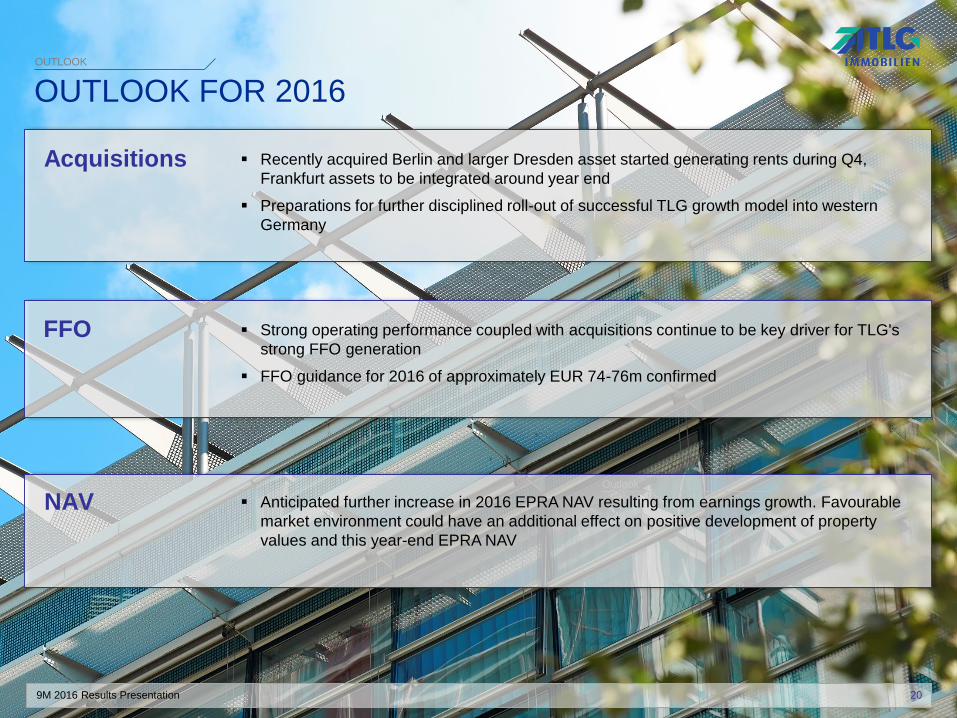
OUTLOOK FOR 2016 OUTLOOK
Outlook
Acquisitions
FFO Strong operating performance coupled with acquisitions continue to be key driver for TLG's
strong FFO generation
FFO guidance for 2016 of approximately EUR 74-76m confirmed
Recently acquired Berlin and larger Dresden asset started generating rents during Q4,
Frankfurt assets to be integrated around year end
Preparations for further disciplined roll-out of successful TLG growth model into western
Germany
NAV Anticipated further increase in 2016 EPRA NAV resulting from earnings growth. Favourable
market environment could have an additional effect on positive development of property
values and this year-end EPRA NAV
20

9M 2016 Results Presentation
AGENDA
1 Highlights 9M 2016
2 Portfolio
3 Operations and Financials
4 Outlook
5 Appendix
21
9M 2016 Results Presentation
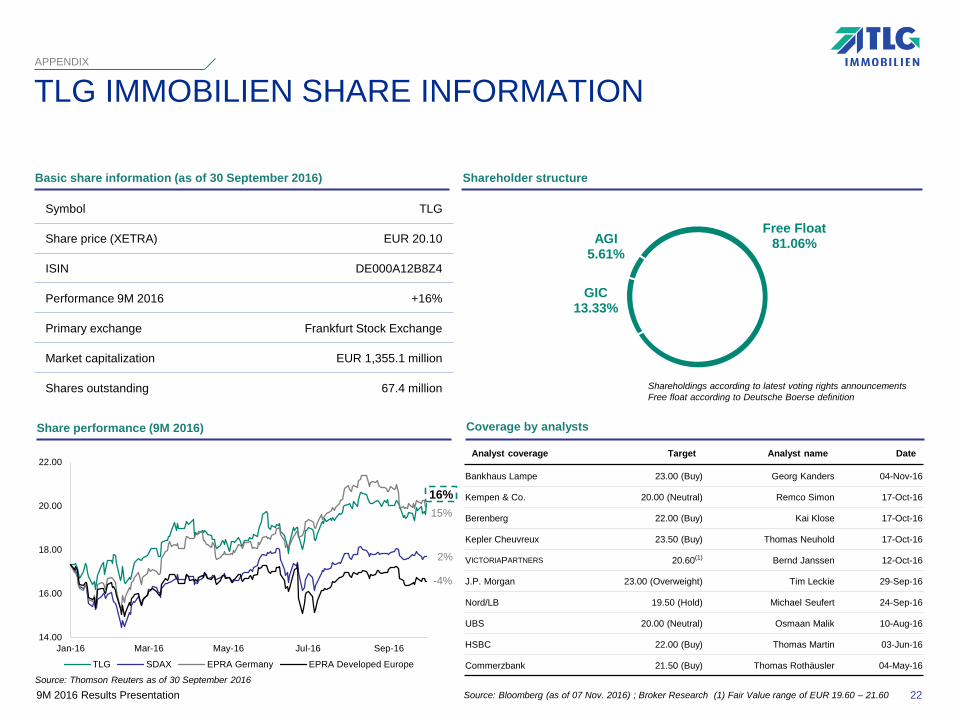
Free Float81.06%
GIC13.33%
AGI5.61%
TLG IMMOBILIEN SHARE INFORMATIONAPPENDIX
Coverage by analysts
Symbol TLG
Share price (XETRA) EUR 20.10
ISIN DE000A12B8Z4
Performance 9M 2016 +16%
Primary exchange Frankfurt Stock Exchange
Market capitalization EUR 1,355.1 million
Shares outstanding 67.4 million
Basic share information (as of 30 September 2016) Shareholder structure
Shareholdings according to latest voting rights announcements
Free float according to Deutsche Boerse definition
Source: Bloomberg (as of 07 Nov. 2016) ; Broker Research (1) Fair Value range of EUR 19.60 – 21.60
Source: Thomson Reuters as of 30 September 2016
Share performance (9M 2016)
16%
2%
15%
-4%
22
Analyst coverage Target Analyst name Date
Bankhaus Lampe 23.00 (Buy) Georg Kanders 04-Nov-16
Kempen & Co. 20.00 (Neutral) Remco Simon 17-Oct-16
Berenberg 22.00 (Buy) Kai Klose 17-Oct-16
Kepler Cheuvreux 23.50 (Buy) Thomas Neuhold 17-Oct-16
VICTORIAPARTNERS 20.60(1) Bernd Janssen 12-Oct-16
J.P. Morgan 23.00 (Overweight) Tim Leckie 29-Sep-16
Nord/LB 19.50 (Hold) Michael Seufert 24-Sep-16
UBS 20.00 (Neutral) Osmaan Malik 10-Aug-16
HSBC 22.00 (Buy) Thomas Martin 03-Jun-16
Commerzbank 21.50 (Buy) Thomas Rothäusler 04-May-16
14.00
16.00
18.00
20.00
22.00
Jan-16 Mar-16 May-16 Jul-16 Sep-16
TLG SDAX EPRA Germany EPRA Developed Europe
9M 2016 Results Presentation
FINANCIAL CALENDAR AND CONTACT DETAILS
FY 2016 Results 09 March 2017
Q1 2017 Results 11 May 2017
AGM 23 May 2017
Q2 2017 Results 11 August 2017
Q3 2017 Results 09 November 2017
TLG IMMOBILIEN AG
Sven Annutsch (Head of Investor Relations)
Hausvogteiplatz 12 Telefon: +49 (0) 30 2470 6089
10117 Berlin Telefax: +49 (0) 30 2470 7446
E-Mail: [email protected]
APPENDIX
23