General or Vocational? Evidence on School Choice, …meea.sites.luc.edu/volume7/elhamidi.pdfparental...
22
Twenty-fifth Annual Meeting of The Middle East Economic Association (MEEA) Allied Social Science Associations Philadelphia, Pennsylvania January 7-9, 2005 General or Vocational? Evidence on School Choice, Returns, and “Sheep Skin” Effects from Egypt 1998 ∗ By Fatma El-Hamidi University of Pittsburgh University of Phoenix [email protected] ∗ The author would like to thank Ragui Assaad for invaluable assistance. The author has also benefited from comments from Manos Antoninis. 1 Topics in Middle Eastern and African Economies Vol. 7, September 2005
Transcript of General or Vocational? Evidence on School Choice, …meea.sites.luc.edu/volume7/elhamidi.pdfparental...

Twenty-fifth Annual Meeting of The Middle East Economic Association (MEEA)
Allied Social Science Associations Philadelphia, Pennsylvania
January 7-9, 2005
General or Vocational? Evidence on School Choice, Returns, and “Sheep Skin” Effects from Egypt 1998∗
By
Fatma El-Hamidi University of Pittsburgh University of Phoenix
∗ The author would like to thank Ragui Assaad for invaluable assistance. The author has also benefited from comments from Manos Antoninis.
1
Topics in Middle Eastern and African Economies Vol. 7, September 2005

1- Introduction There is no doubt the need for quality technicians and a skilled workforce is crucial to
sustainable industrial development, and a key determinant of a country’s international competitiveness in a rapidly globalizing world economy. The competitive advantages of a country and its potential for modernization are directly related to the size of accumulated human capital. People, with their education, skills and experience, determine the opportunities of economic growth.
It is well documented in the literature that while tertiary skills are important for growth in developed countries, it is primary and secondary education that are related to development in poorest and intermediate developing countries. Recently, development agencies have been promoting investment in basic and general education in the developing world, to ensure global labor market competitiveness. One reason has been due to low rates of returns to vocational and technical education. Another is the high cost of that type of education. A third reason has been a weak relationship between vocational school graduates and the need of the labor market. For example, the World Bank has been trying to convince governments in developing countries that, basic education should be their top priority and public expenditure on vocational education should be reduced drastically (Bennell and Segerstrom, 1998). The World Bank argues that vocational education and training in developing countries is best left to individuals, enterprises and private sector training institutions with government interventions kept to a minimum.
The debate on the relative benefits of upper secondary vocational education and of general education is still going. While this area of research has been very active in the United States and industrialized countries in recent years, empirical work in the Middle East countries still lacking. This study adds new evidence to that debate. The paper identifies factors that influence an individual’s choice between vocational and general education in Egypt as well as the relative returns between these them and beyond secondary levels.
Using an ordered logit model, the study finds that an individual from a well educated family is more likely to undertake general education. After correcting for self-selection, the study also finds vocational education to offer higher returns (earnings) than general secondary education does for men, but not for women. 2- Literature Review
There are several approaches in researching education. A number of studies use Mincer’s human capital earnings function (HCEF). This model is also the most commonly employed method in labor economics. In the human capital model, an individual invests time and forgone earnings in order to obtain higher future benefits, the discounting method is then used to calculate individual (private) rate of return. The HCEF is a simple regression model with a linear schooling term and a low-order polynomial in potential experience (Card, 1998). The methodology used in the human capital literature is useful for analyzing the role of education in the labor market. However, Mincer’s earnings function has been criticized for not taking into consideration other important factors such as family background that are not typically available in wage data. Many of these factors are considered in the education production function approach.
A related model used to calculate educational attainment is the reduced–form estimation model. Studies implementing reduced-form models typically evaluate the
2
Topics in Middle Eastern and African Economies Vol. 7, September 2005

influence of family and neighborhood characteristics on returns to education. They set educational attainment as a dependent variable and a number of family and neighborhood characteristics as independent variables. Numerous studies find strong evidence that parental education has a significant effect on the child’s returns to education (Haveman et al, 1991) and (Wilson, 2001).
Psacharopoulos showed that general secondary education offered higher social rates of return, largely because of the high unit cost of providing vocational education (Psacharopoulos, 1986, 1987, 1994). But a new wave of studies is stressing the fact that the returns to vocational education depend substantially on the general level of economic development, the availability of private sector jobs, and whether or not people are employed in a field related to their training (Bennell and Segerstrom, 1998; Middleton et al., 1993; Neuman and Ziderman, 1990, 1999). Others have shown substantial problems with Psacharapoulos findings. Bennell for example, shows that the social rates of return to vocational education are equal to or above those for general secondary education in a number of cases. He finds the methodologies Psacharopoulos uses to calculate the returns are incomparable, and that he excludes data from a number of studies that contradict his conclusions (Bennell,1996a, b).
The literature on the production function approach in researching education views various school characteristics, specifically teacher salaries, class size, student/teacher ratio, and expenditures per student, as inputs, and the educational attainments of individuals, specifically test scores, years of education, and graduation rates, as outputs. Such an approach concentrates on the educational process itself and the educational attainment of an individual, (Wilson, 2001), Hanushek (1986), and Kremer (1995). The major difference between human capital model and production function approach is that the latter does not consider the individual as a decision maker choosing his/her level of schooling. Instead, it evaluates different factors that affect the individual’s educational attainment.
Many studies include family background into the models estimating returns to education. A number of research studies demonstrate that children who grow up in a low-income family typically have lower educational achievements and, subsequently, lower returns to education than children who grow up in a wealthy family (Haveman et al., 1991). They also find that the mother’s education usually has a positive effect on educational returns of a child. Moreover, a vast research on returns to education suggests that additional years of schooling increase the return to education. According to Altonji (1998), the wage level rises by 8 percent in response to each additional year of academic postsecondary education. In their study on estimating returns to education for a sample of twins, Ashenfelter and Krueger (1994) find each year of schooling increases wage rate by 12 –16 percent. Even when they adjust for a measurement error, their estimates are not less than 9 percent per year of school completed (Ashenfelter and Krueger,1994).
Another important variable often discussed in the literature is educational level. Years of education are important, but the fact that an individual spent twelve years in school does not necessarily mean that he or she received a high school diploma. For example, that person could have repeated one or more years. That is why it is important to study not only how years of education affect future earnings, but also how the educational level that an individual ultimately achieves affects his/her wages.
3
Topics in Middle Eastern and African Economies Vol. 7, September 2005

Cosca (2000) confirms the finding of many economists that, in general, employees with a bachelor’s, master’s, doctoral, or professional degree have higher average incomes and lower unemployment rates than do employees with less education. Hecker’s (1992) study was done in the early 1990’s and has similar results to those of Cosca. He proves that earnings rise with education level. Jaeger and Page (1996) estimate the returns to schooling and the “sheepskin” effect. The sheepskin effect reflects the difference in earnings due to the possession of a degree. The reason is simply that a diploma serves as a signal of productivity in the labor market, thus increasing the individual’s potential earnings. Jaeger and Page demonstrate strong evidence that diploma effects exist for all post-secondary degrees. An important test to this finding is to estimate the same model using years of schooling rather than educational dummies to find out if the labor market values degrees more than the equivalent years of schooling. 3- Overview of the Egyptian Education System
The education system in Egypt is four-tiered: Elementary; preparatory, secondary and high institutions and university. Elementary school (5 years), preparatory school (3 years)—these are compulsory— for all children ages 6-14. Upon completion of preparatory school and successfully passing the examinations, children receive a basic education certificate which permits admission to the secondary education level. Figure (1).
Secondary education comprises of: A three-year general secondary education cycle, from which successful students can go on to study at post-secondary level; and a vocational secondary education cycle. There are two different types of courses at vocational secondary schools: 1- the three-year vocational secondary school leading to qualification as “Technician” for the three main sectors: industry, agriculture and commerce; and 2- the five-year advanced vocational/technical secondary school leading to qualification as “First Technician”. Table (1) shows enrollment in secondary and higher education between 1990 and 1995.
Table (1): Enrollment, by Level and Type of Education, 1990-91 to 1994-95
(Thousands of students) Type of
education 1990-91 1994-95 (Percent
Change) Primary 6,402.5 7,313.0 142 Secondary 1,648.9 2,788.2 66 General 576.4 894.4 47 Technical-
vocational 1,026.2 1,893.8 85
Higher 215.8 224.5 5 Universities 74.3 148.4 200
Source: Gill, et all (2000). Compare with other countries. Vocational and technical secondary degrees are considered terminal degrees, whereas
general secondary degree is viewed as a route to college. Vocational and technical
4
Topics in Middle Eastern and African Economies Vol. 7, September 2005

institutions are normally not free to choose the most competent students. The decision is set by politicians who decide that students who do not reach a particular limit in general education ought to go to vocational education. This in turn is reflected in lack of ability and lack of motivation since they have failed the academic examination.
One of the main characteristics of the education system in Egypt is the long standing government responsibility to employ all graduates of tertiary education graduates. This commitment extended in 1963 to cover vocational and technical education graduates. The policy has impacted the labor market well into 1990s.
During the 1970s, the Government of Egypt expanded vocational secondary education believing this should heal the urban youth unemployment problem1. By early 1980s, and throughout the 1990s, this idea showed up into enrolling almost 70 percent of preparatory graduates into vocational and technical secondary education (commercial, industrial, and agricultural). The main objective of this policy was to ease the pressure on university education, not to meet/match the demand on those skills. This policy resulted in deterioration of quality of both graduates and teachers due to low pay rates and outdated equipments.
Figure (1): The Education System in Egypt
Source: National report presented to the 45th session of the International Conference on Education, Geneva, 30 September - 5 October 1996.
1 Antoninis reports male urban unemployment rate in Egypt (including discouraged unemployment) in 1997 is 10 percent, and 28 percent for women, compared to 8 percent and 38 percent respectively in rural Egypt.
5
Topics in Middle Eastern and African Economies Vol. 7, September 2005

4- Methodology: The research on returns to education is based on the work by Mincer (1974). In the
traditional specification, returns to education are estimated as follows:
LnW = β0 + β1EDU + β2EXP + β3EXP2 + u (1) Where EDU is the number of years of schooling, EXP is experience in years, EXP2 is
experience squared, and u is a random disturbance term. The specification is shown logarithmically in order for the regressors to be interpreted in terms of marginal effects. In this way index β is interpreted as the rate of returns to schooling.
This function that has been introduced by Mincer (1974) is known as the human capital earnings function. It has been the basis of practically all research on returns to education.
Griliches (1977), however, pointed out that the coefficient estimates of the OLS estimation of the classical model could suffer from what is now known as ‘self-selection bias’. When individual’s family background and ability influence his/her educational attainment, the individual is said to be self-selected into that educational attainment. If educational attainment of an individual is partially determined by his/her abilities and family backgrounds, estimating the previous classical earnings function without taking into account the possibility that family background and ability might influence educational attainment, could give biased results.
One approach to reduce the bias is to include control variables that might capture part of the unobserved components in the error term. These controls should also enter in form of interaction terms with education to allow for heterogeneous slope coefficients. The higher the correlation between the added variables and the unobserved components, the lower endogeneity bias. Control variables such as family background characteristics: Father and mother level of education and father’s occupation. An interaction term between education and family background can capture the effect of family background on returns to education.
These results, however, are still subject to another type of selection bias. Basically, the equation has been estimated from data on workers, resulting in a censored sample of the entire population. When estimating the wage equation, only those who reported wages at the time of the survey are entered into the analysis, while the ones who were not working did not report any wage. In order to solve the problem of sample selection bias, Heckman (1979) suggests estimating two equations. First the participation equation is estimated, consisting in estimating through a logit, for the purpose of this study, the probability of having worked at the time of the survey, and out of school (using the entire sample: workers and non-workers). From the logit results, a selection variable (the inverse Mills ratio term) is created. This estimate is used in the second step, as an additional regressor in the wage equation, yielding consistent estimates of the coefficients free of censoring bias.
A recent extension to this model is to capture the so-called “certification effect” or “sheep skin effect”. The idea is an employer might value a worker with a certificate more than a worker without one. For this reason, and to allow for estimated rate of return to vary by level of schooling, dummies for levels of education are used instead of years of schooling.
6
Topics in Middle Eastern and African Economies Vol. 7, September 2005

The modified Mincerian earnings function is: LnW = β0 + ∑βkE.Dumik + β2EXP + β3EXP2 + u (2) Where E.Dum consists of dummies for levels of education. Years of experience are
calculated by the following formula: Age - Year of survey (that is 98) – year at which individual entered the labor force. In this specification, the private rate of return to the kth level of education is estimated
by the following formula: rk = (βk - βk-1)/ ∆nk (3) where βk is the coefficient of a specific level of education, βk-1 is the coefficient of the
previous level of education, and ∆n is the difference in years of schooling between K and K-1. (Psacharopoulos, 1981).
This procedure involves three assumptions: 1. Direct costs are either minor, or are compensated by a student’s part-time and/or
summer earnings. This assumption is satisfied in the current analysis since education is either free or involves minimal fees.
2. The opportunity cost of foregone earnings is equal to the earnings of the next lower level predicted by the model.
3. The earnings profiles are isomorphic, that is, they are of the form ycf(x), where yc are the initial earnings of the educational category in question and f(x) is a multiplicative experience function common to all educational levels.’
It is expected to see the rate of returns to educational levels fall as the educational level gets higher, since the opportunity cost of education increases with educational level.
4.1- First Stage: Ordered Logit Model
In this study, I use the ordered logit model where education variable is ordered from zero to four, where 0= less than secondary; 1= general secondary; 2= vocational secondary; 3= higher institutions; and 4= university and above. The model is:
iii xy εβ += '* (4) Where is a latent variable that is a function of a vector of explanatory variables. *
iyThe standard logistic distribution has a mean of 0 and its density function is:
( )ie
F i εε −+=
11 (5)
The relation between the unobserved latent variable and the outcome can be expressed as:
7
Topics in Middle Eastern and African Economies Vol. 7, September 2005
.if4...
,if2
,if1
,if0
*5
3*
2
2*
1
1*
i
i
i
ii
y
y
y
yy
≤=
≤<=
≤<=
≤=
µ
µµ
µµ
µ
(6)
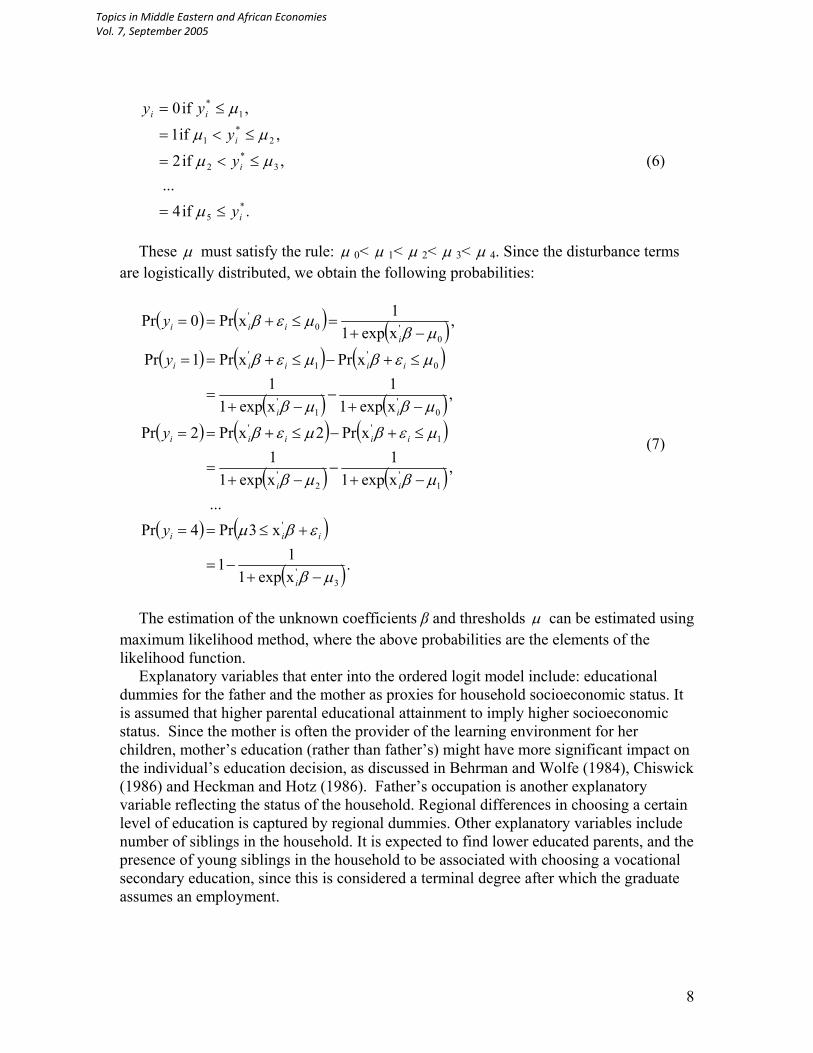
These µ must satisfy the rule: µ 0< µ 1< µ 2< µ 3< µ 4. Since the disturbance terms
are logistically distributed, we obtain the following probabilities:
( ) ( ) ( )( ) ( ) (
( )
)
( )( ) ( ) (
( )
)
( )
( ) ( )
( ).xexp111
x3Pr4Pr...
,xexp11
xexp11
xPr2xPr2Pr
,xexp11
xexp11
xPrxPr1Pr
,xexp11xPr0Pr
3'
'
1'
2'
1''
0'
1'
0'
1'
0'0
'
µβ
εβµ
µβµβ
µεβµεβ
µβµβ
µεβµεβ
µβµεβ
−+−=
+≤==
−+−
−+=
≤+−≤+==
−+−
−+=
≤+−≤+==
−+=≤+==
i
iii
ii
iiiii
ii
iiiii
iiii
y
y
y
y
(7)
The estimation of the unknown coefficients β and thresholds µ can be estimated using
maximum likelihood method, where the above probabilities are the elements of the likelihood function.
Explanatory variables that enter into the ordered logit model include: educational dummies for the father and the mother as proxies for household socioeconomic status. It is assumed that higher parental educational attainment to imply higher socioeconomic status. Since the mother is often the provider of the learning environment for her children, mother’s education (rather than father’s) might have more significant impact on the individual’s education decision, as discussed in Behrman and Wolfe (1984), Chiswick (1986) and Heckman and Hotz (1986). Father’s occupation is another explanatory variable reflecting the status of the household. Regional differences in choosing a certain level of education is captured by regional dummies. Other explanatory variables include number of siblings in the household. It is expected to find lower educated parents, and the presence of young siblings in the household to be associated with choosing a vocational secondary education, since this is considered a terminal degree after which the graduate assumes an employment.
8
Topics in Middle Eastern and African Economies Vol. 7, September 2005

4.2- Second Stage: Earnings Function Estimating the parameters in the first stage allows calculating the selection term, to
correct for selectivity bias, which is then entered linearly into the wage equation. The dependent variable in the wage equation is the log hourly earnings. Log hourly
earnings is used (instead of hourly earning) because it reduces the effects of earnings outliers. The model therefore is:
LnW = β0 + ∑βkE.Dumik + β2EXP + β3EXP2 + ∑βj Reg. Dumij+ β4λ +u (8)
Where E.Dum are dummies for levels of education, experience, experience squared,
regional dummies and the selection term. Experience variables are included in the model since workers with more years of job
experience are likely to earn more. (Higher experience is often associated with higher skills and higher productivity.) A firm is likely to use higher wages to induce experienced workers to stay on in their jobs, as the cost of training new workers could be very expensive. The experience squared variable is included to capture the possibility of a non-linear relationship between experience and earnings. I expect a positive sign of the experience variable for the reason that working experience is likely to contribute to enhancement of individual’s human capital, and negative coefficient of experience square as marginal returns from experience tend to decline over the lifetime.
Interaction of the effects of schooling and experience on earnings should not be neglected. A common reason is the fact that the first few years in the labor market are time for experimenting and frequent job change. As a consequence, earnings of many individuals rise in their first years in the labor force, then level off and increases by a decreasing rate. Another rationale is that the life-time patterns of low level of education and highly educated workers’ earnings differ by nature: for example, the marginal effects of experience on education for a worker with a vocational education are likely to increase during the first years of work and diminish afterwards. A university educated worker, on the contrary, faces increasing marginal returns to experience. Omission of the interaction variable, therefore, leads to the omitted variable bias in the coefficients estimates.
The coefficients of educational variables are expected to be positive, and their magnitudes increase through post general school levels as follows (in ascending order): general secondary, vocational secondary, higher institutes, and university and above. That is I assume private earnings increase the higher the level of education. In theory, a main objective of technical/vocational education (among others) is to provide job-specific training. Another desirable outcome of secondary vocational education is a possibility for a better match between skills acquired in school and the industry, although empirical evidence is ambiguous. In case of a better match of vocational skills, and because vocational degrees are terminals, I would expect the labor market would reward vocational skills more than general education.
5- Data and Empirical Methodology
The empirical analysis is based on a 1998 nationally representative household survey, Egyptian Labor Market Survey (ELMS). The survey includes rich data concerning basic demographics, employment, unemployment, occupational history, migration, education,
9
Topics in Middle Eastern and African Economies Vol. 7, September 2005

10
earnings, and parental background. The ELMS 1998 was conducted on a sample of 5,000 households.
The analysis is restricted to urban2, non-agriculture3, private sector4 workers, who are sons or daughters of the household heads between the ages of 15 and 64, and not currently enrolled in school. The sample on which the analysis is based on consists of 4843 urban private sector workers in 1998.
Table (A-1) in the appendix displays means and standard deviations for variables used in the analysis. A summary statistics by gender and level of education is in process.
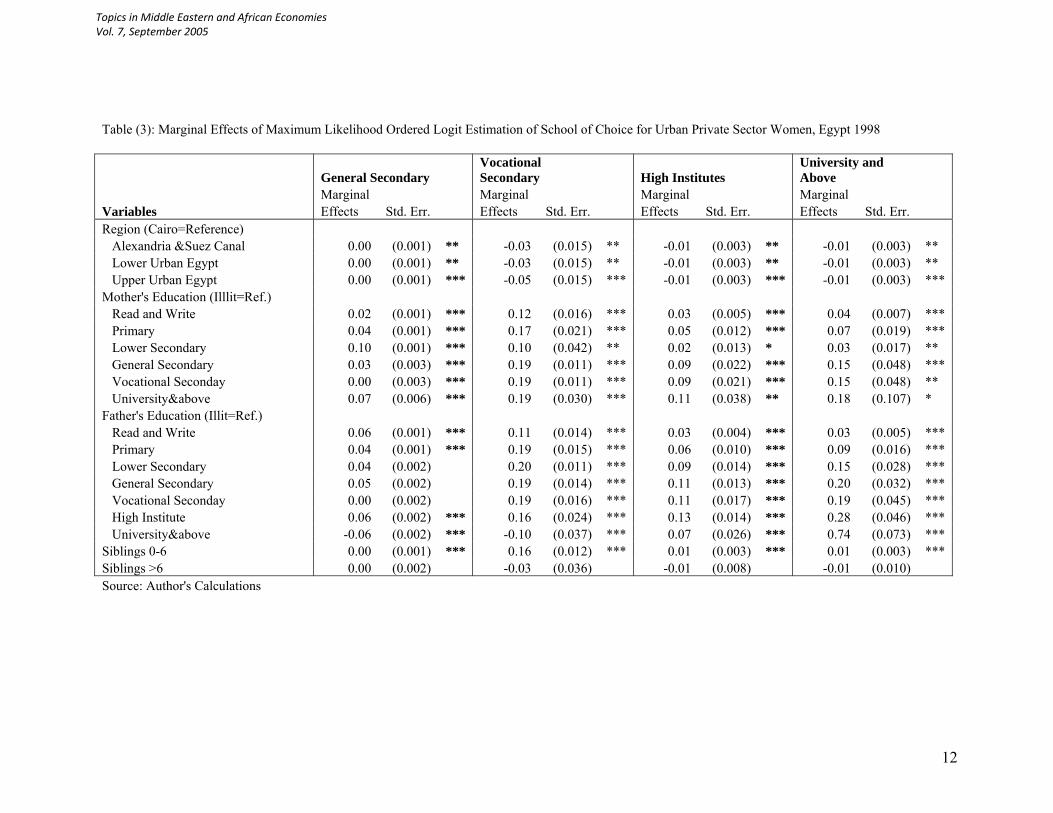
5.1- Ordered Logit Estimates: Tables (2) and (3) show the marginal effects of the
explanatory variables on the probability of choosing certain levels of education derived from an ordered logit model, for men and women. Since all explanatory variables are dummies, the marginal effects show the effect of a discrete change from zero to one. The reference individual lives in Cairo, with illiterate parents, and no siblings.
The Tables show region does not affect men’s decision to enroll in vocational education, while it does for women. Vocational educated women are more likely to reside in Cairo than other urban cities.
Parent’s education appears to have the expected effect. Mother’s education for men is significant and increases in magnitude the higher the level of education. The higher the level of mother’s education (beyond lower secondary), the higher the chance the individual chooses high institute or university education. A mother with secondary general education or post secondary degree increases the chance her son chooses a university education by 30 percent and 26 percent respectively. For daughters, mother’s education is significant in choosing any level of secondary or university education. The magnitude of the effect is higher in vocational education compared to other levels, but it gets higher again at the university level. This finding is consistent with Tunali’s in Turkey (Tunali, 2003).
The higher the father’s education the less likely his son chooses vocational education. For example, a university educated father reduces the chance of his son choosing a vocational education by 18 percent, and a university educated father increases the chance of his son to pursue university education by 61 percent.
Father’s education for women is also essential in choosing a secondary and above education. The pattern depicted in men’s case appears here too. For fathers with lower levels of education, daughters are likely to choose vocational education, while higher levels of father’s education increase the chances their daughters choose university education. For example, women with university educated fathers are on average 74 percent more likely to opt for university education5.
The magnitude of the effect of the presence of siblings less than six years of age is very small in all levels except in vocational education. The presence of siblings less than six years of age in the household, reduces the probability of choosing a vocational
2 To avoid the problems of labor market definition associated with subsistence agriculture in rural areas. 3 High rates of seasonal employment within the agriculture sector are justification for excluding them from the analysis. 4 Since labor earnings for this group are more likely to be immune from potential biases due to the noncompetitive nature of the public and government sectors. 5 Adding father’s occupation to the model produced insignificant coefficients for all occupation dummies.
Topics in Middle Eastern and African Economies Vol. 7, September 2005

Table (2): Marginal Effects of Maximum Likelihood Ordered Logit Estimation of School Choice for Urban Private Sector Men, Egypt 1998
General Secondary Vocational Secondary High Institutes
University and Above
Marginal Marginal Marginal Marginal Variables Effects Std. Err. Effects Std. Err. Effects Std. Err. Effects Std. Err. Region (Cairo=Reference) Alexandria &Suez Canal 0.00 (0.000) -0.02 (0.018) -0.01 (0.006) -0.01 (0.010) Lower Urban Egypt 0.00 (0.000) -0.03 (0.017) -0.01 (0.005) -0.01 (0.009) Upper Urban Egypt 0.00 (0.000) 0.00 (0.016) 0.00 (0.005) 0.00 (0.010) Mother's Education (Illlit=Ref.) Read and Write 0.00 (0.001) 0.06 (0.011) *** 0.03 (0.008) *** 0.06 (0.016) *** Primary 0.01 (0.001) ** 0.07 (0.008) *** 0.05 (0.011) *** 0.10 (0.028) *** Lower Secondary 0.03 (0.002) ** 0.07 (0.010) *** 0.06 (0.016) *** 0.13 (0.050) *** General Secondary 0.01 (0.003) *** 0.00 (0.056) 0.09 (0.010) *** 0.30 (0.099) *** Vocational Seconday 0.02 (0.002) ** 0.07 (0.115) 0.06 (0.017) *** 0.15 (0.057) *** University&above 0.01 (0.003) ** 0.02 (0.064) 0.08 (0.016) *** 0.26 (0.124) ** Father's Education (Illit=Ref.) Read and Write -0.01 (0.000) 0.07 (0.012) *** 0.03 (0.006) *** 0.05 (0.012) *** Primary 0.03 (0.001) *** 0.08 (0.008) *** 0.05 (0.010) *** 0.11 (0.024) *** Lower Secondary 0.01 (0.002) *** 0.06 (0.014) 0.07 (0.011) *** 0.18 (0.038) *** General Secondary 0.08 (0.002) *** 0.02 (0.027) 0.09 (0.010) *** 0.28 (0.051) *** Vocational Seconday 0.01 (0.002) *** -0.01 (0.036) 0.09 (0.009) *** 0.33 (0.062) *** High Institute 0.04 (0.003) *** -0.08 (0.043) ** 0.08 (0.012) *** 0.46 (0.071) *** University&above 0.06 (0.003) *** -0.18 (0.044) *** 0.05 (0.020) *** 0.61 (0.077) *** Siblings 0-6 0.00 (0.000) *** -0.04 (0.016) ** -0.01 (0.005) ** -0.02 (0.008) ** Siblings >6 0.00 (0.001) -0.02 (0.021) -0.02 (0.011) -0.03 (0.022) Source: Author's Calculations
11
Topics in Middle Eastern and African Economies Vol. 7, September 2005
12
Table (3): Marginal Effects of Maximum Likelihood Ordered Logit Estimation of School of Choice for Urban Private Sector Women, Egypt 1998
General Secondary Vocational Secondary High Institutes
University and Above
Marginal Marginal Marginal Marginal Variables Effects Std. Err. Effects Std. Err. Effects Std. Err. Effects Std. Err. Region (Cairo=Reference) Alexandria &Suez Canal 0.00 (0.001) ** -0.03 (0.015) ** -0.01 (0.003) ** -0.01 (0.003) ** Lower Urban Egypt 0.00 (0.001) ** -0.03 (0.015) ** -0.01 (0.003) ** -0.01 (0.003) ** Upper Urban Egypt 0.00 (0.001) *** -0.05 (0.015) *** -0.01 (0.003) *** -0.01 (0.003) *** Mother's Education (Illlit=Ref.) Read and Write 0.02 (0.001) *** 0.12 (0.016) *** 0.03 (0.005) *** 0.04 (0.007) *** Primary 0.04 (0.001) *** 0.17 (0.021) *** 0.05 (0.012) *** 0.07 (0.019) *** Lower Secondary 0.10 (0.001) *** 0.10 (0.042) ** 0.02 (0.013) * 0.03 (0.017) ** General Secondary 0.03 (0.003) *** 0.19 (0.011) *** 0.09 (0.022) *** 0.15 (0.048) *** Vocational Seconday 0.00 (0.003) *** 0.19 (0.011) *** 0.09 (0.021) *** 0.15 (0.048) ** University&above 0.07 (0.006) *** 0.19 (0.030) *** 0.11 (0.038) ** 0.18 (0.107) * Father's Education (Illit=Ref.) Read and Write 0.06 (0.001) *** 0.11 (0.014) *** 0.03 (0.004) *** 0.03 (0.005) *** Primary 0.04 (0.001) *** 0.19 (0.015) *** 0.06 (0.010) *** 0.09 (0.016) *** Lower Secondary 0.04 (0.002) 0.20 (0.011) *** 0.09 (0.014) *** 0.15 (0.028) *** General Secondary 0.05 (0.002) 0.19 (0.014) *** 0.11 (0.013) *** 0.20 (0.032) *** Vocational Seconday 0.00 (0.002) 0.19 (0.016) *** 0.11 (0.017) *** 0.19 (0.045) *** High Institute 0.06 (0.002) *** 0.16 (0.024) *** 0.13 (0.014) *** 0.28 (0.046) *** University&above -0.06 (0.002) *** -0.10 (0.037) *** 0.07 (0.026) *** 0.74 (0.073) *** Siblings 0-6 0.00 (0.001) *** 0.16 (0.012) *** 0.01 (0.003) *** 0.01 (0.003) *** Siblings >6 0.00 (0.002) -0.03 (0.036) -0.01 (0.008) -0.01 (0.010) Source: Author's Calculations
Topics in Middle Eastern and African Economies Vol. 7, September 2005

education by 0.04 percent for men, but increases the chances for women by 0.16 percent. A possible interpretation is that since the vocational education is considered a terminal degree, women with young siblings are expected to get a job right after graduating, to help their families financially. Parents, who send their kids to vocational education, expect quick returns and less risky investment. On the other hand, the presence of siblings older than six years old does not seem to have a significant effect on enrolling in any type of secondary or higher education, for women, and men.
5.2- Returns to Education Estimates Table (4) displays selectivity corrected estimates of the returns equation, with
interaction terms, for men and women. The following analysis applies to both men and women unless otherwise indicated.
Selection term is insignificant for men and women, indicating that sample selection is not a problem. Experience has the expected profile. A positive sign of the experience variable indicates working experience is likely to contribute to growth of individual’s human capital, and negative coefficient of experience square as marginal returns from experience tend to decline over the lifetime. Figure (A-1, in the Appendix) depicts earning-experience profile for men and women. It is clear from the figure the differences in men and women’s profiles. Women tend to have shorter life experience and steeper decline in their profile than men.
Back to Table (4), no differences appear in earnings between the largest three urban cities (Cairo, Alexandria, and Suez Canal), but earnings are lower in both upper and lower urban Egypt compared to Cairo, with upper urban having a greater earnings difference than lower urban for men. Earnings in lower urban Egypt are 6 percent lower than those in Cairo, compared to 13 percent for upper urban Egypt. For women, the difference in earnings between upper or lower urban Egypt compared to Cairo was lower by almost 3 percent in both regions.
The coefficients of the education dummies all have the expected positive sign, and the majority are significantly different from zero at the 1 percent level or more. These results may suggest that employers are affected by credentialism in their wage-setting. The education coefficients in this case, may be regarded as evidence of credentialism, or screening for ability. These results do not match those obtained by Assaad6 (1997)--using 1988 data--and Antoninis (2002)--using 1997 data-- on Egypt. Both Assaad and Antoninis found rates of return to vocational secondary schooling and higher institutes in the private sector are either negative or very low, for both men and women. The results also disagree with those found by Arabsheinbani (2001) in Libya. He found the returns to years of education do not strongly support sheepskin effect. The largest marginal return is at 8 years of education (not a diploma year).
(Results of the interactions between education dummies and family background will be available by the conference time in December).
6 Assaad differentiates between vocational blue collars, vocational white collars, and technical institutes in his analysis
13
Topics in Middle Eastern and African Economies Vol. 7, September 2005

Table (4): Selectivity Corrected Wage Equation for Men and Women, Egypt 1998 Variables Men Women Experience 0.111** 0.033** (0.013) (0.011) Experience Sq. -0.002** -0.001** (0.000) (0.000) Region (Cairo=Ref)
Alex&Sz Cnl -0.038 0.001 (0.032) (0.018) Lower Urban Egypt -0.063* -0.032* (0.031) (0.007) Upper Urban Egypt -0.132** -0.027* (0.031) (0.017) Education (Lwr Sec=Ref)
General Sec 0.061 0.268* (0.168) (0.128) Vocational Sec 0.354** 0.307** (0.088) (0.063) Higher Institute 0.569** 0.380+ (0.162) (0.125) University&Above 0.735** 0.490** (0.260) (0.080) Interactions GenSecXExp 0.063** 0.039** (0.014) (0.011) GenSecXExp2 -0.001** -0.001** (0.000) (0.000) VocSecXExp 0.085 0.035 (0.048) (0.023) VocSecXExp2 -0.001 -0.001 (0.001) (0.000) HInstXExp 0.073** 0.029* (0.015) (0.011) HInstXExp2 -0.001** -0.001* (0.000) (0.000) Univ+XExp 0.065** 0.033* (0.023) (0.016) Univ+XExp2 -0.001** -0.001* (0.000) (0.000) Selection Term -0.053 -0.012 (0.023) (0.018) Constant -0.879** -0.210+ (0.160) (0.124) Observations 1914 3313 R-squared 0.34 0.24 Source: Author’s calculations Standard errors in parenthesis. * significant at 5%; ** significant at 1%; + significant at 10%.
14
Topics in Middle Eastern and African Economies Vol. 7, September 2005

5.3- Private Rates of Return Tables (5) and (6) present private rates of return to education for men and women
respectively using equation 37. The tables do not support the hypothesis that rates of returns are expected to decline the higher the level of education, because of an increasing opportunity cost. Table (5) for example demonstrates returns to vocational secondary are 29 percent higher than general secondary for men. This may support the fact that general secondary is not considered a terminal degree. Although did not differentiate between vocational and secondary education, Antoninis found secondary school graduates to earn more than less than secondary education, since 95 percent of his secondary educated workers were graduates of vocational schools, he dismissed the notion that expansion of vocational education led to higher unemployment and deteriorating quality of education. Whereas Assaad (1997) reported negative returns to general and vocational (commercial) secondary education investment in the private sector in 1988, while the return to industrial secondary education for males in the private sector was a significant two percent.
Table (5): Private Rate of Return to Education for Men, Egypt 1998 Educ. Level Coef. Educ. Level Coef. Rate of Return Vocational Sec 0.354 Gen. Sec 0.061 (.354-.061)=0.293 Higher Inst. 0.569 Voc Sec 0.354 (.569-.354)/2=0.108 University&Above 0.735 Higher Inst. 0.569 (.735-.569)/2=0.083 University&above 0.735 Voc Sec 0.354 (.735-.354)/4=0.095 University&above 0.735 Gen. Sec 0.061 (.735-.061)/4=0.169 Source: Author’s calculations Table (6): Private Rate of Return to Education for Women, Egypt 1998 Educ. Level Coef. Educ. Level Coef. Rate of Return Vocational Sec 0.307 Gen. Sec 0.268 (.307-.286)= -0.021 Higher Inst. 0.380 Voc Sec 0.307 (.380-.307)/2= 0.03 University&Above 0.490 Higher Inst. 0.380 (.490-.380)/2= 0.055 University&above 0.490 Voc Sec 0.307 (.490-.307)/4= 0.046 University&above 0.490 Gen. Sec 0.268 (.490-.268)/4= 0.056 Source: Author’s calculations
The Table displays returns to higher institutes graduates are around 11 percent higher
than vocational secondary graduates. This is in line with Kane who found the average person who attended a two-year college in the US earned about 10 percent more than those without any college education (Kane, 1995). Empirical evidence in this matter still mixed. Antoninis (2001), for example, found no evidence that going to high institute in Egypt seems to add to earnings significantly. He explains this finding by interactions between supply side (poor quality of education) and demand side (poor choice of
7 To insure these rates of return are significant, tests of restrictions that the coefficients of kth variables are equal to those of (k-1)th were all significant at the 5% level or above.
15
Topics in Middle Eastern and African Economies Vol. 7, September 2005
graduates). Evidence from the US reveal Community graduates earn 20 percent more than high school graduates, and those with bachelor's degrees earn 40 percent more (Casse, 1998). The puzzling result though is the returns to university education are only 10 percent higher than that of vocational education, compared to 17 percent for general secondary. Further investigation is pending.
For women, the differences in returns are smaller in magnitude compared to men. For example, the difference in rates of return to high institutes is only four percent higher than that of vocational education. The returns to university education are merely six percent higher than that of higher institutes.
6- Concluding Remarks:
The purpose of this study is two-fold: First, to determine factors that influence individual’s decision to choose a specific level of education. Specifically general secondary versus vocational secondary education. The second objective is to estimate selectivity corrected returns to different levels of education, that is “sheep skin effects”, from which a crude estimate of the private rate of return is estimated.
The analysis in this study shows that children of parents with lower levels of education are more likely to get vocational education compared to children of parents with higher education. The presence of young siblings in the household affects women by positively influencing their decision to join vocational education. Whereas the effect on men is insignificant.
Evidence on Sheep skin effect, or credentialism, for men is manifested in the significant rising of positive schooling coefficients the higher the level of education. Finally, estimates of the private rate of return to education indicate an increase of 29 percent in returns to vocational secondary education if compared to general secondary, and only 10 percent increase in returns for a high institution or university degrees compared to vocational degree. Sheep skin is not as evident for women.
The current educational data, trend, and policy in Egypt imply an oversupply of technical and vocational skills. Gill points out that even if technically demanding industries operated efficiently, the current system in Egypt could supply five to seven times the required number of skilled workers, according to conservative estimates (Gill et all, 2000). One suggestion is for the government to develop a third form of secondary education which combines the best of general and vocational education, a model that draws on the instructive/academic and structural approaches. This “third way” would provide vocational training that is applicable to a wider range of occupations and is more responsive to local demand for labor.
It is well acknowledged that the development of a ‘high skill–high participation’ workforce is essential in order to achieve the levels of international competitiveness that are now required in a rapidly growing number of economic sectors. However, country experiences show that this type of labor force cannot be created voluntarily, or relying on the private sector. Without active labor market policies based on continuing government intervention in funding and providing for high quality vocational education and training, this type of workforce is unlikely to develop in most countries. Because of the high capital investment needed for quality vocational education, it cannot be left to be determined by market forces alone. Most private sector entities have neither the vision
16
Topics in Middle Eastern and African Economies Vol. 7, September 2005

nor the capacity to provide the level of training that is needed to create an optimally skillful workforce.
Further Research: Separating three years of vocational education from five years is the first pressing test
of the findings of this paper, accompanied by a clear distinction between the three divisions of vocational education: commercial, industrial, and agriculture.
17
Topics in Middle Eastern and African Economies Vol. 7, September 2005

Appendix
Table (A-1): Means and Standard Deviations of Variables Used in the Analysis
Men Women
Variables Mean Std.
Dev. Mean Std.
Dev. Log Real Hourly Wage 0.159 0.519 -0.041 0.353 Experience 18.178 14.962 23.499 14.712 Region Cairo 0.307 0.461 0.299 0.458 Alexandria &Suez Canal 0.193 0.395 0.193 0.395 Lower Urban Egypt 0.247 0.431 0.253 0.435 Upper Urban Egypt 0.253 0.435 0.254 0.436 Level of Education General Secondary 0.520 0.500 0.681 0.466 Vocational Secondary 0.013 0.111 0.015 0.123 High Institute 0.280 0.449 0.198 0.399 University& above 0.057 0.232 0.039 0.193 Household Characteristics Siblings 0-6 0.230 0.421 0.364 0.481 Siblings >6 0.951 0.215 0.973 0.163 Mother's Education Read and Write 0.132 0.339 0.128 0.334 Primary 0.055 0.229 0.028 0.164 Lower Secondary 0.026 0.160 0.014 0.118 General Secondary 0.017 0.128 0.014 0.118 Vocational Secondary 0.020 0.140 0.011 0.106 University& above 0.009 0.097 0.005 0.074 Father's Education Read and Write 0.286 0.452 0.306 0.461 Primary 0.090 0.286 0.065 0.247 Lower Secondary 0.047 0.212 0.032 0.177 General Secondary 0.044 0.206 0.041 0.198 Vocational Secondary 0.033 0.178 0.017 0.130 High Institute 0.036 0.185 0.035 0.183 University& above 0.023 0.150 0.010 0.101 No. of Observations 1914 3313
18
Topics in Middle Eastern and African Economies Vol. 7, September 2005

Figure (A-1)
.6 Earnings-Experience Profile for Men and Women, Egypt 1998
.4 Log Real Hourly Wages
Men
.2
Women 0
-.2
-.4
10 15 50 55 5 20 25 30 35 40 45 60Years of Experience
19
Topics in Middle Eastern and African Economies Vol. 7, September 2005
References
Altonji, Joseph G. 1998. “Effects of Personal and School Characteristics on
Estimates of the Return to Education,” Economic Perspectives 22, pp.65-80. Angrist, Joshua D. and Alan B. Krueger. 1991. “Does Compulsory School
Attendance Affect Schooling and Earnings?” The Quarterly Journal of Economics 106, pp. 979-1014.
Antoninis, Emmanouil. 2001. “The expansion of technical secondary education in Egypt and its effect on the labour market”. Ph.D. Dissertation. St. Anthony’s College.
Arabsheibani, Reza G. and Lamine Manfor. 2001. “Non-Linearities in Returns to Education in Libya,” Education Economics 9, pp.139-144.
Arias, Omar; Kevin F. Hallock and Walter Sosa-Escudero. 2001. “Individual Heterogeneity in the Returns to Schooling: Instrumental Variables Quantile Regression Using Twins Data,” Empirical Economics 26, pp.7-40.
Arriagada, A.M., Ziderman, A., 1992. Vocational Secondary Schooling: Occupational Choice and Earnings in Brazil. The World Bank, Washington, DC.
Ashenfelter, Orley and Alan Krueger. 1994. “ Estimates of the Economic Return to Schooling from a New Sample of Twins,” American Economic Review 84, pp.1157-1174.
Ashenfelter, Orley and Alan Krueger. 1994. “ Estimates of the Economic Return to Schooling from a New Sample of Twins,” American Economic Review 84, pp.1157-1174.
Assaad, Ragui. 1997. “The effects of public sector hiring and compensation policies on the Egyptian labor market.” World Bank Economic Review 11, 1 (January).
Behrman, J. R., & Wolfe, B. L. (1984). The socioeconomic impact of schooling in a developing country. Review of Economics and Statistics, 66, 296–303.
Bennell, P., 1996a. General versus vocational secondary education in developing countries: a review of the rates of return evidence. The Journal of Development Studies 33 (2), 230–247.
Bennell, P., 1996b. Using and abusing rates of return: a critique of the World Bank’s 1995 education sector review. International Journal of Educational Development 16 (3), 235–248.
Bennell, P., Segerstrom, J., 1998. Vocational education and training in developing countries: has the World Bank got it right? International Journal of Educational Development 18(4), 271–287.
Boissiere, M; J.B. Knight and R.H. Sabot. 1985. “Earnings, Schooling, and Cognitive Skills,” The American Economic Review 75, pp.1016-1030.
Card, David and Alan B. Krueger. 1992. “Does School Quality Matter? Returns to Education andthe Characteristics of Public Schools in the United States.” The Journal of Political Economy 100, pp.1-40.
Card, David. 1998. “The Casual Effect of Education on Earnings,” The Center for Labor Economics working paper 2.
20
Topics in Middle Eastern and African Economies Vol. 7, September 2005

Casse, Daniel and Bruno V. Manno. 1998. “The Cost and Price of College and the Value of Higher Education,” Academic Questions 11, pp. 38-55.
Chiswick, B. R. (1986). Comment on Hauser and Sewell. Journal of Labor Economics, 4 (3 (Part 2)), S116–S120.
Cosca, Theresa. 1998. “Earnings of College Graduates in 1996,” Occupational Outlook Quarterly 42, pp. 20-29.
Cosca, Theresa. 1998. “Earnings of College Graduates in 1996,” Occupational Outlook Quarterly 42, pp. 20-29.
Gaston, N., & Sturm, R. (1991). Educational attainment and the returns to education for Australian youth: evidence of selfselection? Economic Analysis and Policy, 21 (1), 29–45.
Gill IS and SP Heyneman (2000) Arab Republic of Egypt, in : IS Gill, F Fluitman, and A Dar (eds.) Vocational education and training reform : matching skills to markets and budgets, A joint study of the World Bank and the International Labour Office, Oxford University Press.
Griliches, Z. (1977). Estimating the returns to schooling: some econometric problems. Econometrica, 45, 1–22.
Hanushek, Eric A. 1995. “Interpreting Recent Research on Schooling in Developing Countries,” The World Bank Research Observer 10, pp. 227.
Haveman, Robert; Barbara Wolfe and James Spaulding. 1991. “Childhood Events and Circumstances Influencing High School Completion,” Demography 28, pp. 133-157.
Haveman, Robert; Barbara Wolfe and James Spaulding. 1991. “Childhood Events and Circumstances Influencing High School Completion,” Demography 28, pp. 133-157.
Hecker, Daniel E. 1992. “College Graduates: Do We Have Too Many or Too Few? College Earnings and Why They Vary,” Occupational Outlook Quarterly 36, pp. 13.
Hecker, Daniel E. 1992. “College Graduates: Do We Have Too Many or Too Few? College Earnings and Why They Vary,” Occupational Outlook Quarterly 36, pp. 13.
Heckman, J. J., & Hotz, V. J. (1986). An investigation of the labor market earnings of Panamanian males: evaluating the sources of inequality. Journal of Human Resources, 21, 507–542.
Hollenbeck, K. (1993). Postsecondary education as triage: returns to academic and technical programs. Economics of Education Review, 213–232.
Jaeger, David A. and Marianne E. Page. 1996. “Degree Matter: New Evidence on Sheepskin Effects in the Returns to Education,” The Review of Economics and Statistics 78, pp.733-740.
Jaeger, David A. and Marianne E. Page. 1996. “Degree Matter: New Evidence on Sheepskin Effects in the Returns to Education,” The Review of Economics and Statistics 78, pp.733-740.
Kane, Thomas J. and Cecilia Elena Rouse. 1995. “Labor-Market Returns to Two- and Four-Year College,” American Economic Review 85, pp.600-615.
21
Topics in Middle Eastern and African Economies Vol. 7, September 2005

Kremer, Michael R. 1995. “Research on Schooling: What We Know and What We Don’t – A Comment on Hanushek,” The World Bank Research Observer 10, pp. 247.
Lassibille, Gerard and Lucia Navarro Gomez. 1998. “The Evolution of Returns to Education in Spain 1980-1991,” Education Economics 6, pp. 3-10.
Middleton, J., Ziderman, A., Adams, A., 1993. Skills for Productivity: Vocational Education and Training in Developing Countries. Oxford University Press for the World Bank, New York.
Mincer, J. (1974). Schooling, experience and earnings. New York: National Bureau of Economic Research.
Neuman, S., Ziderman, A., 1991. Vocational schooling, occupational matching and labor market earnings in Israel. Journal of Human Resources 26 (2), 413–425.
Neuman, S., Ziderman, A., 1999. Vocational education in Israel: wage effects of the voced-occupation match. Journal of Human Resources 34 (2), 907–932.
Orapin, S., 1991. Three More Years in School: Parents’ Opinions and Problems. The Thailand Development Research Institute, Thailand; Bangkok, Thailand.
Psacharopoulos, G., 1986. Returns to education. The Journal of Human Resources 20 (4), 583–604.
Psacharopoulos, G., 1987. To vocationalize or not to vocationalize? that is the curriculum question. International Review of Education 33 (2), 187–211.
Psacharopoulos, G., 1994. Returns to investment in education: a global update. World Development 22 (9), 1325–1343.
Psacharopoulos, George and Eduardo Velez. 1996.” Returns to Education During Economic Boom and Recession: Mexico 1984, 1989, and 1992,” Education Economics 4, pp. 219-231.
Psacharopoulos, George. 1995. “The Profitability of Investment in Education.” Working Paper.
Siphambe, H.K., 2000. Rates of return to education in Botswana. Economics of Education Review 19, 291–300.
Tunali, I. 2003. "General vs. Vocational Secondary School Choice and Labor Market Outcomes in Turkey, 1988-98". Paper presented at the 10th annual ERF conference in Morocco, December, 2003.
Wilson, Kathryn. 2001. “The Determinants of Educational Attainment: Modeling and Estimating the Human Capital Model and Education Production Functions,” Southern Economic Journal 67, pp. 518-551.
World Bank (1995a) Priorities and Strategies for Education: A World Bank Sector Review. Education and Social Policy Department, World Bank, Washington, D.C.
22
Topics in Middle Eastern and African Economies Vol. 7, September 2005