Gender and Negatively Influencing Factors of Intuitive ...Gender and Negatively Influencing Factors...
75
Gender and Negatively Influencing Factors of Intuitive Eating 1 Gender Differences in Intuitive Eating and Factors That Negatively Influence Intuitive Eating A Senior Honors Thesis Presented in Partial Fulfillment of the Requirements for graduation with distinction in Psychology in the undergraduate colleges of The Ohio State University by Ashley Kroon Van Diest The Ohio State University November 2007 Project Advisor: Associate Professor Tracy L. Tylka, Department of Psychology
Transcript of Gender and Negatively Influencing Factors of Intuitive ...Gender and Negatively Influencing Factors...

Gender and Negatively Influencing Factors of Intuitive Eating 1
Gender Differences in Intuitive Eating and Factors That Negatively Influence Intuitive Eating
A Senior Honors Thesis
Presented in Partial Fulfillment of the Requirements for graduation with distinction in Psychology in the undergraduate colleges
of The Ohio State University
by
Ashley Kroon Van Diest
The Ohio State University November 2007
Project Advisor: Associate Professor Tracy L. Tylka, Department of Psychology

Gender and Negatively Influencing Factors of Intuitive Eating 2
Abstract
Research on intuitive eating has examined some correlates of intuitive eating, but is still
rather limited. The current study was the first to examine gender differences in levels of
intuitive eating. This study also assessed perceptions of an adaptive diet, and expanded
on previous research assessing factors that negatively predict intuitive eating. Data was
obtained from 259 college men and women by a self-report survey. Results indicated
that men had higher total intuitive eating levels and were more likely to eat for physical
rather than emotional reasons than women and that participants had a slightly skewed
idea of an adaptive diet. Results also indicated that certain factors negatively influence
intuitive eating such as: (1) perceptions of caregiver use of coercive feeding strategies,
(2) being around individuals who are obsessed with food and weight, and (3) maladaptive
personality characteristics (i.e. negative affect, depression, body dissatisfaction, low
levels of body appreciation, maladaptive perfectionism, low levels of self-esteem, and
low levels optimism).
Gender and Negatively Influencing Factors of Intuitive Eating 3
Gender Differences in Intuitive Eating and Factors That Negatively Influence Intuitive
Eating
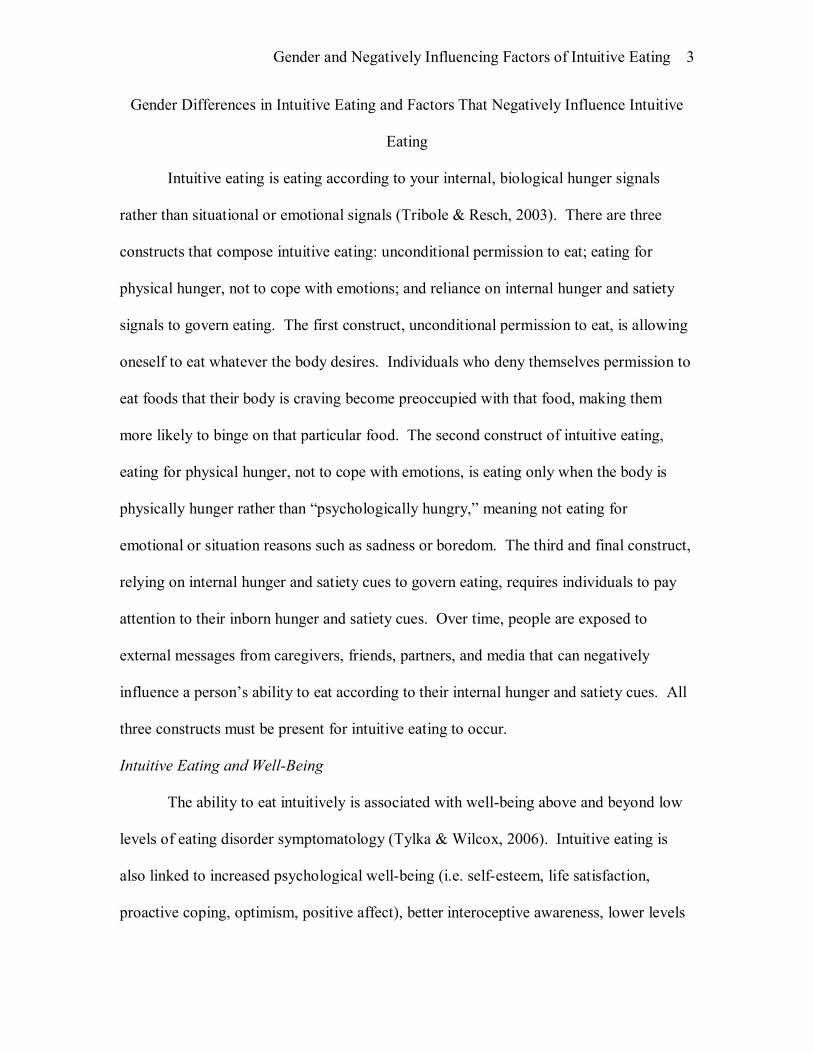
Intuitive eating is eating according to your internal, biological hunger signals
rather than situational or emotional signals (Tribole & Resch, 2003). There are three
constructs that compose intuitive eating: unconditional permission to eat; eating for
physical hunger, not to cope with emotions; and reliance on internal hunger and satiety
signals to govern eating. The first construct, unconditional permission to eat, is allowing
oneself to eat whatever the body desires. Individuals who deny themselves permission to
eat foods that their body is craving become preoccupied with that food, making them
more likely to binge on that particular food. The second construct of intuitive eating,
eating for physical hunger, not to cope with emotions, is eating only when the body is
physically hunger rather than �psychologically hungry,� meaning not eating for
emotional or situation reasons such as sadness or boredom. The third and final construct,
relying on internal hunger and satiety cues to govern eating, requires individuals to pay
attention to their inborn hunger and satiety cues. Over time, people are exposed to
external messages from caregivers, friends, partners, and media that can negatively
influence a person�s ability to eat according to their internal hunger and satiety cues. All
three constructs must be present for intuitive eating to occur.
Intuitive Eating and Well-Being
The ability to eat intuitively is associated with well-being above and beyond low
levels of eating disorder symptomatology (Tylka & Wilcox, 2006). Intuitive eating is
also linked to increased psychological well-being (i.e. self-esteem, life satisfaction,
proactive coping, optimism, positive affect), better interoceptive awareness, lower levels

Gender and Negatively Influencing Factors of Intuitive Eating 4
of eating disorder symptomatology, lower BMI (body mass index), and lower body
dissatisfaction. This information warrants intensive exploration of factors that are linked
to intuitive eating, but the construct of intuitive eating is rather new, resulting in
somewhat limited research on the topic. This study was conducted to assess what factors
negatively influence a person�s ability to eat intuitively as well as any distinct gender
differences in intuitive eating.
There is no set definition for what constitutes healthy eating, but it has been
suggested that intuitive eating and its constructs may represent healthy, adaptive eating
(Tribole & Resch, 2003). The Intuitive Eating Scale (IES; Tylka, 2006) is a
psychometrically sound measure of the construct of intuitive eating, and is reflective of
an individual�s ability to eat intuitively. However, the IES does not determine
individuals� perceptions of a healthy, adaptive diet. Thus, the Healthy Eating Scale was
created for this study to assess individuals� perceptions of adaptive eating. People may
have a skewed idea of what constitutes adaptive eating because society tells people that
healthy eating involves eating lots of fruits, vegetables, and lean protein, while restricting
or completely eliminating fats and sweets. People may internalize this idea of �healthy
eating,� promoting restricted eating which leads to lower psychological well-being and
maladaptive eating (Tribole & Resch, 2003). It is predicted that individuals do not have
accurate perceptions of adaptive eating.
No studies have been conducted examining gender differences in intuitive eating.
This is worth researching because while similar, intuitive eating and eating disorders are
not just opposite poles of the same construct, and studies have shown that there are
distinct gender differences in disordered eating (i.e. Meyer & Waller, 1998; Murnen &

Gender and Negatively Influencing Factors of Intuitive Eating 5
Smolak, 1997; Tata, Fox, & Cooper, 2001; Walcott, Pratt, & Patel, 2003). According to
the Diagnostic and Statistical Manual of Mental Disorders, fourth edition, text revision
(DSM-IV-TR), women outnumber men 10 to 1 in the prevalence of eating disorders
(American Psychiatric Association, 2000). Research comparing the levels of men and
women�s eating disorder symptomatology using the EAT and EDI measures found that
women�s levels were much higher than men�s (Tata et al., 2001; Meyer & Waller, 1998).
This study will assess if there are distinct differences between gender and intuitive eating
behaviors. It is predicted that men will be more in touch with their intuitive eater than
women.
Caregiver Influence
There is overwhelming evidence to support the theory that children adopt eating
attitudes and behaviors based on their parents eating attitudes and behaviors, as well as
the messages that they send children about the child�s eating behaviors (i.e. Birch, 1999;
Birch & Fisher, 2000; Cutting, Fisher, Grimm-Thomas, & Birch, 1999; Fisher & Birch,
1999). It is also suggested that when parents send negative messages to their children
about their eating behaviors, body weight/shape, and physical appearance, the risk of
negative body image and eating disorder symptomatology increase (Striegel-Moore &
Kearney-Cooke, 1994; Smolak, Levine, & Schermer, 1999). Some examples of these
eating messages and behaviors parents impose on their children are rigid schedules,
portion size restriction, and comments about eating behaviors (i.e. too much or too little).
Leann Birch has done many studies on childhood eating and has found that restricted
childhood eating can lead to more body dissatisfaction, higher BMI, and higher levels of

Gender and Negatively Influencing Factors of Intuitive Eating 6
eating disorder symptomatology (Birch, 1999; Birch & Fisher, 2000; Cutting et al., 1999;
Fisher & Birch, 1999).
Parents often attempt to control their children�s eating habits by using coercive
feeding strategies (i.e. restricting certain foods). Birch (1999) discovered that when
parents withhold certain foods from their children, that particular food actually becomes
more desirable to the child. This behavior results in the child choosing these restricted
foods over others when they are given the opportunity to eat these restricted foods. Also,
parents labeling certain foods as �good� or �bad� backfires as children tend to desire the
�bad� foods more than the �good� foods. These behaviors often carry over into
adulthood, resulting in higher levels of disordered eating and obesity (Cutting et al.,
1999).
While Birch�s research has studied the effect of caregiver messages on childhood
eating behaviors, she has not directly studied intuitive eating. This study will be
extending her research to see if caregiver messages are directly related to intuitive eating.
The Caregiver Eating Messages Scale was created for this study to assess if parental use
of coercive feeding strategies is associated with an individual�s ability to eat intuitively as
an adult. It is predicted that such parental/caregiver messages negatively influence
children�s eating behaviors, specifically their ability to eat intuitively. If this hypothesis
is supported, there will be more evidence for the adaptive properties of intuitive eating.
There is also strong evidence suggesting that children who have parents that
chronically diet are more likely to become chronic dieters and/or adopt eating disorder
symptomatology (i.e. Edmunds & Hill, 1999; Keel, Heatherton, Harnden, & Hornig,
1997; Smolak, Levine, & Schermer, 1999). Research has indicated that both mothers and

Gender and Negatively Influencing Factors of Intuitive Eating 7
fathers have an influence on their children�s attitudes toward food and dieting.
Daughter�s weight dissatisfaction has been shown to be associated with their father�s own
weight dissatisfaction, which is associated with increased dieting and eating disorder
symptoms in adolescent females (Keel et al., 1997). Mothers with children who have
eating disorders often have a history of dieting themselves. Children tend to model
dieting behavior exhibited by their parents which lead to disordered eating (Edmunds &
Hill, 1999; Keel et al., 1997).
There is much research on the association between dieting and weight
preoccupation in an individual�s environment and eating disordered behavior, but none of
this research has been focused on intuitive eating. The Dieting Others Scale, and the
Person in Environment question were created specifically for this study to assess the
association between dieting and weight preoccupation in an individual�s environment and
intuitive eating. For this study, it is predicted that people in an individual�s environment
who are consumed with dieting and being thin will increase the likelihood that the
individual will report lower intuitive eating.
Personality Characteristics
Many personality characteristics (i.e. negative affect, pessimism, low self-esteem,
negative body image, maladaptive perfectionism) have been linked to increased risks of
developing eating disorder symptomatology (i.e. Fairburn, Cooper, Doll, & Welch, 1999;
Fairburn, Doll, Welch, Hay, Davies, & O�Connor, 1998; Leon, Fulkerson, Perry, Keel, &
Klump, 1999; Vohs, Bardone, Joiner, Abramson, & Heatherton, 1999). Maladaptive
perfectionism is a personality trait that is commonly linked to anorexia, bulimia, and
binge eating disorder (i.e. Fairburn et al., 1999; Fairburn et al., 1998; Fairburn, Welch,

Gender and Negatively Influencing Factors of Intuitive Eating 8
Doll, Davies, & O�Connor, 1997; Tyrka, Waldron, Graber, & Brooks-Gunn, 2002; Vohs
et al., 1999). Because individuals have an intense desire to be perfect, but can never
achieve their ideal levels of perfection, they begin to diet to achieve physical perfection
which is associated with disordered eating behaviors. Other personality characteristics
such as negative affect, low self-esteem, and body dissatisfaction are also commonly
linked with eating disorder symptomatology (i.e. Leon et al., 1999; Tyrka et al., 2002;
Vohs et al., 1999).
Existing literature consistently displays the links of certain personality
characteristics with disordered eating, but there are, to my knowledge, no current studies
linking these personality characteristics with intuitive eating for both men and women.
Tylka (2006) examined the relationship between intuitive eating and certain personality
characteristics among college women, and found scores on the IES were negatively
related to body dissatisfaction, poor interoceptive awareness, pressure for thinness,
internalization of the thin ideal, and body mass. This study will assess the following
personality characteristics and their link with intuitive eating ability among men and
women: negative affect (including depression), body appreciation, body dissatisfaction,
optimism, maladaptive perfectionism, and self-esteem. It is predicted that certain
personality characteristics will be associated with lower intuitive eating, and higher
chronic dieting and eating disorder symptomatology.
Sociocultural Pressures for Thinness
Many studies conducted on men and women�s negative body image suggest that
these negative emotions are caused by an internalization of the media�s focus on thinness
and weight (i.e. Agliata & Tantleff-Dunn, 2004; Groesz, Levine, & Murnen, 2002;
Gender and Negatively Influencing Factors of Intuitive Eating 9
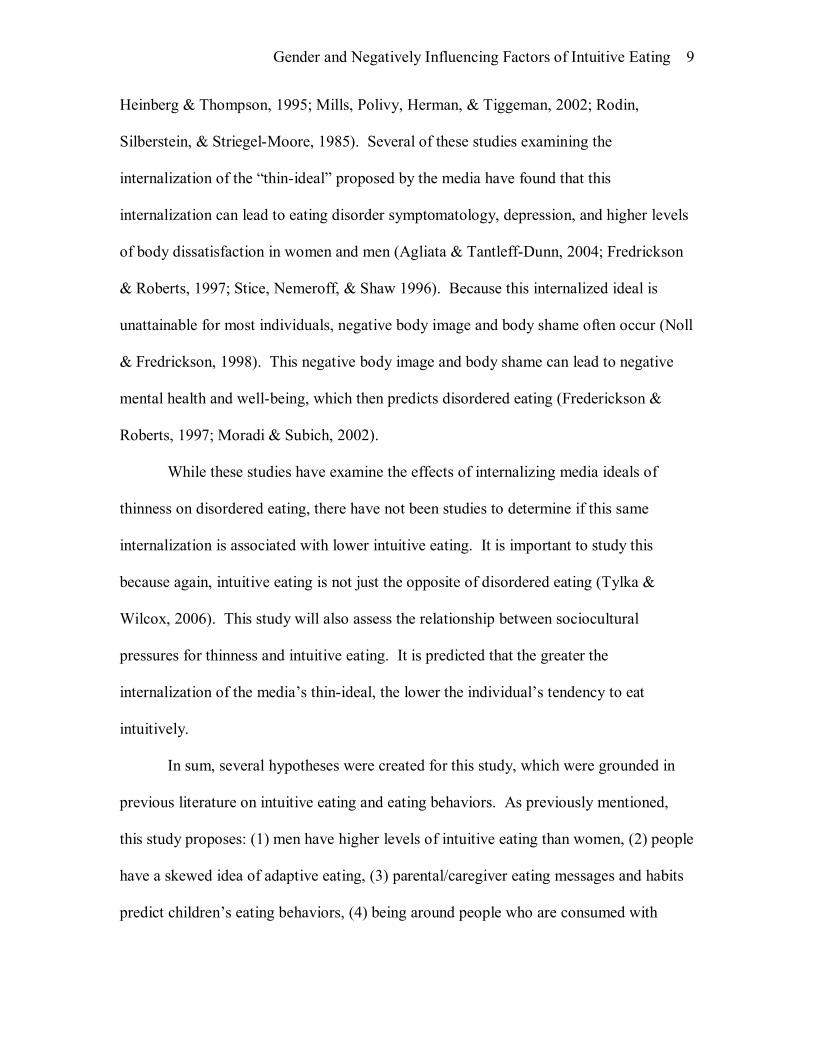
Heinberg & Thompson, 1995; Mills, Polivy, Herman, & Tiggeman, 2002; Rodin,
Silberstein, & Striegel-Moore, 1985). Several of these studies examining the
internalization of the �thin-ideal� proposed by the media have found that this
internalization can lead to eating disorder symptomatology, depression, and higher levels
of body dissatisfaction in women and men (Agliata & Tantleff-Dunn, 2004; Fredrickson
& Roberts, 1997; Stice, Nemeroff, & Shaw 1996). Because this internalized ideal is
unattainable for most individuals, negative body image and body shame often occur (Noll
& Fredrickson, 1998). This negative body image and body shame can lead to negative
mental health and well-being, which then predicts disordered eating (Frederickson &
Roberts, 1997; Moradi & Subich, 2002).
While these studies have examine the effects of internalizing media ideals of
thinness on disordered eating, there have not been studies to determine if this same
internalization is associated with lower intuitive eating. It is important to study this
because again, intuitive eating is not just the opposite of disordered eating (Tylka &
Wilcox, 2006). This study will also assess the relationship between sociocultural
pressures for thinness and intuitive eating. It is predicted that the greater the
internalization of the media�s thin-ideal, the lower the individual�s tendency to eat
intuitively.
In sum, several hypotheses were created for this study, which were grounded in
previous literature on intuitive eating and eating behaviors. As previously mentioned,
this study proposes: (1) men have higher levels of intuitive eating than women, (2) people
have a skewed idea of adaptive eating, (3) parental/caregiver eating messages and habits
predict children�s eating behaviors, (4) being around people who are consumed with

Gender and Negatively Influencing Factors of Intuitive Eating 10
dieting and being thin will be associated with intuitive eating in a negative direction, (5)
certain maladaptive personality characteristics are associated with lower levels of
intuitive eating, and higher levels of eating disorder symptomatology, and (6)
societal/media messages are negatively associated with intuitive eating, and positively
associated with eating disorder symptomatology.
Method
Participants
A sample consisting of 259 participants was used to test these hypotheses.
Participants were college students ranging in age from 18-61 (M = 22.74, SD = 7.58)
recruited from various classes at The Ohio State University and Marion Technical
College. The participants consisted of 178 females, 80 males, and 1 individual who
marked both genders. Most participants (91.5%) identified as Caucasian, followed in
frequency by African-American (3.1%), Asian American (2.7%), other (multiracial)
(2.3%), and Native American (0.4%). In terms of relationship status, 41.3% of
participants were single, 36.3% were involved in a long-term relationship, 13.1% were
married, 3.5% were divorced, and 5.8% indicated �other� (e.g. short-term relationship,
separated). A large majority of the participants were first-year students or high school
seniors (52.5%); of the remaining participants, 19.36% were sophomores, 14.7% were
juniors, 4.6% were seniors, 1.5% were post-baccalaureate students, 2.3% were graduate
students, 3.9% indicated �other� but did not specify school status, and three participants
(1.2%) did not answer this question. Most participants reported being middle class
(49.4%), followed by working class (23.2%), upper-middle class (22.4%), upper class
(3.1%), and five participants (1.9%) left this question blank. Participants height ranged

Gender and Negatively Influencing Factors of Intuitive Eating 11
from 59-79 inches (M = 66.71, SD = 4.03), and their weight ranged from 98-360 pounds
(M = 160.04, SD = 41.46). These data were obtained from the demographic data sheet
presented in Appendix A.
Measures
Intuitive eating. The Intuitive Eating Scale (IES; Tylka, 2006, Appendix B) is a
21 item scale psychometrically sound measure of the construct of intuitive eating. This
scale consists of three subscales that measure their respective constructs of intuitive
eating. The first subscale represents unconditional permission to eat, and contains 9
items (e.g. �If I am craving a certain food, I allow myself to have it.�). The second
subscale measures eating for physical rather than emotional reasons, and contains 6 items
(e.g. � I find myself eating when I am bored, even when I�m not physically hungry.�).
The third subscale assessed reliance on internal hunger and satiety cues to govern eating,
and also contains 6 items (e.g. �I trust my body to tell me how much to eat.�). All items
were rated on a 5-point scale with 1 being �Strongly Disagree,� and 5 being �Strongly
Agree.� Items for each subscale, as well as the entire Intuitive Eating Scale were
averaged. High scores on the entire scale indicate high levels of intuitive eating ability.
High scores on each subscale indicate higher abilities of adhering to each construct.
Tylka (2006) reported that this measure demonstrated acceptable internal consistency
reliability (Cronbach�s coefficient α = .89) for the total Intuitive Eating Scale. Reported
Chronbach alphas from the same study for the Unconditional Permission to Eat subscale,
the Eating for Physical Rather than Emotional Reasons subscale, and the Reliance on
Internal Hunger and Satiety Cues to Govern Eating subscale were 0.89, 0.86, and 0.72
respectively. Cronbach�s coefficient alpha for the entire Intuitive Eating Scale, the

Gender and Negatively Influencing Factors of Intuitive Eating 12
Unconditional Permission to Eat subscale, the Eating for Physical Rather than Emotional
Reasons subscale, and the Reliance on Internal Hunger and Satiety Cues to Govern
Eating subscale were 0.85, 0.86, 0.85, and 0.67 respectively.
Caregiver eating messages. A measure was created for this study (Caregiver
Eating Messages Scale, Appendix C) because no measure currently exists to examine the
relationship between negative eating messages (i.e. coercive feeding strategies) children
receive from their caregivers. This is a 22 item scale with items ranged on a 6-point scale
with 1 being �Always,� and 6 being �Never.� Participants were given prompts such as:
�Made sure you finished all the food that was on your plate,� or, �Commented that you
weren�t eating enough,� and were asked to indicate the degree to which their
parents/caregivers emphasized the given behavior while they were growing up. Items 20
and 21 of this scale were focused more on body acceptance by family members, and were
ranged on a 5 point scale (1=Never, 5=Always). These two items were not used in the
analysis because similar items were analyzed in the Body Acceptance by Others Scale.
Item 22 of this scale asks participants to determine the overall focus on food and weight
of parent/caregivers while growing up, and was ranked on a 6 point scale with 1 being
�Not at all focused on food or weight,� and 6 being, �Extremely focused on food and
weight.� Items 1 through 19 were averaged with high scores indicating high levels of
coercive feeding strategies used by caregivers while growing up. Items 20 and 21 were
eliminated from the analysis, and item 22 was used in a multiple regression analysis.
Cronbach�s alpha for items 1 through 19 of this study was 0.83.
Healthy eating. A measure was also created for this study to examine individuals�
concepts of an adaptive diet (Healthy Eating Scale, Appendix D). This scale contains 16

Gender and Negatively Influencing Factors of Intuitive Eating 13
items that are ranged on a 5-point scale with 1 being �Never,� and 5 being �Always.�
Participants were given certain types of food groups (i.e. �assorted fibrous vegetables,� or
�whole grain bread, brown rice, whole grain pasta�), or items such as �no food
restriction,� or �unlimited calorie intake,� and were asked to circle if/how much that item
would be included in an adaptive diet. Items were averaged with higher scores
correlating with higher levels of intuitive eating ability. Cronbach�s alpha for this study
was 0.76.
Dieting others. Another measure was created for this study to examine the impact
of people who are preoccupied with dieting and losing weight in an individual�s
environment (Dieting Others Scale, Appendix E). This scale contains 8 items ranged on
a 5-point scale (1=Never, 5=Always). Participants were asked questions such as: �How
often do your family members talk about their weight?� and �How often do your friends
talk about dieting or food restriction?� All items were averaged with high scores
indicating high levels of dieting/food and weight preoccupied people in an individual�s
environment. Cronbach�s coefficient alpha for this study was 0.86.
A single question about people in an individual�s environment was also created to
use in multiple regression analyses (People in Environment). Participants were provided
with 5 choices (Overall, people in my environment are _________ focused on food and
weight.) with 1 being never, 2 being rarely, 3 being sometimes, 4 being often, and 5
being always. Participants were asked to place an X beside the choice that best described
people in their environment.
Personality characteristics. The first personality characteristic that was assessed
in this study was depression, using the Beck Depression Inventory (BDI; Beck, Rush,

Gender and Negatively Influencing Factors of Intuitive Eating 14
Shaw, & Emery, 1979, Appendix G). This measure is comprised of 21 questions. Each
question has 4 choices (i.e. 0,1,2,3) unique to each question, with 0 being the least
depressed choice, and 3 being the most depressed choice. All items are averaged with
high scores indicating higher levels of depression. Previous Cronbach�s alphas for this
measure�s scores have been noted as 0.91 (Schotte, Maes, Cluydts, De Doncker, &
Cosyns, 1997). For the current study, Cronbach�s alpha was 0.90.
The next personality characteristic that was analyzed was body appreciation
which was measured using the Body Appreciation Scale (BAS; Avalos, Tylka, & Wood-
Barcalow, 2005, Appendix H). This 13 item scale is ranked on a 5-point scale with 1
being �Never,� and 5 being �Always.� Example items from this survey include, �I feel
good about my body,� and �Despite its flaws, I accept my body for what it is.� Items are
averaged with high scores indicating higher levels of body appreciation. Previous
Cronbach�s alphas found for this scale�s scores have been 0.91-0.94 (Avalos et al., 2005).
Chronbach�s coefficient alpha for the current study was 0.93.
Perfectionism was assessed using the Almost Perfect Scale-Revised (APS-R;
Slaney, Rice, Mobley, Trippi, & Ashby, 2001, Appendix I). This is a 23 item scale with
items 1 to 12 creating the Maladaptive Perfectionism Subscale, and items 13 to 23
creating the Adaptive Perfectionism Subscale. Participants are asked to number each
item from 1 to 7 with 1 being �Strongly Disagree,� and 7 being �Strongly Agree.� Items
from each subscale are averaged with high scores on the Maladaptive Perfectionism
Subscale indicating high levels of maladaptive perfectionism and high scores on the
Adaptive Perfectionism Subscale indicating high levels of adaptive perfectionism.
Previous Cronbach�s alphas for the maladaptive and adaptive perfectionism subscale
Gender and Negatively Influencing Factors of Intuitive Eating 15
scores have been reported as 0.93 and 0.84 respectively (Pearson & Gleaves, 2006).
Cronbach�s coefficient alpha for the Maladaptive Perfectionism Subscale in this study
was 0.94, while alpha for the Adaptive Perfectionism Subscale in this study was 0.89.
Self-esteem was analyzed using the Rosenberg Self-Esteem Scale (RSE;
Rosenberg, 1965, Appendix J). This is a 10 item scale, with items such as, �I feel that I
have a number of good qualities.� Items were rated on a 4-point scale with 1 being
�Strongly Disagree,� and 4 being �Strongly Agree.� All items were averaged with higher
scores indicating high levels of self-esteem. Scores on the RSE have been shown to
demonstrate good internal consistency reliability (Cronbach�s α = .89), test-retest
reliability (r = .85), and convergent validity as it is moderately with other measures of
self-esteem (Robinson & Shaver, 1973). Cronbach�s alpha for this measure was 0.90.
Another personality characteristic that was assessed was affect. This was
measured using the Positive and Negative Affect Scale (PANAS; Watson, Clark, &
Tellegen, 1988b, Appendix M). This is a 20 item scale, where participants number each
item from 1 to 5 with 1 equaling �Very slightly or not at all,� and 5 equaling
�Extremely.� Answers are supposed to represent the participant�s average affect rather
than their affect at the given time. Ten of the items are words indicating positive affect
(i.e. �attentive,� and �strong�), comprising the Positive Affect Subscale. The other ten
items are words indicating negative affect (i.e. �irritable,� and �guilty�), and make up the
Negative Affect Subscale. Cronbach�s alpha for the Positive Affect Subscale are
generally 0.88 to 0.90, while alpha for the Negative Affect Subscale are 0.84 to 0.87
(Crawford & Henry, 2004). Cronbach�s coefficient alphas for the Positive Affect and
Negative Affect subscale scores for this study were 0.88 and 0.89 respectively.

Gender and Negatively Influencing Factors of Intuitive Eating 16
Body dissatisfaction was measured using the Body Dissatisfaction Subscale of the
Eating Disorder Inventory-2 (BD EDI-2; Garner, 1991, Appendix O). This subscale of
the EDI-2 is a 9 item scale measuring the acceptance of an individual�s own body/body
parts. Sample items from this scale are, �I think that my stomach is too big,� and �I think
that my thighs are too large.� Items are ranked on a 6-point scale with 1 being �Always,�
and 6 being �Never.� All items are averaged with high scores indicating high levels of
body dissatisfaction. Test-retest reliability of this measure�s scores over a three week
period was 0.97 (Wear & Pratz, 1987). Previous studies using college women have
yielded Cronbach�s alphas of 0.91 (Brookings & Wilson, 1994). Cronbach�s coefficient
alpha for the current study was also 0.91.
The final personality characteristic that was analyzed in this study was optimism,
which was measured using the Life Orientation Test- Revised (LOT-R; Scheier, Carver,
& Bridges, 1994, Appendix P). This is a 7 item scale containing items such as: �In
uncertain times, I usually expect the best.� All items are ranged on a 4-point scale with 1
being �Strongly Disagree,� and 4 being �Strongly Agree.� With the exception of item 4
which is a filler item (�It�s important for me to keep busy.�), items are averaged with
high scores indicating high levels of optimism. Internal consistency reliability scores
from previous studies using college students have been 0.82 (Sheier et al., 1994).
Cronbach�s alpha for this study was also 0.82.
Societal/media messages. Internalization of media messages was measured using
the Internalization Subscale of the Sociocultural Attitudes Toward Appearance
Questionnaire (SATAQ; Heinberg, Thompson, & Stormer, 1995, Appendix K). This
scale contains 8 items such as, �Photographs of thin women make me wish that I were
Gender and Negatively Influencing Factors of Intuitive Eating 17
thin,� and, �Music videos that show thin models make me wish that I were thin.� Items
were rated on a 5-point scale with 1 being �Definitely Disagree,� and 5 being �Definitely
Agree.� All items were averaged with high scores indicating high levels of
internalization of the thin-ideal proposed by the media. Scores on this scale have shown
internal consistency reliability in previous studies using college women, with Cronbach�s
alpha equaling 0.88 (Heinber et al., 1995). Cronbach�s coefficient alpha for this study
was 0.90.
External pressures to lose weight were assessed using the Perceived Sociocultural
Pressures Scale (PSPS; Stice, Ziemba, Margolis, & Flick, 1996, Appendix L). This is an
8 item scale with sample items such as, �I�ve felt pressure from my friends to lose
weight,� and, �I�ve noticed a strong message from people I�ve dated to have a thin body.�
Items were rated on a 5 point scale with 1 being �Never,� and 5 being �Always.� All
items were averaged with high scores indicating high levels of perceived pressures to lose
weight/be thin. For this scale�s scores, Cronbach�s alpha has previously been found to be
0.87, and test-retest reliability over a two week period was 0.93 among college women
(Stice et al., 1996). For the current study, Cronbach�s alpha was 0.87.
Perceived acceptance of an individual�s body weight and shape by others was
measured using the Body Acceptance by Others Scale (BAOS; Avalos & Tylka, 2006,
Appendix N). This is a 10 item scale with items rated on a 5 point scale with 1 being
�Never,� and 5 being �Always.� An example item from this survey is �I�ve felt
acceptance from my friends regarding my body shape and/or weight.� All 10 items were
averaged, with high scores indicating high levels of perceived acceptance of body
weight/shape by others. Cronbach�s coefficient alpha for this measure was 0.93.
Gender and Negatively Influencing Factors of Intuitive Eating 18
Procedure
Participants were recruited through several different courses at either The Ohio
State University or Marion Technical College during winter and spring quarters of 2008.
Participants were informed of the purpose of the study (to determine gender differences
in eating habits and factors that impact eating behaviors, such as personality variables and
family influences), that it was anonymous, and that completing the survey was optional.
All participants who opted to participate in the study were allowed to take the survey
home to complete it, and returned it during the next class period. Students were allowed
to replace a given assignment with the completion of the survey or received extra credit
for their participation.
Results
Descriptive and Preliminary Analyses
Measures that had more than 25% of data points missing were dropped from the
study. Otherwise, missing data points were handled by substituting participants� mean
scale score for the missing value. Table 1 presents the correlations, means, and standard
deviations of the various measures used in this study. For intuitive eating, the subscales
all correlated with each other and the total scale in the expected direction. The use of
coercive feeding strategies by caregivers was associated in a negative direction to
intuitive eating and its respective constructs as hypothesized. Also, being around people
who are consumed with dieting and being thin was associated in a negative direction to
intuitive eating and its constructs as predicted. Intuitive eating was also associated in a
negative direction to all of the maladaptive personality characteristics assessed in this
Gender and Negatively Influencing Factors of Intuitive Eating 19
study (depression, body dissatisfaction, maladaptive perfectionism, negative affect, low
levels of self-esteem, and pessimism) as expected.
Gender Differences in Intuitive Eating
An independent t-test was conducted to determine if men have higher levels of
intuitive eating than women. As predicted, total intuitive eating scores (t [2, 256] = -2.42,
p < .05) and eating for physical rather than emotional reasons (t [2, 256] = -2.41, p < .05)
indicated significant gender differences, with men having higher intuitive eating average
scores than women. Contrary to the hypothesis, unconditional permission to eat (t [2,
256] = -1.68, ns) and reliance on internal hunger and satiety cues to govern eating (t [2,
256] = -1.68, ns) did not indicate significant gender differences. Results of these
analyses, as well as means and standard deviations for women�s and men�s IES scores,
are indicated in Table 2.
Perceptions of Adaptive Eating
Standard correlations between the Healthy Eating Scale and the Intuitive Eating
Scale and its respective subscales were used to determine if individuals have skewed
ideas of adaptive eating as hypothesized. As predicted, intuitive eating (r = .30, p < .05)
and unconditional permission to eat (r = .39, p < .05) were associated with higher levels
of adaptive diet perceptions. However, eating for physical rather than emotional reasons
(r = .04, ns), and reliance on internal hunger and satiety cues to govern eating (r = .12,
ns) were not associated with adaptive diet perceptions. Results from these analyses are
presented in Table 1.
Caregiver Eating Messages

Gender and Negatively Influencing Factors of Intuitive Eating 20
A standard multiple regression analysis was used to determine whether the
hypothesis that suggested that increased use of coercive feeding strategies by caregivers
would be associated with lower levels of intuitive eating, predicted unique variance in
intuitive eating. This analysis showed that caregiver use of coercive feeding strategies as
well as the overall focus on food and weight by caregivers accounted for 15.7% of the
variance in intuitive eating (F [2, 251] = 23.36, p < .05). Of the two individual factors,
both caregiver use of coercive feeding strategies (β = -.32, t [253] = -4.95, p < .05) and
overall focus of food and weight by caregivers (β = -.14, t [253] = -2.22, p < .05)
predicted unique variance in intuitive eating as hypothesized.
A second standard multiple regression analysis was used to determine if this
hypothesis predicted unique variance in unconditional permission to eat. This analysis
showed that caregiver use of coercive feeding strategies as well as the overall focus on
food and weight by caregivers accounted for 12.9% of the variance in unconditional
permission to eat (F [2, 251] = 18.64, p < .05). Of the two individual factors, both
caregiver use of coercive feeding strategies (β = -.18, t [253] = -2.80, p < .05) and overall
focus of food and weight by caregivers (β = -.24, t [253] = -3.77, p < .05) predicted
unique variance in unconditional permission to eat as hypothesized.
A third standard multiple regression analysis was used to determine if this
hypothesis predicted unique variance in eating for physical rather than emotional reasons.
This analysis showed that caregiver use of coercive feeding strategies as well as the
overall focus on food and weight by caregivers accounted for 8.4% of the variance in
eating for physical rather than emotional reasons (F [2, 251] = 11.45, p < .05). Of the
two individual factors, only caregiver use of coercive feeding strategies predicted unique

Gender and Negatively Influencing Factors of Intuitive Eating 21
variance in eating for physical rather than emotional reasons (β = -.31, t [253] = -4.65, p
< .05). Contrary to the hypothesis, overall focus of food and weight by caregivers did not
predict unique variance in eating for physical rather than emotional reasons (β = .06, t
[253] = .91, ns).
A final standard multiple regression analysis was used to determine if this
hypothesis predicted unique variance in reliance on internal hunger and satiety cues to
govern eating. This analysis showed that caregiver use of coercive feeding strategies as
well as the overall focus on food and weight by caregivers accounted for 6.5% of the
variance in reliance on internal hunger and satiety cues to govern eating (F [2, 251] =
8.79, p < .05). Of the two individual factors, only caregiver use of coercive feeding
strategies predicted unique variance in reliance on internal hunger and satiety cues to
govern eating (β = -.23, t [253] = -3.38, p < .05). Contrary to the hypothesis, overall
focus of food and weight by caregivers did not predict unique variance in reliance on
internal hunger and satiety cues to govern eating (β = -.06, t [253] = -.85, ns). Results for
these analyses are indicated in Table 3.
Perceptions of Significant Others� Dieting Behaviors
The hypothesis suggesting that the presence of significant others who participants
perceive are consumed with dieting and being thin will increase the likelihood that the
participants themselves will report lower intuitive eating was analyzed using a standard
multiple regression analysis. This analysis showed that being around people who are
consumed with dieting and being thin and the overall focus on food and weight by people
in an individual�s environment accounted for 43.4% of the variance in intuitive eating (F
[2, 256] = 29.71, p < .05). However, of the two individual predictors, only being around
Gender and Negatively Influencing Factors of Intuitive Eating 22
people who are consumed with dieting and being thin predicted unique variance in
intuitive eating (β = -.33, t [258] = -4.10, p < .05). Contrary to the hypothesis, overall
focus of food and weight by people in an individual�s environment did not predict unique
variance in intuitive eating (β = -.14, t [258] = -1.74, ns).
A second standard multiple regression analysis was used to determine if this
hypothesis predicted unique variance in unconditional permission to eat. This analysis
showed that being around people who are consumed with dieting and being thin and the
overall focus on food and weight by people in an individual�s environment accounted for
43.9% of the variance in unconditional permission to eat (F [2, 256] = 30.51, p < .05).
Of the two individual factors, both being around people who are consumed with dieting
and being thin (β = -.31, t [258] = -3.95, p < .05) and overall focus of food and weight by
people in an individual�s environment (β = -.16, t [258] = -2.00, p < .05) predicted unique
variance in unconditional permission to eat as hypothesized.
A third standard multiple regression analysis was used to determine if this
hypothesis predicted unique variance in eating for physical rather than emotional reasons.
This analysis showed that being around people who are consumed with dieting and being
thin and the overall focus on food and weight by people in an individual�s environment
accounted for 21.6% of the variance in eating for physical rather than emotional reasons
(F [2, 256] = 6.29, p < .05). However, of the two individuals predictors, only being
around people who are consumed with dieting and being thin predicted unique variance
in eating for physical rather than emotional reasons (β = -.21, t [258] = -2.41, p < .05).
Contrary to the hypothesis, overall focus of food and weight by people in an individual�s
Gender and Negatively Influencing Factors of Intuitive Eating 23
environment did not predict unique variance in eating for physical rather than emotional
reasons (β = -.01, t [258] = -.15, ns).
A final standard multiple regression analysis was used to determine if this
hypothesis predicted unique variance in reliance on internal hunger and satiety cues to
govern eating. This analysis showed that being around people who are consumed with
dieting and being thin and the overall focus on food and weight by people in an
individual�s environment accounted for 22.2% of the variance in reliance on internal
hunger and satiety cues to govern eating (F [2, 256] = 6.66, p < .05). Of the two
individual factors, neither being around people who are consumed with dieting and being
thin (β = -.12, t [258] = -1.43, ns) nor overall focus of food and weight by people in an
individual�s environment (β = -.12, t [258] = -1.38, ns) predicted unique variance in
reliance on internal hunger and satiety cues to govern eating. Results from these analyses
are located in Table 4.
Maladaptive Personality Characteristics
Standard multiple regression analyses were ran to assess if the hypothesis that
certain maladaptive personality characteristics would be associated with low levels of
intuitive eating predicted unique variance in intuitive eating. The maladaptive
personality characteristics were put into the following groups: (1) depression, negative
affect, and maladaptive perfectionism, (2) body appreciation and body dissatisfaction,
and (3) low levels of self-esteem and optimism. Each group was assessed in its own
multiple regression analysis with intuitive eating and its respective constructs.
First, depression, negative affect, and maladaptive perfectionism were assessed to
determine if they predicted unique variance in intuitive eating. This analysis showed
Gender and Negatively Influencing Factors of Intuitive Eating 24
these three personality characteristics accounted for 43.9% of the variance in intuitive
eating (F [3, 255] = 20.35, p < .05). Of the three individual characteristics, only
depression (β = -.25, t [258] = -3.12, p < .05) and maladaptive perfectionism (β = -.20, t
[258] = -2.79, p < .05) predicted unique variance in intuitive eating. Negative affect did
not predict unique variance in intuitive eating as expected (β = -.06, t [258] = -.79, ns).
Depression, negative affect, and maladaptive perfectionism were also assessed to
determine if they predicted unique variance in unconditional permission to eat. This
analysis showed that these three personality characteristics accounted for 33.8% of the
variance in unconditional permission to eat (F [3, 255] = 10.97, p < .05). Of the three
individual characteristics, only depression (β = -.17, t [258] = -2.05, p < .05) and
maladaptive perfectionism (β = -.24, t [258] = -3.18, p < .05) predicted unique variance in
unconditional permission to eat. Negative affect did not predict unique variance in
unconditional permission to eat as expected (β = .04, t [258] = .48, ns).
Depression, negative affect, and maladaptive perfectionism were also assessed to
determine if they predicted unique variance in eating for physical rather than emotional
reasons. This analysis showed that these three personality characteristics accounted for
37.3% of the variance in eating for physical rather than emotional reasons (F [3, 255] =
13.74, p < .05). Of the three individual characteristics, only depression predicted unique
variance in eating for physical rather than emotional reasons (β = -.22, t [258] = -2.65, p
< .05). Negative affect (β = -.10, t [258] = -1.29, ns) and maladaptive perfectionism (β =
-.11, t [258] = -1.52, ns) did not predicted unique variance in eating for physical rather
than emotional reasons.

Gender and Negatively Influencing Factors of Intuitive Eating 25
Depression, negative affect, and maladaptive perfectionism were also assessed to
determine if they predicted unique variance in reliance on internal hunger and satiety
cues to govern eating. This analysis showed that these three personality characteristics
accounted for 26.2% of the variance in reliance on internal hunger and satiety cues to
govern eating (F [3, 255] = 6.29, p < .05). None of the three personality characteristics:
depression (β = -.15, t [258] = -1.79, ns), negative affect (β = -.14, t [258] = -1.71, ns), or
maladaptive perfectionism (β = .01, t [258] = .11, ns) predicted unique variance in
reliance on internal hunger and satiety cues to govern eating as hypothesized.
Second, body appreciation and body dissatisfaction were assessed to determine if
they predicted unique variance in intuitive eating. This analysis showed that these
personality characteristic accounted for 58.6% of the variance in intuitive eating (F [3,
255] = 67.09, p < .05). Both of these individuals characteristics, body appreciation (β =
.26, t [258] = 3.71, p < .05) and body dissatisfaction (β = -.38, t [258] = -5.39, p < .05)
predicted unique variance in intuitive eating as predicted.
Body appreciation and body dissatisfaction were also assessed to determine if
they predicted unique variance in unconditional permission to eat. This analysis showed
that these personality characteristic accounted for 39.7% of the variance in unconditional
permission to eat (F [3, 255] = 23.89, p < .05). Of these two individual personality
characteristics, only body dissatisfaction predicted unique variance in unconditional
permission to eat (β = -.29, t [258] = -3.64, p < .05). Body appreciation did not predict
unique variance in unconditional permission to eat (β = .14, t [258] = 1.75, ns).
Body appreciation and body dissatisfaction were also assessed to determine if
they predicted unique variance in eating for physical rather than emotional reasons. This

Gender and Negatively Influencing Factors of Intuitive Eating 26
analysis showed that these personality characteristic accounted for 49.5% of the variance
in eating for physical rather than emotional reasons (F [3, 255] = 41.46, p < .05). Both of
these individuals characteristics, body appreciation (β = .18, t [258] = 2.34, p < .05) and
body dissatisfaction (β = -.36, t [258] = -4.76, p < .05) predicted unique variance in eating
for physical rather than emotional reasons as hypothesized.
Body appreciation and body dissatisfaction were also assessed to determine if
they predicted unique variance in reliance on internal hunger and satiety cues to govern
eating. This analysis showed that these personality characteristic accounted for 42.8% of
the variance in reliance on internal hunger and satiety cues to govern eating (F [3, 255] =
28.77, p < .05). Of these two individual personality characteristics, only body
appreciation predicted unique variance in reliance on internal hunger and satiety cues to
govern eating (β = .34, t [258] = 4.36, p < .05). Body dissatisfaction did not predict
unique variance in reliance on internal hunger and satiety cues to govern eating (β = -.12,
t [258] = -1.50, ns).
Finally, self-esteem and optimism were examined to determine if they predicted
unique variance in intuitive eating. This analysis showed that these personality
characteristic accounted for 40.9% of the variance in reliance intuitive eating (F [3, 255]
= 25.78, p < .05). Of these two individual personality characteristics, only self esteem
predicted unique variance in intuitive eating (β = .42, t [258] = 5.44, p < .05). Optimism
did not predict unique variance in intuitive eating (β = -.01, t [258] = -.18, ns).
Self-esteem and optimism were also examined to determine if they predicted
unique variance in unconditional permission to eat. This analysis showed that these
personality characteristic accounted for 28.2% of the variance in unconditional

Gender and Negatively Influencing Factors of Intuitive Eating 27
permission to eat (F [3, 255] = 11.02, p < .05). Of these two individual personality
characteristics, only self esteem predicted unique variance in unconditional permission to
eat (β = .29, t [258] = 3.53, p < .05). Optimism did not predict unique variance in
unconditional permission to eat (β = -.01, t [258] = -.08, ns).
Self-esteem and optimism were also examined to determine if they predicted
unique variance in eating for physical rather than emotional reasons. This analysis
showed that these personality characteristic accounted for 33.0% of the variance in eating
for physical rather than emotional reasons (F [3, 255] = 15.64, p < .05). Of these two
individual personality characteristics, only self esteem predicted unique variance in
eating for physical rather than emotional reasons (β = .37, t [258] = 4.65, p < .05).
Optimism did not predict unique variance in eating for physical rather than emotional
reasons (β = -.07, t [258] = -.81, ns).
Self-esteem and optimism were also examined to determine if they predicted
unique variance in reliance on internal hunger and satiety cues to govern eating. This
analysis showed that these personality characteristic accounted for 30.9% of the variance
in reliance on internal hunger and satiety cues to govern eating (F [3, 255] = 13.56, p <
.05). Of these two individual personality characteristics, only self esteem predicted
unique variance in reliance on internal hunger and satiety cues to govern eating (β = .26, t
[258] = 3.19, p < .05). Optimism did not predict unique variance in reliance on internal
hunger and satiety cues to govern eating (β = .07, t [258] = .91, ns). Table 5 contains the
results of all of these analyses.
Sociocultural Pressures

Gender and Negatively Influencing Factors of Intuitive Eating 28
The hypothesis that suggests that internalization of sociocultural pressures to be
thin will be associated with lower levels of intuitive eating was assessed using a standard
multiple regression analysis to determine if unique variance in intuitive eating was
predicted. This analysis showed that internalization of media messages, perceived
sociocultural pressures for thinness, and body acceptance by others accounted for 56.0%
of the variance in intuitive eating (F [3, 255] = 38.88, p < .05). All three individual
factors: internalization of media messages (β = -.24, t [258] = -4.04, p < .05), perceived
sociocultural pressures for thinness (β = -.20, t [258] = -2.82, p < .05), and body
acceptance by others (β = .25, t [258] = 3.77, p < .05) predicted unique variance in
intuitive eating as expected.
A second standard multiple regression analysis was used to determine if this
hypothesis predicted unique variance in unconditional permission to eat. This analysis
showed that internalization of media messages, perceived sociocultural pressures for
thinness, and body acceptance by others accounted for 45.4% of the variance in
unconditional permission to eat (F [3, 255] = 22.08, p < .05). Of the individual
predictors, only being internalization of media messages (β = -.21, t [258] = -3.22, p <
.05), and perceived sociocultural pressures for thinness (β = -.27, t [258] = -3.44, p < .05)
predicted unique variance in unconditional permission to eat. Contrary to the hypothesis,
body acceptance by others did not predict unique variance in unconditional permission to
eat (β = -.07, t [258] = .97, ns).
A third standard multiple regression analysis was used to determine if this
hypothesis predicted unique variance in eating for physical rather than emotional reasons.
This analysis showed that internalization of media messages, perceived sociocultural

Gender and Negatively Influencing Factors of Intuitive Eating 29
pressures for thinness, and body acceptance by others accounted for 41.2% of the
variance in eating for physical rather than emotional reasons (F [3, 255] = 17.43, p < .05).
Of all the individual factors, only body acceptance by others predicted unique variance in
eating for physical rather than emotional reasons (β = .27, t [258] = 3.74, p < .05) as
predicted. Contrary to the hypothesis, neither internalization of media messages (β = -
.12, t [258] = 1.84, ns) nor perceived sociocultural pressures for thinness (β = -.10, t [258]
= -1.29, ns) predicted unique variance in eating for physical rather than emotional
reasons.
A final standard multiple regression analysis was used to determine if this
hypothesis predicted unique variance in reliance on internal hunger and satiety cues to
govern eating. This analysis showed that internalization of media messages, perceived
sociocultural pressures for thinness, and body acceptance by others accounted for 38.7%
of the variance in reliance on internal hunger and satiety cues to govern eating (F [3, 255]
= 14.95, p < .05). Two of the individual factors: internalization of media messages (β = -
.21, t [258] = -3.09, p < .05), and body acceptance by others (β = .30, t [258] = 4.10, p <
.05) predicted unique variance in reliance on internal hunger and satiety cues to govern
eating as predicted. Contrary to the hypothesis, perceived sociocultural pressures for
thinness did not predict unique variance in reliance on internal hunger and satiety cues to
govern eating (β = .06, t [258] = .80, ns). Results of these analyses are found in Table 6.
Discussion
Several different areas of intuitive eating were examined for the present study: (1)
gender differences in intuitive eating, (2) participants� ideas of what constitutes an
adaptive diet, (3) the relationship between caregiver eating messages and behaviors and

Gender and Negatively Influencing Factors of Intuitive Eating 30
intuitive eating, (4) the association between dieting and weight preoccupation in
participants� environments and intuitive eating, (5) the association between certain
personality characteristics and intuitive eating, and (6) the association between
societal/media messages and intuitive eating. All hypotheses were supported, at least in
part, by the data.
First, men were found to have higher levels of intuitive eating and eating for
physical rather than emotional reasons than women. This is similar to previous research
indicating that men have lower levels of disordered eating than women (Meyer & Waller,
1998; Murnen & Smolak, 1997; Tata et al., 2001; Walcott et al., 2003). Yet, it is
important to not assume that low levels of intuitive eating are equivalent to high levels of
eating disorder symptomatology, as these constructs are related but not completely
overlapping (Tylka & Wilcox, 2006). It is essential to note that even though the number
of female participants (n = 178) was much larger than the number of male participants (n
= 80) in this survey, the t-test was ran assuming equal variance between the genders.
Second, the idea that individuals have a skewed idea of adaptive eating was
moderately supported by the data. Knowledge of an adaptive diet or healthy eating (i.e.,
defined in this study as one that does not avoid certain categories of food, such as the
avoidance of all sugar or fatty foods, which does not create feelings of deprivation, food
preoccupation or disinhibited eating) was correlated with higher levels of intuitive eating
and unconditional permission to eat. This fact suggests that as the knowledge and
practice of an adaptive diet decreases, so do levels of intuitive eating and vice versa.
This idea supports the theory that intuitive eating and its constructs represent healthy,
adaptive eating (Tribole & Resch, 2003).

Gender and Negatively Influencing Factors of Intuitive Eating 31
Third, increased levels of perceived caregiver use of coercive feeding strategies
(e.g., pressures to eat certain foods such as fruits and vegetables, restriction of sugar or
fatty foods) were associated with lower levels of intuitive eating and unconditional
permission to eat. Participants� perceptions that their caregivers used coercive feeding
strategies also negatively predicted unique variance in intuitive eating and its respective
constructs. The overall focus on food and weight by caregivers also negatively predicted
unique variance in intuitive eating and unconditional permission to eat. This data
expands on previous research indicating that caregiver messages have a large impact on
childhood eating behaviors by determining that these caregiver messages are directly
related to intuitive eating, such that these messages are associated with lower levels of
intuitive eating (Birch, 1999; Birch & Fisher, 2000; Fisher & Birch, 1999).
Fourth, as predicted, being around people who are consumed with dieting and
being thin was correlated with lower levels of intuitive eating and all three of its
constructs. Being around people who are consumed with dieting and being thin also
negatively predicted unique variance in intuitive eating, unconditional permission to eat,
and eating for physical rather than emotional reasons. The overall focus on food and
weight by people in an individual�s environment negatively predicted unique variance in
unconditional permission to eat. This indicates that being around people who are
consumed with dieting and being thin not only increases levels of chronic dieting and
eating disorder symptomatology, it is also negatively associated with lower levels of
intuitive eating (Edmunds & Hill, 1999; Keel et al., 1997; Smolak et al., 1999).
Fifth, all of the maladaptive personality characteristics tested in this study
(negative affect and depression, body dissatisfaction, low levels of body appreciation,

Gender and Negatively Influencing Factors of Intuitive Eating 32
maladaptive perfectionism, low levels of self-esteem, and low levels optimism) were
associated with lower levels of intuitive eating. Depression, maladaptive perfectionism,
body dissatisfaction, low levels of body appreciation, low levels of self-esteem and low
levels of optimism all also predicted unique variance in intuitive eating. While negative
affect and optimism were correlated bivariately in the expected directions with intuitive
eating, they did not predict unique variance when other variables were considered. This
supports and expands on previous research by Tylka (2006) indicating that certain
personality characteristics have a negative influence on levels of intuitive eating, but
should be examined concurrently with other variables to determine which have the
stronger and unique associations with intuitive eating.
Finally, internalization of sociocultural pressures to be thin was associated with
lower levels of intuitive eating. Internalization of media messages, perceived
sociocultural pressures to be thin, and body acceptance by others all negatively predicted
unique variance in intuitive eating. This suggests that internalization of the media�s focus
on thinness and weight are associated with lower levels of intuitive eating as well as
eating disorder symptomatology, depression, and higher levels of body dissatisfaction in
women and men as previously mentioned (Agliata & Tantleff-Dunn, 2004; Fredrickson
& Roberts, 1997; Stice et al., 1996).
Implications for Theory
Many of the relationships between the factors assessed in this study and intuitive
eating have not been previously researched (i.e. gender, caregiver eating messages,
perceptions of adaptive eating, being around others who are consumed with dieting and
being thin, and certain maladaptive personality characteristics) and therefore add

Gender and Negatively Influencing Factors of Intuitive Eating 33
incrementally to research on eating behaviors. The findings of this study indicate that
each of these factors have a negative association with intuitive eating and thus should be
incorporated into current theories on eating behaviors and intuitive eating. The
incorporation of these findings into current theories could essentially provide valuable
information to help discover reasons for low levels of intuitive eating.
Implications for Research
Future research could re-assess the hypothesis predicting that men have higher
levels of intuitive eating than women. It is possible that significant gender differences in
the intuitive eating constructs of unconditional permission to eat and reliance on internal
hunger and satiety cues to govern eating could be found with a larger number of men, or
perhaps there genuinely is no significant difference between women and men in these
areas. Also, the majority of participants in this study were young, Caucasian women, so
future research could examine ethnic, and age differences in levels of intuitive eating as
well. Studies have shown some ethnical differences in disordered eating, but to my
knowledge, no studied have examined the relationship between ethnicity and levels of
intuitive eating (i.e. Barry & Grilo, 2002; Franko, 2007; Wildes, Emery, & Simons,
2001). This would improve the basic understanding of intuitive eating as well as prevent
generalizations of previous findings to individuals of different ages and ethnicities.
Future research could also focus on factors that positively influence intuitive
eating. Avalos and Tylka (2006) have previously found that body function and positive
body image influence intuitive eating levels in a positive direction in college women, but
there are many other factors, such as personality variables, that could increase or decrease
levels of intuitive eating as well. These factors should also be examined with minority
Gender and Negatively Influencing Factors of Intuitive Eating 34
individuals and men. Discovering these factors could impact our knowledge of factors
that contribute to intuitive eating so as to facilitate attempts to increase this adaptive
eating style.
Implications for Practice
The data analyzed in this study indicated that individuals have skewed
perceptions of what is included in an adaptive diet, believing that restricting certain foods
is healthy and adaptive when research shows that it is clearly not (Birch, 1999; Birch &
Fisher, 2000; Cutting et al., 1999; Fisher & Birch, 1999). These ideas suggest that
individuals need to be educated on intuitive eating and its constructs in order to increase
knowledge of adaptive diets. Spreading this information could increase levels of intuitive
eating and decrease levels of chronic dieting and disordered eating.
The information from this study also indicated that perceptions that caregiver
used coercive feeding strategies negatively influenced intuitive eating. Educating parents
and caregivers on coercive feeding strategies as well as the negative effects of the use of
these feeding strategies could decrease their likelihood to use them. This would then
decrease the negative effects that these feeding strategies have on children (i.e. low self-
esteem, negative body image, low levels of intuitive eating). It would also be beneficial
to educate parents on intuitive eating to increase their levels of intuitive eating so that
they can display healthy eating behaviors to their children.
Certain maladaptive personality characteristics were also found to be associated
with low levels of intuitive eating. Teaching individuals how to identify these
maladaptive personality characteristics within themselves, as well as how to replace them
with more adaptive characteristics (i.e. self-esteem, optimism, body appreciation) could
Gender and Negatively Influencing Factors of Intuitive Eating 35
help raise intuitive eating levels. Not only would replacing maladaptive personality
characteristics with adaptive personality characteristics increase levels of intuitive eating,
it could increase overall physical and psychological well-being (Tylka & Wilcox, 2006).
Limitations
Limitations of the present study should be addressed. First, participants of the
present study were primarily young, middle class, Caucasian college women, which
preclude the generalization of the findings to other groups such as women of color,
individuals of various socioeconomic status, community women, and older women.
Second, the variable relations between the constructs in the present study were not
analyzed using SEM, which is an essential next step in understanding the theoretical
framework developed in the present study. This analysis would require at least 300
participants, depending on the number of indicators used to represent each latent variable.
Third, the present study used a correlational design, and nothing can be said about the
direction of the predictions made. Fourth, the self-report mode of data collection is
susceptible to erroneous responding. Finally, Cronbach�s coefficient alpha for the
Intuitive Eating subscale of Reliance on Internal Hunger and Satiety cues to govern
eating was reported at 0.67 for this study. Unfortunately, this coefficient is slightly lower
than acceptable Cronbach�s alphas of 0.70 or higher. This reported alpha suggests a
lower level of internal consistency reliability for this measure in this study.
Conclusion
This study provided new information and expanded on previous research in
gender differences and negatively influencing factors of intuitive eating. The present
study provided evidence that men have higher levels of intuitive eating then women.
Gender and Negatively Influencing Factors of Intuitive Eating 36
This study also discovered support for many factors that negatively influence levels of
intuitive eating, which may be the closest thing to healthy eating. Specifically,
individuals who internalize sociocultural pressures to be thin, and/or have an environment
containing diet and weight preoccupied individuals are predicted to have lower levels of
intuitive eating. Also, children who perceived being exposed to coercive feeding
strategies by their caregivers had lower levels of intuitive eating and carried negative
eating habits into adulthood. It was also discovered that personality characteristics of
negative affect and depression, body dissatisfaction, low levels of body appreciation
maladaptive perfectionism, low levels of self-esteem, and low levels of optimism
predicted low levels of intuitive eating. Identifying that all of these factors are associated
with lower levels of intuitive eating is an important step in the process of improving
one�s ability to eat intuitively.

Gender and Negatively Influencing Factors of Intuitive Eating 37
References
Agliata, D., & Tantleff-Dunn, S. (2004). The impact of media exposure on males� body
image. Journal of Social and Clinical Psychology, 23, 7-22.
American Psychological Association. (2000). Diagnostic and statistical manual of mental
disorders (4th ed., text revision). Washington DC: American Psychiatric Press, Inc.
Avalos, L. C., & Tylka, T. L. (2006). Exploring a model of intuitive eating with college
women. Journal of Counseling Psychology, 53, 486-497.
Avalos, L., Tylka, T. L., & Wood-Barcalow, N. (2005). The Body Appreciation Scale:
Development and psychometric evaluation. Body Image: An International Journal of
Research, 2, 285---297.
Barry, D. T., & Grilo, C. M. (2002). Eating and body image disturbances in adolescent
psychiatric inpatients: Gender and ethnicity patterns. International Journal of Eating
Disorders, 32, 335-343.
Birch, L. L. (1999). Development of food preferences. Annual Review of Nutrtion, 19,
41-62.
Birch, L. L., & Fisher, J. O. (2000). Mothers’ child-feeding practices influence daughters
eating and weight. The American Journal of Clinical Nutrition, 71, 1054-1061.
Beck, A. T., Rush, A., Shaw, B. F., & Emery, G. (1979). Cognitive therapy of depression.
Guilford Press: New York.
Brookings, J. B., & Wilson, J. F. (1994). Personality and family environment predictors
of self-reported eating attitudes and behaviors. Journal of Personality Assessment, 63,
313�326.
Gender and Negatively Influencing Factors of Intuitive Eating 38
Crawford, J. R., & Henry, J. D. (2004). The Positive and Negative Affect Schedule
(PANAS): Construct validity, measurement properties and normative data in a large
non-clinical sample. British Journal of Clinical Psychology, 43, 245-265.
Cutting, T. M., Fisher, J. O., Grimm-Thomas, K., & Birch, L. L. (1999). Like mother,
like daughter: Familial patterns of overweight are mediated by mothers� dietary
disinhibition. The American Journal of Clinical Nutrition, 69, 608-613.
Edmunds, H., & Hill, A. J. (1999). Dieting and the family context of eating in young
adolescent children. International Journal of Eating Disorders, 25, 435-440.
Fairburn, C. G., Cooper, Z., Doll, H. A., & Welch, S. L. (1999). Risk factors for anorexia
nervosa: Three integrated case-control comparisons. Archives of General Psychiatry,
56, 468-476.
Fairburn, C. G., Doll, H. A., Welch, S. L., Hay, P. J., Davies, B. A., & O�Connor, M. E.
(1998). Risk factors for binge eating disorder: A community-based, case-control
study. Archives of General Psychiatry, 55, 425-432.
Fairburn, C. G., Welch, S. L., Doll, H. A., Davies, B. A., & O�Connor, M. E. (1997).
Risk factors for bulimia nervosa: A community-based case-control study. Archives of
General Psychiatry, 54, 509-517.
Fisher, J. O., & Birch, L. L. (1999). Restricting access to palatable foods affects
children�s behavioral response, food selection, and intake. The American Journal of
Clinical Nutrition, 69, 1264-1272.
Franko, D. L. (2007). Race, ethnicity, and eating disorders: Considerations for DSM-V.
International Journal of Eating Disorders, 40, 31-34.
Garner, D. M. (1991). Eating Disorder Inventory---2 manual. Odessa, FL: Psychological
Assessment Resources.

Gender and Negatively Influencing Factors of Intuitive Eating 39
Groesz, L. M., Levine, M. P., & Murnen, S. K. (2001). The effect of experimental
presentation of thin media images on body satisfaction: A meta-analytic review.
International Journal of Eating Disorders, 31, 1-16.
Heinberg, L. J., & Thompson, J. K. (1995). Body image and televised images of thinness
and attractiveness: A controlled laboratory investigation. Journal of Social and
Clinical Psychology, 14, 325-338.
Heinberg, L. J., Thompson, J. K., & Stormer, S. M. (1995). Development and validation
of the sociocultural attitudes towards appearance questionnaire. International Journal
of Eating Disorders, 17, 81-89.
Keel, P. K., Heatherton, T. F., Harnden, J. L., & Hornig, C. D. (1997). Mothers, fathers,
and daughters: Dieting and disordered eating. Eating Disorders, 5, 216-228.
Leon, G. R., Fulkerson, J. A., Perry, C. L., Keel, P. K., & Klump, K. L. (1999). Three to
four year prospective evaluation of personality and behavioral risk factors for later
disordered eating in adolescent girls and boys. Journal of Youth and Adolescence, 28,
181-196.
Meyer, C., & Waller, G. (1998). Dissociation and eating psychopathology: Gender
differences in a nonclinical population. International Journal of Eating Disorders, 23,
217-221.
Mills, J. S., Polivy, J., Herman, C. P., & Tiggemann, M. (2002). Effects of exposure to
thin media images: Evidence of self-enhancement among restrained eaters.
Personality and Social Psychology Bulletin, 28, 1687-1699.

Gender and Negatively Influencing Factors of Intuitive Eating 40
Moradi, B., & Subich, L.M. (2002). Perceived sexist events and feminist identity
development attitudes: Links to women�s psychological distress. The Counseling
Psychologist, 30, 44-65.
Murnen, S. K., & Smolak, L. (1997). Femininity, masculinity, and disordered eating: A
meta-analytic review. International Journal of Eating Disorders, 22, 231-242.
Noll, S.M., & Frederickson, B.L. (1998). A mediational model linking self-
objectification, body shame, and disordered eating. Psychology of Women Quarterly,
22, 623-636.
Pearson, C. A., & Gleaves, D. H. (2006). The multiple dimensions of perfectionism and
their relation with eating disorder features. Personality and Individual Differences,
41, 225-235.
Robinson, J.P., & Shaver, P.R. (1973). Measures of social psychological attitudes (2nd
ed.). Ann Arbor, MI: Institute for Social Research.
Rodin, J., Silberstein, L., & Striegel-Moore, R. (1985). Women and weight: A normative
discontent. In T. Sonderegger (Ed.), Psychology and Gender: Nebraska Symposium
on Motivation (pp. 256-306). Lincoln, NE: University of Nebraska Press.
Schotte, C. K. W., Maes, M., Cluydts, R., De Doncker, D., & Cosyns, P. (1997).
Construct validity of the Beck Depression Inventory in a depressive population.
Journal of Affective Disorders, 46, 115-125.
Scheier, M. F., Carver, C. S., & Bridges, M. W. (1994). Distinguishing optimism from
neuroticism (and trait anxiety, self-mastery, and selfesteem): A reevaluation of the
Life Orientation Test. Journal of Personality and Social Psychology, 67, 1063�1078.

Gender and Negatively Influencing Factors of Intuitive Eating 41
Slaney, R. B., Rice, K. G., Mobley, M., Trippi, J., & Ashby, J. S. (2001). The revised
almost perfect scale. Measurement and Evaluation in Counseling and Development,
34, 130�145.
Smolak, L., Levine, M. P., & Schermer, F. (1999). Parental input and weight concerns
among elementary school children. International Journal of Eating Disorders, 25,
263-271.
Stice, E., Nemeroff, C., & Shaw, H. (1996). A test of the dual pathway model of bulimia
nervosa: Evidence for restrained-eating and affect regulation mechanisms. Journal of
Social and Clinical Psychology, 15, 340-363.
Stice, E., Ziemba, C., Margolis, J., & Flick, P. (1996). The dual pathway model
differentiates bulimics, subclinical bulimics, and controls: Testing the continuity
hypothesis. Behavior Therapy, 27, 531�549.
Striegel-Moore, R. H., & Kearney-Cooke, A. (1994). Exploring parents� attitudes and
behaviors about their children�s physical appearance. International Journal of Eating
Disorders, 15, 377-385.
Tata, P., Fox, J., & Cooper, J. (2001). An investigation into the influence of gender and
parenting styles on excessive exercise and disordered eating. European Eating
Disorders Review, 9, 194-206.
Tribole, E., & Resch, E. (2003). Intuitive eating: A revolutionary program that works.
New York: St. Martin�s Press.
Tylka, T. L. (2006). Development and psychometric evaluation of a measure of intuitive
eating. Journal of Counseling Psychology, 53, 226-240.

Gender and Negatively Influencing Factors of Intuitive Eating 42
Tylka, T. L., & Wilcox, J. A. (2006). Are intuitive eating and eating disorder
symptomatology opposite poles of the same construct? Journal of Counseling
Psychology, 53, 474-485.
Tyrka, A. R., Waldron, I., Graber, J. A., & Brooks-Gunn, J. (2002). Prospective
predictors of the onset of anorexic and bulimic symptoms. International Journal of
Eating Disorders, 32, 282-290.
Vohs, K.D., Bardone, A. M., Joiner, T. E., Abramson, L. Y., & Heatherton, T. F. (1999).
Perfectionism, perceived weight status, and self-esteem interact to predict bulimic
symptoms: A model of bulimic symptom development. Journal of Abnormal
Psychology, 108, 695-700.
Walcott, D. D., Pratt, H. D., & Patel, D. R. (2003). Adolescents and eating disorders:
Gender, racial, ethnic, sociocultural, and socioeconomic issues. Journal of Adolescent
Research, 18, 223-243.
Watson, D., Clark, L. A., & Tellegen, A. (1988b). Development and validation of brief
measures of positive and negative affect: The PANAS Scales. Journal of Personality
and Social Psychology, 47, 1063�1070.
Wear, R. W., & Pratz, O. (1987). Test---retest reliability for the Eating Disorder Inventory.
International Journal of Eating Disorders, 6, 767---769.
Wildes, J. E., Emery, R. E., & Simons, A. D. (2001). The roles of ethnicity and culture in
the development of eating disturbance and body dissatisfaction: A meta-analytic
review. Clinical Psychology Review, 21, 521-551.

Gen
der a
nd N
egat
ivel
y In
fluen
cing
Fac
tors
of I
ntui
tive
Eatin
g 43
Tabl
e 1:
Mea
ns, S
tand
ard
Dev
iatio
ns, a
nd C
orre
latio
ns a
mon
g th
e M
easu
res (
N =
259
) __
____
____
____
____
____
____
____
____
____
____
____
____
____
____
____
____
____
____
____
____
____
____
____
____
____
____
____
____
___
Mea
sure
s
1
2
3
4
5
6
7
8
9
10
11
12
1
3
14
1
5
16
1
7
18
1
9___
_ 1.
BD
I
--
---
2.
PA
NA
S-po
sitiv
e
-.5
1*
-----
3.
PA
NA
S-ne
gativ
e
.66
* -.
47*
----
- 4.
DO
S
.3
5* -
.17*
.2
8*
-----
5.
BA
S
-
.58*
.5
0* -
.47*
-.4
0*
-----
6. A
PS-m
alad
aptiv
e
.57
* -.
49*
.52
*
.27*
-.38
* --
---
7. A
PS-a
dapt
ive
-.
07
.28
* -.
18*
.0
4
.11
-.1
1
-----
8.
PSP
.4
9* -
.30*
.3
8*
.47*
.58
* .
31*
-.08
--
---
9. B
AO
S
-.4
4*
.41*
-.3
6* -
.28*
.62
* -.
31*
.20
* -.
62*
----
- 10
. CEM
S
.3
6* -
.03
.3
7*
.36*
-.25
* .
26*
-.06
.
45*
-.41
* -
----
11. H
ES
-.1
4*
.12*
-.1
0
-.18*
.30
* -.
09
-.04
-.2
9*
.17*
-.0
9
-----
12
. RSE
-.5
7*
64*
-.5
5* -
.24*
.6
2* -
.60*
.28
* -.
40*
.4
8* -
.17*
.0
9
-----
13. S
ATA
Q
.31*
-.3
2*
.31*
.3
6* -
.54*
.3
5* -
.02
.4
8* -
.38*
.2
0* -
.24*
-.4
5*
-----
14. B
D E
DI-2
.3
9* -
.42*
.3
4*
.30*
-.6
9*
.35*
-.0
2
.59*
-.5
7*
.22*
-.2
7* -
.46*
.5
5*
-----
15. L
OT-
R
-.5
9*
.57*
-.6
2* -
.19*
.4
4* -
.56*
.21
* -.
25*
.3
2* -
.15*
.0
9
.67*
-.2
8* -
.31*
---
-- 16
. IES
-.40
* .
29*
-.33
* -.
42*
.52
* -.
37*
.07
-.4
7*
.47*
-.3
7*
.30*
.4
1* -
.43*
-.5
6*
.27*
---
-- 17
. IES
-UPE
-.2
8*
.15*
-.2
0* -
.42*
.3
4* -
.31*
-.06
-.
41*
.3
1* -
.28*
.3
9*
.28*
-.3
6* -
.38*
.1
9*
.81*
---
-- 18
. IES
-EPR
-.3
5*
.28*
-.3
0* -
.22*
.4
2* -
.29*
.13
* -.
33*
.3
8* -
.28*
.0
4
.33*
-.2
7* -
.48*
.1
8*
.69*
.2
1*
-----
19. I
ES-R
IHSC
-.24*
.2
7* -
.24*
-.2
1*
.42*
-.1
5* .
18*
-.23
*
.34*
-.2
6*
.12
.3
1* -
.29*
-.3
5*
.25*
.6
3*
.30*
.3
9*
-----
M
.43
3.
60
2.28
2.
99
3.49
3.
39
5.53
2.
15
3.7
0 2
.96
2.4
8 3
.15
2.7
3 3
.40
2.
80
3.38
3.
27
3.28
3.
67
SD
.39
.6
5
.81
.7
1
.76
1.
34
.99
.8
2
.77
.
45
.64
.
52
.89
1
.14
.5
5
.52
.7
7
.83
.4
9
Not
e. B
DI =
Bec
k D
epre
ssio
n In
vent
ory,
PA
NA
S-po
sitiv
e =
Posi
tive
Affe
ct su
bsca
le o
f Pos
itive
and
Neg
ativ
e A
ffect
Sca
le, P
AN
AS-
nega
tive
= N
egat
ive
Affe
ct
subs
cale
of P
ositi
ve a
nd N
egat
ive
Affe
ct S
cale
, DO
S =
Die
ting
Oth
ers S
cale
, BA
S =
Body
App
reci
atio
n Sc
ale,
APS
-mal
adap
tive
= M
alad
aptiv
e Pe
rfec
tioni
sm
subs
cale
of A
lmos
t Per
fect
Sca
le, A
PS-a
dapt
ive
= A
dapt
ive
Perf
ectio
nism
subs
cale
of A
lmos
t Per
fect
Sca
le, P
SP =
Per
ceiv
ed S
ocio
cultu
ral P
ress
ures
Sca
le,
BAO
S =
Body
Acc
epta
nce
by O
ther
s Sca
le, C
EMS
= Ca
regi
ver E
atin
g M
essa
ges S
cale
, HES
= H
ealth
y Ea
ting
Scal
e, R
SE =
Ros
enbe
rg S
elf-E
stee
m S
cale
, SA
TAQ
= In
tern
aliz
atio
n su
bsca
le o
f Soc
iocu
ltura
l Atti
tude
s Tow
ards
App
eara
nce
Que
stio
nnai
re, B
D E
DI-
2 =
Body
Dis
satis
fact
ion
subs
cale
of E
atin
g D
isor
der
Inve
ntor
y-2,
LO
T-R
= Li
fe O
rient
atio
n Te
st-R
evis
ed, I
ES =
Intu
itive
Eat
ing
Scal
e, IE
S-U
PE =
Unc
ondi
tiona
l Per
mis
sion
to E
at su
bsca
le o
f Int
uitiv
e Ea
ting
Scal
e, IE
S-EP
R =
Eatin
g fo
r Phy
sica
l Rea
sons
subs
cale
of I
ntui
tive
Eatin
g Sc
ale,
IES-
RIH
SC =
Rel
ianc
e on
Inte
rnal
Hun
ger a
nd S
atie
ty C
ues s
ubsc
ale
of
Intu
itive
Eat
ing
Scal
e.
*p <
.05

Gender and Negatively Influencing Factors of Intuitive Eating 44
Table 2 Independent T-test Predicting Gender Differences in Levels of Intuitive Eating (N = 258) Gender M SD 1. Female 3.33 .52 2. Male 3.50 .51
Overall t [2, 256] = -2.42*
Dependent Variable = Intuitive Eating Scale (IES) Gender M SD 1. Female 3.22 .77 2. Male 3.39 .78
Overall t [2, 256] = -1.68 Dependent Variable = Unconditional Permission to Eat Subscale (IES-UPE) Gender M SD 1. Female 3.19 .82 2. Male 3.46 .83
Overall t [2, 256] = -2.41* Dependent Variable = Eating for Physical Reasons Subscale (IES-EPR) Gender M SD 1. Female 3.65 .49 2. Male 3.71 .48
Overall t [2, 256] = -.93 Dependent Variable = Reliance on Internal Hunger and Satiety Cues Subscale (IES-RIHSC) Note. *p < .05
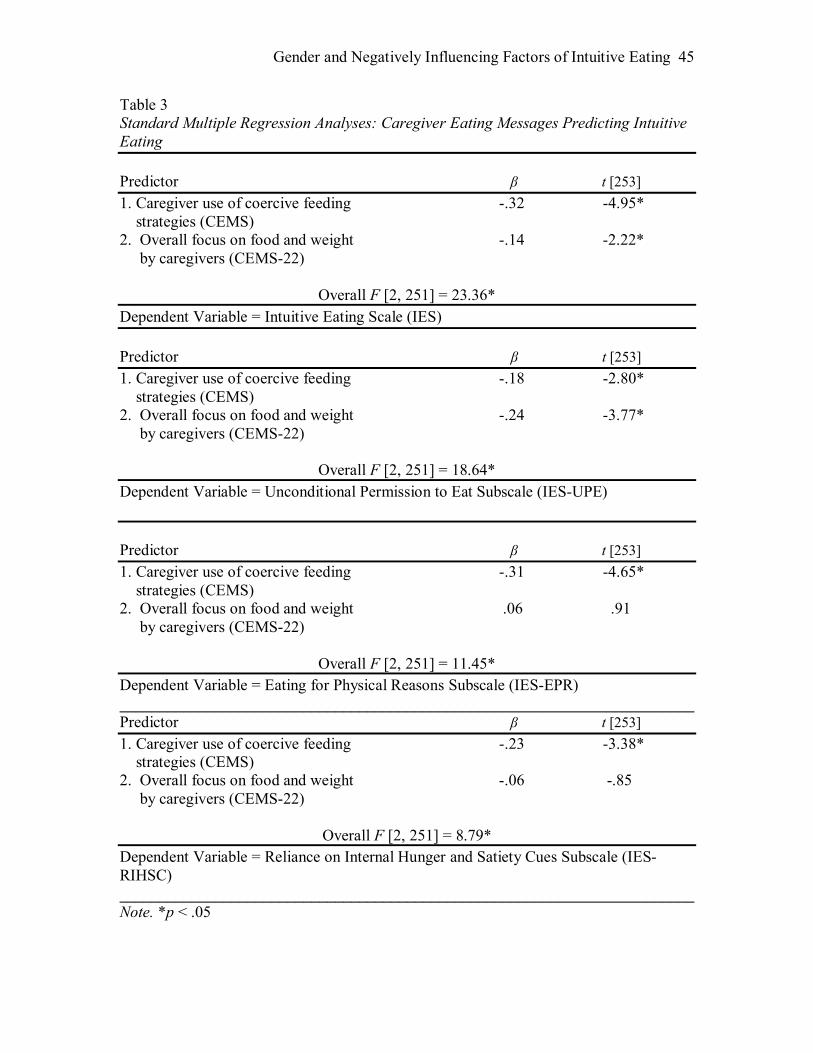
Gender and Negatively Influencing Factors of Intuitive Eating 45
Table 3 Standard Multiple Regression Analyses: Caregiver Eating Messages Predicting Intuitive Eating Predictor β t [253] 1. Caregiver use of coercive feeding -.32 -4.95* strategies (CEMS) 2. Overall focus on food and weight -.14 -2.22* by caregivers (CEMS-22)
Overall F [2, 251] = 23.36* Dependent Variable = Intuitive Eating Scale (IES) Predictor β t [253] 1. Caregiver use of coercive feeding -.18 -2.80* strategies (CEMS) 2. Overall focus on food and weight -.24 -3.77* by caregivers (CEMS-22)
Overall F [2, 251] = 18.64* Dependent Variable = Unconditional Permission to Eat Subscale (IES-UPE) Predictor β t [253] 1. Caregiver use of coercive feeding -.31 -4.65* strategies (CEMS) 2. Overall focus on food and weight .06 .91 by caregivers (CEMS-22)
Overall F [2, 251] = 11.45* Dependent Variable = Eating for Physical Reasons Subscale (IES-EPR) ________________________________________________________________________ Predictor β t [253] 1. Caregiver use of coercive feeding -.23 -3.38* strategies (CEMS) 2. Overall focus on food and weight -.06 -.85 by caregivers (CEMS-22)
Overall F [2, 251] = 8.79* Dependent Variable = Reliance on Internal Hunger and Satiety Cues Subscale (IES-RIHSC) ________________________________________________________________________ Note. *p < .05

Gender and Negatively Influencing Factors of Intuitive Eating 46
Table 4 Standard Multiple Regression Analyses: Dieting Others Predicting Intuitive Eating Predictor β t [258] 1. Being around people who are consumed with dieting and being thin (DOS) -.33 -4.10* 2. Overall focus on food and weight by people in an individual�s environment (PE) -.14 -1.74
Overall F [2, 256] = 29.71* Dependent Variable = Intuitive Eating Scale (IES) Predictor β t [258] 1. Being around people who are consumed with dieting and being thin (DOS) -.31 -3.95* 2. Overall focus on food and weight by people in an individual�s environment (PE) -.16 -2.00*
Overall F [2, 256] = 30.51* Dependent Variable = Unconditional Permission to Eat Subscale (IES-UPE) Predictor β t [258] 1. Being around people who are consumed with dieting and being thin (DOS) -.21 -2.41* 2. Overall focus on food and weight by people in an individual�s environment (PE) -.01 -.15
Overall F [2, 256] = 6.29* Dependent Variable = Eating for Physical Reasons Subscale (IES-EPR) Predictor β t [258] 1. Being around people who are consumed with dieting and being thin (DOS) -.12 -1.43 2. Overall focus on food and weight by people in an individual�s environment (PE) -.12 -1.38
Overall F [2, 256] = 6.66* Dependent Variable = Reliance on Internal Hunger and Satiety Cues Subscale (IES-RIHSC) ________________________________________________________________________ Note. *p < .05

Gender and Negatively Influencing Factors of Intuitive Eating 47
Table 5 Standard Multiple Regression Analyses: Maladaptive Personality Characteristics Predicting Intuitive Eating Predictor β t [258] 1. Depression (BDI) -.25 -3.12* 2. Negative Affect (PANAS-negative) -.06 -.79 3. Maladaptive Perfectionism -.20 -2.79* (APS-maladaptive)
Overall F [3, 255] = 20.35* Dependent Variable = Intuitive Eating Scale (IES) Predictor β t [258] 1. Depression (BDI) -.17 -2.05* 2. Negative Affect (PANAS-negative) .04 .48 3. Maladaptive Perfectionism -.24 -3.18* (APS-maladaptive)
Overall F [3, 255] = 10.97* Dependent Variable = Unconditional Permission to Eat Subscale (IES-UPE) Predictor β t [258] 1. Depression (BDI) -.22 -2.65* 2. Negative Affect (PANAS-negative) -.10 -1.29 3. Maladaptive Perfectionism -.11 -1.52 (APS-maladaptive)
Overall F [3, 255] = 13.74* Dependent Variable = Eating for Physical Reasons Subscale (IES-EPR) Predictor β t [258] 1. Depression (BDI) -.15 -1.79 2. Negative Affect (PANAS-negative) -.14 -1.71 3. Maladaptive Perfectionism .01 .11 (APS-maladaptive)
Overall F [3, 255] = 6.29* Dependent Variable = Reliance on Internal Hunger and Satiety Cues Subscale (IES-RIHSC) Note *p < .05

Gender and Negatively Influencing Factors of Intuitive Eating 48
Table 5 (cont.) ________________________________________________________________________ Predictor β t [258] 1. Body Appreciation (BAS) .26 3.71* 2. Body Dissatisfaction (BD EDI-2) -.38 -5.39*
Overall F [2, 256] = 67.09* Dependent Variable = Intuitive Eating Scale (IES) Predictor β t [258] 1. Body Appreciation (BAS) .14 1.75 2. Body Dissatisfaction (BD EDI-2) -.29 -3.64*
Overall F [2, 256] = 23.89* Dependent Variable = Unconditional Permission to Eat Subscale (IES-UPE) Predictor β t [258] 1. Body Appreciation (BAS) .18 2.34* 2. Body Dissatisfaction (BD EDI-2) -.36 -4.76*
Overall F [2, 256] = 41.46* Dependent Variable = Eating for Physical Reasons Subscale (IES-EPR) Predictor β t [258] 1. Body Appreciation (BAS) .34 4.36* 2. Body Dissatisfaction (BD EDI-2) -.12 -1.50
Overall F [2, 256] = 28.77* Dependent Variable = Reliance on Internal Hunger and Satiety Cues Subscale (IES-RIHSC) Note. *p < .05
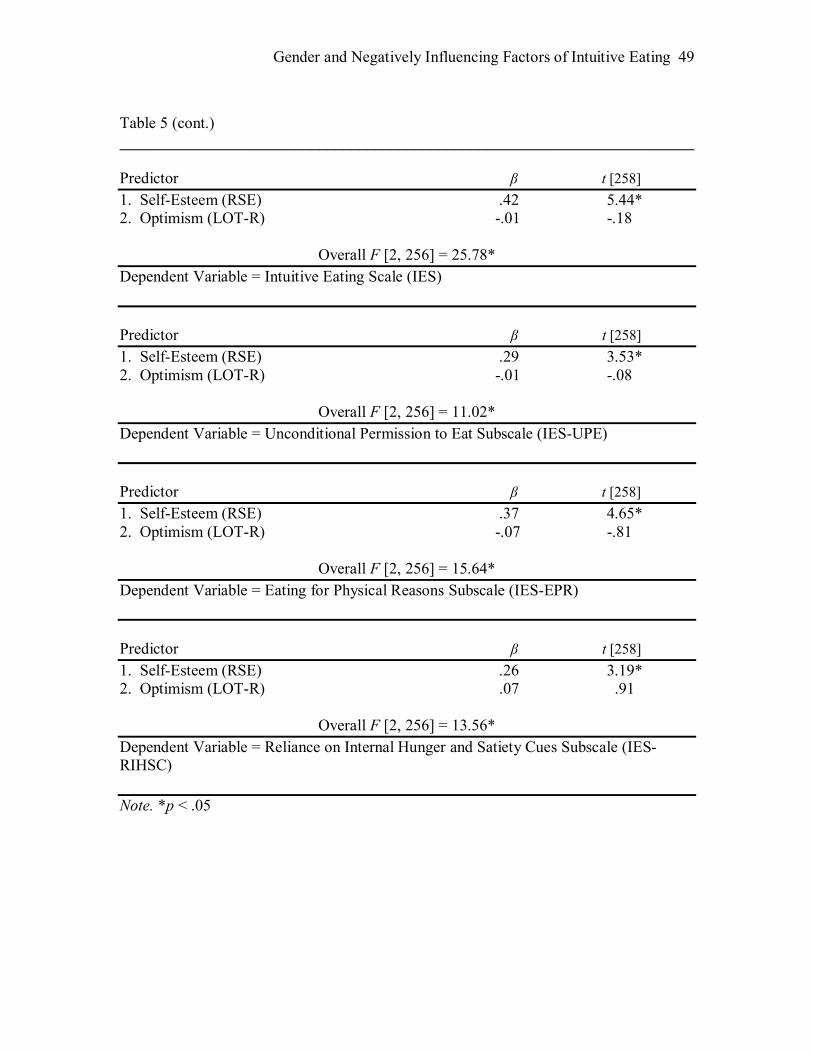
Gender and Negatively Influencing Factors of Intuitive Eating 49
Table 5 (cont.) ________________________________________________________________________ Predictor β t [258] 1. Self-Esteem (RSE) .42 5.44* 2. Optimism (LOT-R) -.01 -.18
Overall F [2, 256] = 25.78* Dependent Variable = Intuitive Eating Scale (IES) Predictor β t [258] 1. Self-Esteem (RSE) .29 3.53* 2. Optimism (LOT-R) -.01 -.08
Overall F [2, 256] = 11.02* Dependent Variable = Unconditional Permission to Eat Subscale (IES-UPE) Predictor β t [258] 1. Self-Esteem (RSE) .37 4.65* 2. Optimism (LOT-R) -.07 -.81
Overall F [2, 256] = 15.64* Dependent Variable = Eating for Physical Reasons Subscale (IES-EPR) Predictor β t [258] 1. Self-Esteem (RSE) .26 3.19* 2. Optimism (LOT-R) .07 .91
Overall F [2, 256] = 13.56* Dependent Variable = Reliance on Internal Hunger and Satiety Cues Subscale (IES-RIHSC) Note. *p < .05

Gender and Negatively Influencing Factors of Intuitive Eating 50
Table 6 Standard Multiple Regression Analyses: Sociocultural Pressures for Thinness Predicting Intuitive Eating Predictor β t [258] 1. Internalization of media messages -.24 -4.04* (SATAQ) 2. Perceived sociocultural pressures -.20 -2.82* For thinness (PSP) 3. Body acceptance by others (BAOS) .25 3.77*
Overall F [3, 255] = 38.88* Dependent Variable = Intuitive Eating Scale (IES) Predictor β t [258] 1. Internalization of media messages -.21 -3.22* (SATAQ) 2. Perceived sociocultural pressures -.27 -3.54* For thinness (PSP) 3. Body acceptance by others (BAOS) .07 .97
Overall F [3, 255] = 22.08* Dependent Variable = Unconditional Permission to Eat Subscale (IES-UPE) Predictor β t [258] 1. Internalization of media messages -.12 -1.84 (SATAQ) 2. Perceived sociocultural pressures -.10 -1.29 For thinness (PSP) 3. Body acceptance by others (BAOS) .27 3.74*
Overall F [3, 255] = 17.43* Dependent Variable = Eating for Physical Reasons Subscale (IES-EPR) Predictor β t [258] 1. Internalization of media messages -.21 -3.09* (SATAQ) 2. Perceived sociocultural pressures .06 .80 For thinness (PSP) 3. Body acceptance by others (BAOS) .30 4.10*
Overall F [3, 255] = 14.95* Dependent Variable = Reliance on Internal Hunger and Satiety Cues Subscale (IES-RIHSC) Note. *p < .05

Gender and Negatively Influencing Factors of Intuitive Eating 51
APPENDIX A
DEMOGRAPHIC DATA FORM Age: Gender: Female Male Ethnic Identification African American Asian American Caucasian/White Native American Latino Other: please specify: Relationship status: Single Married Long term relationship Divorced Other: please specify: Year in School: Freshman-or- high school senior Post-bac Sophomore Graduate student Junior Other Senior Socio-Economic Identification Upper class Middle class Upper-middle class Working class
What is your height? What is your weight?
APPENDIX B

Gender and Negatively Influencing Factors of Intuitive Eating 52
INTUITIVE EATING SCALE
Directions for participants: For each item, please circle the answer that best characterizes your attitudes or behaviors. 1. I try to avoid certain foods high in fat, carbohydrates, or calories. 1 2 3 4 5 Strongly Disagree Disagree Neutral Agree Strongly Agree 2. I stop eating when I feel full (not overstuffed). 1 2 3 4 5 Strongly Disagree Disagree Neutral Agree Strongly Agree 3. I find myself eating when I’m feeling emotional (e.g., anxious, depressed, sad), even when I’m not physically hungry. 1 2 3 4 5 Strongly Disagree Disagree Neutral Agree Strongly Agree 4. If I am craving a certain food, I allow myself to have it. 1 2 3 4 5 Strongly Disagree Disagree Neutral Agree Strongly Agree 5. I follow eating rules or dieting plans that dictate what, when, and/or how much to eat. 1 2 3 4 5 Strongly Disagree Disagree Neutral Agree Strongly Agree 6. I find myself eating when I am bored, even when I’m not physically hungry. 1 2 3 4 5 Strongly Disagree Disagree Neutral Agree Strongly Agree 7. I can tell when I’m slightly full. 1 2 3 4 5 Strongly Disagree Disagree Neutral Agree Strongly Agree 8. I can tell when I’m slightly hungry. 1 2 3 4 5 Strongly Disagree Disagree Neutral Agree Strongly Agree 9. I get mad at myself for eating something unhealthy. 1 2 3 4 5 Strongly Disagree Disagree Neutral Agree Strongly Agree 10. I find myself eating when I am lonely, even when I’m not physically hungry. 1 2 3 4 5 Strongly Disagree Disagree Neutral Agree Strongly Agree
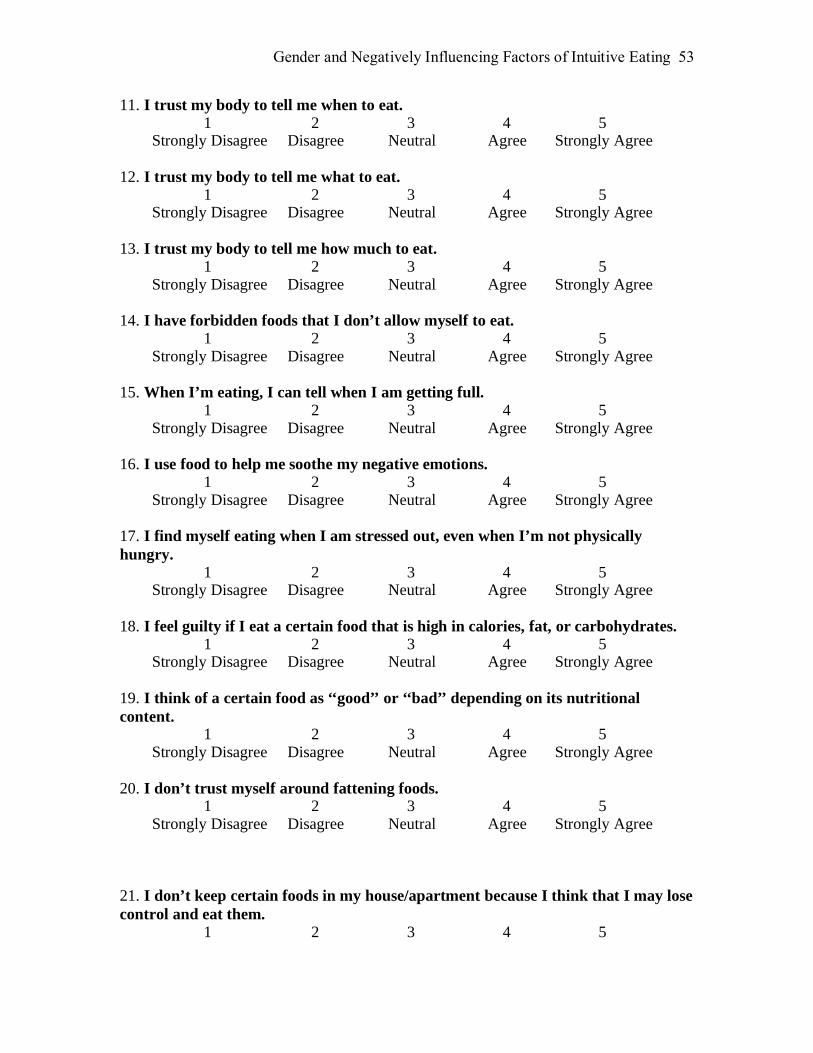
Gender and Negatively Influencing Factors of Intuitive Eating 53
11. I trust my body to tell me when to eat. 1 2 3 4 5 Strongly Disagree Disagree Neutral Agree Strongly Agree 12. I trust my body to tell me what to eat. 1 2 3 4 5 Strongly Disagree Disagree Neutral Agree Strongly Agree 13. I trust my body to tell me how much to eat. 1 2 3 4 5 Strongly Disagree Disagree Neutral Agree Strongly Agree 14. I have forbidden foods that I don’t allow myself to eat. 1 2 3 4 5 Strongly Disagree Disagree Neutral Agree Strongly Agree 15. When I’m eating, I can tell when I am getting full. 1 2 3 4 5 Strongly Disagree Disagree Neutral Agree Strongly Agree 16. I use food to help me soothe my negative emotions. 1 2 3 4 5 Strongly Disagree Disagree Neutral Agree Strongly Agree 17. I find myself eating when I am stressed out, even when I’m not physically hungry. 1 2 3 4 5 Strongly Disagree Disagree Neutral Agree Strongly Agree 18. I feel guilty if I eat a certain food that is high in calories, fat, or carbohydrates. 1 2 3 4 5 Strongly Disagree Disagree Neutral Agree Strongly Agree 19. I think of a certain food as ‘‘good’’ or ‘‘bad’’ depending on its nutritional content. 1 2 3 4 5 Strongly Disagree Disagree Neutral Agree Strongly Agree 20. I don’t trust myself around fattening foods. 1 2 3 4 5 Strongly Disagree Disagree Neutral Agree Strongly Agree 21. I don’t keep certain foods in my house/apartment because I think that I may lose control and eat them. 1 2 3 4 5

Gender and Negatively Influencing Factors of Intuitive Eating 54
Strongly Disagree Disagree Neutral Agree Strongly Agree
APPENDIX C
CAREGIVER EATING MESSAGES SCALE

Gender and Negatively Influencing Factors of Intuitive Eating 55
Directions for participants: For each item, please indicate the degree to which your parents/caregivers emphasized the following behaviors while you were growing up.
1. Told you to eat all the food on your plate. 1 2 3 4 5 6
Always Usually Often Sometimes Rarely Never 2. Made sure you finished all the food that was on your plate.
1 2 3 4 5 6 Always Usually Often Sometimes Rarely Never 3. Made you eat at times you weren�t hungry.
1 2 3 4 5 6 Always Usually Often Sometimes Rarely Never 4. Told you not to eat something that wasn�t healthy.
1 2 3 4 5 6 Always Usually Often Sometimes Rarely Never 5. Told you to eat all your vegetables after you told them that you didn�t want
to eat any more. 1 2 3 4 5 6
Always Usually Often Sometimes Rarely Never 6. Looked at you with raised eyebrows at how much you were eating, making
you feel that you were eating too much. 1 2 3 4 5 6
Always Usually Often Sometimes Rarely Never 7. Commented that you weren�t eating enough.
1 2 3 4 5 6 Always Usually Often Sometimes Rarely Never 8. Commented that you were eating too much.
1 2 3 4 5 6 Always Usually Often Sometimes Rarely Never 9. Made fun of you for eating too much.
1 2 3 4 5 6 Always Usually Often Sometimes Rarely Never 10. Made fun of you for eating too little.
1 2 3 4 5 6 Always Usually Often Sometimes Rarely Never 11. Told you that you couldn�t eat at times you were really hungry.

Gender and Negatively Influencing Factors of Intuitive Eating 56
1 2 3 4 5 6 Always Usually Often Sometimes Rarely Never 12. Told you that you shouldn�t eat certain foods because they will �make you
fat.� 1 2 3 4 5 6
Always Usually Often Sometimes Rarely Never 13. Ate at a specific time each day.
1 2 3 4 5 6 Always Usually Often Sometimes Rarely Never 14. Made you eat despite the fact that you were full.
1 2 3 4 5 6 Always Usually Often Sometimes Rarely Never 15. Put more food on your plate even though you said that you were full.
1 2 3 4 5 6 Always Usually Often Sometimes Rarely Never 16. Used food to reward you for good behavior.
1 2 3 4 5 6 Always Usually Often Sometimes Rarely Never 17. Restricted food to punish you for bad behavior.
1 2 3 4 5 6 Always Usually Often Sometimes Rarely Never 18. Talked about their weight.
1 2 3 4 5 6 Always Usually Often Sometimes Rarely Never 19. Talked about dieting or restricting certain high calorie foods.
1 2 3 4 5 6 Always Usually Often Sometimes Rarely Never 20. I�ve felt acceptance from my family regarding my body shape and/or weight.
1 2 3 4 5 Never Rarely Sometimes Often Always
21. My family has sent me the message that my body shape and weight are fine.
1 2 3 4 5 Never Rarely Sometimes Often Always
22. Overall, when I was growing up, my parents/caregivers were:
1 2 3 4 5 6

Gender and Negatively Influencing Factors of Intuitive Eating 57
Not at all focused Extremely focused on food or weight on food and weight
APPENDIX D
HEALTHY EATING SCALE

Gender and Negatively Influencing Factors of Intuitive Eating 58
Directions for participants: Please circle what, in your opinion, an adaptive diet would include. 1. Whole grain bread, brown rice, whole grain pasta 1 2 3 4 5 Never Rarely Sometimes Often Always 2. Portion size restriction 1 2 3 4 5 Never Rarely Sometimes Often Always 3. White bread, white rice, pasta 1 2 3 4 5 Never Rarely Sometimes Often Always 4. Starchy vegetables (i.e. potatoes) 1 2 3 4 5 Never Rarely Sometimes Often Always 5. Assorted fruits 1 2 3 4 5 Never Rarely Sometimes Often Always 6. No food restriction 1 2 3 4 5 Never Rarely Sometimes Often Always 7. Assorted fibrous vegetables (i.e. broccoli) 1 2 3 4 5 Never Rarely Sometimes Often Always 8. Lean protein 1 2 3 4 5 Never Rarely Sometimes Often Always 9. Dairy products 1 2 3 4 5 Never Rarely Sometimes Often Always 10. Calorie restriction 1 2 3 4 5 Never Rarely Sometimes Often Always 11. Sweets (i.e. ice cream, cake, candy etc.) 1 2 3 4 5 Never Rarely Sometimes Often Always
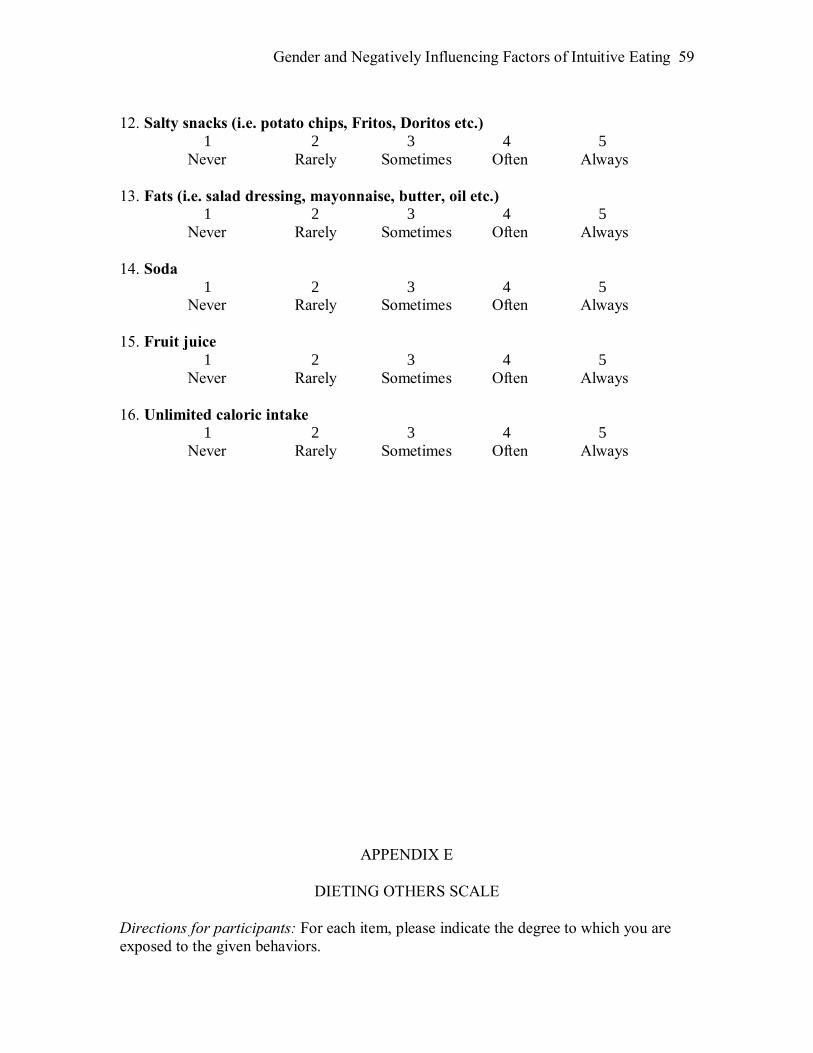
Gender and Negatively Influencing Factors of Intuitive Eating 59
12. Salty snacks (i.e. potato chips, Fritos, Doritos etc.) 1 2 3 4 5 Never Rarely Sometimes Often Always 13. Fats (i.e. salad dressing, mayonnaise, butter, oil etc.) 1 2 3 4 5 Never Rarely Sometimes Often Always 14. Soda 1 2 3 4 5 Never Rarely Sometimes Often Always 15. Fruit juice 1 2 3 4 5 Never Rarely Sometimes Often Always 16. Unlimited caloric intake 1 2 3 4 5 Never Rarely Sometimes Often Always
APPENDIX E
DIETING OTHERS SCALE
Directions for participants: For each item, please indicate the degree to which you are exposed to the given behaviors.
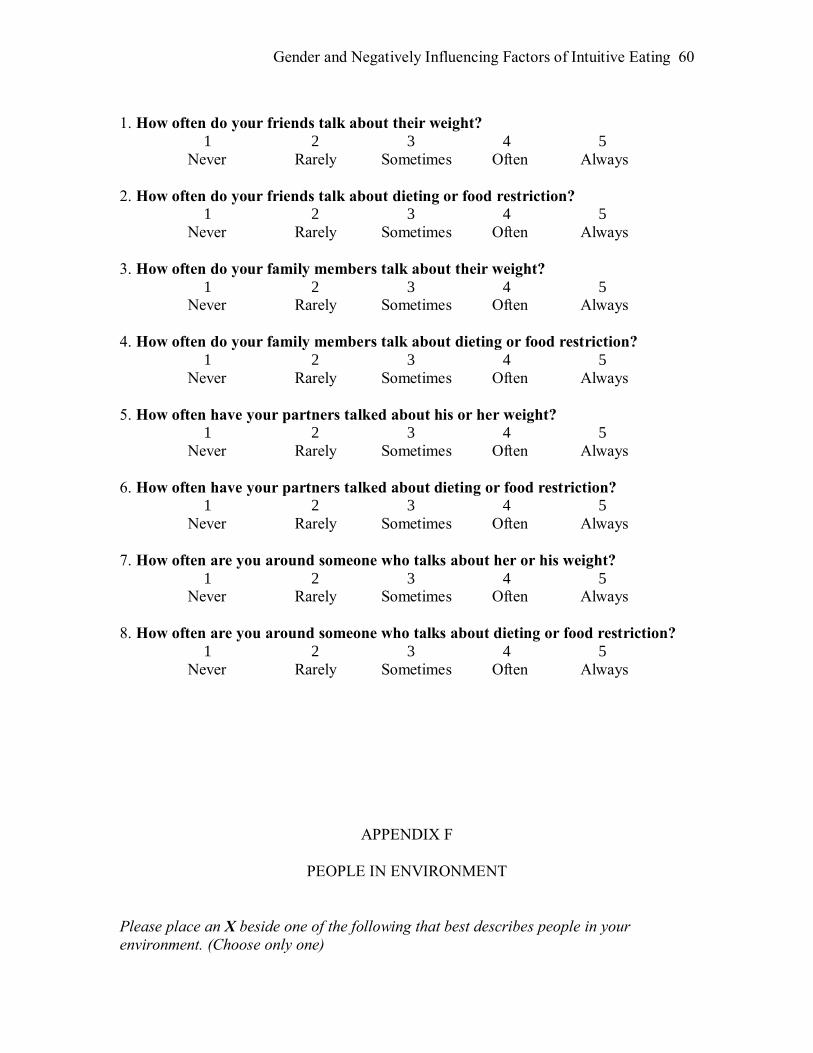
Gender and Negatively Influencing Factors of Intuitive Eating 60
1. How often do your friends talk about their weight? 1 2 3 4 5 Never Rarely Sometimes Often Always 2. How often do your friends talk about dieting or food restriction? 1 2 3 4 5 Never Rarely Sometimes Often Always 3. How often do your family members talk about their weight? 1 2 3 4 5 Never Rarely Sometimes Often Always 4. How often do your family members talk about dieting or food restriction? 1 2 3 4 5 Never Rarely Sometimes Often Always 5. How often have your partners talked about his or her weight? 1 2 3 4 5 Never Rarely Sometimes Often Always 6. How often have your partners talked about dieting or food restriction? 1 2 3 4 5 Never Rarely Sometimes Often Always 7. How often are you around someone who talks about her or his weight? 1 2 3 4 5 Never Rarely Sometimes Often Always 8. How often are you around someone who talks about dieting or food restriction? 1 2 3 4 5 Never Rarely Sometimes Often Always
APPENDIX F
PEOPLE IN ENVIRONMENT Please place an X beside one of the following that best describes people in your environment. (Choose only one)

Gender and Negatively Influencing Factors of Intuitive Eating 61
___1. Overall, people in my environment are never focused on food and weight. ___2. Overall, people in my environment are rarely focused on food and weight. ___3. Overall, people in my environment are sometimes focused on food and weight. ___4. Overall, people in my environment are often focused on food and weight. ___5. Overall, people in my environment are always focused on food and weight.
APPENDIX G
BECK DEPRESSION INVENTORY
In each question, choose one statement from among the group of four statements that describes how you have been feeling during the past few days. Circle the number beside your choice.

Gender and Negatively Influencing Factors of Intuitive Eating 62
Question 1 0 I do not feel sad. 1 I feel sad. 2 I am sad all the time and I can�t snap out of it. 3 I am so sad or unhappy that I can�t stand it. Question 2
0 I am not particularly discouraged about the future. 1 I feel discouraged about the future. 2 I feel I have nothing to look forward to. 3 I feel that the future is hopeless and that things cannot improve.
Question 3
0 I do not feel like a failure. 1 I feel I have failed more than the average person. 2 As I look back on my life, all I can see is a lot of failure. 3 I feel I am a complete failure as a person.
Question 4
0 I get as much satisfaction out of things as I used to. 1 I don�t enjoy things the way I used to. 2 I don�t get any real satisfaction out of anything anymore. 3 I am dissatisfied or bored with everything.
Question 5
0 I don�t feel particularly guilty. 1 I feel guilty a good part of the time. 2 I feel quite guilty most of the time. 3 I feel guilty all of the time.
Question 6
0 I don�t feel I am being punished. 1 I feel I may be punished. 2 I expect to be punished. 3 I feel I am being punished.
Question 7
0 I don�t feel disappointed in myself. 1 I am disappointed in myself. 2 I am disgusted with myself. 3 I hate myself.
Question 8
0 I don�t feel I am any worse than anybody else. 1 I am critical of myself for my weaknesses or mistakes.
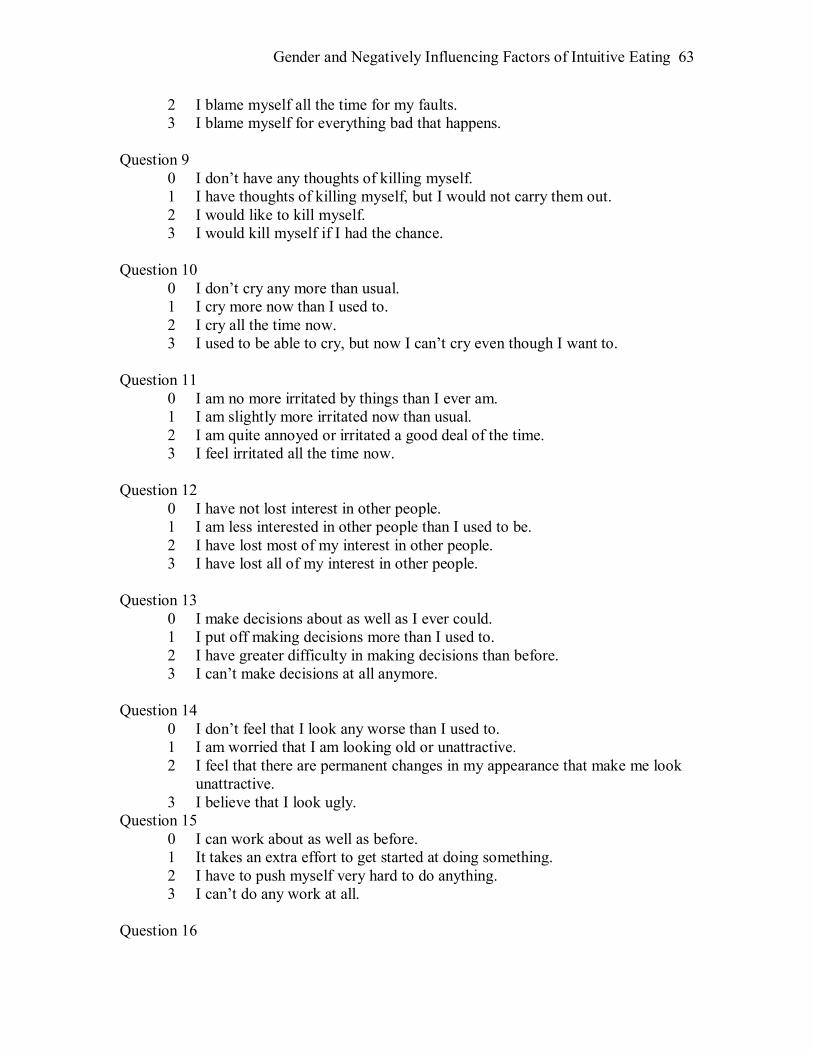
Gender and Negatively Influencing Factors of Intuitive Eating 63
2 I blame myself all the time for my faults. 3 I blame myself for everything bad that happens.
Question 9
0 I don�t have any thoughts of killing myself. 1 I have thoughts of killing myself, but I would not carry them out. 2 I would like to kill myself. 3 I would kill myself if I had the chance.
Question 10
0 I don�t cry any more than usual. 1 I cry more now than I used to. 2 I cry all the time now. 3 I used to be able to cry, but now I can�t cry even though I want to.
Question 11
0 I am no more irritated by things than I ever am. 1 I am slightly more irritated now than usual. 2 I am quite annoyed or irritated a good deal of the time. 3 I feel irritated all the time now.
Question 12
0 I have not lost interest in other people. 1 I am less interested in other people than I used to be. 2 I have lost most of my interest in other people. 3 I have lost all of my interest in other people.
Question 13
0 I make decisions about as well as I ever could. 1 I put off making decisions more than I used to. 2 I have greater difficulty in making decisions than before. 3 I can�t make decisions at all anymore.
Question 14
0 I don�t feel that I look any worse than I used to. 1 I am worried that I am looking old or unattractive. 2 I feel that there are permanent changes in my appearance that make me look
unattractive. 3 I believe that I look ugly.
Question 15 0 I can work about as well as before. 1 It takes an extra effort to get started at doing something. 2 I have to push myself very hard to do anything. 3 I can�t do any work at all.
Question 16

Gender and Negatively Influencing Factors of Intuitive Eating 64
0 I can sleep as well as usual. 1 I don�t sleep as well as I used to. 2 I wake up 1 � 2 hours earlier than usual and find it hard to get back to sleep. 3 I wake up several hours earlier than I used to and cannot get back to sleep.
Question 17
0 I don�t get more tired than usual. 1 I get tired more easily than I used to. 2 I get tired from doing almost anything. 3 I am too tired to do anything.
Question 18
0 My appetite is no worse than usual. 1 My appetite is not as good as it used to be. 2 My appetite is much worse now. 3 I have no appetite at all anymore.
Question 19 (Circle 0 if you have been purposely trying to lose weight)
0 I haven�t lost much weight, if any, lately. 1 I have lost more than five pounds. 2 I have lost more than 10 pounds. 3 I have lost more than 15 pounds.
Question 20
0 I am no more worried about my health than usual. 1 I am worried about physical problems such as aches and pains, or upset
stomach, or constipation. 2 I am very worried about physical problems, and it�s hard to think of much
else. 3 I am so worried about my physical problems that I cannot think about
anything else. Question 21
0 I have not noticed any recent change in my interest in sex. 1 I am less interested in sex than I used to be. 2 I am much less interested in sex now. 3 I have lost interest in sex completely.
APPENDIX H
BODY APPRECIATION SCALE
1. I respect my body.
1 2 3 4 5 Never Seldom Sometimes Often Always

Gender and Negatively Influencing Factors of Intuitive Eating 65
2. I feel good about my body.
1 2 3 4 5 Never Seldom Sometimes Often Always
3. On the whole, I am satisfied with my body. 1 2 3 4 5
Never Seldom Sometimes Often Always
4. Despite its flaws, I accept my body for what it is. 1 2 3 4 5
Never Seldom Sometimes Often Always
5. I feel that my body has at least some good qualities. 1 2 3 4 5
Never Seldom Sometimes Often Always
6. I take a positive attitude towards my body. 1 2 3 4 5
Never Seldom Sometimes Often Always 7. I am attentive to my body�s needs.
1 2 3 4 5 Never Seldom Sometimes Often Always
8. My self worth is independent of my body shape or weight.
1 2 3 4 5 Never Seldom Sometimes Often Always
9. I do not focus a lot of energy being concerned with my weight or body shape. 1 2 3 4 5
Never Seldom Sometimes Often Always 10. My feelings toward my body are positive, for the most part.
1 2 3 4 5 Never Seldom Sometimes Often Always
11. I engage in healthy behaviors to take care of my body. 1 2 3 4 5
Never Seldom Sometimes Often Always 12. I do not allow unrealistically thin images of women presented in the media to affect my attitudes toward my body.
1 2 3 4 5 Never Seldom Sometimes Often Always
13. Despite its imperfections, I still like my body.

Gender and Negatively Influencing Factors of Intuitive Eating 66
1 2 3 4 5 Never Seldom Sometimes Often Always
APPENDIX I
ALMOST PERFECT SCALE-REVISED
Indicate your agreement with each statement by writing the number in the space provided, using the following rating scale:
Strongly Slightly Neither Agree Slightly Strongly

Gender and Negatively Influencing Factors of Intuitive Eating 67
Disagree Disagree Disagree Nor Disagree Agree Agree Agree 1 2 3 4 5 6 7
___ 1. I often feel frustrated because I can’t meet my goals
___ 2. My best just never seems good enough for me
___ 3. I rarely live up to my high standards
___ 4. Doing my best never seems to be enough
___ 5. I am never satisfied with my accomplishments
___ 6. I often worry about not measuring up to my own expectations
___ 7. My performance rarely measures up to my standards
___ 8. I am not satisfied even when I know I have done my best
___ 9. I am seldom able to meet my own high standards for performance
___ 10. I am hardly ever satisfied with my performance
___ 11. I hardly ever feel that what I’ve done is good enough
___ 12. I often feel disappointed after completing a task because I know I could have done better
___ 13. I have high standards for my performance at work or school
___ 14. If you don’t expect much out of yourself you will never succeed
___ 15. I have high expectations for myself
___ 16. I set very high standards for myself
___ 17. I expect the best from myself
___ 18. I try to do my best at everything I do
___ 19. I have a strong need to strive for excellence
___ 20. I am an orderly person
___ 21. Neatness is important to me
___ 22. I think things should be put away in their place
___ 23. I like to always be organized and disciplined
APPENDIX J
ROSENBERG SELF-ESTEEM SCALE
1. I feel that I am a person of worth, at least on an equal plane with others.
1 2 3 4 Strongly Disagree Disagree Agree Strongly Agree
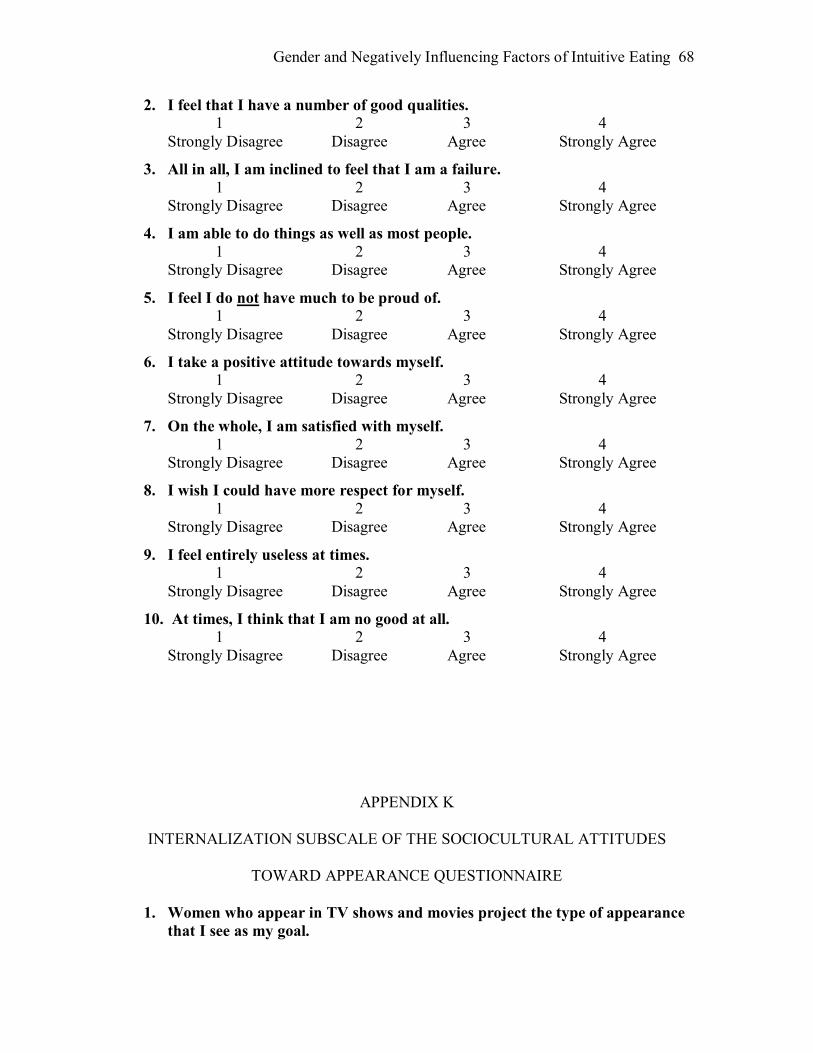
Gender and Negatively Influencing Factors of Intuitive Eating 68
2. I feel that I have a number of good qualities. 1 2 3 4
Strongly Disagree Disagree Agree Strongly Agree
3. All in all, I am inclined to feel that I am a failure. 1 2 3 4
Strongly Disagree Disagree Agree Strongly Agree
4. I am able to do things as well as most people. 1 2 3 4
Strongly Disagree Disagree Agree Strongly Agree
5. I feel I do not have much to be proud of. 1 2 3 4
Strongly Disagree Disagree Agree Strongly Agree
6. I take a positive attitude towards myself. 1 2 3 4
Strongly Disagree Disagree Agree Strongly Agree
7. On the whole, I am satisfied with myself. 1 2 3 4
Strongly Disagree Disagree Agree Strongly Agree
8. I wish I could have more respect for myself. 1 2 3 4
Strongly Disagree Disagree Agree Strongly Agree
9. I feel entirely useless at times. 1 2 3 4
Strongly Disagree Disagree Agree Strongly Agree
10. At times, I think that I am no good at all. 1 2 3 4
Strongly Disagree Disagree Agree Strongly Agree
APPENDIX K
INTERNALIZATION SUBSCALE OF THE SOCIOCULTURAL ATTITUDES
TOWARD APPEARANCE QUESTIONNAIRE
1. Women who appear in TV shows and movies project the type of appearance that I see as my goal.

Gender and Negatively Influencing Factors of Intuitive Eating 69
1 2 3 4 5 Definitely Mostly Neither agree Mostly Definitely disagree disagree nor disagree agree agree
2. I believe that clothes look better on thin models.
1 2 3 4 5 Definitely Mostly Neither agree Mostly Definitely disagree disagree nor disagree agree agree
3. Music videos that show thin models make me wish that I were thin. 1 2 3 4 5 Definitely Mostly Neither agree Mostly Definitely disagree disagree nor disagree agree agree
4. I do not wish to look like the models in magazines.
1 2 3 4 5 Definitely Mostly Neither agree Mostly Definitely disagree disagree nor disagree agree agree
5. I tend to compare my body to people in magazines and on TV. 1 2 3 4 5 Definitely Mostly Neither agree Mostly Definitely disagree disagree nor disagree agree agree
6. Photographs of thin women make me wish that I were thin.
1 2 3 4 5 Definitely Mostly Neither agree Mostly Definitely disagree disagree nor disagree agree agree
7. I wish I looked like a swimsuit model.
1 2 3 4 5 Definitely Mostly Neither agree Mostly Definitely disagree disagree nor disagree agree agree
8. I often read magazines like Cosmopolitan, Vogue, and Glamour and compare
my appearance to the models. 1 2 3 4 5 Definitely Mostly Neither agree Mostly Definitely disagree disagree nor disagree agree agree
APPENDIX L
PERCEIVED SOCIOCULTURAL PRESSURES SCALE 1. I�ve felt pressure from my friends to lose weight.
1 2 3 4 5 Never Seldom Sometimes Often Always

Gender and Negatively Influencing Factors of Intuitive Eating 70
2. I�ve noticed a strong message from my friends to have a thin body. 1 2 3 4 5
Never Seldom Sometimes Often Always 3. I�ve felt pressure from my family to lose weight.
1 2 3 4 5 Never Seldom Sometimes Often Always 4. I�ve noticed a strong message from my family to have a thin body.
1 2 3 4 5 Never Seldom Sometimes Often Always 5. I�ve felt pressure from people I�ve dated to lose weight.
1 2 3 4 5 Never Seldom Sometimes Often Always 6. I�ve noticed a strong message from people I�ve dated to have a thin body.
1 2 3 4 5 Never Seldom Sometimes Often Always 7. I�ve felt pressure from the media (e.g., TV, magazines) to lose weight.
1 2 3 4 5 Never Seldom Sometimes Often Always 8. I�ve noticed a strong message from the media to have a thin body.
1 2 3 4 5 Never Seldom Sometimes Often Always
APPENDIX M
POSITIVE AND NEGATIVE AFFECT SCALE This scale consists of a number of words and phrases that describe different feelings and emotions. Read each item and then write the number in the space provided next to that word. Indicate to what extent you have felt this way in general, that is, on average. Use the following scale:
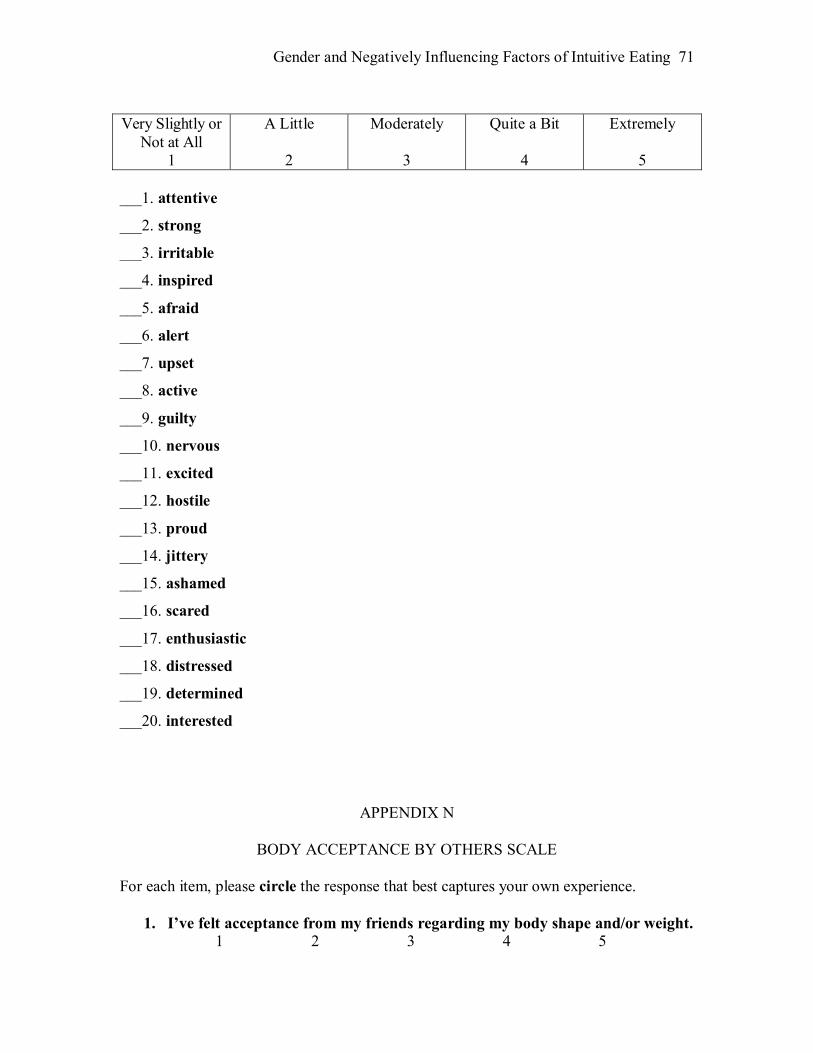
Gender and Negatively Influencing Factors of Intuitive Eating 71
Very Slightly or
Not at All 1
A Little
2
Moderately
3
Quite a Bit
4
Extremely
5 ___1. attentive
___2. strong
___3. irritable
___4. inspired
___5. afraid
___6. alert
___7. upset
___8. active
___9. guilty
___10. nervous
___11. excited
___12. hostile
___13. proud
___14. jittery
___15. ashamed
___16. scared
___17. enthusiastic
___18. distressed
___19. determined
___20. interested
APPENDIX N
BODY ACCEPTANCE BY OTHERS SCALE For each item, please circle the response that best captures your own experience.
1. I�ve felt acceptance from my friends regarding my body shape and/or weight. 1 2 3 4 5

Gender and Negatively Influencing Factors of Intuitive Eating 72
Never Rarely Sometimes Often Always 2. My friends have sent me the message that my body shape and weight are
fine. 1 2 3 4 5
Never Rarely Sometimes Often Always
3. I�ve felt acceptance from my family regarding my body shape and/or weight. 1 2 3 4 5
Never Rarely Sometimes Often Always 4. My family has sent me the message that my body shape and weight are fine.
1 2 3 4 5 Never Rarely Sometimes Often Always
5. I�ve felt acceptance from people I�ve dated regarding my body shape and/or
weight. 1 2 3 4 5
Never Rarely Sometimes Often Always
6. People I�ve dated have sent me the message that my body shape and weight are fine.
1 2 3 4 5 Never Rarely Sometimes Often Always
7. I�ve felt acceptance from the media (e.g., TV, magazines) regarding my body shape and/or weight.
1 2 3 4 5 Never Rarely Sometimes Often Always
8. I feel that the media have sent me the message that my body shape and weight are fine.
1 2 3 4 5 Never Rarely Sometimes Often Always
9. I�ve felt acceptance from society (e.g., school, church, social settings) regarding my body shape and/or weight.
1 2 3 4 5 Never Rarely Sometimes Often Always
10. I feel that society has sent me the message that my body shape and weight are fine.
1 2 3 4 5 Never Rarely Sometimes Often Always

Gender and Negatively Influencing Factors of Intuitive Eating 73
APPENDIX O
BODY DISSATISFACTION SUBSCALE OF THE EATING DISORDER INVENTORY-2
Please indicate on this scale whether the question is true about you always, usually, often, sometimes, rarely, or never.

Gender and Negatively Influencing Factors of Intuitive Eating 74
1. I think that my stomach is too big. 1 2 3 4 5 6 Always Usually Often Sometimes Rarely Never 2. I think that my thighs are too large.
1 2 3 4 5 6 Always Usually Often Sometimes Rarely Never 3. I think that my stomach is just the right size.
1 2 3 4 5 6 Always Usually Often Sometimes Rarely Never 4. I feel satisfied with the shape of my body.
1 2 3 4 5 6 Always Usually Often Sometimes Rarely Never 5. I like the shape of my buttocks.
1 2 3 4 5 6 Always Usually Often Sometimes Rarely Never 6. I think that my hips are too big.
1 2 3 4 5 6 Always Usually Often Sometimes Rarely Never 7. I think that my thighs are just the right size.
1 2 3 4 5 6 Always Usually Often Sometimes Rarely Never 8. I think that my buttocks are too large.
1 2 3 4 5 6 Always Usually Often Sometimes Rarely Never 9. I think that my hips are just the right size.
1 2 3 4 5 6 Always Usually Often Sometimes Rarely Never
APPENDIX P
LIFE ORIENTATION TEST-REVISED (OPTIMISM) For each item, please circle the response that best reflects your agreement with the statement.
1. In uncertain times, I usually expect the best.
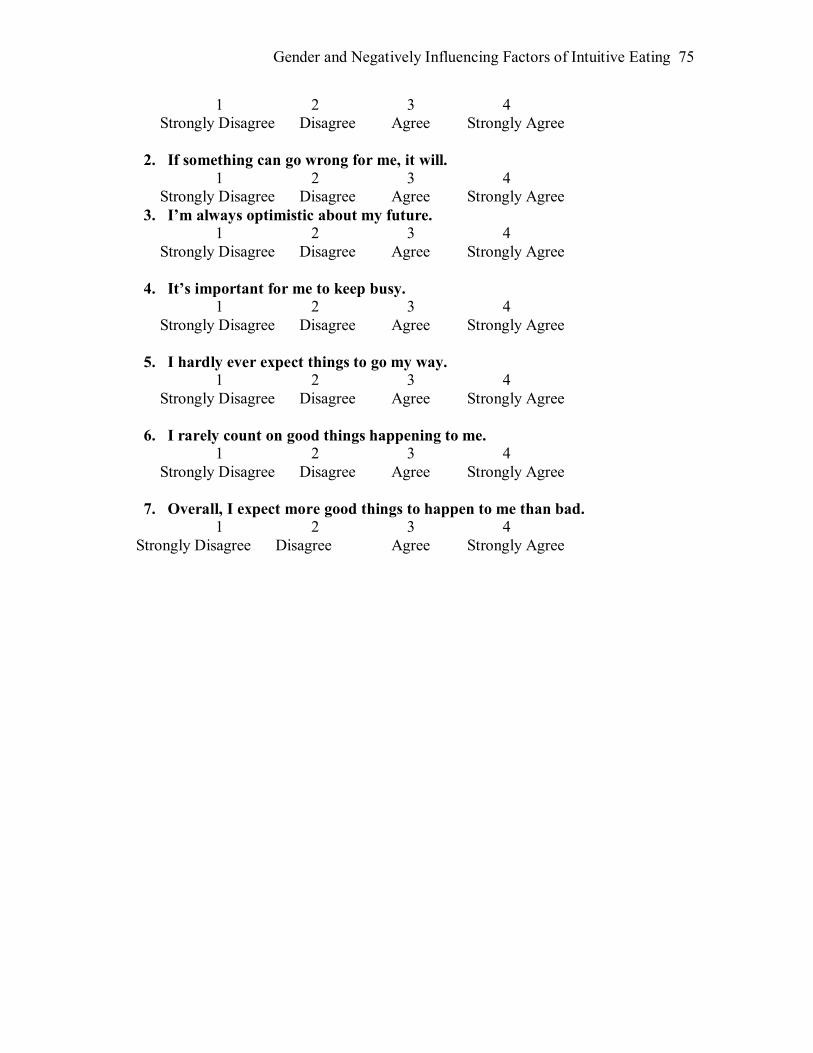
Gender and Negatively Influencing Factors of Intuitive Eating 75
1 2 3 4 Strongly Disagree Disagree Agree Strongly Agree
2. If something can go wrong for me, it will.
1 2 3 4 Strongly Disagree Disagree Agree Strongly Agree 3. I�m always optimistic about my future.
1 2 3 4 Strongly Disagree Disagree Agree Strongly Agree
4. It�s important for me to keep busy.
1 2 3 4 Strongly Disagree Disagree Agree Strongly Agree 5. I hardly ever expect things to go my way.
1 2 3 4 Strongly Disagree Disagree Agree Strongly Agree 6. I rarely count on good things happening to me.
1 2 3 4 Strongly Disagree Disagree Agree Strongly Agree 7. Overall, I expect more good things to happen to me than bad.
1 2 3 4 Strongly Disagree Disagree Agree Strongly Agree