Gender and Monitoring & Evaluation - Asian … and Monitoring & Evaluation Samantha Hung ... To...
38
Gender and Monitoring & Evaluation Samantha Hung Senior Social Development Specialist (Gender and Development) The views expressed in this presentation are the views of the author and do not necessarily reflect the views or policies of the Asian Development Bank ADB), or its Board of Governors, or the governments they represent. ADB does not guarantee the accuracy of the data included in this paper and accepts no responsibility for any consequence of their use. The countries listed in this paper do not imply any view on ADB's part as to sovereignty or independent status or necessarily conform to ADB's terminology
Transcript of Gender and Monitoring & Evaluation - Asian … and Monitoring & Evaluation Samantha Hung ... To...
Gender and Monitoring & Evaluation
Samantha HungSenior Social Development
Specialist (Gender and Development)
The views expressed in this presentation are the views of the author and do not necessarily reflect the views or policies of the Asian Development Bank ADB), or its Board of Governors, or the governments they represent. ADB does not guarantee the accuracy of the data included in this paper and accepts no responsibility for any consequence of their use. The countries listed in this paper do not imply any view on ADB's part as to sovereignty or independent status or necessarily conform to ADB's terminology

Outline of Presentation
• Importance of gender M&E?
• Gender statistics cycle
• Knowledge gaps
• Using gender data to inform policy
• Challenges
• Linking to international initiatives

“Nowadays women have the same opportunities as
men. So where is the problem?”
“All our data are sex-disaggregated
anyway. What’s theproblem?”
“Business statistics have
nothing to do with gender.”
“There is no issue.”
“Gender statistics is not a statistical field, what is special about
it?”
“The role of women is not an issue in our country.
We have resource constraints and we need to concentrate on other
areas.”
“We do not want to overburden the respondents.”
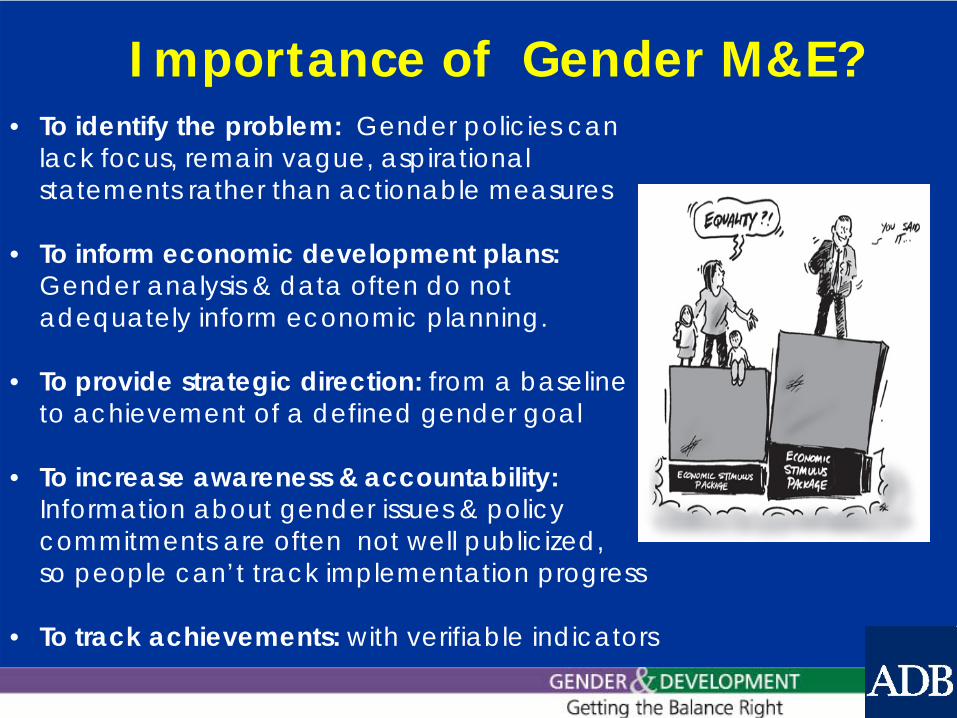
Importance of Gender M&E?• To identify the problem: Gender policies can
lack focus, remain vague, aspirational statements rather than actionable measures
• To inform economic development plans: Gender analysis & data often do not adequately inform economic planning.
• To provide strategic direction: from a baseline to achievement of a defined gender goal
• To increase awareness & accountability: Information about gender issues & policy commitments are often not well publicized, so people can’t track implementation progress
• To track achievements: with verifiable indicators
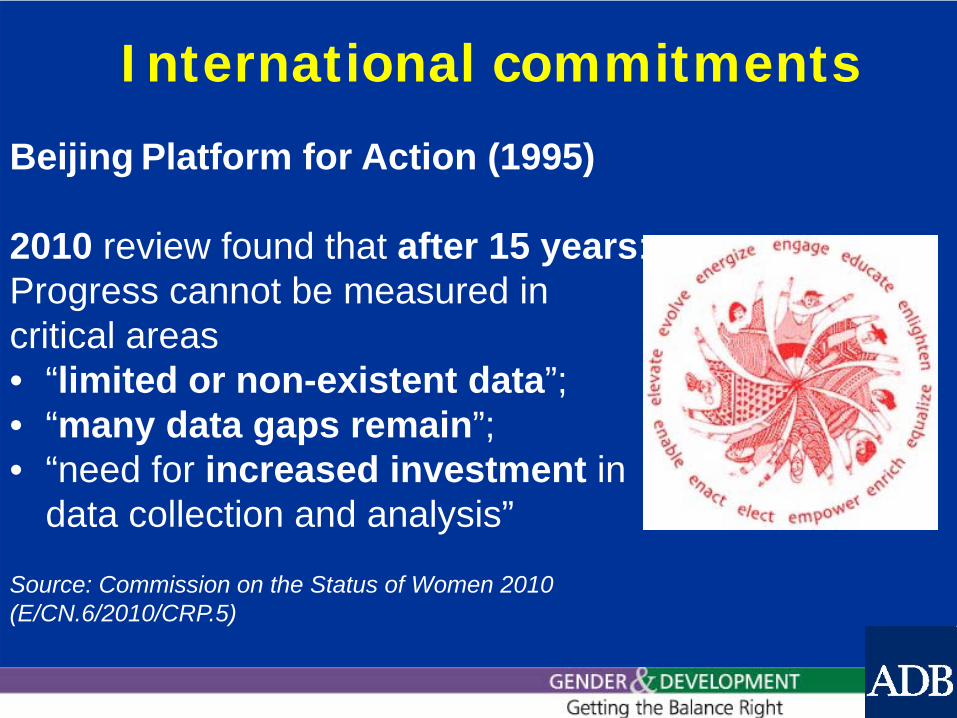
International commitments
Beijing Platform for Action (1995)
2010 review found that after 15 years:Progress cannot be measured in critical areas • “limited or non-existent data”;• “many data gaps remain”;• “need for increased investment in
data collection and analysis”
Source: Commission on the Status of Women 2010 (E/CN.6/2010/CRP.5)

Busan - 4th HLF on Aid EffectivenessForum declaration commits countries & developmentpartners “to collect, disseminate, harmonize and make full use of sex-disaggregated data to inform policy… ”
Busan Action Plan for Statistics –Commits to fully mainstreaming gender mainstreaming into national statistical systems
Address weaknesses in sex-disaggregated data among others as a priority initiative
Recent International Commitments

Evidence-based Policy Making & Budgeting for Gender Equality
Plan for Development Results for Men
and Women
Budget for Results
Implement for ResultsMonitor Results
Evaluate Results We need data & indicators for
planning, budgeting
monitoring & evaluation!
National Gender Equality Goals formulated

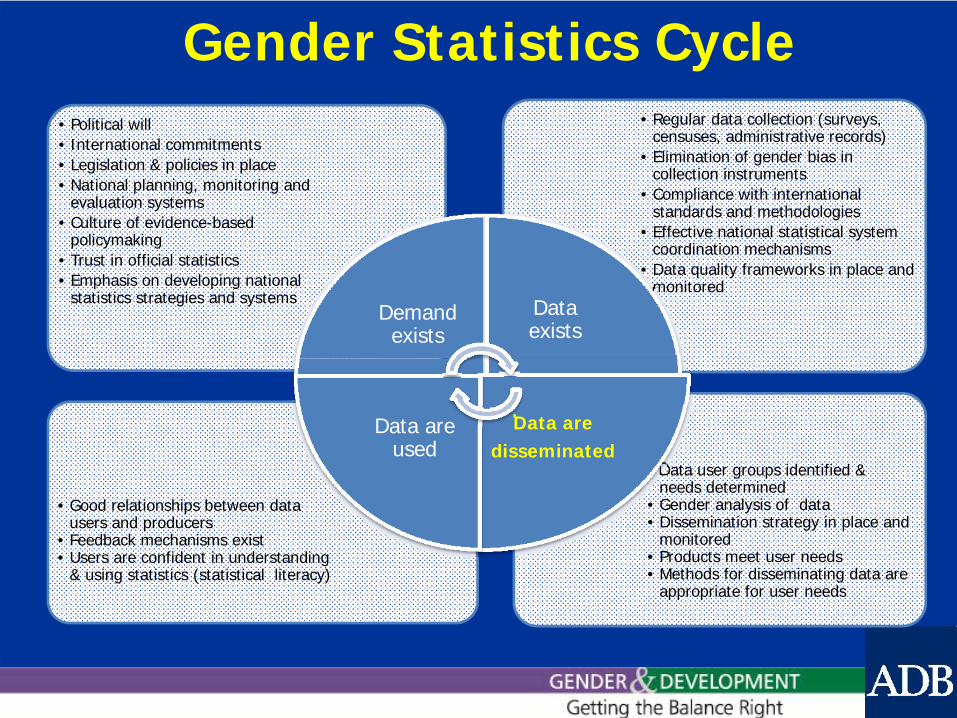
Gender Statistics Cycle
• Data user groups identified & needs determined
• Gender analysis of data• Dissemination strategy in place and
monitored• Products meet user needs• Methods for disseminating data are
appropriate for user needs
• Good relationships between data users and producers
• Feedback mechanisms exist• Users are confident in understanding
& using statistics (statistical literacy)
• Regular data collection (surveys, censuses, administrative records)
• Elimination of gender bias in collection instruments
• Compliance with international standards and methodologies
• Effective national statistical system coordination mechanisms
• Data quality frameworks in place and monitored
• Political will• International commitments• Legislation & policies in place • National planning, monitoring and
evaluation systems• Culture of evidence-based
policymaking• Trust in official statistics • Emphasis on developing national
statistics strategies and systemsDemand
existsData exists
Data are disseminated
Data are used

Provincial
National commitments
International commitments
Flow of data
• Monitoring and Evaluation• Public Policy• International Reporting
• CEDAW• Beijing
Platform• MDGs
• Gender Equality Laws
• Economic Growth Strategies
Demand Exists: National & International level
GRB

10
Data exists: MDG3 Gender Equality & Empowerment of Women
Gender parity in primary, secondary & tertiary education
Data availability: Primary (65% of countries); Secondary (52%of countries); Tertiary (46% of countries) had data from 2009onwards
Even if achieved, often find that data: • Incomplete coverage - Private schools often not covered• Possible misreporting (over-reporting) of enrollments• Unreliable or incomplete data on age of students• Unreliable or incomplete estimates of sub-national levelpopulation – provincial, rural–urban, etc.
• Differences between national & international data
11
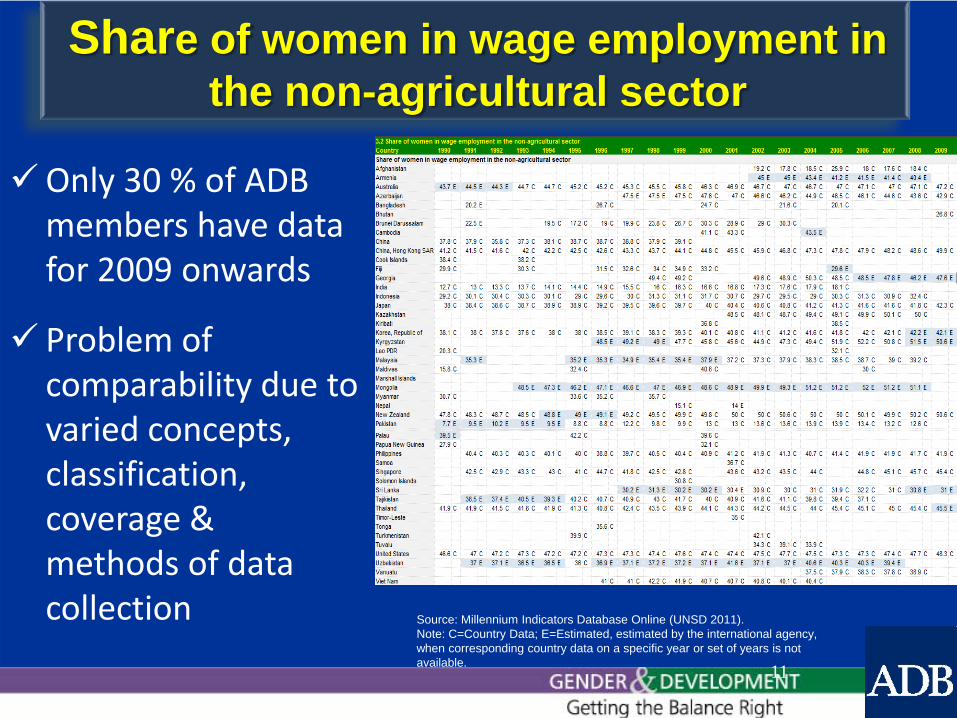
Share of women in wage employment in the non-agricultural sector
Only 30 % of ADB members have data for 2009 onwards
Problem of comparability due to varied concepts, classification, coverage & methods of data collection Source: Millennium Indicators Database Online (UNSD 2011).
Note: C=Country Data; E=Estimated, estimated by the international agency, when corresponding country data on a specific year or set of years is not available.

12
MDG3 - representation in parliament
Women continue to be underrepresented in national parliaments - slow upward movement.
0
2
4
6
8
10
12
14
16
1990 1997 1998 1999 2000 2001 2002 2003 2004 2005 2006 2007 2008 2009 2010 2011
perc
ent
Average percent of seats held by women in National Parliament, Developed and Developing Member Economies: 1990 - 2011
Source. : Millennium Indicators Database Online (UNSD 2011) accessed 6 June 2012.

Challenges to national demand
• Institutional support & mechanisms • Explicit legislative requirement? • Clear mandate in NSDS?• Awareness on gender equality & women’s
rights, among decision-makers & public?• Need for capacity building & training?• Low priority for gender statistics, and as a
result, insufficient financial & human resources
? Do these apply in Malaysian context?

Gender Statistics Cycle
• Data user groups identified & needs determined
• Gender analysis of data• Dissemination strategy in place and
monitored• Products meet user needs• Methods for disseminating data are
appropriate for user needs
• Good relationships between data users and producers
• Feedback mechanisms exist• Users are confident in understanding
& using statistics (statistical literacy)
• Regular data collection (surveys, censuses, administrative records)
• Elimination of gender bias in collection instruments
• Compliance with international standards and methodologies
• Effective national statistical system coordination mechanisms
• Data quality frameworks in place and monitored
• Political will• International commitments• Legislation & policies in place • National planning, monitoring and
evaluation systems• Culture of evidence-based
policymaking• Trust in official statistics • Emphasis on developing national
statistics strategies and systemsDemand exists
Data exists
Data are disseminated
Data are used
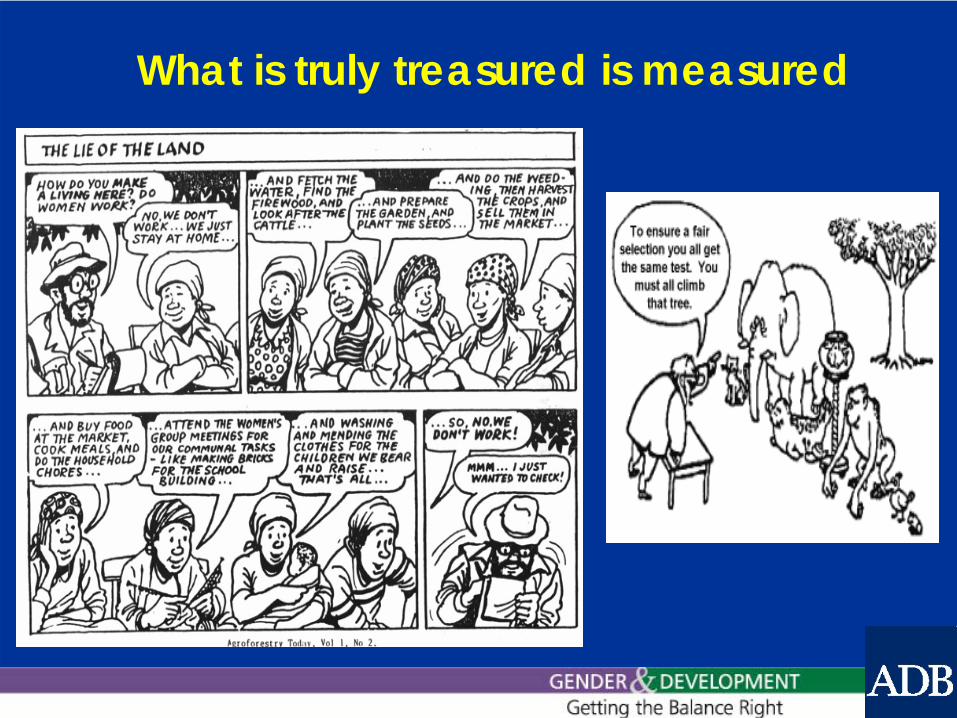
What is truly treasured is measured

16
Data exists: Sorting out terms
• Sex-disaggregated data
• Indicators & gender indicators
• Goals, targets & indicators• Assemble data into a large
number of statistics• They don’t act as gender
indicators until we use them
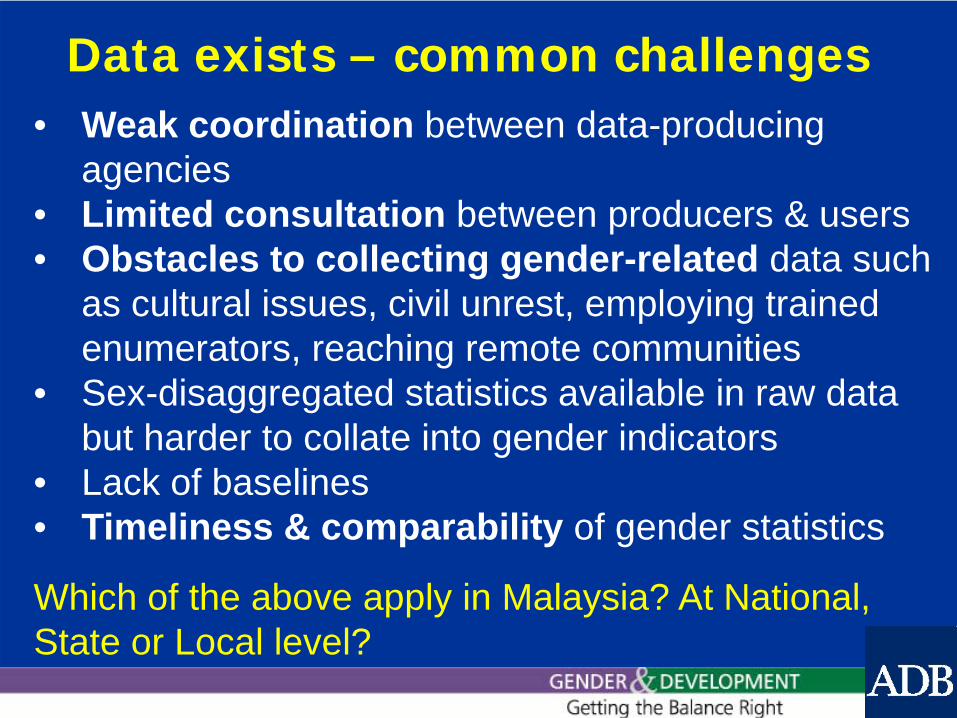
Data exists – common challenges• Weak coordination between data-producing
agencies• Limited consultation between producers & users• Obstacles to collecting gender-related data such
as cultural issues, civil unrest, employing trained enumerators, reaching remote communities
• Sex-disaggregated statistics available in raw data but harder to collate into gender indicators
• Lack of baselines• Timeliness & comparability of gender statistics
Which of the above apply in Malaysia? At National,State or Local level?

18
More numbers needed to complete HERstory – common ‘problem’ dataMajor Data constraints to provide evidence
for public policies related to gender equality:Violence against womenUnpaid work, care economy & time use/povertyHousehold ‘headship’Intra‐household allocationOccupation, wages, unemployment, informal employment, decision making in private sectorEntrepreneurshipHousehold decision making & ownership of assetsAttitudinal change

Strategies to produce gender data – Regular multi-purpose household surveys:
• Sex -disaggregation on earnings, asset ownership, informal & self-employment
– Leverage Demographic & Health Surveys• Key data source for many gender issues,
including health, education, bargaining power, fertility & mortality
– Irregular time use surveys: • Identify gender time constraints
– Universal vital registration & ID system• Register all births & deaths• Analyze this data
19
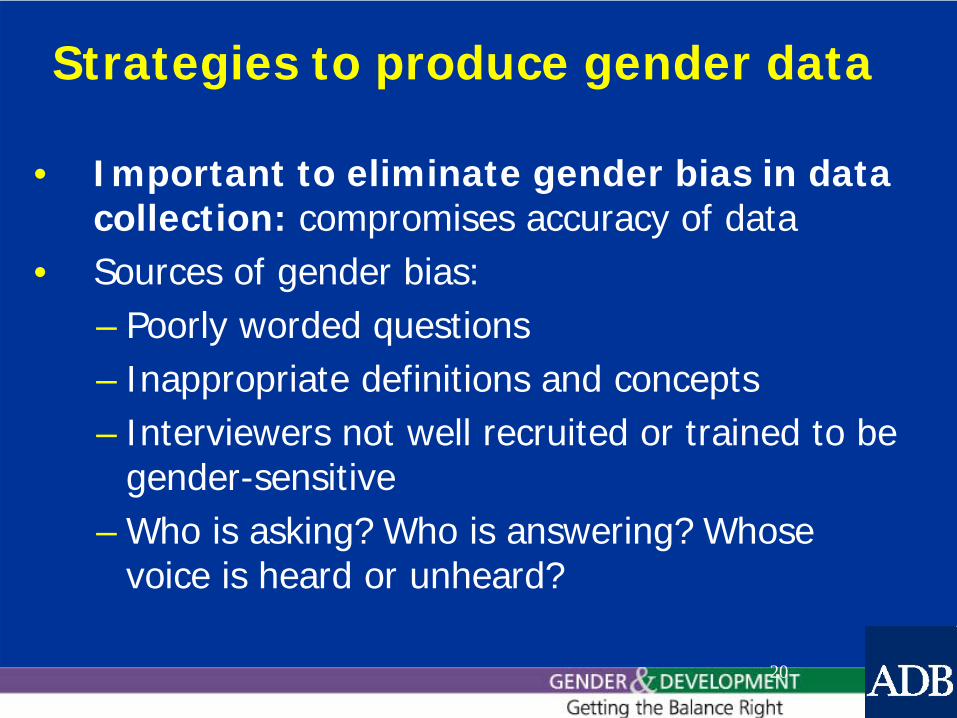
Strategies to produce gender data
• Important to eliminate gender bias in data collection: compromises accuracy of data
• Sources of gender bias:– Poorly worded questions– Inappropriate definitions and concepts– Interviewers not well recruited or trained to be
gender-sensitive– Who is asking? Who is answering? Whose
voice is heard or unheard?
20
Gender Statistics Cycle
• Data user groups identified & needs determined
• Gender analysis of data• Dissemination strategy in place and
monitored• Products meet user needs• Methods for disseminating data are
appropriate for user needs
• Good relationships between data users and producers
• Feedback mechanisms exist• Users are confident in understanding
& using statistics (statistical literacy)
• Regular data collection (surveys, censuses, administrative records)
• Elimination of gender bias in collection instruments
• Compliance with international standards and methodologies
• Effective national statistical system coordination mechanisms
• Data quality frameworks in place and monitored
• Political will• International commitments• Legislation & policies in place • National planning, monitoring and
evaluation systems• Culture of evidence-based
policymaking• Trust in official statistics • Emphasis on developing national
statistics strategies and systemsDemand exists
Data exists
Data are disseminated
Data are used
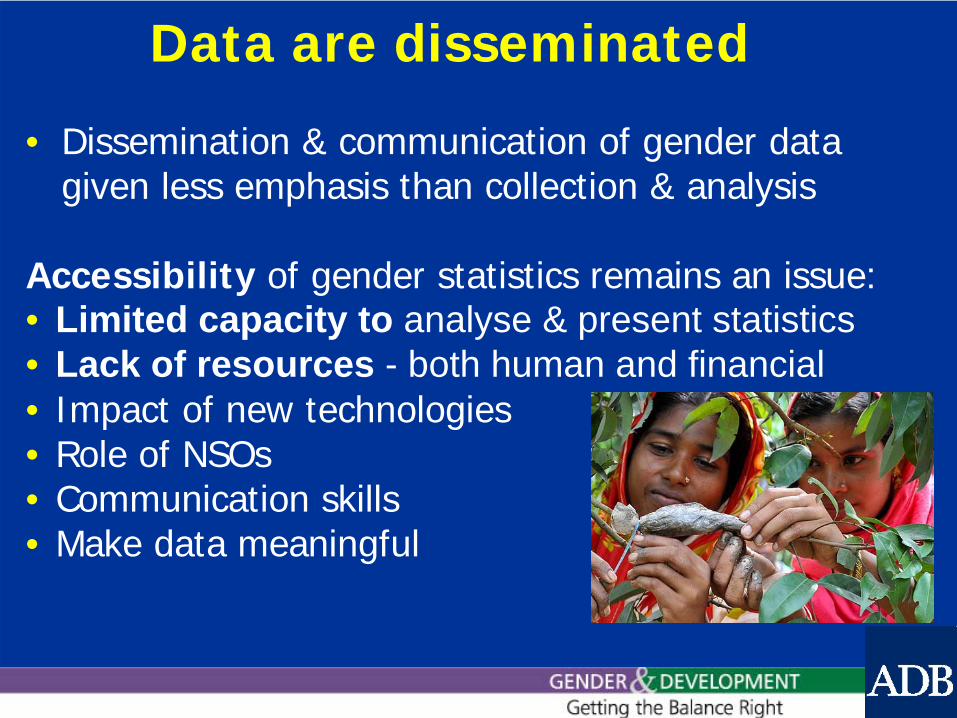
Data are disseminated
• Dissemination & communication of gender data given less emphasis than collection & analysis
Accessibility of gender statistics remains an issue:• Limited capacity to analyse & present statistics• Lack of resources - both human and financial• Impact of new technologies• Role of NSOs• Communication skills• Make data meaningful


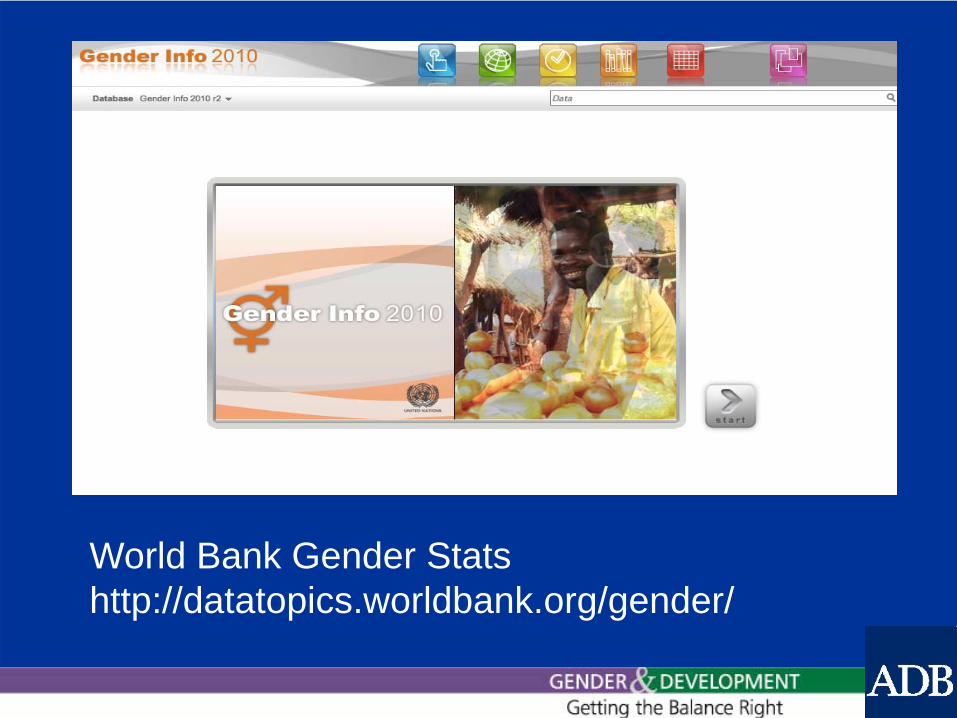
World Bank Gender Stats http://datatopics.worldbank.org/gender/
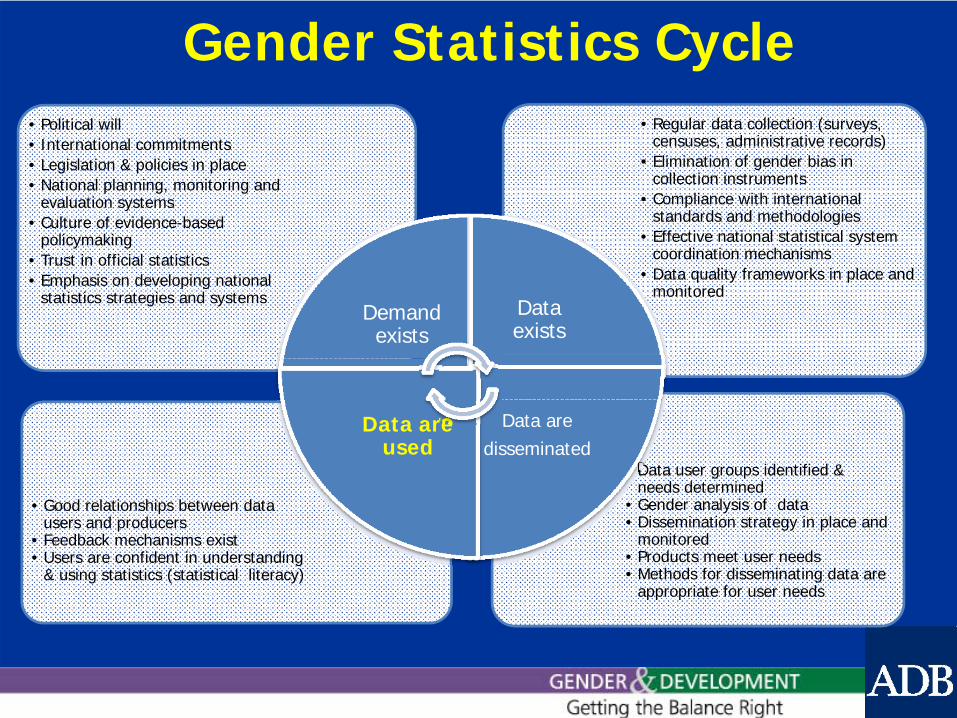
Gender Statistics Cycle
• Data user groups identified & needs determined
• Gender analysis of data• Dissemination strategy in place and
monitored• Products meet user needs• Methods for disseminating data are
appropriate for user needs
• Good relationships between data users and producers
• Feedback mechanisms exist• Users are confident in understanding
& using statistics (statistical literacy)
• Regular data collection (surveys, censuses, administrative records)
• Elimination of gender bias in collection instruments
• Compliance with international standards and methodologies
• Effective national statistical system coordination mechanisms
• Data quality frameworks in place and monitored
• Political will• International commitments• Legislation & policies in place • National planning, monitoring and
evaluation systems• Culture of evidence-based
policymaking• Trust in official statistics • Emphasis on developing national
statistics strategies and systemsDemand exists
Data exists
Data aredisseminated
Data are used
Using gender data to inform policy
• Example 1: Gender gaps in education due to son preference & cultural practices Policy solution = targeted scholarships/stipends for girls
• Example 2: Low representation of women in parliament Policy solution = quotas/reserved seats for women
• Example 3: Low fertility rates & low female labor force participation Policy solution = greater provision of child-care, parental leave, tax amendments to encourage women to work
Then monitor and evaluate gender impacts of policy!
27
28
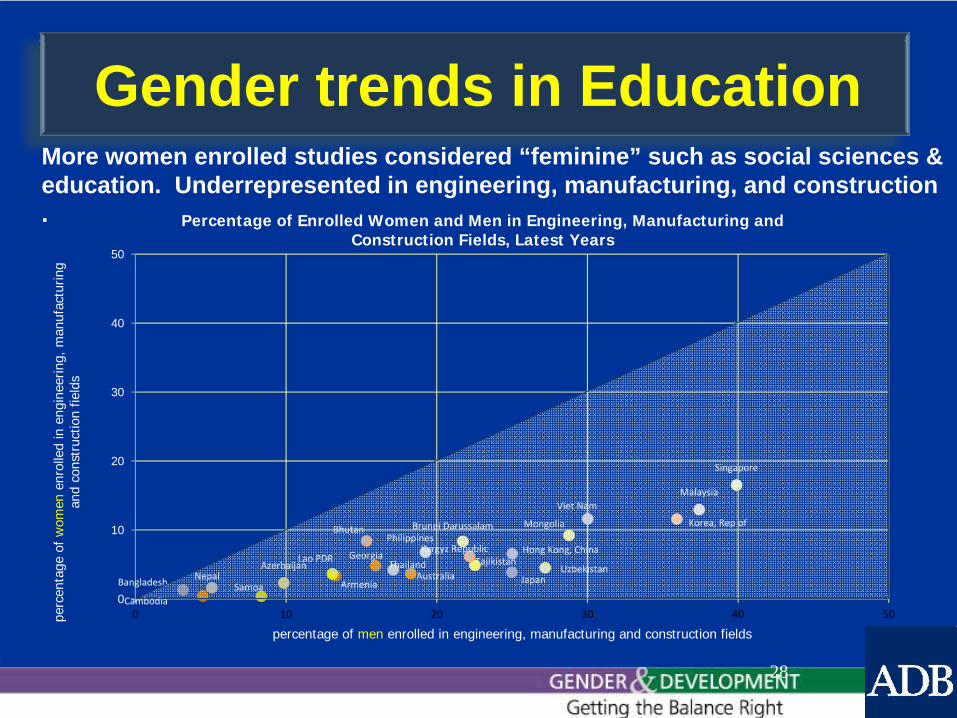
Gender trends in EducationMore women enrolled studies considered “feminine” such as social sciences & education. Underrepresented in engineering, manufacturing, and construction .
Source: UNESCO Institute for Statistics (UIS) accessed 12 June 2012.
SamoaCambodia
Bangladesh NepalAzerbaijan
Armenia
Lao PDR
Australia JapanThailand Uzbekistan
Georgia TajikistanKyrgyz Republic Hong Kong, China
PhilippinesBrunei DarussalamBhutan Mongolia Korea, Rep of
Viet NamMalaysia
Singapore
0
10
20
30
40
50
0 10 20 30 40 50perc
enta
ge o
f wom
enen
rolle
d in
eng
inee
ring,
man
ufac
turin
g an
d co
nstr
uctio
n fie
lds
percentage of men enrolled in engineering, manufacturing and construction fields
Percentage of Enrolled Women and Men in Engineering, Manufacturing and Construction Fields, Latest Years
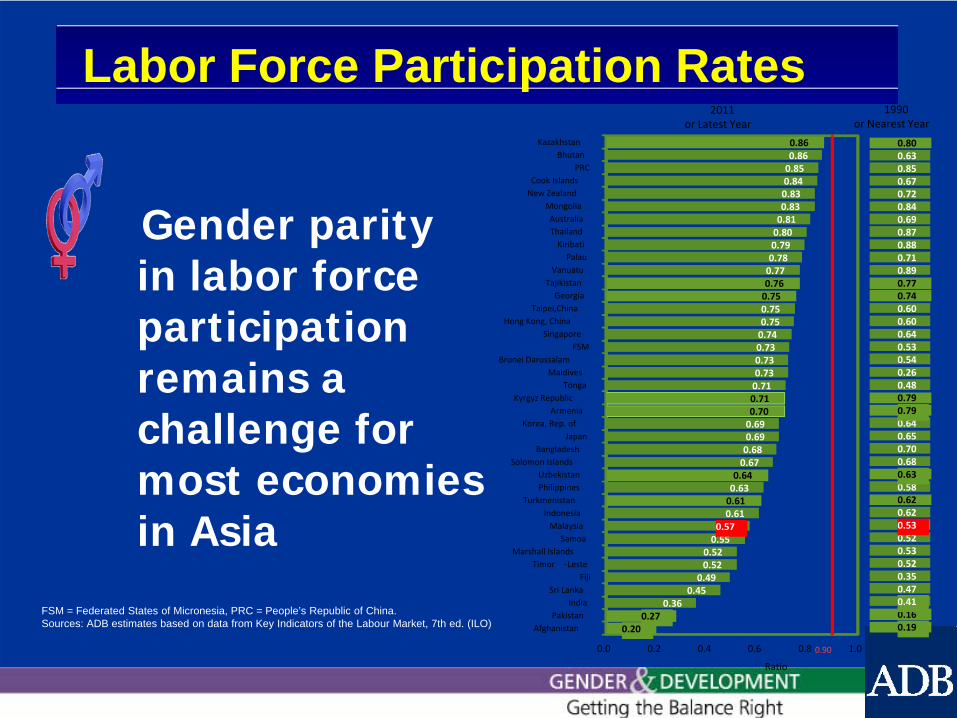
Gender parity in labor force participation remains a challenge for most economies in Asia
FSM = Federated States of Micronesia, PRC = People’s Republic of China. Sources: ADB estimates based on data from Key Indicators of the Labour Market, 7th ed. (ILO)
Labor Force Participation Rates
0.200.27
0.360.450.490.520.520.550.570.610.610.630.640.670.680.690.690.700.710.710.730.730.730.740.750.750.750.760.770.780.790.800.810.830.830.840.850.860.86
0.0 0.2 0.4 0.6 0.8 1.0
AfghanistanPakistan
IndiaSri Lanka
FijiTimor ‐Leste
Marshall IslandsSamoa
MalaysiaIndonesia
TurkmenistanPhilippinesUzbekistan
Solomon IslandsBangladesh
JapanKorea, Rep. of
ArmeniaKyrgyz Republic
TongaMaldives
Brunei DarussalamFSM
SingaporeHong Kong, China
Taipei,ChinaGeorgia
TajikistanVanuatu
PalauKiribati
ThailandAustraliaMongolia
New ZealandCook Islands
PRCBhutan
Kazakhstan
Ratio
2011 or Latest Year
0.90
0.190.160.410.470.350.520.530.520.530.620.620.580.630.680.700.650.640.790.790.480.260.540.530.640.600.600.740.770.890.710.880.870.690.840.720.670.850.630.80
1990 or Nearest Year
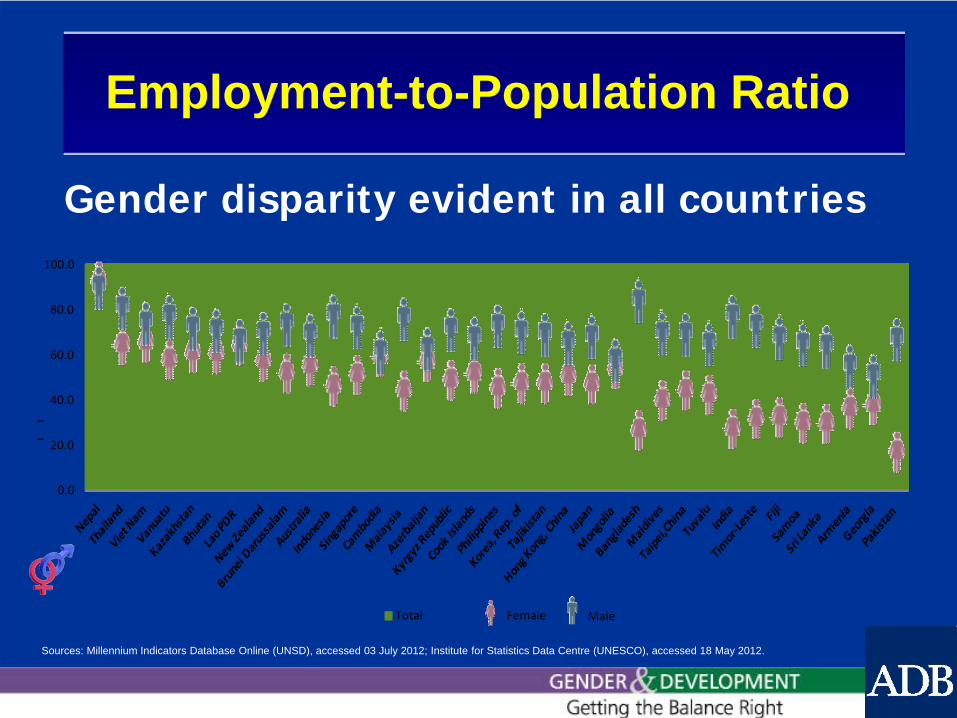
Gender disparity evident in all countries
Employment‐to‐Population Ratio, Aged 15 years and over, Total, Female, Male, Latest Year
Sources: Millennium Indicators Database Online (UNSD), accessed 03 July 2012; Institute for Statistics Data Centre (UNESCO), accessed 18 May 2012.
Employment-to-Population Ratio
0.0
20.0
40.0
60.0
80.0
100.0
‐‐
Total Female Male
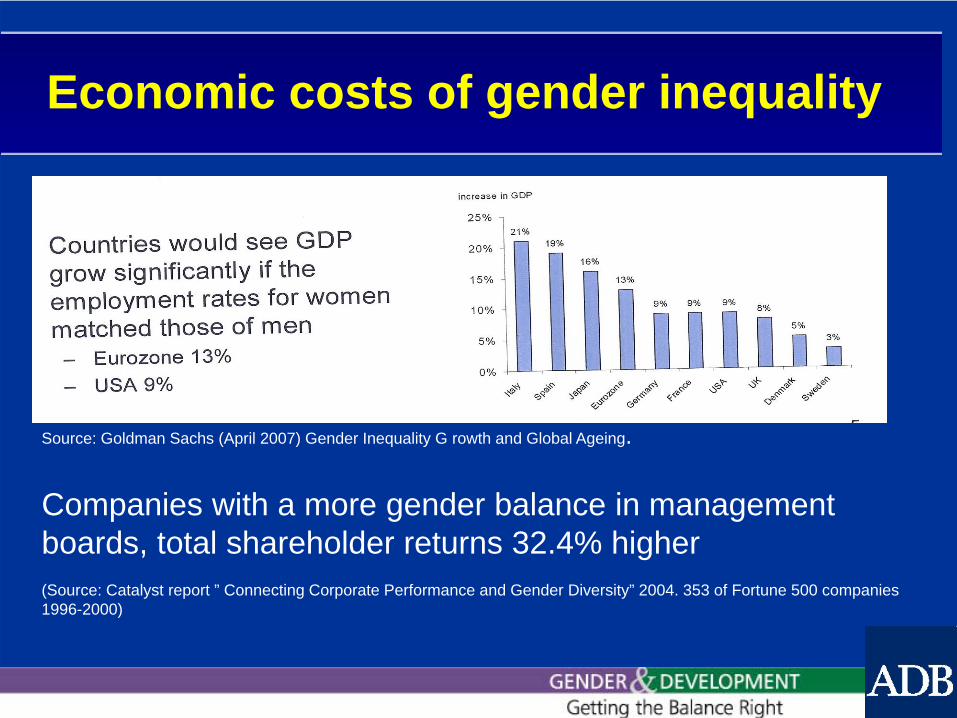
Source: Goldman Sachs (April 2007) Gender Inequality G rowth and Global Ageing.
Economic costs of gender inequality
Companies with a more gender balance in management boards, total shareholder returns 32.4% higher (Source: Catalyst report ” Connecting Corporate Performance and Gender Diversity” 2004. 353 of Fortune 500 companies 1996-2000)

Addressing costs of inequality –policy informed by gender M&E
• Target = women with children, who start working or increase work-hours, as they buy products and services.
• Need to understand if women respond to economic stimuli in the same way? Policy response = introduction of a ”job-tax-deduction” favoring lower incomes more than higher:
• Supply in work force as a result of the "job deduction" – projected increase in number of job hours:
Desired number of work hours
Total Women Men
Change in % 2.3 2.9 1.8
Change per annum 106000 59000 47000
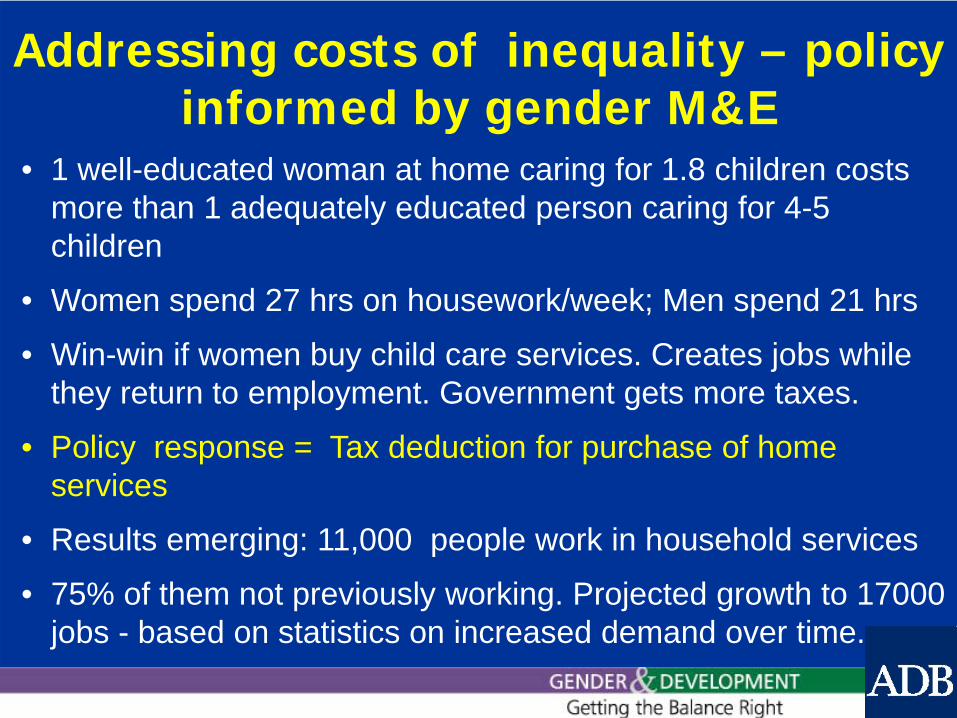
• 1 well-educated woman at home caring for 1.8 children costs more than 1 adequately educated person caring for 4-5 children
• Women spend 27 hrs on housework/week; Men spend 21 hrs
• Win-win if women buy child care services. Creates jobs while they return to employment. Government gets more taxes.
• Policy response = Tax deduction for purchase of home services
• Results emerging: 11,000 people work in household services
• 75% of them not previously working. Projected growth to 17000 jobs - based on statistics on increased demand over time.
Addressing costs of inequality – policy informed by gender M&E

Challenges to data being used
• Too often, gender statistics not fully used for evidence-based policies
• Key challenge: limited capacity of users to access, understand, analyse, interpret & use gender statisticsEnhance cooperation & partnerships (regular consultations & dialogue) between data producers and users, for discussing trends, issues and progressNeed clear gender M&E mandate across all sectors Need to invest in gender statistics & M&E

• Evidence & Data for Gender Equality (EDGE) developing international gender indicator database;methodological development of standards/guidelines on entrepreneurship and asset ownership;presentation to UN Statistical Commission in 2015
Linking to International Initiatives (1)
•Core UN IAEG-GS indicators in being developedEconomic structures, participation in productive activities& access to resourcesEducationHealth and related servicesPublic life and decision-makingHuman Rights of women and girl child
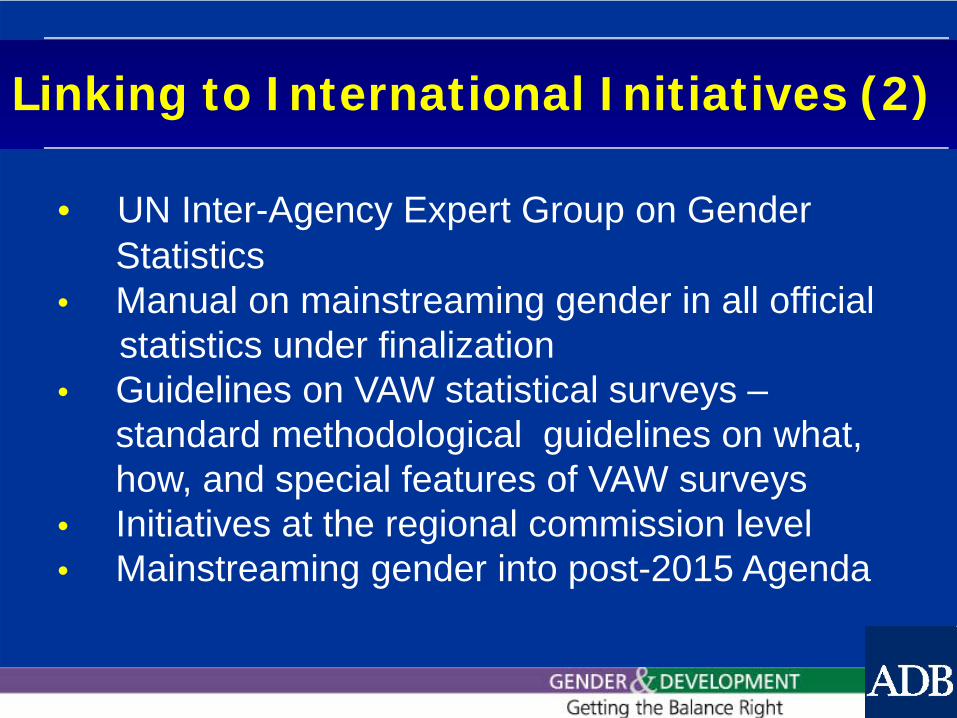
• UN Inter-Agency Expert Group on Gender Statistics
• Manual on mainstreaming gender in all official statistics under finalization
• Guidelines on VAW statistical surveys –standard methodological guidelines on what,how, and special features of VAW surveys
• Initiatives at the regional commission level• Mainstreaming gender into post-2015 Agenda
Linking to International Initiatives (2)
Thank you for your attention Please visit our website
www.adb.org/gender/

References*• Why Gender Statistics are important to monitor the progress in achieving MDGs - Numbers tell HERstory! , Presentation by Susann Roth, Social Development Specialist, ADB
• Numbers tell HERstory: Why gender statistics is important to monitor the progress in achieving MDGs?, Presentation of Kaushal Joshi, Senior Statistician, ADB
• Statistics as evidence for inclusive growth planning: Sweden, Presentation of Bonnie Bernström, President, Liberal Women
• Gender-Specific Statistics: Why they matter and what can be done, Presentation by Stephan Klasen, Universität Göttingen
*Sourced from recent ADB-sponsored regional workshops/conference proceedings
•