Gemmology The Journal ofThe Journal of Gemmology 2011 olume 32 o. 58Page 130 Measurement and...
128
Gemmology The Gemmological Association of Great Britain The Journal of 2011 / Volume 32 / Nos. 5/8 Trapiche tourmaline
Transcript of Gemmology The Journal ofThe Journal of Gemmology 2011 olume 32 o. 58Page 130 Measurement and...
Gemmology
The Gemmological Association of Great Britain
The Journal of
2011 / Volume 32 / Nos. 5/8
Trapiche tourmalineTrapiche tourmaline
The Journal of Gemmology
Editor: Dr R. R. Harding
Deputy Editor: E. A. Skalwold
Assistant Editor: M. J. O’Donoghue
Associate Editors: Dr A. J. Allnutt (Chislehurst), Dr C. E. S. Arps (Leiden), G. Bosshart (Horgen), Prof. A. T. Collins (London), J. Finlayson (Stoke on Trent), Dr J. W. Harris (Glasgow), Prof. R. A. Howie (Derbyshire), E. A. Jobbins (Caterham), Dr J. M. Ogden (London), Prof. A. H. Rankin (Kingston upon Thames), Dr K. Schmetzer (Petershausen), Dr J. E. Shigley (Carlsbad), Prof. D. C. Smith (Paris), E. Stern (London), Prof. I. Sunagawa (Tokyo), Dr M. Superchi (Milan)
Production Editor: M. A Burland
The Editor is glad to consider original articles shedding new light on subjects of gemmological interest for publication in The Journal of Gemmology. A guide to the preparation of typescripts for publication in The Journal is given on our website, or contact the Production Editor at the Gemmological Association of Great Britain.
Any opinions expressed in The Journal of Gemmology are understood to be the views of the contributors and not necessarily of the publishers.
President: Prof. A. H. Rankin
Vice-Presidents: N. W. Deeks, R. A. Howie, E. A. Jobbins, M. J. O'Donoghue
Honorary Fellows: R. A. Howie
Honorary Life Members: H. Bank, D. J. Callaghan, T. M. J. Davidson, J. S. Harris, J. A. W. Hodgkinson, E. A. Jobbins, J. I. Koivula, M. J. O’Donoghue, C. M. Ou Yang, E. Stern, I. Thomson, V. P. Watson, C. H. Winter
Chief Executive Officer: J. M. Ogden
Council: J. Riley – Chairman, S. Collins, B. Jackson, S. Jordan, C. J. E. Oldershaw, L. Palmer, R. M. Slater
Members’ Audit Committee: A. J. Allnutt, P. Dwyer-Hickey, E. Gleave, J. Greatwood, G. M. Green, K. Gregory, J. Kalischer
Branch Chairmen: Midlands – P. Phillips, North East – M. Houghton, North West – J. Riley, South East – V. Wetten, South West – R. M. Slater
The Gemmological Association of Great Britain
27 Greville Street, London EC1N 8TN, UKT: +44 (0)20 7404 3334 F: +44 (0)20 7404 8843E: [email protected] W: www.gem-a.com
Registered Charity No. 1109555Registered office: Palladium House, 1–4 Argyll Street, London W1F 7LD
The Journal of Gemmology / 2011 / Volume 32 / No. 5–8
©2011 The Gemmological Association of Great Britain

The Journal of Gemmology / 2011 / Volume 32 / No. 5–8
©2011 The Gemmological Association of Great Britain Page 129
IntroductionOrigin determination has become
an increasingly important requirement
in the gem trade during the last decade,
especially for larger rubies, sapphires and
emeralds. In addition to the ‘traditional’
examination of inclusions, trace element
chemistry, e.g. by X-ray fluorescence or
laser ablation inductively coupled plasma
mass spectrometry (LA-ICP-MS), can
provide the necessary data to determine
the provenance of a gemstone.
However, with the increasing number
of new sources of gem-quality stones
on the international market such as blue
sapphires from Madagascar or Tanzania,
inclusion and chemical information
may be insufficient — especially due to
Measurement and interpretation of growth patterns in chrysoberyl, including alexandriteDr Karl Schmetzer
Abstract: Procedures for identifying growth planes, growth zones and twin planes in optical biaxial gemstones are described and the most commonly observed interfacial angles are tabulated, using chrysoberyl as an example. The strong pleochroism of the chromium-bearing chrysoberyl variety alexandrite was found to be a useful indicator for locating the positions of the crystallographic axes, and the optic axes are determined using interference figures under crossed polarizers. Examples of the typical features of growth zoning in natural alexandrites from Russia, Sri Lanka and Brazil are shown. Twinned chrysoberyls from Madagascar are described in detail.
Keywords: alexandrite, Brazil, chrysoberyl, crystal habit, Madagascar, optic properties, pleochroism, Russia, Sri Lanka, twinning
overlapping trace element patterns — and
the determination of the internal growth
patterns of these uniaxial gemstones
provides additional criteria to use for
distinguishing between samples from
different natural sources. With the
exception of a few significant cases,
growth patterns should be measured
and assessed only in combination with
a stone’s other properties and not as a
single technique.
The determination of the internal
growth patterns of optically uniaxial
gemstones, e.g. ruby, sapphire, emerald,
amethyst and citrine, has been described
in detail by Kiefert and Schmetzer (1991
a,b,c). The general technique was also
comprehensibly described by Smith (1996)
and applied to the distinction of natural
and synthetic rubies. Further examples of
characteristic growth patterns of optically
uniaxial gemstones are also given in the
literature, especially in connection with
the description of new sources of ruby
and sapphire and with the description of
various synthetic quartz varieties.
In contrast, the description of
characteristic growth patterns in optically
Above: Growth structure and pleochroism in twinned alexandrite from Lake Manyara, Tanzania; the twin boundary separates a first individual with growth planes parallel to two i (011) faces and a second individual with growth faces parallel to i (011) and b (010). View parallel to the a-axis of both parts of the twin, immersion, 25 ×.

The Journal of Gemmology / 2011 / Volume 32 / No. 5–8
Page 130
Measurement and interpretation of growth patterns in chrysoberyl, including alexandrite
biaxial gemstones is limited. For flux-
grown Russian synthetic alexandrites, the
internal growth patterns were determined
using immersion microscopy of rough and
faceted samples (Schmetzer et al., 1996).
More recently, a detailed description of
characteristic growth patterns in natural
Russian alexandrites originating from the
emerald mines in the Ural mountains
has been published (Schmetzer, 2010)
and includes practical guidance for
the recognition of such characteristic
patterns in Russian samples. However, a
general overview of growth patterns in
alexandrites from various natural sources
and their determination is still missing.
General considerationsIn optically uniaxial gemstones, the
determination of the complete growth
pattern is quite straightforward. Because
the crystallographic c-axis is parallel to
the optic axis, a growth plane can easily
be determined by measurement of its
inclination to the optic axis. The complete
growth pattern can be seen by rotating
the sample with the c-axis (coincident
with the optic axis) as rotation axis of the
sample holder.
In optically biaxial gemstones, on
the other hand, neither optic axis can be
expected to be parallel to any one of the
three crystallographic axes (a-, b- and
c-axes) and, therefore, the measurement
of an angle of a growth plane relative
to one of the optic axes or a rotation
of the gemstone with one of the optic
axes as rotation axis gives only limited
information and doesn’t show the
complete growth pattern of a sample.
Consequently, the determination
of growth patterns in optically biaxial
gemstones can be considered as a trial
and error process, which, depending
upon the orientation of the table facet
with respect to the crystallographic
axes, may be very quick (comparable
to the procedure for optically uniaxial
gemstones) or somewhat more time
consuming. For all biaxial gemstones it
is necessary to rotate a faceted sample
through an angle of 360° in a number of
different orientations in the sample holder.
Figure 2: This series illustrates the variation of interference figures in alexandrite from Hematita, Brazil, during a slight rotation of the stone; tilting the alexandrite from a position, in which the optic axis is inclined to the direction of view (A) progressively towards positions in which the angle between the optic axis and the microscope axis is progressively diminished, moves the interference rings towards the centre (B and C); in (D) the optic axis is exactly parallel to the microscope axis. Consequently, this procedure is applied in a search for both optic axes and for the determination of crystal orientation in faceted samples by optical means. Immersion, crossed polarizers, 30×.
Figure 1: Orientation of the optic plane and the optic axes relative to the three crystallographic axes a, b and c in optically biaxial chrysoberyl; the optic plane is represented by the ac-plane of the crystal. Left: clinographic projection, view almost parallel to the a-axis; right: parallel projection, view parallel to the b-axis.
a, b, ccrystallographic axis
optic axis
optic plane
a, b, icrystal faces
X, Y, Zpleochroism, incandescent light
c Z green to bluish green
b
Y yellow to orange
a
X red to purple
a b
i
ab
i
c
A B
C D

The Journal of Gemmology / 2011 / Volume 32 / No. 5–8
Page 131
Measurement and interpretation of growth patterns in chrysoberyl, including alexandrite
The observed structural properties and
their orientation within the gemstone, e.g.
relative to the table facet, can then be
noted. In subsequent steps, an orientation
of the alexandrite in selected settings
and subsequent rotations will give the
basic information to determine the most
characteristic structural properties. In
other words, each setting and rotation
of the gemstone in the sample holder
yields information to solve part of a
three-dimensional puzzle, i.e. part of the
complete growth information.
Technical equipmentThe facilities used for the
determination of growth patterns in
optically biaxial gemstones are identical
with the tools used for optically uniaxial
gems. Detailed descriptions are given by
Schmetzer (1986), Kiefert and Schmetzer
(1991a) and Smith (1996).
For the measurement of angles
between structural features in the
immersion microscope, a special sample
holder with two rotation axes and a 360°
dial attached to the vertical rotation axis is
applied to determine the angle of rotation,
i.e. the angle between two structural
features observed in two angular positions
of the sample holder. The second
horizontal rotation axis of the sample
holder, in general, is not used for the
measurement of angles between structural
properties, but this axis is essential for an
orientation of a rough or faceted sample
in a direction of view exactly parallel to
the observed growth planes. Furthermore,
an eyepiece with crossed hairs and a
360° dial attached to the eyepiece tube
are used for the measurement of angles
between two different structural features,
e.g. between two differently orientated
series of parallel growth planes.
Determination of optic and crystallographic axes using interference figures and pleochroism
The optic axial plane in chrysoberyl,
including its colour-change variety
alexandrite, is always located in the plane
formed by the crystallographic a- and
c-axes (Figure 1). The position of an optic
axis in this plane is found by placing the
stone in the sample holder in different
initial orientations and rotating the stone
360° in each position under crossed
polarizers. This uses the vertical axis of
the sample holder as rotation axis. A
position with a view somewhat inclined
to the optic axis is indicated by a typical
pattern of interference rings (Figure 2A).
Tilting the crystal continuously towards a
position in which the optic axis is exactly
parallel to the direction of view moves the
interference rings continuously towards
the centre of the sample (Figure 2 B to D).
If the geometry of the stone is such
that it is possible to find both optic
axes, its orientation relative to the three
crystallographic axes can be determined.
With a starting position in which the
crystallographic b-axis is parallel or almost
parallel to the rotation axis of the sample
holder, it is possible to observe both optic
axes within one single rotation of the
gemstone. In this case, the optic axial angle
of the chrysoberyl can be measured. In
most gem chrysoberyls the optic axial angle
lies in the range 65 to 70°, and exactly
half way between both optic axes, a view
Figure 3: Pleochroism of an alexandrite crystal fragment from Hematita, Brazil, in immersion and incandescent light, view of the sample in directions parallel to the crystallographic a-, b- and c-axis in a cell with transmitted polarized light, with an orientation of X || a, Y || b and Z || c. Size of the crystal fragment about 2.8 × 5.2 × 4.2 mm.
view || a-axis
view || b-axis
view || c-axis
[100]
[010]
[001]
Y
Z
Z
X
Y
X
c
b
c
a
a
b

The Journal of Gemmology / 2011 / Volume 32 / No. 5–8
Page 132
Measurement and interpretation of growth patterns in chrysoberyl, including alexandrite
parallel to the crystallographic c-axis can be
obtained. After a rotation of 90° from this
position with the b-axis chosen parallel to
the rotation axis, the direction of view is
exactly parallel to the a-axis.
This orientation in the sample holder,
which enables determination of the
position of both optic axes and — with
that knowledge — the position of the
three crystallographic axes, is ideal; to
find it, the observation of pleochroism
is helpful. For the chromium-bearing
chrysoberyl variety alexandrite, the
colours of X || a, Y || b and Z || c in
incandescent light, as observed commonly
in the immersion microscope, are always:
X red to purple, Y yellow to orange,
and Z green to bluish green.
An example is given in Figure
3. Consequently, the observation of
pleochroism is helpful to determine which
Figure 4: Alexandrite crystal with simple morphology consisting of the faces a (100), b (010), m (110), r (130) and i (011); the intersection edges of the faces a, b, m and r are parallel to the zone axis [001]. In a view parallel to the zone axis, the growth planes equivalent to the faces a, b, m and r are visible in the immersion microscope as lines or bands.
Table I: Morphological properties of chrysoberyls.
Crystal class 2/m 2/m 2/m = D2h, single and repeated twinning on (031) and (03
-1).
Crystal form Designation Miller indices (hkl)* Number of faces
Pinacoid
a (100)
2b (010)c (001)
Prism
i (011)
4
k (021)m (110)s (120)r (130)x (101)
Dipyramid
o (111)
8n (121)w (122)v (211)
Zone axis [uvw]
Direction of view Crystal faces, designation and Miller indices (hkl)
[001] parallel to the c-axis a (100), m (110), s (120), r (130), b (010)
[100] parallel to the a-axis b (010), k (021), i (011), c (001)
[010] parallel to the b-axis c (001), x (101), a (100)
[011] between b- and c-axis a (100), v (211), o (111), w (122), i (011)
[012] between b- and c-axis a (100), n (121), k (021)
[101] between a- and c-axis, almost parallel to the optic axis
b (010), n (121), o (111), x (101)
[110] between a- and b-axis o (111), c (001)
[111] oblique to all three axes i (011), n (121), m (110)
*Based on a morphological cell with a 4.42, b 9.39, c 5.47
[001]
Direction of view
Pleochroism
View || to the
a-axis [100]
Y yellow to orange
Z green to bluish green
View || to the
b-axis [010]
X red to purple
Z green to bluish green
View || to the
c-axis [001]
X red to purple
Y yellow to orange
crystallographic axis (in the setting of the
crystal examined) is more or less parallel
to the rotation axis of the sample holder.
Pleochroism can also be used to
control the search for optic axes. If one
optic axis is parallel to the direction of
view, no pleochroism is observed when
the polarizer is rotated. In views parallel
to the three different crystallographic axes,
the following colours are observed (see
again Figure 3):
Observation of characteristic faces and growth zones
The determination of the presence
of a single growth plane or a series of
parallel growth planes — in general — is
neither helpful for the characterization
of a faceted alexandrite regarding its
original crystal morphology nor for origin
determination. What is needed is the
recognition of one or several characteristic
growth zones, each growth zone
consisting of a group of crystal faces.
In crystallography, a zone is defined
as a set of faces which are parallel to
a line (the zone axis) and intersect in
parallel edges (Figure 4). In general, two
non-parallel crystal faces form a zone, but
most characteristic zones in chrysoberyl
consist of more than two crystal faces. A
crystal face is indicated by Miller indices
(hkl) in round brackets and a zone axis is
indicated by the symbol [uvw] in square
brackets.
To avoid confusion, the author will
designate a part of a rough crystal or a
faceted gemstone which shows parallel
growth planes assigned to a single crystal
face as a growth area. Consequently,
several growth areas which are related to
each other by a single zone axis form a
growth zone.
The Journal of Gemmology / 2011 / Volume 32 / No. 5–8
Page 133
Measurement and interpretation of growth patterns in chrysoberyl, including alexandrite
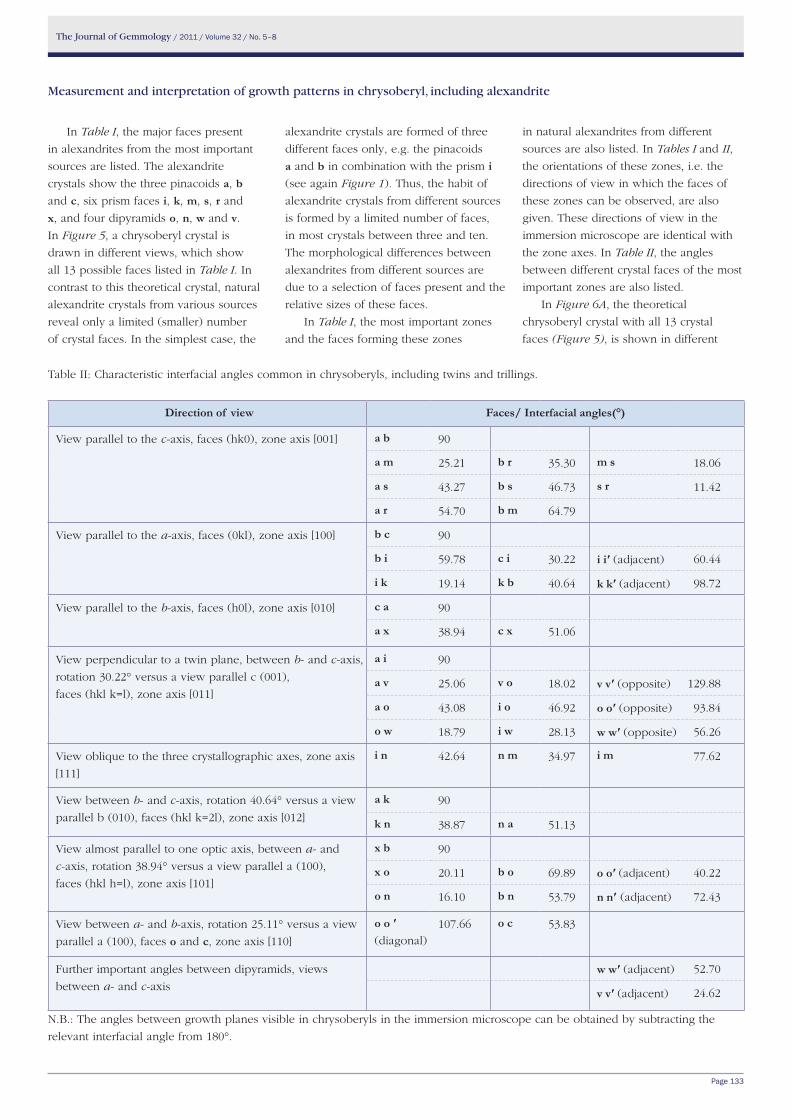
Table II: Characteristic interfacial angles common in chrysoberyls, including twins and trillings.
Direction of view Faces/ Interfacial angles(°)
View parallel to the c-axis, faces (hk0), zone axis [001] a b 90
a m 25.21 b r 35.30 m s 18.06
a s 43.27 b s 46.73 s r 11.42
a r 54.70 b m 64.79
View parallel to the a-axis, faces (0kl), zone axis [100] b c 90
b i 59.78 c i 30.22 i i′ (adjacent) 60.44
i k 19.14 k b 40.64 k k′ (adjacent) 98.72
View parallel to the b-axis, faces (h0l), zone axis [010] c a 90
a x 38.94 c x 51.06
View perpendicular to a twin plane, between b- and c-axis,
rotation 30.22° versus a view parallel c (001),
faces (hkl k=l), zone axis [011]
a i 90
a v 25.06 v o 18.02 v v′ (opposite) 129.88
a o 43.08 i o 46.92 o o′ (opposite) 93.84
o w 18.79 i w 28.13 w w′ (opposite) 56.26
View oblique to the three crystallographic axes, zone axis
[111]
i n 42.64 n m 34.97 i m 77.62
View between b- and c-axis, rotation 40.64° versus a view
parallel b (010), faces (hkl k=2l), zone axis [012]
a k 90
k n 38.87 n a 51.13
View almost parallel to one optic axis, between a- and
c-axis, rotation 38.94° versus a view parallel a (100),
faces (hkl h=l), zone axis [101]
x b 90
x o 20.11 b o 69.89 o o′ (adjacent) 40.22
o n 16.10 b n 53.79 n n′ (adjacent) 72.43
View between a- and b-axis, rotation 25.11° versus a view
parallel a (100), faces o and c, zone axis [110]
o o ′ (diagonal)
107.66 o c 53.83
Further important angles between dipyramids, views
between a- and c-axis
w w′ (adjacent) 52.70
v v′ (adjacent) 24.62
N.B.: The angles between growth planes visible in chrysoberyls in the immersion microscope can be obtained by subtracting the
relevant interfacial angle from 180°.
In Table I, the major faces present
in alexandrites from the most important
sources are listed. The alexandrite
crystals show the three pinacoids a, b
and c, six prism faces i, k, m, s, r and
x, and four dipyramids o, n, w and v. In Figure 5, a chrysoberyl crystal is
drawn in different views, which show
all 13 possible faces listed in Table I. In
contrast to this theoretical crystal, natural
alexandrite crystals from various sources
reveal only a limited (smaller) number
of crystal faces. In the simplest case, the
alexandrite crystals are formed of three
different faces only, e.g. the pinacoids
a and b in combination with the prism i (see again Figure 1). Thus, the habit of
alexandrite crystals from different sources
is formed by a limited number of faces,
in most crystals between three and ten.
The morphological differences between
alexandrites from different sources are
due to a selection of faces present and the
relative sizes of these faces.
In Table I, the most important zones
and the faces forming these zones
in natural alexandrites from different
sources are also listed. In Tables I and II,
the orientations of these zones, i.e. the
directions of view in which the faces of
these zones can be observed, are also
given. These directions of view in the
immersion microscope are identical with
the zone axes. In Table II, the angles
between different crystal faces of the most
important zones are also listed.
In Figure 6A, the theoretical
chrysoberyl crystal with all 13 crystal
faces (Figure 5), is shown in different
The Journal of Gemmology / 2011 / Volume 32 / No. 5–8
Page 134
Measurement and interpretation of growth patterns in chrysoberyl, including alexandrite
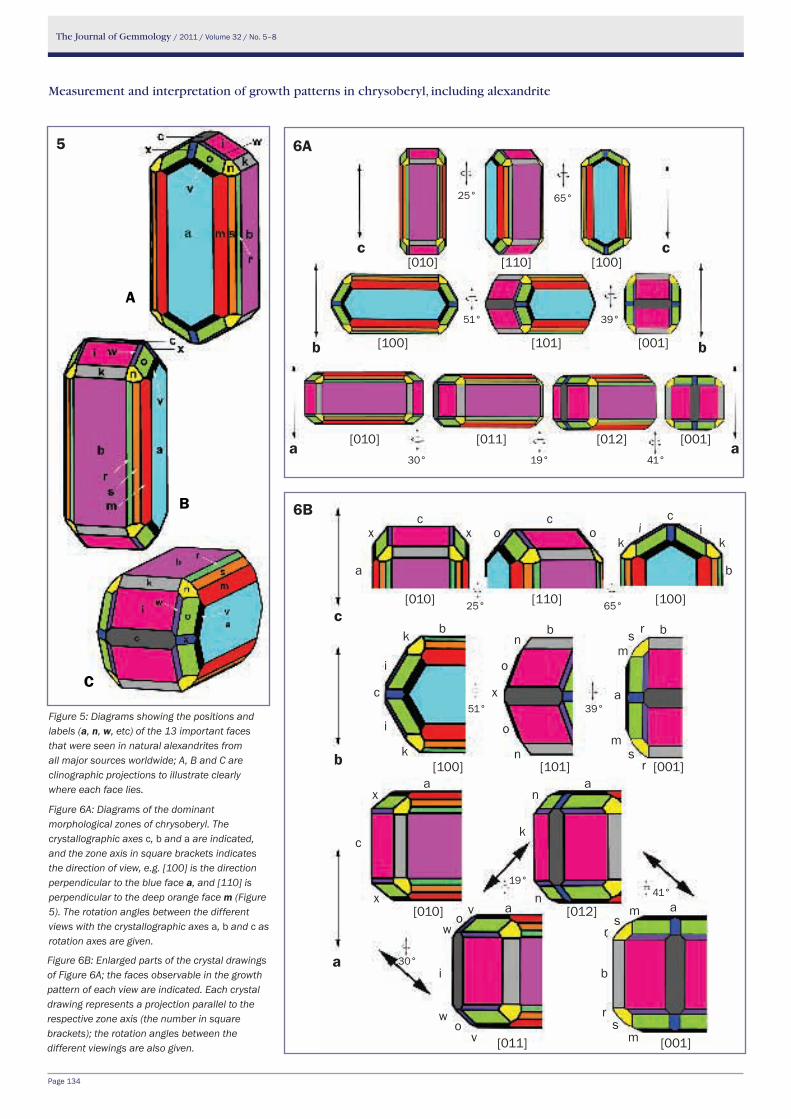
Figure 6A: Diagrams of the dominant morphological zones of chrysoberyl. The crystallographic axes c, b and a are indicated, and the zone axis in square brackets indicates the direction of view, e.g. [100] is the direction perpendicular to the blue face a, and [110] is perpendicular to the deep orange face m (Figure 5). The rotation angles between the different views with the crystallographic axes a, b and c as rotation axes are given.
Figure 6B: Enlarged parts of the crystal drawings of Figure 6A; the faces observable in the growth pattern of each view are indicated. Each crystal drawing represents a projection parallel to the respective zone axis (the number in square brackets); the rotation angles between the different viewings are also given.
[010] [110] [100]
[100] [101] [001]
[010] [011] [012] [001]
25° 65°
39°
41°
51°
19°30°a
b
c
a
b
c
6A
[010] [110] [100]
[100] [101] [001]
[011] [001]
25° 65°
39°
41°
51°
19°
30°a
b
c
[010] [012]
a
a
a
x
x
x
xx
c
c
ccc
o
o
o
o
oo
k
k
k
kk
i
i
i
i i
bbb
b
m
m
m
m
s
s
s
s
r
r
r
r
w
w
v
vn
n
n
na
aa
b
6B
Figure 5: Diagrams showing the positions and labels (a, n, w, etc) of the 13 important faces that were seen in natural alexandrites from all major sources worldwide; A, B and C are clinographic projections to illustrate clearly where each face lies.
A
B
C
5

The Journal of Gemmology / 2011 / Volume 32 / No. 5–8
Page 135
Measurement and interpretation of growth patterns in chrysoberyl, including alexandrite
Figure 7: Examples of growth structures in alexandrites from three major natural sources (Urals, Russia; Hematita, Brazil; Sri Lanka). Top row, growth zone [001]: (A) Brazil, 50 ×; (B) Sri Lanka, 40 ×; (C) Sri Lanka, 30 ×; bottom row, growth zone [011]: (D) Russia, 30 ×; (E) Russia, 50 ×; (F) Sri Lanka, 35 ×. All photos in immersion.
Figure 8: Examples of growth structures in alexandrites from three major natural sources (Urals, Russia; Hematita, Brazil; Sri Lanka). Top row, growth zone [100]: (A) Brazil, 50 ×; (B) Brazil, 40 ×; (C) Sri Lanka, 40 ×; bottom row, growth zone [101]: (D) Russia, 50 ×, (E) Brazil, 50 ×; (F) Sri Lanka, 35 ×. All photos in immersion.
Zone [001]
Zone [011]
A B C
D E F
Zone [100]
Zone [101]
A B C
D E F

The Journal of Gemmology / 2011 / Volume 32 / No. 5–8
Page 136
Measurement and interpretation of growth patterns in chrysoberyl, including alexandrite
Table III: Structural pattern consisting of more than one growth plane.
Rotation axis of the sample holder parallel to one of the three crystallographic axes
Zone Visible pattern of crystal growth planes (common examples)
c [001]
[010] a c a or a x c x′ a′
[110] o c o′ or o o′
[100] b i i′ b′ or b i c i′ b′ or b k i c i′ k′ b′
b [010]
[100] b i i′ b′ or b i c i′ b′ or b k i c i′ k′ b′
[101]* b o o′ b′ or b o x o′ b′ or b n o x o′ n′ b′
[001]
b a b′ or b m a m′ b′ or b s a s′ b′ or b r a r′ b′ orb s m a m′ s′ b′ or b r s a s′ r′ b′ or b r m a m′ r′ b′ orb r s m a m′ s′ r′ b′
a [100]
[010] a c a or a x c x′ a′
[011]**a i a′ or a o o′ a′ or a o i o′ a′ ora o w w′ o′ a′ or a o w i w′ o′ a′ ora v o o′ v′ a′ or a v o i o′ v′ a′
[012] a n n′ a′ or a n k n′ a′
[001]
a b a′ ora m b m′ a′ or a s b s′ a′ or a r b r′ a′ ora m s b s′ m′ a′ or a s r b r′ s′ a′ or a m r b r′ m′ a′ or a m s r b r′ s′ m′ a′
Rotation axis of the sample holder perpendicular to a crystal face
Visible zones (examples)
Prism i (011) [100], [111]***, [011]
Prism x (101) [010], [101]
Dipyramid o (111) [011], [101], [110]
Dipyramid n (121) [101], [012], [111]***
* view almost parallel to one of the optic axes** view perpendicular to a twin plane *** faces m, n, i
Figure 9: Growth structure and pleochroism in alexandrite from the Urals, Russia; growth zone [110] (i.e. looking perpendicular to the deep orange face m (110) in Figure 5), two o dipyramids (again see Figure 5) form an interfacial angle of 108° (the angle formed by the two faces is 180° – 108° = 72°). Immersion, 50 ×.
projections. If one considers the three
crystallographic axes c, b and a, each in
turn parallel to the vertical rotation axis
of the sample holder, it is apparent which
zones can be visible in a single setting
by rotation. In the upper part of Figure
6A, for example, the c-axis is selected as
rotation axis. So, the different faces of
each zone, [010], [110] and [100], can be
seen after rotation of the crystal through
angles of 25° and 65°, respectively.
In Figure 6B, only parts of the
complete crystals shown in Figure 6B are
drawn, and the crystal faces observable
in different orientations are indicated.
It needs to be mentioned that — in
practice — only part of the crystal faces
shown in Figures 6a and 6b are generally
observable. The zone [100], for example,
may show all four different faces, b, k, i
and c, but some crystals only display two
or three of these four faces. Examples
of characteristic zone patterns which
are common in natural alexandrites
from different sources are listed in Table
III. Photomicrographs of cut immersed
alexandrites from three of the major
natural sources, namely the Urals, Russia,
Hematita, Brazil, and Sri Lanka, are given
in Figures 7 and 8. Figure 9 shows an
example of an additional growth pattern
of zone [110] in a Russian alexandrite
crystal and the pleochroism observed on
rotation of the polarizer.
It should be emphasized that faceted
gemstones normally represent only part of
the original rough crystal, from which the
gemstone was cut. This means that more
or less included and impure parts of the
original crystal might have been removed
by the cutting process and, therefore,
the pattern seen in the microscope might
represent only part of a zone structure. It
is the experience of the author that it is
very helpful to have Figures 6a and 6b or
a similar general overview and Tables I
to III available beside the microscope for
practical work with samples of unknown
origin or morphology.
It is possible that during the
microscope examination, only one of the
optic axes is found. It is also possible that
none of the pinacoids a, b or c is present

The Journal of Gemmology / 2011 / Volume 32 / No. 5–8
Page 137
Measurement and interpretation of growth patterns in chrysoberyl, including alexandrite
Figure 10A: Growth structure in alexandrite from Hematita, Minas Gerais, Brazil; growth zone [111], the crystal faces i (011) and n (121) form an interfacial angle of 43° (the angle formed by the two faces is 180° – 43° = 137°). Immersion, 50 ×.Figure 10B: Growth structure in alexandrite from Hematita, Minas Gerais, Brazil; growth zone [111], the crystal faces i (011), n (121) and m (110) form interfacial angles of 43° and 35°. Immersion, 60 ×.Figure 10C: Growth structure in alexandrite from Hematita, Minas Gerais, Brazil; growth zone [011], the crystal faces i (011) and o (121) form an interfacial angle of 47° (the angle formed by the two faces is 180° – 47° = 133°). Immersion, 20 ×.
C
BAor clearly recognizable, or that no growth
zone with more than one face is visible.
For such stones, it is recommended that a
setting is selected with the most significant
growth plane perpendicular to the rotation
axis of the sample holder. In this setting,
the strong growth plane is always visible
and sharp in the microscope and any
other faces forming a growth zone with
this plane will appear during rotation. The
measurement of angles in that particular
zone together with a control by the
observed pleochroism will determine this
zone and the crystal planes present.
Examples of characteristic growth
patterns which are common in alexandrites
from Hematita, Brazil, are given. The first
pattern consists of a distinct and jagged
boundary between two growth areas (see,
e.g., Bank et al., 1987). In these areas the
growth planes are rather weak (compared
with the images in Figures 7–9) and are
related by an interfacial angle of 43°
(Figure 10A). In this orientation, the two
growth zones show distinct pleochroism.
Thus, although two dipyramidal o growth
areas in growth zone [101] would abut
at a similar angle of 40°, such a view is
almost parallel to one of the optic axes
and would show no pleochroism, so the
pattern in Figure 10A cannot be assigned
to this zone. Neither is this characteristic
pattern visible when one of the a-, b- or
c-axes is parallel to the rotation axis of
the sample holder. However, because
the prism i is a common growth face
in alexandrites from Hematita, samples
were oriented with these growth planes
perpendicular to the rotation axis of
the sample holder. With that particular
orientation, growth planes of the prism
i are always sharp in the microscope.
Starting with a view of zone [011], after
rotation of 21° (measured), a characteristic
pattern was observed (Figure 10B), which
consists of the prism i and the dipyramid
n (Figure 11). In the same orientation, the
dipyramid n abuts the prism m, again with
a jagged boundary, forming an interfacial
angle of 35° (Table II), and finally the
growth zone is identified as [111]. The
theoretical angle calculated for the rotation
described is 22.13°.
Figure 11: Diagrams of an alexandrite crystal from Hematita, Brazil. Left: clinographic projection; centre: parallel projection with [011] as zone axis; right: parallel projection with [111] as zone axis. When looking parallel to [011], growth structures parallel to the faces a, o and i are visible; upon rotation about an axis perpendicular to the i face through 22°, the growth faces i, n and m related to the zone [111] are visible.
view[011]
view[111]
oo
o
ii i
aa
a
nn
m
m b
r
22°

The Journal of Gemmology / 2011 / Volume 32 / No. 5–8
Page 138
Measurement and interpretation of growth patterns in chrysoberyl, including alexandrite
Figure 12: Diagrams of different types of twins in alexandrite: by reflection on the plane (031) a single crystal (A) forms penetration (B) or contact twins (C); a cyclic twin consists of three penetration twins (D) or six contact twins (E). According to the sizes of different faces of the single crystals, the twins may show distinct re-entrant angles (as shown here) or vanishingly small ones.
Figure 13: Interference patterns in twinned and untwinned alexandrites. (A) Alexandrite twin from Sri Lanka showing an interference pattern confined by the twin boundary; crossed polarizers; immersion, 25 ×. (B) View parallel to a twin plane of alexandrite from Sri Lanka. Growth planes run perpendicular to the twin plane; upon rotation of the polarizer, the different parts of the twin show distinct pleochroism in deeper and paler shades of orange; immersion, 50 ×. (C) Growth planes in alexandrite from Sri Lanka in plane polarized light, and showing interference patterns (D) under crossed polarizers; immersion, 30 ×. (E) Growth planes in alexandrite from Hematita, Brazil, showing interference patterns (F) under crossed polarizers; immersion, 30 ×.
A B C
D E
A
B
C
D
E
F
A second growth pattern commonly
seen in alexandrites from Hematita which
looks similar with planes forming an
interfacial angle of 47° were identified as
i and o, which are related to growth zone
[011] (Figure 10C).
Twinning in chrysoberyl and alexandrite
Twinning in alexandrite was described
by Rose (1839) in one of the first scientific
papers mentioning the new gem material.
Of the crystal twins shown in Figure 12,
those which are common among the
alexandrites recovered from the Uralian
emerald mines in Russia are described as
cyclic twins or trillings, which consist of
three interpenetrant individuals (Figure
12D). However, such crystal twins may
alternatively be interpreted as a contact
twin of six independent individuals
(Figure 12E). The governing twin law is
reflection on (031) or (03-1). Both twin
planes are also composition planes of
the crystals. In alexandrites from several
other occurrences, however, trillings are

The Journal of Gemmology / 2011 / Volume 32 / No. 5–8
Page 139
Measurement and interpretation of growth patterns in chrysoberyl, including alexandrite
Figure 14: Slightly water-worn greenish yellow chrysoberyls from Ilakaka, Madagascar. The upper left sample is an untwinned single crystal, the crystal on the upper right is a trilling, all other samples are contact twins. The single crystal is about 8 × 15 mm.
Figure 15: Diagrams of chrysoberyl crystals from Ilakaka, Madagascar. (A) Single crystal, (B) contact twin with small re-entrant angle, (C) contact twin with a more distinct re-entrant angle, and (D) cyclic twin (trilling), viewed from two directions close to parallel and perpendicular to the a-axis.
either rare or absent, although other kinds
of twins are quite common. Such twins
follow the same twin law as trillings and
are developed as contact or penetration
twins (Figure 12 B,C). In trillings and
in contact twins or penetration twins
on (031), the crystallographic a-axes of
all parts of the twin are parallel to each
other, and the b- and c-axes are inclined
according to the twin law. For more
details, the reader is referred to pp 62–67
in Schmetzer (2010).
In addition to reflection on (031),
another twin law in chrysoberyl was
described by Jeremejew in 1898 but this
has not since been confirmed. Therefore,
in this paper, studies are concentrated on
twinning on (031).
Many faceted alexandrites show one
simple twin boundary, but a few may
show two or even three intersecting twin
planes. The intersection line between
different twin planes is always parallel to
[100], i.e. parallel to the crystallographic
a-axis. When rotating twinned crystals
under crossed polarizers, the twin
boundary shows a typical interference
pattern (Figure 13A). Similar interference
colours confined to different growth
planes may also be present in alexandrites
from Sri Lanka, Hematita, Brazil, or
elsewhere. In twinned crystals, however,
distinct pleochroism can be observed
between different parts of a twin or trilling
(Figure 13B), whereas such pleochroism
is not present in crystals with interference
colours related to simple growth planes
(Figure 13C to F).
Growth patterns in twinned chrysoberyls
The best orientation for the
examination of growth patterns in
twinned chrysoberyls is a setting with the
crystallographic a-axis (which is parallel
for all parts of the twin) as rotation axis,
i.e. with the a-axis parallel to the rotation
axis of the sample holder. With this
setting, it is possible to view the twinned
sample parallel and perpendicular to the
twin plane. Measuring the rotation angle
between the visible twin plane and a
position, in which several growth planes
AB
C
D

The Journal of Gemmology / 2011 / Volume 32 / No. 5–8
Page 140
Measurement and interpretation of growth patterns in chrysoberyl, including alexandrite
Figure 16 (above): Chrysoberyl twins from Ilakaka, Madagascar with more (A) or less (B) separation of the twin components. Views in the direction of the a-axis showing the [100] growth zones; the pinacoids b and c and the prism faces i and k of the waterworn twinned crystals are visible in immersion. Sample (A) measures about 11 × 11 mm, sample (B) measures about 9 × 10 mm.
A
B
Figure 17 (left): Diagrams of a chrysoberyl twin from Madagascar in different orientations.(A) Clinographic projection, and (B) parallel projection with [100] as zone axis. If one looks parallel to the zone [011] the two i prism faces are near-parallel as are the four o dipyramids of the two individuals of the twin (only two are shown); this direction of view is indicated in drawing (B) and a parallel projection of the sample in this orientation is shown in drawing (D). Drawing (D) is connected to drawing (C) showing a view parallel to the twin plane by a rotation of 90° with the a-axis as rotation axis; starting from an orientation as shown in drawing (D), a rotation in both directions through 60° leads to orientations as shown in drawings (E) and (F), in which one part of the twin shows a view parallel to the zone [011] with crystal faces i, o and a, and the other part of the twin shows a view parallel to the zone [001] with crystal faces b, r, s, m and a.

The Journal of Gemmology / 2011 / Volume 32 / No. 5–8
Page 141
Measurement and interpretation of growth patterns in chrysoberyl, including alexandrite
Table IV: Rotation of chrysoberyl and alexandrite twins and trillings with the a-axis [100]
as rotation axis, view perpendicular to the rotation axis.
Chrysoberyl twin from Ilakaka, Madagascar; observed zones and faces
Rotation angle [°]Zones and faces
Individual I Individual II-120 -[011] a o i o′ a′ -[001] a m s r b r′ s′ m′ a′-101 -[012] a n k n′ a′- 90 view parallel to a twin plane
-79 -[012] a n k n′ a′-60 -[001] a m s r b r′ s′ m′ a′ -[011] a o i o′ a′-30 [010] a x c x′ a′0 view perpendicular to a twin plane
[011] a o i o′ a′ [011] a o i o′ a′
30 [010] a x c x′ a′60 [011] a o i o′ a′ [001] a m s r b r′ s′ m′ a′79 [012] a n k n′ a′90 view parallel to a twin plane
101 [012] a n k n′ a′120 [001] a m s r b r′ s′ m′ a′ [011] a o i o′ a′
Alexandrite trilling from Tokovaya, Urals, Russia; observed zones and faces
Rotation angle [°]Zones and faces
Individual I Individual II Individual III-60 view perpendicular to a twin plane
[011] a o i o′ a′ [001] a s b s′ a′ [011] a o i o′ a′
-30 view parallel to a twin plane
0 view perpendicular to a twin plane
[011] a o i o′ a′ [011] a o i o′ a′ [001] a s b s′ a′
30 view parallel to a twin plane
60 view perpendicular to a twin plane
[001] a s b s′ a′ [011] a o i o′ a′ [011] a o i o′ a′
90 view parallel to a twin plane
120 view perpendicular to a twin plane
[011] a o i o′ a′ [001] a s b s′ a′ [011] a o i o′ a′
After rotation through 180°, the same sequence of faces is observable; this is indicated by identical background colours of the respective rows within the table.
of a growth zone are visible, identifies the
growth zone. In addition, determination
of the angles between different growth
planes within such a growth zone enables
identification of the different growth faces.
For a better understanding of these
investigations, the author selected some
greenish yellow to yellowish green
chrysoberyls from Ilakaka, Madagascar.
The stones examined consisted of one
single crystal, several contact twins
and one trilling (Figure 14). Schematic
crystal drawings are given in Figure 15.
The crystal faces of 11 of the 13 crystal
forms (Table I) are visible and, therefore,
these Madagascan samples are useful to
explain the sometimes really complex
morphological properties and growth
structures seen in twins. Due to the sizes
of different crystal faces, twin crystals with
deeper re-entrant angles are visible beside
twins with vanishingly small re-entrant
angles (Figure 16).
For the recognition of typical growth
zones in faceted chrysoberyls, it can be
helpful to orientate a twinned sample
with the rotation axis of the sample
holder perpendicular to the twin plane.
During rotation, one position may be
found where the [100] growth zones
are symmetrically developed for both
individuals of the twin with regard to the
twin boundary (view parallel to the a-axes
of both individuals). In this direction, the
different faces of the [100] zone of both
individuals are visible (Figure 16).
In simple contact twins, each part
of the twin shows two [011] growth
zones, i.e. for the complete twin four
[011] growth zones are visible, each one
with the faces i, o and a (Figures 16 and
17). Now, although the [011] axis is not
exactly perpendicular to a twin plane on
(031), it is sufficiently close (within 1°)
so that in practice, the growth planes
of the growth zone [011] are visible in a
view perpendicular to a twin plane (see
Figure 20 for the relevant twin plane and
view). So, in that particular view (Figure
17 D), two of these four [011] zones with
faces i, o and a (one of each of the two
individuals) are virtually parallel and
visible together in the microscope. This
means that after a rotation through 180°
(viewing the sample from the opposite
direction), the same growth pattern can
be observed (Figure 17 and see Table
IV). After a rotation of 60°, the remaining
[011] growth zone of the first individual
is parallel to the growth zone [001] of the
second individual of the twin (Figure 17
E). This indicates that at one side of the
sample, the faces belonging to the [011]
zone of the first individual are seen, and
at the other side the faces of the growth
zone [001] of the second individual
are observed. This special feature is a
geometric consequence of the twin law
of chysoberyl, which is also responsible
for the pseudohexagonal nature of the
cyclic twins. After a rotation of -60°,
the remaining [011] growth zone of the
second individual is parallel to the growth
zone [001] of the first individual of the
twin (Figure 17F).
In relatively small and clean
chrysoberyls, growth zones of both
individuals of such a twin are visible and
careful measurements of the rotation

The Journal of Gemmology / 2011 / Volume 32 / No. 5–8
Page 142
Measurement and interpretation of growth patterns in chrysoberyl, including alexandrite
Figure 18: Different growth zones in chrysoberyl contact twins from Ilakaka, Madagascar. According to the orientation of the twin, the growth zones [011] and [001] of both parts of the crystal are shown together (upper left, see also Figure 17 E,F), in other parts of the twin, only one specific growth zone is visible. All photos in immersion, magnification from 15 to 40 ×.
zone [011] + [001] zone [010] zone [011]
zone [012] zone [001] zone [101]
Figure 19: Alexandrite trilling from the Urals, Russia, looking parallel to the a-axis. The a-axes of all three components of the twin, I, II and III, are parallel. In this orientation, in each part of the trilling two i prism faces are observed; this sample has no re-entrant angles. Immersion, 40 ×.
angles versus the twin plane are necessary
to assign the observed zones and faces to
one of the two individuals (see Table IV).
Using the a-axis of the twin as rotation
axis of the sample holder, in addition to
the various [011] and [001] growth zones
mentioned above, the faces of the [010]
and [012] growth zones can also be visible
on rotation. An overview concerning
rotation angles and growth zones is given
in Table IV and examples are pictured in
Figure 18. If a different setting is used
with the b-axis of one individual of a
twin as the rotation axis, the faces of the
[101] growth zone can also be observed
(Figure 18).
In trillings, the a-axes of all three
components of the twin are parallel to
each other (Figures 19 and 20). With the
same orientation as mentioned above
for twins, i.e. with the a-axes parallel to
the rotation axis of the sample holder,
similar observations are possible and
can be interpreted with the help of the
schematic drawing in Figure 20. In a view

The Journal of Gemmology / 2011 / Volume 32 / No. 5–8
Page 143
Measurement and interpretation of growth patterns in chrysoberyl, including alexandrite
Figure 20: Diagram of alexandrite trilling with deep re-entrant angles, projection parallel to the a-axis. In this orientation, all i prism faces of the different parts of the trilling are visible. In views perpendicular to this projection (indicated by → and view), which is consequently perpendicular to the a-axis, the [011] zones of two individuals (I and II) of the trilling are virtually parallel, and parallel to the [001] zone of the third individual (III); the grey part of the trilling is absent in the crystal pictured in Figure 21.
Figure 21: Alexandrite trilling from Lake Manyara, Tanzania. Top: view parallel to the a-axis; the three individuals I, II and III show growth planes parallel to the faces i and b. Below: view perpendicular to the a-axis; for two parts I and II of the trilling (left), the zone [011] is visible in which the growth planes a, o, w and i of both parts of the trilling are near-parallel; for the third part of the trilling III (right) the growth zone [001] with faces r and b is visible. Immersion, 20 ×.
II III
IIII
b
aa
r
b
aa
b
b
i
i
i
ii
i
w
o
[011] [001]
[100]
perpendicular to one of the three twin
planes, the [011] zones of two individuals
of the trilling are virtually parallel (Table
IV) and are visible right and left of the
centre of the alexandrite. In the same
view, the [001] zone of the third individual
of the trilling may be seen in the centre.
Consequently, these different patterns are
not related to the same part of the rough
or faceted trilling and would be seen on
opposite parts or ends of a sample (Figure
21). This pattern is repeated (for complete
samples) after each rotation through an
angle of 60°.
ConclusionsWith a detailed knowledge of what
patterns of internal growth structure
are possible, the measurement and
interpretation of characteristic growth
zones in faceted optically biaxial
gemstones such as chrysoberyl is
achievable using immersion microscopy.
Although not as straightforward as in
optically uniaxial gemstones, patterns
perhaps consisting of up to several growth
areas can be assigned to various growth
zones. The orientation of growth planes
relative to the twin boundary may also
assist understanding of the observed
structural pattern. The observation of
pleochroism and search for the positions
of optic axes can also provide useful
complementary information. Currently
growth patterns in alexandrites from all
major commercial sources, e.g. Russia,
Brazil, Sri Lanka, Madagascar, Zimbabwe,
India and Tanzania, are being compiled
and, in combination with trace element
contents, they will be a useful factor in
origin determination of these gems.
AcknowledgementsThe author is grateful to Dr D.
Nyfeler and Mrs A.-K. Malsy, Gübelin
Gem Lab, Lucerne, Switzerland, as
well as Dr M. Krzemnicki, SSEF, Basel,
Switzerland, for the loan of numerous
chrysoberyl and alexandrite samples from
the reference collections of the Gübelin
Gemmological Laboratory and at the SSEF
Swiss Gemmological Institute. Numerous
samples were provided by the following
view[011]
i
view[011]
view[001]
i
c-axistwin boundary
The Journal of Gemmology / 2011 / Volume 32 / No. 5–8
Page 144
Measurement and interpretation of growth patterns in chrysoberyl, including alexandrite
companies: Rolf Goerlitz and Gebrüder
Henn Companies, both at Idar-Oberstein,
Germany; Wild & Petsch and Paul
Wild Companies, both at Kirschweiler,
Germany; Mawingu Gems of Werner Radl,
Niederwörresbach, Germany; and Rudolf
Schupp Company, Pforzheim, Germany.
They are all gratefully acknowledged.
ReferencesBank, F.H., Bank, H., Gübelin, E., and
Henn, U., 1987. Alexandrite von einem
neuen Vorkommen bei Hematita in
Minas Gerais, Brasilien. Zeitschrift
der Deutschen Gemmologischen
Gesellschaft, 36(3/4), 121–31
Jeremejew, P. Von, 1898. A new twin
law for alexandrite. Bulletin de
l’Académie Impériale des Sciences de
St.-Pétersbourg, Ve Série, 8(5), LXIX–
LXXI (in Russian). (See also abstract in
German by Von Worobieff, V., 1900.
Ein neues Zwillingsbildungsgesetz
beim Alexandrit. Zeitschrift für
Krystallographie und Mineralogie,
32, 427)
Kiefert, L., and Schmetzer, K., 1991a. The
microscopic determination of structural
properties for the characterization
of optical uniaxial natural and
synthetic gemstones. Part 1: General
considerations and description of the
methods. Journal of Gemmology, 22(6),
344–54
Kiefert, L., and Schmetzer, K., 1991b. The
microscopic determination of structural
properties for the characterization of
optical uniaxial natural and synthetic
gemstones. Part 2: Examples for the
applicability of structural features
for the distinction of natural emerald
from flux-grown and hydrothermally-
grown synthetic emerald. Journal of
Gemmology, 22(7), 427–38
Kiefert, L., and Schmetzer, K., 1991c. The
microscopic determination of structural
properties for the characterization of
optical uniaxial natural and synthetic
gemstones. Part 3: Examples for the
applicability of structural features for
the distinction of natural and synthetic
sapphire, ruby, amethyst and citrine.
Journal of Gemmology, 22(8), 471–82
Rose, G., 1839. Ueber den Chrysoberyll
vom Ural. Annalen der Physik und
Chemie, 48, 570–3
Schmetzer, K., 1986. An improved sample
holder and its use in the distinction
of natural and synthetic ruby as well
as natural and synthetic amethyst.
Journal of Gemmology, 20(1), 20–33
Schmetzer, K., 2010. Russian alexandrites.
Schweizerbart Science Publishers,
Stuttgart, 141 pp.
Schmetzer, K., Peretti, A., Medenbach, O.,
and Bernhardt, H.-J., 1996. Russian
flux-grown synthetic alexandrite. Gems
& Gemology, 32(3), 186–202
Smith, C.P., 1996. Introduction to
analyzing internal growth structures:
Identification of the negative d plane
in natural ruby. Gems & Gemology,
32(3), 170–84
All photos and crystal drawings by the author.
The AuthorDr Karl SchmetzerTaubenweg 16, 85238 Petershausen, GermanyEmail: [email protected]

The Journal of Gemmology / 2011 / Volume 32 / No. 5–8
©2010 Gemmological Association of Great Britain Page 145
A Russian Maxixe beryl?Lars Olov Andersson
Abstract: Maxixe beryl has a deep blue colour, which fades upon extended exposure of the crystal to daylight. In a 1976 publication a colourless Russian beryl was reported to contain a considerable amount of NO2. The published EPR spectrum of this beryl is similar to that of a bleached Maxixe beryl. Analysis of the colour centres of Maxixe beryl and the artificially created Maxixe-type beryl indicate that samples of this Russian beryl could display the blue colour of Maxixe beryl after irradiation.
Keywords: EPR, Maxixe beryl, NO2 in beryl
IntroductionThe observation of NO
2 impurities in
a colourless Russian beryl by Electron
Paramagnetic Resonance (EPR)
spectroscopy (Sukharzhevskii, 1976)
suggests that this Russian beryl may
have had (and can again obtain) the
features of the rare Maxixe beryl found
around 1917 in Brazil. This possibility
is based on a study of the creation and
decay of the colour centre in the Maxixe
beryl. Comparison of these processes
is also made with the behaviour of the
colour centre in the Maxixe-type beryl
which appeared on the gemstone market
around 1973.
A crystal of beryl (Be3Al
2Si
6O
18)
consists of silicate rings stacked upon
each other, like stacks of doughnuts.
The holes in the middle form channels
stretching throughout the crystal structure.
These channels are parallel to the
c-axis of the beryl crystal and have a
diameter which varies between 2.8 Å in
the rings and 5.1 Å between the rings.
Neighbouring stacks are held together
by Be and Al ions. Impurity ions like
Fe, Mn and Cr can replace Al or Be ions
in natural beryl crystals. Relatively large
amounts (often more than one weight %)
of other impurities, mainly alkali ions and
water, but also CO2 and CH
4 molecules,
can be located in the channels.
Chemical bonds in molecules (such
as CO2), ions (such as CO
32–), and crystals
usually contain paired electrons. NO2
and NO3 molecules are exceptions with
unpaired electrons. Unpaired electrons
are also a result from irradiation which
can remove one electron (as in CO3–)
or add one electron (as in CO2–). EPR
spectrometers are used to detect such
unpaired electrons and study their
behaviour. They can also be used to study
the unpaired electrons in paramagnetic
ions (such as Fe3+ and Cr3+). When a
strong magnetic field is applied, the spin
of the electrons will be oriented parallel
or antiparallel to the magnetic field. These
orientations have different energy levels
and transitions between them occur in the
microwave region. The EPR spectrometer
registers the microwave absorption of
the unpaired electrons. The spectrum
is obtained by keeping the microwave
frequency constant and changing the
magnetic field.
Maxixe beryl and Maxixe-type beryl
Maxixe beryl was first described in the
scientific literature by Wild (1933), who
stated that the crystal had been found
15 years earlier in the Maxixe mine. This
beryl had a deep blue colour, which
faded when the crystal was kept for many
days in daylight. It is strange that there
are no earlier reports about this unusual
beryl, after it had caused the gemstone
dealers such disappointment. The samples
investigated by Wild had been kept in
the dark since about 1917 and had not
lost their blue colour. More detailed
investigations of this material were made
by Schlossmacher and Klang (1935)
and by Roebling and Tromnau (1935).
Schlossmacher and Klang (1935) describe
the location of the Maxixe mine in Minas
Gerais, Brazil, and state that the mine was
closed when the loss of colour caused a
lot of trouble. One other of Wild’s samples
has been described in detail by Schiffman
(1977). No other beryl with the same
properties as Maxixe beryl has since been
reported.
In 1972–1973 more beryl crystals
of an intense blue colour appeared on

The Journal of Gemmology / 2011 / Volume 32 / No. 5–8
Page 146
A Russian Maxixe beryl?
the gemstone markets, but the initial
enthusiasm for these beautiful stones
changed to disappointment when it was
found that their colour also faded upon
extended exposure to daylight in shop
window displays. Nassau et al. (1976)
investigated these crystals and established
that they have the opposite dichroism to
that of aquamarine. The blue colour of
the new beryl is carried by the ordinary
ray, while that of aquamarine is carried by
the extraordinary ray. Nassau et al. (1976)
called these new beryls Maxixe-type
beryls because their optical absorption
spectra contained similar, but slightly
different, absorption bands to those from
the rare Maxixe beryl. They were also
able to create similar blue crystals by
irradiation of some other beryls. As will be
seen below, this should be possible when
the beryls contain enough carbonate ions.
Origin of the blue colourThe different colours of beryl are
usually related to paramagnetic ions
(iron, manganese, chromium, vanadium)
substituting for aluminium in the
octahedral sites between the stacks of
silicate rings in the beryl crystal structure.
However, Maxixe beryl has a very low
content of such ions (Roebling and
Tromnau, 1935) and the unusual blue
colour centres of Maxixe and Maxixe-type
beryl are instead located in the beryl
channels.
Using EPR spectroscopy, Andersson
(1979) determined that the colour centre
in Maxixe beryl is the NO3 molecule,
while the colour centre in Maxixe-type
beryl is CO3–. Since these centres have
the same number of electrons in the
same molecular orbitals (that is they are
isoelectronic), their optical absorption
spectra are very similar. However, their
EPR spectra are different because the
nuclei of the colour centres interact
differently with the unpaired electron. The
oxygen and carbon nuclei of CO3– have
no influence on the EPR spectrum, but
the nitrogen nucleus of NO3 splits the EPR
signal into three lines. It is therefore easy
to separate Maxixe and Maxixe-type beryl
by EPR spectroscopy.
Both the NO3 and CO
3– groups
(radicals) are planar and fit in the widest
part of the beryl channel where they are
oriented with their trigonal symmetry axis
parallel to the crystal c-axis. This well-
defined orientation gives rise to the strong
pleochroism of the blue colour.
Creation of NO3 and CO3–
colour centres in berylNassau et al. (1976) concluded that
the blue colour centre in Maxixe-type
beryl is created by irradiation while the
Maxixe colour centre is of natural origin.
Different possibilities of how CO3– and
NO3 radicals could be created in beryl will
now be considered.
One possibility is that CO32- and
NO3– ions existed in the original melt and
were trapped in the channels of the beryl
crystal during its formation. An electron
can be removed from each of these ions
by irradiation to create CO3– and NO
3.
The released electron can be caught by
an impurity proton to form a hydrogen
atom. Such atoms have been detected in
both Maxixe and Maxixe-type beryl by
EPR. If this scheme is correct, it can be
concluded that both colour centres have
been created by irradiation.
A second possibility is that CO2 and
NO2 molecules were trapped from the
original melt during the beryl crystal
formation. Wood and Nassau (1967)
observed the optical absorption of CO2
in many beryl crystals and Andersson
(1979 and 2010) observed the EPR signal
of NO2 in Maxixe beryl. It has been
shown that H2O molecules can diffuse
in the beryl channel (Fukuda, 2009). If a
water molecule enters a wide portion of
the channel containing a NO2 molecule,
it can combine with this molecule to
form NO3. The hydrogens are split off as
single atoms, which have been detected
in the EPR spectrum of Maxixe beryl.
The probability that this combination
of molecules will happen may be very
small, so that it could have taken many
thousands of years until a sufficient
number of stable NO3 molecules were
created to give the Maxixe beryl its
intense blue colour. This process was
proposed by Andersson (2008) to explain
the existence of NO3 in natural beryl
crystals. The corresponding process forms
CO32– in beryl containing CO
2 and in this
case the hydrogen is split off as protons.
Irradiation creates the Maxixe-type colour
centre CO3– and the released electron is
captured by a proton to form a hydrogen
atom.
A third possibility is that OH– ions
diffuse in the structural channel and
combine with CO2 or NO
2 to form
CO32– or NO
3–. This possibility has been
discussed in detail by Andersson (2006).
As in the first possibility, irradiation is
needed to create the Maxixe beryl.
Decay of the NO3 and CO3–
colour centresNassau et al. (1976) found that the
colour of both Maxixe beryl and Maxixe-
type beryl disappeared when the crystals
were exposed to daylight for one week or
were heated to 200°C for one hour. They
observed that while the colour of Maxixe-
type beryl was created in one single
process, its decay exhibited one fast and
one slow component. Edgar and Vance
(1977) found that the decay of the CO3–
EPR signal upon heating of Maxixe-type
beryl at 175°C correlated very well with
the decay of the optical absorption, while
the decay of the hydrogen atom signal
was less pronounced in the initial stage.
Both Maxixe and Maxixe-type beryl
contain hydrogen atoms which are stable
at room temperature, which is rather
unusual. The hydrogen atom easily
dissociates into a proton and an electron.
The released electron can combine with
CO3– to form a CO
32– ion or with NO
3 to
form a NO3– ion, and the colour centres
will disappear. I therefore suggest that the
dissociation of the hydrogen atom is the
cause of bleaching in Maxixe and Maxixe-
type beryl. The hydrogen atom loses its
electron and the bleaching occurs when
the crystals are heated above 100°C or are
exposed to light.
Andersson (2008) found that some
of the electrons which were released
by the irradiation of Maxixe-type beryl
were trapped by CO2 molecules to form

The Journal of Gemmology / 2011 / Volume 32 / No. 5–8
Page 147
A Russian Maxixe beryl?
CO2– radicals. (This explains why the
CO2 absorption in the infrared spectrum
of Krambrock et al. (2002) disappeared
upon irradiation.) These radicals lose
their electrons at a lower temperature
than the hydrogen atoms and cause the
initial decay of the CO3– colour centres.
That is why the decay curve has two
components in Maxixe-type beryl, with
the slow component corresponding to the
decay of the hydrogen atoms. The decay
of colour in Maxixe beryl will have only
one component.
NO2 in Maxixe beryl and in a Russian beryl
The EPR signal of NO2 has been
detected in a colourless Russian beryl by
Sukharzhevskii (1976). It is split into three
lines by the nitrogen nucleus. These lines
are of equal width and intensity when
the magnetic field is oriented parallel to
the crystal c-axis and in the spectrum
they are separated by 66 Gauss, which in
modern units is 6.6 milliTesla (mT). This
beryl was found on the Kola peninsula in
northwestern Russia (Sukharzhevskii, pers.
comm., 2011). The Kola beryl has a high
content of Cs ions, like the other beryls in
which NO2 has been observed.
Dr Gübelin of Lucerne kindly donated
a piece from the Maxixe crystal in his
collection for the EPR measurements,
which were performed in 1977. I was
not able to orient this irregular mm-size
piece parallel to the c-axis, but a later
extrapolation of the NO2 signal positions
observed at other angles converges to
three narrow lines for the orientation
parallel to the c-axis. This extrapolation
(Andersson, 2010) was made before I
was aware of the 1976 publication by
Sukharzhevskii, but fits very well with his
spectrum.
EPR spectra obtained with different
orientations of the magnetic field give
information about the orientation of
the NO2 molecule. Sukharzhevskii
(1976) found that the molecular plane is
perpendicular to the crystal c-axis and
suggested that the NO2 molecules are
located between the stacks of silicate
rings. Solntsev (1981) interpreted the data
differently and located the NO2 molecules
in the beryl channel, at the same position
as the NO3 molecules. He suggested
that they are oriented in six equivalent
positions in the hexagonal symmetry.
Andersson (2010) found that the NO2
molecules in Maxixe beryl are evenly
distributed over all possible orientations
in the plane perpendicular to the crystal
c-axis.
The EPR spectra with the magnetic
field oriented perpendicular to the crystal
c-axis are shown for Maxixe beryl in trace
A and for the Russian beryl in trace B of
Figure 1. For technical reasons the EPR
signal is recorded as the derivative of
the absorption. An integration of trace B
shows the three absorption lines in trace
C of Figure 1. The two low field lines
have been broadened. (Because of the
background noise in trace B, the integral
is not completely accurate: the areas
beneath each of the three absorption lines
should be equal.)
It can be seen that the intensity is
evenly distributed over the range of the
absorption for each of the two low field
lines in trace C. If the NO2 molecules had
only six different orientations as suggested
by Solntsev (1981), the low field lines
should have consisted of a few separate
absorptions. The absorption in trace C
shows that there is an even distribution
of NO2 orientations over all angles in the
Kola beryl, as there is in the Maxixe beryl.
The end points of the distributed
absorptions appear clearly in the
derivative spectrum in trace B and are
marked with 1 and 2 for the two low
field lines. These signals are also present
in trace A from the Maxixe beryl. In this
spectrum line 1 is partly overlapped by
the signal from NO3, which has a much
smaller splitting of 0.5 mT. The EPR signal
of the hydrogen atom is outside the
range of Figure 1 because the hydrogen
nucleus splits the signal into two lines 50
mT apart. The EPR signal from NO2 can
A
B
C
1 2
H
2mT
NO3
3
1
1
2
2
2
3
Figure 1: EPR spectra obtained at 9.2 GHz with the magnetic field H oriented perpendicular to the crystal c-axis. The strength of the field H is changed around the resonance field of the free electron near 330 mT. Trace A was obtained from Maxixe beryl at −180 °C and trace B from the Russian beryl at −196 °C. Trace C is the integral of the spectrum in trace B. Further explanations are given in the text.
The Journal of Gemmology / 2011 / Volume 32 / No. 5–8
Page 148
A Russian Maxixe beryl?
only be observed at temperatures below
−140 °C and is still somewhat broadened
at −180 °C. The derivative peaks are
therefore not so sharp in trace A as in
trace B which was obtained at −196 °C.
Andersson (2010) has shown that it
is a coincidence that line 3 has the same
narrow shape as in the spectrum with the
magnetic field parallel to the c-axis and
that the spread of line 1 is twice as large
as that of line 2. In the spectrum from an
EPR spectrometer operating at another
microwave frequency line 3 would also be
broadened.
DiscussionReports about NO
2 and NO
3 impurities
in other beryls are rare and their
concentrations have been so small that
no colour has been observed. The EPR
spectrum from the 1973 Maxixe-type beryl
contains very small signals from NO2
(Andersson, 2010) and NO3 (Andersson,
1979). Solntsev (1981) reported EPR
parameters for NO2 and NO
3 in natural
beryl and in synthetic hydrothermal beryl,
but does not mention a blue colour or
the origin of his samples. Krambrock
et al. (2002) detected EPR signals from
CO3– and NO
3 in natural pink beryl from
Minas Gerais in Brazil. It is strange that
CO3– is present in the unirradiated crystal
and that a signal identified as NO2 was
observed only after irradiation. In a later
publication, Pinheiro et al. (2007) reported
that only the NO3 signal was present in
the natural crystal while the CO3– signal
appeared after irradiation. The intensity of
the NO3 signal remained about the same
before and after the irradiation.
An interpretation of the observations
by Pinheiro et al. (2007) is that the natural
crystal contained CO32– and an amount of
NO3 which was not enough to give the
crystal a colour. The irradiation created
enough CO3– to colour the crystal blue but
no additional NO3. If the natural crystal
had contained NO3–, the irradiation should
have created additional NO3.
Two of the possible processes for
creation of the colour centre in Maxixe
beryl involve NO3– ions and irradiation.
The irradiation need not have been
artificial, but could have come from
natural sources. Irradiation also creates
CH3 from CH
4 molecules in the beryl
channel and the EPR signal from CH3 can
easily be detected in the spectrum from
the artificially irradiated Maxixe-type beryl
(Andersson, 2008). A much smaller CH3
signal is detected in the Maxixe beryl
and is indicated by arrows in trace A of
Figure 1. Although natural radiation at
the Maxixe locality may have created
such a small signal, it was probably not
sufficiently intense to have caused the
much stronger NO3 signal. (An alternative,
but unlikely, interpretation is that the
natural radiation was very strong and that
the CH4 content in Maxixe beryl was very
small.) This supports the assumption that
NO3 was created by a different process
and not by irradiation of NO3–.
The most likely process involves a
combination of H2O and NO
2 without the
influence of radiation. The NO2 molecules
could have been trapped in the beryl
crystals during their formation and some
of these impurities have been transformed
into NO3 over geological time. This could
have happened in both the Maxixe beryl
and the Russian beryl. The NO3 colour
centres in the Kola beryl may then have
been converted into NO3– by catching the
electrons from the decay of the hydrogen
atoms when the crystal was exposed to
daylight or was heated above 100 °C in
recent geological time. Sukharzhevskii
(1976) mentions that a zone of the crystal
is weakly blue, which may indicate that
some NO3 remains.
The rest of the original NO2 molecules
are not influenced by heat or light and
their EPR signal remains the same in both
Maxixe and Kola beryl. The signals from
the hydrogen atoms and NO3 molecules
in Maxixe beryl disappear when the
crystal is bleached. The colour centres are
then not converted back to NO2 but are
transformed to NO3– ions.
Nassau et al. (1976) found that the
colour of bleached Maxixe beryl could
be restored by irradiation with neutrons
or γ-rays. This would be the case if the
irradiation removes the electron from NO3–
, which recreates the NO3 colour centre.
Irradiation is therefore needed to restore
the colour centre in Maxixe beryl, but not
for its initial creation. Andersson (2008)
showed that the colour of Maxixe-type
beryl can be restored by UV irradiation.
If this is the case also for Maxixe beryl,
it may be possible that the Kola beryl
could display the same deep blue colour
as Maxixe beryl without the discolouring
caused by more intense irradiation
(Nassau et al., 1976). This possibility
should be borne in mind if such stones
should appear in the gemstone market.
Collectors and dealers should be aware
that such a blue beryl would lose its
colour upon extended exposure to
daylight.
ConclusionConsiderable amounts of NO
2
impurities have been found in only two
beryl crystals, the Kola beryl and the
Maxixe beryl. The EPR spectrum of the
colourless Kola beryl contains only the
NO2 signal, while that of the Maxixe beryl
also contains NO3 and hydrogen signals.
The latter two signals disappear when the
Maxixe beryl is bleached. The Kola beryl
may therefore be a bleached Maxixe beryl
and should turn blue when it is irradiated.
A definite classification of the Kola
beryl as a Maxixe beryl could only be
made if the NO3 colour centre is detected
after irradiation of a crystal from the
same location as the beryl which was
investigated in 1976.
References Andersson, L.O., 1979. The difference
between Maxixe beryl and Maxixe-
type beryl: an electron paramagnetic
resonance investigation. J. Gemm., 16,
313–17
Andersson, L.O., 2006. The positions of
H+, Li+ and Na+ impurities in beryl.
Phys. Chem. Minerals, 33, 403–16
Andersson, L.O., 2008. EPR investigation
of the methyl radical, the hydrogen
atom and carbon oxide radicals
in Maxixe-type beryl. Phys. Chem.
Minerals, 35, 505–20
The Journal of Gemmology / 2011 / Volume 32 / No. 5–8
Page 149
A Russian Maxixe beryl?
Andersson, L.O., 2010. EPR investigation
of NO2 and CO
2– and other radicals in
beryl. Phys. Chem. Minerals, 37, 435–51
Edgar, A., and Vance, E.R. 1977.
Electron paramagnetic resonance,
optical absorption, and magnetic
circular dichroism studies of the CO3–
molecular-ion in irradiated natural
beryl. Phys. Chem. Minerals, 1, 165–78
Fukuda, J., Shinoda, K., Nakashima, S.,
Miyoshi, N., and Aikawa, N., 2009.
Polarized infrared spectroscopic
study of diffusion of water molecules
along structure channels in beryl. Am.
Mineral., 94, 981–5
Krambrock, K., Pinheiro, M.V.B., Guedes,
K.J., Medeiros, S.M., Schweizer, S.,
Castaneda, C., Botelho, N.F., and
Pedrosa-Soares, A.C., 2002. Radiation-
induced centers in Cs-rich beryl studied
by magnetic resonance, infrared and
optical spectroscopy. Nucl. Instrum.
Methods B, 191, 285–90
Nassau, K., Prescott, B.E., and Wood, D.L.,
1976. The deep blue Maxixe-type color
center in beryl. Am. Mineral., 61, 100–7
Pinheiro, M.V.B., Krambrock, K., Guedes,
K.J., and Spaeth, J.M., 2007. Optically-
detected magnetic resonance of
molecular color centers CO3– and NO
3
in gamma-irradiated beryl. Phys. Stat.
Sol. (c), 4, 1293–6
Roebling, W., and Tromnau, H.W., 1935.
Maxixeberyll. II. Zentralbl. Mineral.
Geol. Paläont., 1935A, 134–9
Schiffman, C.A., 1977. Gemmologische
Studie an einem Original-Maxixe-Beryll.
Z. Dt. Gemmol. Ges., 26, 135–41
Schlossmacher, K., and Klang, H., 1935.
Der Maxixeberyll. I. Zentralbl. Mineral.
Geol. Paläont., 1935A, 37–44
Solntsev, V.P., 1981. The nature of
colour centres and EPR in beryl and
chrysoberyl. Trudy Instituta Geologii
i Geofiziki, Akademiya Nauk SSSR
(Novosibirsk), 499, 92–140 (in Russian)
The AuthorDr Lars Olov AnderssonBrunnenweid 49, CH-5643 Sins, Switzerland
e-mail: [email protected]
Sukharzhevskii, S.M., 1976. Investigation
of the NO2 molecular structure in beryl.
In: Problems in geochemistry and
typomorphism of minerals. Leningrad
State University, Leningrad, 22–9 (in
Russian)
Wild, G.O., 1933. Mitteilung über ein
anscheinend neues Berylliumsilikat.
Zentralbl. Mineral. Geol. Paläont., 1933A,
38–9
Wood, D.L., and Nassau, K., 1967. Infrared
spectra of foreign molecules in beryl.
J. Chem. Phys., 47, 2220–8

To order your TravelGem Microscope from the Gem-A shop go to www.gem-a.com/shop.aspx or contact Alan Clark on +44 (0)20 7404 3334, email [email protected].
Gem-A Corporate MembershipGain advantages including:
• Use of Gem-A logo or Coat of Arms (illustrated right)• GIA Diamond Grading Reports via Gem-A• Discounts on courses and workshops• Discounts on books and instruments• Regular meetings for information exchange and networking• Gem-A's popular magazine Gems & Jewellery.
Raise your profile . . . Raise customer confidence with
Gem-A Corporate Membership Logo
Gem-A Gold Corporate Coat of Arms
Any UK-based company may apply to become a Corporate Member of Gem-A if their business is the sale, auction, manufacture or appraisal of gems or gem-set jewellery
If you employ a Fellow (FGA) or Diamond member (DGA) of Gem-A you may apply for Gold Corporate Membership, entitling you to display the Gold Corporate Coat of Arms stating that you employ a qualified gemmologist — the ultimate sign of gem excellence.
The annual membership fee for Corporate Members and Gold Corporate Members for 2012 is £160.00.
However, it may cost you nothing extra for 2012 if you already employ and pay the subscriptions for two Fellow, Diamond or Associate Members of Gem-A. This is because the Corporate Membership subscription includes two individual subscriptions.
For further details and to apply, go to www.gem-a.com/membership/corporate-membership.aspx or contact the Membership Department on 020 7404 3334 email [email protected]
A Gem-A initiative to support your business
The Gemmological Association of Great Britain27 Greville Street (Saffron Hill entrance), London EC1N 8TNtel: 020 7404 3334 fax: 020 7404 8843 email: [email protected] UK Registered Charity No. 1109555

The Journal of Gemmology / 2011 / Volume 32 / No. 5–8
©2011 The Gemmological Association of Great Britain Page 151
1. IntroductionGem materials designated as trapiche
are rare in the gemstone and mineral
trade, and this is because there is only a
limited number of mineral species which
show a clear trapiche pattern, i.e. a
pattern with a clear separation into distinct
growth sectors, best seen in cabochons or
polished slices. The boundaries of these
Chemical and growth zoning in trapiche tourmaline from Zambia — a re-evaluationDr Karl Schmetzer, Dr Heinz-Jürgen Bernhardt and Thomas Hainschwang
Abstract: Trapiche tourmalines from Zambia show the hexagonal prism a {112–0}, the positive pyramids r {101–1} and o {022–1} and the negative pyramid –r {011–1–} as dominant external crystal forms. The trapiche pattern is formed by the positioning of liquid and solid inclusions which are trapped at growth boundaries between pyramidal and prismatic growth sectors. Growth-induced elongate voids are also formed perpendicular to the dominant growth faces, which are inclined at 27°, at 46° or at 90° to the pedion {0001} of the tourmaline hosts.
All the trapiche tourmalines are chemically zoned with isomorphic substitutions of Ca by Na and Mg by Al, which is characteristic for tourmalines of the uvite-dravite solid solution series. Content of Na increases and of Ca decreases from core to rim of all tourmalines. However, at the boundaries between different growth sectors (forming the geometric trapiche pattern of the samples), tourmaline compositions with higher Na and lower Ca contents than measured in adjacent pyramidal and prismatic growth sectors were found.
The formation of this complex structural and chemical pattern is consistent with the formation of the tourmaline crystals in a two step process, with the skeletal growth of a sodium-rich dravite in a first step and the subsequent, layer-by-layer growth of a second tourmaline generation. The growth of the second generation started with calcium-rich fluor-uvite and was followed step-by-step by a more sodium-rich dravite. The green coloration of the samples is caused by minor contents of vanadium and chromium.
growth sectors are normally sharp and
decorated with mineral or fluid inclusions,
in this way separating a core from a rim
or separating different parts within the
rim. From these sector boundaries which
are also described as arms of a fixed
six-rayed or three-rayed star, growth
tubes filled with mineral and/or fluid
phases commonly run into the different
Above: Slices of trapiche tourmaline from Zambia cut perpendicular to the c-axis. In the centre of the slice, upper left, the dark arms of the fixed three-rayed star separate three pyramidal growth sectors. The slice, lower right, cut from the same tourmaline, has a rim with six prismatic growth sectors which are separated from each other and from the pyramidal growth sectors of the centre by less transparent boundaries. View parallel to the c-axis, size of the samples about 13 × 12 mm. Photos by T. Hainschwang.

The Journal of Gemmology / 2011 / Volume 32 / No. 5–8
Page 152
Chemical and growth zoning in trapiche tourmaline from Zambia — a re-evaluation
transparent growth sectors between these
arms. The gem minerals showing a distinct
trapiche pattern most commonly seen
are emeralds from Colombia and rubies
from Mong Hsu, Myanmar (Nassau and
Jackson, 1970a,b; Schmetzer et al., 1996).
Different models have been described
to explain the growth mechanism of the
trapiche pattern (see, e.g., Nassau and
Jackson, 1970 a,b; Sunagawa et al., 1999).
Recently, another trapiche mineral was
added to this list, trapiche tourmaline from
Zambia (Hainschwang et al., 2007).
According to Hainschwang et al.
(2007), the Zambian trapiche tourmalines
originate from the Kavungu mine near
the small village of Jivunda, southwest of
Mwinilunga in the northwestern part of
the country near the border with Angola.
Tourmaline crystals show the hexagonal
prism a {112-0} as well as the positive
rhombohedron r {101-1} and the negative
rhombohedron −r {101-1-} as external crystal
forms.
Slices of trapiche tourmalines cut
perpendicular to the c-axis can show two
different patterns (see photograph on
page 151):
(a) a three-rayed star with three
transparent tourmaline sectors
between the three arms of the fixed
star and, in most crystals,
(b) the pattern described above in the
centre of the slice, surrounded by six
transparent sectors of tourmaline, with
six boundaries between the centre and
the rim and six boundaries between
the six sectors of the rim.
The crystals may also contain two
types of channels, running “nearly parallel
to the c-axis” and “close to perpendicular”
to the c-axis.
After the description of trapiche
tourmaline from Zambia was published,
one author (KS) examined some crystals
reportedly from the same occurrence
which showed additional crystal faces
not mentioned in the Hainschwang et
Figure 1a: Three slices of trapiche tourmaline from Zambia with hexagonal outline cut from the same crystal perpendicular to the c-axis; in the centre, the arms of a fixed three-rayed star separate three pyramidal growth sectors of the tourmaline crystal; the rim consists of six prismatic growth sectors which are separated from each other and from the pyramidal growth sectors of the centre by less transparent boundaries; the sizes of cores and rims vary according to the position of the slices along the c-axis of the tourmaline crystal. Views parallel to the c-axis, the samples measure about 32 mm in diameter. Figure 1b: Three slices of trapiche tourmaline from Zambia with trigonal outline cut from the same crystal perpendicular to the c-axis; in the centre, the arms of a fixed three-rayed star separate three pyramidal growth sectors of the tourmaline crystal; the rim consists of nine (three plus six) prismatic growth sectors which are separated from each other and from the pyramidal growth sectors of the centre by less transparent boundaries; the sizes of cores and rims vary according to the position of the slices along the c-axis of the tourmaline crystal. Views parallel to the c-axis, size of the samples about 7 × 8 mm. Figure 1c: Two slices of trapiche tourmaline from Zambia with hexagonal outline cut perpendicular to the c-axis; in the centre, the boundaries distinguish six (three plus three) different pyramidal growth sectors; at the rim there are six prismatic growth sectors which are distinguished from each other and from the pyramidal growth sectors of the centre by more included borders or boundaries. Views parallel to the c-axis, size of the samples about 9 × 10 mm. All photos by T. Hainschwang: a and b in reflected light; c in transmitted light.
1b
1a
1c
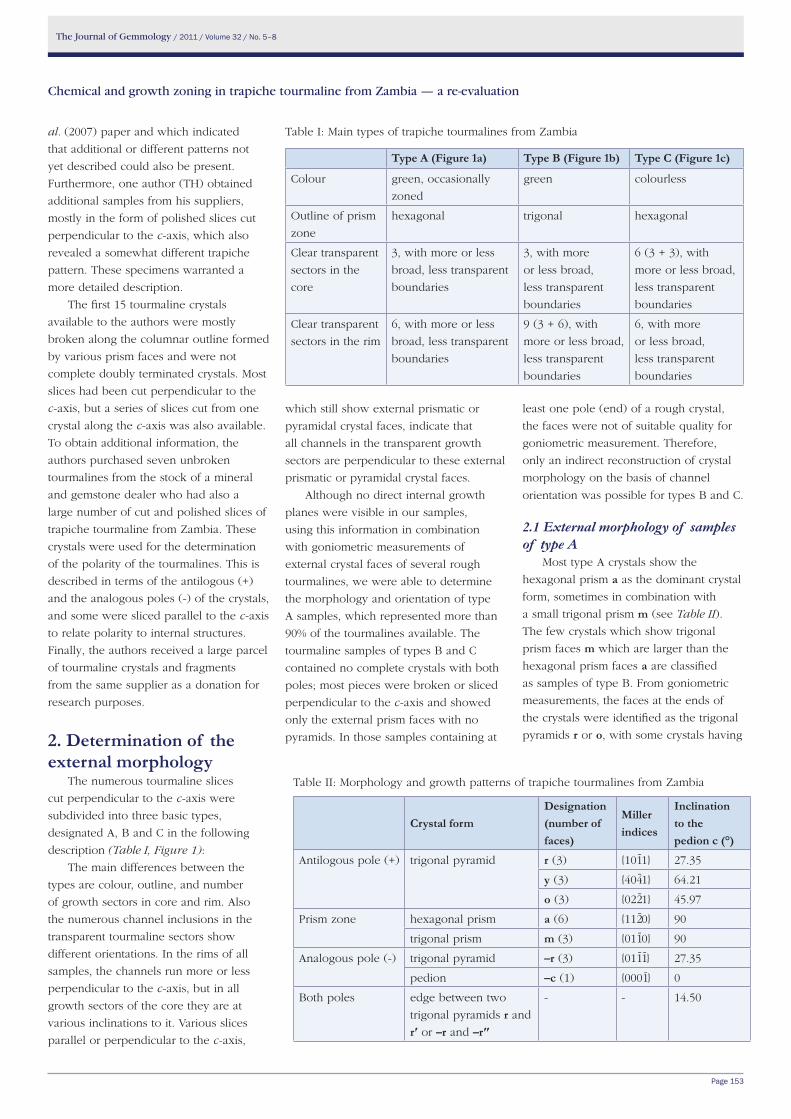
The Journal of Gemmology / 2011 / Volume 32 / No. 5–8
Page 153
Chemical and growth zoning in trapiche tourmaline from Zambia — a re-evaluation
al. (2007) paper and which indicated
that additional or different patterns not
yet described could also be present.
Furthermore, one author (TH) obtained
additional samples from his suppliers,
mostly in the form of polished slices cut
perpendicular to the c-axis, which also
revealed a somewhat different trapiche
pattern. These specimens warranted a
more detailed description.
The first 15 tourmaline crystals
available to the authors were mostly
broken along the columnar outline formed
by various prism faces and were not
complete doubly terminated crystals. Most
slices had been cut perpendicular to the
c-axis, but a series of slices cut from one
crystal along the c-axis was also available.
To obtain additional information, the
authors purchased seven unbroken
tourmalines from the stock of a mineral
and gemstone dealer who had also a
large number of cut and polished slices of
trapiche tourmaline from Zambia. These
crystals were used for the determination
of the polarity of the tourmalines. This is
described in terms of the antilogous (+)
and the analogous poles (-) of the crystals,
and some were sliced parallel to the c-axis
to relate polarity to internal structures.
Finally, the authors received a large parcel
of tourmaline crystals and fragments
from the same supplier as a donation for
research purposes.
2. Determination of the external morphology
The numerous tourmaline slices
cut perpendicular to the c-axis were
subdivided into three basic types,
designated A, B and C in the following
description (Table I, Figure 1):
The main differences between the
types are colour, outline, and number
of growth sectors in core and rim. Also
the numerous channel inclusions in the
transparent tourmaline sectors show
different orientations. In the rims of all
samples, the channels run more or less
perpendicular to the c-axis, but in all
growth sectors of the core they are at
various inclinations to it. Various slices
parallel or perpendicular to the c-axis,
Table I: Main types of trapiche tourmalines from Zambia
Type A (Figure 1a) Type B (Figure 1b) Type C (Figure 1c)
Colour green, occasionally
zoned
green colourless
Outline of prism
zone
hexagonal trigonal hexagonal
Clear transparent
sectors in the
core
3, with more or less
broad, less transparent
boundaries
3, with more
or less broad,
less transparent
boundaries
6 (3 + 3), with
more or less broad,
less transparent
boundaries
Clear transparent
sectors in the rim
6, with more or less
broad, less transparent
boundaries
9 (3 + 6), with
more or less broad,
less transparent
boundaries
6, with more
or less broad,
less transparent
boundaries
which still show external prismatic or
pyramidal crystal faces, indicate that
all channels in the transparent growth
sectors are perpendicular to these external
prismatic or pyramidal crystal faces.
Although no direct internal growth
planes were visible in our samples,
using this information in combination
with goniometric measurements of
external crystal faces of several rough
tourmalines, we were able to determine
the morphology and orientation of type
A samples, which represented more than
90% of the tourmalines available. The
tourmaline samples of types B and C
contained no complete crystals with both
poles; most pieces were broken or sliced
perpendicular to the c-axis and showed
only the external prism faces with no
pyramids. In those samples containing at
least one pole (end) of a rough crystal,
the faces were not of suitable quality for
goniometric measurement. Therefore,
only an indirect reconstruction of crystal
morphology on the basis of channel
orientation was possible for types B and C.
2.1 External morphology of samples of type A
Most type A crystals show the
hexagonal prism a as the dominant crystal
form, sometimes in combination with
a small trigonal prism m (see Table II).
The few crystals which show trigonal
prism faces m which are larger than the
hexagonal prism faces a are classified
as samples of type B. From goniometric
measurements, the faces at the ends of
the crystals were identified as the trigonal
pyramids r or o, with some crystals having
Crystal formDesignation(number of faces)
Miller indices
Inclination to the pedion c (°)
Antilogous pole (+) trigonal pyramid r (3) {101-1} 27.35
y (3) {404-1} 64.21
o (3) {022-1} 45.97
Prism zone hexagonal prism a (6) {112-0} 90
trigonal prism m (3) {011-0} 90
Analogous pole (-) trigonal pyramid –r (3) {011-1-} 27.35
pedion –c (1) {0001-} 0
Both poles edge between two
trigonal pyramids r and
r′ or –r and –r″
- - 14.50
Table II: Morphology and growth patterns of trapiche tourmalines from Zambia
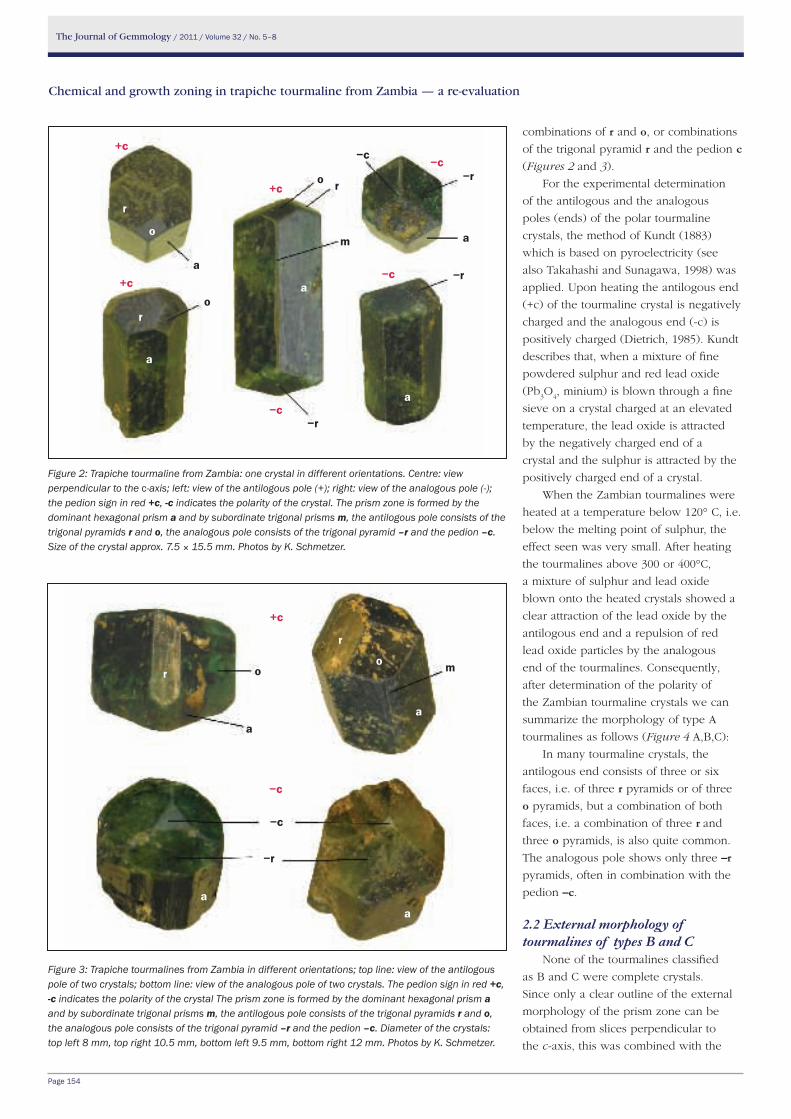
The Journal of Gemmology / 2011 / Volume 32 / No. 5–8
Page 154
Chemical and growth zoning in trapiche tourmaline from Zambia — a re-evaluation
combinations of r and o, or combinations
of the trigonal pyramid r and the pedion c
(Figures 2 and 3).
For the experimental determination
of the antilogous and the analogous
poles (ends) of the polar tourmaline
crystals, the method of Kundt (1883)
which is based on pyroelectricity (see
also Takahashi and Sunagawa, 1998) was
applied. Upon heating the antilogous end
(+c) of the tourmaline crystal is negatively
charged and the analogous end (-c) is
positively charged (Dietrich, 1985). Kundt
describes that, when a mixture of fine
powdered sulphur and red lead oxide
(Pb3O
4, minium) is blown through a fine
sieve on a crystal charged at an elevated
temperature, the lead oxide is attracted
by the negatively charged end of a
crystal and the sulphur is attracted by the
positively charged end of a crystal.
When the Zambian tourmalines were
heated at a temperature below 120° C, i.e.
below the melting point of sulphur, the
effect seen was very small. After heating
the tourmalines above 300 or 400°C,
a mixture of sulphur and lead oxide
blown onto the heated crystals showed a
clear attraction of the lead oxide by the
antilogous end and a repulsion of red
lead oxide particles by the analogous
end of the tourmalines. Consequently,
after determination of the polarity of
the Zambian tourmaline crystals we can
summarize the morphology of type A
tourmalines as follows (Figure 4 A,B,C):
In many tourmaline crystals, the
antilogous end consists of three or six
faces, i.e. of three r pyramids or of three
o pyramids, but a combination of both
faces, i.e. a combination of three r and
three o pyramids, is also quite common.
The analogous pole shows only three –r pyramids, often in combination with the
pedion –c.
2.2 External morphology of tourmalines of types B and C
None of the tourmalines classified
as B and C were complete crystals.
Since only a clear outline of the external
morphology of the prism zone can be
obtained from slices perpendicular to
the c-axis, this was combined with the
Figure 2: Trapiche tourmaline from Zambia: one crystal in different orientations. Centre: view perpendicular to the c-axis; left: view of the antilogous pole (+); right: view of the analogous pole (-); the pedion sign in red +c, -c indicates the polarity of the crystal. The prism zone is formed by the dominant hexagonal prism a and by subordinate trigonal prisms m, the antilogous pole consists of the trigonal pyramids r and o, the analogous pole consists of the trigonal pyramid –r and the pedion –c. Size of the crystal approx. 7.5 × 15.5 mm. Photos by K. Schmetzer.
Figure 3: Trapiche tourmalines from Zambia in different orientations; top line: view of the antilogous pole of two crystals; bottom line: view of the analogous pole of two crystals. The pedion sign in red +c, -c indicates the polarity of the crystal The prism zone is formed by the dominant hexagonal prism a and by subordinate trigonal prisms m, the antilogous pole consists of the trigonal pyramids r and o, the analogous pole consists of the trigonal pyramid –r and the pedion –c. Diameter of the crystals: top left 8 mm, top right 10.5 mm, bottom left 9.5 mm, bottom right 12 mm. Photos by K. Schmetzer.
+c
−c
−c
−r
m
a
a
r
oo
a
r
a
−r
−r
−r
r
a
a
oa
m
o+c
−c
−c
−c
−c+c
+c
r
a
a
r
o

The Journal of Gemmology / 2011 / Volume 32 / No. 5–8
Page 155
Chemical and growth zoning in trapiche tourmaline from Zambia — a re-evaluation
information available from the orientation
of elongate voids in transparent internal
growth sectors (see Table II).
Samples of type B (Figure 4 D) show
trigonal habits with larger trigonal prism
faces m and smaller hexagonal prisms a.
The orientation of growth tubes indicates
that the trigonal pyramid r is the dominant
crystal form.
Samples of type C (Figure 4 E) show a
hexagonal outline of the prism zone with
larger hexagonal prism faces a and only
subordinate trigonal prism faces m. Within
the clear central growth sectors, two main
orientations of needle-like growth tubes
are visible and these indicate that two
different trigonal pyramids, namely o and
y, are present.
2.3 Single slices and series of slices of trapiche tourmalines from Zambia
For the European market, transparent
tourmaline crystals or transparent parts
within tourmaline crystals are normally
sliced perpendicular to the c-axis and sold
as individual slices or as complete series
of tourmaline plates. Some crystals are
cut as cabochons also in that particular
orientation. Slices parallel to the c-axis
were not available commercially.
Type A: In this study numerous single
slices perpendicular to the c-axis and
three complete series of slices consisting
of seven, eight or nine individual
tourmaline plates cut from almost
completely transparent crystals or crystal
fragments along the c-axis were examined.
From another six crystals, purchased from
the trade, with at least partly transparent
or translucent areas, individual slices
perpendicular to the c-axis were prepared.
Some non-transparent parts of crystals
were not sliced.
Types B and C: From these categories,
only slices perpendicular to the c-axis
or fragments of prismatic crystals were
available. It was possible to study small
series of two or three slices cut along c
from a few single crystals, but no slice
parallel to c with a complete internal
morphology could be obtained.
Figure 4: Morphology of trapiche tourmalines from Zambia; the prism zone is formed by the dominant hexagonal prism a and by subordinate trigonal prisms m (examples A,B,C,E); in example D, the prism zone is formed by three dominant trigonal prism faces m and subordinate hexagonal prisms a; the antilogous pole consists of the trigonal pyramids r, o and y, the analogous pole consists of the trigonal pyramid –r and the pedion –c.Top line: view perpendicular to the c-axis (clinographic projections), middle line: view parallel to the +c axis (parallel projections), bottom line: view parallel to the -c axis (parallel projections). Crystal drawings and artwork by K. Schmetzer.
A B C D E
−r
−c
−r
−c
−r
−c
−r
−c
−r
−c
−r −r −r−r −r
o o or r r
r
y
a a a a a
m
oo
ooo
r
mm m m
y
rrr
r
oo
r

The Journal of Gemmology / 2011 / Volume 32 / No. 5–8
Page 156
Chemical and growth zoning in trapiche tourmaline from Zambia — a re-evaluation
Figure 5: Schematic sections through a tourmaline crystal (top middle, clinographic projection) with orientation of the sections perpendicular to the prism a (left) and perpendicular to the prism m (right), only crystal faces are labelled but not crystal edges; the directions of crystal growth are indicated by green arrows; a preferential crystal growth at the antilogous pole compared to the analogous pole is indicated. Crystal drawings and artwork by K. Schmetzer.
Figure 6: Series of slices of a trapiche tourmaline crystal from Zambia cut perpendicular to the c-axis (middle and lower line); the sequence of slices (Nos. 1 to 9) runs from the antilogous pole towards the analogous pole. Slice 1 represents a section through three trigonal pyramids o, slices 2 to 8 represent sections through three trigonal pyramids o and six prism faces a; slice 9 represents a section through three pyramids –r and six prism faces a; the approximate position of the slices within the complete crystal is given in the upper left diagram; the trigonal and hexagonal outline of the sections is also given in the upper line (middle and right). Diameter of slices 2 to 9 approx. 8 mm. Photos by T. Hainschwang, crystal drawings and artwork by K. Schmetzer.
1 3 5 7 9
2 4 6 8
−r
−c
92–81
oo
r
r
r
−r
ma
o1
2
5
9
8
am
ro
−raa
+
−c−
−c−
−r
m
ro
+

The Journal of Gemmology / 2011 / Volume 32 / No. 5–8
Page 157
Chemical and growth zoning in trapiche tourmaline from Zambia — a re-evaluation
3. The trapiche pattern: geometrical description
Tourmaline crystals from certain
occurrences, especially samples from
Madagascar, show a distinct growth and
colour zoning with sharp boundaries
(see, e.g., Benesch, 1990; Wöhrmann,
2002; Zang et al., 2002; Rustemeyer,
2003; Lussier and Hawthorne, 2011). In
cross sections parallel and perpendicular
to the c-axis, growth and colour zoning
parallel to the pedion as well as parallel
to different prism and pyramidal faces is
directly visible.
In contrast, the trapiche pattern in
crystals from Zambia consists of different
growth sectors, which are separated by
more or less sharp boundaries. These
boundaries, in general, are narrow areas
within the tourmaline crystals with high
concentrations of mineral and fluid
inclusions, and where the elongated voids
or channels were initiated to extend into
the surrounding tourmaline sectors. These
channels are always perpendicular to
the growing crystal face of the relevant
growth sector, i.e. perpendicular to the
dominant hexagonal prism a or to one
of the different trigonal pyramids r, o, y
and –r. Although individual growth layers
with sharp boundaries are not visible,
measurement of the inclination of the
elongated voids allows the determination
and identification of the growth plane and
surrounding sector, i.e. the ‘host’ sector
of the channel. The different positions of
trapiche sector boundaries in successive
slices of a crystal along the c-axis or the
changes within trapiche sector boundaries
allow an insight into the growth history of
a crystal.
3.1 Samples of type A From observations of slices parallel
to the c-axis it is apparent that there was
more crystal growth from the centre to
the antilogous pole than from the centre
to the analogous pole. In approximate
terms, the length from the origin (centre)
of crystal growth to the analogous end of
the crystal is in the range of 5 to 15% of
the total length of the crystal (Figure 5).
Furthermore, where the parts of the crystal
between the centre and the analogous end
are not transparent, those in the gem and
mineral trade start a series of slices along
the c-axis at or slightly above the crystal
centre and run in a sequence towards its
antilogous end. Several non-transparent
ends of crystals, which were left over (i.e.
which were not sliced) show the pedion
–c and the trigonal pyramid –r.
One series of nine slices examined
(Figure 6) consists of one slice with three
central growth sectors with channels
inclined at about 27° to the c-axis (slice
9, representing a core with the trigonal
pyramid –r), and eight successive slices
with three central growth sectors with
elongated voids inclined at about 45° to
the c-axis (slices 1 to 8, representing a
Figure 7: Series of slices of a trapiche tourmaline crystal from Zambia cut parallel to the c-axis (middle line in reflected light, right line in transmitted light); a schematic drawing of the original crystal (clinographic projection) is on the upper left; a schematic section through the centre (z) of the tourmaline crystal is on the centre left; in views parallel to the +c axis and the –c axis (lower left), the approximate positions of the three sections are indicated. Size of the tourmaline slices: top 14 × 25 mm, middle 14 × 25 mm, bottom 11 × 25 mm. Photos by T. Hainschwang and K. Schmetzer, crystal drawings and artwork by K. Schmetzer.
o
m
a
r
−r
edge−r −r′
edger r′
ro
−r−c
−r
a
r
a
a
3
2
1
3
2
1
Z
Z
−r
−r
−r
−r
−r −r
r r
r r
r r
3
2
1
Z
a

The Journal of Gemmology / 2011 / Volume 32 / No. 5–8
Page 158
Chemical and growth zoning in trapiche tourmaline from Zambia — a re-evaluation
core with the trigonal pyramid o). Slices 3
to 9, in addition, showed rims consisting
of six growth sectors each, representing
the hexagonal prism a. The two remaining
slices in the series (slices 1 and 2) showed
no rim related to prism zones.
Several slices of type A crystals
parallel to the c-axis show external
faces parallel to the prism a as well
as parallel to the trigonal pyramids r (at the antilogous pole) and –r (at the
analogous pole). From one larger crystal
(Figure 7) three slices show the edges
between adjacent r or between adjacent
–r pyramids, with an inclination of about
14.5° to the pedion c (Table II, Figure 7).
In Figure 7, it is apparent that these
slices contain larger non-transparent
areas of tourmaline with abundant
trapped solid or liquid inclusions. Most of
these channels are confined to margins
between different growth sectors, and end
irregularly within an adjacent transparent
growth sector.
Two series of seven or eight
tourmaline slices cut perpendicular to the
c-axis are variably transparent (Figure 8).
Both series started on the antilogous side
of the centre of crystal growth, so the
analogous pole is not represented. In
the slices closest to the crystal centres,
the core of the crystals consists of three
growth sectors with channels inclined
at 27° to the c-axis, representing growth
sectors related to the trigonal pyramid
r. These are surrounded by six growth
sectors with channels inclined at 90° to
the c-axis, representing growth sectors
related to the hexagonal prism a (slice 7
in Figure 8).
In both series of slices, the non-
transparent margins between the
three central r growth sectors become
successively broader with distance from
the centre of the crystal (slices 1 to 6 in
Figure 8). Within these margins, numerous
mineral and fluid inclusions were trapped,
mostly in elongate voids. These channels
are inclined at about 27° to the c-axis,
which indicates that these areas represent
growth sectors confined to the trigonal
pyramid r. Within the two series of
slices, the hexagonal prism growth zones
gradually become smaller and are not
present in the last tourmaline plates (slices
1 and 2) which show only larger, mostly
non-transparent r growth sectors.
Slices 2 and 7 of the crystal depicted
in Figure 8 were used for microprobe
analyses (see also Figures 18 and 19).
3.2 Samples of type B and CEach individual part of a type B
crystal or single slice shows three central
growth sectors with channels inclined at
about 27° to the c-axis (representing the
trigonal pyramids r or –r), and three larger
growth sectors at the rim (representing
the trigonal prism m). In some samples,
smaller growth sectors related to the prism
a are also present in the rim. Slices cut
from a single crystal are shown in Figure
1b (see also Figure 4 D).
Type C tourmalines are mostly
colourless and contain a core consisting of
six transparent tourmaline growth sectors
within a rim of six growth sectors related
to the hexagonal prism a. The elongated
voids within the six sectors of the central
core show two different inclinations to
c, which indicate that the faces within
these zones are the trigonal pyramids
Figure 8: Series of slices of a trapiche tourmaline crystal from Zambia cut perpendicular to the c-axis (middle lines in reflected light, lower lines in transmitted light); as indicated in the diagram upper left, the sequence of slices (Nos 1 to 7) runs from the antilogous pole towards the analogous pole. Slices 1 to 7 represent sections through three trigonal pyramids r and six prism faces a. Size of the slices 16 × 18 mm. Photos by T. Hainschwang and K. Schmetzer, crystal drawings and artwork by K. Schmetzer.
1
7531
642
753
642
7
4
1
r
r
a
−r
m
o

The Journal of Gemmology / 2011 / Volume 32 / No. 5–8
Page 159
Chemical and growth zoning in trapiche tourmaline from Zambia — a re-evaluation
Figure 9: Section through a trapiche tourmaline crystal cut parallel to the c-axis; the complete crystal is in the lower right, a schematic section is in the upper line (middle), and enlarged views of different parts of the crystal are given in other photographs. Growth sectors belonging to the trigonal pyramids r and –r and the hexagonal prism a are indicated; the growth sectors are distinguished by margins with abundant solid and liquid inclusions; and within the transparent areas of various growth sectors, channels filled with liquid or solid matter and irregularly shaped areas with a high concentration of inclusions are visible. The prime symbol denotes another face in the same zone, so that r, r′ and r″ are the three pyramid faces of the r zone. Size of the crystal approx. 10 × 20 mm; thickness of the section approx. 60 µm; crossed polarizers. Photos by H.-J. Bernhardt.
Figure 10: Section through a trapiche tourmaline crystal cut parallel to the c-axis; the complete crystal is in the upper right, a schematic section is in the centre and enlarged views of different parts of the crystal are given in other photographs. Growth sectors belonging to the trigonal pyramids r, o and –r and the hexagonal prism a are indicated; the growth sectors are distinguished by margins with high concentrations of solid and liquid inclusions; within the transparent areas of various growth sectors, channels filled with liquid or solid matter, and irregularly shaped areas with a high concentration of inclusions are visible. Size of the crystal approx. 10 × 16 mm; thickness of the section approx. 60 µm; crossed polarizers. Photos by H.-J. Bernhardt.
o and y (Figure 1c and see Figure 4 E).
These observations indicate crystals with
hexagonal habit but with somewhat
steeper pyramidal faces y (Table II).
4. Thin sections of type A crystals parallel to the c-axis
In contrast to the slices parallel to c
with thicknesses in the mm range several
sections 60 μm thick were prepared and
two examples are shown in Figures 9
and 10. Each section was cut parallel to
one of the larger hexagonal prism faces
a. One section shows a habit consisting
predominantly of the hexagonal prism a
in combination with r and –r pyramids
(Figure 9) and the other shows additional
o growth sectors increasing in size during
crystal growth (Figure 10). With crossed
polarizers, the orientation of numerous
elongate voids is clearly visible and most
channels are orientated perpendicular
to the external crystal faces. Some
channels however are inclined or even
perpendicular to the plane of the section.
The sections parallel to the c-axis
show external faces parallel to the prism
a, the trigonal pyramids r and o (at the
antilogous pole) and –r (at the analogous
pole). The outlines of idealized sections
through the three crystals are also given
in Figures 9 and 10 and contain the edges
between adjacent r or between adjacent
–r pyramids, with an inclination of about
14.5° to the pedion c (see Table II). The
individual growth zones within these
sections were assigned to growth sectors
related to the hexagonal prism a and
r′
r′
a
r′
r′
r
r
a
a
r′
o
r′ −cedge −r−r′
edge r r′r
r
r
r′
r′
r′
−r′−r
rr
r
r
a′
a′
a
a
o
r′
r′
r
r′
r′
r′
ro
−cedge −r−r′
edge r r′
r′ r
−r′
a a′
−r
r
r
a′′
a′′
a′′
a′′
r′
r′
−r′−ra′
r
r
rr′
r′
ro
o
a
a
a

The Journal of Gemmology / 2011 / Volume 32 / No. 5–8
Page 160
Chemical and growth zoning in trapiche tourmaline from Zambia — a re-evaluation
to different trigonal pyramids r and –r. Towards the antilogous end of the crystal
pictured in Figure 10, there is also a
small growth sector with an orientation
of channels inclined at about 45° to the
c-axis, corresponding with the trigonal
pyramid o.
In detail, the thin section shown in
Figure 9 represents a cut more or less
through the centre of the crystal and
shows two growth sectors related to
the hexagonal prism (a and a′) and two
growth sectors related to the a trigonal
pyramid (r and r′). The growth sectors of
the trigonal pyramid (–r and –r′) at the
analogous pole are distinctly smaller than
those towards the antilogous pole. This
may indicate more preferential growth
towards the antilogous end of the crystal
(see Figure 5).
The other example (Figure 10) shows
three prismatic growth sectors (a, a′ and
a″) which indicates that the cut represents
a section not exactly through the centre of
the crystal. The cut is not exactly parallel
to the c-axis but inclined to it at about
10°, so the two edges running north-south
are not exactly parallel. The section shows
larger trigonal r and smaller –r growth
sectors. During growth of the crystal there
Figure 11: (a) In a section about 60 µm thick cut parallel to the c-axis, the pyramidal and prismatic growth sectors are separated by margins with abundant solid and liquid inclusions; (b) within the transparent areas of various growth sectors, channels filled with liquid or solid matter and irregularly shaped areas with a high concentration of inclusions are visible. Crossed polarizers, field of view (a) 2.04 × 2.72 mm and (b) 3.04 × 4.05 mm. Photos by H.-J. Bernhardt.
r
r
a
a′
r′
a
a
a
r
r
r
was a change of habit with development
of growth sectors related to the trigonal
pyramid o.
5. Fine structure and determination of inclusions
The trapiche pattern is formed
by inclusions which are concentrated
at the margins of adjacent growth
sectors related to different crystal faces.
Irregularly shaped areas with inclusions
and individual elongate voids commonly
originate at these sector boundaries and
extend into more transparent tourmaline
areas (Figure 11). The growth sectors
of different crystal faces, such as r and o pyramids may contain different
concentrations of inclusions, and there are
also some bent channels (Figure 12) that
follow closely the growth planes.
The inclusions were examined
using optical microscopy and electron
microprobe, and the main ones (i.e.
non-tourmaline, see below) are graphite,
calcite and dolomite, and irregularly
shaped cavities or needle-like cavities
filled with fluids of one or two phases
(Figure 12a,b). A coating on the surface
of some channels (Figure 12c), is most
probably secondary iron oxide or iron
hydroxide on the basis of electron
microprobe analyses. In some irregular
fractures there is also some secondary
fracture filling and staining by iron oxides
and hydroxides.
6. Chemical compositionTo evaluate chemical composition,
zoning and colour variation, 10 sections
of Zambian tourmaline were analysed
using the electron microprobe. Four type
A sections were parallel to the c-axis, five
type A sections and one type B section
were cut perpendicular to the c-axis.
Two of the five sections of type A cut
perpendicular to c represented different
parts of one tourmaline crystal (sections
of slices 2 and 7 of Figure 8). Thus,
the chemical analyses presented have
been obtained from 10 sections of nine
tourmaline crystals.
Since the pattern of chemical zoning
was found to be quite fine, the number
of analysis points in different automatic
scans was set at a range of 50 – 150
per scan. In total, 2922 point analyses
were obtained, of which 326 analyses
were deleted, because the chemical
composition obtained did not represent
tourmaline analyses of acceptable quality,
being affected by inclusions or cavities.
Consequently, the discussion of chemical
composition in this paper is based on
2596 point analyses.
6.1 Range of chemical compositionThe traverses across all 10 sections
show a distinct variation of chemical
composition within the dravite-uvite solid
solution series. In general, the sections
prepared parallel to the c-axis show a
somewhat larger compositional range
than the sections cut perpendicular to c.
This is because the latter represent only
part of the growth history, while the
sections parallel to c and along the cores
of euhedral crystals represent much more
complete growth histories.
Tourmalines are borosilicates with
a complex chemical composition and
general formula:
XY3Z
6(T
6O
18)(BO
3)3V
3W (Schmetzer et al.,
2007; Novák et al., 2009; Henry et al.,
2011)

The Journal of Gemmology / 2011 / Volume 32 / No. 5–8
Page 161
Chemical and growth zoning in trapiche tourmaline from Zambia — a re-evaluation
For the two main magnesium-rich
members of the tourmaline group, dravite
and fluor-uvite, the following formulae are
given:
Dravite: NaMg3Al
6(Si
6O
18)(BO
3)3(OH)
3OH
Fluor-uvite:
CaMg3(Al
5Mg)(Si
6O
18)(BO
3)3(OH)
3F
Coupled isomorphic substitutions
between dravite and fluor-uvite are
established according to the formulae
Na + Al ↔ Ca + Mg
and OH ↔ F
Average compositions of the
tourmalines are given in Table III. In
Figure 13 a,b, the atomic proportions
of Na, Ca, Al and Mg obtained from the
analyses of our four sections cut parallel
to the c-axis and sample G (a total of
2101 analyses) are plotted. Isomorphic
substitutions of Na and Ca, and of Al and
Mg are evident. For calcium-rich (sodium-
poor) tourmaline, the X sites are almost
completely occupied by Ca and Na, with
site vacancies mostly below 0.04 atoms
per formula unit (apfu). For sodium-rich
tourmalines, the number of vacancies
in the X site increases to 0.15 apfu
(Figure 13c) due to complex isomorphic
substitution.
Sample A is the richest in fluorine
(Figure 13d), and the substitution of
fluorine and OH on the W position in the
tourmaline structure is shown in Figure
13e. In general, Na-poor (Ca-rich) areas
of the tourmalines show higher fluorine
contents than areas with higher sodium
contents.
The following formulae were
calculated representing the compositional
range of the nine tourmalines analysed:
A. for eight tourmalines with lower
fluorine contents
dravite-rich (Na0.81
Ca0.08
)(Mg2.79
Al0.21
)
Al6(Si
6O
18)(BO
3)3(OH)
3(F
0.2OH
0.62O
0.18)
uvite-rich (Na0.20
Ca0.80
)Mg3(Al
5.40Mg
0.60)
(Si6O
18)(BO
3)3(OH
2.95O
0.05)(F
0.85O
0.15)
B. for one tourmaline with higher
fluorine content
dravite-rich (Na0.80
Ca0.06
)(Mg2.75
Al0.25
)
Al6(Si
6O
18)(BO
3)3(OH)
3(F
0.61OH
0.22O
0.17)
uvite-rich (Na0.14
Ca0.86
)Mg3(Al
5.30Mg
0.70)
(Si6O
18)(BO
3)3(OH
2.77O
0.16F
0.07)(F
1.00)
Figure 12 a,b: Different views of a section about 60 µm thick, cut parallel to the c-axis, showing channels filled with liquid or solid matter. Crossed polarizers, field of view (a) approx. 2.04 × 2.72 mm, and (b) approx. 0.51 × 0.68 mm; (c) and (d) view of an open channel which is stained with an iron-bearing mineral on its internal surface, in transmitted and reflected light respectively, field of view approx. 0.34 × 0.26 mm. Photos by H.-J. Bernhardt.
a b
c d
Compared to an ideal intermediate
composition between dravite and
uvite, these analyses show some excess
calcium and some sodium deficiency. For
example, analyses with an intermediate
composition between the ideal end-
members dravite and uvite, with a
composition of 3.5 apfu Mg and 5.5 apfu
Al, show approximately 0.3 Na and 0.7
Ca rather than 0.5 Na and 0.5 Ca which
would have been expected if isomorphic
substitution had been ideal. A ‘dravite’
with an ideal composition of 3.0 apfu
Mg and 6.0 apfu Al (which should be
free of Ca) shows approximately 0.22
apfu Ca, and approximately 0.72 apfu
Na (instead of 1.0 apfu Na which may
have been expected from the theoretical
composition). Consequently, if these
compositions are compared with many
quoted in textbooks, the Zambian
tourmalines would be considered as
members of the dravite-uvite solid
solution series but with excess calcium
and deficient sodium.
6.2 Trace elements causing colourIron and manganese contents in all
samples are each in the range of 0.01
to 0.02 wt.%, so neither trace element is
likely to influence colour. The majority
of the tourmalines (with smaller fluorine
contents) contain vanadium in the range
of 0.10 to 0.40 wt.% V2O
3 and chromium
between 0.0 and 0.27 wt.% Cr2O
3 and
the tourmalines with the higher contents
of these elements are an attractive green
(Figure 13f). In contrast, tourmaline A
with the higher fluorine content (Table
III) shows colour zoning with a colourless
or almost colourless core and an intense
green rim. The core contains 0.0 to 0.1

The Journal of Gemmology / 2011 / Volume 32 / No. 5–8
Page 162
Chemical and growth zoning in trapiche tourmaline from Zambia — a re-evaluation
Table III: Mean chemical compositions of nine trapiche tourmalines from Zambia
Specimen A B C* D E F G** H I
Orientation
of section c c c c c c c c c
Number of
analyses346 148 59 516 166 409 545 122 285
Wt.%
SiO2
36.91 36.84 37.07 37.05 37.17 37.15 37.03 36.94 36.66
TiO2
0.10 0.21 0.18 0.22 0.21 0.19 0.21 0.20 0.18
B2O
31 10.73 10.73 10.78 10.73 10.78 10.77 10.71 10.67 10.64
Al2O
328.49 28.58 29.17 28.82 28.97 29.25 29.02 29.06 29.11
V2O
30.09 0.25 0.12 0.16 0.29 0.26 0.23 0.22 0.31
Cr2O
30.05 0.07 0.12 0.04 0.08 0.09 0.05 0.07 0.14
FeO2 0.02 0.01 0.01 0.01 0.02 0.01 0.01 0.01 0.01
MnO 0.01 0.01 0.01 0.02 0.01 0.01 0.02 0.02 0.01
MgO 14.70 14.51 14.27 14.27 14.26 14.03 13.97 13.76 13.65
CaO 4.08 4.04 3.74 3.78 3.68 3.45 3.41 3.22 3.13
K2O 0.01 0.01 0.01 0.01 0.01 0.01 0.01 0.02 0.01
Na2O 0.91 0.94 1.07 1.09 1.15 1.25 1.28 1.35 1.38
F 1.98 1.65 1.73 1.55 1.55 1.55 1.54 1.51 1.50
H2O3 2.64 2.75 2.71 2.76 2.78 2.77 2.74 2.73 2.76
-O=F 0.83 0.70 0.73 0.65 0.65 0.65 0.65 0.64 0.63
Total 99.89 99.90 100.26 99.86 100.31 100.14 99.58 99.14 98.86
Number of ions based on 31 (O,OH,F)
Specimen A B C D E F G H I
Si 5.978 5.969 5.979 5.999 5.993 5.994 6.007 6.017 5.997
Ti 0.012 0.025 0.022 0.026 0.026 0.023 0.026 0.024 0.022
B 3.000 3.000 3.000 3.000 3.000 3.000 3.000 3.000 3.000
Al 5.438 5.457 5.544 5.501 5.504 5.560 5.547 5.578 5.597
V 0.012 0.033 0.016 0.021 0.037 0.033 0.030 0.028 0.041
Cr 0.007 0.008 0.015 0.005 0.010 0.012 0.007 0.009 0.018
Fe 0.002 0.002 0.002 0.001 0.002 0.001 0.001 0.001 0.002
Mn 0.001 0.001 0.001 0.002 0.001 0.001 0.002 0.002 0.001
Mg 3.550 3.504 3.421 3.445 3.428 3.375 3.379 3.341 3.323
Ca 0.709 0.701 0.647 0.655 0.636 0.596 0.594 0.562 0.548
K 0.002 0.001 0.002 0.002 0.002 0.002 0.002 0.003 0.002
Na 0.285 0.294 0.335 0.341 0.360 0.392 0.402 0.427 0.436
F 1.012 0.848 0.881 0.793 0.791 0.793 0.788 0.780 0.775
OH 2.847 2.967 2.911 2.978 2.988 2.982 2.969 2.969 2.997
* Type B, all other samples type A
** two slices perpendicular to the c-axis
1 calculated as B = 3.00 atoms per formula unit (apfu)
2 total iron as FeO
3 calculated as OH + F + O = 31.00 apfu
wt.% V2O
3 and between 0.0 and 0.06 wt.%
Cr2O
3, while the green rim has chromium
up to 0.30 wt.% Cr2O
3 and vanadium up
to 0.8 wt.% V2O
3. These elevated trace
element contents are responsible for the
intense green coloration of the rim of that
particular sample.
6.3 Compositional zoning – scans across sections parallel and perpendicular to the c-axis
Chemical zoning in trapiche
tourmalines from Zambia is extremely
complex, especially because different
patterns of zoning can be present in
the same crystal. To demonstrate this,
variation of sodium and calcium on the
X positions in the tourmaline structure is
shown, but the variation could be shown
equally well by means of other element
pairs such as magnesium and aluminium.
Numerous scans across the boundaries
of prismatic/prismatic and pyramidal/
pyramidal growth sectors in all analysed
tourmalines show no changes in
composition, but scans across adjacent
prismatic and pyramidal growth sectors do
show differences with higher sodium and
lower calcium contents in the prismatic
sectors (Figure 14). These differences for
Na and Ca are in the range of 0.1 atoms
per formula unit (apfu).
In transparent prismatic growth
sectors the values obtained indicate that
as growth proceeds there is a continuous
increase of sodium content combined
with a decrease of calcium content in the
direction of growth, i.e. with increasing
distance from the centre of the tourmaline
crystals. This chemical variation is
present both in sections perpendicular
to the c-axis (Figure 15) and in sections
parallel to the c-axis (Figure 16). In
transparent pyramidal growth sectors of
tourmalines cut parallel to the c-axis, a
similar continuous increase of sodium
contents coupled with a decrease of
calcium contents also occurs in the
direction of growth, i.e. in scans parallel
to the c-axis (Figures 16 and 17). In scans
of prismatic growth sectors with that
particular direction however, the chemical
composition is constant, because these
analyses represent areas of the tourmaline

The Journal of Gemmology / 2011 / Volume 32 / No. 5–8
Page 163
Chemical and growth zoning in trapiche tourmaline from Zambia — a re-evaluation
Figure 13: Variation of chemical composition in trapiche tourmalines from Zambia; five different colours indicate point analyses taken in various scans across the sections of five tourmalines, the diagrams represent a total of 2101 point analyses. (a) isomorphic substitution of calcium by sodium on X sites during tourmaline growth; (b) isomorphic substitution of magnesium on (Y+Z) sites by the sum of (aluminium plus chromium plus vanadium); (c) variation of vacancies with Na on X sites in the tourmaline; (d) variation of fluorine contents versus sum of (aluminium plus chromium plus vanadium); (e) variation of hydroxyl content versus fluorine content on W sites; (f) range of chromium and vanadium contents: A sample represented by green dots has a colourless core and an intensely green rim. All samples are members of the solid solution series between dravite and fluor-uvite and show a wide compositional range; one tourmaline (sample A in Table III represented by green dots) shows a higher fluorine content than the other four samples; apfu stands for ‘atoms per formula unit’.
1.0
0.9
0.8
0.7
0.6
0.5
0.4
0.3
0.2
0.1
0.0
Ca [a
pfu]
0.0 0.1 0.2 0.3 0.4 0.5 0.6 0.7 0.8 0.9 1.0Na [apfu]
3.7
3.6
3.5
3.4
3.3
3.2
3.1
3.0
2.9
2.8
2.7
Mg
[apf
u]
5.25 5.35 5.45 5.55 5.65 5.75 5.85 5.95 6.05 6.15 6.25(Al+Cr+V) [apfu]
5.25 5.35 5.45 5.55 5.65 5.75 5.85 5.95 6.05 6.15 6.25(Al+Cr+V) [apfu]
F [a
pfu]
1.1
1.0
0.9
0.8
0.7
0.6
0.5
0.4
0.3
0.2
0.10.0 0.1 0.2 0.3 0.4 0.5 0.6 0.7 0.8 0.9 1.0Na [apfu]
0.2
0.18
0.16
0.14
0.12
0.1
0.08
0.06
0.04
0.02
0.0
Vac
[apf
u]
0.0 0.1 0.2 0.3 0.4 0.5 0.6 0.7 0.8 0.9 1.0V2O3 [apfu]
0.3
0.27
0.24
0.21
0.18
0.15
0.12
0.09
0.06
0.03
0.0
Cr2O
3 [ap
fu]
0.1 0.2 0.3 0.4 0.5 0.6 0.7 0.8 0.9 1.0 1.1F [apfu]
3.7
3.6
3.5
3.4
3.3
3.2
3.1
3.0
2.9
2.8
2.7
OH [a
pfu]
a b
c d
e f

The Journal of Gemmology / 2011 / Volume 32 / No. 5–8
Page 164
Chemical and growth zoning in trapiche tourmaline from Zambia — a re-evaluation
Figure 15: Ca (green) and Na (red) contents in a scan across two prismatic a and two pyramidal r growth sectors in a trapiche tourmaline from Zambia; section perpendicular to the c-axis. Pyramidal r growth sectors have higher calcium and lower sodium contents than adjacent prismatic a growth sectors. Within the prismatic a growth sector, sodium increases and calcium decreases from centre to rim; in the margins of the various growth sectors and in irregularly shaped areas with abundant trapped inclusions, the tourmaline has higher sodium and lower calcium contents. Size of the sample approx. 15 × 16 mm. Photo by H.-J. Bernhardt.
a ar r
0 1421 2842 4263 5684 7105 8526 9947 11367 12788 14209distance [μm]
0.85
0.785
0.72
0.655
0.59
0.525
0.46
0.395
0.33
0.265
0.2
atom
ic p
rop
[apf
u]
a arr
Figure 14: Ca (green) and Na (red) variation across prismatic a and pyramidal o growth sectors in trapiche tourmaline from Zambia; section perpendicular to the c-axis. Scans 1, 2 and 3 were performed across the sector boundaries indicated by B. Pyramidal o growth sectors show higher calcium and lower sodium contents than adjacent prismatic a growth sectors (scan 1); no significant difference in composition is present between the two adjacent pyramidal o growth sectors measured in scan 2 or between the adjacent prismatic a growth sectors in scan 3, but in scan 3 in the marginal area between the two a growth sectors, the tourmaline has higher sodium and lower calcium contents than in either growth sector. Diameter of the sample approx. 13 mm. Photo by H.-J. Bernhardt.
0 80 160 240 320 401 481 561 641 721 801distance [μm]
0.8
0.74
0.68
0.62
0.56
0.5
0.44
0.38
0.32
0.26
0.2
o
o
aa
2
1
3
atom
ic p
rop
[apf
u]
pyramid o
pyramid
o
Scan 2 Scan 3
Scan 1
prism a
prism a
B
pyramid o
prism a
0 80 160 240 320 400 480 560 640 720 800distance [μm]
0.8
0.74
0.68
0.62
0.56
0.5
0.44
0.38
0.32
0.26
0.2
atom
ic p
rop
[apf
u]
0 80 160 240 320 400 480 560 640 720 800distance [μm]
0.8
0.74
0.68
0.62
0.56
0.5
0.44
0.38
0.32
0.26
0.2
atom
ic p
rop
[apf
u]
B
B

The Journal of Gemmology / 2011 / Volume 32 / No. 5–8
Page 165
Chemical and growth zoning in trapiche tourmaline from Zambia — a re-evaluation
Figure 16: Ca (green) and Na (red) contents in scans across prismatic a and pyramidal r and -r growth sectors in trapiche tourmaline from Zambia; section parallel to the c-axis. In the prismatic a growth sectors, sodium increases and calcium decreases from centre to rim (scan 1); within pyramidal r and –r growth sectors, sodium increases and calcium decreases along the c-axis from the centre to both analogous and antilogous ends of the crystal (scan 2); as above, where there are abundant inclusions the tourmaline has higher sodium and lower calcium contents than that in the various growth sectors (scans 1 and 2). Size of the sample approx. 15 × 21 mm; crossed polarizers. Photo by H.-J. Bernhardt.
r
r
r
r r aa
a
−r
1
2
a a
rr
0 1523 3045 4568 6091 7614 9136 10659 12182 13704 15227distance [μm]
0.85
0.77
0.69
0.61
0.53
0.45
0.37
0.29
0.21
0.13
0.05
atom
ic p
rop
[apf
u]
0 2032 4063 6095 8127 10159 12190 14222 16254 18285 20317distance [μm]
0.85
0.77
0.69
0.61
0.53
0.45
0.37
0.29
0.21
0.13
0.05
atom
ic p
rop
[apf
u]
ar
r
r
Scan 2
Scan 1
0 1926 3851 5777 7703 9629 11554 13480 15406 17331 19257distance [μm]
0.85
0.77
0.69
0.61
0.53
0.45
0.37
0.29
0.21
0.13
0.05
atom
ic p
rop
[apf
u]
a ar
rr
−r
Figure 17: Ca (green) and Na (red) contents across prismatic a and pyramidal r and -r growth sectors along the c-axis in trapiche tourmaline from Zambia. Pyramidal r growth sectors have higher calcium and lower sodium contents than adjacent prismatic a growth sectors; within pyramidal r and –r growth sectors, sodium increases and calcium decreases along the c-axis from the centre to both analogous and antilogous ends of the crystal. At the margin of various growth sectors and in irregularly shaped areas with abundant trapped inclusions, the tourmaline host has higher sodium and lower calcium contents compared to that in the surrounding growth sectors. Size of the sample approx. 10 × 20 mm; crossed polarizers. Photo by H.-J. Bernhardt.
−r a ar
r r
−r

The Journal of Gemmology / 2011 / Volume 32 / No. 5–8
Page 166
Chemical and growth zoning in trapiche tourmaline from Zambia — a re-evaluation
crystal at the same stage of growth.
In the growth areas related to the
negative pyramid –r (Figures 16 and 17),
sodium contents are higher than in all
other parts of the tourmaline crystals.
Similar tourmaline compositions are
present in the rim of a crystal with a
normal trapiche pattern in the centre
but which has an outer sector with no
trapiche pattern (labelled n–t, Figure
18). Heavily included margins between
adjacent growth sectors also have a more
sodic tourmaline host than the non-
transparent areas (Figures 15 to17).
6.4 Compositional maps – the distribution of Na and Ca in tourmaline sections parallel and perpendicular to the c-axis
Na and Ca compositional maps
were obtained on two sections of slices
perpendicular to the c-axis, originating
from the same rough crystal and for two
sections of different crystals cut parallel to
the c-axis. These show that in prismatic a
growth sectors, the calcium contents are
always somewhat lower than in adjacent
pyramidal r growth sectors, while the
sodium contents are higher (Figures 19a
and 20). In growth sectors confined to the
negative pyramid –r, extreme chemical
zoning is present on a small scale (Figure
20), and this represents the complete range
of chemical variation along the c-axis.
At the boundaries between different
prismatic or pyramidal growth sectors
with abundant inclusions two types of
areas with a composition different from
the surrounding transparent tourmaline
may be present (Figures 19 and 20).
One shows pixels representing material
with high calcium or a high calcium and
magnesium content and represents the
Figure 18: Ca (green) and Na (red) contents in trapiche tourmaline from Zambia. The slices are those shown in Figure 8 and are perpendicular to the c-axis; slice 7 was broken when repolished. Thin section of slice 7: a scan across pyramidal r growth sectors shows higher calcium and lower sodium contents than the adjacent prismatic a growth sector; no differences in composition were observed between two adjacent pyramidal r growth sectors. Within the prismatic a growth sector, sodium increases and calcium decreases from the centre to the rim; these trends become extreme at the outermost part of the rim, which shows no trapiche pattern (indicated with n-t). Thin section of slice 2: the scan across two r growth sectors shows that sodium (red) increases and calcium (green) decreases from centre to rim. The common occurrence of irregularly shaped areas with abundant inclusions, is reflected in the fluctuating sodium and calcium contents in the scan.Size of slice 7 approx. 11 × 14 mm and of slice 2 16 × 18 mm. Photos by H.-J. Bernhardt.
Slice 7
n-t
r ar
Slice 2
r r r r
r
a
r
0 940 1879 2819 3759 4699 5638 6578 7518 8458 9397distance [μm]
0.85
0.775
0.7
0.625
0.55
0.475
0.4
0.325
0.25
0.175
0.1
atom
ic p
rop
[apf
u]
r rr
r
0 1637 3274 4911 6548 8185 9822 11458 13095 14732 16369distance [μm]
0.85
0.775
0.7
0.625
0.55
0.475
0.4
0.325
0.25
0.175
0.1
atom
ic p
rop
[apf
u]
n-t

The Journal of Gemmology / 2011 / Volume 32 / No. 5–8
Page 167
Chemical and growth zoning in trapiche tourmaline from Zambia — a re-evaluation
Figure 19a: Na content maps in parts of tourmaline slices 7 and 2 (see Figures 8 and 18). Low content is indicated by blue and higher contents in yellow and red. In slice 7, the increase in Na towards the rim is consistent with the profile in Figure 18. In slice 2, the irregularly shaped areas with abundant inclusions have higher Na contents.
Figure 19b: Magnified view of part of slice 2 showing Ca in r growth sectors. Only the low-Ca areas (blue) contain abundant tiny high-Ca inclusions (yellow and red) of calcite and dolomite.
Slice 7, mapped area Slice 2, mapped area
Slice 7, Na Slice 2, Na
1 mm1 mm
1 mm 1 mm
a b
many inclusions of magnesite or dolomite.
The other type of pixel represents
material with a somewhat higher sodium
and lower calcium content than the
surrounding tourmaline (Figure 20b).
7. Discussion — chemical zoning and formation of structural patterns7.1 Compositional zoning
The complexity of structural and
chemical zoning in tourmaline crystals
from different localities is due to one or
a combination of several mechanisms
(see Benesch, 1990; Henry and Dutrow,
1992, 1996, 2001; Kazachenko et al.,
1993; Sperlich et al., 1996; Takahashi and
Sunagawa, 1998; Vergilov and Kostova,
2000; Agrosi et al., 2006; van Hinsberg et
al., 2006; Lussier et al., 2008; Lussier and
Hawthorne, 2011).
(a) Chemical growth zoning. This type of
compositional variation from core to
rim is common in tourmalines from
different localities.
(b) Compositional polarity. Tourmalines
from some localities have antilogous
and analogous ends of different
composition.
(c) Sector zoning. Adjacent growth sectors
can have different compositions.
The chemical compositions of the
transparent areas of all the trapiche
tourmalines measured in this study
varied from core to rim. At the beginning
of crystal growth, a calcium-rich fluor-
uvite crystallized. Subsequently there
was a continuous decrease of calcium,
magnesium and fluorine contents with
corresponding isomorphic substitutions
of Ca by Na, Mg by Al and F by OH.
Consequently, by the end of crystal
growth, sodium-rich dravite was forming.
Sector zoning is present in all samples,
and some compositional polarity is
present; details are given above. At the
end of growth, the sodium content of the
crystal’s analogous end is higher than at
its antilogous end. The variation described
for sodium and calcium applies also
for magnesium and aluminium and for
fluorine and hydroxyl groups.
The trapiche pattern is formed by
numerous fluid and solid inclusions,
mainly calcite and dolomite, at the
margins of all combinations of pyramidal
and prismatic growth sectors, i.e. at
pyramidal/pyramidal, prismatic/prismatic
and at pyramidal/prismatic growth sectors.
Obviously, crystal growth was hindered
by these inclusions for some period and
then subsequent growth of tourmaline
contained elongate voids. This mechanism
of formation of the growth-induced
elongate voids or channels has been
described in detail by such authors as
Slivko (1966) (see Figure 21 a,b), Liu and
Lu (1986) and Rustemeyer (2003). The
voids may form in two ways:
(a) Trapping of inclusions and formation
of channels in the growth direction
‘behind’ these inclusions (Figure 21a).
(b) Trapping of inclusions and formation
of channels in the growth direction
with the inclusion moving ‘in front’ of
the growth channel (Figure 21b).
The formation of an elongate void
Slice 2, Ca
1000 μm

The Journal of Gemmology / 2011 / Volume 32 / No. 5–8
Page 168
Chemical and growth zoning in trapiche tourmaline from Zambia — a re-evaluation
1 mm
Figure 20a: Na and Ca content maps in part of a tourmaline section parallel to the c-axis. Low content is indicated by blue and higher content by yellow and red. This is the crystal shown in Figures 9 and 17 and the mapped area is outlined. Pyramidal and prismatic growth sectors are indicated and the Na increase and Ca decrease at the rim are clearly visible; the compositional difference between prismatic a and pyramidal r growth sectors is also observed.
1 mm
Ca
1 mm1 mm
NaMapped area
rr
r−r
−r
a
a
Ca Ca inclusions
r
r
r a
aaFigure 20b: Magnified view of part of the mapped area in Figure 20a showing Ca contents in tourmaline and calcium-bearing inclusions. The left part shows relatively 'clean' areas with light and dark amber colour representing transparent r and a growth sectors of the tourmaline crystal. In the same figure, green and blue pixels indicate a second tourmaline composition with lower calcium contents. Only in these heavily included areas are tiny crystals of calcite and dolomite (right part) present.
ends when the diameter of the channel
diminishes and closes (case a, see
Figure 21a) or when the inclusion at
the forefront of the channel halts or is
finally ‘frozen’ and normal tourmaline
resumes growth (case b, see Figure 21b).
One or both ways described could be
responsible for the formation of channels
in tourmaline cat’s-eyes.
In some trapiche tourmalines,
abundant channels of limited length are
present only at the margins between
different growth sectors. If growth-
induced channels are not limited to an
area close to the sector boundaries, they
continuously extend into the growing
tourmaline sectors. In such samples,
the last slices along the c-axis of the
tourmalines show only small ‘clean’
transparent areas with few growth tubes.
The various growth processes
suggested so far do not explain the
tourmaline analyses in the arms of the star
with sodium contents that are higher than
in the surrounding transparent tourmaline.
Careful examination of thin sections
showed that despite the difference, this
tourmaline is not distinguishable from the
main tourmaline on the basis of optical
properties.
7.2 The trapiche pattern: nomenclature
Numerous gemstones have been
designated as ‘trapiche’ in the trade and in
various gemmological journals. In general
Complete crystal

The Journal of Gemmology / 2011 / Volume 32 / No. 5–8
Page 169
Chemical and growth zoning in trapiche tourmaline from Zambia — a re-evaluation
the term is used to describe a pattern
consisting of a fixed star in a transparent
host matrix, with the arms of the star
radiating from a central point or central
core to the rim of the crystal, cabochon
or slice. Several ‘trapiche’ materials with
different visual appearance were recently
described by Win (2005) and these can be
considered in two groups.
The first group is characterized by
more or less sharp boundaries, extending
from a central intersection point or
from the edges of a central core, which
separate transparent to translucent growth
sectors of the host (see ruby in Figure
22). The arms of the fixed star, which
are formed by these boundaries, are
mostly not transparent and run from the
centre to the edges of the external crystal
faces. They consist of the main mineral
(e.g. beryl, corundum, tourmaline) and
numerous tiny other mineral or fluid
inclusions. Consequently, the areas
separated by the arms of the star are
crystallographically equivalent prismatic
(beryl), dipyramidal (corundum) or
pyramidal (tourmaline) growth sectors
of the crystal. The most prominent gem
materials of this group (see Table IV) are
Colombian emerald, ruby from Mong Hsu,
Myanmar and the uvite-dravite tourmaline
from Zambia.
The second group is characterized
by several alternating transparent and
translucent areas which surround a central
point or central core according to the
symmetry of the host. The transparent
and translucent areas are characterized
by different concentrations of inclusions,
which are trapped within specific central
parts of symmetry-equivalent growth
sectors of the host (see the sapphire
in Figure 22). The sharp boundaries
separating the different crystallographically
equivalent growth sectors of the first
group are not visible. The arms of the
group 2 star are perpendicular to the
external crystal faces, e.g. perpendicular
to the hexagonal dipyramids of corundum
or perpendicular to the prism faces of
beryl. The most prominent gem examples
of this second group are the blue
basaltic sapphires described recently by
Khotchanin et al. (2009). Slices of these
sapphires perpendicular to the c-axis
consist of milky white, translucent areas
with a high concentration of inclusions.
The following examples highlight
the differences in star pattern. The
milky white translucent areas with
abundant inclusions in the sapphires of
Khotchanin et al.(2009) are equivalent
Figure 22: Trapiche ruby from Mong Hsu, Myanmar (top) and trapiche-type sapphire from Hunan province, China (bottom); slices perpendicular to the c-axis, the hexagonal outlines of the rough crystals are represented by dipyramidal faces. With identical crystallographic orientation of both corundum slices, the different orientation of the fixed star within these samples is observed. Diameter of the trapiche ruby 4.20 mm, size of the trapiche-type sapphire 10 × 12 mm. Photos by K. Schmetzer.
Figure 21: Two possible formation mechanisms of growth induced elongated voids in tourmaline (from Slivko, 1966):(a) Trapping of a solid inclusion and subsequent blocking of crystal growth with the formation
of a growth induced, elongated void in the direction of crystal growth (arrow) subsequent to trapping of the small mineral grain;
(b) Trapping of a solid inclusion, movement of the trapped small mineral grain in the direction of the arrow and of the growing crystal face and formation of a growth induced, elongated void in the wake of the moving mineral grain, a mechanism repeated in several steps.
a b

The Journal of Gemmology / 2011 / Volume 32 / No. 5–8
Page 170
Chemical and growth zoning in trapiche tourmaline from Zambia — a re-evaluation
Table IV. Properties of gem materials with typical trapiche pattern
Emerald, Colombia Ruby, Myanmar Tourmaline, Zambia12
Type of crystals Hexagonal prisms, rarely
with basal faces 1,2,4,5
Fragments confined by
hexagonal dipyramids ω 7
Complete prismatic
crystals
Sections or slices to the
c-axis
Geometrical pattern Hexagonal core,
rim formed by six
trapezohedral sectors 1,2,3,4,5,6
Hexagonal red, yellow or
black core, rim formed
by six red trapezohedral
sectors 7,8,9,10,11
Growth zoning ω 10
Hexgonal core
consisting of several
pyramidal growth
sectors, rim formed
by six trapezohedral
sectors
Chemical zoning Zoning of trace elements 6 Zoning of trace elements 8,9,11
Uvite-dravite zoning
Fine structure in thin
sections to the c-axis,
orientation of channels
or needle-like inclusions
Fibrous texture to the
c-axis in the rim 1,5,6
growth planes parallel to
the prism 1,5
Channels to the c-axis
and slightly inclined to
the c-axis 7
Channels to the
pyramids in the core
and to the prism in
the rim
Sections or slices to the
c-axis
Geometrical pattern Tapered core 1,2,4,5 Tapered core, end of
cores red, yellow or
black channels to the
dipyramids ω 7
Tapered core,
sometimes skeleton
growth
Chemical zoning Uvite-dravite zoning
Fine structure in thin
sections to the c-axis,
orientation of channels
or needle-like inclusions
Fibrous texture to the
c-axis in the rim and to
the c-axis in the core 1
Channels to the
pyramids in the core
and to the prism in
the rim
Main material trapped at
the boundaries of growth
sectors or in channels
Quartz, albite 3,5
or carbonaceous matter 5
Fluid, calcite, dolomite,
silicates 7,8,11
Graphite, calcite,
dolomite, fluid
Emerald: 1 Bernauer, 1926; 2 McKague, 1964; 3 Schiffmann 1968, 1969; 4 Tripp and Hernandez, 1970; 5 Nassau and Jackson, 1970
a,b; 6 Ohnenstetter et al., 1998
Ruby: 7 Schmetzer et al., 1996; 8 Schmetzer et al., 1998; 9 Sunagawa et al., 1999; 10 Schmetzer and Schwarz, 2000; 11 Garnier et al.,
2002 a,b
Tourmaline: 12 this paper
to the transparent growth sectors of
trapiche rubies (Figure 22, see Table IV),
and the blue transparent areas of basaltic
sapphires are equivalent to the sharp non-
transparent boundaries of trapiche rubies.
If the pattern of Colombian emeralds
(Table IV) is compared with that in
aquamarine from Namibia (Koivula, 2008),
the non-transparent arms of Colombian
emeralds are equivalent to the transparent
areas within the aquamarine material
from Pakistan, and the transparent growth
sectors of the emeralds are equivalent to
the heavily included milky white areas
of these aquamarines. Another example
is given by DelRe (1994) in which he
compares Colombian trapiche emerald
with emeralds from Brazil which have a
fixed six-rayed star with arms orientated
perpendicular to the external prism
faces of the beryl host. The author
also mentioned that the two types of
trapiche emeralds “almost seem to be a
photographic negative” of each other.
These two star patterns indicate
different mechanisms of formation.
Consequently, to distinguish them, we
suggest naming the first group (e.g.
Colombian emeralds, ruby from Myanmar,
tourmaline from Zambia) trapiche and the
second group (e.g. basaltic sapphires from
various origins) trapiche-type.
7.3 The trapiche pattern: formationSeveral mechanisms of formation for
the trapiche pattern have been suggested
for the gemstones emerald and ruby, as
well as for other non-gem materials such
as cordierite or andalusite (chiastolite)
(Petreus, 1974; Henderson, 1995).
A mineral which shows a clear
trapiche pattern – cordierite from Japan
– is not discussed in this paper because
of the even more complex mechanism
of formation, which includes a high
temperature to low temperature transition
between indialite and cordierite (see
Rakovan et al., 2006, and the papers cited
therein). If we concentrate on the known

The Journal of Gemmology / 2011 / Volume 32 / No. 5–8
Page 171
Chemical and growth zoning in trapiche tourmaline from Zambia — a re-evaluation
gem materials with trapiche patterns, i.e.
emerald, ruby and tourmaline, we always
have materials subdivided in growth
zones related to a core and a rim. The
equivalent faces of these growth zones are
given above.
The most significant visual difference
is the subdivision of the core of trapiche
tourmalines into three different sectors,
whereas the cores of emerald and rubies
normally consist of a single hexagonally
outlined area.
The formation of Colombian trapiche
emeralds (Table IV) has been described
as a process in which first the transparent
core and then the rim (consisting of the
six transparent sectors separated by non-
transparent arms) were grown (McKague,
1964; Nassau and Jackson, 1970 a,b).
This mechanism does not explain the
tapered form of the transparent core and
the different orientations of the fibrous
texture of the core and the rim (see Figure
23 by Bernauer, 1926). In addition, it
is not clear how a rare type of trapiche
emerald with opaque tapered core (as
proposed by Nassau and Jackson from
their observation and literature data)
was formed. If the tapered form of the
core and the growth planes within the
outer trapezohedral areas as well as the
orientation of fibrous textures indicate
basal and prismatic growth sectors, a
growth in several growth steps with the
subsequent formation of the core and the
six sectors of the rim is rather unlikely.
Trapiche rubies from Myanmar were
extensively studied in basal slices and thin
sections (see Table IV), but only limited
information is available from slices or
sections parallel to the c-axis. Within the
arms of the six-rayed star, ruby zones
with distinctly lower chromium contents
compared to the higher chromium
contents of the trapezohedral ruby sectors
were analysed. Thus, a dendritic (skeletal)
growth of the arms and a subsequent
growth of the transparent trapezohedral
ruby sectors were suggested by Sunagawa
et al. (1999).
However, the growth sectors
representing the different red, black or
yellow cores of trapiche rubies and the
transitions between these parts within
the same sample were not resolved
clearly (see Schmetzer et al., 1996, 1998;
Sunagawa et al., 1999). In particular, it is
not understood if the complex formation
of non-trapiche rubies from Mong Hsu
with subsequent red and black cores
parallel to the c-axis as described by
Peretti et al. (1995) is part of the formation
of the differently coloured cores of the
trapiche rubies from this occurrence.
The compositional zoning of the
uvite-dravite tourmalines described in this
paper and the geometrical pattern of a
core consisting of pyramidal and prismatic
growth sectors both separated by trapiche
boundaries makes the possibility that a
partial core (consisting only of pyramidal
growth sectors) grew first, followed by a
rim consisting of prismatic growth sectors
very unlikely. The complex chemical
zoning within all growth sectors of these
tourmalines shows a successive, layer-
by-layer growth from a calcium- and
magnesium-rich uvite towards a sodium-
and aluminium-rich dravite.
The presence of mineral grains
and fluid inclusions at the margins of
different growth sectors and in the
less transparent areas of the crystals is
apparent. The formation of fluid filled
channels originating from these inclusions
with an orientation perpendicular to the
growing crystal face is consistent with
the description of a similar mechanism
of channel formation in tourmaline as
described by Slivko (1966).
A sodium- and aluminium-rich dravite
with a composition different from the
tourmaline forming the larger transparent
growth sectors was found in all non-
transparent boundaries between different
growth sectors and in the less transparent
irregular growth zones of the tourmalines.
Using the model of Sunagawa et al.(1999)
developed for trapiche rubies from
Myanmar, this dravite is equivalent to
the dendritic ruby forming the arms of
trapiche rubies, and the transparent uvite-
to-dravite growth sectors are equivalent
to the trapezohedral growth sectors of
these trapiche rubies. Consequently, the
application of the model developed for
trapiche rubies can explain the formation
of the trapiche pattern in tourmaline
from Zambia. First there was rapid
skeletal growth of dravite with trapping
of numerous inclusions followed by
successive layer-by-layer growth of more
transparent tourmaline. Starting this
second generation of tourmaline growth
with calcium-rich uvite, the composition
slowly and continuously altered to a more
sodium-rich dravite.
AcknowledgementsThe authors are grateful to Prof.
I. Sunagawa, Tokyo, Japan, for helpful
comments and to D. Gravier, Poncin,
France, who provided numerous samples
of trapiche tourmaline for this research
project.
emerald ruby tourmaline
core basal pinacoid basal pinacoid different trigonal pyramids
rim hexagonal prism hexagonal dipyramid hexagonal prism and/or trigonal prism
Figures 23: Schematic drawing of structural features in trapiche emerald from Colombia (from Bernauer, 1926). Fibrous textures within the tapered core are oriented parallel to the c-axis, and similar appearing fibrous textures within the rim are perpendicular to the external prism faces, layered growth zoning is observed within the prismatic growth sectors of the rim; the core and the six growth sectors of the rim are separated by dark non-transparent boundaries.
The Journal of Gemmology / 2011 / Volume 32 / No. 5–8
Page 172
Chemical and growth zoning in trapiche tourmaline from Zambia — a re-evaluation
ReferencesAgrosi, G., Bosi, F., Lucchesi, S.,
Melchiorre, G., and Scandale, E., 2006.
Mn-tourmaline crystals from the island
of Elba (Italy): Growth history and
growth marks. American Mineralogist,
91(5-6), 944–52
Benesch, F., 1990. Der Turmalin.
Urachhaus, Stuttgart. 380 pp
Bernauer, F., 1926. Die sog.
Smaragdsrillinge von Muzo und ihre
optischen Anomalien. Neues Jahrbuch
für Mineralogie, Geologie und
Paläontologie, 54, Beilage-Band, Abt.
A, 205–42
DelRe, N., 1994. Emerald, trapiche from
a new locality. Gem Trade Lab notes.
Gems & Gemology, 30(2), 116–7
Dietrich, R.V., 1985. The tourmaline
group. Van Nostrand Reinhold Co.
Inc., New York, pp. 12–15, 167–72
Garnier, V., Ohnenstetter, D., Giuliani,
G., Blanc, P., and Schwarz, D.,
2002a. Trace-element contents and
cathodoluminescence of “trapiche”
rubies from Mong Hsu, Myanmar
(Burma). Mineralogy and Petrology,
76, 179–93
Garnier, V., Ohnenstetter, D., Giuliani,
G., and Schwarz, D., 2002b. Rubis
trapiches de Mong Hsu, Myanmar.
Revue de Gemmologie A.F.G., 144, 5–12
Hainschwang, T., Notari, F., and Anckar,
B., 2007. Trapiche tourmaline from
Zambia. Gems & Gemology, 43(1),
36–46
Henderson, B., 1995. Inhibited growth of
crystals. Mineralogical Record, 26(3),
201–3
Henry, D.J., and Dutrow, B.L., 1992.
Tourmaline in a low grade clastic
metasedimentary rock: an example
of the petrogenetic potential
of tourmaline. Contributions to
Mineralogy and Petrology, 112, 203–18
Henry, D.J., and Dutrow, B.L., 1996.
Metamorphic tourmaline and its
petrologic applications. In: Grew,
E.S., and Anovitz, L.M. (Eds),
Boron. Mineralogy, petrology and
geochemistry. Mineralogical Society of
America. Reviews in Mineralogy, 33,
503–57
Henry, D.J., and Dutrow, B.L., 2001.
Compositional zoning and element
partitioning in nickeloan tourmaline
from a metamorphosed karstbauxite
from Samos, Greece. American
Mineralogist, 86(10), 1130–42
Henry, D.J., Novak, M., Hawthorne, F.C.,
Ertl, A., Dutrow, B.L., Uher, P., and
Pezzotta, F., 2011. Nomenclature of
the tourmaline supergroup minerals.
American Mineralogist, 96(5–6),
895–613
Kazachenko, V.T., Butsik, L.A., Sapin,
V.I., Kitaev, I.V., Barinov, N.N., and
Narnov, G.A., 1993. Vanadian-
chromian tourmaline and vanadian
muscovite in contact-metamorphosed
carbonaceous rocks, Primorye, Russia.
Canadian Mineralogist, 31(2), 347–56
Khotchanin, K., Thanasuthipitak, K.,
and Thanasuthipitak, T., 2009. The
structure and chemical composition of
trapiche blue sapphire from Southern
Vietnam and Cambodia. Journal of
the Gemmological Association of Hong
Kong, 30, 25–35
Koivula, J.I., 2008. Two unusual
aquamarines. Gems & Gemology, 44(3),
275–6
Kundt, A., 1883. Ueber eine einfache
Methode zur Untersuchung der
Thermo-, Actino- und Piëzoelectricität
der Krystalle. Wiedemanns Annalen
der Physik und Chemie, Neue Folge, 20,
592–601
Liu, G., and Lu, H., 1986. Fluid inclusion
study of gem tourmaline from
Xinjiang, China. Geochemistry, 5(3),
234–40
Lussier, A.J., and Hawthorne, F.C., 2011.
Oscillatory zoned liddicoatite from
Anjanabonoina, Central Madagascar.
II. Compositional variation and
mechanisms of substitution. Canadian
Mineralogist, 49(1), 89–104
Lussier, A.J., Hawthorne, F.C., Herwig,
S., Abdu, Y., Aguiar, P.M., Michaelis,
V.K., and Kroeker, S., 2008. Mushroom
elbaite from the Kat Chay mine,
Momeik, near Mogok, Myanmar:
II. Zoning and crystal growth.
Mineralogical Magazine, 72(5),
999–1010
McKague, H.L., 1964. Trapiche emeralds
from Colombia. Gems & Gemology,
11(7), 210–13, 223
Nassau, K., and Jackson, K.A., 1970a.
Trapiche emeralds from Chivor
and Muzo, Colombia. American
Mineralogist, 55(3-4), 416–27
Nassau, K., and Jackson, K.A., 1970b.
Trapiche emeralds from Chivor and
Muzo, Colombia: Nature and origin.
Lapidary Journal, 24(1), 82–6
Novák, M., Henry, D.J., Hawthorne, F.C.,
Ertl, A., Uher, P., Dutrow, B.L., and
Pezzotta, F., 2009. Nomenclature of
the tourmaline-group minerals. Report
of the subcommittee on tourmaline
nomenclature to the International
Mineralogical Association’s
Commission on New Minerals,
Nomenclature and Classification, 45 pp
(unpublished draft)
Ohnenstetter, D., Giuliani, G., and
Bustos, O., 1998. Èmeraudes trapiches
colombiennes. In: Giard, D. et al.
(Eds), L’émeraude. Connaissances
actuelles et prospectives futures. Livre
Edition, Association Française de
Gemmologie, Paris, 119–24
Peretti, A., Schmetzer, K., Bernhardt, H.-J.,
and Mouawad, F., 1995. Rubies from
Mong Hsu. Gems & Gemology, 31(1),
2–26
Petreus, I., 1974. The divided structure
of crystals. Neues Jahrbuch für
Mineralogie Abhandlungen, 122(3),
314–38
Rakovan, J., Kitamura, M., and Tamada,
O., 2006. Sakura Ishi (Cherry
Blossom Stones): Mica pseudomorphs
of complex cordierite-indialite
intergrowths from Kameoka, Kyoto
Prefecture, Japan. Rocks & Minerals, 81, 284–92
Rustemeyer, P., 2003. Faszination
Turmalin. Formen, Farben, Strukturen.
Spektrum Akademischer Verlag, Berlin.
310 pp
Schiffman, C.A., 1968. Unusual emeralds.
Journal of Gemmology, 11(4), 105–14
Schiffman, C.A., 1969. Unusual emeralds.
Lapidary Journal, 23(6), 828–31
Schmetzer, K., Bernhardt, H.-J., Dunaigre,
C., and Krzemnicki, M.S., 2007.
The Journal of Gemmology / 2011 / Volume 32 / No. 5–8
Page 173
Chemical and growth zoning in trapiche tourmaline from Zambia — a re-evaluation
Vanadium-bearing gem-quality
tourmalines from Madagascar. Journal
of Gemmology, 30(7/8), 413–33
Schmetzer, K., Hänni, H.A., Bernhardt,
H.-J., and Schwarz, D., 1996. Trapiche
rubies. Gems & Gemology, 32(4),
242–50
Schmetzer, K., and Schwarz, D., 2000.
Trapiche ruby: an update. Gems &
Gemology, 36(2), 168-169
Schmetzer, K., Zhang, B., Gao, Y.,
Bernhardt, H.-J., and Hänni, H.A.,
1998. Element mapping of trapiche
rubies. Journal of Gemmology, 26(5),
289–301
Slivko, M.M., 1966. Repulsion and
capture of solid particles by growing
tourmaline crystals. In: Grigoriev, D.P.
(Ed.) Genezis Mineralnych Individov i
Agregatov. Akademija Nauk SSSR, pp
116–21 (in Russian)
Sperlich, R., Gierè, R., and Frey, M.,
1996. Evolution of compositional
polarity and zoning in tourmaline
during prograde metamorphism of
sedimentary rocks in the Swiss Central
Alps. American Mineralogist, 81(9-10),
1222–36
Sunagawa, I., Bernhardt, H.-J., and
Schmetzer, K., 1999. Texture formation
and element partitioning in trapiche
ruby. Journal of Crystal Growth, 206,
322–30
Takahashi, Y., and Sunagawa, I., 1998.
Tourmaline: morphological and
compositional variations during the
history of uvite single crystals. Journal
of Gemmology, 26(4), 226–37
Tripp, E.J., and Hernandez, L.H., 1970.
The complete trapiche emerald
picture. Lapidary Journal, 24(1),
97–104
Van Hinsberg, V.J., Schumacher, J.C.,
Kearns, S., Mason, P.R.D., and Franz,
G., 2006.Hourglass sector zoning in
metamorphic tourmaline and resultant
major and trace-element fractionation.
American Mineralogist, 91(5-6), 717–28
Vergilov, Z., and Kostova, B., 2000.
Composition, anatomy and growth
mechanism of tourmalines from
Vitosha pegmatites. Annuaire de
l’Universite de Sofia “St. Kliment
Ohridski”, Faculte de Geologie et
Geographie, Livre 1 – Geologie, 92,
105–19
The Authors
Dr Karl SchmetzerTaubenweg 16, 85238 Petershausen, GermanyEmail: [email protected]
Dr Heinz-Jürgen BernhardtZEM, Institut für Geologie, Mineralogie und Geophysik, Ruhr-University,
D-44780 Bochum, Germany
Email: [email protected]
Thomas HainschwangGGTL Laboratories, Gemlab (Liechtenstein)/GemTechLab, FL 9496 Balzers,
Liechtenstein/CH 1227 Geneva, Switzerland
Email: [email protected]
Win, K.K., 2005. Trapiche of Myanmar.
Australian Gemmologist, 22(6), 269–70
Wöhrmann, B., 2002. Cut longitudinally
with drafting pen and paint brush. In:
Falster, A.U., et al. (Eds), Tourmaline,
a gemstone spectrum. ExtraLapis
English, 3, 34–8
Zang, J., Falster, A.U., and Simmons,
W.B., 2002. News about the star. In:
Falster, A.U., et al. (Eds), Tourmaline,
a gemstone spectrum. ExtraLapis
English, 3, 39–41

The Journal of Gemmology / 2011 / Volume 32 / No. 5–8
Page 174 ©2011 Gemmological Association of Great Britain
IntroductionRecently, the author received a 3.85 ct
pear-shaped yellowish orange gemstone,
measuring 11.38 × 9.55 × 4.88 mm, for
identification (Figure 1).
The refractive index (RI)
determinations were carried out using a
Rayner Dialdex critical angle refractometer
with the use of a polarizing filter and
monochromatic sodium light. Using
the table facet, the stone was rotated
every 45° and the indices recorded until
a rotation of 180° was reached. The
indices obtained showed two constant
and parallel shadow edges, 1.762 and
1.770 (birefringence 0.008), proving
the stone uniaxial, with its table facet
cut perpendicular to the optic axis. A
polarizing filter is needed to obtain the
optic sign (Sturman and Parker, 2010), and
this was checked by testing one of the
pavilion facets, under the same working
conditions, this gave ε = 1.762, ω = 1.770,
optic sign U/-.
To confirm the uniaxial nature of
the stone, it was examined table down
in a Gem Illuminator Polariscope, set to
its dark position (where the vibration
Untreated yellowish orange sapphire exhibiting its natural colourJ.M. Duroc-Danner, Dip. IUED, DUG, FGA, GG
Abstract: Orange sapphires of natural colour are rather rare. A 3.85 ct sapphire recently submitted for identification was confirmed as natural using conventional gemmological equipment and infrared spectrometry. Colour zoning, inclusions and twinning are described and compared with the features shown by synthetic sapphires.
Keywords: colour zoning, heat treatment, inclusions, infrared spectra, orange sapphire, synthetic
directions of the polarizer and analyser
are perpendicular to one another) and
with a conoscope placed on the stone’s
pavilion; a uniaxial interference figure
could be seen.
The specific gravity (SG) was obtained
by hydrostatic weighing of the stone,
employing a Mettler PL 300c electronic
balance (accuracy ± 0.001 ct) with SG
attachments. The SG is 3.99.
The pleochroism observed through the
pavilion with a Rayner calcite dichroscope
was very weak with a small range from
yellow orange to slightly darker yellow
orange.
The absorption spectrum seen through
a Gem Beck Spectroscope Unit, showed
no lines in the blue portion of the visible
spectrum, but lines in the red at 660 and
680 nm.
A faint uneven dark apricot
fluorescence could be seen with a
Multispec combined LW/SW unit.
These physical properties correspond
to those of corundum, yellowish orange
sapphire, so to determine whether it was
natural or synthetic, treated or untreated,
further testing was necessary.
Distinguishing natural from synthetic corundum
Synthetic corundum was first obtained
by M.A. Gaudin in 1837 by the Verneuil
flame-fusion process (Bourgeois, 1884);
this was followed by J. Czochralski in
1918 using the pulling method (Elwell,
1979), later by C.C. Chatham and F.T.
Brown by flux fusion in the mid 1960s
(Nassau, 1980) and more recently by
Tairus using hydrothermal synthesis in the
1990s (Koivula et al., 2000).
To test whether this orange yellow
sapphire was synthetic, the stone was
examined under a Bausch & Lomb Mark
V Gemolite binocular microscope using
dark field illumination or overhead
lighting as appropriate. It revealed
immediately under the table facet, broad
parallel straight growth zonal striae lying
in different planes, crossing each other
at angles (Figure 2). Numerous clouds
of exsolved substances are aligned with
these zonal striae and are responsible for
Figure 1 (above): Pear-shaped yellowish orange sapphire of 3.85 ct. Magnification 10×.

The Journal of Gemmology / 2011 / Volume 32 / No. 5–8
Page 175
Untreated yellowish orange sapphire exhibiting its natural colour
growth planes of the second-order
hexagonal prism as well as growth
planes parallel to different second-order
hexagonal dipyramids (with the exception
of n {224−3}), do not appear in this type
of synthesis (Schmetzer, 1986; Kiefert and
Schmetzer, 1988, 1991). Occasionally one
encounters inclusions of angular platelets
of metallic appearance, often triangular
or hexagonal in shape, but also in other
forms such as needles. These originate
from the platinum crucible in which
the corundum is grown and have not
been encountered in natural corundum
(Gübelin and Koivula, 1986).
Hydrothermally grown synthetic
corundums usually show fluid inclusions
composed at room temperature of H2O
(liquid), H2O (vapour) and carbonate solid
daughter minerals (such as CaCO3 and
KHCO3), while the fluid inclusions found
in the natural counterparts (including
the heat-treated ones) are composed of
CO2-rich compositions with completely
different reactions to heating and freezing.
By studying these reactions, it is therefore
possible to identify this type of synthetic
(Peretti et al., 1997). Roiled-to-angular
growth structures, sometimes described as
chevron-spaced, and scattered flake-like
‘breadcrumbs’ can also occur (Renfro et
al., 2010). Solid inclusions are sometimes
also observed, consisting of copper alloys,
derived from the steel autoclave (copper
inclusions have not yet been observed
in natural corundum). Hydrothermally
produced yellow, green, blue-green and
blue synthetic sapphires owe their colour
only to nickel, whereas blue-violet to
violet orange and reddish-orange synthetic
hydrothermal sapphires are coloured by
traces of both chromium and nickel, while
the three main causes of colour in natural
corundum are due to colour centres or
Fe3+ for yellow sapphires; Fe2+/Ti4+ ion
pairs with or without additional Fe2+/Fe3+
pairs, for blue to violet sapphires; and Cr+
for rubies (Schmetzer and Peretti, 1999,
2000).
Magmatic or metamorphic corundum
Corundum can be of two different
types:
• Magmaticyellowishorangesapphires
owe their colour chiefly to Fe2+/Fe3+,
Fe3+ and Fe3+/Fe3+, and to a lesser
degree to IVCT Fe2+ Ti4+, with high
Ga3+ and minor Cr3+.
•Metamorphicyellowishorange
sapphires can owe their colour partially
or wholly to trapped-hole centres,
or mainly to Fe3+, Fe3+/Fe3+, with
sometimes minor IVCT Fe2+Ti4+, added
to some Mg2+ and Cr3+ (F.L. Sutherland
pers. comm., 2011; Schmetzer and
Schwarz, 2005).
Some magmatic sapphires may be
transported as xenocrystic passengers
by basalt and brought to the surface
from depths of up to 100 km (Keller,
1990, p.71) during volcanic eruptions.
The infrared spectra of these magmatic
sapphires show a peak at ± 3309
cm−1, which is not present in natural
metamorphic sapphires, nor in all (non-
heat treated) synthetic sapphires except
those issued from the Verneuil flame-
fusion syntheses; this is due (as for peaks
Figure 2: Broad parallel straight growth zonal striae lying in different planes and crossing each other at angles. Dark field illumination, magnification 15×.
Figure 3: Tiny ‘feather’ consisting of very fine acicular droplets. Dark field illumination, magnification 30×.
Figure 4: Polysynthetic twin lamellae, stone immersed in ethyl alcohol, between crossed polaroids, magnification 20×.
the ‘sleepy’ appearance of the stone. Lying
in the bottom of the pavilion, parallel to a
basal pinacoid is a tiny ‘feather’ consisting
of very fine acicular droplets (Figure 3).
Polysynthetic twin lamellae (Figure 4) are
visible with the stone immersed in ethyl
alcohol between crossed polaroids.
These inclusions exclude Verneuil
and Czochralski synthesis which display
curved colour and growth banding
(Gübelin and Koivula, 1986, 2008), often
in the company of rounded gas bubbles
with notably bold edges (although there
is polysynthetic twinning in some Verneuil
synthetics; Duroc-Danner, 1985).
In contrast, the most common
inclusions in flux-grown sapphires are
twisted veils of flux resembling net
curtains or veils blowing in the wind
(O’Donoghue, 2005; Gübelin and Koivula,
1986). While hexagonal, herring-bone or
sets of straight growth bands forming an
angle can occur in flux-grown synthetics,
their synthetic origin can be ascertained
by crystallographic investigation of
structural features such as morphology
and growth components. Straight parallel

The Journal of Gemmology / 2011 / Volume 32 / No. 5–8
Page 176
Untreated yellowish orange sapphire exhibiting its natural colour
± 3295 cm−1, ± 3232 cm−1, and ± 3185
cm−1) to a OH-dipole linked to atoms
of iron and titanium in the corundum
structure. The peak ± 3366 cm−1 is due
to OH clusters linked to a titanium atom
(Duroc-Danner, 2002).
The FTIR spectrum in the mid-infrared
region between 4000 and 2100 cm−1 of
the yellowish orange sapphire is shown
in Figure 5. There is a strong absorption
in the range 2300–1700 cm−1, a 3161 cm−1
peak, accompanied by peaks at 3240 cm−1
and 3354 cm−1.
The 3161-series occurs most
commonly in natural-colour yellow-to-
orange and padparadscha sapphires from
low-iron metamorphic environments,
which owe their colour partially or wholly
to trapped-hole centres. LA-ICP-MS
chemical data and heating experiments
suggest that the 3161-series is actually due
to structurally bonded OH associated with
Mg2+ (Smith and Van der Bogert, 2006).
The absence of a 3309 cm−1 peak
(location indicated on Figure 5), also
confirms that this yellowish orange
sapphire is of non-magmatic origin
(probably metamorphic) and has not
suffered heat-treatment.
Natural colour versus beryllium treated corundum
Heat-treatment of corundum, with
more or less colour improvement
occurred in Sri Lanka around the second
century ad, and is still performed today.
Corundums were embedded in an open
charcoal fire and air was blown through
a bamboo pipe to raise the temperature
up to 1000°C (Gunaratne, 1981; Hughes,
1988; Themelis, 1992, pp 113–14; Notari
and Grobon, 2002).
More modern heat-treatment
techniques were discovered apparently in
the 1960s (translucent milky white Geuda
sapphires from Sri Lanka transformed by
atmosphere-controlled high temperatures
around 1500°C into transparent richly
coloured sapphires). Diffusion-treated
corundum which first appeared on the
world market in the late 1970s (heating in
the range 1800°C with addition of colour-
causing elements such as titanium results
in a thin outer layer of saturated blue in
otherwise colourless or pale coloured
sapphire) produced dramatic results when
compared with the subtle changes of the
past (Kane et al., 1990; Emmett et al.,
2003).
More recently, in late 2001, beryllium-
diffused treated rubies and sapphires
were produced (heating the corundum
to around 1800°C with the beryllium
obtained, for example, by crushed
chrysoberyl, BeAl2O
4). The reaction
penetrates the entire sapphire to impart
relatively homogeneous yellow-to-orange
hues, although early examples of this
treatment could be recognized when the
stone was immersed in methylene iodide
or ethyl alcohol by the presence of a
colour zone that conforms to the external
faceted shape of the stone (Emmett et al.,
2003). As can be seen in Figure 6, when
immersed in ethyl alcohol the present
yellowish orange sapphire has a colour
distribution of angular yellow zoning
alternating with colourless areas, which
is characteristic of natural growth origin
(Hurwit, 1987).
DiscussionStandard gemmological properties,
such as RI, optic character and sign, and
SG, confirm that the stone is corundum,
variety yellowish orange sapphire, but
do not help in determining whether it is
natural or synthetic.
Nowadays at least four kinds of
process are used worldwide on a
commercial basis to produce synthetic
corundum, and the products are becoming
more sophisticated, thus posing a real
challenge to the unwary jeweller:
• Verneuilinvertedblow-pipe
process (Hrand Djévahirdjian S.A.,
Switzerland; Union Carbide, U.S.A.;
Nakazumi Earth Crystals, Japan;
Wiedes Carbidwerke Freyung,
Germany; etc).
• Czochralski(pulling)growth
technique (Union Carbide, U.S.A.;
Deltronics, New Jersey, U.S.A.; Crystal
Figure 5: FTIR spectrum showing the 3161 cm−1 series of peaks due to structurally bonded OH associated with Mg2+, and the absence of a 3309 cm−1 peak (indicated on the spectrum to show its location).
Figure 6: Straight angular yellow zoning alternating with colourless areas. Immersed in ethyl alcohol, magnification 10×.
1.60
1.55
1.50
1.45
1.40
1.35
1.30
1.25
1.20
1.15
1.104000 3800 3600 3400 3200 3000 2800 2600 2400 2200
wavelength (cm−1)
abso
rban
ce
3161
3240
3354
3309

The Journal of Gemmology / 2011 / Volume 32 / No. 5–8
Page 177
Untreated yellowish orange sapphire exhibiting its natural colour
Optics Research, California, U.S.A.;
Kyocera International Inc., Japan; etc).
• Fluxfusiongrowthtechnique(C.C.
Chatham, California; Douros, Greece;
J. Osmer Crystals Co., California,
U.S.A.; Kashan Inc., Texas, U.S.A.;
P.O. Knischka, Austria; J. Lechleitner,
Austria; etc).
• Hydrothermalgrowthprocess(Tairus
Co., Thailand and Russia; etc).
Also most natural corundums in the
gem market are heat-treated between
1000° and 1500°C. Additionally, some
are diffusion-treated with colour-causing
elements such as titanium (Ti) or more
recently beryllium (Be), which can be
detected using Secondary Ion Mass
Spectrometry (SIMS) or Laser Ablation-
Inductively Coupled Plasma-Mass
Spectrometry (LA-ICP-MS).
The present yellowish orange
sapphire was identified with conventional
gemmological equipment and infrared
spectroscopy, so recourse to the
expensive SIMS or LA-ICP-MS facilities
was not necessary.
The inclusions and internal
characteristics point towards a natural
stone devoid of heat-treatment (Panjikar
and Panjikar, 2011).
The FTIR spectrum not only confirmed
that the stone was not heat-treated, but
also established its non-magmatic origin
(probably metamorphic).
The faint uneven dark apricot
luminescence to ultraviolet radiation
provided helpful indications for non-
Be-diffusion treatment since Be-diffused
areas usually fluoresce a distinctive
homogeneous orange (Notari et al., 2003).
This indication is also consistent with the
angular yellow zoning alternating with
colourless areas, which is characteristic of
natural origin.
ReferencesBourgeois, M.L., 1884. Reproduction
artificielle des minéraux. Dunod,
éditeur, Paris, 62–5
Duroc-Danner, J.M., 1985. Polysynthetic
twin lamellae in synthetic Verneuil
sapphire. Journal of Gemmology, 19(6),
479–83
Duroc-Danner, J.M., 2002. A study of
Colombian corundum. Diplôme
d’Université de Gemmologie de
Nantes, 217 pp
Elwell, D., 1979. Man-made gemstones.
Ellis Horwood Ltd., Chichester. 52–7
Emmett, J.L., Scarratt, K., McClure, S.F.,
Moses, T., Douthit, T.R., Hughes, R.,
Novak, S., Shigley, J.E., Wang, W.,
Bordelon, O., and Kane, R.E., 2003.
Beryllium diffusion of ruby and
sapphire. Gems & Gemology, 39(2),
84–135
Gübelin, E.J., and Koivula, J.I., 1986.
Photoatlas of Inclusions in Gemstones.
ABC Verlag, Zürich. 532 pp
Gübelin, E.J., and Koivula, J.I., 2008.
Photoatlas of Inclusions in Gemstones.
3. Opinio Publishers, Basel. 672 pp
Gunaratne, H.S., 1981. “Geuda sapphires”
— Their colouring elements and
their reaction to heat. Journal of
Gemmology, 17(5), 292–300
Hughes, R.W., 1988. Identifying yellow
sapphires – two important techniques.
Journal of Gemmology, 21(1), 23-5
Hughes, R.W., 1997. Ruby and Sapphire.
RWH Publishing, Boulder, CO. 511 pp
Hurwit, K.N., 1987. Heat-treated yellow
sapphire. Gem Trade lab notes. Gems
& Gemology, 23(3), 167
Kane, R.E., Kammerling, R.C., Koivula, J.I.,
Shigley, E., and Fritsch, E., 1990. The
identification of blue diffusion-treated
sapphires. Gems & Gemology, 26(2),
115–33
Keller, P.C., 1990. Gemstones and their
origins. Van Nostrand Reinhold, New
York, 144 pp
Kiefert, L., and Schmetzer, K., 1988.
Morphology and twinning in Chatham
synthetic blue sapphire. Journal of
Gemmology, 21(1), 16–22
Kiefert, L., and Schmetzer, K., 1991. The
microscopic determination of structural
properties for the characterization of
optical uniaxial natural and synthetic
gemstones. Part 3: Examples for the
applicability of structural features for
the distinction of natural and synthetic
sapphire, ruby, amethyst and citrine.
Journal of Gemmology, 22(8), 471–82
Koivula, J.I., Tannous, M., and Schmetzer,
K., 2000. Synthetic gem materials
and simulants in the 1990s. Gems &
Gemology, 36(4), 360–79
Notari, F., and Grobon, C., 2002.
Gemmologie du corindon et du
spinelle. Minéraux et Fossiles, Paris,
Hors-série No.15, 48–59
Notari, F., Fritsch, E., and Grobon, C.,
2003. Comment l’observation de la
luminescence (fluorescence) peut
aider à l’identification des corindons
jaunes, rose orangé et orange, traités
par diffusion de béryllium. Revue de
Gemmologie A.F.G., 148, 40–3
Nassau, K., 1980. Gems made by man.
Chilton Book Company, Radnor,
Pennsylvania, 83
O’Donoghue, M., 2005. Artificial
gemstones. NAG Press, London, 109–42
Panjikar, J., and Panjikar, A., 2011.
Importance of various “feather type”
inclusions for the identification of
natural, treated, synthetic and treated-
synthetic yellow sapphire. 32nd IGC
Abstracts, 85–8
Peretti, A., Mullis, J., Mouawad, F., and
Guggenheim, R., 1997. Inclusions
in synthetic rubies and synthetic
sapphires produced by hydrothermal
methods (Tairus, Novosibirsk, Russia).
Journal of Gemmology, 25(8), 541–61
Renfro, N., Koivula, J.I., Wang, W., and
Roskin, G., 2010. Synthetic gem
materials in the 2000s: A decade in
review. Gems & Gemology, 46(4),
260–73
Schmetzer, K., 1986. An improved sample
holder and its use in the distinction of
natural and synthetic ruby as well as
natural and synthetic amethyst. Journal
of Gemmology, 20(1), 20–33
Schmetzer, K., and Peretti, A., 1999.
Some diagnostic features of Russian
hydrothermal synthetic sapphires.
Gems & Gemology, 35(1), 17–28

The Journal of Gemmology / 2011 / Volume 32 / No. 5–8
Page 178
Untreated yellowish orange sapphire exhibiting its natural colour
Schmetzer, K., and Peretti, A., 2000.
Characterization of a group of
experimental Russian hydrothermal
synthetic sapphires. Journal of
Gemmology, 27(1), 1–7
Schmetzer, K., and Schwarz, D., 2005. A
microscopy-based screening system to
identify natural and treated sapphires
in the yellow to reddish-orange colour
range. Journal of Gemmology, 29(7),
407–49
Smith, C.P., and Van der Bogert, C., 2006.
Infrared spectra of gem corundum.
Gems & Gemology, 42(3), 92–3
Sturman, D.B., and Parker, D., 2010.
Use of the polarizing filter on the
refractometer in determination of
the optic sign or optic character of
a gemstone. Journal of Gemmology,
31(1–4), 90–100
Themelis, T., 1992. The heat treatment
of ruby and sapphire. Gemlab Inc.,
U.S.A., 236 pp
The AuthorJ.M. Duroc DannerGeneva, Switzerland
e-mail: [email protected]

The Journal of Gemmology / 2011 / Volume 32 / No. 5–8
©2011 Gemmological Association of Great Britain Page 179
Alexandrite and colour-change chrysoberyl from the Lake Manyara alexandrite-emerald deposit in northern TanzaniaDr Karl Schmetzer and Anna-Kathrin Malsy
Abstract: Mineralogical and gemmological properties of alexandrite from the Mayoka deposit, Lake Manyara mining area, Tanzania, are described. The alexandrite crystals are located in a phlogopite-bearing schist which is part of a metamorphic-metasomatic association of mafic or ultramafic rocks in contact with pegmatitic intrusions. Emeralds are associated with the pegmatites. Single crystals, contact twins, penetration twins and cyclic twins (trillings) are all present in this area and are developed in two major habits, one tabular parallel to the a pinacoid and the other columnar along the a-axis. Microscopic features of faceted and rough alexandrites are characterized by internal growth structures reflecting the external morphology of the samples. Common mineral inclusions are phlogopite, apatite and zircon. Associated with series of channels parallel to the a-axis three groups of elongated or tabular negative crystals oriented in a plane parallel to the a pinacoid form milky white zones in some samples. The complexity of alexandrite colours is clarified to some extent by correlation of colorimetric parameters with trace element contents and with the orientation of the alexandrites. The designation of samples as alexandrites and a possible distinction from colour-change chrysoberyl is discussed. Alexandrite and green chrysoberyl from Lake Manyara is compared with samples from other occurrences in phlogopite-bearing schist such as the ‘classical’ alexandrite deposits in the Urals, Russia, and from Novello, Zimbabwe.
Historical backgroundThe first emeralds originating from the
Lake Manyara alexandrite-emerald deposit
were discovered in 1968 or 1969 by local
residents and after some time appeared
in Arusha, in northeastern Tanzania,
where they were seen by the prospector
Hans Kristen. He and some of his group
were able to trace the emeralds back to
a place called Maji Moto (hot springs) in
the Lake Manyara area. In February 1970,
after months of prospecting activities, they
finally discovered the primary deposit
on the western bank of Lake Manyara.
The mining rights were given to and
the mine was exploited by Galai Mining
Company Ltd., headed by George ‘Papas’
Papaeliopoulos (also spelled in the
literature Papaleoupoulos, Papadopoulos)
until 1973. Within this period, more than
100 workers were employed in the mine
yielding more than 200 kilos of emerald
Irregular alexandrite twin from Lake Manyara,
Tanzania; view parallel to the a-axis,
immersion, crossed polarizers, field of view 6.5
× 4.9 mm. Photo by K. Schmetzer.
(July 1970 to April 1972). In contrast, an
official report by Mwakisunga (1972 a,b),
a geologist who examined the mining area
from July to September 1972 for Tanzania
Gemstone Industries Ltd, a subsidiary of
the State Mining Corporation, mentioned
only the possible occurrence of gem
materials in the mine and no commercial
production.
In February 1973, the activities of
Galai Mining Company were stopped by

The Journal of Gemmology / 2011 / Volume 32 / No. 5–8
Page 180
Alexandrite and colour-change chrysoberyl from the Lake Manyara alexandrite-emerald deposit in northern Tanzania
the Tanzanian government and the mine
was nationalized. The government had
decided to take over the mine because
no production figures had been reported
for several months and no emeralds had
ever been exported officially. G. Papas
was arrested and imprisoned, being
accused of smuggling emeralds out of the
country. The mining activities continued
under the guidance of Kristen for the
state-owned Manyara Emerald Co. During
their stay in Tanzania in November 1973
and July 1974, E. Gübelin from Lucerne
and H. Bank from Idar-Oberstein were
allowed to visit the mine. They reported
on a mine in full production with several
dozens of labourers. In 1976 the so-
called Mayoka mine was taken over by
the state-owned Stamico (State Mining
Company). Activities declined and finally
the mine was abandoned. Prospecting
work was performed in the late 1970s and
early 1980s by the companies Stamico
and Gemco Ltd. (for the history from the
discovery of the deposit to the 1980s see
Mwakisunga, 1972 a,b; Thurm, 1972, a,b,c;
Bank, 1974; Gübelin, 1974, 1976; Bank
and Gübelin, 1976; Viswanatha and Shah,
1983).
For almost three decades, only limited
mining activity in the area by local farmers
or other residents has been reported; they
sporadically worked, legally or illegally,
the old veins in the Mayoka mine and
other pits nearby (Simonet, 1997, 2010;
Werner Radl and John Saul, pers. comm.,
2010, 2011). Only small parcels of gem-
quality emerald (Figures 1a and 1b) or
alexandrite (Figure 2) from this source
reached the market.
In October 2009, participants of the
International Gemmological Conference
were able to visit the area and allowed
to see a mine, which was operated by
Charles Perfect (Coldham and Payette,
2010; Wight and Wight, 2010). The visitors
were told that active mining had started
only some months ago. They reported
on an area with deeply weathered
country rocks with darker bands, some
metres wide (Figure 3), which appeared
to be deeply weathered amphibolite-,
actinolite- and phlogopite-bearing schist,
intruded by pegmatites. These darker
Figures 1a and 1b: Emerald crystals from the Lake Manyara deposit show a surface consisting of heavily etched crystal faces; such natural etching is common in beryls from pegmatitic deposits, but less so in emeralds (see, e.g., Honess, 1917). Collection of W. Radl, Niederwörresbach, Germany. Photos by K. Schmetzer.Figure 1a: Samples from 33.2 to 3.7 ct in weight, the emerald in the centre measures 13 × 7 mm. Figure 1b: Heavily etched emerald, 4.85 ct, 13 × 7 mm.
Figure 2: These two recently found alexandrite crystals were shown to the visitors at Mayoka mine in October 2009. Photo by Willow Wight.
a
b

The Journal of Gemmology / 2011 / Volume 32 / No. 5–8
Page 181
Alexandrite and colour-change chrysoberyl from the Lake Manyara alexandrite-emerald deposit in northern Tanzania
rocks were indicated by the miners as
possibly alexandrite-bearing or as possibly
emerald-bearing veins. To find emerald
(Figures 1a and 1b) or alexandrite
(Figure 2), the miners follow these dark,
possibly emerald- or alexandrite-bearing
amphibolite-actinolite-phlogopite bands
in different parts of the mine (Figures 4
and 5) and remove these darker layers
from the more or less weathered lighter
country rock (Anne and George Bosshart,
Terry Coldham, Francine Payette, Willow
and Quintin Wight, Hanco Zwaan; pers.
comm., 2010, 2011).
At present (2011) the mine visited
by participants of the International
Gemmological Conference in 2009 is still
operated by Charles Perfect, and the gem
material is marketed by Sailesh Pandit
of Signature Gems, Arusha, Tanzania
(Werner Radl, pers. comm., 2011). The
claim adjacent to this location is exploited
by Emanuel Pengo (Figure 6). The term
‘Mayoka’ is used for both mining areas,
but it is not clear to the present authors,
which parts of these claims were originally
covered by the claims of G. Papas in the
early 1970s (see above).
The Mayoka mine was originally
located close to the boundary of the
Lake Manyara Game Reserve, but at
least partly outside the park. Due to an
expansion of the Reserve, the mining area
is nowadays located completely within
the park. This created a conflict (see
Kondo, 2005; Nkwame, 2009) which was
settled in December 2010 by a Tanzanian
court allowing the continuation of mining
activities in the main Lake Manyara
Figure 3 : Detailed view of the deeply weathered country rock traversed by darker bands of what appear to be actinolite-phlogopite-bearing zones or layers, mostly some metres wide. These bands were indicated by the miners at Mayoka mine as either alexandrite- or emerald-bearing veins. Photo by Quintin Wight.
Figure 4 : ‘Emerald adit’ at Mayoka mine with miner removing the rocks of the darker emerald-bearing vein from the surrounding country rock. Photo by Francine Payette.
Figure 5 : Miner digging for alexandrite in a weathered zone of the actinolite-phlogopite schist at Mayoka mine. Photo by Willow Wight.
3
4
5

The Journal of Gemmology / 2011 / Volume 32 / No. 5–8
Page 182
Alexandrite and colour-change chrysoberyl from the Lake Manyara alexandrite-emerald deposit in northern Tanzania
alexandrite-emerald deposit and also for
some local miners working in the area.
Formation of emerald and alexandrite
The formation of emerald and
alexandrite in phlogopite-bearing host
rocks was recently summarized by
Schmetzer et al. (2011). Alexandrite and
emerald are the rare green varieties
of chrysoberyl (BeAl2O
4) and beryl
(Be3Al
2Si
6O
18), respectively. Trace amounts
of chromium are the principal cause of
the green colours of both gem minerals
and are responsible for the colour-change
of alexandrite. The development of
both gemstones in a rock requires the
simultaneous availability of beryllium and
chromium and it is not uncommon to find
both minerals near to each other but not
in contact. Chromium is present to some
extent in ultramafic rocks, such as dunite
and peridotite and their metamorphic
equivalents, serpentinite and talc schist.
Although beryllium is usually associated
with specific types of granitic pegmatites
in which it commonly occurs as beryl,
it can also be derived from feldspars
and other minerals independent of a
pegmatitic source.
It follows therefore that an interaction
between a beryllium-rich pegmatite and
an ultramafic or mafic host would provide
a suitable environment for the formation
of emerald and/or alexandrite, mostly
in a complex metamorphic-metasomatic
alteration process. The emerald occurs
within and in close proximity to the
pegmatite; the rarer alexandrite and
chrysoberyl formed under silicon-poor
conditions and occurs more distally.
It need not be directly associated with
the pegmatite. Deposits with a similar
paragenesis, especially those containing
alexandrite in phlogopite lenses or
phlogopite bodies, include the Russian
emerald-alexandrite-phenakite deposits
in the Urals and the emerald-alexandrite
occurrence from the Novello deposit,
Masvingo District, Zimbabwe.
Geology of the Lake Manyara deposit, Tanzania
Several authors have mentioned that
the Lake Manyara deposit belongs to the
classical phlogopite-related metamorphic-
metasomatic type described for the
alexandrite occurrences in the Urals or in
Novello (see Box 1). The most detailed
description of the country rocks found in
the area and the reaction zone between
ultramafic or suitable mafic rocks and
pegmatite veins at the Lake Manyara
deposit is in an unpublished report by
Viswanatha and Shah (1983):
“The rock types within the area consist
of permeated gabbroic amphibolite
and meta-pyroxenite bordered on
either side by banded granodioritic
to granitic gneisses….The borders of
the pyroxenite with the amphibolite
are traversed by veins of pegmatite
and quartzo-feldspathic permeations
and are marked by the development
of alteration zones rich in acicular
bunches of actinolite and tremolite
with interlocked flakes of vermiculite.
Some of these pegmatites along this
contact carry gem quality emerald,
green aquamarine, chrysoberyl cat’s-
eye, alexandrite, alexandrite cat’s-eye,
ruby and garnet.”
A more recent summary is in another
unpublished report by Simonet (1997):
“The Manyara deposit belongs to the
Box 1 In some older papers, the mica
associated with emerald and
alexandrite is described as biotite,
but modern analyses show that
most brownish micas in these
alteration zones contain less iron
than in biotite and, thus should
be designated phlogopite. The
actual analyses of some micas
on rough alexandrite samples
from Lake Manyara and from
inclusions in faceted Lake Manyara
alexandrites by the present
authors gave between 7.86 and
8.57 wt% FeO. All micas analysed
contained significant amounts of
potassium and, thus, the samples
were designated phlogopite and
not vermiculite. This is consistent
with the analysis of phlogopite
inclusions in Lake Manyara
emeralds reported by Moroz and
Eliezri (1999).
Figure 6: Another area next to the Mayoka mine visited by participants of the International Gemmological Conference in 2009 is exploited by E. Pengo who is using also the term ‘Mayoka’ for his claim. Mayoka is also the name of a small village nearby. Photo (taken in 2011) courtesy of Werner Radl.

The Journal of Gemmology / 2011 / Volume 32 / No. 5–8
Page 183
Alexandrite and colour-change chrysoberyl from the Lake Manyara alexandrite-emerald deposit in northern Tanzania
category of emeralds in micaschists. Its
main characteristics are the following:
It is evidently associated with an
alignment of altered ultrabasic bodies,
which follows a big shear zone. Many
pegmatite dikes have been observed
and are thought to be the source of
the beryllium. In one of the pits I
visited, mineralizations are strikingly
associated with black biotite veins,
one to several meters thick, with
strongly marked orientation, and
surrounded by black amphibolites.
Emerald is present as isolated crystals
in biotitites, or in pockets associated
with transparent quartz. Alexandrite
appears in lumps of a whitish rock
inside the emerald bearing biotitites,
or associated with mica, in desilicified
pegmatites.”
Most other authors have described
the emerald host rocks as massive
biotite schists or biotite lenses and less
commonly as pegmatites with emeralds
occurring in these types of host rocks
and especially at the contact between
pegmatites and biotite schists (Thurm,
1972 a,b,c; Gübelin, 1974; Bank and
Gübelin, 1976; Bridges, 1982). Mineral and
fluid inclusions in Lake Manyara emeralds
were examined with modern analytical
methods by Moroz and Eliezri (1999) and
Moroz et al. (2001). The P-T conditions of
emerald growth are given as: T = 370-470
°C, P = 3.0-7.0 kbar.
Furthermore, alexandrite is mentioned
to occur together with emerald in
the biotite schist (Thurm, 1972 a,b,c),
occasionally also together with emerald
and ruby (Bank, 1974; Amstutz and Bank,
1977). However, the alexandrite has also
been found in actinolite schist (Gübelin,
1976; Bank and Gübelin, 1976).
In summary, emeralds are found in
the phlogopite and at the contact between
phlogopite and pegmatite veins, while
alexandrites are found in the phlogopite
and within masses of deeply weathered
white feldspar originating from desilicified
pegmatite veins.
So far, the details described in the two
unpublished reports by Viswanatha and
Shah (1983) and Simonet (1997) and in
various other papers are not completely
consistent (see also the summary of Keller,
1992, 49–59) but fit within the general
concept of formation of alexandrite and
emerald in a complex metamorphic-
metasomatic phlogopite-bearing alteration
zone formed between an intruding
pegmatite and mafic or ultramafic rocks.
Consequently, the Mayoka mining area
close to Lake Manyara is a deposit of
the same kind as those metamorphic-
metasomatic deposits in the alexandrite-
emerald mining belt of the Urals, Russia,
and the Novello deposit, Zimbabwe.
Scope of the present paperMineralogical and gemmological
descriptions of alexandrite from Lake
Manyara were made of a limited number
of samples in the 1970s (Dunn, 1976;
Gübelin, 1976; Liddicoat, 1976; Bank and
Gübelin, 1976). Morphological properties
of rough crystals are only briefly
mentioned, and growth patterns in rough
Figure 7: Alexandrite trilling in different orientations and mirrored to show habit, and faceted alexandrite from Lake Manyara, Tanzania, shown in both daylight and incandescent light; these extraordinary pieces are from the collection of W. Radl, Niederwörresbach, Germany. The trilling weighs 132 g, view almost parallel to the a-axis, size 62 × 43 mm, thickness along the a-axis 29 mm; the faceted alexandrite weighs 0.71 ct, size 4.8 × 4.7 mm. Photos and artwork by K. Schmetzer.

The Journal of Gemmology / 2011 / Volume 32 / No. 5–8
Page 184
Alexandrite and colour-change chrysoberyl from the Lake Manyara alexandrite-emerald deposit in northern Tanzania
Figure 8: Alexandrite crystals from Lake Manyara, Tanzania, shown in both daylight (a) and incandescent light (b); The alexandrites are found as single crystals (A), interpenetrant twins (B), contact twins (C) or cyclic twins (trillings, D); in the upper row, the crystals show columnar habit along the crystallographic a-axis, in the lower row, the crystals show tabular habit parallel to the a pinacoid. The two interpenetrant twins (B) measure 10.0 × 6.5 mm, length along the a-axis 10.0 mm (sample in the upper row) and 14.1 × 7.5 mm, thickness along the a-axis 3.8 mm (sample in the lower row). Collections of SSEF, Basel, Switzerland (H.A. Hänni collection), and W. Radl, Niederwörresbach, Germany. Photo by K. Schmetzer.
Figure 9: Schematic drawings of alexandrites from the Lake Manyara deposit, Tanzania. Single crystals (A to D), contact twins (E to I) and interpenetrant twins (J, K) are shown. The single crystals and twins are drawn in a view parallel to the a-axis, single crystals show tabular habit parallel b (A, D) or tabular habit parallel a (B, C), twins show tabular habit parallel a (E to H, J) or columnar habit along the a-axis (I, K). Crystal drawings and artwork by K. Schmetzer.
AB C
D
8a
8b
A
HG
FED
CB
K
J
I
9

The Journal of Gemmology / 2011 / Volume 32 / No. 5–8
Page 185
Alexandrite and colour-change chrysoberyl from the Lake Manyara alexandrite-emerald deposit in northern Tanzania
or faceted samples were not reported.
Analytical data for trace element contents
or analytical determination of inclusions
are limited. Thus, in the present account,
the authors will try to fill this gap using
numerous rough and faceted samples
available from collectors closely associated
with the Tanzanian gem trade for many
years, from the reference collections of
gemmological laboratories and from the
gem trade.
Subsequent to the recent monograph
containing detailed descriptions of the
properties of alexandrite from the Uralian
deposits (Schmetzer, 2010), and from
the emerald-alexandrite occurrence at
Novello, Zimbabwe (Schmetzer et al.,
2011), the current authors were also
interested in comparing the mineralogical
and gemmological characteristics of Lake
Manyara alexandrite with stones from the
other sources mentioned. Although the
general occurrence of alexandrite from
these deposits in a phlogopite matrix has
been discussed in the literature, a detailed
comparison of their characteristic features
is not available.
Research materialsIn the current investigation, the
authors examined more than 200
complete crystals and crystal groups as
well as crystal fragments, together with
some alexandrite in matrix. Furthermore,
45 faceted stones in the range of 0.15 to 3
ct were available for examination (Figure
7). The samples originated from private
collections, from the reference collections
of gemmological laboratories and from the
stock of several companies. The samples
are drawn from stones collected over
the full time scale of four decades from
the discovery of the mining area in the
early 1970s to the most recent production
(2009). No significant differences were
found between samples unearthed in
different decades within the Lake Manyara
deposit.
Morphology, twinning and colour
Alexandrites from Lake Manyara show
some variability in morphology, and
especially in different forms of twinning.
The crystals were determined as single
crystals, contact twins, penetration twins
or cyclic twins (trillings). Two major habits
are found within each group (Figures 8, 9
and 14), which can be described as
I. tabular parallel to the a (100) pinacoid
or
II. tabular parallel to the b (010) pinacoid
or columnar along the a [100] axis.
From the crystal material available,
the authors were able to determine
seven external crystal forms for the
orthorhombic chrysoberyls, namely the
pinacoids a and b, the prisms i, s, and
r, and the dipyramids o and n (Table I). The habit of all crystals is determined by
three crystal forms, the two pinacoids
a and b and the prism i. The remaining
prisms s and r and dipyramids o and n,
are accessory forms only. The dipyramid
w was only found as an internal growth
feature.
All samples which are tabular parallel
to the a pinacoid (group I), show
dominant a pinacoids and somewhat
smaller b and i faces. If the b pinacoids
as well as the i prism faces are larger
and dominant with a faces still being
present (group II), the samples are mostly
columnar along the a-axis or rarely tabular
parallel b (Table I).Single crystals of both groups (Figures
9 and 10) are rare. The largest single
crystal examined weighing 30 g is pictured
in Figure 11. In contrast, contact twins
with tabular habit are common, while
columnar contact twins are rare (Figure
12). Tabular penetration twins are rare,
Table I: Morphological properties of alexandrites from Lake Manyara, Tanzania.
Possible crystal forms and designation
Crystal form Designation Miller indices (hkl)* Number of faces
Pinacoida (100) 2
b (010) 2
Prism
i (011) 4
s (120) 4
r (130) 4
Dipyramid
o (111) 8
n (121) 8
w (122) 8
*Based on a morphological cell with a 4.42, b 9.39, c 5.47
Crystal class 2/m 2/m 2/m = D2h, single and repeated twinning on (031) and (03
–1)
Habit of single crystals, twins and cyclic twins (trillings)
Habit Dominant forms
Subordinate forms
Accessory forms
Drawings in Figure
Single
crystals
Tabular parallel a a b, i o, r 9 C
Tabular parallel b
or columnar along
a-axis
a, b, i s, r, o, n 9 A, B, D
Contact
twins
Tabular parallel a a b, i s, r, o, n 9 E, F, G, H
Columnar along
a-axisa, b, i s, r, o, n 9 I
Penetration
twins
Tabular parallel a a b, i s, r, o, n 9 J
Columnar along
a-axisa, b, i s, r, o, n 9 K
Cyclic twins
(trillings)
Tabular parallel a a b, i o 14 A, B, C
Columnar along
a-axisa, (b), i o 14 D, E, F
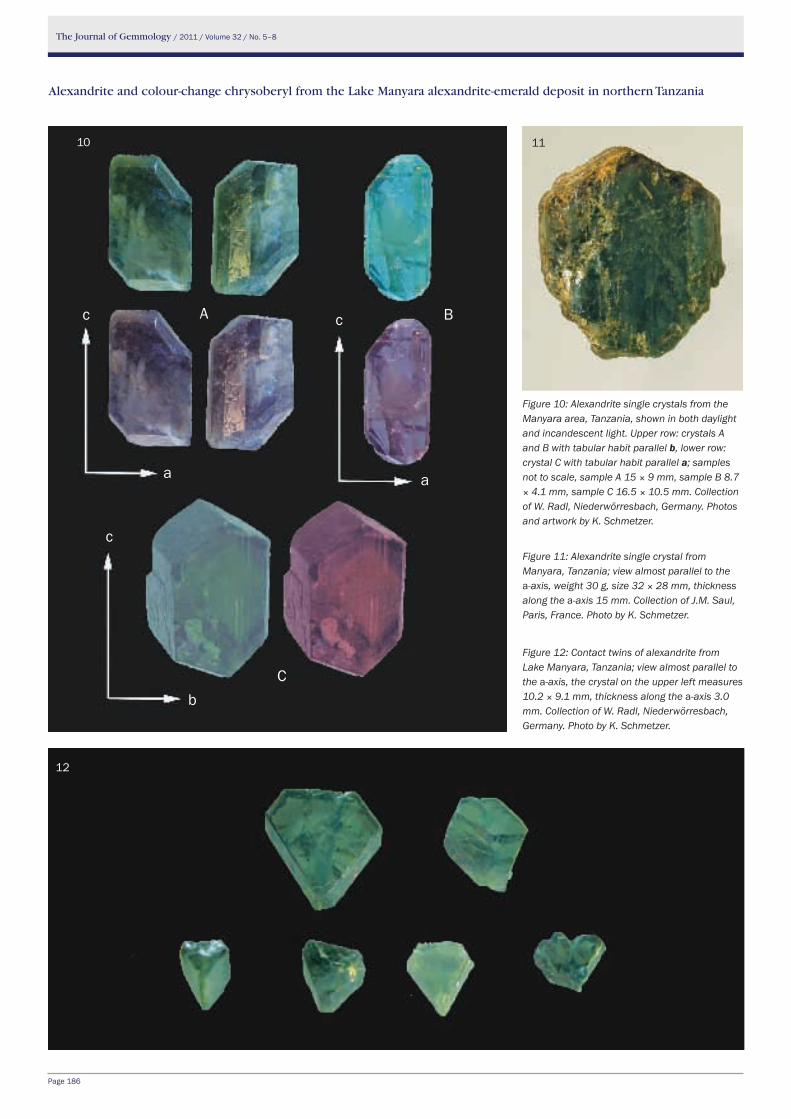
The Journal of Gemmology / 2011 / Volume 32 / No. 5–8
Page 186
Alexandrite and colour-change chrysoberyl from the Lake Manyara alexandrite-emerald deposit in northern Tanzania
Figure 10: Alexandrite single crystals from the Manyara area, Tanzania, shown in both daylight and incandescent light. Upper row: crystals A and B with tabular habit parallel b, lower row: crystal C with tabular habit parallel a; samples not to scale, sample A 15 × 9 mm, sample B 8.7 × 4.1 mm, sample C 16.5 × 10.5 mm. Collection of W. Radl, Niederwörresbach, Germany. Photos and artwork by K. Schmetzer.
Figure 11: Alexandrite single crystal from Manyara, Tanzania; view almost parallel to the a-axis, weight 30 g, size 32 × 28 mm, thickness along the a-axis 15 mm. Collection of J.M. Saul, Paris, France. Photo by K. Schmetzer.
Figure 12: Contact twins of alexandrite from Lake Manyara, Tanzania; view almost parallel to the a-axis, the crystal on the upper left measures 10.2 × 9.1 mm, thickness along the a-axis 3.0 mm. Collection of W. Radl, Niederwörresbach, Germany. Photo by K. Schmetzer.
10 11
12
A B
C
a a
b
c
cc

The Journal of Gemmology / 2011 / Volume 32 / No. 5–8
Page 187
Alexandrite and colour-change chrysoberyl from the Lake Manyara alexandrite-emerald deposit in northern Tanzania
Figure 13: Penetration twins of alexandrite from Lake Manyara, Tanzania; view almost parallel to the a-axis (a) and oblique to the a-axis (b), the largest sample shows tabular habit parallel a, the three smaller twins show columnar habit along the a-axis; size of the largest crystal 14.1 × 7.5 mm, thickness along the a-axis 3.8 mm. Collection of W. Radl, Niederwörresbach, Germany. Photos by K. Schmetzer.
a b
Figure 14: Schematic drawings of alexandrite cyclic twins (trillings) from the Lake Manyara deposit, Tanzania. The cyclic twins are shown in views parallel to the a-axis (upper rows) and perpendicular to the a-axis (lower rows); the trillings show tabular habit parallel a (A to C) or columnar habit along the a-axis (D to F). Crystal drawings and artwork by K. Schmetzer.
and columnar penetration twins were seen
only occasionally (Figure 13). On the
other hand, tabular trillings (cyclic twins)
are common (Figures 14 and 15), but only
a few columnar trillings were seen (Figure 16). Tabular trillings commonly show
colour zoning with a transparent light
green rim and an off-white, translucent
core. In several samples, between rim
and core, there are transparent green
and translucent off-white layers. The two
largest somewhat distorted trillings seen
by the present authors weigh 132 and 16
g respectively (Figures 7 and 17).
Some more irregular twins can be
described as contact twins with an
additional crystal in twin position (Figure 18
and 19, sample A), as part of a penetration
twin (Figure 19, sample B) or as part of a
trilling (Figure 20).In summary, the variability of
morphology, i.e. the presence of single
crystals and a wide range of twins and
trillings, is enormous. It is comparable
with or even exceeds the wide variability
of alexandrites from the large Uralian
mining area in Russia. Two types of
samples are commonest: tabular contact
twins (Figure 12) and tabular trillings (Figure 15), both with dominant a pinacoids and
subordinate i prism faces and b pinacoids.
Tabular contact twins commonly show
small o dipyramids and one or two
A
FED
CB

The Journal of Gemmology / 2011 / Volume 32 / No. 5–8
Page 188
Alexandrite and colour-change chrysoberyl from the Lake Manyara alexandrite-emerald deposit in northern Tanzania
Figure 15: Cyclic twins (trillings) of alexandrite from Lake Manyara, Tanzania, with tabular habit parallel a shown in both daylight and incandescent light, view almost parallel to the a-axis; samples A to C show distinct zoning with alternating green and milky white layers. Samples not to scale; sample A 21 × 17.5 mm, thickness along the a-axis 8.0 mm; sample B 8.8 × 8.2 mm, thickness along the a-axis 5.2 mm; sample C 12.5 × 8.5 mm, thickness along the a-axis 5.3 mm; sample D 11.0 × 9.0 mm, thickness along the a-axis 4.7 mm. Collection of W. Radl, Niederwörresbach, Germany. Photos and artwork by K. Schmetzer.
Figure 17: Alexandrite trilling from Lake Manyara, Tanzania. The trilling weighs 16 g, view almost parallel to the a-axis, size 27.5 × 14.5 mm, thickness along the a-axis 11.0 mm. Collection of Paul Wild Company, Kirschweiler, Germany. Photo by K. Schmetzer.
A
B C
D
Figure 16: Cyclic twin (trilling) of alexandrite from Lake Manyara, Tanzania, with columnar habit along the a-axis shown in both daylight and incandescent light; diameter of sample 9.5 × 9.0 mm, length along the a-axis 11.0 mm. Collection of F. Jurkutat, Einbeck, Germany. Photo by K. Schmetzer.

The Journal of Gemmology / 2011 / Volume 32 / No. 5–8
Page 189
Alexandrite and colour-change chrysoberyl from the Lake Manyara alexandrite-emerald deposit in northern Tanzania
smaller prism faces (s or r). Tabular
trillings, in general, show only small o
dipyramids, but no s or r prism faces.
The colours of rough alexandrites and
chrysoberyls from Lake Manyara range
(in daylight) from various shades and
intensities of green to yellowish green
or bluish green. The pleochroism of
Lake Manyara alexandrites in polarized
light is distinct, and is as seen in most
alexandrites from different sources (for
the description of colour in different
directions of view, i.e. pleochroism in
non-polarized light, see below).
Pleochroism of alexandrite from Lake Manyara, Tanzania, in polarized light
DaylightIncandescent
light
X || a yellow green purple to
purplish red
Y || b yellow orange
Z || c blue green blue green
Microscopic features of crystals
To understand the structural pattern,
colour zoning and zoning of inclusions
of faceted gemstones, it is helpful to
examine the microscopic characteristics
of transparent rough single and twinned
crystals. The microscopic characteristics
of contact twins and penetration twins
are shown in Figure 21, and examples for
cyclic twins are shown in Figure 22. In
views parallel to the a-axis (in most cases
perpendicular to the large a pinacoids
of the crystals), a growth pattern with
dominant i prism faces as growth
structures is present. In some crystals, we
noted also growth structures parallel to
the b pinacoid. If a twin plane or several
twin planes are present, the twin planes
are perpendicular to i prism faces of the
different parts of the twin.
In the centres of crystals, i.e. in the
first stages of crystal growth, the faces
a, b, i, o and w can be present (see Table I), but in later stages of growth, the
Figure 18 a to c: Irregular alexandrite contact twin with tabular habit parallel a from Lake Manyara, Tanzania: (a) in both daylight and incandescent light; (b) in a schematic crystal drawing; and (c) in immersion showing growth planes and inclusion distribution. The crystal consists of three twinned individuals; view almost parallel to the a-axis, size 8.5 × 7.2 mm, thickness along the a-axis 2.7 mm. Collection of J.M. Saul, Paris, France. Photos and crystal drawing by K. Schmetzer.
Figure 19: Irregular alexandrite contact twins with tabular habit parallel a from Lake Manyara, Tanzania shown in both daylight and incandescent light; crystal A consists of three twinned individuals and crystal B consists of two twinned individuals; view almost parallel to the a-axis; sample A size 6.2 × 6.1 mm, thickness along the a-axis 3.2 and 1.8 mm (in different parts), sample B size 5.5 × 4.5 mm, thickness along the a-axis 2.7 mm. Collection of W. Radl, Niederwörresbach, Germany. Photos by K. Schmetzer.
a
b c
A B
a a
a
b
i
i
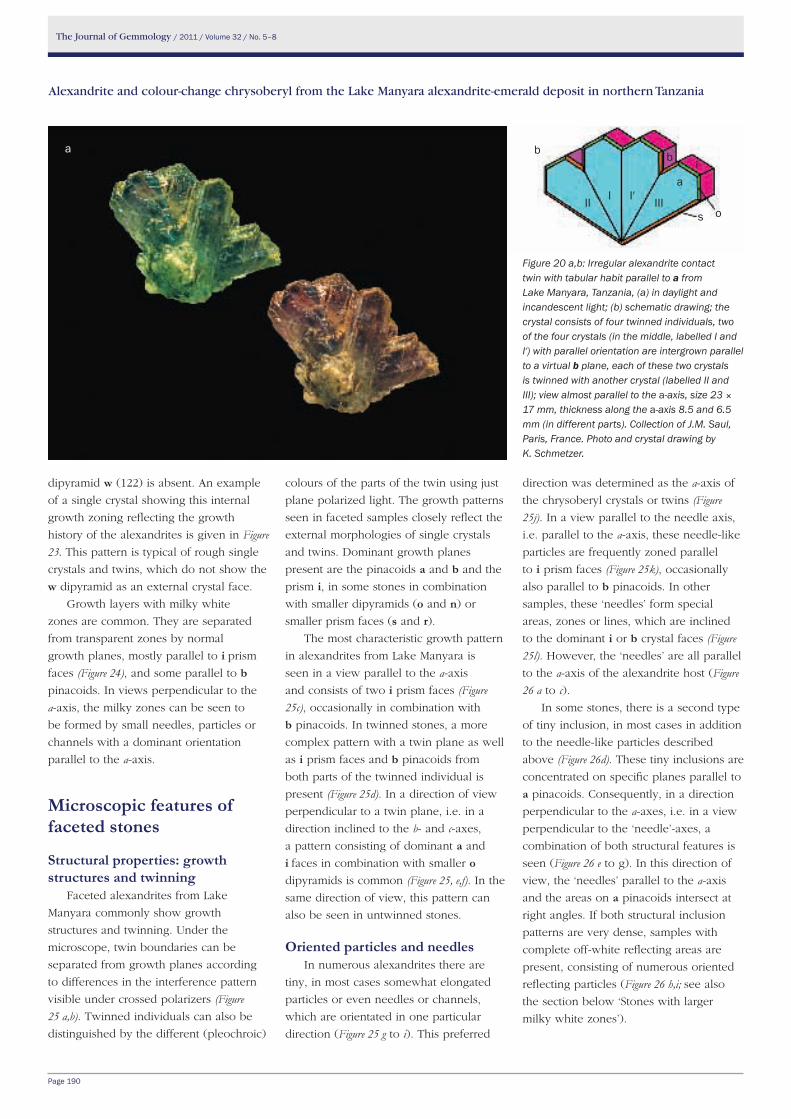
The Journal of Gemmology / 2011 / Volume 32 / No. 5–8
Page 190
Alexandrite and colour-change chrysoberyl from the Lake Manyara alexandrite-emerald deposit in northern Tanzania
dipyramid w (122) is absent. An example
of a single crystal showing this internal
growth zoning reflecting the growth
history of the alexandrites is given in Figure 23. This pattern is typical of rough single
crystals and twins, which do not show the
w dipyramid as an external crystal face.
Growth layers with milky white
zones are common. They are separated
from transparent zones by normal
growth planes, mostly parallel to i prism
faces (Figure 24), and some parallel to b
pinacoids. In views perpendicular to the
a-axis, the milky zones can be seen to
be formed by small needles, particles or
channels with a dominant orientation
parallel to the a-axis.
Microscopic features of faceted stones
Structural properties: growth structures and twinning
Faceted alexandrites from Lake
Manyara commonly show growth
structures and twinning. Under the
microscope, twin boundaries can be
separated from growth planes according
to differences in the interference pattern
visible under crossed polarizers (Figure 25 a,b). Twinned individuals can also be
distinguished by the different (pleochroic)
colours of the parts of the twin using just
plane polarized light. The growth patterns
seen in faceted samples closely reflect the
external morphologies of single crystals
and twins. Dominant growth planes
present are the pinacoids a and b and the
prism i, in some stones in combination
with smaller dipyramids (o and n) or
smaller prism faces (s and r). The most characteristic growth pattern
in alexandrites from Lake Manyara is
seen in a view parallel to the a-axis
and consists of two i prism faces (Figure 25c), occasionally in combination with
b pinacoids. In twinned stones, a more
complex pattern with a twin plane as well
as i prism faces and b pinacoids from
both parts of the twinned individual is
present (Figure 25d). In a direction of view
perpendicular to a twin plane, i.e. in a
direction inclined to the b- and c-axes,
a pattern consisting of dominant a and
i faces in combination with smaller o
dipyramids is common (Figure 25, e,f). In the
same direction of view, this pattern can
also be seen in untwinned stones.
Oriented particles and needlesIn numerous alexandrites there are
tiny, in most cases somewhat elongated
particles or even needles or channels,
which are orientated in one particular
direction (Figure 25 g to i). This preferred
Figure 20 a,b: Irregular alexandrite contact twin with tabular habit parallel to a from Lake Manyara, Tanzania, (a) in daylight and incandescent light; (b) schematic drawing; the crystal consists of four twinned individuals, two of the four crystals (in the middle, labelled I and I′) with parallel orientation are intergrown parallel to a virtual b plane, each of these two crystals is twinned with another crystal (labelled II and III); view almost parallel to the a-axis, size 23 × 17 mm, thickness along the a-axis 8.5 and 6.5 mm (in different parts). Collection of J.M. Saul, Paris, France. Photo and crystal drawing by K. Schmetzer.
a b
direction was determined as the a-axis of
the chrysoberyl crystals or twins (Figure 25j). In a view parallel to the needle axis,
i.e. parallel to the a-axis, these needle-like
particles are frequently zoned parallel
to i prism faces (Figure 25k), occasionally
also parallel to b pinacoids. In other
samples, these ‘needles’ form special
areas, zones or lines, which are inclined
to the dominant i or b crystal faces (Figure 25l). However, the ‘needles’ are all parallel
to the a-axis of the alexandrite host (Figure 26 a to c).
In some stones, there is a second type
of tiny inclusion, in most cases in addition
to the needle-like particles described
above (Figure 26d). These tiny inclusions are
concentrated on specific planes parallel to
a pinacoids. Consequently, in a direction
perpendicular to the a-axes, i.e. in a view
perpendicular to the ‘needle’-axes, a
combination of both structural features is
seen (Figure 26 e to g). In this direction of
view, the ‘needles’ parallel to the a-axis
and the areas on a pinacoids intersect at
right angles. If both structural inclusion
patterns are very dense, samples with
complete off-white reflecting areas are
present, consisting of numerous oriented
reflecting particles (Figure 26 h,i; see also
the section below ‘Stones with larger
milky white zones’).
Io
ib
aI′ IIIII
s
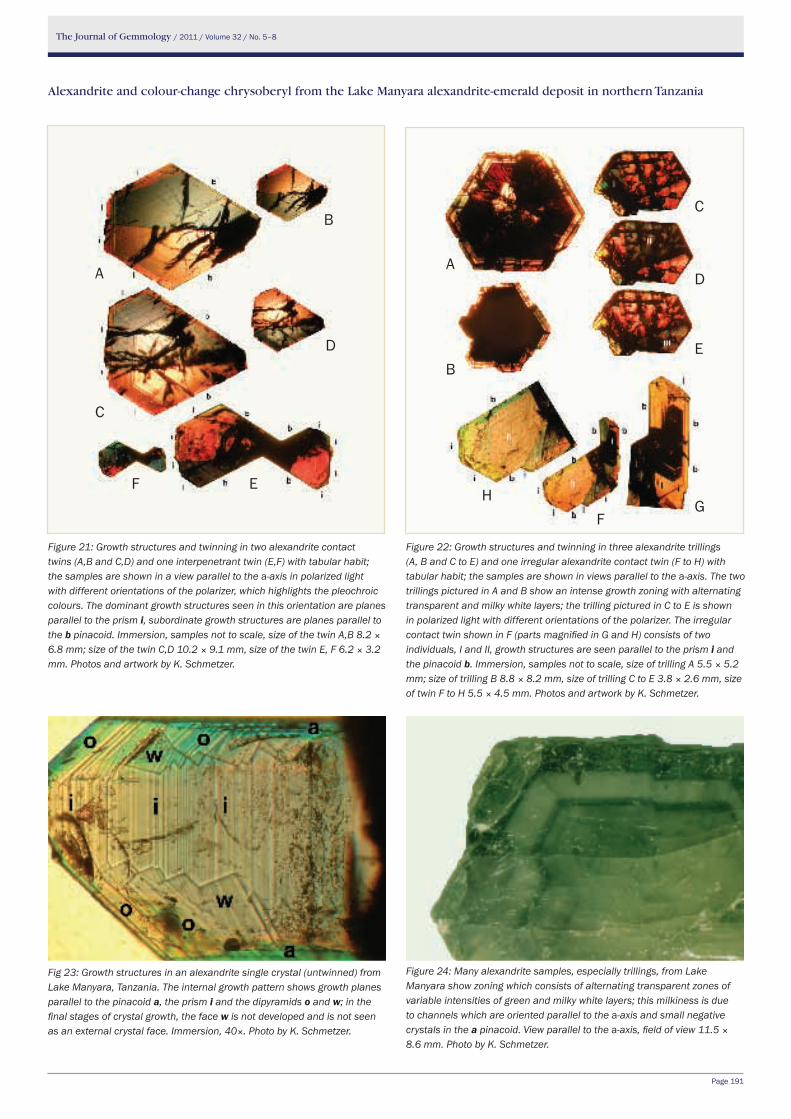
The Journal of Gemmology / 2011 / Volume 32 / No. 5–8
Page 191
Alexandrite and colour-change chrysoberyl from the Lake Manyara alexandrite-emerald deposit in northern Tanzania
Figure 21: Growth structures and twinning in two alexandrite contact twins (A,B and C,D) and one interpenetrant twin (E,F) with tabular habit; the samples are shown in a view parallel to the a-axis in polarized light with different orientations of the polarizer, which highlights the pleochroic colours. The dominant growth structures seen in this orientation are planes parallel to the prism i, subordinate growth structures are planes parallel to the b pinacoid. Immersion, samples not to scale, size of the twin A,B 8.2 × 6.8 mm; size of the twin C,D 10.2 × 9.1 mm, size of the twin E, F 6.2 × 3.2 mm. Photos and artwork by K. Schmetzer.
Figure 22: Growth structures and twinning in three alexandrite trillings (A, B and C to E) and one irregular alexandrite contact twin (F to H) with tabular habit; the samples are shown in views parallel to the a-axis. The two trillings pictured in A and B show an intense growth zoning with alternating transparent and milky white layers; the trilling pictured in C to E is shown in polarized light with different orientations of the polarizer. The irregular contact twin shown in F (parts magnified in G and H) consists of two individuals, I and II, growth structures are seen parallel to the prism i and the pinacoid b. Immersion, samples not to scale, size of trilling A 5.5 × 5.2 mm; size of trilling B 8.8 × 8.2 mm, size of trilling C to E 3.8 × 2.6 mm, size of twin F to H 5.5 × 4.5 mm. Photos and artwork by K. Schmetzer.
Fig 23: Growth structures in an alexandrite single crystal (untwinned) from Lake Manyara, Tanzania. The internal growth pattern shows growth planes parallel to the pinacoid a, the prism i and the dipyramids o and w; in the final stages of crystal growth, the face w is not developed and is not seen as an external crystal face. Immersion, 40×. Photo by K. Schmetzer.
Figure 24: Many alexandrite samples, especially trillings, from Lake Manyara show zoning which consists of alternating transparent zones of variable intensities of green and milky white layers; this milkiness is due to channels which are oriented parallel to the a-axis and small negative crystals in the a pinacoid. View parallel to the a-axis, field of view 11.5 × 8.6 mm. Photo by K. Schmetzer.
A
B
C
D
E
GF
H
A
B
D
E
C
F

The Journal of Gemmology / 2011 / Volume 32 / No. 5–8
Page 192
Alexandrite and colour-change chrysoberyl from the Lake Manyara alexandrite-emerald deposit in northern Tanzania
Figure 25 a to l: Microscopic properties of alexandrite and chrysoberyl from Lake Manyara, Tanzania. (a and b) Twin boundary showing interference patterns: (a) immersion; (b) same sample with crossed polarizers, 25×. (c to f) Characteristic growth structures consisting of a and b pinacoids, i prism faces and o dipyramids; in (d) a twin boundary is also present; immersion (c,d) 25×; (e) 50×; (f) 60×.(g to i) Orientated needle-like particles or channels: (g) darkfield, 80×; (h,i) brightfield, 80×. (j) Growth structures parallel to the faces a, i and o with channels perpendicular to the a pinacoid (arrow), immersion, 35×. (k) View parallel to the a-axis, showing a concentration of needles or channels or other inclusions on i prism planes, 50×.(l) View parallel to the a-axis, showing a concentration of channels on i prism planes (upper part) or an irregular arrangement along specific planes or within specific zones (lower right), immersion, 60×. Photos a to f, j to l by K. Schmetzer, g to i by A.-K. Malsy.
a b c
d e
g h
f
i
lkj

The Journal of Gemmology / 2011 / Volume 32 / No. 5–8
Page 193
Alexandrite and colour-change chrysoberyl from the Lake Manyara alexandrite-emerald deposit in northern Tanzania
Figure 26 a to l: Microscopic properties of alexandrite and chrysoberyl from Lake Manyara, Tanzania:(a to c) Channels with an orientation along the a-axis in different views: (a) parallel to the a-axis; (b) slightly inclined to the a-axis; and (c) inclined to the a-axis; the channels are concentrated on i prism planes or show an irregular arrangement along specific other planes or within specific growth zones (lower part), immersion, 60×. (d to i) Two types of inclusions are developed as needles or channels parallel to the a-axis and as smaller particles concentrated on planes perpendicular to the a-axis; in high concentration, these inclusions cause a milky white appearance (h); (d) brightfield, 80×; (e) immersion, 40×; (f,g) immersion, 60×; (h) darkfield, 35×; (i) (same sample as h) immersion, 30×. (j to l) Phlogopite inclusions: (j) brightfield, 80×; (k,l) immersion; (l) with crossed polarizers, 60×.Photos a to c, e to g, i, k, l by K. Schmetzer, d, h, j by A.-K. Malsy.
a b c
d e
g h
f
i
lkj

The Journal of Gemmology / 2011 / Volume 32 / No. 5–8
Page 194
Alexandrite and colour-change chrysoberyl from the Lake Manyara alexandrite-emerald deposit in northern Tanzania
Figure 27 a to l: Microscopic properties of alexandrite and chrysoberyl from Lake Manyara, Tanzania.(a to e) Inclusions of apatite crystals and apatite clusters (e): (a) brightfield, 50×; (b to d) same sample, (b) brightfield, (c) immersion, (d) immersion, crossed polarizers, all 60×; (e) immersion, crossed polarizers, 70×. (f,g) Zircon crystals with tension cracks: (f) brightfield, 80×; (g) immersion, crossed polarizers, 60×. (h,i) Chrysoberyl inclusions in alexandrite, immersion, crossed polarizers: (h) 40×; (i) 60×. (j,k) Healing feathers consisting of small irregular liquid-filled cavities: (j) brightfield, 80×; (k) darkfield, 80×.(l) Healing feather with two-phase inclusions in negative crystals, brightfield, 80×. Photos c to e, g to i by K. Schmetzer, a, b, f, j to l by A.-K. Malsy.
a b c
d e
g h
f
i
lkj

The Journal of Gemmology / 2011 / Volume 32 / No. 5–8
Page 195
Alexandrite and colour-change chrysoberyl from the Lake Manyara alexandrite-emerald deposit in northern Tanzania
Figure 28 (a to e): Alexandrites from Lake Manyara with growth layers parallel to the prism i showing a high concentration of channels forming milky white layers.(a) Faceted alexandrites in daylight and incandescent light, weights 0.41 and 0.35 ct, sizes 5.1 × 4.4 mm and 5.0 × 4.3 mm. (b,c) and (d,e) Views of the two stones in (a) along the a-axis, i.e. parallel to the axes of the channels; with different orientation of the polarizer, the pleochroism (Y orange, Z bluish green) is clearly visible; immersion (b,c) 50× (d,e) 80×. Photos by K. Schmetzer.Figure 28 (f,g): Thin section of a milky white alexandrite with an orientation almost parallel to the a pinacoid: (f) two series of channels parallel to the a-axis, which are aligned along specific planes (indicated by arrows) of the host; field of view 110 × 82 µ.(g) Three orientations of groups of elongated cavities are present, which are aligned in the a plane at angles of about 60° to each other (indicated by black arrows); in places two of these negative crystals originate from a single point and/or form tabular negative crystals which closely resemble tabular alexandrite twins (indicated by white arrows); both fields of view 110 × 41 µ.Photos by H.-J. Bernhardt.
b
c
d
g
f
e
a

The Journal of Gemmology / 2011 / Volume 32 / No. 5–8
Page 196
Alexandrite and colour-change chrysoberyl from the Lake Manyara alexandrite-emerald deposit in northern Tanzania
Mineral and fluid inclusionsNumerous mineral inclusions were
identified using Raman microspectroscopy
and laser ablation inductively coupled
plasma mass spectrometry (LA-ICP-MS)
by one author (A.-K.M.). The results are
given below.
Although alexandrites from Lake
Manyara are found in phlogopite schist,
mica (phlogopite) inclusions are not
common in gem-quality samples (Figure 26 j to l). The commonest inclusions were
identified as prismatic apatite crystals or
clusters of apatites (Figure 27 a to e). In
several samples isolated zircons or groups
of zircons, mostly surrounded by tension
cracks (Figure 27 f,g) are also present. One
alexandrite contains a group of well
developed alexandrite crystals in no
particular orientation (Figure 27 h,i).Some alexandrites also contain healed
fractures with residual fluid inclusions
(Figure 27 j,k), and others may contain
negative crystals filled with liquid or two-
phase (liquid-gas) inclusions (Figure 27l).
Stones with larger milky white zones
It should be mentioned that
alexandrite crystals with larger milky
white zones (see again Figure 24) can
yield attractive gems if the direction of
cut is carefully chosen. The two samples
depicted in Figure 28a were cut with
the table facet formed of a transparent
zone which was free of any milky white
reflecting particles as inclusions. The
growth zones below the table facets
consist of successive layers with different
concentrations of milky white reflecting
needles or channels (Figure 28 b,c). The
different growth layers are separated by
two i (011) prism faces. This microscopic
feature, however, does not disturb the
overall appearance of the gems.
In a view perpendicular to the needle
axis, the elongated particles within the
milky white zones are clearly visible. In
a view parallel to the crystallographic
a-axis, i.e. parallel to the needle axis, the
observer has the impression of looking
into a fibre optic with light emanating
from the needles. A view at somewhat
higher magnification (Figure 28 d,e) indicates
Figure 29 a,b: Iron/chromium and vanadium/chromium binary diagrams showing the variability of these trace element contents in alexandrites and green chysoberyls from Lake Manyara compared to alexandrites and green chrysoberyls from Russia, from Zimbabwe and other localities (pale blue area representing more than 220 samples including all market relevant sources). The individual points represent measurements on various alexandrites; multiple analyses of different spots on the same crystal are plotted separately. Iron contents in alexandrites from Lake Manyara are intermediate between those in samples from Russia and Zimbabwe, vanadium and chromium contents for all three sources overlap. Artwork by A.-K. Malsy.
0.01 0.1 1 10Fe2O3[wt%]
Cr2O
3 [w
t%]
10
1
0.1
0.01
alexandrite + green chrysoberyl, Lake Manyaratraverse across zoned trilling, Lake Manyaraalexandrite, Novello Claims, Zimbabwealexandrite + green chrysoberyl, Russiaalexandrite + green chrysoberyl, other sources
a
0.001 0.01 0.1 1V2O3[wt%]
Cr2O
3 [w
t%]
10
1
0.1
0.01
alexandrite + green chrysoberyl, Lake Manyaratraverse across zoned trilling, Lake Manyaraalexandrite, Novello Claims, Zimbabwealexandrite + green chrysoberyl, Russiaalexandrite + green chrysoberyl, other sources
b

The Journal of Gemmology / 2011 / Volume 32 / No. 5–8
Page 197
Alexandrite and colour-change chrysoberyl from the Lake Manyara alexandrite-emerald deposit in northern Tanzania
Figure 30 a,b: Ternary diagrams showing relative proportions of magnesium-germanium-tin and iron-gallium-tin in alexandrites and green chrysoberyls from Lake Manyara, Tanzania, Zimbabwe and Russia. The individual points represent measurements on various alexandrites; multiple analyses of different spots on the same crystal are plotted separately. The potential of trace element chemistry for distinguishing alexandrites from various localities is evident. Artwork by A.-K. Malsy.
Mg × 1 Sn × 1
Ge × 100
alexandrite + green chrysoberyl, Lake Manyaraalexandrite, Novello Claims, Zimbabwealexandrite + green chrysoberyl, Russia
a
Fe × 1
Ga × 20 Sn × 20
alexandrite + green chrysoberyl, Lake Manyaraalexandrite, Novello Claims, Zimbabwealexandrite + green chrysoberyl, Russia
b

The Journal of Gemmology / 2011 / Volume 32 / No. 5–8
Page 198
Alexandrite and colour-change chrysoberyl from the Lake Manyara alexandrite-emerald deposit in northern Tanzania
that at least part of these structures
are hollow channels and not mineral
inclusions such as rutile.
To identify all the needles and/or
channels in Lake Manyara alexandrites
and to further evaluate the inclusions
causing the milky white appearance,
a thin section almost parallel to the a pinacoid was prepared. The thin section
showed several series of channels parallel
to the a-axis, which were aligned along
specific planes of the host (Figure 28f). In addition, three groups of elongated
cavities were present, which are aligned
in the a plane at angles of about 60° to
each other (Figure 28g). Occasionally, two
of these negative crystals originate from a
single point and/or form tabular negative
crystals which closely resemble tabular
alexandrite twins in appearance (Figure 28g, compare Figure 9, especially crystal
G). These results, indicating that the
milky white zones are caused by channels
parallel to the a-axis, occasionally in
combination with negative crystals
along the a plane, are confirmed by the
chemical properties of a zoned green/
milky white sample (see below).
We would like to mention that –
although not found in our study - there
might be also needle-like mineral
inclusions in other samples of alexandrite
from Lake Manyara and especially in
chrysoberyl from other sources. It was
found in numerous samples from different
Figure 31: Rough alexandrite crystals and fragments from Lake Manyara with colour change from green or bluish green in daylight (a) to purple or reddish purple in incandescent light (b). The largest crystal measures about 7 × 6 mm. Photo by K. Schmetzer.
Figure 32: Colorimetric parameters of rough alexandrites shown in Figure 31 in the CIELAB colour circle; the neutral point (white point) is in the centre of the a*b* coordinate system; the small black circles represent the coordinates in the daylight source D65 and the ends of the differently coloured bars represent the coordinates in tungsten light A, the outer circle represents a chroma of 18. These parameters show the typical alexandrite-like colour change from daylight to incandescent light. Colorimetric measurements of various samples by A.-K. Malsy and G. Bosshart.
a b

The Journal of Gemmology / 2011 / Volume 32 / No. 5–8
Page 199
Alexandrite and colour-change chrysoberyl from the Lake Manyara alexandrite-emerald deposit in northern Tanzania
localities by microscopic examination
by one of the present authors (K.S.) that
chatoyancy in chrysoberyl or alexandrite
is due to needle-like particles or channels
with a preferred orientation parallel to
the a-axis. However, to determine the
exact nature of all different types of
needles and/or channels in chrysoberyls
and alexandrites from different sources,
additional research is necessary, which is
beyond the scope of the present paper.
Figure 33: Faceted alexandrites and green chrysoberyls from Lake Manyara show a range of colours in daylight (a) and a much greater range in incandescent light (b); the numbers correspond to the numbers and their colorimetric parameters in the CIELAB diagram in Figure 34. Weights of samples from 0.16 to 0.68 ct, the square cut stone (1) weighs 0.56 ct, size 4.4 mm square. Photo by K. Schmetzer.
Figure 34: Colorimetric parameters of faceted alexandrites and green chrysoberyls originating from the Lake Manyara deposit, Tanzania, in the CIELAB colour circle; the neutral point (white point) is in the centre of the a*b* coordinate system; the small black circles represent the coordinates in daylight D65 and the ends of the differently coloured bars represent the coordinates for tungsten light A, the outer circle represents a chroma of 18. Only a few stones show the typical alexandrite colour change of green to purplish red (e.g. 4, 5, 12, 13, represented by purple bars); other stones are green or yellow, orange or bluish grey in incandescent light. Colorimetric measurements of various samples by A.-K. Malsy. The numbers represent the stones in Figure 33 in daylight and incandescent light.
1
2
3 5
4
7
6 8
9 11 13
10 12
a
b
123
456
78
91011
12
13
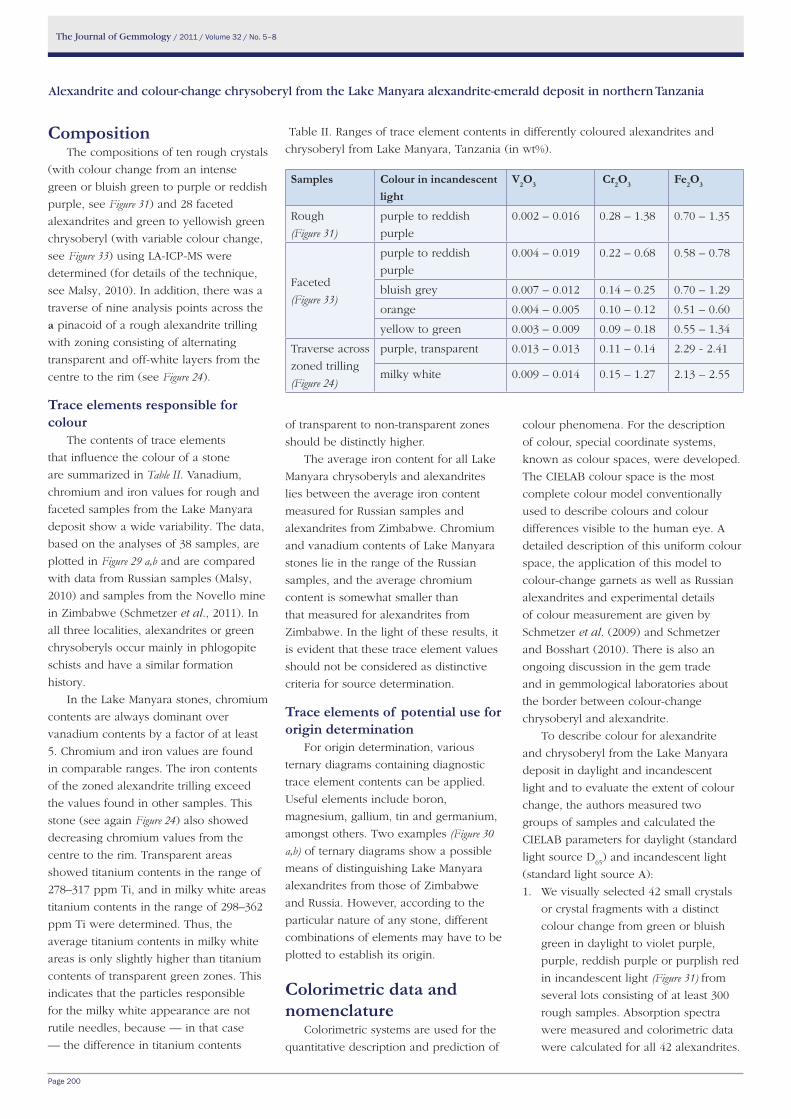
The Journal of Gemmology / 2011 / Volume 32 / No. 5–8
Page 200
Alexandrite and colour-change chrysoberyl from the Lake Manyara alexandrite-emerald deposit in northern Tanzania
Table II. Ranges of trace element contents in differently coloured alexandrites and
chrysoberyl from Lake Manyara, Tanzania (in wt%).
Samples Colour in incandescent light
V2O3 Cr2O3 Fe2O3
Rough
(Figure 31)purple to reddish
purple
0.002 – 0.016 0.28 – 1.38 0.70 – 1.35
Faceted
(Figure 33)
purple to reddish
purple
0.004 – 0.019 0.22 – 0.68 0.58 – 0.78
bluish grey 0.007 – 0.012 0.14 – 0.25 0.70 – 1.29
orange 0.004 – 0.005 0.10 – 0.12 0.51 – 0.60
yellow to green 0.003 – 0.009 0.09 – 0.18 0.55 – 1.34
Traverse across
zoned trilling
(Figure 24)
purple, transparent 0.013 – 0.013 0.11 – 0.14 2.29 - 2.41
milky white 0.009 – 0.014 0.15 – 1.27 2.13 – 2.55
colour phenomena. For the description
of colour, special coordinate systems,
known as colour spaces, were developed.
The CIELAB colour space is the most
complete colour model conventionally
used to describe colours and colour
differences visible to the human eye. A
detailed description of this uniform colour
space, the application of this model to
colour-change garnets as well as Russian
alexandrites and experimental details
of colour measurement are given by
Schmetzer et al. (2009) and Schmetzer
and Bosshart (2010). There is also an
ongoing discussion in the gem trade
and in gemmological laboratories about
the border between colour-change
chrysoberyl and alexandrite.
To describe colour for alexandrite
and chrysoberyl from the Lake Manyara
deposit in daylight and incandescent
light and to evaluate the extent of colour
change, the authors measured two
groups of samples and calculated the
CIELAB parameters for daylight (standard
light source D65) and incandescent light
(standard light source A):
1. We visually selected 42 small crystals
or crystal fragments with a distinct
colour change from green or bluish
green in daylight to violet purple,
purple, reddish purple or purplish red
in incandescent light (Figure 31) from
several lots consisting of at least 300
rough samples. Absorption spectra
were measured and colorimetric data
were calculated for all 42 alexandrites.
CompositionThe compositions of ten rough crystals
(with colour change from an intense
green or bluish green to purple or reddish
purple, see Figure 31) and 28 faceted
alexandrites and green to yellowish green
chrysoberyl (with variable colour change,
see Figure 33) using LA-ICP-MS were
determined (for details of the technique,
see Malsy, 2010). In addition, there was a
traverse of nine analysis points across the
a pinacoid of a rough alexandrite trilling
with zoning consisting of alternating
transparent and off-white layers from the
centre to the rim (see Figure 24).
Trace elements responsible for colour
The contents of trace elements
that influence the colour of a stone
are summarized in Table II. Vanadium,
chromium and iron values for rough and
faceted samples from the Lake Manyara
deposit show a wide variability. The data,
based on the analyses of 38 samples, are
plotted in Figure 29 a,b and are compared
with data from Russian samples (Malsy,
2010) and samples from the Novello mine
in Zimbabwe (Schmetzer et al., 2011). In
all three localities, alexandrites or green
chrysoberyls occur mainly in phlogopite
schists and have a similar formation
history.
In the Lake Manyara stones, chromium
contents are always dominant over
vanadium contents by a factor of at least
5. Chromium and iron values are found
in comparable ranges. The iron contents
of the zoned alexandrite trilling exceed
the values found in other samples. This
stone (see again Figure 24) also showed
decreasing chromium values from the
centre to the rim. Transparent areas
showed titanium contents in the range of
278–317 ppm Ti, and in milky white areas
titanium contents in the range of 298–362
ppm Ti were determined. Thus, the
average titanium contents in milky white
areas is only slightly higher than titanium
contents of transparent green zones. This
indicates that the particles responsible
for the milky white appearance are not
rutile needles, because — in that case
— the difference in titanium contents
of transparent to non-transparent zones
should be distinctly higher.
The average iron content for all Lake
Manyara chrysoberyls and alexandrites
lies between the average iron content
measured for Russian samples and
alexandrites from Zimbabwe. Chromium
and vanadium contents of Lake Manyara
stones lie in the range of the Russian
samples, and the average chromium
content is somewhat smaller than
that measured for alexandrites from
Zimbabwe. In the light of these results, it
is evident that these trace element values
should not be considered as distinctive
criteria for source determination.
Trace elements of potential use for origin determination
For origin determination, various
ternary diagrams containing diagnostic
trace element contents can be applied.
Useful elements include boron,
magnesium, gallium, tin and germanium,
amongst others. Two examples (Figure 30 a,b) of ternary diagrams show a possible
means of distinguishing Lake Manyara
alexandrites from those of Zimbabwe
and Russia. However, according to the
particular nature of any stone, different
combinations of elements may have to be
plotted to establish its origin.
Colorimetric data and nomenclature
Colorimetric systems are used for the
quantitative description and prediction of

The Journal of Gemmology / 2011 / Volume 32 / No. 5–8
Page 201
Alexandrite and colour-change chrysoberyl from the Lake Manyara alexandrite-emerald deposit in northern Tanzania
For a group of 15 samples the spectra
in different directions were also
measured, if the morphology of the
rough irregular fragments allowed this
procedure. In summary, colorimetric
data from 65 measured spectra were
calculated and plotted in Figure 32. Ten
of this group were also chemically
analysed to determine the trace
element contents (see above).
2. For the 28 faceted chrysoberyls
and alexandrites, which were
chemically analysed (see above),
absorption spectra were measured
and colorimetric data were calculated.
These alexandrites and chrysoberyls
show great variability of colour change
between daylight and incandescent
light and were selected to cover the
full range of colour change present
in Lake Manyara stones. The colour
in daylight ranged from green either
to bluish green or to yellowish green,
with a large colour variability in
incandescent light, which allowed
subdivision of the samples into four
subgroups according to their colour
in incandescent light: (a) orange, (b)
yellow to green, (c) grey to bluish
grey, and (d) purple to purplish
red. From these 28 spectroscopically
examined samples 13 faceted stones
were selected (Figure 33), to represent
the full range of colour and colour
change in the population for the
graphical presentation of colorimetric
data (Figure 34).All colorimetric data closely reflect
the visually observed colour (Figures 31 to
34). Colorimetric parameters of all rough
alexandrites of the first group (Figures 31
and 32) reveal a large hue angle difference
between daylight and incandescent light
as well as a distinct colour difference
between both light sources. These
colorimetric parameters are typical for an
alexandrite-like colour change from green
or bluish green in daylight to a colour
ranging from violet purple to purplish red
in incandescent light.
All 13 faceted gemstones of the second
group also reveal a distinct colour change
between daylight and incandescent light,
and a wide range of colours under the
Figure 35 a,b: Iron, chromium and vanadium contents of alexandrites and green chrysoberyls from Lake Manyara and from other localities. The general light blue area represents more than 220 samples including all market relevant sources. The differently coloured symbols represent the approximate colours of the samples observed in incandescent light. Chromium contents in alexandrites from Lake Manyara with a colour change to purple or reddish purple are above the values measured in samples with other colours in incandescent light; the values for iron and vanadium, on the other hand, are comparable. Artwork by A.-K. Malsy.
0.01 0.1 1 10Fe2O3[wt%]
10
1
0.1
0.01
purple in incandescent lightbluish grey in incandescent lightorange in incandescent lightyellow to green in incandescent lighttraverse across zoned trillingalexandrite + green chrysoberyl, other sources
Cr2O
3 [w
t%]
a
0.001 0.01 0.1 1V2O3[wt%]
Cr2O
3 [w
t%]
10
1
0.1
0.01
purple in incandescent lightbluish grey in incandescent lightorange in incandescent lightyellow to green in incandescent lighttraverse across zoned trillingalexandrite + green chrysoberyl, other sources
b

The Journal of Gemmology / 2011 / Volume 32 / No. 5–8
Page 202
Alexandrite and colour-change chrysoberyl from the Lake Manyara alexandrite-emerald deposit in northern Tanzania
Figure 36: Graph showing the correlation of the main colorimetric parameters of hue angle difference and colour difference in alexandrites and colour-change chrysoberyls from Lake Manyara, with correlations representing the extent of colour change referred to as faint, moderate, strong and very strong. The extent of colour change for rough and faceted alexandrites with a purple or reddish purple coloration in incandescent light [samples of group I and of group II, subgroup (d)] is very strong, the extent of colour change for samples with different coloration in incandescent light [orange, yellow to green or bluish grey; samples of group II, subgroups (a), (b) and (c)] is moderate to strong. Artwork by K. Schmetzer.
Figure 37: Colour and pleochroism in a natural alexandrite single crystal from Lake Manyara, Tanzania, in daylight and incandescent light in views parallel to the a-, b- and c-axes. The crystal fragment shows a and b pinacoids and is broken at both terminations, size of the crystal 3.8 × 3.5 × 3.2 mm. With the unaided eye (non-polarized light), the observed coloration in all three directions varies distinctly, with the ‘best’ colour change in the view parallel to the b-axis. Parallel to the a-axis, the red colour component in incandescent light is very small. Photographs and artwork by K. Schmetzer.
Daylight
Incandescent light
View parallela-axis
View parallela-axis
View parallelb-axis
View parallelb-axis
View parallelc-axis
View parallelc-axis
colo
ur d
iffer
ence
del
ta E
* ab
22
20
18
16
14
12
10
8
6
4
20 20 40 60 80 100 120 140 160 180
hue angle difference delta hab
Extent of colour change
Colour in incandescent light
orange
yellow to green
bluish grey
purple faceted
purple rough
faint
moderatestrong
very strong

The Journal of Gemmology / 2011 / Volume 32 / No. 5–8
Page 203
Alexandrite and colour-change chrysoberyl from the Lake Manyara alexandrite-emerald deposit in northern Tanzania
latter (Figures 33 and 34). Only six samples
(subgroup d) show a colour change to
purple or purplish red in incandescent
light, which represents a typical
alexandrite-like colour change between
daylight and incandescent light. The other
groups of samples [subgroups (b) and (c)]
show a colour change to yellow or green
or to greyish blue in incandescent light,
and one stone [subgroup (a)] became
brownish orange in incandescent light.
Chromium, vanadium and iron
contents of rough alexandrite crystals and
of the four different groups of faceted
stones are plotted in Figure 35 a,b. It is evident that chromium contents of most
samples with a typical alexandrite-like
colour change of green to purplish red
in daylight to incandescent light (rough
samples of group I [Figure 31] and faceted
samples of group II, subgroup (d) of
[Figure 33]) exceed the chromium contents
of samples with colour change to bluish
grey, orange or yellowish green to yellow
in incandescent light (faceted samples of
group II, subgroups (a), (b), and (c) [Figure 33]). Vanadium and iron contents, on the
other hand, are in similar ranges.
Table III. Trace element contents, colour and pleochroism in selected alexandrites.
Samples Czochralski-grown synthetic alexandrite,
Russia
Natural alexandrite, Lake Manyara,
Tanzania
Natural alexandrite, Sri
Lanka
Size (mm) 9.2 × 9.0 × 9.0 3.8 × 3.5 × 3.2 6.6 × 6.1 × 6.0
Trace element contents (wt%)
V2O
30.09 0.01 0.01
Cr2O
30.21 0.60 0.15
Fe2O
3< 0.01 1.23 0.80
Colour to the unaided eye in daylight
View || a-axis intense green green green
View || b-axis greenish blue bluish green bluish green
View || c-axis light green yellowish green yellowish green
Colour to the unaided eye in incandescent light
View || a-axis bluish grey yellow purplish grey,
almost colourless
View || b-axis intense purple violet purple intense purple
View || c-axis light greyish purple orange purplish red
Figure 38: Colorimetric parameters of three alexandrite cubes, i.e. of natural alexandrite from Lake Manyara, Tanzania (see Figure 37), and natural alexandrite from Sri Lanka as well as Czochralski-grown synthetic alexandrite from Russia plotted in the CIELAB colour circle. Each stone was measured parallel to the crystallographic a-, b- and c-axis) and the coordinates labelled accordingly; the neutral point (white point) is in the centre of the a*b* coordinate system; the small black circles represent the coordinates in daylight D65 and the ends of the differently coloured bars represent the coordinates in tungsten light A; the outer circle represents a chroma of 18. The typical alexandrite-like colour change from daylight to incandescent light is apparent in views parallel to the b-axis and partly also in views parallel to the c-axis. The red colour component in incandescent light is distinctly weaker in views parallel to the a-axis. Data for the synthetic Russian alexandrite from Schmetzer and Bosshart (2010), data for the natural samples from Tanzania and Sri Lanka measured by A.-K. Malsy.
To evaluate the extent of colour
change, the two relevant colorimetric data,
i.e. colour difference ΔE*ab versus hue
angle difference Δhab were plotted in Figure
36. The rough and faceted samples with
a typical alexandrite-like colour change
[rough samples, group I, and faceted
samples, group II, subgroup (d)] showed
a wide variation of hue angle difference
(from about 100° to 180°) and colour
alexandriteLake Manyara
alexandriteSri Lanka
synthetic alexandrite
a
b
c
a
b
c
a
b
c

The Journal of Gemmology / 2011 / Volume 32 / No. 5–8
Page 204
Alexandrite and colour-change chrysoberyl from the Lake Manyara alexandrite-emerald deposit in northern Tanzania
differences (between 8 and 19 CIELAB
units). Using the definition for the extent
of colour change given by Schmetzer et
al. (2009) and Schmetzer and Bosshart
(2010), the extent of colour change for
all these alexandrites is very strong. The
other samples show colour differences
in the same range, but smaller hue angle
differences. Although these samples
show moderate [group II, subgroup (b),
yellow to green,] or strong colour change
[group II, subgroup (a), brownish orange
sample, and subgroup (c), bluish grey
samples], they do not show the traditional
alexandrite colours in incandescent light.
The association or correlation of
chemical properties, especially chromium
contents, and colorimetric parameters,
however, does not completely explain
the pattern of colour change observed.
It is generally known in the gem trade
and especially by cutters of alexandrite
rough, that the colours observable in
incandescent light are strongly dependent
on the orientation of the samples (Fischer,
1954, 94–6). This was demonstrated
with colorimetric parameters measured
for alexandrites in different orientations
versus the non-polarized primary
spectrometer beam (Schmetzer and
Bosshart, 2010). In particular, colorimetric
parameters were described for an exactly
oriented, Czochralski-grown cube of
synthetic alexandrite.
Similar orientation dependencies
were observed and measured in two
natural alexandrites. One fragment of an
untwinned crystal from Lake Manyara is
shown in Figure 37 in different orientations
in daylight and incandescent light. For
comparison, an alexandrite cube from
Sri Lanka was also measured. The size,
chemical properties and colours to the
unaided eye in daylight and incandescent
light of the two samples are summarized
in Table III, the colorimetric parameters
are plotted in Figure 38. The parameters of
the synthetic alexandrite cube mentioned
above are also given.
The sample loci within the CIELAB
colour circle (Figure 38) represent the
colours for daylight and incandescent
light. Although the connecting bars
between the loci measured for a specific
orientation of the three cubes are almost
parallel to each other, the positions of
the endpoints differ significantly and
demonstrate the distinct pleochroism
of alexandrite. The lengths of the bars
are a graphical representation of colour
difference in the a*b* plane of the CIELAB
colour circle.
Although the three samples show large
differences according to various trace
element contents and variable paths of
light (sample thickness), a general scheme
is apparent for all three alexandrites.
In daylight, in a view parallel to the
a-axis, the most intense and pure green
is visible. In a view parallel to the b-axis,
the alexandrites are more bluish green
and in a view parallel to the c-axis, the
alexandrites are less intense green or
more yellowish green. The most intense
colour change is always parallel to the
b-axis; the change is somewhat weaker
parallel to the c-axis. In incandescent light,
the colour parallel to the a-axis in these
three samples changed only to yellow,
bluish grey or purplish grey, in general
without a distinct red colour component.
In the gem trade, only a small
percentage of faceted alexandrites
will be cut so that the table facets are
exactly perpendicular to one of the three
crystallographic axes a, b or c. To evaluate
the orientation dependency of colour
change in faceted alexandrites and green
chrysoberyls from Lake Manyara, we
determined the orientation of the table
facets for colorimetrically measured and
chemically analysed samples by optical
Figure 39: Colorimetric parameters of rough and faceted alexandrites and chrysoberyls from Lake Manyara in the CIELAB colour circle; the neutral point (white point) is in the centre of the a*b* coordinate system; the small black circles represent the coordinates in daylight D65 and the ends of the differently coloured bars represent the coordinates for tungsten light A; the outer circle represents a chroma of 18. The coloured bars represent measurements of different samples with a predominant path of light parallel to the a-axis (red), parallel to the b-axis (black) and parallel to the c-axis (green) of each sample. The dependency of colour and colour change on stone orientation is evident. Colorimetric measurements of various samples by A.-K. Malsy and G. Bosshart.
a
b
c
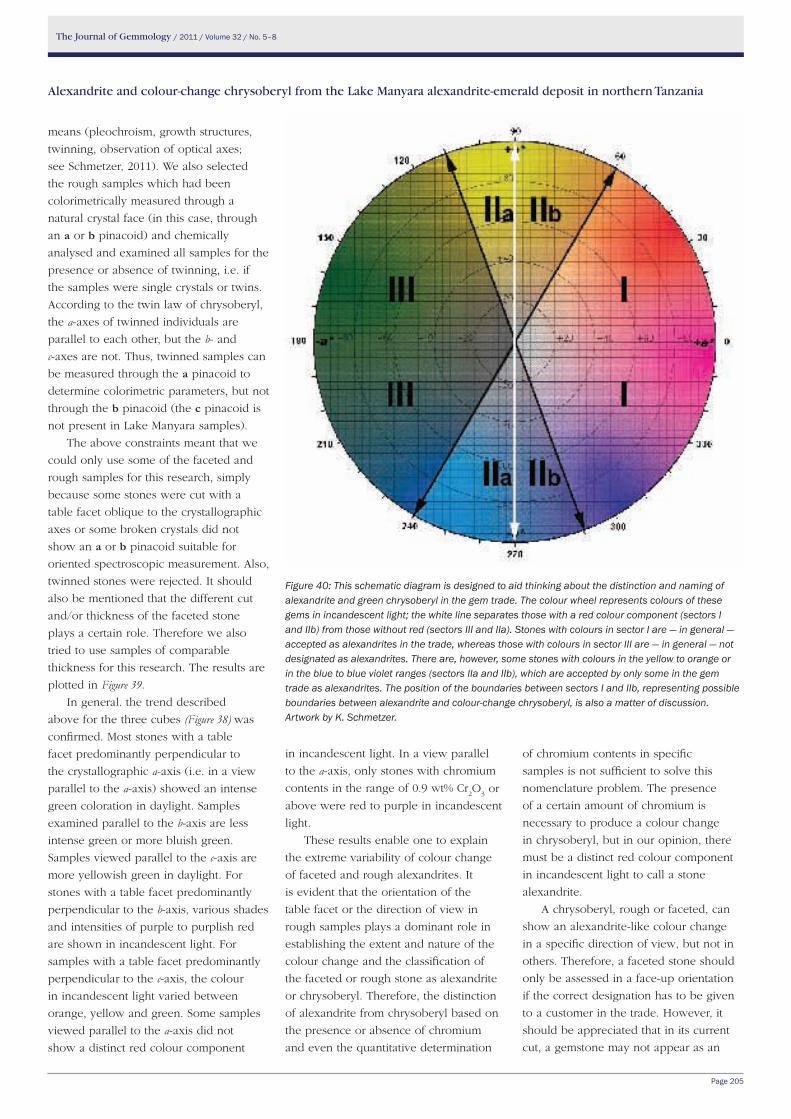
The Journal of Gemmology / 2011 / Volume 32 / No. 5–8
Page 205
Alexandrite and colour-change chrysoberyl from the Lake Manyara alexandrite-emerald deposit in northern Tanzania
means (pleochroism, growth structures,
twinning, observation of optical axes;
see Schmetzer, 2011). We also selected
the rough samples which had been
colorimetrically measured through a
natural crystal face (in this case, through
an a or b pinacoid) and chemically
analysed and examined all samples for the
presence or absence of twinning, i.e. if
the samples were single crystals or twins.
According to the twin law of chrysoberyl,
the a-axes of twinned individuals are
parallel to each other, but the b- and
c-axes are not. Thus, twinned samples can
be measured through the a pinacoid to
determine colorimetric parameters, but not
through the b pinacoid (the c pinacoid is
not present in Lake Manyara samples).
The above constraints meant that we
could only use some of the faceted and
rough samples for this research, simply
because some stones were cut with a
table facet oblique to the crystallographic
axes or some broken crystals did not
show an a or b pinacoid suitable for
oriented spectroscopic measurement. Also,
twinned stones were rejected. It should
also be mentioned that the different cut
and/or thickness of the faceted stone
plays a certain role. Therefore we also
tried to use samples of comparable
thickness for this research. The results are
plotted in Figure 39.
In general. the trend described
above for the three cubes (Figure 38) was
confirmed. Most stones with a table
facet predominantly perpendicular to
the crystallographic a-axis (i.e. in a view
parallel to the a-axis) showed an intense
green coloration in daylight. Samples
examined parallel to the b-axis are less
intense green or more bluish green.
Samples viewed parallel to the c-axis are
more yellowish green in daylight. For
stones with a table facet predominantly
perpendicular to the b-axis, various shades
and intensities of purple to purplish red
are shown in incandescent light. For
samples with a table facet predominantly
perpendicular to the c-axis, the colour
in incandescent light varied between
orange, yellow and green. Some samples
viewed parallel to the a-axis did not
show a distinct red colour component
in incandescent light. In a view parallel
to the a-axis, only stones with chromium
contents in the range of 0.9 wt% Cr2O
3 or
above were red to purple in incandescent
light.
These results enable one to explain
the extreme variability of colour change
of faceted and rough alexandrites. It
is evident that the orientation of the
table facet or the direction of view in
rough samples plays a dominant role in
establishing the extent and nature of the
colour change and the classification of
the faceted or rough stone as alexandrite
or chrysoberyl. Therefore, the distinction
of alexandrite from chrysoberyl based on
the presence or absence of chromium
and even the quantitative determination
of chromium contents in specific
samples is not sufficient to solve this
nomenclature problem. The presence
of a certain amount of chromium is
necessary to produce a colour change
in chrysoberyl, but in our opinion, there
must be a distinct red colour component
in incandescent light to call a stone
alexandrite.
A chrysoberyl, rough or faceted, can
show an alexandrite-like colour change
in a specific direction of view, but not in
others. Therefore, a faceted stone should
only be assessed in a face-up orientation
if the correct designation has to be given
to a customer in the trade. However, it
should be appreciated that in its current
cut, a gemstone may not appear as an
Figure 40: This schematic diagram is designed to aid thinking about the distinction and naming of alexandrite and green chrysoberyl in the gem trade. The colour wheel represents colours of these gems in incandescent light; the white line separates those with a red colour component (sectors I and IIb) from those without red (sectors III and IIa). Stones with colours in sector I are — in general — accepted as alexandrites in the trade, whereas those with colours in sector III are — in general — not designated as alexandrites. There are, however, some stones with colours in the yellow to orange or in the blue to blue violet ranges (sectors IIa and IIb), which are accepted by only some in the gem trade as alexandrites. The position of the boundaries between sectors I and IIb, representing possible boundaries between alexandrite and colour-change chrysoberyl, is also a matter of discussion. Artwork by K. Schmetzer.
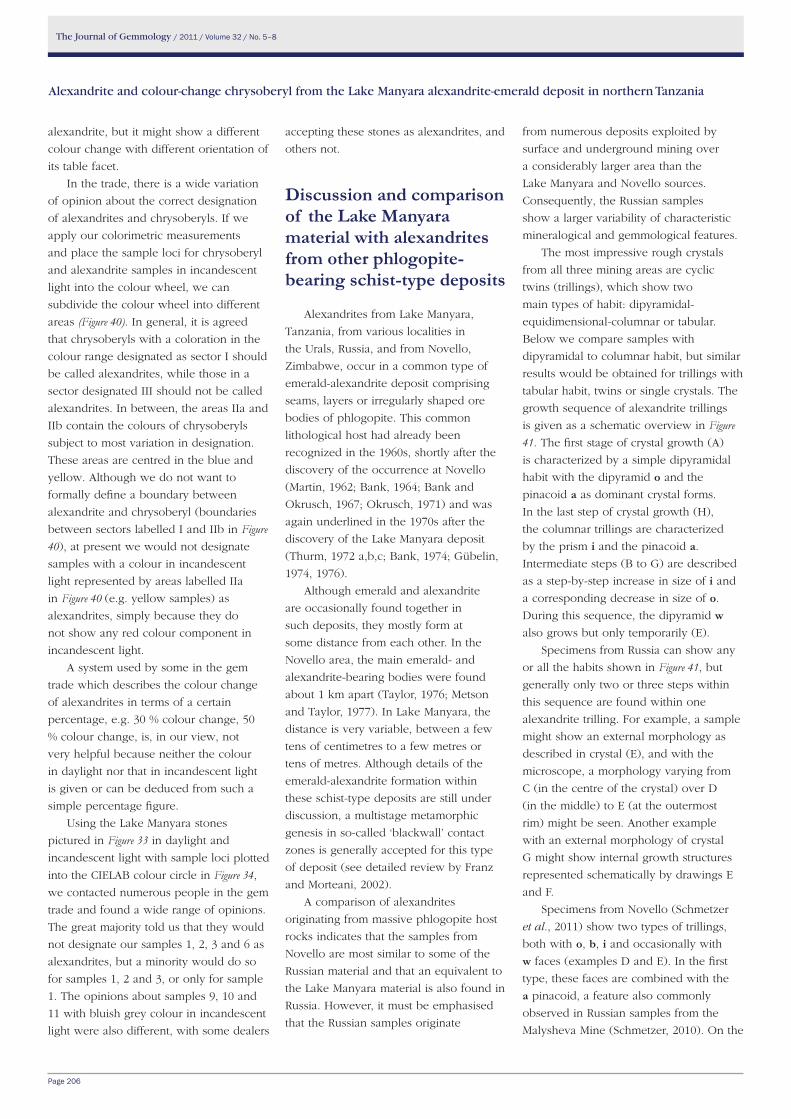
The Journal of Gemmology / 2011 / Volume 32 / No. 5–8
Page 206
Alexandrite and colour-change chrysoberyl from the Lake Manyara alexandrite-emerald deposit in northern Tanzania
alexandrite, but it might show a different
colour change with different orientation of
its table facet.
In the trade, there is a wide variation
of opinion about the correct designation
of alexandrites and chrysoberyls. If we
apply our colorimetric measurements
and place the sample loci for chrysoberyl
and alexandrite samples in incandescent
light into the colour wheel, we can
subdivide the colour wheel into different
areas (Figure 40). In general, it is agreed
that chrysoberyls with a coloration in the
colour range designated as sector I should
be called alexandrites, while those in a
sector designated III should not be called
alexandrites. In between, the areas IIa and
IIb contain the colours of chrysoberyls
subject to most variation in designation.
These areas are centred in the blue and
yellow. Although we do not want to
formally define a boundary between
alexandrite and chrysoberyl (boundaries
between sectors labelled I and IIb in Figure 40), at present we would not designate
samples with a colour in incandescent
light represented by areas labelled IIa
in Figure 40 (e.g. yellow samples) as
alexandrites, simply because they do
not show any red colour component in
incandescent light.
A system used by some in the gem
trade which describes the colour change
of alexandrites in terms of a certain
percentage, e.g. 30 % colour change, 50
% colour change, is, in our view, not
very helpful because neither the colour
in daylight nor that in incandescent light
is given or can be deduced from such a
simple percentage figure.
Using the Lake Manyara stones
pictured in Figure 33 in daylight and
incandescent light with sample loci plotted
into the CIELAB colour circle in Figure 34,
we contacted numerous people in the gem
trade and found a wide range of opinions.
The great majority told us that they would
not designate our samples 1, 2, 3 and 6 as
alexandrites, but a minority would do so
for samples 1, 2 and 3, or only for sample
1. The opinions about samples 9, 10 and
11 with bluish grey colour in incandescent
light were also different, with some dealers
accepting these stones as alexandrites, and
others not.
Discussion and comparison of the Lake Manyara material with alexandrites from other phlogopite-bearing schist-type deposits
Alexandrites from Lake Manyara,
Tanzania, from various localities in
the Urals, Russia, and from Novello,
Zimbabwe, occur in a common type of
emerald-alexandrite deposit comprising
seams, layers or irregularly shaped ore
bodies of phlogopite. This common
lithological host had already been
recognized in the 1960s, shortly after the
discovery of the occurrence at Novello
(Martin, 1962; Bank, 1964; Bank and
Okrusch, 1967; Okrusch, 1971) and was
again underlined in the 1970s after the
discovery of the Lake Manyara deposit
(Thurm, 1972 a,b,c; Bank, 1974; Gübelin,
1974, 1976).
Although emerald and alexandrite
are occasionally found together in
such deposits, they mostly form at
some distance from each other. In the
Novello area, the main emerald- and
alexandrite-bearing bodies were found
about 1 km apart (Taylor, 1976; Metson
and Taylor, 1977). In Lake Manyara, the
distance is very variable, between a few
tens of centimetres to a few metres or
tens of metres. Although details of the
emerald-alexandrite formation within
these schist-type deposits are still under
discussion, a multistage metamorphic
genesis in so-called ‘blackwall’ contact
zones is generally accepted for this type
of deposit (see detailed review by Franz
and Morteani, 2002).
A comparison of alexandrites
originating from massive phlogopite host
rocks indicates that the samples from
Novello are most similar to some of the
Russian material and that an equivalent to
the Lake Manyara material is also found in
Russia. However, it must be emphasised
that the Russian samples originate
from numerous deposits exploited by
surface and underground mining over
a considerably larger area than the
Lake Manyara and Novello sources.
Consequently, the Russian samples
show a larger variability of characteristic
mineralogical and gemmological features.
The most impressive rough crystals
from all three mining areas are cyclic
twins (trillings), which show two
main types of habit: dipyramidal-
equidimensional-columnar or tabular.
Below we compare samples with
dipyramidal to columnar habit, but similar
results would be obtained for trillings with
tabular habit, twins or single crystals. The
growth sequence of alexandrite trillings
is given as a schematic overview in Figure 41. The first stage of crystal growth (A)
is characterized by a simple dipyramidal
habit with the dipyramid o and the
pinacoid a as dominant crystal forms.
In the last step of crystal growth (H),
the columnar trillings are characterized
by the prism i and the pinacoid a.
Intermediate steps (B to G) are described
as a step-by-step increase in size of i and
a corresponding decrease in size of o.
During this sequence, the dipyramid w
also grows but only temporarily (E).
Specimens from Russia can show any
or all the habits shown in Figure 41, but
generally only two or three steps within
this sequence are found within one
alexandrite trilling. For example, a sample
might show an external morphology as
described in crystal (E), and with the
microscope, a morphology varying from
C (in the centre of the crystal) over D
(in the middle) to E (at the outermost
rim) might be seen. Another example
with an external morphology of crystal
G might show internal growth structures
represented schematically by drawings E
and F.
Specimens from Novello (Schmetzer
et al., 2011) show two types of trillings,
both with o, b, i and occasionally with
w faces (examples D and E). In the first
type, these faces are combined with the
a pinacoid, a feature also commonly
observed in Russian samples from the
Malysheva Mine (Schmetzer, 2010). On the

The Journal of Gemmology / 2011 / Volume 32 / No. 5–8
Page 207
Alexandrite and colour-change chrysoberyl from the Lake Manyara alexandrite-emerald deposit in northern Tanzania
Figure 41: Growth sequence of alexandrite and chrysoberyl trillings with dipyramidal to columnar habit originating from phlogopite schist-related deposits. Examples of the complete growth sequence from A to H can be obtained from stones mined from the Uralian emerald-alexandrite belt (U), Russia, crystals A to C represent typical habits which were unearthed in the nineteenth century, samples D and E represent crystals mined in the twentieth century in the famous Malysheva Mine, and habits F to H represent mostly smaller crystals from the more recent production from Malysheva. Crystals D and E are typical examples of alexandrite trillings from the Novello deposit, Zimbabwe (N). Also E represents a morphology developed at the beginning of crystal growth in the Lake Manyara deposit, Tanzania, but not seen in well developed crystals from this deposit. F to H represent later stages of Lake Manyara (L) material and these habits are common in trillings from this locality. Examples of characteristic internal growth patterns corresponding to the external morphologies are also shown. Photos, crystal drawings and artwork by K. Schmetzer.
other hand, the second type from Novello
with smaller or no a pinacoids and
larger m prism faces, is extremely rare in
Russian samples. Instead of the m prism,
which is a larger face in Novello samples,
alexandrite from the Urals commonly
shows the s prism. Some of the Russian
samples do not show the i prism and the
w dipyramid, a common feature in crystals
from Novello.
Trillings from Lake Manyara, on the
other hand, show two dominant faces,
the a pinacoid and the i prism, mostly in
combination with small o dipyramids and
b pinacoidal faces (see again Figure 41,
examples F to H). Under the microscope
growth patterns at the beginning of crystal
growth showing the w dipyramid (E) are
visible; this is not seen macroscopically on
the mature crystals (see again Figure 23).
This morphology has recently been found
in Russian alexandrites which have been
unearthed within the last two decades
from the Malysheva Mine, but only in
smaller crystals with columnar habit. In
contrast to Russian samples and crystals
from Novello, single crystals and twins
from Lake Manyara commonly show the
prism r. The general crystal morphology of
twinned and untwinned chrysoberyls from
the Lake Manyara deposit is reflected
in their growth patterns and consists of
dominant a pinacoids and i prism faces
with subordinate (smaller) o dipyramids.
In contrast to some alexandrites from
Russia and most from Zimbabwe, intense
colour zoning is not present in the
Tanzanian stones.
Inclusions or platelets of phlogopite
mica are present in the chrysoberyls from
all three areas. Other mineral inclusions
which are common in material from Lake
Manyara are apatite and zircon; channels
parallel to the a-axis are also common.
Compositionally, Zimbabwean stones
have higher chromium contents than most
Russian alexandrites, while in samples
from Lake Manyara, chromium contents
are variable and overlap with those in
Russian samples. It was also found that
Lake Manyara alexandrites have iron
contents intermediate between those in
Urals
Urals
Novello
Lake Manyara
A
B
E
D
C
H
G
F
U
U
U
UL
UL
UL
UN
UN
The Journal of Gemmology / 2011 / Volume 32 / No. 5–8
Page 208
Alexandrite and colour-change chrysoberyl from the Lake Manyara alexandrite-emerald deposit in northern Tanzania
Russian and Zimbabwean alexandrites.
A more fruitful distinction of stones
from these three sources on the basis
of composition can be made using
various trace elements, such as boron,
magnesium, gallium, germanium and tin.
The colour changes observed in
alexandrites and chrysoberyls from
Tanzania are extremely variable, and
relate directly to their chromium contents
and the orientation of the table facet with
respect to the crystallographic axes.
Acknowledgements Information about the history of
the mine and unpublished geological
reports were obtained by Werner Radl,
Niederwörresbach, Germany, John M.
Saul, Paris, France, and Mark Saul, Swala
Gem Traders, Arusha, Tanzania. Cedric
Simonet, Nairobi, Kenya, submitted
two of his unpublished geological
reports for information. Some of the
samples examined were from the private
collections of the authors, and additional
alexandrites from the Lake Manyara
area were kindly submitted from the
following private collections or from the
stock of their companies, which is greatly
appreciated:
George Bosshart, Horgen, Switzerland;
Terry Coldham, Sydney, Australia;
Rolf Goerlitz, Rolf Goerlitz Company, Idar-
Oberstein;
Frank Jurkutat, Einbeck, Germany;
Michael Krzemnicki, SSEF, Swiss
Gemmological Institute, Basel,
Switzerland;
Francine Payette, Perth, Australia;
Werner Radl, Mawingu Gems Company,
Niederwörresbach, Germany;
John M. Saul, Paris, France;
Markus Wild, Paul Wild Company,
Kirschweiler, Germany;
Karl Egon Wild, Wild & Petsch Company,
Kirschweiler, Germany.
Frank-Jürgen Schupp, Pforzheim,
Germany, kindly submitted the alexandrite
cube from Sri Lanka;
George Bosshart, Horgen, Switzerland,
measured numerous rough alexandrite
crystals and crystal fragments with his
Zeiss MCS 311 colorimeter.
Christopher Cavey, London, UK,
is thanked for various discussions
concerning the alexandrite/chrysoberyl
nomenclature.
ReferencesAmstutz, G.C., and Bank, H., 1977.
Geologische, petrographische und
mineralogische Beobachtungen in
einigen Minen von Smaragd, Tansanit,
Tsavorit und Rubin in Tansania
und Kenya. Zeitschrift der Deutschen Gemmologischen Gesellschaft, 26(3), 118–27
Bank, H., 1964. Alexandritvorkommen
in Südrhodesien. Zeitschrift der Deutschen Gesellschaft für Edelsteinkunde, 47, 11–15
Bank, H., 1974. Smaragd, Alexandrit
und Rubin als Komponenten einer
Paragenese vom Lake Manyara
in Tansania. Zeitschrift der Deutschen Gemmologischen Gesellschaft, 23(1), 62–3
Bank, H., and Okrusch, M., 1967.
Mineralogische Untersuchungen
am Alexandrit der Novello Claims,
Rhodesien. Zeitschrift der Deutschen Gesellschaft für Edelsteinkunde, 61, 33–49
Bank, H., and Gübelin, E., 1976. Das
Smaragd-Alexandritvorkommen von
Lake Manyara/Tansania. Zeitschrift der Deutschen Gemmologischen Gesellschaft, 25(3),130–47
Bridges, C.R., 1982. Gemstones of
East Africa. In: Eash, D.M. (Ed.),
International Gemological Symposium
Proceedings 1982, Gemological
Institute of America, 263–75
Coldham, T., and Payette, F., 2010. The
31st International Gemmological
Conference. Australian Gemmologist, 24(1),
17–22
Dunn, P.J., 1976. Gemmological Notes.
Journal of Gemmology, 15(3), 113–18
Fischer, W., 1954. Praktische Edelsteinkunde. 2nd Edn. Kettwig/Ruhr, Verlag Gustav
Feller-Nottuln, 187 pp
Franz, G., and Morteani, G., 2002. Be-
minerals: synthesis, stability, and
occurrence in metamorphic rocks.
In: Grew, E.S. (Ed.), Beryllium:
mineralogy, petrology, and
geochemistry. Reviews in Mineralogy, 50,
551–89
Gübelin, E.J., 1974. The emerald deposit
at Lake Manyara, Tanzania. Lapidary Journal, 28(2), 338–60
Gübelin, E., 1976. Alexandrite from Lake
Manyara, Tanzania. Gems & Gemology, 15(7), 203–9
Honess, A.P., 1917. On the etching figures
of beryl. American Journal of Science, Series 4, 43, 223–36
Keller, P.C., 1992. Emerald and alexandrite
from Tanzania. In: Gemstones of East Africa. Geoscience Press, Phoenix,
Arizona, 144 pp
Liddicoat, R.T. Jr., 1976. African
alexandrites? Gems & Gemology, 15(7),
211–13
Malsy, A.-K., 2010. Trace element
chemistry and locality determination.
In: Schmetzer, K. Russian alexandrites. Schweizerbart Science Publishers,
Stuttgart, pp 121–6
Martin, H.J., 1962. Some observations on
Southern Rhodesian emeralds and
chrysoberyl. Chamber of Mines Journal, 4,
34–8
Metson, N.A., and Taylor, A.M., 1977.
Observations on some Rhodesian
emerald occurrences. Journal of Gemmology, 15(8), 422–34
Moroz, I.I., and Eliezri, I.Z., 1999. Mineral
inclusions in emeralds from different
sources. Journal of Gemmology, 26(6),
357–63
Moroz, I., Vapnik, Y., Eliezri, I., and Roth,
M., 2001. Mineral and fluid inclusions
of emeralds from the Lake Manyara
and Sumbawanga deposits, Tanzania.
Journal of African Earth Sciences, 33(2),
377–90
Mwakisunga, M.A., 1972a. Geological
report of Mayoka beryl occurrence,
Lake Manyara. Unpublished report,
3 pp
Mwakisunga, M.A., 1972b. Preliminary
summary report on Mayoka beryl
occurrence — Lake Manyara.
Unpublished report, 6 pp
Okrusch, M., 1971. Zur Genese
der Chrysoberyll- und
Alexandritlagerstätten. Eine
Literaturübersicht. Zeitschrift der Deutschen Gemmologischen Gesellschaft, 20(3), 114–24

The Journal of Gemmology / 2011 / Volume 32 / No. 5–8
Page 209
Alexandrite and colour-change chrysoberyl from the Lake Manyara alexandrite-emerald deposit in northern Tanzania
Schmetzer, K., 2010. Russian alexandrites. Schweizerbart Science Publishers,
Stuttgart, 141 pp
Schmetzer, K., 2011. Measurement and
interpretation of growth patterns in
chrysoberyl, including alexandrite.
Journal of Gemmology, 32(5-8), 129–44
Schmetzer, K., Bernhardt, H.-J.,
Bosshart, G., and Hainschwang, T.,
2009. Colour-change garnets from
Madagascar: variation of chemical,
spectroscopic and colorimetric
properties. Journal of Gemmology, 31(5–8),
235–82
Schmetzer, K., and Bosshart, G.,
2010. Colorimetric data of Russian
alexandrite and yellowish green to
green chrysoberyl. In: Schmetzer,
K. Russian alexandrites. Schweizerbart
Science Publishers, Stuttgart,
pp 107–20
Schmetzer, K., Stocklmayer, S.,
Stocklmayer, V., and Malsy, A.-K.,
2011. Alexandrites from the Novello
alexandrite-emerald deposit, Masvingo
District, Zimbabwe. Australian Gemmologist, 24(6), 133–47
Simonet, C., 1997. The Manyara emerald
mine – proposals for the re-opening.
Unpublished report, October 1997,
7 pp
Simonet, C., 2010. Manyara alexandrite
and emerald. Unpublished report,
August 2010, 9 pp
Taylor, A.,1976. African clues to the great
emerald mystery. Lapidary Journal, 30(3),
692–722
The AuthorsDr Karl SchmetzerTaubenweg 16, 85238 Petershausen, Germany
email: [email protected]
Anna-Kathrin MalsyGübelin Gem Lab, Gübelin Gemmological Laboratory, Maihofstr. 102, 6006
Lucerne, Switzerland and Institute of Geological Sciences, Mineralogical
Crystallography, University of Berne, Freiestrasse 3, 3012 Bern, Switzerland.
email: [email protected]
Thurm, R., 1972a. Smaragde vom Lake
Manyara in Tansania. Zeitschrift der Deutschen Gemmologischen Gesellschaft, 21(1),
9–12
Thurm, R.E., 1972b. Die Manyara-
Smaragde von Tansania. Goldschmiede Zeitung, 70(5), 62-63
Thurm, R.E., 1972c. The Lake-Manyara
emeralds of Tanzania. Journal of Gemmology, 13(3), 98–9
Viswanatha, M.N., and Shah, A.P.,
1983. Geology and gem potentiality
of the emerald deposit at Lake
Manyara (Arusha region) Tanzania.
Unpublished report, 10 pp
Wight, Q., and Wight, W., 2010. The
31st International Gemmological
Conference Arusha, Tanzania,
October, 2009. Canadian Gemmologist, 31(1-3), 16-26
Web listKondo, H., 2005. Manyara: Living on
memories. Available at: http://
www.ganoksin.com/borisat/nenam/
tanzania-mines.htm
Nkwame, M., 2009. Lake Manyara National
Park to be expanded. Available
at: http://www.dailynews.co.tz/
home/?n=5713&cat=home

The Gem-A TravelGem Microscope
To order your TravelGem Microscope from the Gem-A shop go to www.gem-a.com/shop.aspx or contact Alan Clark on +44 (0)20 7404 3334, email [email protected].
The GemmoloGical associaTion of GreaT BriTain
Gem-A
Price: £325.00 plus VAT, postage and packing
A 10% discount is given on all instruments ordered by Gem-A members and Gem-A registered students.
A compact microscope designed for gemmologists — ideal for students, valuers and gem dealers.
• Fitted aluminium travel case• 10x, 20x, 30x and 60x magnification• Stone holder and dark field assembly can be removed to examine jewellery• Runs on 110 and 220 volts (built in transformer)• Bright field, dark field and top lighting
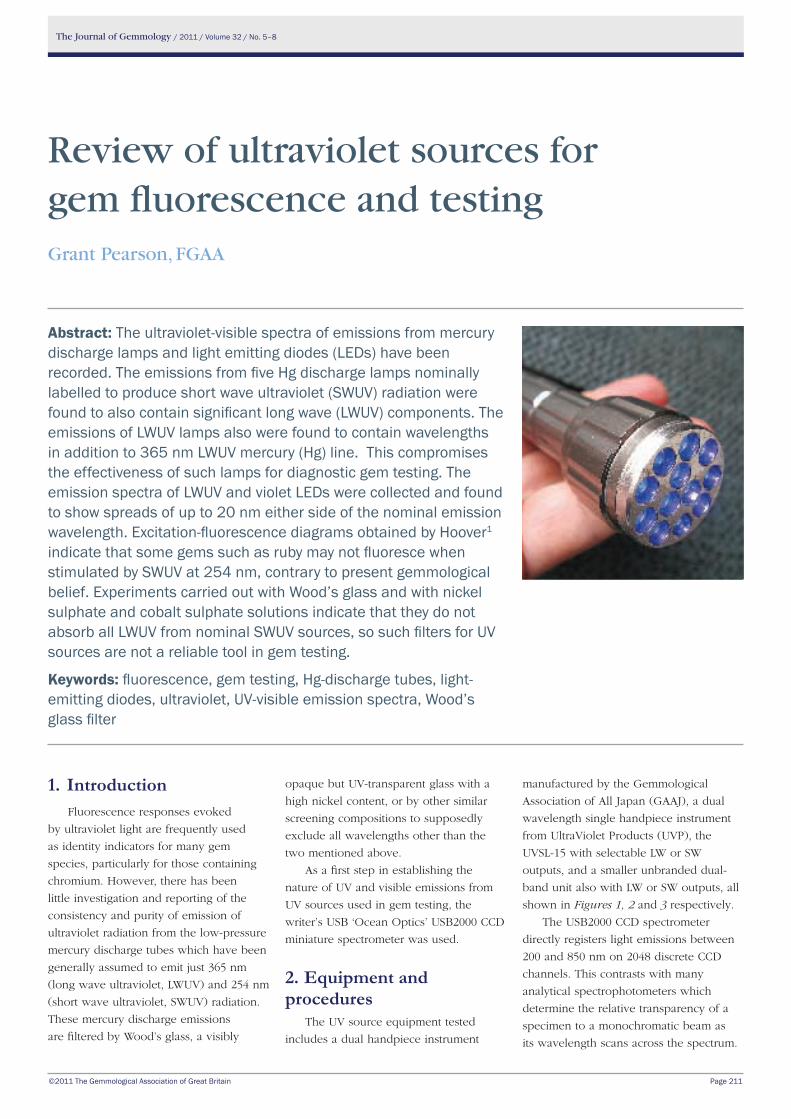
The Journal of Gemmology / 2011 / Volume 32 / No. 5–8
©2011 The Gemmological Association of Great Britain Page 211
1. IntroductionFluorescence responses evoked
by ultraviolet light are frequently used
as identity indicators for many gem
species, particularly for those containing
chromium. However, there has been
little investigation and reporting of the
consistency and purity of emission of
ultraviolet radiation from the low-pressure
mercury discharge tubes which have been
generally assumed to emit just 365 nm
(long wave ultraviolet, LWUV) and 254 nm
(short wave ultraviolet, SWUV) radiation.
These mercury discharge emissions
are filtered by Wood’s glass, a visibly
Review of ultraviolet sources for gem fluorescence and testingGrant Pearson, FGAA
Abstract: The ultraviolet-visible spectra of emissions from mercury discharge lamps and light emitting diodes (LEDs) have been recorded. The emissions from five Hg discharge lamps nominally labelled to produce short wave ultraviolet (SWUV) radiation were found to also contain significant long wave (LWUV) components. The emissions of LWUV lamps also were found to contain wavelengths in addition to 365 nm LWUV mercury (Hg) line. This compromises the effectiveness of such lamps for diagnostic gem testing. The emission spectra of LWUV and violet LEDs were collected and found to show spreads of up to 20 nm either side of the nominal emission wavelength. Excitation-fluorescence diagrams obtained by Hoover1 indicate that some gems such as ruby may not fluoresce when stimulated by SWUV at 254 nm, contrary to present gemmological belief. Experiments carried out with Wood’s glass and with nickel sulphate and cobalt sulphate solutions indicate that they do not absorb all LWUV from nominal SWUV sources, so such filters for UV sources are not a reliable tool in gem testing.
Keywords: fluorescence, gem testing, Hg-discharge tubes, light-emitting diodes, ultraviolet, UV-visible emission spectra, Wood’s glass filter
opaque but UV-transparent glass with a
high nickel content, or by other similar
screening compositions to supposedly
exclude all wavelengths other than the
two mentioned above.
As a first step in establishing the
nature of UV and visible emissions from
UV sources used in gem testing, the
writer’s USB ‘Ocean Optics’ USB2000 CCD
miniature spectrometer was used.
2. Equipment and procedures
The UV source equipment tested
includes a dual handpiece instrument
manufactured by the Gemmological
Association of All Japan (GAAJ), a dual
wavelength single handpiece instrument
from UltraViolet Products (UVP), the
UVSL-15 with selectable LW or SW
outputs, and a smaller unbranded dual-
band unit also with LW or SW outputs, all
shown in Figures 1, 2 and 3 respectively.
The USB2000 CCD spectrometer
directly registers light emissions between
200 and 850 nm on 2048 discrete CCD
channels. This contrasts with many
analytical spectrophotometers which
determine the relative transparency of a
specimen to a monochromatic beam as
its wavelength scans across the spectrum.
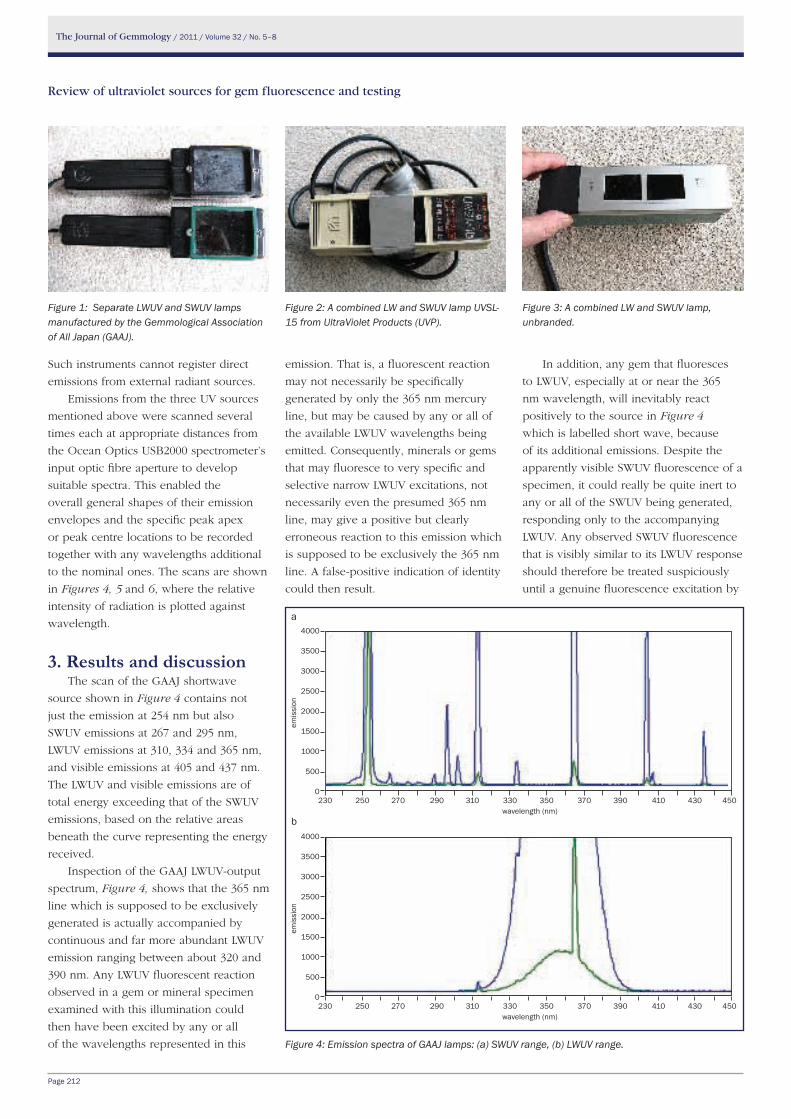
The Journal of Gemmology / 2011 / Volume 32 / No. 5–8
Page 212
Review of ultraviolet sources for gem fluorescence and testing
Such instruments cannot register direct
emissions from external radiant sources.
Emissions from the three UV sources
mentioned above were scanned several
times each at appropriate distances from
the Ocean Optics USB2000 spectrometer’s
input optic fibre aperture to develop
suitable spectra. This enabled the
overall general shapes of their emission
envelopes and the specific peak apex
or peak centre locations to be recorded
together with any wavelengths additional
to the nominal ones. The scans are shown
in Figures 4, 5 and 6, where the relative
intensity of radiation is plotted against
wavelength.
3. Results and discussionThe scan of the GAAJ shortwave
source shown in Figure 4 contains not
just the emission at 254 nm but also
SWUV emissions at 267 and 295 nm,
LWUV emissions at 310, 334 and 365 nm,
and visible emissions at 405 and 437 nm.
The LWUV and visible emissions are of
total energy exceeding that of the SWUV
emissions, based on the relative areas
beneath the curve representing the energy
received.
Inspection of the GAAJ LWUV-output
spectrum, Figure 4, shows that the 365 nm
line which is supposed to be exclusively
generated is actually accompanied by
continuous and far more abundant LWUV
emission ranging between about 320 and
390 nm. Any LWUV fluorescent reaction
observed in a gem or mineral specimen
examined with this illumination could
then have been excited by any or all
of the wavelengths represented in this
emission. That is, a fluorescent reaction
may not necessarily be specifically
generated by only the 365 nm mercury
line, but may be caused by any or all of
the available LWUV wavelengths being
emitted. Consequently, minerals or gems
that may fluoresce to very specific and
selective narrow LWUV excitations, not
necessarily even the presumed 365 nm
line, may give a positive but clearly
erroneous reaction to this emission which
is supposed to be exclusively the 365 nm
line. A false-positive indication of identity
could then result.
In addition, any gem that fluoresces
to LWUV, especially at or near the 365
nm wavelength, will inevitably react
positively to the source in Figure 4
which is labelled short wave, because
of its additional emissions. Despite the
apparently visible SWUV fluorescence of a
specimen, it could really be quite inert to
any or all of the SWUV being generated,
responding only to the accompanying
LWUV. Any observed SWUV fluorescence
that is visibly similar to its LWUV response
should therefore be treated suspiciously
until a genuine fluorescence excitation by
Figure 1: Separate LWUV and SWUV lamps manufactured by the Gemmological Association of All Japan (GAAJ).
Figure 2: A combined LW and SWUV lamp UVSL-15 from UltraViolet Products (UVP).
Figure 3: A combined LW and SWUV lamp, unbranded.
Figure 4: Emission spectra of GAAJ lamps: (a) SWUV range, (b) LWUV range.
4000
3500
3000
2500
2000
1500
1000
500
0230 250 270 290 310 330 350 370 390 410 430 450
wavelength (nm)
emis
sion
4000
3500
3000
2500
2000
1500
1000
500
0230 250 270 290 310 330 350 370 390 410 430 450
wavelength (nm)
emis
sion
a
b

The Journal of Gemmology / 2011 / Volume 32 / No. 5–8
Page 213
Review of ultraviolet sources for gem fluorescence and testing
exclusively SWUV can be demonstrated,
rather than by any unsuspected
accompanying LWUV.
The spectrum of the SWUV emission
from the UVSL-15 lamps shown in Figure
5 indicates a definite emission near 254
nm accompanied by a substantially larger
output in the long wave region which is
perhaps comparable with that from the
nominal LWUV-only output (see lower
graph). So, any visible fluorescence
evoked in a gem by such LWUV will
also appear when it is placed under the
SWUV lamp. Any genuine fluorescence
stimulated by the SWUV may not be
perceptible since it could be overwhelmed
by fluorescence excited by the more
intense accompanying LW radiation,
especially if the fluorescent emission
wavelengths are visibly similar.
Examination of the SWUV emission
spectrum of the unbranded dual-band
UV unit shown in Figure 6 also indicates
the presence of substantial amounts of
LWUV. This common feature of all three
commercial lamps suggests that many if
not most Hg-discharge UV lamps may
suffer from this shortcoming. This implies
that any fluorescence displayed by a gem
under one of these lights may or may not
be due to short-wave stimulation, which
in turn casts doubt on attributions of
cause and interpretations published in the
past.
Just like the other two LWUV maps,
the unbranded lamp emits light with
a distinct peak near 405 nm. This is
significant, since many chromiferous
minerals and gems may strongly fluoresce
red to the visible shorter wavelengths,
often more intensely than to the shorter
365 nm LWUV band to which they
may even be negligibly sensitive. This
effect is at the core of the ‘crossed
filters technique’ where fluorescence of
a specimen is preferentially excited by
visible blue light. Appropriate blue light
can be screened from initially white
continuous light by a solution of a blue
copper salt such as the nitrate or sulphate
to remove all wavelengths other than the
blue to visible-violet (see the transmission
spectrum of saturated copper nitrate
solution produced by the writer on a
Figure 5: Emission spectra of UVSL-15 lamp: (a) in SWUV mode, (b) in LWUV mode.
Figure 6: Emission spectra of unbranded lamp: (a) SWUV source, (b) LWUV source.
4000
3500
3000
2500
2000
1500
1000
500
0 250 270 290 310 330 350 370 390 410 430 450
wavelength (nm)
emis
sion
a
4000
3500
3000
2500
2000
1500
1000
500
0 250 270 290 310 330 350 370 390 410 430 450
wavelength (nm)
emis
sion
b
3500
3000
2500
2000
1500
1000
500
0 250 270 290 310 330 350 370 390 410
wavelength (nm)
emis
sion
a
4000
3500
3000
2500
2000
1500
1000
500
0 250 270 290 310 330 350 370 390 410
wavelength (nm)
emis
sion
b
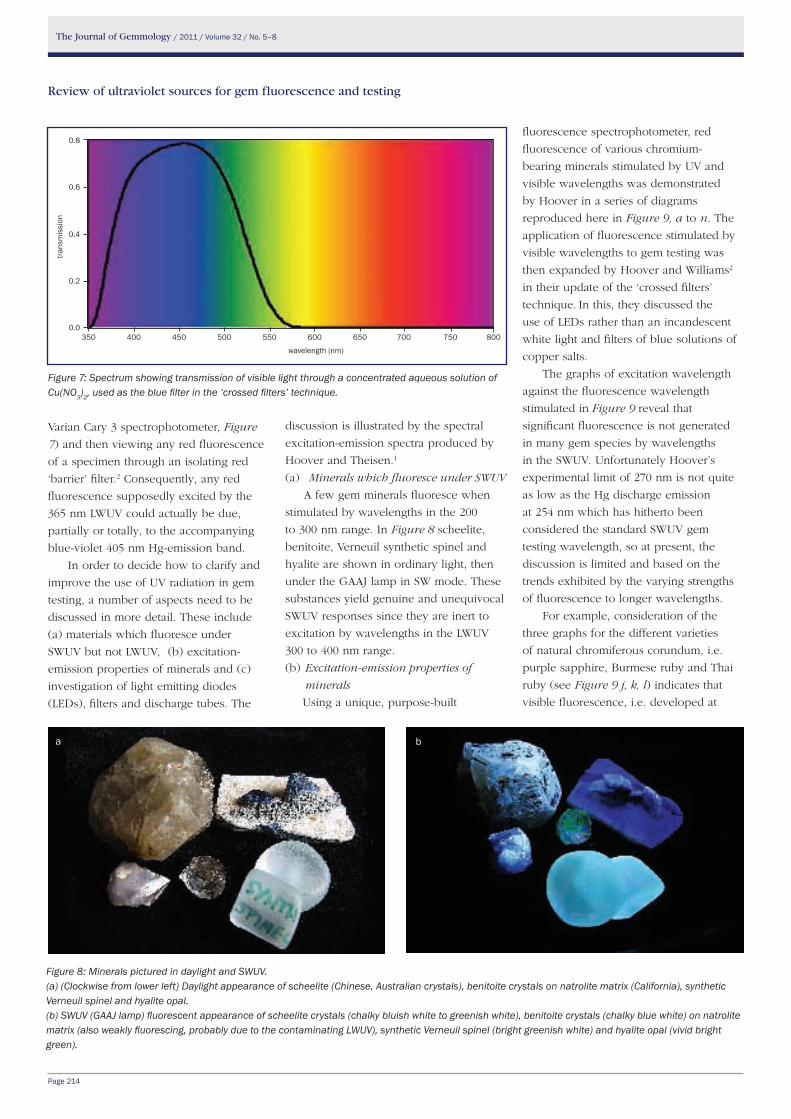
The Journal of Gemmology / 2011 / Volume 32 / No. 5–8
Page 214
Review of ultraviolet sources for gem fluorescence and testing
Varian Cary 3 spectrophotometer, Figure
7) and then viewing any red fluorescence
of a specimen through an isolating red
‘barrier’ filter.2 Consequently, any red
fluorescence supposedly excited by the
365 nm LWUV could actually be due,
partially or totally, to the accompanying
blue-violet 405 nm Hg-emission band.
In order to decide how to clarify and
improve the use of UV radiation in gem
testing, a number of aspects need to be
discussed in more detail. These include
(a) materials which fluoresce under
SWUV but not LWUV, (b) excitation-
emission properties of minerals and (c)
investigation of light emitting diodes
(LEDs), filters and discharge tubes. The
discussion is illustrated by the spectral
excitation-emission spectra produced by
Hoover and Theisen.1
(a) Minerals which fluoresce under SWUV
A few gem minerals fluoresce when
stimulated by wavelengths in the 200
to 300 nm range. In Figure 8 scheelite,
benitoite, Verneuil synthetic spinel and
hyalite are shown in ordinary light, then
under the GAAJ lamp in SW mode. These
substances yield genuine and unequivocal
SWUV responses since they are inert to
excitation by wavelengths in the LWUV
300 to 400 nm range.
(b) Excitation-emission properties of
minerals
Using a unique, purpose-built
fluorescence spectrophotometer, red
fluorescence of various chromium-
bearing minerals stimulated by UV and
visible wavelengths was demonstrated
by Hoover in a series of diagrams
reproduced here in Figure 9, a to n. The
application of fluorescence stimulated by
visible wavelengths to gem testing was
then expanded by Hoover and Williams2
in their update of the ‘crossed filters’
technique. In this, they discussed the
use of LEDs rather than an incandescent
white light and filters of blue solutions of
copper salts.
The graphs of excitation wavelength
against the fluorescence wavelength
stimulated in Figure 9 reveal that
significant fluorescence is not generated
in many gem species by wavelengths
in the SWUV. Unfortunately Hoover’s
experimental limit of 270 nm is not quite
as low as the Hg discharge emission
at 254 nm which has hitherto been
considered the standard SWUV gem
testing wavelength, so at present, the
discussion is limited and based on the
trends exhibited by the varying strengths
of fluorescence to longer wavelengths.
For example, consideration of the
three graphs for the different varieties
of natural chromiferous corundum, i.e.
purple sapphire, Burmese ruby and Thai
ruby (see Figure 9 j, k, l) indicates that
visible fluorescence, i.e. developed at
Figure 7: Spectrum showing transmission of visible light through a concentrated aqueous solution of Cu(NO3)2, used as the blue filter in the ‘crossed filters’ technique.
Figure 8: Minerals pictured in daylight and SWUV.(a) (Clockwise from lower left) Daylight appearance of scheelite (Chinese, Australian crystals), benitoite crystals on natrolite matrix (California), synthetic Verneuil spinel and hyalite opal.(b) SWUV (GAAJ lamp) fluorescent appearance of scheelite crystals (chalky bluish white to greenish white), benitoite crystals (chalky blue white) on natrolite matrix (also weakly fluorescing, probably due to the contaminating LWUV), synthetic Verneuil spinel (bright greenish white) and hyalite opal (vivid bright green).
350 400 450 500 550 600 650 700 750 800
wavelength (nm)
0.8
0.6
0.4
0.2
0.0
trans
mis
sion
a b

The Journal of Gemmology / 2011 / Volume 32 / No. 5–8
Page 215
Review of ultraviolet sources for gem fluorescence and testing
Figure 9 a–h: Fluorescence-excitation contour diagrams for (a) alexandrite, (b) chrome diopside, (c) chrome grossular, (d) chrome kornerupine, (e) chrome tourmaline, (f) Australian emerald, (g) Brazilian emerald, and (h) chrome kyanite.
590
550
510
470
430
390
350
310
270
excitation (nm)
600 640
680 720
760 800
emission (nm)
590
550
510
470
430
390
350
310
270
excitation (nm)
600 640
680 720
760 800
emission (nm)
650
690
730
770
810
590
550
510
470
430
390
350
310
270
excitation (nm)emission (nm)
590
550
510
470
430
390
350
310
270
excitation (nm)
600 640
680 720
760 800
emission (nm)
650
690
730
770
810590
550
510
470
430
390
350
310
270
excitation (nm)emission (nm)
650
690
730
770
810
590
550
510
470
430
390
350
310
270
excitation (nm)emission (nm)
590
550
510
470
430
390
350
310
270
excitation (nm)
600 640
680 720
760 800
emission (nm)
590550
510
470
430390
35031
027
0excitation (nm)
600 640
680
720 760
800
emission (nm)
a b
c d
e f
hg

The Journal of Gemmology / 2011 / Volume 32 / No. 5–8
Page 216
Review of ultraviolet sources for gem fluorescence and testing
wavelengths less than 700 nm, occurs only
for excitation wavelengths in the LWUV,
and even then only at values greater than
about 350 nm for each of them, and with
no indication of any fluorescence by
excitation at any shorter wavelengths.
The onset of visible fluorescence of
the natural Brazilian alexandrite (Figure
9a) only commences at excitation by
wavelengths greater than 370 nm, again
with no indication of any fluorescence
from any shorter excitation wavelengths.
Exactly as for the alexandrite, the
chrome grossular (Figure 9c) including
green garnets such as Merelani ‘mint’
garnet or chrome-rich tsavorite), the
Australian natural emerald (Figure 9f),
the Brazilian natural emerald (Figure
9g), the Kenyan chrome tourmaline
(Figure 9e) and the Brazilian pink topaz
(Figure 9n), also fluoresce but only
to excitation wavelengths greater than
370 nm, suggesting that fluorescence
to the usual 365 nm LWUV should not
even be observed and that any detected
fluorescence is due to the longer
LWUV continuum up to about 390 nm.
Some very minor longer wavelength
fluorescence was noted for the chrome
tourmaline at shorter excitations.
Chrome kyanite (Figure 9h) does not
begin to significantly fluoresce until the
excitation reaches as much as 390 nm
and should be inert to 365 nm LWUV.
Purple (chrome-rich) Sri Lankan spinel
(Figure 9l), did fluoresce red to 365 nm,
590
550
510
470
430
390
350
310
270
excitation (nm)
600 640
680 720
760 800
emission (nm)
Figure 9 i–n: Fluorescence-excitation contour diagrams for (i) purple sapphire, (j) Burmese ruby, (k) Thai ruby, (l) purple spinel (Sri Lanka), (m) synthetic emerald, (n) pink topaz (Brazil).
650
690
730
770
810
590
550
510
470
430
390
350
310
270
excitation (nm)
emission (nm)
590
550
510
470
430
390
350
310
270
excitation (nm)
600 640
680 720
760 800
emission (nm)
590
550
510
470
430
390
350
310
270
excitation (nm)
600 640
680 720
760 800
emission (nm)
650
690
730
770
810
590
550
510
470
430
390
350
310
270
excitation (nm)emission (nm)
590
550
510
470
430
390
350
310
270
excitation (nm)
650
690
730
770
810
emission (nm)
i j
k l
m n

The Journal of Gemmology / 2011 / Volume 32 / No. 5–8
Page 217
Review of ultraviolet sources for gem fluorescence and testing
beginning at slightly shorter excitation
wavelengths around 350 nm with some
comparatively minor activity at even
shorter excitation wavelengths.
The synthetic emerald (Figure 9m)
shows the same fluorescence pattern
as the two natural emeralds except that
additional visible fluorescence does begin
to develop as low as about 300 nm, and
the fluorescence intensity is still increasing
as the excitation wavelength falls to 270
nm. This suggests that this undisclosed
variety of synthetic emerald may well
fluoresce to some excitation band in the
SWUV including 254 nm, in contrast to the
natural emeralds.
African chrome kornerupine (Figure
9d) develops fluorescence to shorter
excitation wavelengths from 350 nm
down to at least 270 nm with trending
indications that fluorescence may well
also occur at the SWUV 254 nm and
perhaps even at shorter wavelengths.
Chrome diopside fluoresced strongly to
excitation, but only emitted at greater than
about 390 nm although its fluorescence
was confined to the near-infrared with
negligible visible fluorescence.
Of all of these instances discussed,
only the synthetic emerald displayed
significant fluorescence to wavelengths
in the part of the SWUV band portrayed,
i.e. 270 to 300 nm, and none except
the chrome kornerupine showed any
trends suggesting that fluorescence to
254 nm might be encountered. None of
the various minerals, spinel, corundum,
etc, usually considered to develop red
diagnostic chrome fluorescence to SWUV,
i.e. 254 nm, as well as to the usual LWUV
band, actually displayed significant
observable fluorescence to the available
lower limit of 270 nm. This is consistent
with the conclusion indicated above that
previously noted fluorescence reactions
to SWUV are false and really due to other
wavelengths from the lamp emission that
extend into the LWUV region.
(c) LEDs, discharge tubes and filters
LEDs have become useful illumination
sources in gemmology, especially
including some of the shorter-wavelength
emitters which can stimulate possibly
diagnostic fluorescence in various
Figure 11: Emission spectrum from LED torch shown in Figure 10. At close range (green trace) the emission band is 50 nm wide but this surprisingly narrows with distance from the source (blue trace).
materials. LEDs producing visible deep
blue from about 450 to 400 nm as well as
some that generate LWUV at wavelengths
near 395 and 385 nm have shown
potential for gemmological identification,
especially for stimulating fluorescence in
susceptible diamonds and in chromiferous
materials. The chromiferous gems
particularly include ruby, red spinel,
alexandrite and even some varieties of
emerald. LEDs have significant advantages
such as compactness, simplicity and
portability, operating from low voltages
while drawing only milliwatts of power
and developing locally high light
intensities appropriate for gemmology.
One inexpensive recent development is
the manufacture of a torch (Figure 10)
containing several 385 nm LEDs with their
output being filtered by a disc of Wood’s
glass (Figure 11) to remove most of the
accompanying visible deep blue to violet
emission. The deep blue to violet could
mask visible fluorescence results (see
the illustrations in Figure 12 of visible
emissions from a blue LED torch and the
385 nm filtered LED torch). Wood’s glass
is coloured with nickel, but unlike most
bright-green nickel salts, Wood’s glass
is deep purple and essentially opaque
to the visible spectrum although it is
transparent to much of the LWUV range.
The emissions from several different LED
sources, including the 405 nm violet-LED
torch (see Figure 12 (left) and Figure 13),
a single 405 nm violet LED ‘key-ring’ torch
and a single isolated violet LED were
scanned to determine the extents of their
outputs (Figures 14 and 15).
Another source of LWUV is the
fluorescent ‘black light’ which basically
consists of an ordinary fluorescent tube
with its glass tube consisting of Wood’s
glass filter to exclude the visible spectrum.
The usual phosphors to convert the
UV emissions of Hg into visible light
have probably been replaced by ones
which emit LWUV (see Gleason4). Also,
information posted on the internet
suggests that compositions such as
Figure 10: Multiple-LED battery-powered torch with a Wood’s glass filter and nominal 385 nm emission.
3500
3000
2500
2000
1500
1000
500
0300 320 340 360 380 400 420 440 460 480 500
wavelength (nm)
emis
sion

The Journal of Gemmology / 2011 / Volume 32 / No. 5–8
Page 218
Review of ultraviolet sources for gem fluorescence and testing
europium-doped strontium fluoroborate,
europium-doped strontium borate or
lead-doped barium silicate are often used
as phosphors in these ‘black-light-blue’ or
‘BLB’ black-light tubes. This would explain
the abundant wideband continuous
emission accompanying the line spectra in
the LWUV from Hg discharge tubes. Wide
band emission is often a typical feature of
some fluorescence. Black-lights have been
used in various commercial applications
such as advertising, counterfeit detection,
skin-tanning and decoration, but their
LWUV spectra and their applicability for
gemmological purposes have not been
widely discussed. The LWUV spectrum
of the small (4 watt) BLB black-light
fluorescent tube (Figure 16) was scanned
(Figure 18) to compare it with those
of the proprietary ultraviolet mercury-
discharge lamps shown in Figures 4 to 6
with which it is nearly identical.
Another lamp that has applications to
gemmological testing is the ‘germicidal’
fluorescent tube with a SWUV-transparent
envelope (Figures 16 and 17). The output
is unfiltered and consists of mercury
SWUV emission together with LWUV
radiation and some visible emission.
An earlier commercially unsuccessful
attempt to employ this germicidal lamp
for development of mineralogical and
gemmological fluorescence employed a
unique but rather fragile liquid filter. It
consisted of a UV-transparent fused-silica
(‘vycor’) tube filled with an iron-free and
saturated aqueous solution of cobaltous
sulphate. The spectrum of the LWUV BLB
fluorescent tube is illustrated in Figure
18 and the emission of the SWUV liquid-
filtered prototype lamp is presented in
Figure 19. The filtered germicidal tube
develops a quite satisfactorily intense
SWUV emission but is also accompanied
by significant interfering LWUV and visible
emissions.
To be an effective liquid filter for
excluding visible light from ultraviolet
Figure 14: Emission spectrum of the multiple-LED torch of Figure 13, unfiltered and showing a spread from about 390 to 430 nm and centred about 407 nm. The green trace was measured closer to the source.
Figure 12: Multiple-LED torch of Figure 10 on the right next to a multiple-LED torch on the left which is unfiltered and emits light at and around 405 nm.
Figure 13: Another view of the torch on the left in Figure 12.
Figure 15: Emission spectrum of a single LED ‘key ring’ torch showing a range from 390 to 430 nm and centring about 405 nm. The green trace is closer to the source.
4000
3500
3000
2500
2000
1500
1000
500
0380 385 390 395 400 405 410 415 420 425 430 435 400
wavelength (nm)
emis
sion
3500
3000
2500
2000
1500
1000
500
0380 385 390 395 400 405 410 415 420 425 430 435 400
wavelength (nm)
emis
sion
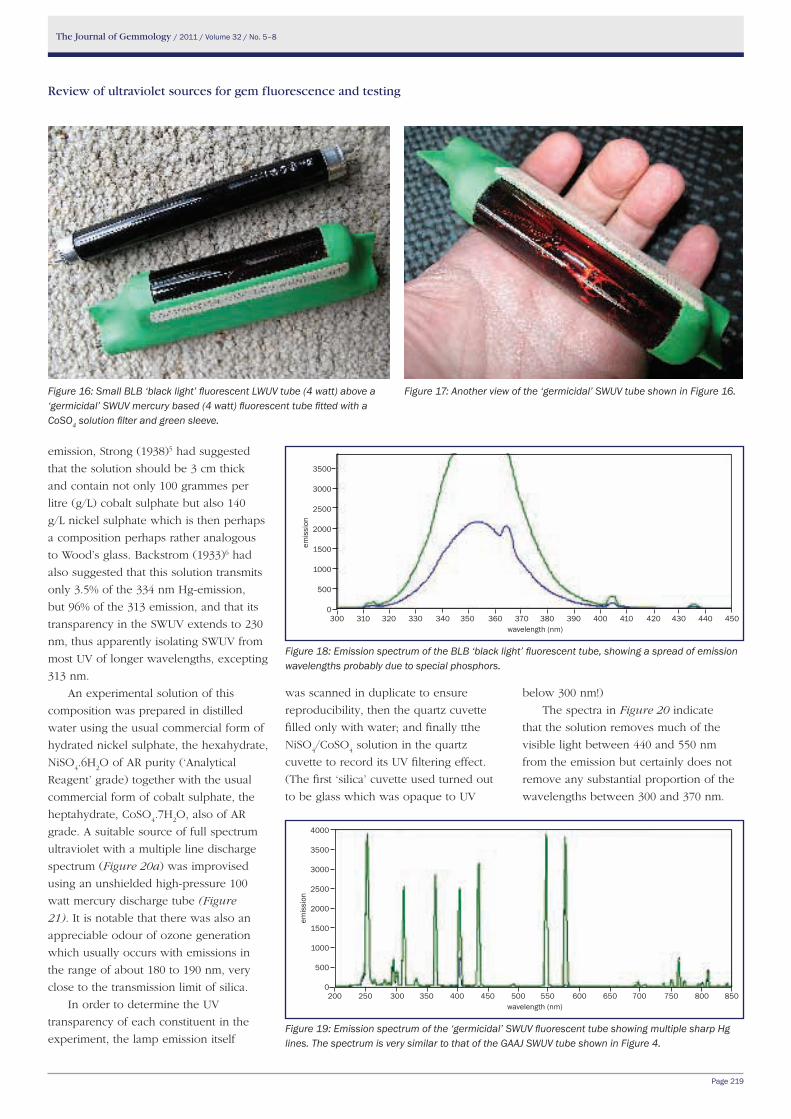
The Journal of Gemmology / 2011 / Volume 32 / No. 5–8
Page 219
Review of ultraviolet sources for gem fluorescence and testing
emission, Strong (1938)5 had suggested
that the solution should be 3 cm thick
and contain not only 100 grammes per
litre (g/L) cobalt sulphate but also 140
g/L nickel sulphate which is then perhaps
a composition perhaps rather analogous
to Wood’s glass. Backstrom (1933)6 had
also suggested that this solution transmits
only 3.5% of the 334 nm Hg-emission,
but 96% of the 313 emission, and that its
transparency in the SWUV extends to 230
nm, thus apparently isolating SWUV from
most UV of longer wavelengths, excepting
313 nm.
An experimental solution of this
composition was prepared in distilled
water using the usual commercial form of
hydrated nickel sulphate, the hexahydrate,
NiSO4.6H
2O of AR purity (‘Analytical
Reagent’ grade) together with the usual
commercial form of cobalt sulphate, the
heptahydrate, CoSO4.7H
2O, also of AR
grade. A suitable source of full spectrum
ultraviolet with a multiple line discharge
spectrum (Figure 20a) was improvised
using an unshielded high-pressure 100
watt mercury discharge tube (Figure
21). It is notable that there was also an
appreciable odour of ozone generation
which usually occurs with emissions in
the range of about 180 to 190 nm, very
close to the transmission limit of silica.
In order to determine the UV
transparency of each constituent in the
experiment, the lamp emission itself
was scanned in duplicate to ensure
reproducibility, then the quartz cuvette
filled only with water; and finally tthe
NiSO4/CoSO
4 solution in the quartz
cuvette to record its UV filtering effect.
(The first ‘silica’ cuvette used turned out
to be glass which was opaque to UV
below 300 nm!)
The spectra in Figure 20 indicate
that the solution removes much of the
visible light between 440 and 550 nm
from the emission but certainly does not
remove any substantial proportion of the
wavelengths between 300 and 370 nm.
Figure 18: Emission spectrum of the BLB ‘black light’ fluorescent tube, showing a spread of emission wavelengths probably due to special phosphors.
Figure 16: Small BLB ‘black light’ fluorescent LWUV tube (4 watt) above a ‘germicidal’ SWUV mercury based (4 watt) fluorescent tube fitted with a CoSO4 solution filter and green sleeve.
Figure 17: Another view of the ‘germicidal’ SWUV tube shown in Figure 16.
Figure 19: Emission spectrum of the ‘germicidal’ SWUV fluorescent tube showing multiple sharp Hg lines. The spectrum is very similar to that of the GAAJ SWUV tube shown in Figure 4.
3500
3000
2500
2000
1500
1000
500
0300 310 320 330 340 350 360 370 380 390 400 410 420 430 440 450
wavelength (nm)
emis
sion
4000
3500
3000
2500
2000
1500
1000
500
0200 250 300 350 400 450 500 550 600 650 700 750 800 850
wavelength (nm)
emis
sion

The Journal of Gemmology / 2011 / Volume 32 / No. 5–8
Page 220
Review of ultraviolet sources for gem fluorescence and testing
The solution is not effective to isolate
SWUV from unwanted LWUV.
It is also well known that filters
of the Wood’s glass type suffer from
‘solarisation’ which is a progressive
loss of SWUV transparency and
performance with continued exposure
to SWUV which is chemically more
active than longer wavelengths (see also
Gleason4). Consequently, the SWUV
performance of frequently used SWUV
lamps may progressively deteriorate
and any fluorescence effect from the
accompanying LWUV can become even
more accentuated. Gleason4 (p.14)
and Strong5 (p.252) both suggest that
solarisation is remediable by carefully
heating the degraded glass filter in air
just below 550°F (290°C) for several
hours before slowly cooling to restore its
original SWUV transparency.
A SWUV tube of Philips manufacture
(TUV 4W 57416E/40) is shown in Figure
22. This is unshielded and unfiltered, and
gives a bright blue central discharge and
red glow around cold electrode terminals,
emitting the spectra in Figure 23(a) and
(b). These reveal the usual Hg lines at
254 and 365 nm and various other Hg
emission lines despite no liquid mercury
droplets being visible before ignition.
The electrode red glow spectrum,
shown in Figure 23(b), suggests that the
starter or carrier gas is probably neon with
its characteristic red discharge consisting
of numerous closely spaced sharp lines
in the red. These emissions should clearly
be excluded from any desired ultraviolet
content to avoid confusion with any
red fluorescence of the specimen. This
SWUV source is obviously very similar
to the filtered germicidal tube, and also
Figure 20: Emission spectra from the high-pressure mercury discharge lamp shown in Figure 21. (a) Unfiltered; (b) filtered by silica cuvette containing water; (c) filtered by silica cuvette containing CoSO4 and NiSO4 solution. Note that LWUV radiation between 300 and 370 nm is transmitted by this assembly.
Figure 21: High pressure mercury-discharge unshielded bulb used as a broadband source of discontinuous line discharge of SWUV and LWUV (a) and the bulb upon ignition (b).
3500
3000
2500
2000
1500
1000
500
0200 250 300 350 400 450 500 550 600 650 700 750 800
wavelength (nm)
emis
sion
3500
3000
2500
2000
1500
1000
500
0200 250 300 350 400 450 500 550 600 650 700 750 800
wavelength (nm)
emis
sion
3500
3000
2500
2000
1500
1000
500
0200 250 300 350 400 450 500 550 600 650 700 750 800
wavelength (nm)
emis
sion
a
b
c
ba
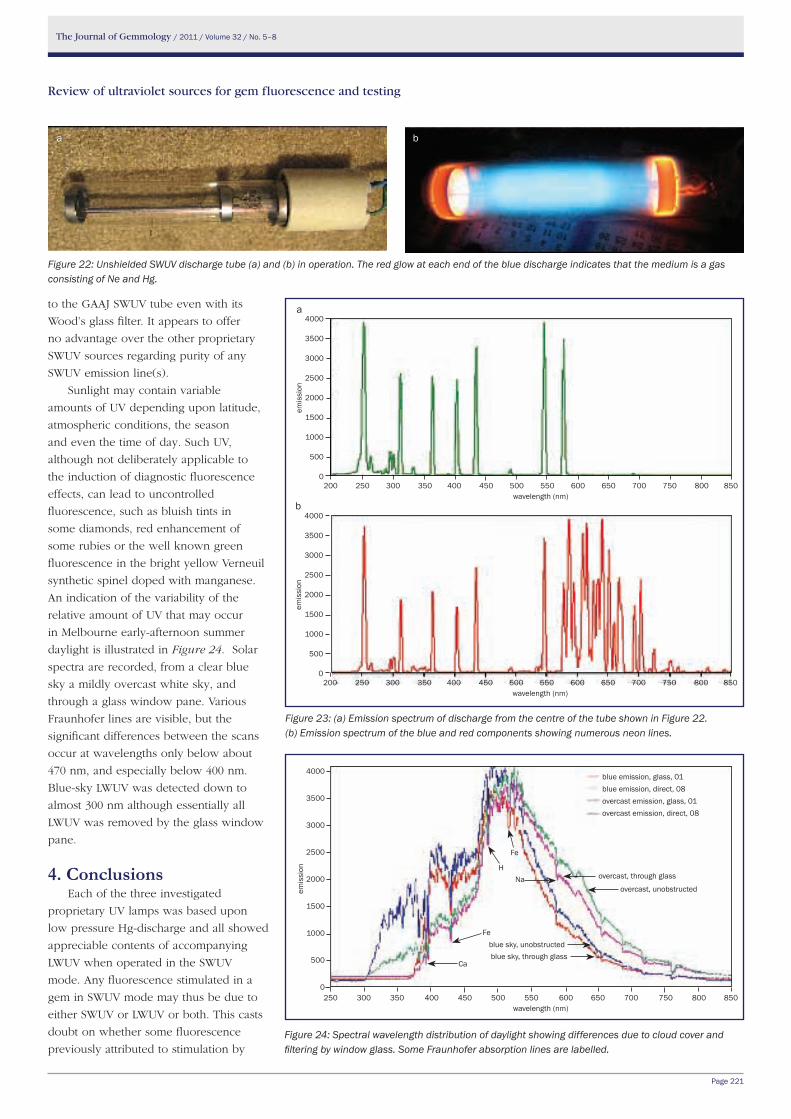
The Journal of Gemmology / 2011 / Volume 32 / No. 5–8
Page 221
Review of ultraviolet sources for gem fluorescence and testing
to the GAAJ SWUV tube even with its
Wood’s glass filter. It appears to offer
no advantage over the other proprietary
SWUV sources regarding purity of any
SWUV emission line(s).
Sunlight may contain variable
amounts of UV depending upon latitude,
atmospheric conditions, the season
and even the time of day. Such UV,
although not deliberately applicable to
the induction of diagnostic fluorescence
effects, can lead to uncontrolled
fluorescence, such as bluish tints in
some diamonds, red enhancement of
some rubies or the well known green
fluorescence in the bright yellow Verneuil
synthetic spinel doped with manganese.
An indication of the variability of the
relative amount of UV that may occur
in Melbourne early-afternoon summer
daylight is illustrated in Figure 24. Solar
spectra are recorded, from a clear blue
sky a mildly overcast white sky, and
through a glass window pane. Various
Fraunhofer lines are visible, but the
significant differences between the scans
occur at wavelengths only below about
470 nm, and especially below 400 nm.
Blue-sky LWUV was detected down to
almost 300 nm although essentially all
LWUV was removed by the glass window
pane.
4. ConclusionsEach of the three investigated
proprietary UV lamps was based upon
low pressure Hg-discharge and all showed
appreciable contents of accompanying
LWUV when operated in the SWUV
mode. Any fluorescence stimulated in a
gem in SWUV mode may thus be due to
either SWUV or LWUV or both. This casts
doubt on whether some fluorescence
previously attributed to stimulation by Figure 24: Spectral wavelength distribution of daylight showing differences due to cloud cover and filtering by window glass. Some Fraunhofer absorption lines are labelled.
Figure 22: Unshielded SWUV discharge tube (a) and (b) in operation. The red glow at each end of the blue discharge indicates that the medium is a gas consisting of Ne and Hg.
Figure 23: (a) Emission spectrum of discharge from the centre of the tube shown in Figure 22.(b) Emission spectrum of the blue and red components showing numerous neon lines.
4000
3500
3000
2500
2000
1500
1000
500
0200 250 300 350 400 450 500 550 600 650 700 750 800 850
wavelength (nm)
emis
sion
b
4000
3500
3000
2500
2000
1500
1000
500
0200 250 300 350 400 450 500 550 600 650 700 750 800 850
wavelength (nm)
emis
sion
a
a b
4000
3500
3000
2500
2000
1500
1000
500
0250 300 350 400 450 500 550 600 650 700 750 800 850
wavelength (nm)
emis
sion
blue emission, glass, 01blue emission, direct, 08overcast emission, glass, 01overcast emission, direct, 08
overcast, through glass
overcast, unobstructed
blue sky, through glassblue sky, unobstructed
NaH
Fe
Ca
Fe

The Journal of Gemmology / 2011 / Volume 32 / No. 5–8
Page 222
Review of ultraviolet sources for gem fluorescence and testing
SWUV actually occurs, especially in many
chromiferous gems. Unless the SWUV
fluorescence response is observably
different and distinguishable from any
LWUV induced fluorescence generated
by the accompanying contaminating
LWUV emissions, fluorescence supposedly
generated by 254 nm SWUV may actually
be due to the LWUV contaminating
‘bleed’. The contaminating LWUV ‘bleed’
in the SWUV mode may even be almost as
intense as in the nominal LWUV-emission
mode.
The excitation/fluorescence diagrams
obtained by Hoover suggest that many
LWUV-fluorescent gems, including
ruby for instance, may show negligible
fluorescence to shorter wavelengths — at
least down to 270 nm which was the limit
of that experiment. So, until exclusively
monochromatic or specific narrow-band
SWUV sources are available to the
gemmological fraternity, it is suggested
that any fluorescent responses in gems to
discharge tubes in the SWUV mode and
being used for identification purposes, are
treated with suspicion.
In both LW and SW modes the
emission spectra of the discharge tubes
indicate the presence of many emissions
at wavelengths in addition to those at
254 and 365 nm. In the SW region, these
include emissions at 265, 288 and 296
nm, and in the (nominal) LW region, at
303 and 313 nm. All or any could evoke
fluorescence that might otherwise be
attributed to the 254 nm emission which
in turn could result in an erroneous
interpretation. Also in the LW mode, the
nature of the ‘365 nm emission’ is in
reality broadband and only centred on 365
nm, and fluorescence could be stimulated
by any or all wavelengths in this range.
Again, erroneous interpretation could
result if stimulation by exclusively 365
nm emission was assumed. The selective
fluorescence response to particular LW
emissions is indicated in Hoover and
Theisen’s diagrams.
It is suggested that the output
from an ultraviolet lamp intended for
gemmological identification purposes,
both SWUV and LWUV ranges, should
be scanned spectrometrically. Any
fluorescence responses observed with
its use can then be interpreted with the
appreciation and knowledge of its actual
radiation, rather than simply assuming
that its emissions consist solely of the
254 nm SWUV Hg-line discharge and the
365 nm LWUV Hg-line discharges. Lamps
apparently intended primarily to develop
aesthetically attractive fluorescent-
display responses from minerals may
not be directly suitable for diagnosing
fluorescence in gems unless their spectral
emission content is known and the
response is appropriately interpreted.
LEDs are currently providing single-
band sources of LWUV but are not
readily available yet with emissions
in gemmologically useful SWUV
ranges. However, the LWUV bands just
below the visible range and down to
the Hg-discharge line at 365 nm are
eminently suited to develop fluorescence
economically and conveniently for
certain gemmological identifications.
LEDs generally do not develop single,
almost monochromatic emissions like
low pressure gas discharges, but emit
a single broadened band, typically
spanning as much as about 10 to 40 nm.
However, these compact and convenient
radiation sources are still very useful to
confirm LWUV fluorescence of commonly
responsive gem materials.
The proposal by Strong5 that a
solution of cobalt and nickel sulphates
would selectively filter out most of the
interfering LWUV, especially the 365
nm emission, from the required SWUV
emission, especially the 254 nm line,
was not substantiated. The indicated
concentrations of these salts removed
some undesirable visible wavelengths,
but unfortunately did little to diminish the
level of the interfering LWUV emissions
contaminating the SWUV range. There is
apparently still no reliable absorption filter
to be able to isolate the desired SWUV
radiation from interfering LWUV.
AcknowledgementsThe initial impetus for this
investigation was generated by Bear
Williams (Stonegroup Labs) and Dr
Don Hoover (retired from USGS),
of Missouri, USA. The subsequent
assistance, discussions and criticisms
from Dr Hoover and from Bear Williams
and the permission from Dr Hoover to
reproduce the excitation-fluorescence
spectrophotometric diagrams of
chromiferous materials compiled by
Hoover and Theisen at the USGS, are very
greatly appreciated.
References(1) Hoover, D.B., and Theisen, A.F., 1993.
Fluorescence excitation-emission
spectra of chromium bearing gems:
an explanation for the effectiveness of
the crossed filter method. Australian
Gemmologist, 18(6),182–7
(2) Hoover, D. and Williams, B., 2005.
Crossed Filters Revisited. Journal of
Gemmology, 29(7–8), 473–81
(3) Williams, B., 2007. Technology update-
ultraviolet light. The Guide, January/
February 2007, p.8–11, 16
(4) Gleason, S., 1972. Ultraviolet Guide
to Minerals. UltraViolet Products, San
Gabriel, CA
(5) Strong J., 1938. Modern Physical
Laboratory Practice. Blackie & Son
Ltd., London
(6) Bäckström, H.L.J., 1933. Ein
Lichtfilter für das mittlere Ultraviolett.
Naturwissenschaften, 21(13), 251
The authorGrant Pearson
Melbourne, Australia
email: [email protected]

Gem-A Photographic Competition
All Gem-A members are invited to participate. Once again there are four categories in which an image may be submitted:
1 Natural Digital photograph (including photomicrography) with minimal post-production work (may include basic cropping, contrast and minor hue/saturation adjustments).
2 Treated Digital photograph (including photomicrography) with significant post-production work (such as background manipulation, HDR, and contrast masking).
3 Synthetic Computer-rendered 3D models of gemstones, crystals, crystal structures, images from microtomography, etc.
4 Melange This category includes any gem-related image that doesn’t fit in the above and may include such things as photos of a spectrum, a scanning electron microscope image, mining, cutting, etc.
Winning entries will be announced at the Gem-A Conference 2012 and feature in Gems & Jewellery.
To enterPlease send a low resolution version of your photo to [email protected]. Entry forms and full details of the competition, including copyright information and Rules of Entry, can be accessed at www.gem-a.com/membership/photographic-competition.aspx or call Amandine on +44 (0)20 7404 3334.
Closing date: 29 June 2012
The GemmoloGical associaTion
of GreaT BriTain
Gem-A
UK registered charity no. 1109555
The 2012 Competition is now open! 2011 Photographic
Competition winners
Overall winner and winner of Natural category: Fibrous hematite and goethite aggregates in quartz
from Minas Gerais. © Michael Hügi.
Winner of Treated category: Blue anatase crystal and rutile fibres in quartz from
Minas Gerais. © Michael Hügi.
Winner of Melange category: Cut cultured pearls in round slices. © Keiko Kon and
Gem Science Academy of Gemology, Tokyo.
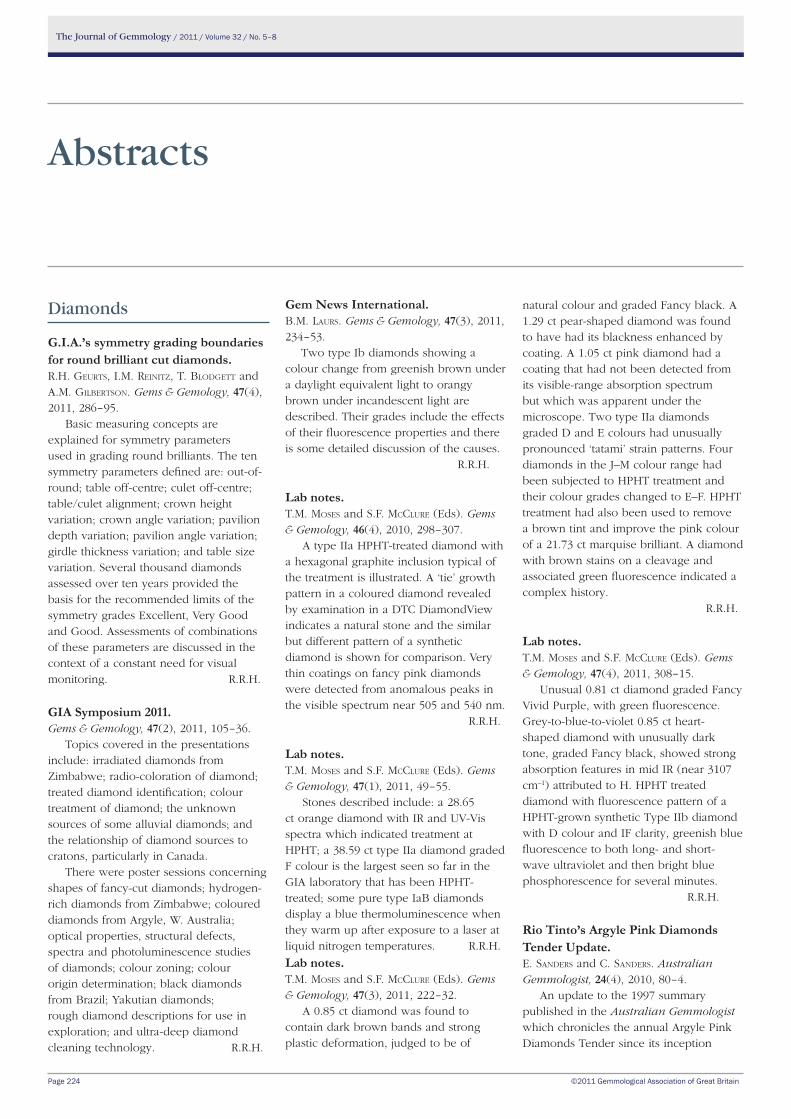
The Journal of Gemmology / 2011 / Volume 32 / No. 5–8
Page 224
Abstracts
Diamonds
G.i.a.’s symmetry grading boundaries for round brilliant cut diamonds.R.H. GeuRts, I.M. ReInItz, t. BlodGett and a.M. GIlBeRtson. Gems & Gemology, 47(4), 2011, 286–95.
Basic measuring concepts are explained for symmetry parameters used in grading round brilliants. The ten symmetry parameters defined are: out-of-round; table off-centre; culet off-centre; table/culet alignment; crown height variation; crown angle variation; pavilion depth variation; pavilion angle variation; girdle thickness variation; and table size variation. Several thousand diamonds assessed over ten years provided the basis for the recommended limits of the symmetry grades Excellent, Very Good and Good. Assessments of combinations of these parameters are discussed in the context of a constant need for visual monitoring. R.R.H.
Gia symposium 2011.Gems & Gemology, 47(2), 2011, 105–36.
Topics covered in the presentations include: irradiated diamonds from Zimbabwe; radio-coloration of diamond; treated diamond identification; colour treatment of diamond; the unknown sources of some alluvial diamonds; and the relationship of diamond sources to cratons, particularly in Canada.
There were poster sessions concerning shapes of fancy-cut diamonds; hydrogen-rich diamonds from Zimbabwe; coloured diamonds from Argyle, W. Australia; optical properties, structural defects, spectra and photoluminescence studies of diamonds; colour zoning; colour origin determination; black diamonds from Brazil; Yakutian diamonds; rough diamond descriptions for use in exploration; and ultra-deep diamond cleaning technology. R.R.H.
Gem news international.B.M. lauRs. Gems & Gemology, 47(3), 2011, 234–53.
Two type Ib diamonds showing a colour change from greenish brown under a daylight equivalent light to orangy brown under incandescent light are described. Their grades include the effects of their fluorescence properties and there is some detailed discussion of the causes. R.R.H.
lab notes.t.M. Moses and s.F. MccluRe (Eds). Gems & Gemology, 46(4), 2010, 298–307.
A type IIa HPHT-treated diamond with a hexagonal graphite inclusion typical of the treatment is illustrated. A ‘tie’ growth pattern in a coloured diamond revealed by examination in a DTC DiamondView indicates a natural stone and the similar but different pattern of a synthetic diamond is shown for comparison. Very thin coatings on fancy pink diamonds were detected from anomalous peaks in the visible spectrum near 505 and 540 nm.
R.R.H.
lab notes.t.M. Moses and s.F. MccluRe (Eds). Gems & Gemology, 47(1), 2011, 49–55.
Stones described include: a 28.65 ct orange diamond with IR and UV-Vis spectra which indicated treatment at HPHT; a 38.59 ct type IIa diamond graded F colour is the largest seen so far in the GIA laboratory that has been HPHT-treated; some pure type IaB diamonds display a blue thermoluminescence when they warm up after exposure to a laser at liquid nitrogen temperatures. R.R.H.
lab notes.t.M. Moses and s.F. MccluRe (Eds). Gems & Gemology, 47(3), 2011, 222–32.
A 0.85 ct diamond was found to contain dark brown bands and strong plastic deformation, judged to be of
natural colour and graded Fancy black. A 1.29 ct pear-shaped diamond was found to have had its blackness enhanced by coating. A 1.05 ct pink diamond had a coating that had not been detected from its visible-range absorption spectrum but which was apparent under the microscope. Two type IIa diamonds graded D and E colours had unusually pronounced ‘tatami’ strain patterns. Four diamonds in the J–M colour range had been subjected to HPHT treatment and their colour grades changed to E–F. HPHT treatment had also been used to remove a brown tint and improve the pink colour of a 21.73 ct marquise brilliant. A diamond with brown stains on a cleavage and associated green fluorescence indicated a complex history. R.R.H.
lab notes.t.M. Moses and s.F. MccluRe (Eds). Gems & Gemology, 47(4), 2011, 308–15.
Unusual 0.81 ct diamond graded Fancy Vivid Purple, with green fluorescence. Grey-to-blue-to-violet 0.85 ct heart-shaped diamond with unusually dark tone, graded Fancy black, showed strong absorption features in mid IR (near 3107 cm–1) attributed to H. HPHT treated diamond with fluorescence pattern of a HPHT-grown synthetic Type IIb diamond with D colour and IF clarity, greenish blue fluorescence to both long- and short-wave ultraviolet and then bright blue phosphorescence for several minutes. R.R.H.
rio Tinto’s argyle Pink Diamonds Tender Update. e. sandeRs and c. sandeRs. Australian Gemmologist, 24(4), 2010, 80–4.
An update to the 1997 summary published in the Australian Gemmologist which chronicles the annual Argyle Pink Diamonds Tender since its inception
©2011 Gemmological Association of Great Britain

The Journal of Gemmology / 2011 / Volume 32 / No. 5–8
Page 225
Abstracts (continued)
in 1985. New information includes: an overview of the unique Argyle Pink Diamonds’ colour grading system; the girdle laser inscription instituted in late 2004 for diamonds over 0.20 ct and later in 2009, stones over 0.15 ct; notable diamonds since 2000, as well as a chart showing each year’s offerings since 1985. E.A.S.
Gems and Minerals
research on gem feldspar from the shigatse region of Tibet.a. aBduRIyIM and 11 other authors. Gems & Gemology, 47(2), 2011, 167–80.
Andesine was collected from Zha Lin and Yu Lin Gu about 55 km SE of Shigatse, Tibet. The samples are up to 2 cm across and most are red, some having blue-green or patchy red areas. They contain twin lamellae, turbid clouds, channels and some tiny copper grains or platelets. Glass residues are present on the surfaces and in cavities in some of the samples, but spectral and chemical analysis failed to establish the origin of the residue. Microprobe and LA-ICP-MS analyses were made of the samples and the latter indicated distinctly high amounts of silver in the rims of those from Yu Lin Gu. Powder X-ray diffraction results indicate that the andesines from Zha Lin and Yu Lin Gu had not been treated at high temperature; this conclusion is supported by argon isotope studies. It was noted that no andesines were collected that had adhering rock (volcanic) matrix, and in the Yu Lin Gu area, andesines were not found at depths of more than a few cm. R.R.H.
ivory carving in Germany.M. caMpBell pedeRsen. Gems & Jewellery, 19(4), 2010, 20–2.
An outline of a unique German museum specializing in ivory and the history of carving. Based in Erbach, the museum’s exhibits span over 300 years of historic ivory use, and the accompanying photographs within the article show some of these carved items (including the iconic Erbach Ivory Rose). The museum is a working example of the carving craft, in all its forms. A.S.F.
Brownish red zircon from muling, china. t. cHen, H. aI, M. yanG, s. zHenG and y. lIu. Gems & Gemology, 47(1), 2011, 36–41.
Zircon occurs in alluvium derived from alkali basalt and is associated with other minerals of gem quality such as sapphire, spinel and garnet. RIs of >1.81 and SGs between 4.57–4.69 were determined, and apatite, metamict zircon, magnetite and dark ovoid glass inclusions were recorded. EPMA and LA-ICP-MS analyses indicate the presence of REE with up to 2440 ppm Th and 871 ppm U, which results are consistent with absorption peaks in the UV-Vis-NIR spectra. Raman spectra are recorded and samples subjected to heat treatment
changed colours to lighter hues. R.R.H.
and now composite chalcedony.G. cHoudHaRy. Gems & Jewellery, 19(4), 2010, 28–30.
As part of a series of articles published in various gemmological texts, Choudhary discusses a new composite stone consisting of chalcedony held in resins. A detailed table is provided with identifying features and results that cover observational and advanced laboratory techniques. Although readily identified as a composite, the analytical methods to identify the component parts give an insight into production techniques. A.S.F.
Greenish yellow zoisite. G. cHoudHaRy. Australian Gemmologist, 24(4), 2010, 90–1.
An 8.33 ct faceted greenish yellow gemstone, at first glance resembling tourmaline, quickly reveals it is otherwise when striking strong trichroism is observed: yellow, blue and purplish pink. Standard gemmological testing indicates the specimen is zoisite; confirmed by FTIR spectral patterns and qualitative EDXRF analysis (major elements: Al, Si, Ca and Sr, with traces of V and Fe). E.A.S.
serpentine crystal with purple-red transmission. G. cHoudHaRy. Australian Gemmologist, 24(7), 2011, 164–6.
Having been sold as alexandrite, a bluish-green crystal showing purplish-red coloration in transmitted light is found to be a member of the serpentine
family. The tabular monoclinic crystal was revealed with EDXRF analysis to contain Mg, Si, Cr, Fe and Ni. These results and those of FTIR spectroscopy were both consistent with those of serpentine. The cause of the purplish red transmission remains unknown, but this and several other specimens mined in Andhra, Pradesh, Southern India, have recently been seen by the Gem Testing Laboratory of Jaipur — all represented as alexandrite in the marketplace. E.A.S.
a chatoyant malachite. G. cHoudHaRy. Australian Gemmologist, 24(2), 2010, 44–5.
A 9.57 ct green cat’s-eye cabochon was confirmed to be malachite by standard gemmological testing along with FTIR spectroscopy and EDXRF. The eye was exhibited as a broad band, reminiscent of lower-grade cat’s-eye quartz. This appears to be the first published report of chatoyant malachite, though an Internet search did turn up offerings of such material, predominantly as rough or tumbled specimens or as beads. E.A.S.
mariupolite from the oktyabrsky massif (se Ukraine) — a less well known rock in the gemstone trade.M. duManska-słowIk, p. BaRanov, w. HeFlIk, l. natkanIec-nowak, s. sHevcHenko and l.I. tsotsko. Gemmologie. Z. Dt. Gemmol. Ges., 60(1/2), 2011, 37–48. 16 photographs, 1 map, 1 geology map, bibl. [English with a German abstract.]Mariupolite is a nepheline syenite rock from the south eastern Ukraine. A diversity of colours and texture is caused by variable mineral composition, the main constituents being albite, nepheline and aegirine. Those materials containing sodalite are suitable for jewellery components, clocks, vases, ashtrays and for the production of facing stones both for indoor and outdoor use. E.S.
Topaz crystals from various geological settings. M. duManska-słowIk, J. FIJał and l. natkanIec-nowak. Gemmologie. Z. Dt. Gemmol. Ges., 60(3/4), 2011, 87–104. 16 photographs,7 graphs, 6 tables, bibl.[English with German abstract.]
This paper deals with topaz crystals

The Journal of Gemmology / 2011 / Volume 32 / No. 5–8
Page 226
Abstracts (continued)
from various geological settings, such as rhyolites, pegmatites, greisens and hydrothermal veins. Topaz crystals have various mineral and fluid inclusions, but have a fairly constant composition although they have different mineral associations. The major difference found in the samples is the F/OH ratio. Topaz from Ouro Preto, Brazil, has the highest content of the hydroxyl groups. The lowest amount of the hydroxyl groups and the highest fluorine content were found in topaz from the Thomas range in the U.S.A. Crystals from Volodarsk-Volynsky exhibit the most ordered lattice, while those from Ouro Preto have the
most defects in their structure. E.S.
Gia symposium 2011.Gems & Gemology, 47(2), 2011, 107–53.
Topics covered in the presentations include: the geological conditions for formation of ruby, emerald and alexandrite; pegmatites; opals from Ethiopia; origin determination; Australian opal nomenclature; lavender jadeite from Myanmar, Guatemala and Japan; natural colour tanzanite; durability of treated ruby and sapphire; archaeogemmology of peridot; natural and treated nephrite in China; the use of photoluminescence spectra in determining growth media and colour origins in cultured pearls; review of the range of testing methods used to distinguish natural and cultured pearls and their treatments.
There were poster sessions concerning blue and pink sapphires from Muling, N.E. China; a review of gems in southern Brazil; ruby from Liberia; petrogenesis of the Stewart pegmatite, Pala, CA; ruby overgrowths on painite from Mogok, Myanmar; gemstones from Mexico; tourmaline from the Pederneira pegmatite, Minas Gerais; blue cristobalite (described as opal) from Rio Grande do Sul; world production figures for coloured gems compiled by the U.S. Geological Survey; tourmalines from Madagascar; use of discriminant analysis for identifying coloured stone sources and for distinguishing HPHT-treated from untreated diamonds; review of the range of quartz varieties and some notable gems tested in the Jaipur laboratory; exotically coloured Chinese freshwater cultured pearls; non-nacreous pearls from the giant clam; roundness and lustre
variations in cultured pearls and their relations to grafting methods in Pinctada margaritifera; experiments to test ancient treatment techniques on gems; Oregon sunstones compared from two deposits; changes in colour of various sapphires by electron beam irradiation; experiments on the effects on sapphires of heating them with Be; the spectra of some gem tourmalines; and some new artificially asteriated gemstones. R.R.H.
Black Beauty.k. GReGoRy. Gems & Jewellery, 19(4), 2010, 34–6.
Kerry Gregory’s experiences of testing a faceted checkerboard style black opaque stone set into a pendant. Although not conclusively identified, the processes and reasoning involved show how cut and setting can affect and limit the choice of tests available. A full table of possible gem materials is provided, along with explanations of how certain materials were discounted. A.S.F.
Jaded.k. GReGoRy, Gems & Jewellery, 20(1), 2011, 15–17.
Reviewing a talk at the South-West Branch by Edward Johnson on Jadeite, this article looks at the possible alternatives to jadeite (tabulated), and highlights some precautionary tales. A.S.F.
Three-dimensional X-ray radiography.t. HaInscHwanG. Gems & Jewellery, 20(1), 2011, 11–14.
Micro X-ray tomography is a new technique that allows pearls and other gem materials to be represented in three dimensions in sufficiently high quality to allow detailed analysis. Whilst not suitable or cost effective for everyday use, a more viable alternative system has been designed that allows 3D films to be produced for analysis of inclusions/fillers, and in particular allow the nature of pearls to be determined. With the advent of cultured pearls using smaller pearls as bead nuclei, this technology will become more important, and is currently in use on all pearls sent to the GEMLAB (Liechtenstein) laboratory. A.S.F.
explaining the flame structure of non-nacreous pearls. H. HännI. Australian Gemmologist, 24(4),
2010, 85–8.Through conventional microscopy
and scanning electron microscopy (SEM), the flame structure of porcellaneous pearls is revealed and the appearance of the optical phenomenon is explained. Since the same structures are present in the shells of the molluscs from which the pearls originate (including Melo, Tridacna, Strombus gigas), such shells may be sacrificed for analytical work. At magnification of 500x, Tridacna shell reveals a crisscross structure of fibrous aragonite lamellae which alternately reflect and absorb light, producing spectral colours due to interference when found at a thickness of 500 nm. Other species exhibit different patterns of the same dull and bright effect, depending on how the fibrous aragonite bundles of ultra-fine fibres, laths or lamellae are arranged. E.A.S.
neues aus china: ming Perlen. H. HännI. Gemmologie. Z. Dt. Gemmol. Ges., 60(3/4), 2011, 105–10. 7 photographs, bibl. [German with English abstract.]
These cultured pearls are similar to the Japanese cultured pearls ‘Kasumiga-ura’. They are freshwater, beaded and gonad grown. These new Ming pearls are round, often larger than 15 mm, and are white or pastel-coloured due to their producing shell which is a hybrid of Hyriopsis schlegeli and Hyriopsis cumingii. E.S.
Das farbenspektrum der Quarze. u. Henn and R.scHultz-GüttleR.Gemmologie. Z. Dt. Gemmol. Ges., 60(3/4), 2011, 63–86. 17 photographs, 1 table, 8 graphs, 2 flow-sheets, bibl. [German with English abstract.]
Macro-crystalline quartz can be classified into several groups. Iron-bearing quartz is represented by amethyst which can be thermally modified to yellow or green. Prasiolite changes from blue to violet by irradiation and thermal treatment. Light amethyst can be thermally improved to lilac.
Aluminium-bearing quartz appears yellow (citrine) or brown (smoky quartz) or black (morion) which can be changed into greenish-yellow lemon quartz by heat treatment. Water-containing quartz can be modified to green by irradiation. Rose quartz is formed by adding dumortierite

The Journal of Gemmology / 2011 / Volume 32 / No. 5–8
Page 227
Abstracts (continued)
or produced by substitution of silicon by phosphorus.
Both iron-bearing and aluminium-bearing quartz can appear as multi-coloured stones. This article shows colour and colour modification as well as the absorption spectra and other testing methods such as pleochroism, twinning
and IR-spectra. E.S.
spinels from Ywathit, Kayah state, myanmar. u.t. HlaInG, w. atIcHat, and c. suttHIRat. Australian Gemmologist, 24(3), 2010, 61–3.
A description of the spinels found in alluvial deposits in the area of Bawlake Township, southeast of Ywathit in the eastern part of Myanmar. These apparently originated from the Pawn Chaung Series mountain range, north of Ywathit between the Salween River and Pawn Chaung. These mountains consist of schist and a fine-grained sugary white-grey marble. Chemical analysis of the spinels was conducted using Electron Probe Micro-Analyser (EPMA) and results are presented in chart form. A photograph illustrates the gems alongside a red and black Abrus precatorius seed. Also known as wild liquorice (English) and Ywe gale or Ywe nge (Burmese), these seeds are of a uniform 0.5 cm size and 0.5 ct weight and have been used locally as a unit of measurement for precious stones and metals. E.A.S.
a microstructural study of pietersite from namibia and china. k. Hu and p.J. Heaney. Gems & Gemology, 47(4), 2011, 280–6.
Pietersite specimens from the two main sources, Kuraman, Namibia, and Xichuan, Henan Province, China, are mixed rocks largely blue-grey, golden and white (Namibian) or red brown and white (Chinese). They consist of major quartz or chalcedony, less calcite, and fibrous crocidolite (magnesioriebeckite) or chlorite embedded in (but not replaced by) the quartz; the latter structure gives rise to the rather contorted chatoyancy of the specimens. Gemmological properties of stones from the two localities are similar although the Namibian pietersite tends to be more fluorescent and have a higher SG, and in thin section, crocidolite
in the Chinese samples is seen to be intensely coated with hematite. R.R.H.
aquamarine from the Thuong Xuan District, Thanh hoa Province, Vietnam.l.t-t. HuonG, w. HoFMeIsteR, t. HäGeR, n.n. kHoI, n.t. nHunG, w. atIcHat and v. pIsutHa-aRnond. Gems & Gemology, 47(1), 2011, 42–8.
Aquamarines from eluvial deposits derived from pegmatites intruding granites of Paleogene age are light to medium blue, elongate crystals up to 4.5 cm long. They contain biotite and hematite crystal inclusions and ubiquitous two-phase inclusions in channels. Their Fe and Cs contents are high compared with other aquamarines, and Raman and IR spectra indicate the presence of type I H
2O and
CO2 in the channels. R.R.H.
synthetischer smaragd – Topas – Dublette. J. HyRsl and u. Henn.Gemmologie. Z. Dt. Gemmol. Ges., 60(3/4), 2011, 111–12. 3 photographs. [German with English abstract.]
This interesting doublet comes from India. The upper part is a synthetic emerald, the lower a colourless topaz. E.S.
scottish agates.B. Jackson. Gems & Jewellery, 20(1), 2011, 3–9.
An in-depth look at agates, which have been used as artefacts for over 9000 years. Through the use of photographs showing different formations of banding and other structural features, the controversy over the genesis of agates and the difficulties in forming a single explanation as to the structural mechanisms is explored. A.S.F.
UV-Vis-nir reflectance spectroscopy of natural-color saltwater cultured pearls from Pinctada margaritifera.s. kaRaMpelas, e. FRItscH, J.-p. GautHIeR and t. HaInscHwanG. Gems & Gemology, 47(1), 2011, 31–5.
UV-Vis-NIR spectra of a range of colours of these pearls from shells grown in the Pacific Ocean revealed nine visible-range absorption features. One of these at 405 nm is attributed to uroporphyrin, but
the attributions of the remainder are the
subject of further work. R.R.H.
infrared spectroscopy of natural vs. synthetic amethyst: an update.s. kaRaMpelas, e. FRItscH, t. zoRBa and k.M. paRaskevopoulos. Gems & Gemology, 47(3), 2011, 196–201.
When traditional gemmological techniques are inadequate to enable distinction between natural and synthetic amethyst, detection and study of the 3595 cm–1 absorption band at high resolution in the IR spectrum could lead to a reliable decision. But this criterion should be used along with other properties discussed; it is not valid for amethysts with large near-colourless zones. R.R.H.
a study of the gems in a ciborium from einsiedeln abbey.s. kaRaMpelas, M. wöRle, k. HunGeR, H. lanz, .d. BeRsanI and s. GüBelIn. Gems & Gemology, 46(4), 2010, 292–6.
This late sixteenth century treasure from a Benedictine abbey contains ten pinkish red stones (almandine), four orange (grossular) and three pale blue (sapphire) stones, identified by means of microscopy, EDXRF and Raman spectroscopy. Respectively they had been labelled ruby, hyacinth and sapphire by Fr. Tonassini around 1798. Their features and styles of cut are consistent with an origin in Sri Lanka. R.R.H.
ruby and sapphire from the Tan huong – Truc lau area, Yen Bai Province, northern Vietnam.n.n. kHoI, c. suttHIRat, d.a. tuan, n.v. naM, n.t.M. tHuyet and n.t. nHunG. Gems & Gemology, 47(3), 2011, 182–95.
Rubies and pink sapphires are recovered from gneisses, amphibolites and marbles in the Red River Shear Zone, NW of Hanoi, and from eluvial and alluvial deposits nearby. Associated gem minerals included spinel, garnet and trapiche-like sapphire. Most rubies are cabochon quality but there are many good quality stones and they tend to come from the secondary deposits. Stones from this area are compared with those from older mines about 15 km away in the Khoan Thong-An Phu area and their inclusions, identified using microprobe analyses and Raman spectra, are abundant, including
The Journal of Gemmology / 2011 / Volume 32 / No. 5–8
Page 228
Abstracts (continued)
rutile, ilmenite, zircon, apatite, spinel, diaspore and calcite. The deposits yield many star stones and corundum crystals with spinel overgrowths are not uncommon. R.R.H.
a historic turquoise jewelry set containing fossilized dentine (odontolite) and glass.M.s. kRzeMnIckI, F. HeRzoG and w. zHou. Gems & Gemology, 47(4), 2011, 296–301.
Six mid-nineteenth century brooches set with diamonds and pale blue cabochons were examined using microscopy, and Raman and EDXRF spectroscopy. Most of the pale blue stones proved to be odontolite (fluorapatite), but some were turquoise and some artificial glass. Features seen on some of the odontolite surfaces include micropores, weak banding and curved bands showing
intersections (cf. elephant ivory). R.R.H.
Gem news international.B.M. lauRs (ed.). Gems & Gemology, 46(4), 2010, 309–31.
Stones described include: clear yellow amber with pyrite and other mineral inclusions; Tibetan andesine at its alleged source; aquamarine from Vietnam and Madagascar; heliodor probably from Cambodia; diopside from Pakistan; the ‘Carolina Emperor’, an emerald from Hiddenite, N. Carolina, and the largest cut emerald from N. America; emerald in matrix from Bahia, Brazil; fifth century ad jewellery containing red garnets from Romania; natural pearls in Pinctada radiata shells in the waters off Bahrain; updates on sapphire mining in Pakistan, Afghanistan and Madagascar, and the rediscovery of sapphires in the Auvergne, Massif Centrale, France; a 16.17 ct green stone was identified as spodumene and while being examined under a fibre optic light became bright orange, displaying thermoluminescence, returning to green on cooling; four faceted oval greenish blue stones resembled Paraíba tourmaline but their compositions fall in the liddicoatite field, not the elbaite field of
Paraíba stones. R.R.H.
Gem news international.B.M. lauRs (ed.). Gems & Gemology, 47(1), 2011, 56–73.
Stones mentioned include Vietnamese
spinels with a range of colours; a new find of green grossular in Tanzania; blue quartz cabochons coloured by trolleite and lazulite inclusions from Minas Gerais; quartz with spectral interference colours caused by twinning along internal minor rhombohedral directions; yellow scapolite from Tamil Nadu, India; scapolite also from Afghanistan, colourless and blue and fluorescing yellow; yellow-brown pargasite from Tanzania; spectacular blue and green tourmalines from Mt. Marie, Paris, Maine; and the rare gems cavansite
and zektzerite. R.R.H.
Gem news international.B.M. lauRs (ed.). Gems & Gemology, 47(3), 2011, 234–53.
A recent import from Afghanistan, gem-quality afghanite (a member of the cancrinite group of feldspathoid minerals, its identity confirmed by microprobe analysis) is pale to medium blue resembling aquamarine and is probably from the Sar-e-Sang region of Badakshan. The regional context of aquamarine deposits on the west side of Thanh Hoa Province in northern Vietnam is described. Iridescent ammonites from southern Madagascar have been known for more than ten years and are now being fashioned into cabochons and some are sold as ‘Madammolite’. Fine blue chalcedony and an intense red-brown sard or carnelian are described from Peru, and there is an update on emerald mining in Afghanistan. A new deposit of colour-change garnets in southern Tanzania has been found; their compositions are comparable with those from Bekily, Madagascar. Iridescent amphibole from Mauritania closely resembles the variety ‘Nuummite’ from Greenland although the Mauritanian colours are blue- to yellow-green rather than golden. Other stones mentioned include blue opal from Sinaloa, Mexico (to be marketed as ‘Lightning Blue Opal’); pallasite pendants fashioned from the Esquel meteorite, a rare type of stony iron meteorite; cat’s-eye quartz in which the colour and chatoyant effect are provided by pink tourmaline needles; green cat’s-eye spodumene from Araçuai, Minas Gerais; and variscite from Peru. Chinese freshwater cultured pearls are described with off-round (baroque) beads which were produced from an alleged hybrid of Hyriopsis cumingii and
Hyriopsis schlegelii whose shell has an unusual shape and intense iridescence. An oval black cabochon sold as a star sapphire was eventually considered to be a corundum-glass-corundum triplet.
R.R.H.
Gem news international.B.M. lauRs (ed.). Gems & Gemology, 47(4), 2011, 316–34.
Stones and topics covered include: small gem-quality golden yellow chondrodites from Tanzania; blue dolomite with three-phase inclusions from the Muzo emerald mine in Colombia; orange and purple zoned fluorite cut and polished as small slabs for silver pendants from Namibia; two sections on opal: common opal from Laverton, W. Australia — red (fire opal), yellow and pale blue, all near-transparent and faceted; a hydrophane opal cabochon, probably from Ethiopia, with one end a white body colour with predominant blue and green iridescent colours, and the other end a brown body colour with much redder iridescence; three sections on quartz: a red cat’s-eye quartz cabochon whose minute slender inclusions were identified as cinnabar; a marquise-shaped cabochon of colourless quartz with included elongate prisms of emerald; a skull carved in quartz by Harold van Pelt which has a network of silver grey submetallic inclusions identified as izoklakeite, a lead-antimony sulphide with some copper; colour-change titanite (sphene) from the Pakistan-Afghanistan border area containing vanadium but no chromium; blue spinel from Vietnam; pinkish orange to red spinel from Mogok, Myanmar, which shows a trapiche structure, best viewed in transmitted light. Imitations described include: black ‘pearls’ sculpted from calcite and showing a cat’s-eye effect; and four large synthetic quartzes variously described as amethyst, citrine and two aquamarines. Experimental sugar-acid treatment of Ethiopian opal is also described to make future possible detection easier. R.R.H.
Gemmological news.c.c. MIlIsenda and k. scHollenBRucH. Gemmologie. Z. Dt. Gemmol. Ges., 60(1/2), 2011, 3–8. 10 photographs.
The authors report on two intense dark blue sapphires (5.42 ct and 4.78 ct)
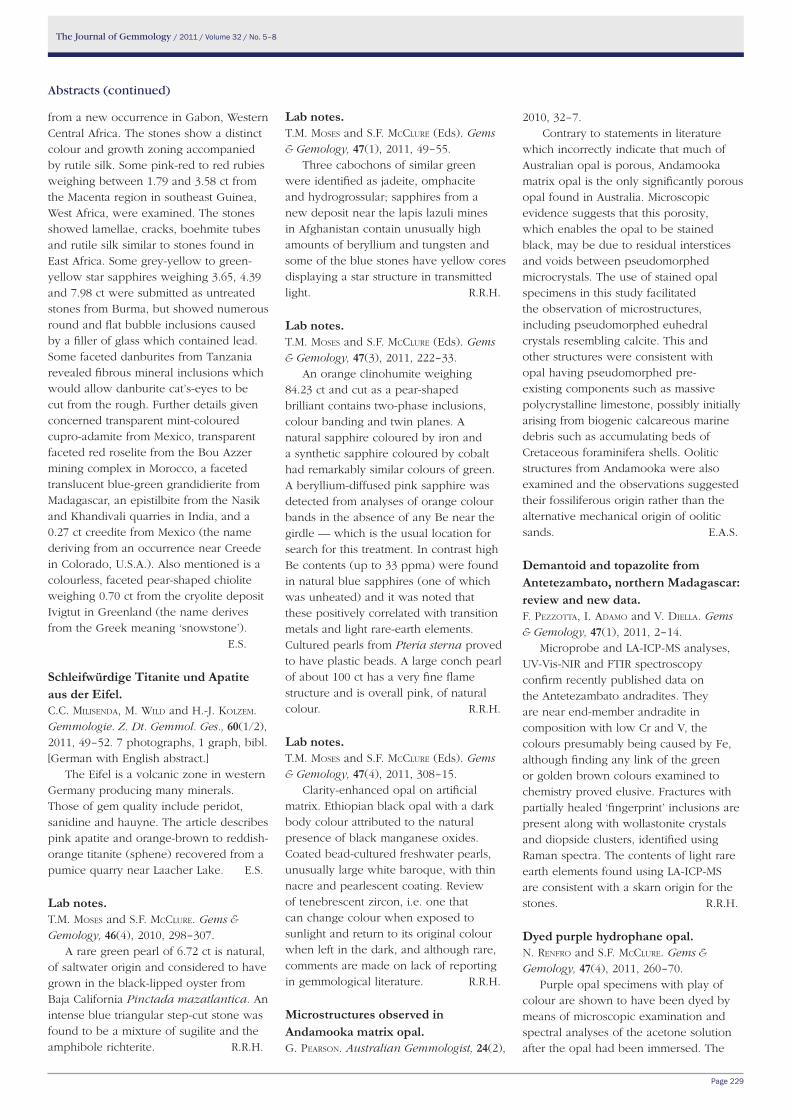
The Journal of Gemmology / 2011 / Volume 32 / No. 5–8
Page 229
Abstracts (continued)
from a new occurrence in Gabon, Western Central Africa. The stones show a distinct colour and growth zoning accompanied by rutile silk. Some pink-red to red rubies weighing between 1.79 and 3.58 ct from the Macenta region in southeast Guinea, West Africa, were examined. The stones showed lamellae, cracks, boehmite tubes and rutile silk similar to stones found in East Africa. Some grey-yellow to green-yellow star sapphires weighing 3.65, 4.39 and 7.98 ct were submitted as untreated stones from Burma, but showed numerous round and flat bubble inclusions caused by a filler of glass which contained lead. Some faceted danburites from Tanzania revealed fibrous mineral inclusions which would allow danburite cat’s-eyes to be cut from the rough. Further details given concerned transparent mint-coloured cupro-adamite from Mexico, transparent faceted red roselite from the Bou Azzer mining complex in Morocco, a faceted translucent blue-green grandidierite from Madagascar, an epistilbite from the Nasik and Khandivali quarries in India, and a 0.27 ct creedite from Mexico (the name deriving from an occurrence near Creede in Colorado, U.S.A.). Also mentioned is a colourless, faceted pear-shaped chiolite weighing 0.70 ct from the cryolite deposit Ivigtut in Greenland (the name derives from the Greek meaning ‘snowstone’). E.S.
schleifwürdige Titanite und apatite aus der eifel.c.c. MIlIsenda, M. wIld and H.-J. kolzeM. Gemmologie. Z. Dt. Gemmol. Ges., 60(1/2), 2011, 49–52. 7 photographs, 1 graph, bibl. [German with English abstract.]
The Eifel is a volcanic zone in western Germany producing many minerals. Those of gem quality include peridot, sanidine and hauyne. The article describes pink apatite and orange-brown to reddish-orange titanite (sphene) recovered from a pumice quarry near Laacher Lake. E.S.
lab notes.t.M. Moses and s.F. MccluRe. Gems & Gemology, 46(4), 2010, 298–307.
A rare green pearl of 6.72 ct is natural, of saltwater origin and considered to have grown in the black-lipped oyster from Baja California Pinctada mazatlantica. An intense blue triangular step-cut stone was found to be a mixture of sugilite and the amphibole richterite. R.R.H.
lab notes.t.M. Moses and s.F. MccluRe (Eds). Gems & Gemology, 47(1), 2011, 49–55.
Three cabochons of similar green were identified as jadeite, omphacite and hydrogrossular; sapphires from a new deposit near the lapis lazuli mines in Afghanistan contain unusually high amounts of beryllium and tungsten and some of the blue stones have yellow cores displaying a star structure in transmitted light. R.R.H.
lab notes.t.M. Moses and s.F. MccluRe (Eds). Gems & Gemology, 47(3), 2011, 222–33.
An orange clinohumite weighing 84.23 ct and cut as a pear-shaped brilliant contains two-phase inclusions, colour banding and twin planes. A natural sapphire coloured by iron and a synthetic sapphire coloured by cobalt had remarkably similar colours of green. A beryllium-diffused pink sapphire was detected from analyses of orange colour bands in the absence of any Be near the girdle — which is the usual location for search for this treatment. In contrast high Be contents (up to 33 ppma) were found in natural blue sapphires (one of which was unheated) and it was noted that these positively correlated with transition metals and light rare-earth elements. Cultured pearls from Pteria sterna proved to have plastic beads. A large conch pearl of about 100 ct has a very fine flame structure and is overall pink, of natural colour. R.R.H.
lab notes.t.M. Moses and s.F. MccluRe (Eds). Gems & Gemology, 47(4), 2011, 308–15.
Clarity-enhanced opal on artificial matrix. Ethiopian black opal with a dark body colour attributed to the natural presence of black manganese oxides. Coated bead-cultured freshwater pearls, unusually large white baroque, with thin nacre and pearlescent coating. Review of tenebrescent zircon, i.e. one that can change colour when exposed to sunlight and return to its original colour when left in the dark, and although rare, comments are made on lack of reporting in gemmological literature. R.R.H.
microstructures observed in andamooka matrix opal. G. peaRson. Australian Gemmologist, 24(2),
2010, 32–7.Contrary to statements in literature
which incorrectly indicate that much of Australian opal is porous, Andamooka matrix opal is the only significantly porous opal found in Australia. Microscopic evidence suggests that this porosity, which enables the opal to be stained black, may be due to residual interstices and voids between pseudomorphed microcrystals. The use of stained opal specimens in this study facilitated the observation of microstructures, including pseudomorphed euhedral crystals resembling calcite. This and other structures were consistent with opal having pseudomorphed pre-existing components such as massive polycrystalline limestone, possibly initially arising from biogenic calcareous marine debris such as accumulating beds of Cretaceous foraminifera shells. Oolitic structures from Andamooka were also examined and the observations suggested their fossiliferous origin rather than the alternative mechanical origin of oolitic sands. E.A.S.
Demantoid and topazolite from antetezambato, northern madagascar: review and new data.F. pezzotta, I. adaMo and v. dIella. Gems & Gemology, 47(1), 2011, 2–14.
Microprobe and LA-ICP-MS analyses, UV-Vis-NIR and FTIR spectroscopy confirm recently published data on the Antetezambato andradites. They are near end-member andradite in composition with low Cr and V, the colours presumably being caused by Fe, although finding any link of the green or golden brown colours examined to chemistry proved elusive. Fractures with partially healed ‘fingerprint’ inclusions are present along with wollastonite crystals and diopside clusters, identified using Raman spectra. The contents of light rare earth elements found using LA-ICP-MS are consistent with a skarn origin for the stones. R.R.H.
Dyed purple hydrophane opal.n. RenFRo and s.F. MccluRe. Gems & Gemology, 47(4), 2011, 260–70.
Purple opal specimens with play of colour are shown to have been dyed by means of microscopic examination and spectral analyses of the acetone solution after the opal had been immersed. The

The Journal of Gemmology / 2011 / Volume 32 / No. 5–8
Page 230
Abstracts (continued)
gemmological properties of the opal are consistent with an origin in Wollo, Ethiopia, although it was said by the merchant/donor to come from Mexico. Inclusions also consistent with an Ethiopian origin are quartz with even rhombohedral and short prism faces, and dark brown to black radial patches; also inclusions of a zeolite, possibly chabazite, were found. The authors’ experiments on dyeing Ethiopian hydrophane opals are reported. R.R.H
The chinese red feldspar controversy: chronology of research through July 2009.G.R. RossMan. Gems & Gemology, 47(1), 2011, 16–30.
Active research on red feldspar variously suggested as originating in Democratic Republic of Congo, ‘China’, Tibet, Inner Mongolia and Mexico is chronicled. Spectra in the UV-Vis-NIR range indicate similarities of this feldspar with Oregon sunstone but EPMA analyses indicate a clear distinction with both the sunstone and suggested Mexican feldspars being more calcic. Argon release experiments were conducted to test for heat treatment and argon isotopes along with Ca, Sr, Ba, Zn and Pb isotopes were measured to test source correlation. In 2008 experiments, Cu was found to diffuse easily into plagioclase above 1200°C, experiments prompted by the presence of high levels of Cu in glassy residues on the surfaces and in cracks in rough andesine specimens. The provisional conclusion was that there was a strong case for at least some of the stones to be copper-diffused andesine from Inner Mongolia; however further research is needed. R.R.H.
Triphylite from Brazil — a rare colour-change gemstone. k. scHMetzeR and e. eRel. Australian Gemmologist, 24(5), 2011, 104–5.
Triphyllite is a collector’s stone which is rarely described in gemmological literature. Three faceted Brazilian specimens display yellow green or greenish yellow in daylight changing to yellowish orange or brownish orange in incandescent light — both conditions varied depending on viewing angle due to distinct trichroism. Refractive indices of α 1.690, β 1.691, γ 1.696 and a Fe:Mn
ratio of 2.08 were consistent with the tryphylite-lithiophilite series in which the refractive indices increase with increasing Fe and decreasing Mn contents. Numerous absorption bands were present in the non-polarized spectrum, with maxima assigned to either Mn2+ or Fe2+. Colorimetric parameters were also recorded. E.A.S.
alexandrites from the novello alexandrite-emerald deposit, masvingo District, Zimbabwe. k. scHMetzeR, s. stöcklMayeR, v. stöcklMayeR and a.k. Malsy. Australian Gemmologist, 24(6), 2011, 133–47.
The Zimbabwean Novello locality, which is similar geologically to the famous Ural Mountain deposit in Russia, has produced mineral specimens and a limited amount of facet-quality rough. Comparisons to the Russian material are drawn via an in-depth discussion of the crystallographic and gemmological features of Novello alexandrites, as well as an overview of the geology of the deposit and gem genesis. Both deposits are dominated by cyclic twins (trillings), while single crystals and contact twins are rare. Unlike most Russian alexandrites, the Novello gems have a higher Cr and Fe content and show strong colour-zoning. Though they have comparable colour-change, the Zimbabwean material is highly fractured and included; rarely of faceting quality. E.A.S.
identification of extraterrestrial peridot by trace elements.a.H. sHen, J.I. koIvula and J.e. sHIGley. Gems & Gemology, 47(3), 2011, 208–13.
Since their RI and SG properties overlapped, 26 peridot samples from the Esquel meteorite, a stony-iron (pallasite) meteorite, were analysed using LA-ICP-MS and compared with analyses of peridots selected from major terrestrial sources. The elements found to be useful in identifying a peridot as terrestrial or extra-terrestrial are Li, V, Mn, Co, Ni and Zn, and two-element plots such as V vs. Li, Ni vs. Mn and Zn vs. Co show clearly separate fields. R.R.H.
neue künstlich geritzte sternsteine und ihre natürlichen Gegenstücke.M.p. steInBacH. Gemmologie. Z. Dt. Gemmol. Ges., 60(1/2), 2011, 25–36. 21
photographs, bibl. [German with English abstract.]
Asterism in stones is usually created by minute, orientated inclusions forming 4-, 6-, 8-, 12-, 18- and even 24-rayed stars. As well as the well-known stones with 4- and 6-rayed stars, the article mentions a few new and rare varieties. About ten years ago, gems with scratched stars appeared on the market. The scratches were made by ‘artists’ in Sri Lanka and included garnet, chrysoberyl, rutile, sinhalite, cassiterite, scheelite or samarskite, tourmaline (schorl) and sphalerite. Newly described are scratched stars on pyrite, iolite, green garnet, chromian diopside, green tourmaline and sapphire, as well as twin stars and doublets imitating iolite and tourmaline. There are about 40 different star stones known plus the diverse trapiche varieties. E.S.
mookaite — a Western australian ornamental rock. s. stöcklMayeR and v. stöcklMayeR. Australian Gemmologist, 24(3), 2010, 56–60.
A description of the geological setting, mining practices, mineralogical properties and causation of colour is presented and is accompanied by photographs of petrographic thin sections and of mookaite’s unique appearance following fashioning. Mookaite is a trade name for a porcellanite composed predominantly of massive ultrafine silica and coloured by iron oxide granules. This ornamental material is popular because it takes a high polish, is fine grained, is hard with no directional weakness and has an attractive mottled coloration. Due to the rock’s variable mineralogy and composition, its gemmological properties also vary. Deposits are found in the former Mooka Pastoral Station located approximately 170 km east of Carnarvon and have been worked since the 1960s. E.A.S.
Yellow scapolite from ihosy, madagascar.M. supeRcHI, F. pezzotta, e. GaMBInI and e. castaMan. Gems & Gemology, 46(4), 2010, 274–9.
Yellow scapolite has been recovered from veins in skarn rocks about 35 km south of Ihosy in southern Madagascar since the late 1990s. Twenty one representative samples have been studied
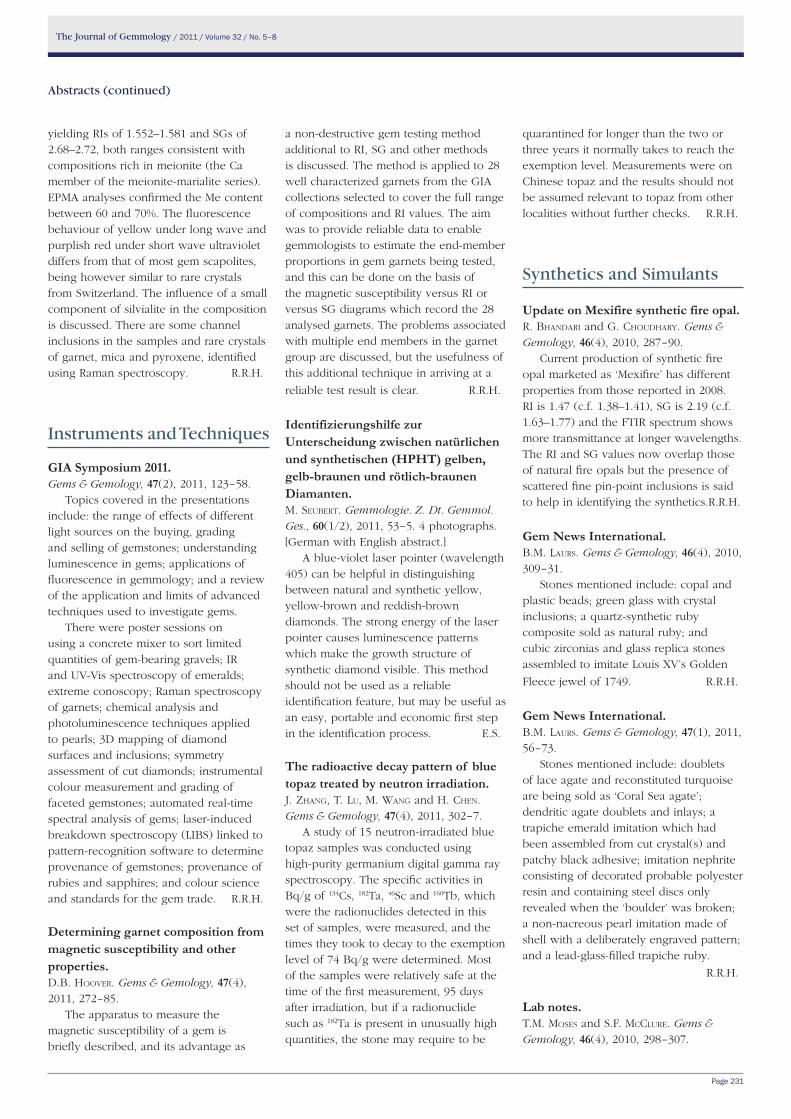
The Journal of Gemmology / 2011 / Volume 32 / No. 5–8
Page 231
Abstracts (continued)
yielding RIs of 1.552–1.581 and SGs of 2.68–2.72, both ranges consistent with compositions rich in meionite (the Ca member of the meionite-marialite series). EPMA analyses confirmed the Me content between 60 and 70%. The fluorescence behaviour of yellow under long wave and purplish red under short wave ultraviolet differs from that of most gem scapolites, being however similar to rare crystals from Switzerland. The influence of a small component of silvialite in the composition is discussed. There are some channel inclusions in the samples and rare crystals of garnet, mica and pyroxene, identified using Raman spectroscopy. R.R.H.
Instruments and Techniques
Gia symposium 2011.Gems & Gemology, 47(2), 2011, 123–58.
Topics covered in the presentations include: the range of effects of different light sources on the buying, grading and selling of gemstones; understanding luminescence in gems; applications of fluorescence in gemmology; and a review of the application and limits of advanced techniques used to investigate gems.
There were poster sessions on using a concrete mixer to sort limited quantities of gem-bearing gravels; IR and UV-Vis spectroscopy of emeralds; extreme conoscopy; Raman spectroscopy of garnets; chemical analysis and photoluminescence techniques applied to pearls; 3D mapping of diamond surfaces and inclusions; symmetry assessment of cut diamonds; instrumental colour measurement and grading of faceted gemstones; automated real-time spectral analysis of gems; laser-induced breakdown spectroscopy (LIBS) linked to pattern-recognition software to determine provenance of gemstones; provenance of rubies and sapphires; and colour science and standards for the gem trade. R.R.H.
Determining garnet composition from magnetic susceptibility and other properties.d.B. HooveR. Gems & Gemology, 47(4), 2011, 272–85.
The apparatus to measure the magnetic susceptibility of a gem is briefly described, and its advantage as
a non-destructive gem testing method additional to RI, SG and other methods is discussed. The method is applied to 28 well characterized garnets from the GIA collections selected to cover the full range of compositions and RI values. The aim was to provide reliable data to enable gemmologists to estimate the end-member proportions in gem garnets being tested, and this can be done on the basis of the magnetic susceptibility versus RI or versus SG diagrams which record the 28 analysed garnets. The problems associated with multiple end members in the garnet group are discussed, but the usefulness of this additional technique in arriving at a
reliable test result is clear. R.R.H.
identifizierungshilfe zur Unterscheidung zwischen natürlichen und synthetischen (hPhT) gelben, gelb-braunen und rötlich-braunen Diamanten.M. seuBeRt. Gemmologie. Z. Dt. Gemmol. Ges., 60(1/2), 2011, 53–5. 4 photographs. [German with English abstract.]
A blue-violet laser pointer (wavelength 405) can be helpful in distinguishing between natural and synthetic yellow, yellow-brown and reddish-brown diamonds. The strong energy of the laser pointer causes luminescence patterns which make the growth structure of synthetic diamond visible. This method should not be used as a reliable identification feature, but may be useful as an easy, portable and economic first step in the identification process. E.S.
The radioactive decay pattern of blue topaz treated by neutron irradiation.J. zHanG, t. lu, M. wanG and H. cHen. Gems & Gemology, 47(4), 2011, 302–7.
A study of 15 neutron-irradiated blue topaz samples was conducted using high-purity germanium digital gamma ray spectroscopy. The specific activities in Bq/g of 134Cs, 182Ta, 46Sc and 160Tb, which were the radionuclides detected in this set of samples, were measured, and the times they took to decay to the exemption level of 74 Bq/g were determined. Most of the samples were relatively safe at the time of the first measurement, 95 days after irradiation, but if a radionuclide such as 182Ta is present in unusually high quantities, the stone may require to be
quarantined for longer than the two or three years it normally takes to reach the exemption level. Measurements were on Chinese topaz and the results should not be assumed relevant to topaz from other localities without further checks. R.R.H.
Synthetics and Simulants
Update on mexifire synthetic fire opal.R. BHandaRI and G. cHoudHaRy. Gems & Gemology, 46(4), 2010, 287–90.
Current production of synthetic fire opal marketed as ‘Mexifire’ has different properties from those reported in 2008. RI is 1.47 (c.f. 1.38–1.41), SG is 2.19 (c.f. 1.63–1.77) and the FTIR spectrum shows more transmittance at longer wavelengths. The RI and SG values now overlap those of natural fire opals but the presence of scattered fine pin-point inclusions is said to help in identifying the synthetics. R.R.H.
Gem news international.B.M. lauRs. Gems & Gemology, 46(4), 2010, 309–31.
Stones mentioned include: copal and plastic beads; green glass with crystal inclusions; a quartz-synthetic ruby composite sold as natural ruby; and cubic zirconias and glass replica stones assembled to imitate Louis XV’s Golden
Fleece jewel of 1749. R.R.H.
Gem news international.B.M. lauRs. Gems & Gemology, 47(1), 2011, 56–73.
Stones mentioned include: doublets of lace agate and reconstituted turquoise are being sold as ‘Coral Sea agate’; dendritic agate doublets and inlays; a trapiche emerald imitation which had been assembled from cut crystal(s) and patchy black adhesive; imitation nephrite consisting of decorated probable polyester resin and containing steel discs only revealed when the ‘boulder’ was broken; a non-nacreous pearl imitation made of shell with a deliberately engraved pattern; and a lead-glass-filled trapiche ruby.
R.R.H.
lab notes.t.M. Moses and s.F. MccluRe. Gems & Gemology, 46(4), 2010, 298–307.

The Journal of Gemmology / 2011 / Volume 32 / No. 5–8
Page 232
Abstracts (continued)
AbstractorsA.S. Fellows – A.S.F. R.R. Harding – R.R.H. E.A. Skalwold – E.A.S. E. Stern – E.S.
An intense purplish-pink round brilliant was identified as a treated HPHT-grown synthetic diamond rather than a treated natural stone. Among HPHT-grown synthetic diamonds tested were a 4.09 ct yellow-orange stone, a blue 0.30 ct stone with silicon vacancy defects and melee-size yellow brilliants. Purple and greenish blue cabochons manufactured from turquoise, metal flakes and plastic appeared to contain metal veining and resemble some natural materials. A doublet with both components synthetic, one ruby and the other spinel, was
identified. R.R.H.
lab notes.t.M. Moses and s.F. MccluRe (Eds). Gems & Gemology, 47(1), 2011, 49–55.
A black submetallic round brilliant was identified using Raman spectroscopy as an intergrowth of synthetic moissanite and crystalline silicon. A cabochon that initially looked like moonstone was identified as a synthetic star spinel with a blue metallic coating on the base. R.R.H.
lab notes.t.M. Moses and s.F. MccluRe (Eds). Gems & Gemology, 47(3), 2011, 222–33.
The features of 16 faceted CVD synthetic diamonds are described; all are type IIa and have a weak to moderate green fluorescence under SWUV radiation. Two pink diamonds graded Fancy Vivid purplish pink and Fancy Deep purple-pink were found to have quite different structures when seen with DiamondView equipment — one grown in HPHT conditions and the other formed by CVD. The HPHT diamond showed much more uneven colour zoning than the CVD
diamond. R.R.H.
synthetic gem materials in the 2000s: a decade in review.n. RenFRo, J.I. koIvula, w. wanG and G. RoskIn. Gems & Gemology, 46(4), 2010, 260–73.
Synthetic versions of diamond (particularly gem-quality CVD diamond),
ruby, sapphire, emerald, aquamarine, red beryl, alexandrite, jadeite, quartz, opal and the unexpected examples of synthetic apatite and topaz are reviewed. Comments are made of the current status of methods of identification of these synthetic stones and the ever-present possibility of confusing them with heat-
treated natural stones. R.R.H.
characterisation of a new synthetic fancy yellow diamond.v. RolandI, a. BRaJkovIc, a. GIoRGIonI, a. MalossI and R. scottI. Gemmologie. Z. Dt. Gemmol. Ges., 60(1/2), 2011, 9–24. 14 photographs, 1 table, 8 graphs, bibl. [In German and English.]
The stones examined were HPHT grown with BARS equipment, modifying the geometry of the high-pressure growth cell and treated post growth by annealing and high temperatures. These new attractive synthetic intense bright yellow diamonds are being sold by the Italian firm Malossi Gemcreate (Milan) and marketed as ‘Malossi synthetic fancy yellow diamonds’. They have a homogeneous colour distribution and very good clarity grades. They can be distinguished from natural diamonds by some distinctive gemmological and spectroscopic properties such as evenly distributed green fluorescence to both long and short wave ultraviolet radiation, infrared features typical of type 1aA diamonds, a general increasing absorption from the visible towards the ultraviolet, characteristic UV-Vis and PL spectroscopic features, green cathodoluminescence and paramagnetic properties. Nine faceted and one rough synthetic diamond were examined. E.S.
high quality synthetic yellow orange diamond emerges in china. s. sHonGHua, l. taIJIn, s. MeIdonG, s. Jun and s. JInGJInG. Australian Gemmologist, 24(4), 2010, 168–70.
Several Chinese universities and companies now have the ability to produce large HPHT yellow diamonds,
some of which are of high quality and high clarity. This report describes a faceted 1.57 ct orange yellow synthetic diamond of relatively good clarity whose internal scene was comprised of tiny pinpoint inclusions and a pattern of internal graining in the form of a rectangle; metallic inclusions were absent. FTIR, Raman, Vis-NIR and EDXRF analysis were performed, and along with a DiamondView luminescence image of a green cross-shaped fluorescence, the diamond was confirmed as a type Ib synthetic — the first such large, high quality gem that the NGTC lab had encountered in the Chinese gem market. E.A.S.
exploring the origin and nature of luminescent regions in cVD synthetic diamond.B. wIlleMs, a. tallaIRe and J. BaRJon. Gems & Gemology, 47(3), 2011, 202–7.
In the DiamondView instrument, blue to blue-green luminescent zones may be seen in CVD synthetic diamond when the growth run has been interrupted and resumed, a well-known practice in the production of gem-quality CVD synthetics. DiamondView, photoluminescence (PL) and cathodoluminescence (CL) imaging were applied to study the origin and nature of these luminscent regions in two samples of high-purity single-crystal CVD synthetic diamond. DiamondView and PL measurements showed a correlation with silicon-related centres. In addition, CL analysis confirmed the presence of boron. Both silicon and boron showed preferential incorporation at the interface between CVD layers, where a higher uptake of impurities lead to the observed luminescence. Although the growth interruptions cannot be detected with the naked eye, the growth history can be determined accurately using luminescence imaging and spectroscopy techniques.
Authors’ abstract
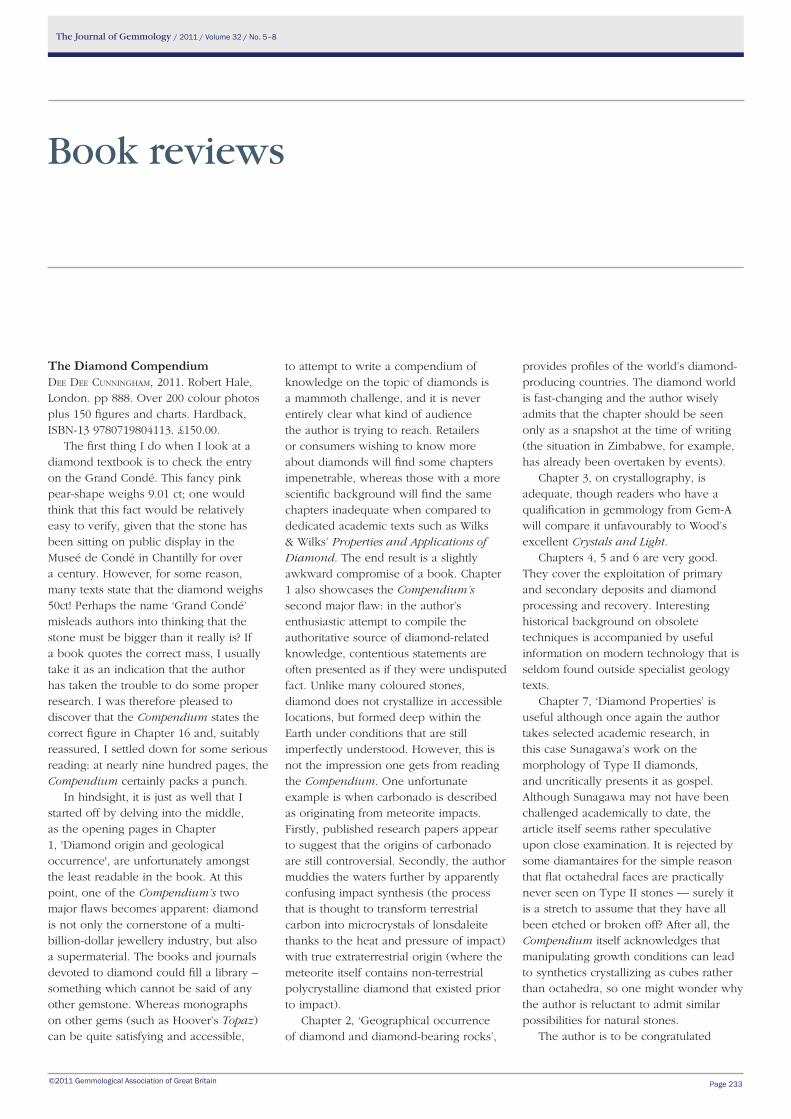
The Journal of Gemmology / 2011 / Volume 32 / No. 5–8
©2011 Gemmological Association of Great Britain Page 233
Book reviews
The Diamond compendiumdee dee cunnInGHaM, 2011. Robert Hale, London. pp 888. Over 200 colour photos plus 150 figures and charts. Hardback, ISBN-13 9780719804113. £150.00.
The first thing I do when I look at a diamond textbook is to check the entry on the Grand Condé. This fancy pink pear-shape weighs 9.01 ct; one would think that this fact would be relatively easy to verify, given that the stone has been sitting on public display in the Museé de Condé in Chantilly for over a century. However, for some reason, many texts state that the diamond weighs 50ct! Perhaps the name ‘Grand Condé’ misleads authors into thinking that the stone must be bigger than it really is? If a book quotes the correct mass, I usually take it as an indication that the author has taken the trouble to do some proper research. I was therefore pleased to discover that the Compendium states the correct figure in Chapter 16 and, suitably reassured, I settled down for some serious reading: at nearly nine hundred pages, the Compendium certainly packs a punch.
In hindsight, it is just as well that I started off by delving into the middle, as the opening pages in Chapter 1, 'Diamond origin and geological occurrence', are unfortunately amongst the least readable in the book. At this point, one of the Compendium’s two major flaws becomes apparent: diamond is not only the cornerstone of a multi-billion-dollar jewellery industry, but also a supermaterial. The books and journals devoted to diamond could fill a library – something which cannot be said of any other gemstone. Whereas monographs on other gems (such as Hoover’s Topaz) can be quite satisfying and accessible,
to attempt to write a compendium of knowledge on the topic of diamonds is a mammoth challenge, and it is never entirely clear what kind of audience the author is trying to reach. Retailers or consumers wishing to know more about diamonds will find some chapters impenetrable, whereas those with a more scientific background will find the same chapters inadequate when compared to dedicated academic texts such as Wilks & Wilks’ Properties and Applications of Diamond. The end result is a slightly awkward compromise of a book. Chapter 1 also showcases the Compendium’s second major flaw: in the author’s enthusiastic attempt to compile the authoritative source of diamond-related knowledge, contentious statements are often presented as if they were undisputed fact. Unlike many coloured stones, diamond does not crystallize in accessible locations, but formed deep within the Earth under conditions that are still imperfectly understood. However, this is not the impression one gets from reading the Compendium. One unfortunate example is when carbonado is described as originating from meteorite impacts. Firstly, published research papers appear to suggest that the origins of carbonado are still controversial. Secondly, the author muddies the waters further by apparently confusing impact synthesis (the process that is thought to transform terrestrial carbon into microcrystals of lonsdaleite thanks to the heat and pressure of impact) with true extraterrestrial origin (where the meteorite itself contains non-terrestrial polycrystalline diamond that existed prior to impact).
Chapter 2, ‘Geographical occurrence of diamond and diamond-bearing rocks’,
provides profiles of the world’s diamond-producing countries. The diamond world is fast-changing and the author wisely admits that the chapter should be seen only as a snapshot at the time of writing (the situation in Zimbabwe, for example, has already been overtaken by events).
Chapter 3, on crystallography, is adequate, though readers who have a qualification in gemmology from Gem-A will compare it unfavourably to Wood’s excellent Crystals and Light.
Chapters 4, 5 and 6 are very good. They cover the exploitation of primary and secondary deposits and diamond processing and recovery. Interesting historical background on obsolete techniques is accompanied by useful information on modern technology that is seldom found outside specialist geology texts.
Chapter 7, ‘Diamond Properties’ is useful although once again the author takes selected academic research, in this case Sunagawa’s work on the morphology of Type II diamonds, and uncritically presents it as gospel. Although Sunagawa may not have been challenged academically to date, the article itself seems rather speculative upon close examination. It is rejected by some diamantaires for the simple reason that flat octahedral faces are practically never seen on Type II stones — surely it is a stretch to assume that they have all been etched or broken off? After all, the Compendium itself acknowledges that manipulating growth conditions can lead to synthetics crystallizing as cubes rather than octahedra, so one might wonder why the author is reluctant to admit similar possibilities for natural stones.
The author is to be congratulated
The Journal of Gemmology / 2011 / Volume 32 / No. 5–8
Page 234
Book reviews (continued)
on Chapter 8, on colour. It is a solid introduction into a highly specialized and vitally important topic that is inadequately covered in most gemmology textbooks. There are occasional slip-ups, such as when the author claims that orange can be modified by green, which is not possible as ‘warm’ and ‘cool’ colours don’t mix. Perhaps this is why the Compendium states that there are 270 colour possibilities, whereas I calculate that the GIA recognizes a total of 101 colour grading terms for fancy diamonds (including black, ‘white’ and grey). In addition, it is asserted that gamma irradiation makes diamonds radioactive, which is untrue for gamma rays with energies of less than several megaelectronvolts.
Chapter 9, ‘Manufacturing’ is probably the best summary available on the topic, although it is already slightly dated: diamond technology is currently developing at an incredible pace. For example, there is no mention of the use of diamond-impregnated grinding wheels for bruting (so-called ‘Russian bruting machines’), which are currently making great inroads into the industry. The text also somewhat underplays the key roles of laser technology and computerized planning in modern manufacturing. The section describing international polishing centres could also use an update, with barely a mention of the effects of resource nationalism and the consequent establishment of polishing centres (‘beneficiation’) in Southern Africa. The author’s tendency to rely uncritically on previous texts rears its head again when the Compendium states that cutting thicker girdles and crowns is a good way of improving depth-of-colour in fancy-coloured stones. This is an oversimplification; modern computer technology is now being used to design faceting patterns and angles that increase path length through the use of total internal reflection. Counter-intuitively, this can sometimes provide ways of increasing a stone’s saturation by re-cutting it to shallower proportions.
Chapter 10, on cutting styles, is a good summary but for the unaccountable omission of the Asscher-cut, which helped to revitalize the popularity of emerald-cuts in the twentieth century. Amusingly, the author speculates that the baguette-
cut owes its name to the French word ‘bague’, meaning ring. Although it is true that baguette-cuts have no relationship to loaves of bread, the etymology of the term is almost certainly better-explained by the fact that ‘baguette’ in French simply means ‘rod/stick’! It is also unfortunate that the Compendium’s preferred line-drawing for heart-shapes includes impossible facets that cannot exist in real life.
Chapters 11, 12, 13 and 14, on the ‘four Cs’, are the strongest in the book: in these sections, the author is solidly within her comfort zone, displaying clear evidence of GIA training. Modern techniques are outlined and there is genuine strength in the detail, such as an explanation of the technique of ‘wet grading’ which helps to showcase the fact that the Compendium has truly been carefully constructed from the ground up rather than cobbled together from existing books. The only unfortunate omission is that the comparative tables contrasting various rather similar grading schemes do not mention the Russian grading system — the only maverick among diamond laboratory standards.
Chapter 15, on the global diamond market, is unfortunately somewhat shaky. In addition to being very out-of-date (De Beers’ former sorting house on 2 Charterhouse Street was vacated and demolished years ago, and the author’s quoted figure of 400 diamond-sorters in London is a distant memory), there are also factual errors. For example, not all of the world’s bourses are affiliated with WFDB, and the account of De Beers’ sorting activities contains numerous mistakes (although the author could perhaps be forgiven for failing to unearth the finer details of this proprietary process, which will in any case be of little relevance to readers given that every diamond company has its own assortment, machinery and procedures). However, the most misleading error is the claim that Sightholders are faced with a coercive, “like it or lump it” dilemma at every Sight. In fact, Sightholders can reject a portion of their Box — so-called ‘buy-backs’ — or refuse the Box in its entirety. They can and do exercise these rights freely, notably during the economic crisis in late 2008 that nearly crippled the entire diamond-mining industry. The author would have gained a better understanding
had she referred to the diamond trade journals, or if she had simply downloaded a copy of the current Sightholder Contract from the company’s website.
Chapter 16, ‘Famous diamonds’, is excellent. The list of largest gem-quality uncut diamonds shows signs of careful archival research: it is obviously more comprehensive than most of the existing lists, and includes several stones from Jagersfontein which others appear to have missed. Previous authors such as Bruton and Balfour have mentioned some additional 500-plus-caraters in passing, and there are reports of a 602 ct rough discovered in 1993 in the Santo Antônio do Bonito river (Minas Gerais, Brazil) but this list restricts itself to ‘gem-quality’ items, which perhaps explains why such stones are not listed — although the author certainly appears to have given the rather murky-looking 620 ct Sefadu the benefit of the doubt! It is sheer bad luck that the 550 ct Letšeng Star was discovered on 19 August 2011, obviously too late for publication. In fact, the only other notable omissions from the list appear to be the Wynn and the Star of Stanley Ho, diamonds owned by competing casino moguls. The former is said to have weighed 581 ct when discovered in Brazil in 2002, and the latter is said to have weighed 570 ct when discovered in Angola around 2003 (it is now the world’s largest D-flawless cushion-cut, on display in a casino in Macau).
The author has taken the Mouawad Collection’s ownership at face value, although few people who work in ‘haute joaillerie’ seem to genuinely believe that Mr Mouawad has built up this fabulous private collection of famous diamonds on his own account: it is widely rumoured that they have long since been re-sold to private clients. With the exception of the Excelsior I, the gems are, in fact, conspicuous by their absence from the Robert Mouawad Private Museum in Beirut, and I have been unable to verify the author’s report of the stones being exhibited in Mouawad boutiques in recent times.
Chapters 17, 18, 19 and 20 (diamond identification, simulants, treatments and synthetics respectively) are all excellent and very comprehensive, along the same lines as the ‘Four Cs’ chapters.

The Journal of Gemmology / 2011 / Volume 32 / No. 5–8
Page 235
Book reviews (continued)
conclusionIn spite of some of the above
comments, the Compendium is a worthy piece of work. It supplants Bruton’s Diamonds as today’s leading general diamond textbook (although it is admittedly rather less enticing and readable) and it deserves to take its place on every gemmologist’s bookshelf along with that other indispensable 900-page behemoth, O’Donoghue’s Gems: their sources, descriptions and Identification. Like both of these tomes, the Compendium deserves to have a long shelf life and go through multiple
editions. Its flaws are usually minor — the occasional slightly wonky diagram, a persistent habit of mis-spelling surnames, an inconsistent approach to the inclusion of ‘inline’ references in the text — but, at its best, the Compendium manages to not only present a reasonably up-to-date summary of existing knowledge that is unavailable elsewhere, but also to add fascinating insights and background colour.
michael hing
(Michael Hing is a Fellow of Gem-A, and works as a diamond valuer in London.)
Gem-A Shop
Don't miss the monthly Special OfferS on books and instruments from the
Gem-A Shop
log on to the Gem-a website at www.gem-a.com to discover what is on offer each month.

The Journal of Gemmology / 2011 / Volume 32 / No. 5–8
Page 236
Proceedings of the Gemmological Association of Great Britain and Notices
© 2011 The Gemmological Association of Great Britain
Gem-A Graduation Ceremony and Presentation of Awards
On Monday 7 November the Graduation Ceremony and
Presentation of Awards was held at Goldsmiths’ Hall in
the City of London. Professor Andy Rankin, President of
the Gemmological Association, presided. James Riley,
Chairman of the Gem-A Board, welcomed those present
and introduced Jeffrey Monnickendam of Monnickendam
Diamonds, a past Gem-A Council member, who presented
the awards and gave the address.
Following the presentations to the graduates, Alan
Hodgkinson was presented with an Honorary Lifetime
Membership in recognition of his tremendous contribution
to gemmology over fifty years. Alan is internationally
recognized for his gem identification techniques using
traditional gem testing equipment and for his book Visual
Optics. Having been President of the Scottish Branch of
Gem-A for many years, Alan is now Honorary President of
the Scottish Gemmological Association formed in 2008.
The ceremony was followed by a reception for
graduates and guests.
Graduates gather on the magnificent staircase at Goldsmiths' Hall following the ceremony. Photo courtesy of Photoshot.

The Journal of Gemmology / 2011 / Volume 32 / No. 5–8
Page 237
Proceedings of the Gemmological Association of Great Britain and Notices
Gem-A Conference 2011
Record numbers attended the 2011 Gem-A Conference,
held on Sunday 6 November at the Hotel Russell,
Bloomsbury. Speakers included Steve Bennett, Brian
Cook, Branko Deljanin, Alan Hart, Brian Jackson and Gary
Roskin. Adolf Peretti was unable to attend due to flooding
in Bangkok, but Willy Bieri kindly stepped in at the last
minute to present his lecture.
During the breaks delegates had the opportunity
to browse through the latest books and instruments
from Gem-A Instruments and to view displays and
demonstrations.
The day concluded with a dinner held at The Russell
followed by a disco.
Conference EventsA programme of events and workshops was arranged
to coincide with the Conference. These started on
Saturday 5 November with two half-day seminars held by
Branko Deljanin entitled ‘Basic gemmology and diamond
identification’.
On Monday 7 November two half-day seminars were
held — ‘Optical phenomena’ with Brian Jackson and
‘Snap decisions: photographing gems under less than ideal
conditions’ with Gary Roskin. The Graduation Ceremony
and Presentation of Awards was held in the evening at
Goldsmiths’ Hall (see report opposite).
On Tuesday 10 November Alan Hart led a tour of the
Mineral Gallery at the Natural History Museum, South
Kensington, including the opportunity to view the
Museum’s new acquisitions. This was followed in the
afternoon by a guided tour of the Crown Jewels at the
Tower of London with David Thomas. The final event was
Gem Discovery Club with guest speaker Dominic Mok
Conference Sponsors and Supporters:
The Association is most grateful to the following for their support:
Major SponSorS
Marcus McCallum FGa, Londonwww.marcusmccallum.com
SponSorS
T.H. March, Insurance Brokerswww.thmarch.co.uk
asian Gemmological Institute and Laboratory (aGIL)w: www.agil.com.hk
The Goldsmiths’ Company assay officewww.thegoldsmiths.co.uk/assay-office
SupporTerS
apsarawww.apsara.co.uk
Brink’s Global Serviceswww.brinksglobal.com
British jewellers’ associationwww.bja.org.uk
Gemfieldswww.gemfields.co.uk
We would also like to thank dg3 Diversified Global Graphics Group for sponsoring the leaflets and
delegate badges for the conference. Visit their website at www.dg3.com
who gave a presentation entitled ‘Fei Cui: jadeite jade
identification, from eye to high-tech’.
A full report of the Conference and events is to be
published in the Winter 2011/2012 issue of Gems &
Jewellery.

The Journal of Gemmology / 2011 / Volume 32 / No. 5–8
Page 238
Proceedings of the Gemmological Association of Great Britain and Notices
Gem-A Examinations were held worldwide in January and June 2011. In the Examinations in Gemmology 293
students qualified in the Diploma Examination, including nine with Distinction and 44 with Merit. In the Foundation
in Gemmology Examination 389 qualified. In the Gem Diamond Examination 81 qualified, including 11 with
Distinction and seven with Merit.
The Tully Medal is awarded to the candidate who submits the best set of answers in the Gemmology Diploma
examination which, in the opinion of the Examiners, are of sufficiently high standard. robin Hansen of Warminster,
Wiltshire, was awarded the Tully Medal as well as the Christie’s prize for Gemmology for the best candidate of the
year in the Diploma Examination, and the anderson Bank prize for the best set of theory papers in the Diploma in
Gemmology examination.
The read practical prize for excellence in the Diploma Practical Examination was sponsored for 2011 by DeeDee
Cunningham of Toronto, Canada. The Read Practical Prize was awarded to Xianzhi Zhang of Wuhan, China.
In the Foundation Certificate in Gemmology examination, the anderson Medal for the candidate who submitted
the best set of answers which, in the opinion of the Examiners, were of sufficiently high standard, and the Hirsh Foundation award for the best candidate of the year, were awarded to Dr Simon Gowry of Wolverhampton.
In the Gem Diamond Diploma examination, the Bruton Medal for the best set of theory answer papers of the year
was awarded to julia anna Griffith of Southampton
The Deeks Diamond prize for the best candidate of the year, was awarded to julia Gowans-poli of London.
The Dominic Mok Diamond practical prize for excellence in the Diamond Practical Examination, is sponsored by
Dominic Mok from AGIL, Hong Kong. The Dominic Mok Diamond Practical Prize was awarded to David Lawrie of
Solihull.
The names of the successful candidates are listed below.
Gem-A Awards
Gemmology DiplomaQualified with Distinction
Antonucci, Andrea, Stockholm, SwedenDi Cui, Beijing, P.R. ChinaDiamond, Marcia Jane, LondonHansen, Robin, Mere, Warminster, WiltshireHuang Rong, Ling Shui County, Hainan, P.R. ChinaLacosta, Patricia, LondonMogridge, Emma Denise, Totnes, DevonTingting Ma, Shanghai, P.R. ChinaWeng Xiao Fan, Fu Zhou City, Fujian, P.R. China
Qualified with Merit
Callandreau, Alexandra Bokobsa, Paris, FranceChao Liu, Beijing, P.R. ChinaChayathorn, Chanruangvanich, Bangkok, ThailandGao, Yu Jie, Henan, P.R. ChinaGuo Huimin, Wuhan, P.R. ChinaHe Yiting, Jiangsu, P.R. ChinaHsu Shu-Lin, Taipei, Taiwan, R.O. ChinaHu Zhengying, Shanghai, P.R. China
In-Nang Cheong, Taipei, Taiwan, R.O. ChinaJain, Sanjay, Bangalore, Karnataka, IndiaJamieson, Pauline, Edinburgh, MidlothianJiao Yongling, Beijing, P.R. ChinaLei Yuanyuan, Changsha City, Hunan, P.R. ChinaMailly, Caroline, Versailles, FranceMin Zhou, Beijing, P.R. ChinaMöhler, Anja, LondonPapaux, David J.H., Geneva, SwitzerlandPei Yu, Beijing, P.R. ChinaQiao Xiong, Honghu, Hubei, P.R. ChinaRaj, Amrit, Jaipur, IndiaReynaud, Lucy, SingaporeReynolds, Eva, Cheltenham, GloucestershireRuiwei Ma, Guilin, Guangxi, P.R. ChinaShao Xinyuan, Wuhan, P.R. ChinaSheridan, Meghan E., Upper Montclair, New Jersey,
U.S.A.Shevchenko, Olga, Montreal, Quebec, CanadaSiyuan Bi, Guilin, Guangxi, P.R. China
Examinations in Gemmology

The Journal of Gemmology / 2011 / Volume 32 / No. 5–8
Page 239
Proceedings of the Gemmological Association of Great Britain and Notices
Cheng Lin Lv, Beijing, P.R. ChinaChengxuan Li, Beijing, P.R. ChinaCheung Siu Lui, Sharon, Tsuen Wan, Hong KongChoi Wing Cheong, Chai Wan, Hong KongChunxia Chen, Shanghai, P.R. ChinaChunzhong Huang, Guilin, Guangxi, P.R. ChinaChuxin Song, Guilin, Guangxi, P.R. ChinaCostanzo, Alessandra, Galway, IrelandCui Dongmei, Taiyuan City, Shanxi, P.R. ChinaDaijun Sun, Beijing, P.R. Chinade Gaspé Beaubien, Isabelle, Montreal, Quebec, CanadaDeutschl, Norbert, Montreal, Quebec, CanadaDi Gregorio, Giuseppe, Spadafora, ItalyElliott, Paul, Woodville, South Australia, AustraliaElmetto, Pamela, LondonFeng Yan, Guangzhou, P.R. ChinaFerré, Iohan, Vingrau, FranceFitchko, Dorian Nicholaus, Montreal, Quebec, CanadaFong Tik Kwan, Tseung Kwan O, Hong KongFranks, Elliot, Worthing, West SussexGan Yanchao, Guangzhou, Guangdong, P.R. ChinaGao Shijia, Beijing, P.R. ChinaGaonkar, Mahesh, Mumbai, IndiaGeorgsen, Cecilia Andrén, Lund, SwedenGilson, Karen Margaret, Wanstead, LondonGross, Robyn Elizabeth, Mont-Royal, Quebec, CanadaGu Jialu, Shanghai, P.R. ChinaGuo Fang Yu, Beijing, P.R. ChinaGuo Yongquan, Xiamen City, P.R. ChinaHao, Yudi, Bayannaoer City, Inner Mongolia, P.R. ChinaHardy, Sarah, Stockton-on-Tees, County DurhamHerzog, Franz A., Oltingen, SwitzerlandHu Yuanfeng, Shanghai, P.R. ChinaHuang Xi, Shanghai, P.R. ChinaHuang Yuan, Beijing, P.R. ChinaHuijie Huang, Beijing, P.R. ChinaHu Jiesheng, Shanghai, P.R. ChinaHunt, Glynis, Andover, HampshireHutchinson, Fiona, Albourne, West SussexIkeuchi, Mototeru, Tokyo, JapanImberti, Daufresne, Antananarivo, MadagascarIvancic, Ivan, Colombo, Sri LankaJacquier, Nathalie, Genthod, SwitzerlandJia Song, Guilin, Guangxi, P.R. ChinaJiang Baoxin, Shanghai, P.R. ChinaJianmei Ouyang, Beijing, P.R. ChinaJiawen Li, Beijing, P.R. ChinaJing Chen, Urumqi, Xinjiang, P.R. ChinaJing Zhang, Wuhan, P.R. ChinaJohnson, Louise, Edinburgh, MidlothianJohnston, Meredith, Marcoola, Queensland, Australia
Su Shi Zhen, Shandong, P.R. ChinaSujie Ai, Guilin, Guangxi, P.R. ChinaTang Pik Yin, Kowloon, Hong KongTianyin Xu, Beijing, P.R. ChinaVazzana, Franck, Cosnes-et-Romain, FranceWang Jing, Shanghai, P.R. ChinaXu Ying, Shanghai, P.R. ChinaYan Shen, Guilin, Guangxi, P.R. ChinaYifan Li, Beijing, P.R. ChinaYiru Shi, Beijing, P.R. ChinaYu-Han Chen, Taipei, Taiwan, R.O. ChinaZdeb, Robert, Epping, EssexZhang Di, Beijing, P.R. ChinaZhang Dongfang, Beijing, P.R. ChinaZhang Shengnan, Beijing, P.R. ChinaZhao Lu, Shanghai, P.R. ChinaZheng Yan, Beijing, P.R. China
Qualified
Aiming Cao, Beijing, P.R. ChinaAkerlund, Sophia, Lidingö, SwedenAkintayo, Olusegun James, LondonAllen, Amanda, NorthamptonAl-Saif, Manar, Stavanger, NorwayAn Yue, Beijing, P.R. ChinaAndoniaina Harijaona, Rabetaliana, Antananarivo,
MadagascarAndriamanohisoa Axhel, Robert, Antananarivo,
MadagascarAndriamboavonjy, Rasamuel, Antananarivo, MadagascarAthavale, Seema Ashish, Mumbai, IndiaBane, Jonathan William, Sheffield, South YorkshireBarnett, Myles, Unley Park, South Australia, AustraliaBeer, Jasmin, Birmingham, West MidlandsBell, Nicola, Newton Abbott, DevonBernau, Eric, La Ciotat, FranceBing Sun, Wuhan, P.R. ChinaBurgoni, Eva Maria, Carnoux-en-Provence, FranceButini, Enrico, Rome, ItalyButini, Flavio, Rome, ItalyCaihuan Liao, Guilin, Guangxi, P.R. ChinaCao Hanxiao, Henan, P.R. ChinaChan Lim Chi, Ap Lei Chau, Hong KongChan Pei Pei, Betty, Quarry Bay, Hong KongChan Yuen Ping, Aberdeen, Hong KongChandrasiri, Hemali Iresha Kumari, Kegalle, Sri LankaChang Jing, Zhangjiakou City, Hebei, P.R. ChinaChaoguang He, Wuhan, P.R. ChinaCharpentier, Frédéric, Fresnes, FranceChen Jiankang, Guangzhou, Guangdong, P.R. ChinaChen Qian-Zheng, Beijing, P.R. China
The Journal of Gemmology / 2011 / Volume 32 / No. 5–8
Page 240
Proceedings of the Gemmological Association of Great Britain and Notices
Jokinen, Tiina, Tampere, FinlandJun Lu, Beijing, P.R. ChinaKarimzadeh, Leyla, LondonKaye, Charlotte Jane, Hungerford, BerkshireKirkham, Sally Louise, Birmingham, West MidlandsKnudsen, Christine, Oslo, NorwayKnutsen, Annmari Ellila, Oslo, NorwayKun Wang, Guilin, Guangxi, P.R. ChinaLahtinen, Tiina Marjaana, Oitti, FinlandLai Hsin Ya, Feng Yuan City, Taiwan, R.O.C.Lai Nga Ting, Eltham, LondonLee, Alix, Rognes, FranceLee, Sealim, LondonLee Lai Chun, Loletta, Hong KongLi Bin, Guangzhou, Guangdong, P.R. ChinaLi Hangeng, Beijing, P.R. ChinaLi Li, Guilin, Guangxi, P.R. ChinaLi Shanshan, Wulumuqi City, Xinjiang, P.R. ChinaLi Shuang, Beijing, P.R. ChinaLiang Siqiao, Mile County, Yunnan, P.R. ChinaLiang Xiaoyang, Wuhan, P.R. ChinaLiao Mengyuan, Guangxi, P.R. ChinaLili Zhang, Wuhan, P.R. ChinaLin Jing, Xiamen City, Fujian, P.R. ChinaLinlin Zhang, Guilin, Guangxi, P.R. ChinaLiu Saihua, Yueyang, Hunan, P.R. ChinaLiuyi Li, Guilin, Guangxi, P.R. ChinaLiyuan Gan, Guilin, Guangxi, P.R. ChinaLoosvelt, Bart, Kortrijk, BelgiumLowther, Joan, LondonLu Gao, Beijing, P.R. ChinaLulu Mo, Guilin, Guangxi, P.R. ChinaMa March Yu, Chongqing, P.R. ChinaMane, Sandesh Narayan, Mumbai, IndiaManeekrajangsaeng, Marisa, Bangkok, ThailandMatsuura, Miho, Yokohama, JapanMayer, Helen, LondonMayer, Melanie, St Helens, Jersey, Channel IslandsMénard, Georges-Etienne, Saint-Hyacinthe, Quebec,
CanadaMeng, Caizhen, Nanning City, Guangxi, P.R. ChinaMengying Luo, Wuhan, P.R. ChinaMinassian Bardehshahi, Odett, Mykonos, GreeceMisme, Eric, Lyon, FranceMitchell, Anne Susan, Harpenden, HertfordshireMkogian, Elen, Stavroupoli, Thessalonika, GreeceModi, Upaasna, LondonNeurauter, Amy Lynn, New York, U.S.A.Nguyen, Michel, Saintry-sur-Seine, FranceOdén, Naime Marielle Angelica, Brunflo, SwedenO’Reilly, Erin M.M., Montreal, Quebec, Canada
Owen, Cheryl Mae, Erdington, West MidlandsPalliyaguruge, Lalake Sanjeewa, Battaramulla, Sri LankaPapalekakou, Despoina, Korydallos, GreeceParkes, Matthew A., Dublin, IrelandParry, Tessa Pryce, Wantage, OxfordshirePatenaude, Lizanne, Westmount, Quebec, CanadaPei Ying Hsiao, Zhongli, TaiwanPeng Cunzhen, Wuhan, P.R. ChinaPoon Pak Kei, Hong KongQi Weihong, Birmingham, West MidlandsQian Gan, Guilin, Guangxi, P.R. ChinaQuentin, Dartois, Vence, FranceRanatunga, Galla Ge Deershika, Meetiyagoda, Sri LankaRatnayake, Dayanthi, Colombo, Sri LankaRegala, Benjamin, Aiea, Hawaii, U.S.A.Ren Xiaoxue, Wu Lan Cha Bu City, Inner Mongolia, P.R.
ChinaRichbourg, Carole, Los Altos, California, U.S.A.Rie, Okayasu, Antananarivo, MadagascarRoach, Fay, Norwich, NorfolkRufa Feng, Guilin, Guangxi, P.R. ChinaSai Qin, Wuhan, P.R. ChinaSakakibara, Kenichi, Oita, JapanSequino, Francesco, Naples, ItalyShan Xinying, Beijing, P.R. ChinaShang Guoqiang, Wuhan, P.R. ChinaShang Mei, Wuhan, Hubei, P.R. ChinaShen Lida, Xiamen City, P.R. ChinaShenoi, Anita, Longhope, GloucestershireShih-Ying Wu, Taipei, Taiwan, R.O. ChinaShuang Zhou, Beijing, P.R. ChinaShuihan Yi, Birmingham, West MidlandsShuxuan Xiao, Beijing, P.R. ChinaSibley, Christopher, St Albans, HertfordshireSmither, Susannah, LondonSong Wenyan, Zengcheng City, Guangdong, P.R. ChinaSun Hongmeng, Xingping City, Shaanxi, P.R. ChinaSy, Dicken, Kowloon, Hong KongTew, Timothy David, Atlanta, Georgia, U.S.A.Thomas, Craig Arthur, Santon, Gauteng, South AfricaTims, Ashley, Indooroopilly, Queensland, AustraliaTing Huang, Guilin, Guangxi, P.R. ChinaToure, Abdoul, Toamasina, MadagascarTsang Hing Cheung, Hong KongValentini, Francesca, LondonVarhadpande, Milind Arun, Mumbai, IndiaVerwijk, Moira, Toronto, Ontario, CanadaVon Allmen, Andrea, Munsingen, SwitzerlandVorilhon, Alix, Antananarivo, MadagascarVoulgaridis, Konstantinos, LondonWang Jinlan, Guilin City, Guangxi, P.R. China
The Journal of Gemmology / 2011 / Volume 32 / No. 5–8
Page 241
Proceedings of the Gemmological Association of Great Britain and Notices
Wang Ming Ying, Beijing, P.R. ChinaWang Mingtian, Zhongshan, Guangdong, P.R. ChinaWang Yuyan, Henan, P.R. ChinaWang Zhen, Beijing, P.R. ChinaWang Zi, Beijing, P.R. ChinaWard, Sarah, Leeds, West YorkshireWelsh, Simon Ian, Exeter, DevonWenhua Liang, Guilin, Guangxi, P.R. ChinaWeyers, Stefanus Salomon, Brandhof Bloemfontein,
South AfricaWhiting, Marielle, Salisbury, WiltshireWillmott, Karra Jane, CroydonWilson, Maria Dorothea, Stretton-on-Dunsmore,
Warwickshire, Windeyer, Patricia Annette, Brisbane, Queensland,
AustraliaWingate, Simon, Tiverton, DevonWolff, Ella S., Silver Lonnen, Tyne and WearWong Wing Suet, Kowloon, Hong KongWoodcock, Olga Faye, Basingstoke, HampshireWu Chung-Kang, Yung He City, Taipei, Taiwan, R.O.C.Wu Yi, Beihai City, Guangxi, P.R. ChinaWu Zhi Yuan, Beijing, P.R. ChinaXiangbo Yang, Beijing, P.R. ChinaXiaoan Chen, Guilin, Guangxi, P.R. ChinaXiaofei Chen, Wuhan, P.R. ChinaXiaowen Huang, Guilin, Guangxi, P.R. ChinaXiong Ranran, Xiangfan City, Hubei, P.R. ChinaRanran Xu Yanyan, Shanghai, P.R. ChinaXue Tian, Beijing, P.R. ChinaXue Yuan, Zhengzhou, Henan, P.R. ChinaYamaguchi, Nao, Osaka, JapanYang Xi, Beijing, P.R. ChinaYanming Feng, Wuhan, P.R. ChinaYanran Xu, Beijing, P.R. ChinaYat, Richard, New Territories, Hong KongYe Ma, Beijing, P.R. ChinaYi’an Jiang, Guilin, Guangxi, P.R. ChinaYishun Huang, Guilin, Guangxi, P.R. ChinaYu Miao, Chengdu City, Sichuan, P.R. ChinaYu Jinping, Beijing, P.R. ChinaYu Zhang, Beijing, P.R. ChinaYu Zheng, Wuhan, P.R. ChinaYue Yin, Guilin, Guangxi, P.R. ChinaYuet Chai, New Territories, Hong KongYujiao Chen, Beijing, P.R. ChinaZang Xiaoliang, Wuhan, P.R. ChinaZhang Jingwen, Central, Hong KongZhang Li, Wuhan, Hubei, P.R. ChinaZhang Qian, Beijing, P.R. ChinaZhang Xianzhi, Wuhan, Hubei, P.R. China
Zhang Yiwen, Beijing, P.R. ChinaZhao Mei Tao, Beijing, P.R. ChinaZhao Yang, Xuchang City, Henan, P.R. ChinaZhao Zhuanghua, Beijing, P.R. ChinaZhenghuan Huang, Guilin, Guangxi, P.R. ChinaZhongjing Kang, Beijing, P.R. ChinaZhou Qi, Zhuji City, Zhejiang, P.R. ChinaZhu Lin, Beijing, P.R. ChinaZhu Ning, Beijing, P.R. ChinaZhu Xiao Li, Yun Cheng City, Shan Xi, P.R. China
Foundation Certificate in GemmologyQualified
Abraham, Helen Louise, Weybridge, Surrey Ai Sujie, Zhongxiang City, Hubei, P.R. ChinaAissaoui, Mehdi, Laxou, FranceAlsvold-Torndahl, Rebecca, Skanor, SwedenAndersson, Helene, Lannavaara, SwedenAndre, Sandrine, London Aponsu, Malimage, Moratuwa, Sri LankaAu Siu Tong, Kowloon, Hong KongAu Sui Keung, New Territories, Hong KongAu Tsz Wai, New Territories, Hong KongAvendano, Edson, Montreal, Quebec, CanadaBai Dan, Guangzhou City, P.R. ChinaBailey, Kathryn, AberdeenBarrows, Michael James, Kidderminster, Worcestershire Benistand, Angelique, Grenoble, FranceBertenshaw, Emma, Luz-Lagos, Algarve, PortugalBi Siyuan, Jiyuan City, Henan, P.R. ChinaBoisserand, Anne, Frejus, FranceBombardier, Valerie, Candiac, Quebec, CanadaBoylan, Penny, London Bragg, Caitlin, London Branchard, Jean-Yves, Kamaryut Township, Yangon,
MyanmarBrasseur, Agnes, Le Tholonet, FranceBrianceau, Boris, Saint-Julien des Landes, FranceBuckley, Amanda, North Shore, Auckland, New
ZealandBuono, Pascal, Mont Royal, Quebec, CanadaBurlando, Elisabetta, Genova, ItalyCancé, Gregory, Montreal, Quebec, Quebec, CanadaCaussinus, Karine, Drumettaz Claraford, FranceChai Yuet, New Territories, Hong KongChamayou, Isabelle, Saint Raphael, FranceChan Hei Yiu, Hong KongChan Shuk Lam, Kowloon, Hong KongChan Wai Ling, New Territories, Hong KongChan Yin Ki Cubie, Hong KongCharpentier, Frederic, Fresnes, France
The Journal of Gemmology / 2011 / Volume 32 / No. 5–8
Page 242
Proceedings of the Gemmological Association of Great Britain and Notices
Chau Lan Yee, Sheung Wan, Hong KongChayathorn, Chanruangvanich, Yannawa, Bangkok,
ThailandChe Yandong, Calfeng City, Inner Mongolia, P.R. ChinaChen Chunxia, Shanghai, P.R. ChinaChen Ju-Yu, Taipei, Taiwan, R.O. ChinaChen Mengna, Rong County, Guangxi, P.R. ChinaChen Xiao, Teda of Tian Jin, P.R. ChinaChen Xiaoan, Yulin, P.R. ChinaChen Xueping, Shanghai, P.R. ChinaChen Yin, Shanghai, P.R. ChinaChen Yu-Han, Taipei, Taiwan, R.O. ChinaCheng Ping Shing, Kowloon, Hong KongCheon Ji Youn, Yeonsu-Gu, Incheon, South KoreaCheong In-Nang, Taipei, Taiwan, R.O. ChinaCheung Chak Ting, Christine, Kowloon, Hong KongCheung Chau, North Point, Hong KongCheung Mei, Karen, New Territories, Hong KongCheung Siu Lui, Sharon, New Territories, Hong KongChin Cheung, Beijing, P.R. ChinaCho Mi Hyun, Jung-Gu, South KoreaChoi Shin A., Namyangju-Si, Kyunggi-Do, South KoreaChow Po Ling, Hong KongChu Hoi Ting, New Territories, Hong KongChu Pik Wa, Shek Lei Est, Hong KongChu Wai Hung, Kowloon, Hong KongChu Yung-Huan, Taichung, Taiwan, R.O. ChinaChung Pui Shan, Rosemary, Pok Fu Lam, Hong KongChung Wing Lam, Apleichau, Hong KongClausen, Tobias, Lannavaara, SwedenCorton, Annabelle Rachael, Dubai, U.A.E.Da Silva, Andre Fortunato, St Helier, Jersey, Channel
Islands Dai Hin Kwan, New Territories, Hong KongDartois, Quentin, Vence, FranceDaufresne, Marie, Antananarivo, MadagascarDavid, Elysabeth, Bonn, GermanyDavis, Valerie, Stone, StaffordshireDay, Kroy, Jimboomba, Queensland, AustraliaDe Haller, Antoine, Geneva, SwitzerlandDe Zoysa Jayatilleke, Liyana Gracelyn, Colombo, Sri
LankaDi Geso, Alessandra, Kirkland, Quebec, CanadaDignet, Lydie, Les Pennes Mirabeau, FranceDodero, Stephanie, Asnieres-sur-Seine, FranceDrouin, Claude, Loughborough, LeicestershireDryland, Davina, Burton-upon-Trent, StaffordshireDuan, Qi, Harbin, P.R. ChinaEastmond, Fiona, Isleworth, Middlesex Elett, Birgit, Ebmatingen, SwitzerlandEllis, Mairghread, Cousland, Midlothian
Faure, Florian, Versailles, FranceFelanis, Kostas, Ioannina, GreeceFeng Rufa, Xi’An City, Shanxi, P.R. ChinaFeng Wei, Ghuangzhou City, P.R. ChinaFerré, Iohan, Vingrau, FranceFitchko, Dorian Nicholaus, Montreal, Quebec, CanadaFitzner, Manuela, Malmo, SwedenForsner, Christina, Sodra Sandby, SwedenFranks, Elliot, Worthing, West SussexFranses, Daniel, London Fremy, Pierre, Bois Colombes, FranceFu Ziou, Haifu Garden, Kaiping City, P.R. ChinaGan Qian, Nanning City, Guangxi, P.R. ChinaGao Liyuan, Jingning County, Gansu, P.R. ChinaGenet, Julie, Cagnes-sur-Mer, FranceGericke, Chanel, NottinghamGervais, Veronique, Brossard, Quebec, CanadaGlover, Katie, London Goshanth, Namasivayam,, Sabaragamuwa , Sri LankaGoustiakov, Elodie, Boulogne Billancourt, FranceGowry, Simon, Wolverhampton, StaffordshireGriffith, Julia, Southampton, HampshireGross, Robyn Elizabeth, Mont-Royal, Quebec, CanadaGuilin Liu, Guangzhou City, P.R. ChinaHallsten, Caroline, Runhallen, SwedenHameed, Aveen, Leicester Hammerstein, Quirine, Geneva, SwitzerlandHan Eun Sun, Guro-Gu, Seoul, South KoreaHasan, Aysha, London He Jie, Guangzhou City, P.R. ChinaHeywood, Charlotte, Saxmundham, Suffolk Ho Hsuan Yi, Taipei, Taiwan, R.O. ChinaHo Wing Sze, London Hong Junbin, Shanghai, P.R. ChinaHou Jian, Shanghai, P.R. ChinaHsu Shu-Lin, Taipei, Taiwan, R.O. ChinaHsu Wei-Che, Taipei, Taiwan, R.O. ChinaHtoi Kai, Yangon, MyanmarHu Yuanfeng, Shanghai, P.R. ChinaHu Zhengying, Shanghai, P.R. ChinaHuang Chiao-Ying, Richmond, Surrey Huang Chunzhong, Guangxi, P.R. ChinaHuang Mulin, Changde, Hunan, P.R. ChinaHuang Ting, Jingjiang, Jiangsu, P.R. ChinaHuang Xi, Shanghai, P.R. ChinaHuang Xiaowen, Nanning City, Guangxi, P.R. ChinaHuang Yishun, Guilin City, Guangxi, P.R. ChinaHuang Zhenghuan, Guangxi, P.R. ChinaHubbard, Amy, Aldershot, HampshireHughes, Beata, Sutton Coldfield, West MidlandsHui Ka Yeung, Kenny, Kowloon, Hong Kong

The Journal of Gemmology / 2011 / Volume 32 / No. 5–8
Page 243
Proceedings of the Gemmological Association of Great Britain and Notices
Hunter, Sam, London Imre, Alexandra, London Jackson, Christopher, Bradford, West Yorkshire Jacques, Cecile, Toulon, FranceJang Jung Hye, Gyeonggi-Do, South KoreaJangsawang, Nongnuch, Bangkok, ThailandJanse, Leonardus, Zutphen, The NetherlandsJardel, Alice, Beausoleil, FranceJeandidier, Nathalie, Asnieres-sur-Seine, FranceJeffrey, Kip, Atterton, Nuneaton, WarwickshireJeffries, Scott, Newport, Gwent Jen Chih-Yuan, Taipei, Taiwan, R.O. ChinaJiang Xue, Urumqi, Xinjiang, P.R. ChinaJiang Yi’An, Hechi City, Guangxi, P.R. ChinaJin Hua Jie, Hangzhou City, P.R. ChinaJo Ji Hee, Seoul, South KoreaJohann, Deru, Villejuif, FranceJohansson, Sandra, Kungsbacke, SwedenJonsall, Lisa, Edsbyn, SwedenJonsson, Elin, Limhamn, SwedenJoo, Soo Kyung, Naju-Si, Jeollanam-Do, South KoreaKalenda, Mujinga, Ladywood, Birmingham, West
Midlands Kanda, Sonia, Farnham Royal, BuckinghamshireKang Chung-Jui, Tainan, Taiwan, R.O. ChinaKeatwitoo, Weerachat, Bangkok, ThailandKi Hyo Gab, Songpa-Gu, Seoul, South KoreaKim Sol Hee, Buk-Gu, Ulsan, South KoreaKlints, Robins, Hounslow, Middlesex Knifeld, Stephanie Ann, Bournemouth, Dorset Knochenhauer, Cecilia, Vastra Gotalands Lan, SwedenKnudsen, Christine, Oslo, NorwayKong, Helen, Toronto, Ontario, CanadaKonishi, Mika, Kanagawa Pref., Kawasaki City, JapanKourbouzou, Maria, Athens, GreeceKozhisseril Abdul Haque, Edgbaston, Birmingham, West
Midlands Lacosta, Patricia, London Lai May Wah, Kennedy Town, Hong KongLally, Joanne Claire, Southampton, HampshireLam Man Ngor, Cherrie, Hong KongLam Pui Kwan, Kowloon, Hong KongLam Pui Pik, Kowloon, Hong KongLambert, Amelie, London Laszlo, Linda, Budapest, HungaryLau, Ingrid, Hong KongLau Yin Ling Lecky, New Territories, Hong KongLaureau, Corinne, La Madeleine-de-Nonancourt, FranceLavoie, Martine, Montreal, Quebec, CanadaLaw, Yuk Fung, New Territories, Hong KongLee Chang-Hsin, Taipei, Taiwan, R.O. China
Lee Hae Ji, Seo-Gu, Dajeon, South KoreaLee Hye Ran, Gwangjin-Gu, Seoul, South KoreaLee Jae Hyun, Chungcheongbuk-do, South KoreaLei Ying, Beijing, P.R. ChinaLeong Chio Meng, Wai Un Fa Un, Macau, P.R. ChinaLesouef, Julie, London Leung, Elsa, Mid Levels, Hong KongLi, Lida, Birmingham, West Midlands Li Chenxi, Tan’an City, Shandong , P.R. ChinaLi Hui, Chi Fen City, Inner Mongolia , P.R. ChinaLi Liuyi, Baise City, Guangxi, P.R. ChinaLi Li, Guigang City, Guangxi, P.R. ChinaLi Qi, Qionghai City, Hainan, P.R. ChinaLi Yuan, Beijing, P.R. ChinaLiang, Wenhua, Nanning City, Guangxi, P.R. ChinaLin Guangkai, Beihai City, Guangxi, P.R. ChinaLindelow, Susanna, Malmö, SwedenLindvall, Lisa, Nacka, SwedenLiu Feng, Guangzhou City, P.R. ChinaLiu Lu, Shenzhen City, P.R. ChinaLiu Si Tong, Beijing City, P.R. ChinaLiu Ye, Shanghai, P.R. ChinaLiu Yunting, Deyang City, Sichuan, P.R. ChinaLiu Yunzhong, Beijing, P.R. ChinaLo Che Hong Chris, Kowloon, Hong KongLopez, Gisele, Pomérols, FranceLoumagne, Antoine, Fragnes, FranceLove, Mary, Alabama, U.S.A.Lubunga, Justin, Clamart, FranceLv Yandi, Wu Xi Shi, Jiangsu Sheng, P.R. ChinaMa Sui Hung, Kowloon, Hong KongMa Ruiwei, Quzhou City, Zhejiang, P.R. ChinaMa Shui Chu, Kowloon, Hong KongMa Tingting, Shanghai, P.R. ChinaMa Yutong, Beijing, P.R. ChinaMcCallum, Neil Keith, Martinborough, New ZealandMack, Darling, Dollard-des-Ormeaux, Quebec, CanadaMacMillan, Margaret-Anne, Grangemouth, StirlingshireMak Kwan Ting, Kowloon Tong, Hong KongMak Yee Ki, Tuen Mun, Hong KongMak Yee Man, New Territories, Hong KongMallett, Alex, Cubert, Cornwall Man Lai Wa, New Territories, Hong KongManeekrajangsaeng, Marisa, Bangkok, ThailandMarier, Valerie, Acton Vale, Quebec, CanadaMartin-Gutierrez, Francesca, London Mas, Anais, Vitrolles, FranceMatsumoto, Mami, Nara-City, Nara Pref., JapanMeissirel, Mathilde, Canterbury, Kent Miranda, Tânia, Geneva, SwitzerlandMitchell, Anne Susan, Harpenden, Hertfordshire
The Journal of Gemmology / 2011 / Volume 32 / No. 5–8
Page 244
Proceedings of the Gemmological Association of Great Britain and Notices
Mitchell, Shirley D., Windsor, Berkshire Mo Lulu, Guangxi, P.R. ChinaMo Xiangzhi, Hepu County, Guangxi, P.R. ChinaMok Khomkrit, Kowloon, Hong KongMok Yan Yan, Kowloon, Hong KongMolina, Jose, Malaga, SpainMui Mei Kuen, New Territories, Hong KongNadeeva, Katerina, London Napawongsuwan, Nilwan, Lopburi, ThailandNegus, Patricia, Moor, County DurhamNg So Ching, New Territories, Hong KongNgan Ian Nei, Jenny, Pak Lei San Chun, Macau, P.R.
ChinaNguyen, Michel, Saintry-sur-Seine, FranceNiala, Josephine, Nairobi, KenyaNie Ting, Zhong Xue, P.R. ChinaNilsson, Paul Graham, Triton, Auckland, New ZealandOdén, Naime Marielle Angelica, Brunflo, SwedenOkayasu, Rie, Antananarivo, MadagascarOlausson, Hasse, Hunnebostrand, SwedenOqvist, Elin, Örebro, SwedenO’Sullivan, Lauren, Glenside, Pennsylvania, U.S.A.Pallot, Emily Elise, St Johns, Jersey, Channel IslandsPalmieri, Angelo, New York, U.S.A.Palmieri, Donald A., New York, U.S.A.Pan Shenchao, Shanghai, P.R. ChinaPapaux, David, Geneva, SwitzerlandPark Jong Min, Dalseo-Gu, Daegu, South KoreaPark Sang Hyun, Seo-Gu, Daejeon, South KoreaPark Seo Kyeong, Cheonan-Si, Chungcheongnam-do,
South KoreaPatel, Hiren, London Payne, Alison, London Pentelow, Irene, Shrewsbury, ShropshirePermingeat, Fabrice, Arzon, FrancePhillips, Jane, Hendra, Queensland, AustraliaPino, Loredana, Chiavari, ItalyPoisson, Francis, Montreal, Quebec, CanadaPorter, Rex, Hartley Whitney, Hook, HampshireQin Yu Song, Jilin, P.R. ChinaRaj, Amrit, Jaipur, IndiaRao Jinghui, Xiamen City, Fujian , P.R. ChinaRapti, Spyridoula, Glyfada, GreeceRaybaut, Eric, Montreal, Quebec, CanadaReynolds, Eva, Cleve Hill, Cheltenham, GloucestershireRoberts, Barry, Beckenham, Kent Roberts, Deborah, Holloway, London Roden, Rhiannon, Derby Rothstein, Michaela, Lindingö, SwedenRussell, Lucy, Kidderminster, WorcestershireRutherford, Rhys, Gloucester, Gloucestershire
Sandin, Emilia, Lannavaara, SwedenSantarsiere, Miguel Angel, Folkestone, Kent Scott, Vicki, Hollywell, Queensland, AustraliaSena, Aree, London Sepper, Mariliis, LondonShen Lingyun, Shanghai, P.R. ChinaShen Yan, Shanghai, P.R. ChinaShepherd, Steve, Greenbank, Queensland, AustraliaShi Miao, Beijing, P.R. ChinaSimpson, Christopher, Weybridge, Surrey Smith, Billy, Colchester, Essex Sombatworapat, Supatra, Bangkok, ThailandSong Chuxin, Luoyang City, Henan, P.R. ChinaSong Wen, Tianjin City, P.R. ChinaSorensen, René, Viborg, DenmarkSpringe, Karl, Lannavaara, SwedenStevens, Sophie, Kingston-upon-Thames, Surrey, Su Shi, Xuan Wu, Beijing, P.R. ChinaSun Hsiang-Han, Taichung, Taiwan, R.O. ChinaSundqvist, Sonja, Hägersten, SwedenSurensoy, Zubeyde, London Suzuki, Yuri, Fulham, Fulham, London Swe, Thet Htar, Yangon, MyanmarTan Xiaoyan, Shanghai, P.R. ChinaTan Zhuting, Birmingham, West Midlands Tanaka, Atsuko, Tokyo, JapanTang Wenguan, Nanning City, Guangxi, P.R. ChinaTao Jiangli, Wuhu, Anhui, P.R. ChinaThongthai, Natheethong, Bangplee, Samutprakarn,
ThailandTin Yin, Vicki, Kowloon, Hong KongTorretta, Janice, Glen Spey, New York, U.S.A.Triantafillidis, Antonia, Montreal, Quebec, CanadaTsai Ta-Wei, Taiwan, R.O. China Tsang Yuk Lung, Billie, New Territories, Hong KongTse Man Fung, New Territories, Hong KongTse Ping, New Territories, Hong KongTseng De-Luen, Taipei, Taiwan, R.O. ChinaTun, Danny, Yangon, MyanmarTyler, Linda, Wokingham, Berkshire Ullmer-Schindler, Jacquelyn, Englewood, Ohio, U.S.A.Vahman, Sarira, Westmount, Quebec, CanadaVan Der Wolf, Nicole, Dublin, Republic of IrelandVan Lenten, Andrea, Red Bank, New Jersey, U.S.A.Verwijk, Moira, Toronto, Ontario, CanadaVisvanathan, Sokkalingam, SingaporeWang Jia, Jinzhou, P.R. ChinaWang Qingbo, Shanghai, P.R. ChinaWang Weiwei, Shanghai, P.R. ChinaWang Xiaojuan, Beijing, P.R. ChinaWang Yan, Beijing, P.R. China
The Journal of Gemmology / 2011 / Volume 32 / No. 5–8
Page 245
Proceedings of the Gemmological Association of Great Britain and Notices
Wang Yue, Guangzhou City, P.R. ChinaWang Zhexin, Zhoushan City, Zhejiang, P.R. ChinaWarner, Simon, Amershan, BuckinghamshireWarren, Rebecca, Kenilworth, WarwickshireWeber, Thorsten, Steinmaur, SwitzerlandWengrowe, Lauren, London Westwood, Timothy, Putney Heath, London Will, Diana, Howth, County Dublin, Republic of IrelandWong, Jackson, Kowloon, Hong KongWong, Sabina, Richmond, British Columbia, CanadaWong Gwin Hang, New Territories, Hong KongWong Man Ho, Hunghom, Hong KongWong Ting, Kowloon, Hong KongWong Yi Sai, Kowloon, Hong KongWong Yuk Man, Janice, Kowloon, Hong KongWoodrow, Gillian, Wokingham, Berkshire Woods, Georgina, London Wu Fei, Takapuna, Auckland, New ZealandWu Huijuan, Anlu City, Hubei, P.R. ChinaWu Shih-Ying, Taipei, Taiwan, R.O. ChinaWu Tianyi, Beijing, P.R. ChinaWu Xiaoting, Shandong, P.R. ChinaWyndham, Jessica, Stanmore, Middlesex Xu Chun, Zhejiang , P.R. ChinaXu Jingzhe, Colombo, Sri LankaXu Lixin, Beijing, P.R. ChinaXu Yang, Tianjin City, P.R. ChinaXu Yanyan, Shanghai, P.R. China
Yang Yufei, Pan Yu, Guangzhou City, P.R. ChinaYeh Wen-Ting, Taipei, Taiwan, R.O. ChinaYeung Sin Yee, New Territories, Hong KongYevno, Nahir, Västra Frölunda, SwedenYin Yue, Xinyang City, Henan, P.R. ChinaYoung, Olivia, London Yu Ho Fai, New Territories, Hong KongYu Qingyuan, Guangzhou, P.R. ChinaYuan Miao, Hangzhou, P.R. ChinaYuen Lung Hon, New Territories, Hong KongYuen Shui Ping, Central, Hong KongYukiko, Horie, Tokyo, JapanZavala, Diana, Round Rock, Texas, U.S.A.Zhang Congcong, Shandong , P.R. ChinaZhang Jian, Beijing, P.R. ChinaZhang Rui Jia, Kunming, P.R. ChinaZhang Yiqun, Beijing, P.R. ChinaZhang Yunting, Qingdao, Shandong , P.R. ChinaZhao Lu, Shanghai, P.R. ChinaZheng Kexiu, Zhejiang, P.R. ChinaZheng Xin, Shan Tou, Jin Xin Hua Yuan, P.R. ChinaZheng Yifei, Shanghai, P.R. ChinaZhou Haohao, Beijing, P.R. ChinaZhou Mei, Guangxi, P.R. ChinaZhou Yuping, Shanwei City, P.R. ChinaZhu Lin, Wanzhuang, Langfang, Hebei, P.R. ChinaZuo Youjing, Nanjing City, Guangxi, P.R. China
Qualified with Distinction
Dennis, Louise, Halesowen, West Midlands Gowans-Poli, Julie, LondonGriffith, Julia Anna, Southampton, HampshireLacosta, Patricia, LondonLiao Caihuan, Nanning City, Guanxi, P.R. ChinaLogan, Peter M., Coventry, WarwickshireLudlam, Louise Helen, Birmingham, West MidlandsNing Liu, Beijing, P.R. ChinaTao Jiangli, Anhui, P.R. ChinaWestley, Penny, Hagley, WorcestershireWong Shing Shun, Philip, Guangzhou City, Guangdong,
P.R. China
Qualified with Merit
Han Xi, Beijing, P.R. ChinaMcKeown, Julia, Oldbury, West MidlandsMan Yee Kong, Tuen Mun, Hong KongPetropoulou, Eleni, Athens, Greece
Gem Diamond Diploma examination
Roberts, Barry, Beckenham, KentSamartseva, Julia, Bracknell, BerkshireSandoval-Williams, Cuauhtemoc, Fribourg, Switzerland
Qualified
Beale, Sioned Ann, Lapworth, WarwickshireByrne, David Mark, Cradley Heath, West MidlandsChen Weiguang, Zhujiang Newtown, Guangzhou, P.R.
ChinaChen Jun, Yujiashan, Hubei, P.R. ChinaChetwin, Sheridan Lesley, Morecambe, LancashireCheung Ching Chi, Hong KongChoi Tsz Ling, Kowloon, Hong KongChow Chiu Hung, Chris, Kowloon, Hong KongChoy Ka Mei, Quarry Bay, Hong KongCriaco, Leo, LondonDi Sera, Susanna, Rome, ItalyDulay, Sundeep, Leamington Spa, WarwickshireFeng Leyuan, Guangzhou, P.R. China

The Journal of Gemmology / 2011 / Volume 32 / No. 5–8
Page 246
Proceedings of the Gemmological Association of Great Britain and Notices
Goshanth, Namasivayam Pillai, Kandy, Sri LankaHui Ka Ching, New Territories, Hong KongJunjie Lu, Beijing, P.R. ChinaKnudsen, Christine, Oslo, NorwayKo Yuen Yuk, Hong KongKum-Yun Tai, Fiona, LondonLau Pui Ting, Yau Tong, Hong KongLee Chak Man, Kowloon, Hong KongLemeshko, Nathalie, LondonLeung Ching Yee, Kowloon, Hong KongLeung Sin Ming, New Territories, Hong KongLi Huanhuan, Yujiashan, Hubei, P.R. ChinaLi Jin, Yujiashan, Hubei, P.R. ChinaLiang Yuanyuan, Hong KongLiu Haodan, Beijing, P.R. ChinaLok Chi Keung, Chai Wan, Hong KongManasse, Daniele, Rome, ItalyMkogian, Elen, Thessaloniki, GreeceNg Siu Kwai, New Territories, Hong KongO’Cock, Sabrina Alice Palmer, LondonPetropoulou, Alexia, Nea Symrni, Athens, GreecePui Fan Yu, Kowloon, Hong Kong Rimmer, Heather Elizabeth, Lichfield, Staffordshire Roditi, David Hubert, LondonRufeng Liu, Beijing, P.R. ChinaSallie, James Norman, Boughton, NorthamptonshireShao Xinyuan, Yujiashan, Hubei, P.R. China
Shi Su, Beijing, P.R. ChinaSze Pui Gee, Peggy, Kowloon, Hong KongTan Zhuting, Birmingham, West MidlandsTao Cheung Sin, New Territories, Hong KongTong Wai Yin, Aberdeen, Hong Kong Tsui Ka Kin, Kenneth, New Territories, Hong KongVisvanathan, Sokkalingam, Singapore Vodyanova-Hitzi, Elena, Athens, Greece Wang Wenjun, Zhujiang Newtown, Guangzhou,
P.R. ChinaWeiyan Feng, Beijing, P.R. ChinaWen Wen, Beijing, P.R. ChinaWetherall, Alan, Hitchin, HertfordshireWong Hoi Lam, Colleen, New Territories, Hong KongXiaojun Zhou, Beijing, P.R. ChinaXue Yanan, Yujiashan, Hubei, P.R. ChinaXueying Wu, Beijing, P.R. ChinaYau Chun Fai, Chai Wan, Hong KongYing Wai Kwong, Richard Alexander, Ap Lei Chau,
Hong KongYu Ho Fai, New Territories, Hong KongZhao Huiyun, Beijing, P.R. ChinaZhao Yangyang, Beijing, P.R. ChinaZheng Xin, Beijing, P.R. ChinaZhu Lin, Beijing, P.R. China
During 2011, the Council approved the election to
Membership of the following:
Fellowship and Diamond Membership (FGa DGa)Chai Yuet, New Territories , Hong KongChan Lim Chi, Ap Lei Chau, Hong KongCheung Yuk King, New Territories, Hong KongChoi Wing Cheong, Chai Wan, Hong KongFong Tik Kwan, Tseung Kwan O, Hong KongHarris, Jennifer, Auckland, New ZealandLee Wai Kwok, Simon, New Territories, Hong KongMai Zhi Qiang, Guangzhou, P.R. ChinaOwen, Cheryl, Birmingham, West MidlandsReynolds, Eva, Cheltenham, GloucestershireWong Wing Suet, Kowloon, Hong KongYin Ying Ngan, Betty, Kowloon, Hong Kong
Fellowship (FGa)Allen, Amanda, Northampton Andren Georgsen, Cecilia, Lund, SwedenBane, Jonathan, Sheffield, South Yorkshire
Butini, Enrico, Rome, ItalyButini, Flavio, Rome, ItalyChayathorn, Chanruangvanich, Bangkok, ThailandChen Binhui, Guangzhou, P.R. ChinaChui Wing Chung, Kowloon, Hong KongCooper, Amy, Las Vegas, Nevada, U.S.A.Costanzo, Alessandra, Rahoon, Galway, IrelandCox, Rebecca Jane, YorkCrockett, Sheri, Santa Cruz, California, U.S.A.Dartois, Quentin, Vence, FranceDe Gaspé Beaubien, Isabelle, Montreal, Quebec, CanadaDennis, Louise, Halesowen, West MidlandsDeutschl, Norbert, Montreal, Quebec, CanadaFitchko, Dorian Nicholaus, Montreal, Quebec, CanadaFranks, Elliot, Worthing, West SussexGauci, Karen Elizabeth, Burnaby, British Columbia,
CanadaGross, Robyn, Mont Royal, Quebec, CanadaGu Jialu, Shanghai, P.R. ChinaHansen, Robin, Warminster, Wiltshire
Membership

The Journal of Gemmology / 2011 / Volume 32 / No. 5–8
Page 247
Proceedings of the Gemmological Association of Great Britain and Notices
Herzog, Franz Adrian, Oltingen, SwitzerlandIvancic, Ivan, Colombo, Sri LankaJacquier, Nathalie, Genthod, SwitzerlandJain, Sanjay, Karnataka, IndiaJohnston, Meredith, Marcoola, Queensland, AustraliaJokinen, Tiina, Tampere, FinlandJones, L. Bruce, Rathdrum, Idaho, U.S.A.Karimzadeh, Leyla, LondonKim Sang Ki, Seoul, KoreaKirkham, Sally, Birmingham, West MidlandsKlinski, Frank, Niebüll, GermanyLahtinen, Tiina, Oitti, FinlandLai Nga Ting, London, Lawson, Charles, Brisbane, Queensland, AustraliaLee, Alix, Rognes, FranceLee, Sealim, LondonLemaire, Alisson, Drummondville, Quebec, CanadaLi Liufen, Guangzhou, P.R. ChinaMaclean, Victoria, LondonManeekrajangsaeng, Marisa, Bangkok, ThailandMayer, Melanie, St Lawrence, Jersey, Channel IslandsMayer, Helen, LondonMenard, Georges-Etienne, Saint Hyacinthe, Quebec,
CanadaMinassian Bardehshahi, Odett, Mykonos, GreeceMitchell, Anne Susan, Harpenden, HertfordshireMogridge, Emma Denise, Birmingham, West MidlandsNeurauter, Amy, New York, U.S.A.Nguyen, Michel, Saintry-sur-Seine, FrancePalliyaguruge, Lalaka, Battaramulla, Sri LankaParkes, Matthew, Dublin, IrelandPatenaude, Lizanne, Westmount, Quebec, CanadaPerosino, Lorenzo, Novi Ligure, ItalyRegala, Benjamin, Aiea, Hawaii, U.S.A.Reynaud, Lucy, SingaporeRichbourg, Carole, Los Altos, California, U.S.A.Rocchiero, Loredana, Genova, ItalySawas, Jeremy, Montreal, Quebec, CanadaShenoi, Anita, Longhope, GloucestershireSheridan, Meghan, Upper Montclair, New Jersey, U.S.A.Shevchenko, Olga, Montreal, Quebec, CanadaSibley, Christopher, St. Albans, HertfordshireTai Ai-Hwa, LondonTong Siu-Kuen, Ma On Shan, Hong KongValentini, Francesca, LondonVerma, Dheeraj, Palwal, IndiaVoulgaridis, Konstantinos, LondonWard, Sarah, Leeds, West YorkshireWeyers, Stefanus Salomon, Bloemfontein, South AfricaWilson, Maria Dorothea, WarwickshireWindeyer, Patricia Annette, Brisbane, Queensland,
Australia
Woodcock, Olga Faye, Basingstoke, HampshireWu Chung-Kang, Taipei, Taiwan, R.O. ChinaYat, Richard, New Territories, Hong KongYueping Luo, Beijing, P.R. ChinaZdeb, Robert, Epping, Essex
Diamond Membership (DGa)Chetwin, Sheridan, Morecambe, LancashireDulay, Sundeep, Leamington Spa, WarwickshireGong, Sheng Wei, Guangzhou, Guangdong, P.R. ChinaGriffith, Julia, Southampton, HampshireNamasivayam, Goshanth, Kegalle, Sri LankaRoberts, Barry, Beckenham, KentRoche, Patrick, Ballydehob, West Cork, IrelandSallie, James, Boughton, NorthamptonshireSamartseva, Julia, Bracknell, BerkshireSpenser, Sarah, LondonStarkey, Imogen M.S., Shanklin, Isle of WightStephenson, Elizabeth, Poole, DorsetTai Kum-Yun, Fiona, LondonTan Zhuting,, Birmingham, West MidlandsYing Wai Kwong, Richard Alexander, Ap Lei Chau, Hong
Kong
associate MembersAdrem, Hanna, Saltsjobaden, SwedenAfemikhe, Eunice, Morden, SurreyAl-Yawer, Najwa, LondonBealey, Philip, Ilfracombe, DevonBhargav, Deepak Prakash, Birmingham, West MidlandsBishop, Carole, Marlborough, WiltshireBraun-Goldinger, Bettina, Küsnacht, SwitzerlandBurman, Marc, LondonDaya Zakir, Djunivia Hamdini, Bogor, IndonesiaDe Basilio, Adolfo, Madrid, SpainDixon, Katie-Jean, Auckland, New ZealandEmmerton, Peter Gordon, Lindfield, West SussexFazlali-Zadeh, Sonia, LondonFederico Becker, Giovanna, New York, U.S.A.Fleming, Ellen, LondonHartogsohn, Ira, Copenhagen, DenmarkHelps, Mark, Chislehurst, KentHillcoat, Cathryn, Wheathampstead, HertfordshireHodges, Jayne, Canvey Island, EssexHyder, Saarah, Dewsbury, West YorkshireIsherwood, Nicholas John, Burgess Hill, West SussexKaplan Gross, Frieda, LondonKim, Jinchang, Seoul, R.O. KoreaLobenstein, Meir, LondonMa Tingting, Shanghai, P.R. ChinaManley, Deborah Jane, Bridgwater, SomersetMastrolorenzo, Maurizio, Paris, FranceMatthews, Kate Louise, Auchenblae, Aberdeenshire

The Journal of Gemmology / 2011 / Volume 32 / No. 5–8
Page 248
Proceedings of the Gemmological Association of Great Britain and Notices
Maury, Christophe, New Malden, SurreyMazza-Newmann, Deborah, Rochester, KentMok, Barend, Halifax, West YorkshireMolina, Jose, Malaga, SpainMorgan, Lorisa, Holywell, Flintshire Moses, June, LondonMumford, Nicola, LondonMurphy, Heather, Bolton, LancashireNielsen, David, LondonO’Faolain, Stephen, Sandymount, Co. Dublin, IrelandPattani, Arun, Harrow, MiddlesexPhilp, Alexander W.L., Banchory, AberdeenshirePortch, Amanda, Wolli Creek, New South Wales, AustraliaRegala, Benjamin, Aiea, Hawaii, U.S.A.Sandecki, Anne Marie, Parsippany, New Jersey, U.S.A.Shah, Arvind, London
Shaikh, Hanif, LondonShen, Mei, Taipei, Taiwan, R.O. ChinaSliti, Sondos, Dubai, U.A.E.Steinbach, Martin, Idar-Oberstein, GermanyStreet, Neil, Wilton, Connecticut, U.S.A.Tatlow, Emily Louise, Guildford, SurreyThilakaratne, Kanishka Lalith, Kandy, Sri LankaToufexis, Mario, LondonValasmo, Hannu, Vantaa, FinlandVan Der Westhuizen, Victor, Kingston upon Thames,
SurreyWay Hnin, Newcastle upon Tyne, Tyne and WearWindeyer, Patricia Annette, Brisbane, Queensland,
AustraliaWinterflood, Letitia, LondonWong, Flora, Hong Kong
Bear essentials, Missouri, U.S.A., for diffused andesine
teaching samples.
Brian D. Cooksey FGa DGa, Elizabeth Cannon
Antiques, Colchester, Essex, for two faceted tourmalines.
Deryck Fitzsimmons, Borehamwood, Hertfordshire,
for a selection of jeremejevite crystals.
adrienne H. Grahame-Ballin FGa, Drummore,
Scotland, for three agate and tourmaline pendants.
Dr roger Harding FGa, Devizes, Wiltshire, for a
selection of gemmological books and mineral samples.
Dr Donald Hoover FGa, Springfield, Missouri, U.S.A.,
for topaz crystals and selenite crystals from Lake Milton,
Ohio
jochen Knigge, Brasil Opal, Lampertheim, Germany,
for a Brazilian opal and a DVD entitled The Precious
Opals of Pedro Segundo.
Marcia Lanyon FGa, London, for a selection of
gemstones.
Susanne Lesley FGa rj Dip, Maidenhead, Berkshire,
for a selection of gemmological testing equipment.
Cora patel, Bolton, Lancashire, for a large faceted
amethyst displaying textbook ‘tiger stripe’ inclusions
Martin p Steinbach, Idar-Oberstein, Germany, for two
pieces of trapiche ‘Cerasite’ (a trapiche variety of altered
cordierite) from Japan, a trapiche sapphire, a piece of
sapphire in matrix from the Urals, Russia, a star sapphire
from Thailand displaying a 12-rayed star, a foil backed
paste star stone and a piece of haüynite in matrix.
The Association is most grateful to the following for their gifts and donations for research and teaching purposes:
Gifts and Donations to the Association
Henry Gerald Stonley FGa, Aylesbury,
Buckinghamshire, for a large selection of cut
gemstones.
David Weinberg, Bangkok, Thailand, for a selection
of zircon sample stones, plus stones of similar
appearance.
Diana Lesley Wenham FGa DGa, Harrow,
Middlesex, for a selection of back issues of The
Journal of Gemmology.
jason Williams FGa DGa, G.F. Williams, London, for
a selection of gemstones including amethyst, cameo,
CZ, emerald, ruby, sapphire, smoky quartz and blue
topaz.
Gladys Yao for a selection of cut gemstones.
Monetary donations were gratefully received from:
petra Bardehle FGa, Holzhausen, Germany
philip Bealey, Ilfracombe, Devon
anthony james Boyce FGa, Doncaster, South Yorkshire
Vincenzo De Michele, Milan, Italy
james C. Finlayson FGa, Stoke on Trent, Staffordshire
Meryan Holman FGa, London
Kiyokatsu Koike FGa, Toride, Japan
Torbjorn Lindwall FGa DGa, Lannavaara, Sweden
john Mason FGa, Harrogate, North Yorkshire
Veronica Wetten FGa, Hounslow, Middlesex
Christine Woodward FGa DGa, Chiswick, London

The Journal of Gemmology / 2011 / Volume 32 / No. 5–8
Page 249
Proceedings of the Gemmological Association of Great Britain and Notices
Wood, Nina, LondonYouenes, Gina, Cambridge
Gold Corporate MembershipAlisha Gems, Rochdale, LancashireChevenix Jewellery, Woodbridge, SuffolkJust Gems, AberdeenNexus Agencies Ltd, Birmingham, West MidlandsPercy Davies & Son Ltd, Gerrards Cross, BuckinghamshireRudell & Co. Ltd, Wolverhampton, StaffordshireShri Nadika Jewellery, Ilford, Essex
Corporate MembershipBassange, LondonBonhams, LondonIP Diamonds Ltd, LondonIMK Ltd, LondonKuropatna Brothers, LondonRamesh Jewellers, LondonSimvinell Ltd, London
TransfersFellowship to Fellowship and Diamond Membership (FGa DGa)Byrne, David, Cradley Heath, West MidlandsDennis, Louise, Halesowen, West MidlandsGowans-Poli, Julie, LondonMcKeown, Julia, Oldbury, West MidlandsO’Cock, Sabrina, LondonVisvanathan, Sokkalingam, SingaporeWestley, Penny, WorcestershireWetherall, Alan, Hitchin, Hertfordshire
Diamond Membership to Fellowship and Diamond Membership (FGa DGa)Diamond, Marcia, LondonLaCosta, Patricia, LondonPoon Pak Kei, New Territories, Hong Kong
associate Membership to Fellowship (FGa)Antonucci, Andrea, Stockholm, SwedenElliott, Paul, Woodville, South Australia, AustraliaHardy, Sarah, Stockton-on-Tees, County DurhamHunt, Glynis, Andover, HampshireHutchinson, Fiona, Albourne, West SussexIkeuchi, Mototeru, Tokyo, JapanJamieson, Pauline, Edinburgh, MidlothianJohnson, Helen, Edinburgh, MidlothianKaye, Charlotte, Hungerford, BerkshireKnutsen, Annmari, Oslo, NorwayLoosvelt, Bart, Kortrijk, BelgiumMa Tingting, Shanghai, P.R. ChinaMatsura, Miho, Yokohama, Japan
Ratnayake, Dayanthi, Colombo, Sri LankaSakakibara, Kenichi, Oita, JapanTew, Timothy David, Atlanta, Georgia, U.S.A.Verwijk, Moira, Toronto, Ontario, CanadaYamaguchi, Nao, Osaka, Japan
associate Membership to Diamond Membership (DGa)Lemeshko, Nathalie, LondonManasse, Daniel, Rome, ItalyRoditi, David, London
Annual General Meeting
The Annual General Meeting was held on Thursday 7
July 2011 at the Imperial Hotel, London WC1. The meeting
was chaired by James Riley the Chairman of the Council.
The Annual Report and Accounts were approved. Brian
Jackson, Cally Oldershaw and Steve Jordan (who had
been appointed by the Council since the 2010 Annual
General Meeting) were re-elected to serve on the Council.
Alan Collins retired from the Council in rotation and did
not seek re-election. Gwyn Green was re-elected and
Kerry Gregory and Elizabeth Gleave elected to serve on
the Membership Liaison Committee. Hazlems Fenton were
re-appointed as auditors for the year.
Subscriptions 2012
The membership subscriptions for 2012 remain at
£90 for UK members and £95 for those in Europe and
overseas.
Obituary
Brian r. Dunn FGa (D.1978), Staplehurst, Kent, died suddenly in December 2011. Brian, a former chairman of the NAG Valuations Committee, ran a number of seminars for Gem-A members on the valuation of antique and modern jewellery.
james (jim) Gemmell FGa (D.1992), Kelloe, Co. Durham, died on 10 April 2011 aged 86. A skilled faceter, Jim was instrumental in setting up the UK Facet Cutters Guild (UKFCG) in 1994 and served as chairman of the Guild for nine years.
Helen Muller FGa (Tully Medal 1974) died on 4 January 2012. Helen was an expert on jet and published three books on the subject.
edward H. Wain FGa (D.1964), Kings Lynn, Norfolk, died in 2011.

The Journal of Gemmology / 2011 / Volume 32 / No. 5–8
Page 250
Proceedings of the Gemmological Association of Great Britain and Notices
George Bosshart, who died on 14 January aged 68,
was one of the most stimulating and internationally
respected gemmologists of the last thirty years.
His main interest was diamonds, especially green
diamonds, but his talent for incisive and well-
researched investigation was applied also to emeralds,
rubies, sapphires and a range of other coloured gem
species.
George was born on 8 May 1943 in Rüti, canton
of Zürich, Switzerland, the son of Georg Albert and
Martha Magdalena Bosshart; his younger brother
Robert was born the following year. His early
education was in Rüti and with Robert he had a very
active and ‘sporty’ childhood. He graduated from the
cantonal college in Wetzikon in 1963 with languages
and natural sciences as main subjects and then
attended an air defence training school, qualifying as
a radar operator. This phase of his life may well have
sown the seed of his ambition to become a Swissair
pilot but such a career was not to be — ruled out by
injuries sustained in a near-fatal automobile accident.
He recovered, and instead directed his energy into
earth science studies at the Swiss Federal Institute of
Technology (Eidgenössische-Technische Hochschule
(ETH)) in Zürich with the aim, as he put it, of an
“uncommon future occupation involving language
skills and travelling”. He graduated in 1969 with a
Master’s degree in earth sciences and was employed
first in ore prospecting using geophysics in Canada.
However, a position in mineralogical analysis at the
aluminium producer ALCAN in Quebec soon proved
more attractive and he spent three years in their R and
D division. It was during this time that his interest in
gems started to grow and he studied in Los Angeles at
the GIA, qualifying as a GG. By 1974 he was looking
at ways of furthering his career and a project of the
Swiss Watch and Jewellery Associations tempted him
most. This was to set up a gem testing laboratory
for the Swiss Foundation for Research of Gemstones
(SSEF) in Zürich. This he established with the motto
‘Reliability, rigour, integrity’, and during his sixteen
years there, he pioneered analytical techniques for
advanced gemstone testing, authored articles on gem
identification in several languages, and, with his new
colleague Dr Henry Hänni, introduced a service which
offered opinions on the geographical origins of rubies,
sapphires and emeralds on the basis of analyses of
stones that they themselves had collected or sourced.
After he left in 1990, it gave George much satisfaction
to see the SSEF lab under its subsequent directors Drs
Hänni and Krzemnicki grow and prosper. During his
time at SSEF, he proposed and in 1988 was granted
permission to record infrared and cryogenic, high-
resolution ultraviolet to visible absorption spectra of
the historic ‘Dresden Green’ diamond to establish its
fundamental properties and also to improve the criteria
for distinguishing natural green from artificially-induced
green diamonds (i.e. artificially irradiated stones). The
innocuous-looking words “... proposed ... granted ...”
used above, gloss over a saga about which George
could speak for a whole evening, one in which
the Dresden authorities needed convincing about
the security of the stone, introduction of analytical
equipment to the Vaults, and reassurance about
George Bosshart, MSc, SFIT, GG, CSEJ
1943–2012

The Journal of Gemmology / 2011 / Volume 32 / No. 5–8
Page 251
Proceedings of the Gemmological Association of Great Britain and Notices
measuring procedures not changing the diamond’s
colour. In addition, there was a dispute with GIA
gemmologists which eventually led to each team’s work
being published separately. Indeed green diamonds
continue to contain some mysteries and George’s most
recent publication on the topic was in 2008.
In 1990 George was appointed Chief Gemmologist
of the Gübelin Gemmological Laboratory in Lucerne,
a move prompted by the opportunity for more far-
reaching visits to gem market centres and gem mining
locations. First assignments took him to Kunming,
Tokyo and Riyadh. Later he visited East African
countries and many if not most of the countries in
the Far East — of which treks in 1993 to Mogok and
1997 to the jadeite mines in upper Burma were the
most challenging. Since 1995 the Gübelin Gem Lab
has regularly offered external testing weeks to the
gem trade and auction houses in Bangkok, Hong
Kong and New York, services which helped their
global recognition. George disliked the growing
numbers of artificially treated and synthetic gems
that came onto the market in the 80s and 90s but in
1999, with his typical realism, he became involved in
researching detection of type IIa diamonds which had
been decolourized by high pressure high temperature
techniques in Russian and American laboratories.
In 2004 George took early retirement to concentrate
on enlarging and improving the analytical database
for blue-green to yellow-green diamonds, whether
naturally or artificially irradiated. This ‘Green Diamond
Research Project’ involved working with colleagues
in the SSEF and Gübelin laboratories, with museums,
and with colleagues in Paris, and highlights an
important thread throughout his career that led to
many publications and presentations at international
meetings. In such research, he was a reliable co-
worker, but the extent of his determination to complete
everything he had committed himself to meant that
meeting deadlines was at times quite tense.
The gem trade, gemmology and gem testing have,
over the last forty years, seen a growing number of
new stone localities, new synthetics and innovative
treatments, and George has played a full part in their
detection, description and disclosure. His first paper in
The Journal of Gemmology in 1978 was a description
of stabilized cubic zirconias, and this remains a first-
class example to gemmology students of how to carry
out and report on such an investigation. Since then
he has graced the Journal pages with his work on the
Dresden Green diamond, major papers on Colombian
emeralds, freshwater pearl cultivation in Vietnam, and
colour-change stones, to name but a few of the topics
he addressed. In 1994 he accepted an invitation to join
the Journal’s board of Associate Editors and his critical,
fair and balanced assessment of a submitted manuscript
was always something to look forward to for the editor.
He also served in the same way on the board of the
Australian Gemmologist.
George was a Swiss delegate to the International
Gemmological Conference and was on the organizing
committee for their meeting in Interlaken in 2011.
There he presented a paper on colour causes and
stability in spodumene. His significant presence on the
international stage did not mean that he neglected the
national scene. George was strongly patriotic and was
a member of the Swiss Mineralogical and Petrographic
Society, the Geological Society of Zürich, and the Swiss
Chamber of Technical and Scientific Forensic Experts.
In 1973 George met his future wife Anna Verena
Geser in New York. They married on 22 April 1977,
settled in Horgen, and in 1980 moved into their own
home overlooking Lake Zürich and the Alps. George
and Anne always enjoyed entertaining friends, and
after George took early retirement they almost had an
open house — some called it a gemmological hotel but
with limited rooms! Anne worked at Gübelin in New
York and Lucerne and became head of staff at Meister
in Zürich, and shared a love of gems and jewels with
George. This found expression in later years when she
accompanied George on some of his more demanding
treks in the Far East to see gems in their natural
settings.
Despite suffering from cancer for many years,
George was grateful he survived the accident when
he was twenty and went on to experience a colourful
world with many natural treasures, human and
otherwise, and felt that he was particularly blessed with
the companionship of a loving partner.
Roger Harding
This brief summary has drawn on notes provided by
George himself, his wife Anne and his long-standing
friend Karl Schmetzer.

The Journal of Gemmology / 2011 / Volume 32 / No. 5–8
Page 252
Proceedings of the Gemmological Association of Great Britain and Notices
A word of thanks . . .Since the 1940s the status of the Journal has been
built up by a succession of editors noted for their
gemmological knowledge and integrity. By the
1970s the pace of scientific advancement in the
discipline had started to accelerate, and by the time
that Alan Jobbins relinquished the editorial chair in
1994 it made sense to formally seek some support
for the editor from those in more specialist areas of
expertise. Thus was established a band of Assistant
and Associate Editors with a wide range of skills
very relevant to today’s gemmology. To them I owe
a great deal, not only for their technical expertise in
assessing manuscripts, but also for their constructive
comments, common sense and wise counsel.
Some members of this band also contributed
Abstracts — a technical and writing skill which I
fear at the present moment is declining but which
in the future I hope will revive as one antidote to
the information deluge we have to contend with
— and to them and the other abstractors who have
so succinctly conveyed the essences of material
published elsewhere, I offer my thanks.
Although gems have a very pervasive social
impact, this cannot be said about the associated
science, and to stimulate any appreciation about
gemmology’s practical, legal or intellectual benefits
and values, it must be presented in an attractive
way. The success of Mary Burland’s efforts in this
respect is brought home most vividly when Journal
issues through the years are laid side by side, and
the changes in size, style and impact are apparent. I
thank her for her dedication to the task, for her ability
to overcome the unforeseen and for her tolerance of
my shortcomings.
In turn, both of us have relied upon staff at the
Gem-A office, and I would like to thank them all for
their consistent willingness over many years to help
in matters concerning publications, an attitude which
makes all the difference when outside the office and
working from home.
. . . and a word of welcome!Being out of the office does however have its
disadvantages, and over time, the lack of close
personal contact with many aspects which affect the
gem trade in such places as Hatton Garden does
affect how well one can assess material submitted
for publication. I am very pleased that someone who
is in the thick of gemmological activity and who
has knowledge and access to many of the advanced
techniques now being used to examine gems, has
agreed to be the next editor. In this, the last issue of
the Journal that I will be editing, my very best wishes
go to Elise Skalwold and I wish her, the Journal and
the Association a most successful future.
roger Harding

Gemmology Foundation and Diploma Blended Learning Course(Access to a computer with an internet connection is essential)
Start dates: Online — 1 October 2012 Daytime, on-site — 29 January to June 2013On-site class days: Tuesday, Wednesday and ThursdayCourse fees: £6,950
Full details at www.gem-a.com/education.aspx or call +44 (0)20 7404 3334 email [email protected]
NEW: Gem-A Blended Learning Gemmology Courses
The GemmoloGical associaTion of GreaT BriTain
Gem-A
Starting in October 2012, Gem-A’s new blended learning gemmology courses combine the advantages of online education with on-site tuition. The courses start with a distance preparation section that can be studied anywhere in the world. This leads to on-site face-to-face seminars and practical tutorials at Gem-A’s London headquarters. This intensive fast-paced learning method covers both the Foundation and Diploma parts of Gem-A’s famous gemmology course. The on-site portion of this course consists of daytime tuition and study sessions, held three days a week for five months.
Enrolling now for October 2012
The Gemmological Association of Great Britain27 Greville Street (Saffron Hill entrance), London EC1N 8TN
tel: +44 (0)20 7404 3334 fax: +44 (0)20 7404 8843 email: [email protected]
UK Registered Charity No. 1109555

Gemmology2011 / Volume 32 / Nos. 5–8
The Journal of
ISSN: 1355-4565Printed by DG3 (Europe) LtdCopyright © 2011
Contents
27 Greville Street, London EC1N 8TN, UKT: +44 (0)20 7404 3334 F: +44 (0)20 7404 8843E: [email protected] W: www.gem-a.com
The Gemmological Association of Great Britain
Cert no. TT-COC-002454
129 Measurement and interpretation of growth patterns in chrysoberyl, including alexandrite K. Schmetzer
145 A Russian Maxixe beryl? L.O. Andersson
151 Chemical and growth zoning in trapiche tourmaline from Zambia — a re-evaluation K. Schmetzer, H.-J. Bernhardt and T. Hainschwang
174 Untreated yellowish orange sapphire exhibiting its natural colour J.M. Duroc-Danner
179 Alexandrite and colour-change chrysoberyl from the Lake Manyara alexandrite-emerald deposit in northern Tanzania K. Schmetzer and A.-K. Malsy
211 Review of ultraviolet sources for gem fluorescence and testing G. Pearson
224 Abstracts
233 Book Reviews
236 Proceedings of The Gemmological Association of Great Britain and Notices
Cover Picture: Slices of trapiche tourmaline from Zambia cut perpendicular to the c-axis. In the centre of the slice, upper left, the dark arms of the fixed three-rayed star separate three pyramidal growth sectors. The slice, lower right, cut from the same tourmaline, has a rim with six prismatic growth sectors which are separated from each other and from the pyramidal growth sectors of the centre by less transparent boundaries. View parallel to the c-axis, size of the samples about 13 × 12 mm. Photos by T. Hainschwang. (See Chemical and growth zoning in trapiche tourmaline from Zambia — a re-evaluation by K. Schmetzer, H.-J. Bernhardt and T. Hainschwang, pages 151–173.)