Gellan hydrogels: preparation, rheological ...
23
1 Gellan hydrogels: preparation, rheological characterization and application in encapsulation of curcumin Emmanuel N. Ambebila, Esther Santamaria, Alicia Maestro * , José M. Gutiérrez, Carmen González Chemical Engineering Department. Faculty of Chemistry.University of Barcelona. Martí i Franquès,1, 08028 Barcelona, Spain *[email protected] Abstract Hydrogels can be used to protect some labile active principles, as polyphenol-rich substances, that can be added to foods to prepare functional ones. Rheological properties of gels formed through the addition of calcium chloride to gellan solutions were studied. It can be concluded that preparation variables and not only formulation ones are determinant in rheological properties of the resulting gels, as they are not in an equilibrium state but they are continuously evolving during hours to stronger gels corresponding to a denser network. It could be related to the fact that local non-gelled domains are formed surrounded by a shell of gel where Ca 2+ ions take some time to arrive. A minimum Ca 2+ /gellan ratio (CG) is required to reach the gel point (GP), determined as the CG where the ratio loss modulus/elastic modulus (G”/G’) collapse for all frequencies. Calcium-induced external gelation of oil-in-water (O/W) emulsions where a curcumin-in-oil solution is the disperse phase and a watery solution of gellan is the continuous phase was used to prepare beads were curcumin is entrapped in order to prevent its degradation. Smaller droplet-sized emulsions were obtained with higher gellan concentrations, since a higher viscosity of the continuous phase allowed to reach the critical Capillary number CaC at lower radius of droplets. An encapsulation yield around 90 % was reached for gellan concentrations of 1 % w/v, and the resulting encapsulated curcumin presented around 6 times slower light degradation than free curcumin-in- oil solutions. Keywords: Gellan, Calcium, Rheology, Curcumin, Beads, Hydrocolloid, Encapsulation 1. Introduction Hydrocolloids, especially polysaccharides and some proteins, are extensively used in food industry, as they can provide specific and innovative textures [1-3], they can act as rheology modifiers and stabilize some structures Manuscript Click here to access/download;Manuscript;Article_Gellan_Alicia2018-FB- Click here to view linked References 1 2 3 4 5 6 7 8 9 10 11 12 13 14 15 16 17 18 19 20 21 22 23 24 25 26 27 28 29 30 31 32 33 34 35 36 37 38 39 40 41 42 43 44 45 46 47 48 49 50 51 52 53 54 55 56 57 58 59 60 61 62 63 64 65
Transcript of Gellan hydrogels: preparation, rheological ...

1
Gellan hydrogels: preparation, rheological
characterization and application in encapsulation
of curcumin
Emmanuel N. Ambebila, Esther Santamaria, Alicia Maestro*, José M. Gutiérrez, Carmen
González
Chemical Engineering Department. Faculty of Chemistry.University of Barcelona.
Martí i Franquès,1, 08028 Barcelona, Spain *[email protected]
Abstract
Hydrogels can be used to protect some labile active principles, as polyphenol-rich substances, that can be added
to foods to prepare functional ones. Rheological properties of gels formed through the addition of calcium
chloride to gellan solutions were studied. It can be concluded that preparation variables and not only formulation
ones are determinant in rheological properties of the resulting gels, as they are not in an equilibrium state but
they are continuously evolving during hours to stronger gels corresponding to a denser network. It could be
related to the fact that local non-gelled domains are formed surrounded by a shell of gel where Ca2+ ions take
some time to arrive. A minimum Ca2+/gellan ratio (CG) is required to reach the gel point (GP), determined as
the CG where the ratio loss modulus/elastic modulus (G”/G’) collapse for all frequencies. Calcium-induced
external gelation of oil-in-water (O/W) emulsions where a curcumin-in-oil solution is the disperse phase and a
watery solution of gellan is the continuous phase was used to prepare beads were curcumin is entrapped in order
to prevent its degradation. Smaller droplet-sized emulsions were obtained with higher gellan concentrations,
since a higher viscosity of the continuous phase allowed to reach the critical Capillary number CaC at lower
radius of droplets. An encapsulation yield around 90 % was reached for gellan concentrations of 1 % w/v, and
the resulting encapsulated curcumin presented around 6 times slower light degradation than free curcumin-in-
oil solutions.
Keywords: Gellan, Calcium, Rheology, Curcumin, Beads, Hydrocolloid, Encapsulation
1. Introduction
Hydrocolloids, especially polysaccharides and some proteins, are extensively used in food industry, as they can
provide specific and innovative textures [1-3], they can act as rheology modifiers and stabilize some structures
Manuscript Click here toaccess/download;Manuscript;Article_Gellan_Alicia2018-FB-
Click here to view linked References 1 2 3 4 5 6 7 8 9 10 11 12 13 14 15 16 17 18 19 20 21 22 23 24 25 26 27 28 29 30 31 32 33 34 35 36 37 38 39 40 41 42 43 44 45 46 47 48 49 50 51 52 53 54 55 56 57 58 59 60 61 62 63 64 65
2
due to an increase in viscosity without substantially modifying other properties of the mixture such as flavour
and colour [4]. Moreover, hydrocolloids can encapsulate and protect bioactive and/or insoluble ingredients that
can be added to conventional foods in order to transform them into functional ones, which have currently an
increasing demand [5]. Hydrocolloids could also find uses in targeted drug delivery systems [6, 7], in
pharmaceutical and cosmetic industries [8, 9]. They can be used at concentrations below 1 % [10].
Polysaccharides form hydrogels through the addition of cations like K+, Ca2+
, Mg2+, that promote intermolecular
junctions, acting as gelling agents. Other gelling agents used are oppositely charged polymers such as chitosan.
These natural hydrogels are widely used because of their innate bioactivity and biocompatibility [11, 12]. Their
thickening properties can find other medical uses, for example in the evaluation of the swallowing capacity in
patients with dysphagia [13]. For this purpose, viscoelastic parameters must be accurately controlled since, for
example, a less viscous than expected puree food would give a stronger swallowing problem, resulting in a
wrong diagnosis of patients [14]. Therefore, it seems to be important to study if their cross-linking degree and,
therefore, physicochemical properties depend not only on the composition (nature and concentration of
hydrocolloid and counterion, hydrocolloid/counterion ratio, pH…), but also on the preparation process, in order
to fix a protocol.
One of the polysaccharides used to form these hydrogels is gellan [15]. Gellan gum is a water-soluble anionic
exopolysaccharide produced by Sphingomonas Elodea bacteria under aerobic fermentation of glucose [16]. It
presents a tetrasaccharide repeating sequence of glucose (Glc), glucuronic acid (ClcA) and rhamnose (Rha)
residues in a 2:1:1 ratio linked together to form the linear primary structure [D-Glc(β1→4)D-GlcA(β1→4)D-
Glc(β1→4)L-Rha(α1→3)]n [17]. One of the advantages of gellan is that it is stable through a wide pH range
[18, 19]. It forms gel at concentrations remarkably lower than other hydrocolloids such as carrageenan, alginate,
pectin or gelatine [16]. This, coupled with its biocompatibility, high sorption capacity, hydrophilicity, low
interfacial tension in contact with body fluids, good carrier properties, and high permeability of nutrients and
metabolites make gellan an interesting scaffold material. Gellan gum also has the ability of improving the heat
stability of other gelled products prone to melting when exposed to high ambient temperatures [19]. Divalent
cations promote the gelation much better than monovalent cations [20, 21]. The effectiveness of cations to
facilitate gelation decreases in the order Ca 2+>Mg 2+>K +>Na +.
Encapsulation is a very useful method in protecting pharmaceutical ingredients, nutroceuticals and biologically
active plant extracts [22]. Over the last few decades, encapsulation and controlled release technology have
extensively been used in delivery of essential biologically active substances to specific portions of the
gastrointestinal track [23]. Controlled and targeted release technology promotes more efficient utilization and
less consumption of active agent, minimizes side effects and reduces frequency of administration. Gellan is one
of the compounds that can be gelled and used in this type of delivery systems. Some recent publications report
the encapsulation of curcumin with several methods that involve several polysaccharides combined with
chitosan as gelling agent [24, 25].
1 2 3 4 5 6 7 8 9 10 11 12 13 14 15 16 17 18 19 20 21 22 23 24 25 26 27 28 29 30 31 32 33 34 35 36 37 38 39 40 41 42 43 44 45 46 47 48 49 50 51 52 53 54 55 56 57 58 59 60 61 62 63 64 65

3
Curcumin is an oil-soluble polyphenolic compound [1,7-bis-(4-hydroxy-3-methoxyphenyl)-1, 6- heptadiene-
3,5-dione], extracted from the rhizomes of the herb Curcuma longa commonly known as turmeric [26, 27], with
low intrinsic toxicity, extensively used as a spice, food preservative and colouring agent mostly in Asian
countries. It contains polyphenolic compounds with strong antioxidant activity due to their ability to neutralize
free radicals and oxidants [28]. Other therapeutic applications of curcumin are its antimicrobial, anticancer,
antiinflammatory, antitumor, antioxidant and antiproliferative activities [22, 29-32]. It seems to be promising
for the fight against cancer due to a certain ability to induce apoptosis in cancer cells [33] and appears to be
useful against colon cancer [34, 35]. However, its applications are seriously limited because of low oral
bioavailability due to its low water solubility and its physicochemical and biological instability [36-39]. Gellan
gum is resistant to intestinal breakdown in the upper gastrointestinal track, it is digested by the colonic enzyme
galactomannanase, and it has been shown in vitro that beads formed with gellan gum undergo initial surface
erosion followed by rapid release of interior contents at pH and galactomannanase concentrations typically
found in the colon [40, 41]. Research has proven that gellan beads significantly retard fast release of
encapsulated material at pH 1.2 and achieve sustained release at pH 6.8 [23]. Therefore, as a hydrophobic
substance, curcumin could be dissolved in an edible oil and encapsulated with gellan to be protected until be
released. It could be a good way of supplying this and other similar substances to the human system because
oils have structures compatible with biological membrane components.
The aim of this work was to study the rheological properties of gellan gels produced by chemical means with
the use of calcium ions as gelling agent. The gel point, it is, the minimum Ca2+/gellan ratio in order to obtain a
gel, was determined by rheology, as well as the evolution of gels with time and the dependence of their
rheological properties with preparation variables. Subsequently, gellan was used to encapsulate curcumin. For
this, curcumin was dissolved in sunflower oil and the oil solution was emulsified in gellan solutions of several
concentrations, which were then externally gelled dropping them into a Ca2+ bath. Beads formed and
encapsulation yield were studied, as well as the reached protection of curcumin against degradation.
2. Materials and methods
2.1. Materials
Deacylated gellan gum was obtained from Solé i Graells (a food additives subministration Company). Calcium
chloride anhydrous > 95 %, curcumin > 65 %, ethanol 96 % (v/v), and Tween 80, were obtained from Sigma-
Aldrich. Commercial sunflower oil was used. MilliQ water was employed in the preparation of aqueous
solutions. All chemicals were used as received with no further purification.
2.2. Preparation of stock solutions
Gellan solutions of different concentrations were prepared by dissolving the required quantity of polymer in
MilliQ water under mild heating to 50 ºC and magnetic stirring for 30 minutes to dissolve the polymer since it
1 2 3 4 5 6 7 8 9 10 11 12 13 14 15 16 17 18 19 20 21 22 23 24 25 26 27 28 29 30 31 32 33 34 35 36 37 38 39 40 41 42 43 44 45 46 47 48 49 50 51 52 53 54 55 56 57 58 59 60 61 62 63 64 65

4
is insoluble in cold water [42]. These solutions were then allowed to cool at room temperature and thereafter
kept in the refrigerator for 24 hours for complete hydration before use. Calcium chloride solutions at 1 % (w/v)
were prepared for external gelation.
2.3. Preparation of gellan hydrogels
Hydrogels were prepared with an Ultra Turrax homogenizer model T.25 basic IKA-WERKE [43]. The gellan
solutions were located in a beaker at room temperature, and different amounts of 1 % (w/v) calcium chloride
solution were added in order to obtain the desired calcium-gellan ratio (CG) for each experiment. Immediately,
homogenization in the range 11,000-22,000 rpm was applied for 3 minutes.
2.4. Rheological tests
The rheological properties of the hydrogels were studied using a rheometer HAAKE MARS (Modular
Advanced Rheometer System) at a temperature of 25 ºC 0.1 ºC. A serrated plate-plate geometry with a
diameter of 20 mm and 1 mm gap was used to avoid slippering. After loading, a resting time of 5 minutes was
stablished before measurement in order to allow stress and temperature equilibration.
2.4.1. Oscillatory frequency sweep tests
Frequency sweep measurements at a fixed amplitude of shear stress were carried out in the frequency range of
0.01–10 Hz, at a controlled temperature of 25 ºC 0.1 ºC. Amplitude of stress applied was chosen in order to
work within the linear viscoelastic region (LVR). To ensure that these conditions were met, preliminary stress
sweep tests were made at a frequency of 1 Hz to choose a stress amplitude inside the LVR range, i.e., small
enough for not modifying microstructure and, therefore, obtaining viscoelastic functions independent of
imposed stress amplitude. Once analyzed the results obtained in the preliminary stress sweep tests, a fixed stress
amplitude of 3 Pa was chosen for the frequency sweep measurements.
2.4.2. Steady state viscosity
The stationary viscosity of samples was measured for different shear rates in the range 0.01-100 s-1 at a
controlled temperature of 25 ºC 0.1 ºC. Protocol was programmed in order to fix a shear rate and monitorize
the viscosity vs. time, in order to take the viscosity value only when it remained constant with time. When a
constant value of viscosity was reached, it was registered and subsequently a new shear rate was stablished until
new steady state. It was done in all the range of shear rates stablished.
2.5. Determination of solubility of curcumin
The solubility of curcumin in oil and in ethanol was determined by preparing mixtures of different
concentrations placing the solvent in a beaker and adding curcumin. Mixing was done with a magnetic stirrer
1 2 3 4 5 6 7 8 9 10 11 12 13 14 15 16 17 18 19 20 21 22 23 24 25 26 27 28 29 30 31 32 33 34 35 36 37 38 39 40 41 42 43 44 45 46 47 48 49 50 51 52 53 54 55 56 57 58 59 60 61 62 63 64 65

5
for 60 minutes at room temperature. After that, samples were centrifuged at 1300 rpm for 10 minutes in order
to identify the existence of a precipitate.
2.6. Preparation of stock solutions for bead formation
Gellan stock solutions for the formation of beads were prepared as described in section 2.2 but with the addition
of 1 % (w/v) Tween 80 to stabilize the O/W emulsions that would be prepared later dispersing in the curcumin-
in-oil solutions. Curcumin-sunflower stock solutions of 0.1 mg/mL were prepared and protected from sunlight
by keeping in darkness.
2.7. Preparation of emulsions
Prior to the preparation of the beads, oil-in-water emulsions were formed by emulsifying the curcumin-
containing sunflower oil in the gellan solutions. 90 mL of the gellan solution were measured and transferred to
a beaker. The beaker content was homogenized with the Ultra Turrax at a rate of 11,000 rpm, and while
homogenizing 10 mL of curcumin-containing oil were added using a syringe. All homogenization process was
done at room temperature.
2.8. Light back scattering measurements
Turbiscan MA 2000 was used to indirectly measure stability. A tube is vertically located in the equipment and
a light of = 850 nm is emitted towards the tube. The system has two optical detectors, one of them detects the
transmitted light (% T) and the other one detects the back scattered light at an angle of 135º (% BS). Both
transmission and backscattering are measured along the tube. In a dispersed system, transmission and
backscattering are related to concentration and size of droplets/particles. Therefore, changes in them are an
indirect measure of destabilization process. For the emulsions studied, changes in % BS were chosen, as values
of % BS were higher than % T and sensitivity was higher. Measurements were done from the bottom to the top
of the tube. The % BS mean value from 1-1,7 cm from bottom was plotted vs. time in order to see changes
which indicated destabilization.
2.9. Preparation of curcumin beads
The beads were prepared by dropwise addition of the bubble-free emulsion in a calcium chloride solution 1 %
(w/v) using a 500 µL Handystep electronic pipette. The medium was continuously stirred during bead formation
with a magnetic stirrer at 200 rpm to prevent aggregation of beads. The distance between the syringe and the
surface of the calcium chloride solution was kept constant about 15 cm above the surface of the calcium chloride
solution to enable formation of uniform and reproducible beads. The resulting beads were allowed to cure for
5 minutes in the calcium chloride solution. They were then separated by filtration with a sieve and rinsed three
times with MilliQ water to remove any free calcium ions from the surface of the beads.
1 2 3 4 5 6 7 8 9 10 11 12 13 14 15 16 17 18 19 20 21 22 23 24 25 26 27 28 29 30 31 32 33 34 35 36 37 38 39 40 41 42 43 44 45 46 47 48 49 50 51 52 53 54 55 56 57 58 59 60 61 62 63 64 65

6
2.10. Confocal microscopy
Confocal microscopy of the emulsions was done to evaluate the nature of the droplets, assure that curcumin
was located inside, and also to correlate the effect of gellan concentration on the size distribution of the oil
droplets. Leica TCS SP2 confocal microscope equipped with a 488 nm Argon laser line and a 63X 1.32NA
objective and DIC (Differential Interference Contrast) was used. There was no need for labelling the samples
with a fluorescent material because curcumin is fluorescent.
2.11. Encapsulation yield
In order to determine the encapsulated curcumin in beads, it was extracted with ethanol and ethanol solutions
subsequently analysed by spectrophotometry. To establish an appropriate time suitable for complete extraction,
500 beads were counted, weighted and then mixed with 100 mL ethanol 96 % (v/v) under continuous stirring,
and absorbance of aliquots was measured along time until constant value. The absorbance was determined using
a Perkin Elmer UV/VIS spectrophotometer at = 425 nm.
For measurement of remaining curcumin in oil solutions, 5 mL of solution were mixed with ethanol and ethanol
was separated and subsequently analyzed by spectrophotometry.
A standard curve for curcumin was constructed preparing a standard solution of curcumin in ethanol and
subsequent dilutions. Ethanol that had been in contact with empty beads was used as a blank.
3. Results and Discussion
3.1. Effect of resting time after gel preparation
Stock solutions prepared one day before were used in order to obtain the hydrogels. Calcium chloride solutions
were added to the gellan solutions and homogenized with Ultraturrax for 3 minutes at 11,000 rpm as described
in section 2.3. Gels prepared visually evolved with time to more viscous and elastic ones. Viscoelasticity of
these samples was therefore analized at several resting times after preparation by oscillatory frequency sweep
tests.
Figure 1 (a) corresponds to a calcium-gellan ratio (CG) of 0.0036 g Ca/g gellan at time 0 and 125 minutes after
homogenization with calcium chloride at 11,000 rpm. As it can be observed, elastic modulus G’ is higher than
loss modulus G’’ in all the range of frequencies studied for both cases, indicating that for this CG gelation
occurs [13]. Hovewer, a well-developed gel usually presents the viscoelastic functions G’ and G” nearly
independent of frequency [44]. At time = 0 both G’ and G” increase with frequency, indicating that the sample
behaves as a weak gel [10]. Regarding the values, G’ and G’’ are much higher for 125 minutes than for 0
minutes, with a stronger increase with time in G’ than in G” and a lower dependence of both parameters with
frequency at 125 minutes, indicating a more developed gel than at t = 0 [45-46]. Therefore hydrogel structure
1 2 3 4 5 6 7 8 9 10 11 12 13 14 15 16 17 18 19 20 21 22 23 24 25 26 27 28 29 30 31 32 33 34 35 36 37 38 39 40 41 42 43 44 45 46 47 48 49 50 51 52 53 54 55 56 57 58 59 60 61 62 63 64 65

7
is reinforced with time in the range of time studied, indicating that intermolecular new junctions are appearing.
In Figure 1 (b) tan (or, what is the same, G’’/G’) is plotted as a function of time at different frequencies for
CG = 0.0036 g Ca/g gellan. As it can be seen, tan decreases, showing once again an evolution to a more elastic
behavior with time, indicating again that the elastic network is yet forming. It could be explained by the fact
that, while gelation starts just at the moment when calcium ions are introduced into the gellan solution, as
reflects Figure 1 (a), it starts to gellify locally. Then, interconnected lumps with a shell of gel are formed at the
early contact Ca2+-gellan points and, although system is mixed by homogenization, ions have to migrate across
the shell of these lumps in order to reach the inside of non-gelled domains and gellify the whole bulk. It seems
to indicate that although bulk gelation is apparently macroscopically homogeneous, it is not complete as
microdomains exist where calcium ions have not yet arrived. Gelation continues along the time, and the system
changes to a more developed gel. This behavior should be taken into account for uses where the control of
rheological properties is essential, for example, for swallowing tests, where a protocol with a fixed time of
ingestion after preparation of testing foods must be fixed [13].
Taking into account these results, for subsequent rheological determinations the freshly prepared gels were
charged in the rheometer and a fixed resting time of 30 minutes was established before measuring for all samples
in order to obtain comparable results.
3.2. Effect of homogenization speed
For the study of the homogenization speed the hydrogels were prepared as described in section 2.2 and 2.3, at
a fixed calcium-gellan ratio of 0.0060 g Ca2+/g gellan with a gellan concentration of 0.60 % w/v. These
conditions are above the gel point as it will be shown in the 3.3 section, and were prepared under the same
conditions except for homogenization speed. Values of elastic and loss moduli, G’, G’’, viscosity at a low shear
rate (0.113 s-1), μ, and shear factor, defined as SF = (0.113 s-1)/ (1.275 s-1) are listed in Table 1.
1 2 3 4 5 6 7 8 9 10 11 12 13 14 15 16 17 18 19 20 21 22 23 24 25 26 27 28 29 30 31 32 33 34 35 36 37 38 39 40 41 42 43 44 45 46 47 48 49 50 51 52 53 54 55 56 57 58 59 60 61 62 63 64 65

8
Table 1 Values of G’, tan , 0, and SF ( (0.113 s-1)/ (1.275 s-1)) at different homogenization speeds. Gellan
concentration = 0.60 % (w/v). CG = 0.0060. T = 25 ºC 0.1 ºC
Homogenization
speed [rpm]
G’ (0.1 Hz)
[Pa]
Tan(0.1 Hz)
[-]
(0.113 s-1)
[Pa·s]
SF
[-]
11,000 70.99 0.10 80.01 7.96
13,000 76.10 0.09 92.40 9.28
19,000 84.19 0.08 127.90 11.90
22,000 88.34 0.07 133.30 13.82
In Table 1 it can be observed a mild elasticity increase (higher G’ and lower tan ) when homogenization speed
is increased, as well as an increase of low shear viscosity and shear factor. The increase of shear factor is related
to a higher shear-thinning behaviour, i.e. a decrease of viscosity when shear rate is increased as a result of a
shear-induced disruption of structure. All these results point towards a slightly stronger gel formation when the
homogenization speed used for preparation of gels is increased. This result agrees with that discussed in section
3.1, i.e., the presence of microdomains where Ca2+ ions hardly arrive and, therefore, although gelation in bulk
is reached, it is not in fact microscopically complete. When homogenization speed is higher, the lumps are
smaller due to a higher shearing and the calcium ions are more homogeneously distributed, the non-gelled
domains are smaller and the bulk gel stronger. Therefore, it can be concluded that shearing must be carefully
controlled if reproducible results are required. For subsequent experiments, the homogenization speed was fixed
at 11,000 rpm.
3.3. Determination of the gel point
The gelation process refers to the phenomenon which transforms a viscoelastic fluid into an elastic well-shaped
solid (gel). The effect of Ca2+/gellan w/w ratio (CG) in gelation and gel rheological properties was analyzed.
The final gellan concentration in gels was fixed at 0.60 % (w/v). Steady state viscosity under shear and
oscillatory experiments were carried out for several CG ratios from CG = 0 to CG = 0.03.
Figure 2 shows the steady state viscosity vs. shear rate for gellan in the absence of calcium and for several CGs.
It can be observed an increase of viscosity with CG. All samples present shear thinning behavior, indicating a
shear-induced disruption of structure. However, in the absence of calcium there is a range of shear rates where
Newtonian behavior exists, indicating that the sample is able to flow without modification of structure when a
low shear is applied. The same occurs, but in a range of lower shear rates, for a CG = 0.0015. This behavior is
1 2 3 4 5 6 7 8 9 10 11 12 13 14 15 16 17 18 19 20 21 22 23 24 25 26 27 28 29 30 31 32 33 34 35 36 37 38 39 40 41 42 43 44 45 46 47 48 49 50 51 52 53 54 55 56 57 58 59 60 61 62 63 64 65

9
typical of viscoelastic liquids, which can flow without disruption of structure when the shear is low enough. It
is attributed to the presence of free disolved polymer molecules, or few Ca2+-induced joined molecules but with
junctions that do not extend to the whole bulk, as they can freely move. So, a network is not yet developed. At
higher shear rates, these molecules or groups of molecules align in the direction of flow, some joining points
can disentangle and shear-thinning occurs. At CG = 0.0015, viscosity is higher than at CG = 0 and the
Newtonian range decreases, indicating that calcium ions induce some intermolecular junctions. However, they
are not enough to gellify the sample. At CG = 0.0020 and above, the Newtonian zone has completely
disappeared in the range studied, indicating that flow necessarily implies some kind of change or disruption of
structure, a typical behavior of viscoelastic solids, which could indicate that the system is gelled and, therefore,
a three-dimensional network exists in the whole bulk that needs to be disrupted for flowing. This network is
stronger at higher CG due to the presence of more intermolecular junctions induced by the presence of more
Ca2+.
Viscoelastic functions G’ and G” for some CG are shown in Figure 3. The sample without calcium was clearly
predominantly viscous, with G” much higher than G’. For CG = 0.0015, G’ and G” increased and got closer
but being G” yet higher than G’ for a range of low frequencies and increasing both with frequency, indicating
yet a predominantly viscous behavior although with some elasticity, according to that discussed for steady state
experiments. Behavior of sample with a CG ratio of 0.0020 drastically changed with G’ clearly higher than G”
and nearly independent of frequency, indicating that gelation point is located in some way between 0.0015 and
0.0020. Higher CG samples presented progressive higher values of moduli, with G’ nearly independent on
frequency, indicating a stronger gel formation (data not shown).
In order to accurately determinate the gel point, tan = G”/G’ for several frequencies is plotted vs CG (g Ca2+/g
gellan) in Figure 4. According to [45, 46], at the gel point (GP) tan is independent of frequency and, therefore,
all curves collapse, as GP is strictly dependent of the material and independent of the applied frequency. It can
be seen that it happens at a CG around 0.0018 g Ca2+/g gellan. So, this ratio is required in order to extend the
intermolecular junctions to the whole bulk and form a well-developed three-dimensional network. The increase
of G’ and G” observed at higher CG is related to the formation of more intermolecular junctions, which produces
a denser network, that behaves like a stronger gel.
Table 2 shows a summary of rheological parameters for all CG ratios tested. Tan was calculated for a
frequency of 0.1 Hz. As it can be seen, G’, as well as low shear rate viscosity, drastically increase when gelation
occurs, in the range 0.0015<CG<0.0020, although it continuously increases with CG, as said before.
Accordingly, tan strongly decreases around the gel point.
1 2 3 4 5 6 7 8 9 10 11 12 13 14 15 16 17 18 19 20 21 22 23 24 25 26 27 28 29 30 31 32 33 34 35 36 37 38 39 40 41 42 43 44 45 46 47 48 49 50 51 52 53 54 55 56 57 58 59 60 61 62 63 64 65

10
Table 2 Rheological parameters of the gels at different CG ratios
CG Ratio
[Ca2+ [g]/gellan [g]]
G' (0.1 Hz)
[Pa]
tan (0.1 Hz)
[-]
(0.113s-1)
[Pa·s]
0 0.06 1.64 0.216
0.0015 0.27 1.54 1.25
0.0020 28.84 0.166 17.84
0.0030 33.86 0.118 53.67
0.0036 35.05 0.113 55.69
0.0045 70.99 0.092 68.98
0.0060 82.26 0.082 80.01
0.0301 405.90 0.069 79.55
3.4. Encapsulation of curcumin into gellan beads
3.4.1. Oil-in-water (O/W) emulsions of curcumin-in-sunflower/gellan
As curcumin is insoluble in water, in order to encapsulate it in gellan beads it is first required to dissolve
curcumin in an oil and emulsify the oil in gellan solutions, previously to gelation. Curcumin solubility in
sunflower oil was determined to be 0.1 mg/mL and in ethanol 96 % (v/v) was 2.5 mg/mL at room temperature.
Curcumin was therefore about 25 folds more soluble in ethanol than in oil. The high solubility of curcumin in
ethanol was exploited for extracting and quantifying curcumin from the beads.
Oil in water (O/W) emulsions of curcumin-oil/gellan at 10 % (v/v) of disperse phase (the oily phase) were
prepared with the homogenizer as described in section 2.7 for gellan concentrations of 0.25 %, 0.50 % and
1.0 % (w/v). Confocal micrographs of emulsions were immediately taken and are shown in Figure 5.
From Figures 5 (a), (b) and (c), it can be observed that oil droplets formed are smaller when the gellan
concentration is higher. Figures 5 (b) and (d) show equivalent images with Figure 5 (d) showing that curcumin,
which is fluorescent, is all located inside the oil droplets. Low shear viscosities of gellan solutions are listed in
Table 3, as well as mean droplet sizes. It is shown that when viscosity of continuous phase (gellan) increases,
mean droplet size decreases. It can be related to the capillary number (Ca). Capillary number represents the
relative effect of viscous forces versus surface tension acting across the interface between the two
immiscibleliquids (Eq. 1), the first favouring deformation and breakage of droplets into smaller ones and the
later minimizing the interface. Symbols and �̇� are the shear stress and shear rate applied, the surface tension,
C the viscosity of the continuous phase and R the radius of droplets. A droplet elonges and breaks into two
smaller ones as far as Ca reaches a critical value. As for all the emulsions a constant homogenization speed has
been used (11,000 rpm), the shear applied is the same, as well as the surface tension. Therefore, when the
1 2 3 4 5 6 7 8 9 10 11 12 13 14 15 16 17 18 19 20 21 22 23 24 25 26 27 28 29 30 31 32 33 34 35 36 37 38 39 40 41 42 43 44 45 46 47 48 49 50 51 52 53 54 55 56 57 58 59 60 61 62 63 64 65

11
viscosity of the continuous phase increases due to an increase on gellan concentration, the radius of the droplets
for reaching the critical value Cac decreases and, therefore, the mean droplet size of these emulsions is lower.
(Eq. 1)
Table 3 Viscosity, average droplet size and encapsulation yields at various gellan concentrations
Concentration of
gellan in solution
[% w/v]
Viscosity of
gellan solutions
before gelation
[Pa·s]
Average size of
oil droplets in
O/W emulsions
[m]
Encapsulation yield
after formation of
beads
[%]
0.25 0.32 77.5 30.9 ± 2.9
0.50 0.216 54.9 43.6 ± 3.1
1.00 1.42 37.4 89.5 ± 1.5
Figure 6 shows backscattering results for the emulsions formed with the three concentrations of gellan tested.
The emulsions showed more stability at higher gellan concentrations, as the backscattering value changes were
smaller with time. These results correlate with that obtained from confocal microscopy, where agglomeration
of droplets can be observed at the lowest concentration of gellan (Figure 5 (a)).
At low gellan concentrations, the oil droplets can more easily move across the continuous phase, and
agglomeration occurs, that eventually turns to coalescence forming larger oil droplets, decreasing the stability
of the system. At higher concentrations, discrete, smaller and relatively monodisperse droplets are formed that
move slower due to the high viscosity of the continuous phase, preventing agglomeration and subsequent
coalescence, at least for a time, that can be enough for the ulterior gelation process.
3.4.2. Encapsulation of curcumin-in-oil in gellan beads through external gelation of emulsions
Emulsions were dropped in a 1 % w/v Ca2+ solution as stablished in section 2.9. Beads were maintained for 5
minutes in the Ca2+ bath for curing. It is important to fix a curing time since, according to section 3.1, gel
evolves with time because ions need a time to migrate across the barrier of already formed gel. Here, the curing
time is yet more determinant, as in external gelation of beads the ions are not mixed inside the droplets and they
have to migrate from the external calcium chloride solution to the core of beads crossing the forming shell of
gel. In fact, according to [28], where beads of alginate were prepared through external gelation with Ca2+, it is
expected a limitation of Ca2+ migration across the forming shell, obtaining beads with a more developed and
denser network near the surface and a more open one around the core. These beads are, therefore, formed by an
emulsion with a gelled continuous phase and a disperse phase cointaining the oil with the curcumin. Although,
R
R
Ca C
1 2 3 4 5 6 7 8 9 10 11 12 13 14 15 16 17 18 19 20 21 22 23 24 25 26 27 28 29 30 31 32 33 34 35 36 37 38 39 40 41 42 43 44 45 46 47 48 49 50 51 52 53 54 55 56 57 58 59 60 61 62 63 64 65

12
as said, a homogeneous crosslinking of continuous phase is not expected, general trends observed in mechanical
properties when bulk gelation was carried out are expected to be maintained. That is, an increase in viscoelastic
parameters with gellan concentration is expected, if a minimum Ca2+ supply is guaranteed. The presence of
disperse oil droplet could just slightly decrease these parameters, as, according to previous works, when the
continuous phase behaves like a gel rheology is basically controlled by the continuous, solid-like phase [47,
48].
Figure 7 shows a picture of the beads formed. Once beads were formed, encapsulation yield was measured.
Encapsulation yield at various gellan concentrations is illustrated in Table 3. It can be seen that around 90 % of
the total added curcumin remained in the 1.0 % gellan beads after the process of dissolution, emulsification,
gelation and washing. However, only 31 % remained when 0.25 % gellan was used. It is attributed to the fact
that at higher concentrations of gellan, the stronger cross-linking of the polymer by Ca2+ ions formed more
compact three dimensional structures which helped in entrapping the curcumin-in-oil droplets within the beads
and prevented curcumin from degradation and leakage during washing. Along all the process samples were
exposed to sunlight as flasks were transparent and, probably, that was enough for partial degradation when the
gel was not developed enough. Some of the curcumin could also be lost during the washing of beads.
The remaining curcumin in beads prepared with 1.0 % gellan was measured after 5 days through the protocol
described in section 2.11, and compared with values of remaining curcumin for curcumin-in-oil solutions
obtained after the same time, in order to measure the protection against degradation that encapsulation offered.
Both samples were exposed to sunlight at room temperature. Results obtained with the solution indicated that
curcumin was almost completely degraded with a yield of only 5.2 % ± 0.7 % but, when the same amount of
curcumin-in-oil solution was encapsulated in gellan beads and exposed to the same conditions, a yield of 30.2 %
± 3.8 % was observed. According to these results, encapsulation with gellan presented around 6 times slower
photodegradation than curcumin-in-oil solutions. It is a promising advance although it requires further
investigation as, probably, a combination of gellan with other component could improve results, as some studies
point out with encapsulation of other substances [24, 25].
4. Conclusions
Calcium gelation-induced gellan hydrogel structures prepared through homogenization evolved with time to
stronger gels. It was attributed to the time required for Ca2+ to reach all the gellan-junction points. Although a
weak gel was quickly formed, it evolved to a denser, stronger gel, with time. On the other hand, higher
homogenization speed produced stronger gels, with higher rheological functions, attributed to a more
homogeneous distribution of Ca2+ in gellan, which promoted closer junction points. Therefore, it can be
concluded that preparation variables must be accurately controlled in uses where the rheological properties are
determinant.
The minimum Ca2+/gellan ratio CG was determined to reach the gel point, GP, i.e. to extend the intermolecular
1 2 3 4 5 6 7 8 9 10 11 12 13 14 15 16 17 18 19 20 21 22 23 24 25 26 27 28 29 30 31 32 33 34 35 36 37 38 39 40 41 42 43 44 45 46 47 48 49 50 51 52 53 54 55 56 57 58 59 60 61 62 63 64 65
13
junctions to the whole bulk and form a three dimensional network with gel behavior. The GP was determined
as the CG where tan = G”/G’ is independent of frequency.
External gelation of curcumin-in-oil/gellan emulsions was carried out in order to entrap curcumin in gellan
beads. Curcumin-in-oil droplets of O/W emulsions were smaller at higher concentrations of gellan, as the higher
viscosity of the continuous phase promoted a higher Capillary number Ca and, as a result, a lower radius of
droplets to reach the critical CaC. Curcumin was entrapped into the oil droplets. The curing time of beads inside
the Ca2+ solution must to be controlled since ions require a time to migrate across the gelled shell of beads. A
higher encapsulation yield, around 90 %, was reached at higher gellan concentrations, due to the formation of
a more compact gel. Encapsulated curcumin presented around 6 times slower sunlight degradation than free
curcumin-in-oil solutions, indicating that encapsulation offered some protection against oxidation.
Acknowledgments
Thanks to the European Commission for the scholarship funded within the Erasmus+ KA1 Programme, ref.
2013-0241 - Erasmus Mundus Joint Master Degree in Chemical Innovation and Regulation, and to the Ministry
of Science and Innovation of Spain (Project CTQ2016-80645-R) with Feder funds
References
1. M. El Soda, L. Pannell, N. Olson, J. Microencapsul. 6(3), 319-26 (1989)
2. G. Sworn, G.R. Sanderson, W. Gibson, Food Hydrocoll. 9(4), 265–271 (1995)
3. D. F. Coutinho, S. V. Sant, H. Shin, J.T. Oliveira, M.E. Gomes, Biomaterials 31, 7494-502 (2010)
4. K. Ako, Carbohydr. Polym. 115, 408-414 (2015)
5. P. Tricardi, C. Cencetti, R. Ria, F. Alhaique, T. Coviello, Molecules 14, 3376-3391 (2009)
6. C.T. Schwall, I.A. Banerjee, Materials 2, 577-612 (2009)
7. F.G. Prezotti, B.S. Cury, R.C. Evangelista, Carbohydr. Polym. 113, 286-295 (2014)
8. E.M. Ahmed, J. Adv. Res. 6, 105-21 (2015)
9. L.S. Liu, J. Kost, F. Yan, R.C. Spiro, Polymers 4, 997-1011 (2012)
10. E.R. Morris, K. Nishinari, M. Rinaudo, Food Hydrocoll. 28(2), 373-411 (2012)
11. B. Karthika, J.S. Vishalakshi, Der Pharma Chemica 5, 185-192 (2013)
1 2 3 4 5 6 7 8 9 10 11 12 13 14 15 16 17 18 19 20 21 22 23 24 25 26 27 28 29 30 31 32 33 34 35 36 37 38 39 40 41 42 43 44 45 46 47 48 49 50 51 52 53 54 55 56 57 58 59 60 61 62 63 64 65

14
12. L. Brannon-Peppas, R.S. Harland, J. Control. Release 17(3), 297–298 (1991)
13. S. Ishihara, M. Nakauma, T. Funami, S. Odake, K. Nishinari, Food Hydrocoll. 25, 1016-1024 (2011)
14. Deglución: K. Nishinari, Food Sci. Technol. Res. 15, 99-106 (2009)
15. N. Sahiner, Progr. Polym. Sci. 38, 1329-1356 (2013)
16. S.J. Pérez-Campos, N. Chavarría-Hernández, A. Tecante, M. Ramírez-Gil, Food Hydrocoll. 28, 291-300
(2012)
17. V.M.F. Gonçalves, A. Reis, M.R.M. Domingues, J.A. Lopes-da-Silva, A.M. Fialho, L.M. Moreira, I. Sá-
Correia, M.A. Coimbra, Carbohydr. Polym. 77, 10-19 (2009)
18. G.R. Bardajee, A. Pourjavadi, S. Ghavami, R. Soleyman, F. Jafarpour, J. Photochem. Photobiol., B 102,
232–240 (2011)
19. T. Osmałek, A. Froelich, S. Tasarek, Int. J. Pharm. 466, 328-340 (2014)
20. Y. Nitta, R. Takahashi, K. Nishinari, Biomolecules 11(1), 187-191 (2009)
21. E. Miyoshi, T. Takaya, K. Nishinari, Carbohydr. Polym. 30(2), 109-119 (1996)
22. F. Yang, S. Xia, C. Tan, X. Zhang, Eur. Food Res. Technol. 237, 467-479 (2013)
23. S. Song, Z. Wang, Y. Qian, L. Zhang, E. Luo, J. Agric. Food Chem. 60, 4388-95 (2012)
24. C. Tan, J. Xie, X. Zhang, J. Cai, S. Xia, Food Hydrocoll. 57, 236-245 (2016)
25. T.P. Sari, B. Mann, R. Kumar, R.R.B. Singh, R. Sharma, M. Bhardwaj, S. Athira, Food Hydrocoll. 43, 540-
546 (2015)
26. X. Chen, L. Q. Zou, J. Niu, W. Liu, S.F. Peng, C.M. Liu, Molecules 20, 293-311 (2015)
27. A.T.B. Nguyen, P. Winckler, P. Loison, Y. Wache, O. Chambin, Colloids Surf., B 121, 290-298 (2014)
28. B. Lupo, A. Maestro, M. Porras, J.M. Gutiérrez, C. González, Food Hydrocoll. 38, 56- 65 (2014)
29. N. Dogra, R. Choudhary, P. Kohli, J.D. Haddock, S. Makwana, B. Horev, Y. Vinokur, S. Droby, V. Rodov,
J. Agric. Food Chem. 63, 2557-2565 (2015)
30. L. Hu, Y. Jia, F. Niu, Z. Jia, X. Yang, K. Jiao, J. Agric. Food Chem. 60, 7137-7141 (2012)
1 2 3 4 5 6 7 8 9 10 11 12 13 14 15 16 17 18 19 20 21 22 23 24 25 26 27 28 29 30 31 32 33 34 35 36 37 38 39 40 41 42 43 44 45 46 47 48 49 50 51 52 53 54 55 56 57 58 59 60 61 62 63 64 65

15
31. A. Munin, F. Edwards-Lévy, Pharmaceutics 3, 793-829 (2011)
32. D. Patra, C. Barakat, Spectrochim. Acta, Part A 79, 1034-1041 (2011)
33. M. Shi, L. Yao, Y. Mao, Y. Ming, G. Ouyang, Cell Biol. Int. Rep. 30, 221-226 (2006)
34. G.R.B. Irving, A. Karmokar, D.P. Berry, K. Brown, W.P. Stewart, Best Pract. Res. Clin. Gastroenterol.
25, 519-534 (2011)
35. V.H. Ferreira, A. Nazli, S.E. Dizzell, K. Mueller, C. Kaushic, PLoS ONE 10, 1-19 (2015)
36. Y. Wang, Z. Lu, F. Lv, X. Bie, Eur. Food Res. Technol. 229, 391-396 (2009)
37. C. Wang, Z. Liu, G. Xu, B. Yin, P. Yao, Food Hydrocoll. 61, 11-19 (2016)
38. Y. Fan, J. Yi, Y. Zhang, W. Yokoyama, Food Chem. 239, 1210-1218 (2018)
39. S. Bisht, A. Maitra, Curr. Drug Discov. Technol. 6, 192-199. (2009).
40. A. Vajpayee, S. Fartya, A.P. Singh, S.K. Jha, J. Pharm. Res. Opinion 4, 108- 112 (2011).
41. B.N. Singh, L.D. Trombetta, K.H. Kim, Pharm. Dev. Technol. 9, 399-407 (2004)
42. K. Nakagawa, N. Sowasod, T. Charinpanitkul, A. Soottitantawat, W. Tanthapanichakoon, Procedia Food
Sci. 1, 1973-1979 (2011)
43. H.M. Shewan, J.R. Stokes, J. Food Eng. 118, 781-792 (2013)
44. E. Rudé, J. Llorens, J. Non-Cryst. Solids 352, 2220-2225 (2006)
45. H.H. Winter, F. Chambon, J. Rheol. 30, 367-382 (1986)
46. F. Chambon, H.H. Winter, J. Rheol. 31, 683-697 (1987)
47. A. May, K. Aramaki, J. M. Gutiérrez, Langmuir 27, 2286-2298 (2011)
48. M. M. Alam, Y. Sugiyama, K. Watanabe, K. Aramaki, J. Colloid Interface Sci. 341, 267-272 (2010)
Figure Captions
Fig. 1 (a) G’ and G” vs. frequency for a gel with gellan 0.60 % and calcium-gellan ratio of 0.0036 g Ca/g gellan
at time 0 (G’ triangles; G” circles) and 125 minutes (G’ diamonds; G” squares); (b) Tan (G’’/G’) vs. time at
different frequencies, 0.1 Hz (white diamonds); 0.215 Hz (white squares); 0.316 Hz (white triangles); 0.464 Hz
1 2 3 4 5 6 7 8 9 10 11 12 13 14 15 16 17 18 19 20 21 22 23 24 25 26 27 28 29 30 31 32 33 34 35 36 37 38 39 40 41 42 43 44 45 46 47 48 49 50 51 52 53 54 55 56 57 58 59 60 61 62 63 64 65

16
(black diamonds); 0.681 Hz (black squares); 1 Hz (black triangles). T = 25 ºC. Homogenization
rate = 11,000 rpm
Fig. 2 Steady state viscosity vs. shear rate for gellan 0.60 % (w/v) and several CG ratios. T = 25 ºC. CG = 0
(circles), CG = 0.0015 (triangles), CG = 0.0020 (diamonds), CG = 0.0045 (squares). Homogenization
rate = 11,000 rpm
Fig. 3 G’ and G” moduli vs. frequency for gellan 0.60 % (w/v) and several CG ratios. T = 25ºC. G’ (open
symbols); G” (black symbol); CG = 0 (circles), CG = 0.0015 (triangles), CG = 0.0020 (diamonds).
Homogenization rate = 11,000 rpm
Fig. 4 Tan = G”/G’ vs. CG = g Ca2+/g gellan for several frequencies. Gellan concentration = 0.60 % (w/v).
T = 25 ºC. 0.1 Hz (circles), 0.215 Hz (open triangles), 0.464 Hz (crosses), 1 Hz (diamonds), 2.154 Hz (black
triangles). Homogenization rate = 11,000 rpm
Fig. 5 Confocal micrographs of curcumin-in-oil/gellan emulsions 10 % v/v for (a) 0.25 % w/v gellan; (b) and
(d) 0.50 % w/v gellan; (c) 1.00 % gellan. All the emulsions were prepared as described in section 2.7.
Fig. 6 Back scattering measurements for oil/gellan emulsions for a 0.25 % gellan (diamonds), 0.5 % gellan
(squares) and 1 % gellan (triangles)
Fig. 7 Beads of gellan with curcumin-in-oil prepared by external gelation
1 2 3 4 5 6 7 8 9 10 11 12 13 14 15 16 17 18 19 20 21 22 23 24 25 26 27 28 29 30 31 32 33 34 35 36 37 38 39 40 41 42 43 44 45 46 47 48 49 50 51 52 53 54 55 56 57 58 59 60 61 62 63 64 65

0
1
10
100
1000
0.01 0.1 1 10
G'
an
d G
" [
Pa]
Frequency [Hz]
G' t=125 min
G" t=125 min
G' t=0 min
G" t=0 min0
0.05
0.1
0.15
0.2
0.25
0.3
0.35
0.4
0 50 100 150
tand
Time [min]
F=0.100
F=0.215
F=0.316
F=0.464
F=0.681
F=1.000
(a) (b)
Figure Click here to access/download;Figure;Fig1.docx
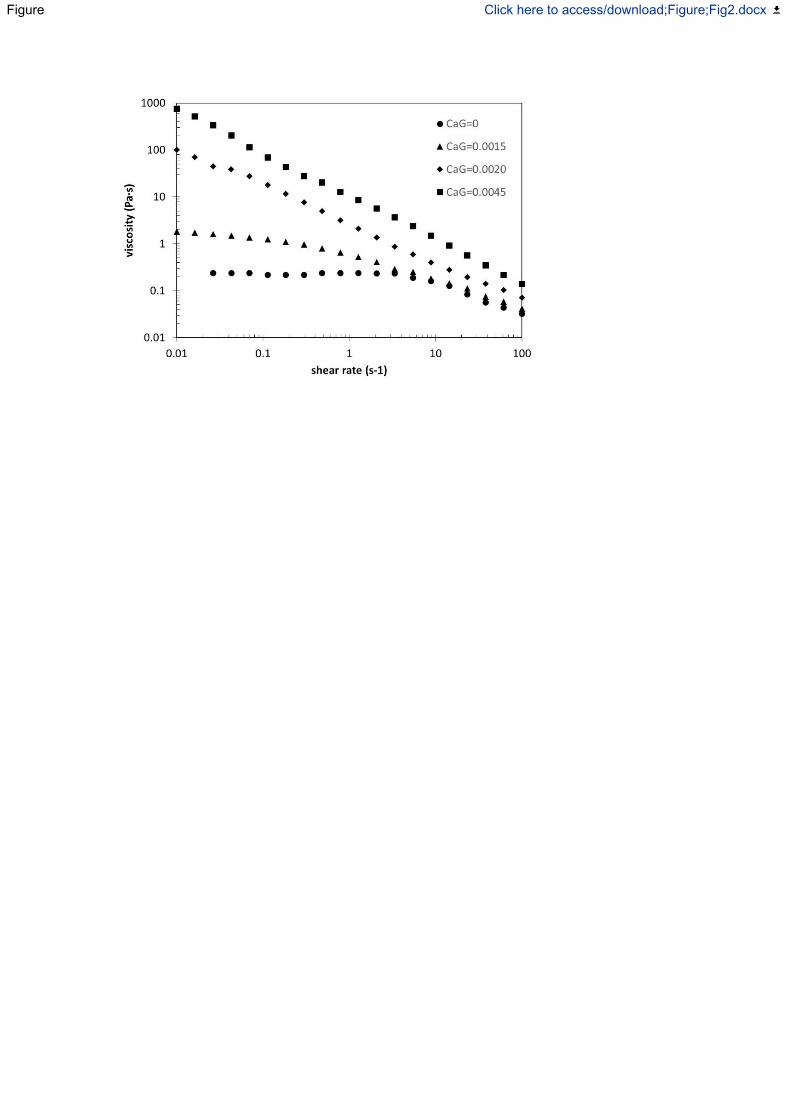
Figure Click here to access/download;Figure;Fig2.docx

Figure Click here to access/download;Figure;Fig3.docx

0.01
0.10
1.00
10.00
100.00
0.000 0.001 0.002 0.003 0.004 0.005 0.006 0.007
tand
g Ca2+/g gellan
0.1 Hz
0.215 Hz
0.464 Hz
1 Hz
2.154 Hz
Figure Click here to access/download;Figure;Fig4.docx

Figure Click here to access/download;Figure;Fig5.docx

0
10
20
30
40
50
60
70
80
90
100
0 10 20 30 40 50 60 70 80
Bac
ksca
tte
rin
g [%
]
Time [min]
Figure Click here to access/download;Figure;Fig6.docx