
GED® Science Spectacular! · GED® Science Spectacular! Steve Schmidt . [email protected] ....
29
GED® Science Spectacular! Steve Schmidt [email protected] abspd.appstate.edu Please Write on this Packet! You can find everything from this workshop at: abspd.appstate.edu Look under: Teaching Resources and scroll down to GED® Science Spectacular!
Transcript of GED® Science Spectacular! · GED® Science Spectacular! Steve Schmidt . [email protected] ....

GED® Science Spectacular!
Steve Schmidt [email protected]
abspd.appstate.edu Please Write on this Packet!
You can find everything from this workshop at: abspd.appstate.edu Look under: Teaching Resources and scroll down to GED® Science Spectacular!

Page 2| GED® Science Spectacular! ABSPD [email protected]
Best Practices in Teaching Science
“Think of science as a verb. You have to do it.” - Jeff Goodman, Appalachian State University Other best practices to consider:
• Be explicit about how activities and content relate to the nature and process of science
• Model scientific behaviors, strategies, language
• Integrate questions such as: How do I use science? How do others use science?
How do we know this?
• Use photos, videos, graphics to teach concepts
• Provide time for hands-on science activities and discussion
• Teach vocabulary: both pronunciation and meaning
• Contextualize – connect your instruction to real life, careers, and college
• Teach about college pathways requiring knowledge of science
What is offered at your technical college that requires science?
• Teach about careers requiring science
What jobs are in the local area?
Science Humor!
Page 3| GED® Science Spectacular! ABSPD [email protected]
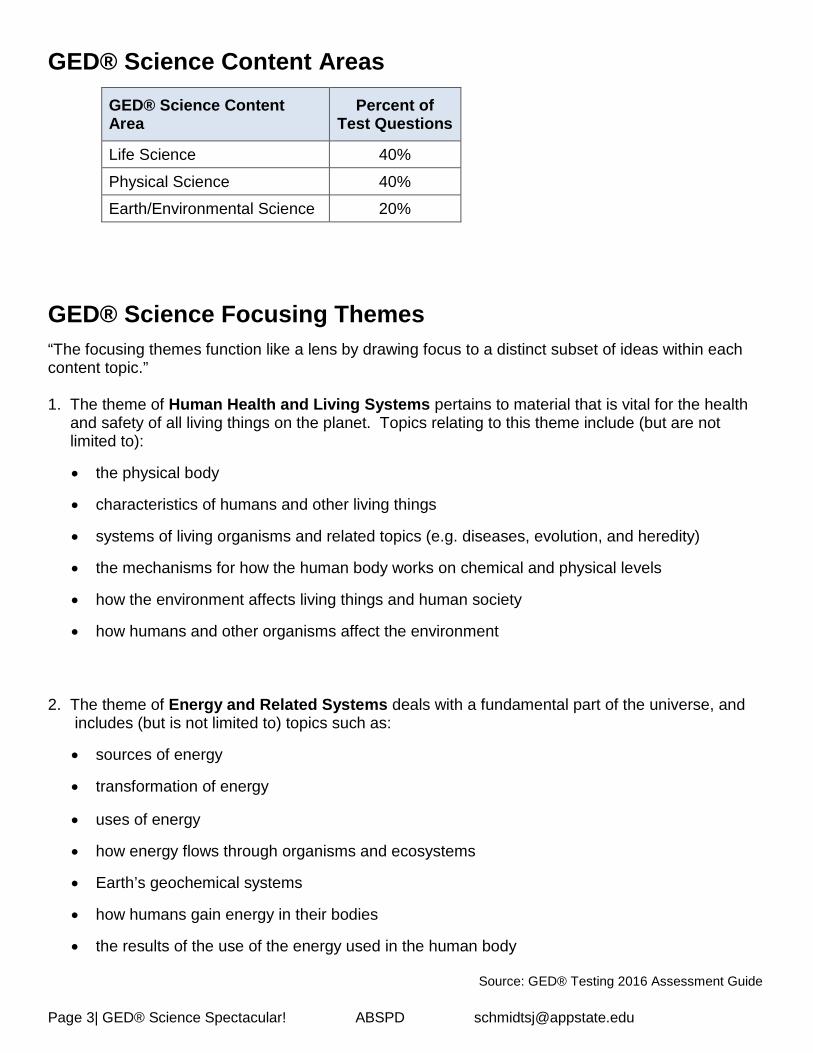
GED® Science Content Areas
GED® Science Content Area
Percent of Test Questions
Life Science 40%
Physical Science 40%
Earth/Environmental Science 20%
GED® Science Focusing Themes “The focusing themes function like a lens by drawing focus to a distinct subset of ideas within each content topic.” 1. The theme of Human Health and Living Systems pertains to material that is vital for the health and safety of all living things on the planet. Topics relating to this theme include (but are not limited to):
• the physical body
• characteristics of humans and other living things
• systems of living organisms and related topics (e.g. diseases, evolution, and heredity)
• the mechanisms for how the human body works on chemical and physical levels
• how the environment affects living things and human society
• how humans and other organisms affect the environment 2. The theme of Energy and Related Systems deals with a fundamental part of the universe, and includes (but is not limited to) topics such as:
• sources of energy
• transformation of energy
• uses of energy
• how energy flows through organisms and ecosystems
• Earth’s geochemical systems
• how humans gain energy in their bodies
• the results of the use of the energy used in the human body
Source: GED® Testing 2016 Assessment Guide
Page 4| GED® Science Spectacular! ABSPD [email protected]
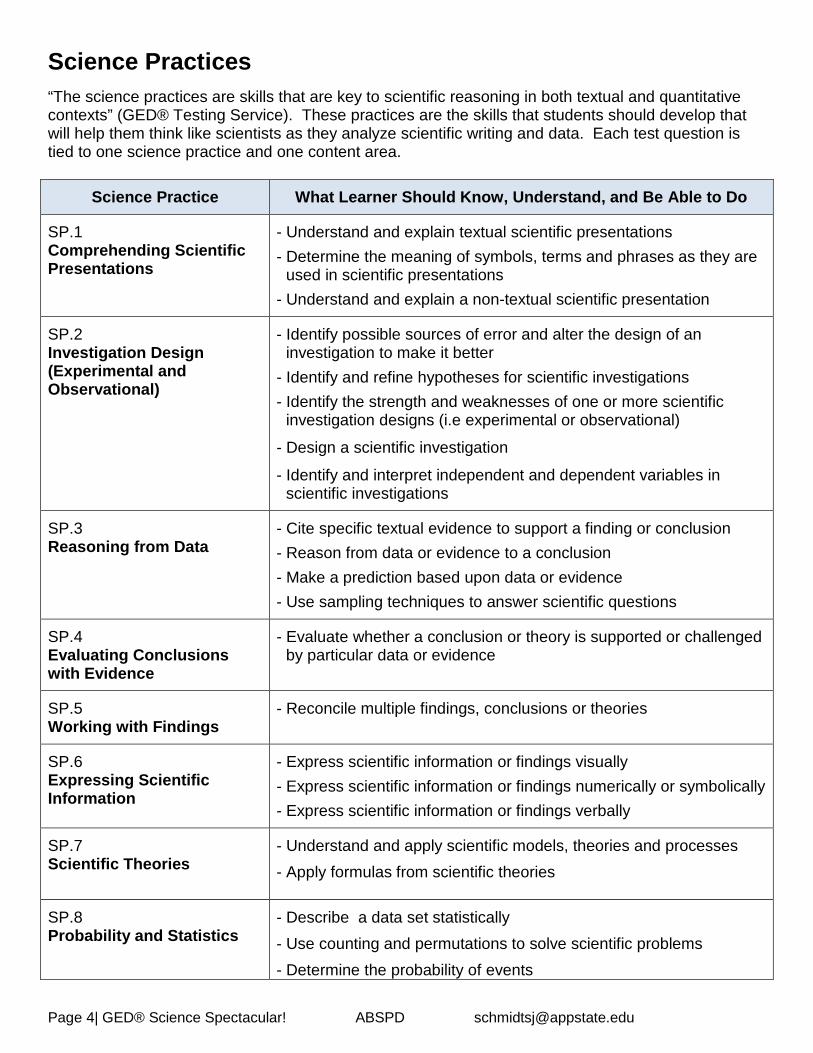
Science Practices “The science practices are skills that are key to scientific reasoning in both textual and quantitative contexts” (GED® Testing Service). These practices are the skills that students should develop that will help them think like scientists as they analyze scientific writing and data. Each test question is tied to one science practice and one content area.
Science Practice What Learner Should Know, Understand, and Be Able to Do
SP.1 Comprehending Scientific Presentations
- Understand and explain textual scientific presentations
- Determine the meaning of symbols, terms and phrases as they are used in scientific presentations
- Understand and explain a non-textual scientific presentation
SP.2 Investigation Design (Experimental and Observational)
- Identify possible sources of error and alter the design of an investigation to make it better
- Identify and refine hypotheses for scientific investigations
- Identify the strength and weaknesses of one or more scientific investigation designs (i.e experimental or observational)
- Design a scientific investigation
- Identify and interpret independent and dependent variables in scientific investigations
SP.3 Reasoning from Data
- Cite specific textual evidence to support a finding or conclusion
- Reason from data or evidence to a conclusion
- Make a prediction based upon data or evidence
- Use sampling techniques to answer scientific questions
SP.4 Evaluating Conclusions with Evidence
- Evaluate whether a conclusion or theory is supported or challenged by particular data or evidence
SP.5 Working with Findings
- Reconcile multiple findings, conclusions or theories
SP.6 Expressing Scientific Information
- Express scientific information or findings visually
- Express scientific information or findings numerically or symbolically
- Express scientific information or findings verbally
SP.7 Scientific Theories
- Understand and apply scientific models, theories and processes - Apply formulas from scientific theories
SP.8 Probability and Statistics
- Describe a data set statistically - Use counting and permutations to solve scientific problems - Determine the probability of events

Page 5| GED® Science Spectacular! ABSPD [email protected]
Tackling Investigation Design (Experimental/Observational)
Scientific Thinking Is Not Complicated
“Science, stripped down to its essentials, is just a method for figuring things out: you look at some situation, come up with a possible explanation, and try it to see if it works. If it does, great, if not, try something else. Repeat until you find an explanation that works. “This does not demand a complicated skill set. It’s really not much more than you need to be a functioning adult in modern society. And most people have, at one time or another, used exactly this procedure . . . “If you’ve ever cooked without a recipe, you have the mental skills needed to be a scientist. You come up with new dishes in essentially the same manner as you solve scientific problems: you make a guess that cooking two particular ingredients together in some way will be delicious, then you do it, and taste to see if you’re right. That’s the scientific method right there, and millions of people have done it at some point in their lives.
“If you have ever repaired anything– a car, a dripping faucet, a blown fuse– you have the mental skills needed to be a scientist. You fix problems in everyday life in the same way that you attack scientific problems: you make a guess as to the source of the problem, you try the appropriate solution for that sort of problem, and see if it worked. That’s how science works, and millions of people make their living doing this without ever realizing that they’re thinking scientifically.” Source: Chad Orzell, Uncertain Principles Blog
Quick Write Ask students to write for 10 minutes on how they solved a recent problem in their lives:
“If you have ever cooked
without a recipe, you have
the mental skills needed to
be a scientist . . . If you
have ever repaired
anything . . . you have the
mental skills needed to be
a scientist.”

Page 6| GED® Science Spectacular! ABSPD [email protected]
Steps in the Scientific Method Make Observations Science begins with observation. Observation is getting information through sight, hearing, smelling, tasting, and touching. My coffee stayed warm for two hours in my Thermos® cup. My cold drink only stayed cold for one hour in a plastic cup. Ask Questions Science begins with observation and continues with wonder. Humans are full of questions about what we discover from our senses. Why is the sky blue? Why do rotten eggs smell? We can ask questions using the five w’s and one h: who, what when, where, why, and how. The question has to be one that can be tested through an experiment.
What kind of cup is the best insulator? Create a Hypothesis Once we have done some research about our question, we can create a hypothesis, an educated guess based on observation and research. A good hypothesis is a possible explanation that can be tested with an experiment. A Thermos® cup will keep hot water warm the longest. Design an Experiment Scientists design experiments where one variable is changed (experimental) and the others are kept the same (controlled). Certain experiments may have a control and experimental group. The variables stay the same in the control group while one variable is changed in the experimental group. The control group shows what happens if nothing changes so it can be compared with the experimental group. In this experiment, the controlled variables are the water temperature, the amount of water poured in the cups, and the room temperature. The experimental variables are the different types of cups. I heat water to 160 degrees and put an equal amount into three kinds of cups:
a Thermos® cup, a plastic cup, and a Styrofoam cup.

Page 7| GED® Science Spectacular! ABSPD [email protected]
Collect and Analyze Data While doing the experiment, we observe what happens and collect data. The data describe what happened in the experiment and is usually shown in charts, graphs, and tables.
Cup type Thermos® Plastic Styrofoam Initial Temp 160 160 160 Water temp
after 30 minutes
105 88 95
Water temp after 60 minutes
92 74 84
Water temp after 120 minutes
84 70 75
Draw Conclusions Using our analyzed data, we now see if our hypothesis is right. The conclusion is our written statement that says what we think about our hypothesis. Scientists repeat their experiments many times to make sure their conclusions are right. My hypothesis is correct: The temperature in the Thermos® cup was the highest after 120 minutes, therefore a thermos cup is the best insulator.
Communicate the Results Finally, we describe the research we have done, the hypothesis, the experiment, the data, and our analysis so we can share it with others. This is done through reports, oral presentations, and journal articles. This can give other scientists a chance to repeat the experiment and see if their results match.
Human Wonder Research Human Wonder Research has seven hands-on science experiments you can do or watch available by Googling human wonder research or http://www.appstate.edu/~goodmanjm/rcoe/hwr/hwr.html . These experiments help improve students’ ability to think as a scientist while developing their observation skills.
MythBusters
The Mythbusters TV show gives an excellent model of how to take a situation and design an experiment to test it. A few years ago there was a viral video showing a man going down a huge waterslide and landing in a pool. People wondered if it was real. Here is the video and what the Mythbusters did to check it out: Video: Slip and fly amazing waterslide jump https://www.youtube.com/watch?v=3wAjpMP5eyo
Video: Mythbusters waterslide wipeout https://www.youtube.com/watch?v=iHu6LVg-0Hs

Page 8| GED® Science Spectacular! ABSPD [email protected]
Science Experimental Design Practice 11 questions you can turn into simple, low-cost experiments to teach experimental design: 1. Does adding aspirin to water keep flowers fresh longer? 2. How does the height from which a ping-pong ball is dropped affect the bounce height? 3. Which type of cup is a better insulator (Styrofoam, Thermos®, plastic, etc.)? Compare
temperatures of hot water over time. 4. How does activity (lying, sitting, walking, running) affect pulse rate? 5. Which color of M&M’s will people choose from a bowl or will they care? (This requires you to have
an even number of each color of M&M evenly mixed in the bowl and not to tell the test subjects what you’re testing.)
6. Compare how moldy a slice of bread will get over time under different storage conditions (in a
plastic bag, left out, in a paper bag, etc.). 7. Compare how long it will take water to evaporate out of different shaped containers. 8. Roll a marble or a car down a ramp. How does the height of the ramp affect how far it goes? (This can also be set up to test how the rolling surface affects distance rolled if height remains the same and rolling surface is changed.) 9. How does the temperature of water affect how quickly it will dissolve an Alka Seltzer? 10. Does the size of a coin affect how long you can spin it on its edge before it falls? (Compare dime, penny, nickel, quarter, dollar coin). (This is a great activity to discuss the challenges in doing controlled experiments. How can we make sure the spin is the same each time?) 11. Which shape of paper falls fastest: An unfolded sheet of paper, a paper folded in fourths, or a sheet of crumpled paper? Or can you create a different shape with paper that falls even faster? Source: 1 – 10 Jeff Goodman, Appalachian State University, 11 Goonen and Pittman
For each of these, identify:
A. Hypothesis B. Many controlled variables C. 1 Experimental (changed) variable D. How you will collect data E. How data will be evaluated
Page 9| GED® Science Spectacular! ABSPD [email protected]
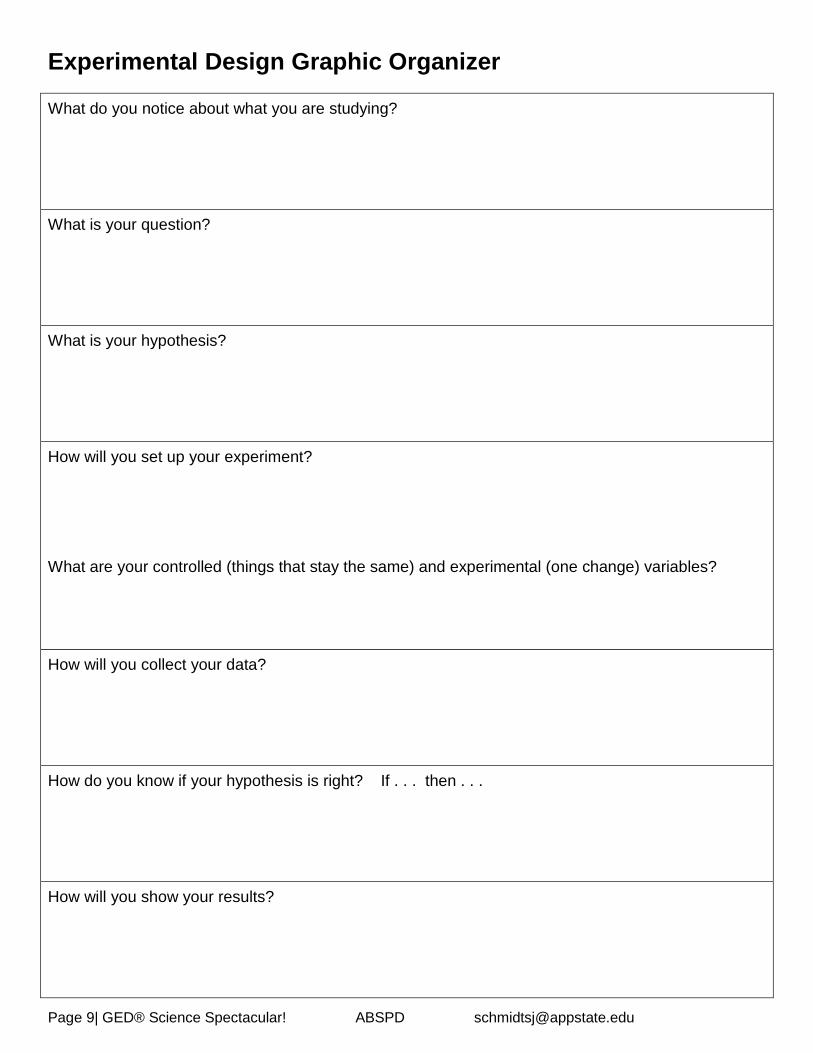
Experimental Design Graphic Organizer
What do you notice about what you are studying? What is your question? What is your hypothesis? How will you set up your experiment? What are your controlled (things that stay the same) and experimental (one change) variables? How will you collect your data? How do you know if your hypothesis is right? If . . . then . . . How will you show your results?
Page 10| GED® Science Spectacular! ABSPD [email protected]
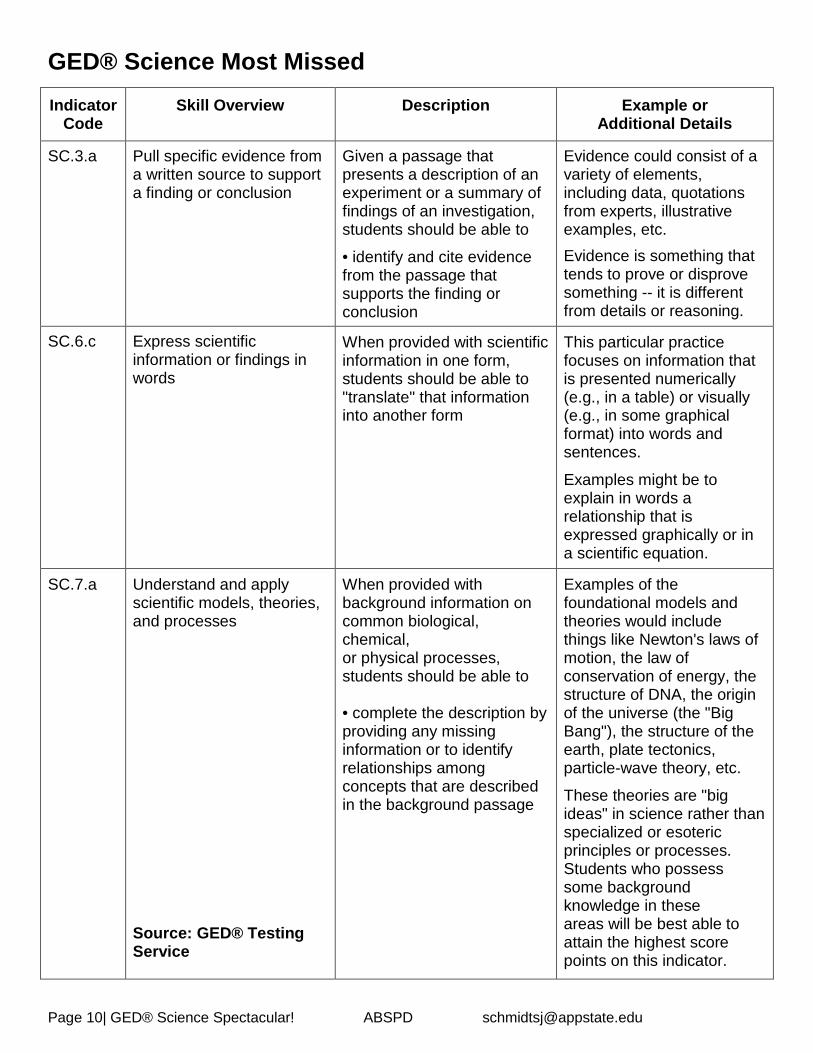
GED® Science Most Missed
Indicator Code
Skill Overview Description Example or Additional Details
SC.3.a Pull specific evidence from a written source to support a finding or conclusion
Given a passage that presents a description of an experiment or a summary of findings of an investigation, students should be able to
• identify and cite evidence from the passage that supports the finding or conclusion
Evidence could consist of a variety of elements, including data, quotations from experts, illustrative examples, etc. Evidence is something that tends to prove or disprove something -- it is different from details or reasoning.
SC.6.c Express scientific information or findings in words
When provided with scientific information in one form, students should be able to "translate" that information into another form
This particular practice focuses on information that is presented numerically (e.g., in a table) or visually (e.g., in some graphical format) into words and sentences.
Examples might be to explain in words a relationship that is expressed graphically or in a scientific equation.
SC.7.a
Understand and apply scientific models, theories, and processes Source: GED® Testing Service
When provided with background information on common biological, chemical, or physical processes, students should be able to • complete the description by providing any missing information or to identify relationships among concepts that are described in the background passage
Examples of the foundational models and theories would include things like Newton's laws of motion, the law of conservation of energy, the structure of DNA, the origin of the universe (the "Big Bang"), the structure of the earth, plate tectonics, particle-wave theory, etc.
These theories are "big ideas" in science rather than specialized or esoteric principles or processes. Students who possess some background knowledge in these areas will be best able to attain the highest score points on this indicator.

Page 11| GED® Science Spectacular! ABSPD [email protected]
GED® Science Short Answer
Students have two 10-minute short answer tasks to respond to with a short paragraph on the GED® Science Test. The short answers are 15 percent of the total points possible on the test (Source: M. Kehe, GED® Testing Service). The short answers test students’ ability to analyze information and express their own reasoning. “The tasks that appear in short answer items will be much more like problems the GED® test taker will encounter in their daily lives, whether writing papers or reports in a postsecondary course of study, or problem solving in the workplace” (Source: GED® Assessment Guide for Educators). Short answer questions may be based on any of the GED® Science Practices Indicators 1 through 6. “If test-takers are able to demonstrate their understanding of the skills described in each of our indicators, then they will be on very solid footing when the respond to these short answer questions” (Source: GED® Testing Service, Martin Kehe, VP of Products). Unpacking Prompts Since students have only 10 minutes for the science short answer, the stimulus (background written information and/or charts/graphs) and prompts (what to write about) are usually less than 250 words. Here is a sample short answer: Stimulus Material A researcher wants to test the solubility (property of being dissolved) of salt in water as the temperature of the water increases. Materials: salt, water, beakers, heat source, thermometer, balance
Prompt Design an experiment to test his hypothesis that as the water temperature increases the solubility of the salt in the water also increases. Include the following in your experimental design: experimental setup, procedure for data collection methods, and criteria for evaluating the hypothesis. Type your response in the box. This task may require approximately 10 minutes to complete.
Have students: Read the prompt first before the stimulus material. This helps students know where to focus.
Understand what the prompt asks students to do. Some prompts ask students to do more
than one thing. A way to practice this skill is to have students use the Do What graphic organizer and write briefly in their own words what they are supposed to do. For example:

Page 12| GED® Science Spectacular! ABSPD [email protected]
Prompt: Wind Energy Cite multiple pieces of data from the table that support why wind energy would be a preferred energy source over coal. Explain how a significant increase in the use of wind energy would affect the energy supply of coal.
Do What
Cite data from a table Shows why wind energy is better than coal
Explain How increased use of wind energy affects the coal supply
Prompt: Solubility Experiment Design Design an experiment to test his hypothesis that as the water temperature increases the solubility of the salt in the water also increases. Include the following in your experimental design: experimental setup, procedure for data collection methods, and criteria for evaluating the hypothesis.
Do What
Prompt: Ophiocordyceps unilateralis Deforestation, or clearing away trees, is occurring in tropical rain forests. Explain how deforestation could disrupt the life cycle of Ophiocordyceps unilateralis in tropical rain forests. Include multiple pieces of evidence from the text to support your answer.
Do What
Prompt: Farmer’s Hypothesis Experimental Design Design a controlled experiment that the farmer can use to test this hypothesis. Include descriptions of data collection and how the farmer will determine whether his hypothesis is correct.
Do What
Page 13| GED® Science Spectacular! ABSPD [email protected]
Prompt: Conclusion Analysis Using the data from the chart and table, explain whether Dr. Nefario’s conclusion about how long it will take the Gru satellite to fall out of orbit and enter Earth’s atmosphere is correct.
Do What
Source: Do What organizer from Goonen and Pittman
Attack the Stimulus Material! Once students understand what to do from reading the prompt, have them use some active reading strategies to understand the stimulus material. Draw a Picture One strategy students can use is to draw a picture. Give students material on a piece of paper with a wide margin. Have them summarize the reading using simple drawings in the margin:
In the summer of 2014, residents of Toledo, Ohio, were warned: Don’t drink the water! Toxins known as microcystins were found in the city’s water supply. Microcystins are produced by cyanobacteria (blue-green algae). The nutrients that start the algal bloom come from nitrogen and phosphorus that are used to treat agricultural crops. These nutrients are found in chemical fertilizers and cow manure. Cow manure on farmland is considered an environmentally safer alternative to chemical fertilizer. Some farmers spread manure on fields early in the spring, before the snow has melted. Many of the nutrients run off the land into streams. When chemical fertilizers are used instead of manure, nutrient runoff occurs even without snow. Many streams join to form rivers that eventually flow into lakes, such as Lake Erie. In addition, the city of Toledo’s treated sewage is released into Lake Erie. If sewage isn’t treated effectively, some nutrients make their way into the lake from that source, too. There may be many reasons for the increase in microcystins, but one is definitely the increase in phosphorus. Ultimately, two things cause the increase in phosphorus – the continuing growth in human population (around Lake Erie and in the rest of the world) and the never-ending attempts to raise more food per acre of land.
Adapted and reprinted by permission from New Reader’s Press, Writing for the GED®, Book 4
Page 14| GED® Science Spectacular! ABSPD [email protected]
3, 2, 1, or 0 and Why Students love to play the role of teacher! Begin by getting some examples of scored 3, 2, 1 and 0 short answers from the 2014 GED® Test – Science Short Answer Resource Guide for Adult Educators (Google: ged science short answer resource guide or find this at: http://www.gedtestingservice.com/uploads/files/89097368525e28544f77607f31391c4f.pdf Model some examples for the students and show why GED® Testing Service gave the scores they did. Have students closely study the Science Short Answer Scoring Guide below and provide scored examples so they can see what complete, partial, minimal, and no explanation or evidence means. Have students score some examples and explain why they gave the score they did. This activity benefits students in several ways: they will understand the scoring rubric better, they will see what it takes to score well on this task, and they will increase in confidence as they approach test day! Science Short Answer Scoring Guide
What the student should do: Score
Clear, well developed and complete explanation, description, or experimental design
Complete evidence support from text or other data
3
Adequate explanation, description, or logical experimental design
Partial evidence support from text or other data
2
Minimal or implied explanation, description, or minimal experimental design
Minimal or implied evidence support from text or other data
1
No explanation or description or illogical/no experimental design
No evidence support from text or other data
0
Science Humor!

Page 15| GED® Science Spectacular! ABSPD [email protected]
It’s All About the Evidence The word evident comes from a Latin word that means to see. Our task in many science readings is to look and find evidence that supports a conclusion. What do we see in a chart, graph, table, or writing that backs up what someone thinks is true? In the following text, we are asked to find evidence that supports the view that storing coal slurry in abandoned mineshafts causes an increase in harmful substances in nearby water supplies. If we have a chart that shows amounts of harmful substances in the water in different years, what should we expect to see over time? Coal Slurry Storage and Health Effects When coal is mined from the ground, it is coated with dirt and rocks. To save transport costs and increase its value, coal is washed with water mixed with chemicals to remove the dirt before being shipped to a power plant. This process creates a huge amount of wastewater called coal slurry. Coal slurry is mostly water and mud but it also contains some chemicals used in the washing as well as coal particles. Coal particles may contain heavy metals like mercury or arsenic that in certain amounts can be dangerous to humans. To deal with coal slurry waste, mining companies may create ponds or pump the slurry into abandoned coalmine shafts.
Critics of putting coal slurry into mineshafts claim that chemicals and heavy metals seep into local drinking water and cause health problems for local residents. Mining companies say storing coal slurry in mineshafts is environmentally responsible and that there is little chance for chemicals to get into local drinking water supplies. In 2008, Massive Coal Company began to put coal slurry in four abandoned mineshafts near Prenter Hollow, West Virginia. In 2010, local residents began complaining about the quality of their drinking water and noticed increases in health problems such as cancer, birth defects, and headaches. The chart below lists results of water tests done near Prenter Hollow every year from 2007 to 2011 for common chemicals contained in coal slurry. Circle or highlight every piece of evidence in this chart that supports the view that coal slurry dumping in abandoned mine shafts caused an increase in harmful chemicals in the ground water near Prenter Hollow West Virginia. Slurry storage near Prenter Hollow began in 2008.

Page 16| GED® Science Spectacular! ABSPD [email protected]
Local Water Samples Taken from Wells near Prenter Hollow West Virginia, 2007 - 2011
Heavy Metal or Organic Compound
2007 2008 2009 2010 2011
Mercury .002* .001 .01 1.6 6.3
Chromium 5.1 5.1 4.9 4.8 5.1
Selenium 1.1 1.0 1.1 1.0 1.1
Arsenic .8 1.0 2.0 4.5 9.9
4-Chloroaniline 0 .2 1.7 9 45
Barium 6 5 12 567 2,345
Cadmium 2.3 2.3 7.9 12.5 56.7
Antimony 2 4.5 11 19 92
* All figures in this chart are in parts per million
Draw a Conclusion Does it seem that there has been an increase in harmful chemicals in the water near Prenter Hollow West Virginia? What evidence supports this?

Page 17| GED® Science Spectacular! ABSPD [email protected]
It’s All About the Evidence Part 2 Evidence is the facts and data that back up a statement. For example, scientists may say: “The sun has just entered a period of greater activity where we will see more sunspots. In May we observed 10 sunspots, but in June we saw 25 sunspots and in July we saw 32 sunspots.” The evidence that supports the claim that the sun is more active is the increase in sunspots during June and July. In this sample writing prompt, have students underline each piece of evidence supporting the view that climate change is taking place through rises in the earth’s temperature, an increase in the sea level, and in the increase of melting ice and snow: Our Changing Earth
A majority of scientists agree that Earth’s climate is getting warmer. They point to many satellite observations done over the past 30 years to support their view. Three major global surface temperature reconstructions show that Earth has warmed a great deal since 1880. The 20 warmest years in history have occurred since 1981 with 10 of the 12 warmest occurring in the past 12 years. A warmer Earth causes more ice to melt and flow into seas causing sea levels to rise. The increased runoff has caused Earth’s seas to rise by an average of 3.4 mm per year. Scientists also believe the increase in sea level is due to the expansion of seawater as it gets warmer. The warming Earth also affects ice, glaciers, and snow cover. The Greenland and Antarctic ice sheets have decreased in mass. Greenland’s ice sheet lost 36 to 60 cubic miles of ice per year between 2002 and 2006, while Antarctica’s sheet lost 36 cubic miles of ice between 2002 and 2005. Glaciers in the Alps, Himalayas, Rockies, and Alaska have shrunk by an average of one percent per year over the past 20 years due to increased temperatures. Over the past 50 years, the snow cover in the Northern Hemisphere has decreased by 10 percent. Scientists have also observed that the spring snow cover melts an average of two weeks earlier today than it did in 1965.

Page 18| GED® Science Spectacular! ABSPD [email protected]
It’s All About the Evidence Part 3 For years, auto engineers believed that the faster a car went over 45 miles per hour (mph), the worse fuel efficiency it had in miles per gallon (MPG). The chart below shows results of recent fuel efficiency testing of four cars:
Fuel Efficiency of Toyota Prius, Honda Civic, BMW 328i, and Subaru Outback
Note: The Toyota Prius is a gas/electric hybrid vehicle while the Honda Civic, BMW 328i, and Subaru Outback are gas-powered cars. 1. What evidence from the graph is there to show that gas-powered cars have their best fuel efficiency between 60 and 70 miles per hour? 2. What evidence from the graph is there to show that gas-powered cards have their best fuel efficiency between 40 and 50 miles per hour? 3. What evidence from the graph is there to show that gas/electric hybrid cards have their best fuel efficiency under 40 miles per hour? 4. What overall conclusion can we draw from the graph about miles per gallon and speed? What is the connection between how fast we drive and our miles per gallon?

Page 19| GED® Science Spectacular! ABSPD [email protected]
Short Answer Practice Prompts Experiment: Truck Aerodynamics Trevon Washington, President of Long Haul Trucking, is looking for ways to save his company money. He heard installing side panels and boat tails to his box trailers would decrease their wind resistance and lead to less fuel use. Adding the panels and tails costs $3000 per box trailer, so Mr. Washington wants to make sure it will work. He has 40 tractor-box trailers that always travel the same round trip from Miami to New York and back driven by 40 different drivers.
Prompt Design an experiment to test the hypothesis that adding side panels and boat tails will save on fuel costs. Include the following in your experimental design: experimental setup, procedure for data collection methods, and criteria for evaluating the hypothesis. Type your response in the box. This task may require approximately 10 minutes to complete.
Source for Truck Aerodynamics and Cafeteria Trays, Schmidt
Side panel
Boat Tail

Page 20| GED® Science Spectacular! ABSPD [email protected]
Experiment: Cafeteria Trays Sarisa McLeod, cafeteria manager at Enormous State University, wants her two dining halls to practice sustainability while saving money. She is concerned about how much food students throw away which costs Enormous State thousands of dollars every year. Ms. McLeod knows of other universities that stopped using cafeteria trays and found they saved money. The theory is that cafeteria trays make it easier for students to take more food than they will eat. With no trays, students take less food and waste less food. Enormous State has two dining halls both of which serve the same food and about the same number of students each day.
Prompt Design an experiment to test the hypothesis that banning cafeteria trays will lead to less food waste. Include the following in your experimental design: experimental setup, procedure for data collection methods, and criteria for evaluating the hypothesis. Type your response in the box. This task may require approximately 10 minutes to complete.
Science Humor!

Page 21| GED® Science Spectacular! ABSPD [email protected]
Experiment: The Fun Theory The Elmwood Health Department is concerned - How do we encourage people to exercise more? They know climbing stairs is good exercise, but they see far more people taking the escalator instead of the stairs when leaving Elmwood’s downtown subway. Elmwood officials heard about the Fun Theory that claims making things fun gets more people to do them. They read research showing that adding electronics that turn stairs into giant piano keys that play music when people step on them gets more people to take stairs, helping them exercise more. There are two exits from Elmwood’s main subway route, the East Exit and West Exit, and both have adjoining stairs and escalators.
Prompt Design an experiment to test the hypothesis that making the stairs fun to use will increase the number of people taking the stairs instead of using the escalators. Include the following in your experimental design: experimental setup, procedure for data collection methods, and criteria for evaluating the hypothesis. Type your response in the box. This task may require approximately 10 minutes to complete.
Source: Schmidt, Reprinted by Permission from New Readers Press®

Page 22| GED® Science Spectacular! ABSPD [email protected]
Experiment: Single-Stream Recycling Gianco Industries wants to encourage its employees to recycle more. They have been using traditional multi-stream recycling where each office has a regular trashcan and each hallway has a recycling bin with collection areas for paper, plastic and metal. They found that many employees throw recyclables in their office trashcans and do not use the hallway recycling bins. Company leaders have read about single-stream recycling where traditional trashcans are removed from offices and are replaced by bins that accept all kinds of paper, plastic and metal and have a small-attached bin for other waste. The company has eight offices with an equal number of employees located around the country.
Prompt Design an experiment to test the hypothesis that using single-stream recycling will result in more pounds of recyclables than multi-stream recycling. Include the following in your experimental design: experimental setup, procedure for data collection methods, and criteria for evaluating the hypothesis. Type your response in the box. This task may require approximately 10 minutes to complete.
Source: Schmidt, Reprinted by Permission from New Reader’s Press®

Page 23| GED® Science Spectacular! ABSPD [email protected]
Climate Change Scientists are concerned about climate change. One way they monitor our changing Earth is through global temperature data. Two research teams are conducting a study using global temperature data from the Japan Meteorological Agency (JMA). The JMA monitors temperatures in 85 percent of the globe but has little data in the Arctic, Antarctic, Asia, and Africa. Some scientists believe the JMA’s data collection techniques from 1891 to 1951 are inaccurate due to outdated collection techniques. Each research team’s hypothesis is that a rise in Earth’s global temperatures above .5 degrees Celsius since 1880 is significantly above the long-term average and shows evidence of global warming. Here is how each team used the JMA data and their conclusion: Brindom University
• They assume that temperatures in the 15 percent of the globe where the JMA does not have temperature data are similar to the areas where they have data
• They believe that the data collected from 1891 to 1951 are accurate
• They find that Earth’s average temperature increased by .3 degrees Celsius and conclude that
the Earth’s warming trend is below its long term average Phenell University
• They use statistical models to fill in the missing data in areas where the JMA does not have data. These models show the Arctic and Antarctic are warming twice as fast as the rest of the world
• They corrected the data from 1891 to 1951 based on modern collection techniques
• They find that Earth’s average temperature increased by .8 degrees Celsius and conclude that
the Earth’s warming trend is above its long-term average Prompt How could these two research teams using the same data have come up with different conclusions? Type your response in the box. This task may require approximately 10 minutes to complete.
Source: Schmidt, Reprinted by Permission from New Reader’s Press®

Page 24| GED® Science Spectacular! ABSPD [email protected]
Where Else Can I Find Practice Prompts? The 2014 GED® Test – Science Short Answer Resource Guide for Adult Educators Google: ged science short answer resource guide to find this resource. It has four short answers that have been used by GED® Testing Service and detailed explanations on how they are scored. See more information at: http://www.gedtestingservice.com/uploads/files/89097368525e28544f77607f31391c4f.pdf http://writing4.newreaderspress.com This website has free practice prompts and mimics actual test taking conditions Writing for the GED® Test Book 4: This book has 15 language arts and 20 science short answer prompts. It is available from New Readers Press for $14. See more information at: www.newreaderspress.com/writing-for-the-ged-test Helpful Web Sites ABSPD Website Search for: abspd teaching resources, scroll down to adult secondary science https://abspd.appstate.edu/teaching-resources Physical Science Live Binder https://www.livebinders.com/play/play?id=1521296 Genetics, Molecular Biology and Evolution Live Binder http://www.livebinders.com/play/play?id=1708731&backurl=/shelf/my Figure This: Does Drinking Soda Affect Your Health?
Search for: challenge does drinking soda affect your health figure this
http://figurethis.nctm.org/challenges/c68/challenge.htm Graphing Stories http://graphingstories.com

Page 25| GED® Science Spectacular! ABSPD [email protected]
The Science Teacher’s Activity a Day® This book from author Pam Walker features 180 quick and fun projects that illustrate concepts in physical science, life science, and earth science using free and inexpensive materials. It is available for $13 on amazon.com Research Base GED® Testing Service (2014). Assessment Guide for Educators. Retrieved from: http://www.gedtestingservice.com/uploads/files/8c13f2e71e85447c9c4caff12b4cf943.pdf GED® Testing Service (2013). The 2014 GED® Test – Science Short Answer Resource Guide for
Adult Educators. Retrieved from: http://www.gedtestingservice.com/uploads/files/e4ea951423eb77497666bad8b2d0992c.pdf
Goodman, J. (2009). Human wonder research. Boone NC: Appalachian State University. Retrieved from: http://www.appstate.edu/~goodmanjm/rcoe/hwr/hwr.html Many thanks to Kim Litz from Asheville Buncombe Technical Community College for her editing help with this project! Answer Key Pgs. 12 - 13 Prompt Do What Prompt: Solubility Experiment
Do What
Design an experiment to test the hypothesis that as water temperature increases the solubility of the salt in the water also increases
Include experimental setup procedure for data collection methods criteria for evaluating the hypothesis

Page 26| GED® Science Spectacular! ABSPD [email protected]
Prompt: Ophiocordyceps unilateralis
Do What
Explain how deforestation could disrupt the life cycle of Ophiocordyceps unilateralis in tropical rain forests
Include multiple pieces of evidence from the text to support your answer
Prompt: Famer’s Hypothesis Experimental Design
Do What
Design a controlled experiment the farmer can use to test his hypothesis
Include descriptions of data collection how the farmer will determine whether his hypothesis is correct
Prompt: Experiment Analysis
Do What
Use data from the chart and table
Explain whether Dr. Nefario’s conclusion about the Gru satellite is correct
Pg. 15 - 16 Coal Slurry Storage and Health Effects: Draw a Conclusion Of the eight substances shown in the table, six show large increases in the period from 2008 to 2011:
Mercury Arsenic 4-Chloroaniline Barium Cadmium Antimony
This supports the view that coal slurry dumping in abandoned mine shafts caused an increase in harmful substances in the ground water which may be impacting local residents’ health.
Page 27| GED® Science Spectacular! ABSPD [email protected]
Pg. 17 It’s All About the Evidence Part 2: Our Changing Earth Three major global surface temperature reconstructions show that Earth has warmed a great deal since 1880. The 20 warmest years in history have occurred since 1981 with 10 of the 12 warmest occurring in the past 12 years. A warmer Earth causes more ice to melt and flow into seas causing sea levels to rise. The increased runoff has caused Earth’s seas to rise by an average of 3.4 mm per year. The warming Earth also affects ice, glaciers, and snow cover. The Greenland and Antarctic ice sheets have decreased in mass. Greenland’s ice sheet lost 36 to 60 cubic miles of ice per year between 2002 and 2006, while Antarctica’s sheet lost 36 cubic miles of ice between 2002 and 2005. Glaciers in the Alps, Himalayas, Rockies, and Alaska have shrunk by an average of one percent per year over the past 20 years due to increased temperatures. Over the past 50 years, the snow cover in the Northern Hemisphere has decreased by 10 percent. Scientists have also observed that the spring snow cover melts an average of two weeks earlier today than it did in 1965. Pg. 18 It’s All About the Evidence Part 3 1. The BMW 328i has its best fuel efficiency (highest miles per gallon (MPG)) at 65 miles per hour. The Honda Civic has has its best fuel efficiency at 68 miles per hour. 2. The Subaru Outback has its best fuel efficiency at 45 miles per hour. 3. The Toyota Prius has its best fuel efficiency at 38 miles per hour. 4. Most cars get their best fuel efficiency (MPG) between about 40 and 70 miles per hour. Cars get fewer MPG as they accelerate from 0 to 40. Cars also get fewer MPG at speeds get over 70 MPH.

Page 28| GED® Science Spectacular! ABSPD [email protected]
Pg. 19 Suggested Answer: Truck Aerodynamics Experimental Setup The hypothesis is that trucks using side panels and boat tails will use less fuel than trucks without them. Our experiment will divide the truck fleet in half with trucks of the same age and mileage equally mixed between the two groups. The experimental group will have 20 trucks with boat tails and side panels added and the control group will be 20 trucks that stay the same. There will be two trials. In the first, Group A (one set of 20 drivers) will drive the round trip between Miami and New York in the experimental group trucks with side panels and boat tails while Group B (the other set of 20 drivers) drives the control group trucks without them. In the second trial, Group B will drive the round trip between Miami and New York in the experimental group trucks with side panels and boat tails while Group A drives the control group trucks without them. Procedure for Data Collection Drivers will turn in their receipts showing the amount of fuel they used on the trucks with and without the side panels and boat tails. The amount of fuel used by the trucks with and without the side panels and boat tails will be added up. Criteria for Hypothesis Evaluation If the total amount of fuel used by the trucks with the side panels and boat tails is less than those without, then the hypothesis that adding side panels and boat tails will save fuel is right. Pg. 20 Suggested Answer: Cafeteria Trays Experimental Setup The hypothesis is that banning cafeteria trays will result in less food waste. Since there are two dining halls that both serve the same number of students, one dining hall will serve as the control group that will continue to use trays while the other dining hall will be the experimental group and stop using trays. Everything else in both cafeterias will remain the same. The experiment will have two trials that each last one week. In the first, Cafeteria A will be the experimental group and stop using trays and cafeteria B will be the control group and continue to use trays. In the second trail, Cafeteria B will be the experimental group and stop using trays and cafeteria A will be the control group and continue to use trays. Procedure for Data Collection During both trials, the food waste in each cafeteria will be weighed for one week and totaled. Criteria for Hypothesis Evaluation If the cafeteria food waste is less when trays are not used, the hypothesis that not using cafeteria trays will result in less food waste is right.

Page 29| GED® Science Spectacular! ABSPD [email protected]
Pg. 21 Suggested Answer: The Fun Theory Experimental setup The hypothesis is that making the stairs fun to use by turning them into piano keys will increase the number of people taking the stairs instead of the escalator. Turn either the East or West Exit stairs into a giant piano as the experimental group and leave the other exit unchanged as the control group. Procedure for data collection Have researchers count the total number of people who take the stairs and the escalator at both the East and West Exit over a two-week period. Criteria for hypothesis evaluation Compare the total number of people taking the stairs and escalator at the East and West Exits. If more people take the stairs at the exit where they were turned into piano keys, the hypothesis that making the stairs fun to use is correct. Pg. 22 Suggested Answer: Single-Stream Recycling Experimental setup The hypothesis is that single-stream recycling results in more total pounds of recycling than multi-stream recycling. Since all the company’s locations have an equal number of employees, choose two of the offices at random to conduct an experiment. One office will be the control group and will continue with multi-stream recycling. Another office will be the experimental group and use the multi-stream system where their office trashcans are removed and replaced by the single-stream recycling bin. Procedure for data collection Have both the control and experimental office collect and weigh the total amount of recycled paper, plastic and metal for one month. Criteria for hypothesis evaluation Compare the total amounts of recyclables from the single-stream and multi-stream recycling to see which type results in a greater amount of recycling. If there were more total pounds of recycling from single-stream recycling, the hypothesis is correct. Pg. 23 Suggested Answer: Climate Change
Phenell University had different results because of how they analyzed and adjusted the JMA data. Their statistical models filled in data from the Arctic and Anarctic which are warming faster than the rest of the Earth. They also adjusted data from a 60 year period based on modern data collection techniques. Both of these adjustments led to a higher average temperature.