GEAR GEOMETRY FOR REDUCED AND ROBUST TRANSMISSION ERROR ...139890/FULLTEXT01.pdf · GEAR GEOMETRY...
21
1 GEAR GEOMETRY FOR REDUCED AND ROBUST TRANSMISSION ERROR AND GEARBOX NOISE Mats Åkerblom KTH Dep. of Machine Design SE-100 44 Stockholm Sweden Volvo CE Component Division, SE-631 85 Eskilstuna, Sweden, [email protected] Abstract Gear geometry was optimized for decreased transmission error in order to reduce gearbox noise. Robustness with respect to gear deviations and varying torque was considered in order to find a gear geometry giving low noise in the appropriate torque interval despite deviations from the nominal geometry due to manufac- turing tolerances. Static and dynamic transmission error as well as noise and housing vibration were measured using a gear test rig. The correlation between dynamic transmission error, housing vibration, and noise was investigated. In speed sweeps from 500 to 2500 rpm at constant torque, no correlation was found be- tween dynamic transmission error and noise. Static transmission error seems to be the excitation of dynamic transmission error as well as housing vibration and noise, but different natural fre- quencies for different degrees of freedom of the dynamic system consisting of gears shafts, bearings, and housing lead to lack of correlation between dynamic transmission error and noise. Introduction Noise from gearboxes can be a problem for vehicles such as passenger cars, buses, trains, and trucks and for construction machines such as wheel loaders. This noise can be reduced by optimizing the macro- and microgeometry of a gear pair. The macro- geometry involves parameters such as the number of teeth, module, face width, pres- sure angle, and helix angle, whereas the microgeometry involves modifications to the gear flank, for example tip relief and helix angle crowning. When designing a gear pair, compromises are necessary because some of the charac- teristics of a gear pair are contradictory. For example, different gear macrogeometry factors influence the gear tooth bending strength, noise, efficiency, size, weight, cost, scoring resistance, and pitting resistance. The characteristics of the gear pair are also affected by parameters like the type and viscosity of the oil used, the operating tem- perature, and deflections of shafts, bearings, and housing [1].
-
Upload
nguyennguyet -
Category
Documents
-
view
217 -
download
0
Transcript of GEAR GEOMETRY FOR REDUCED AND ROBUST TRANSMISSION ERROR ...139890/FULLTEXT01.pdf · GEAR GEOMETRY...

1
GEAR GEOMETRY FOR REDUCED AND ROBUST TRANSMISSION ERROR AND GEARBOX NOISE
Mats Åkerblom
KTH Dep. of Machine Design SE-100 44 Stockholm Sweden Volvo CE Component Division, SE-631 85 Eskilstuna, Sweden, [email protected]
Abstract
Gear geometry was optimized for decreased transmission error in order to reduce gearbox noise. Robustness with respect to gear deviations and varying torque was considered in order to find a gear geometry giving low noise in the appropriate torque interval despite deviations from the nominal geometry due to manufac-turing tolerances. Static and dynamic transmission error as well as noise and housing vibration were measured using a gear test rig. The correlation between dynamic transmission error, housing vibration, and noise was investigated. In speed sweeps from 500 to 2500 rpm at constant torque, no correlation was found be-tween dynamic transmission error and noise. Static transmission error seems to be the excitation of dynamic transmission error as well as housing vibration and noise, but different natural fre-quencies for different degrees of freedom of the dynamic system consisting of gears shafts, bearings, and housing lead to lack of correlation between dynamic transmission error and noise.
Introduction Noise from gearboxes can be a problem for vehicles such as passenger cars, buses, trains, and trucks and for construction machines such as wheel loaders. This noise can be reduced by optimizing the macro- and microgeometry of a gear pair. The macro-geometry involves parameters such as the number of teeth, module, face width, pres-sure angle, and helix angle, whereas the microgeometry involves modifications to the gear flank, for example tip relief and helix angle crowning. When designing a gear pair, compromises are necessary because some of the charac-teristics of a gear pair are contradictory. For example, different gear macrogeometry factors influence the gear tooth bending strength, noise, efficiency, size, weight, cost, scoring resistance, and pitting resistance. The characteristics of the gear pair are also affected by parameters like the type and viscosity of the oil used, the operating tem-perature, and deflections of shafts, bearings, and housing [1].

2
The type of gear noise called gear whine originates from vibrations excited mainly by transmission error. Transmission error is defined by Welbourn [2] as the nonconju-gacy of a gear pair, that is, the motion error defined by the difference between the output gear's actual position and its position if the gear teeth were perfect in shape and infinitely stiff. Transmission error (TE) is defined as:
⎥⎥⎦
⎤
⎢⎢⎣
⎡⎟⎟⎠
⎞⎜⎜⎝
⎛−= g
p
gpbp N
NRTE θθ (1)
where θ p and θ g are the rotations of the pinion and gear shafts, and N p and N g are the number of teeth on the pinion and gear, respectively. R bp is the base radius of the pin-ion. The major causes of transmission error are manufacturing and assembly imperfections and elastic deflections of gear teeth, shafts, bearings, and housing. Transmission error is therefore torque dependent. Dynamic transmission error (DTE) is also load and speed dependent as it is related to resonances and inertias. Henriksson [3] investigated the correlation between measured dynamic transmission error and noise from a two-stage truck gearbox and found that high values of dynamic transmission error corresponded to high noise levels. Measurements were made at constant speed and at different torque levels. He concluded that measured dynamic transmission error correlated with gearbox noise, whereas calculated static transmis-sion error did not. One goal of this work is to investigate whether dynamic loaded transmission error correlates with gearbox noise better than static loaded transmission error does. Dynamic transmission error is more complex and difficult to measure and calculate, but it might be worth the extra work if the correlation with noise seems to be better for dynamic transmission error than for static transmission error. Velex and Ajmi [4] analytically investigated the excitation of a gear system. They suggest that the main excitation of the gear system may be the difference between the loaded static transmission error (TES) and the unloaded static transmission error (NLTE). If that is the case, it is appropriate to try to achieve the same transmission er-ror both under load and with no load, rather than to try to minimize the loaded static transmission error. Therefore another goal of this work is to experimentally investi-gate whether this theory is valid for the gears in this study. This paper describes the optimization of a gear pair for decreased gearbox noise. The reference gear pair was designed more than twenty years ago, at a time when low noise was not as important as it is today. Therefore other properties such as strength were prioritized. Figure 1 shows both the traditional and the new additional demands on gear design according to MackAldener [5]. At the time when the gears were de-signed, it was not possible to predict gear noise with the same precision as today.

3
Figure 1. Traditional and new demands on gear design according to Mack-Aldener [5]
A new noise-optimized gear pair was designed by choosing macro- and micro-geometries giving lower transmission error than the original gear pair. The LDP soft-ware [6] developed at the Gear Laboratory at Ohio State University was used to pre-dict transmission error. The gear geometry was chosen to give low transmission error for the relevant torque range, while also taking into consideration variations in the mi-crogeometry due to manufacturing tolerances. When new gears are manufactured and measured, the transmission error is calculated for the real geometry. Because of manufacturing tolerances, this differs from the no-minal geometry. The new gears were profile-ground using a KAPP VAS 531 gear- grinding machine with CBN-coated grinding-wheels. A gear test rig was used to measure noise and vibration from a test gearbox equipped with the reference and new gears. The test rig is described in more detail in Åkerblom [7]. Optical encoders and a Rotec measuring system were used to measure transmis-sion error in the test rig. Measured transmission error was compared with predicted transmission error, and the correlation between measured gearbox noise and transmis-sion error was investigated.
4
New gear geometry for reduced transmission error The aim was to reduce the maximum amplitude of the predicted transmission error at the gear mesh frequency (first harmonic of gear mesh frequency) to less than 50% of that of the reference gear pair. The second and third harmonics of the gear mesh fre-quency transmission error should also decrease for the new gear pair. (The first har-monic of transmission error is the amplitude of the part of the total transmission error that varies with frequency equal to the gear mesh frequency; the second harmonic is the amplitude of the part of the total transmission error that varies with the frequency equal to twice the gear mesh frequency, and so on). A torque range of 100 to 500 Nm was chosen because this is the torque interval in which the gear pair generates noise in its design application. According to Welbourn [2], a 50% reduction of transmission error can be expected to reduce gearbox noise by 6 dB (sound pressure level). The “optimization” is not done in a strictly mathematical way. The design is opti-mized by calculating the transmission error for different geometries, and then choos-ing a geometry that seems to be a good compromise, considering not only the trans-mission error, but also properties such as strength, friction losses, weight, cost, axial forces on the bearings, and manufacturing. Table 1 and Figure 2 show the geometry for the reference and optimized gears. The face width of the optimized gears was in-creased in order to achieve higher load-carrying capacity and also to some extent to compensate for the decreased load-carrying capacity due to the decreased module. For the optimized gear pair, the face width increased by 29% for the pinion and 36% for the gear. The load-carrying capacity increased by 53% for contact stress. The Load capacity increased by 21% for pinion root stress and 29% for gear root stress. Stresses were calculated according to ISO 6336. Table 2 shows the contact ratios and stresses.
Reference Optimized Pinion Gear Pinion Gear Number of teeth 49 55 57 64 Normal module [mm] 3.5 3.5 3 3 Pressure angle [degrees] 20 20 20 20 Helix angle [degrees] -20 20 -21.5 21.5 Center distance [mm] 191.9 191.9 191.9 191.9 Face width [mm] 35 33 45 45 Profile shift coefficient +0.038 -0.529 -0.250 -0.747 Tip diameter [mm] 191 209 190.3 209.7
Table 1. Macrogeometry for the reference and optimized gear pair

5
86
88
90
92
94
96
98
86
88
90
92
94
96
98
Figure 2. Gear macro geometry for the reference (left) and optimized gears (right)
Reference Optimized Pinion Gear Pinion Gear Profile contact ratio 1.78 2.15 Face contact ratio 1.03 1.67 Total contact ratio 2.81 3.82 Contact stress [MPa] at 1000 Nm pinion torque (ISO 6336) 629 508
Root stress [MPa] at 1000 Nm pinion torque (ISO 6336) 180 200 149 155
Table 2. Contact ratios and stress levels for the reference and optimized gear pair
When choosing microgeometry modifications and tolerances it is important to take in-to consideration the manufacturing options and cost. The goal was to use the same fin-ishing method for the optimized gears as for the reference gears, namely grinding us-ing a KAPP VAS 531 and CBN-coated grinding wheels. The microgeometry of the gears is shown in Table 3.
Reference Optimized Pinion Gear Pinion Gear Lead crowning [µm] 10-18 10-18 5-10 5-10 Tip relief [µm] 7-17 5-10 7-13 7-13 Start of tip relief diam. [mm] 187.05 205.59 186.79 206.44 Involute alignment dev. [µm] 10 10 8 8 Involute form dev. [µm] 8 8 8 8 Involute crowning 1-5 - - - Lead alignment dev. [µm] 10 10 10 10 Lead form dev. [µm] 8 8 8 8 Radial run out [µm] 50 50 50 50
Table 3. Microgeometry and tolerances for the reference and optimized gear pair
Figure 3 shows the predicted amplitude of the first harmonic of gear mesh frequency transmission error for the nominal gear geometry at different torque levels. The transmission error is given as the displacement at the pitch diameter. Nominal gear geometry means that no errors are present and all tolerances are centered in the toler-ance zone.

6
1st Harmonic of Calculated Transmission Error for Nominal Gear Geometry
00.2
0.40.60.8
11.21.4
1.61.8
0 200 400 600 800 1000
Torque [Nm]
TE [µ
m]
ReferenceOptimized
Figure 3. First harmonic of predicted transmission error for the reference and opti-mized gears with nominal gear geometry Robust transmission error For a specific torque and gear macrogeometry, it is possible to define a gear micro-geometry that minimizes transmission error. For example, at no load, if there are no pitch errors and no other geometrical deviations, the shape of the gear teeth should be true involute, without modifications like tip relief or involute crowning. For a specific torque, the geometry of the gear should be designed in such a way that it compensates for the differences in deflection resulting from stiffness variations in the gear mesh. However, although it is possible to define optimal gear geometry, it can be difficult to achieve this because the limitations of gear machining may make it difficult to manu-facture the gear. Manufacturing tolerances are inevitable, and smaller tolerances lead to higher manufacturing costs. Consideration must also be given to how to specify the gear geometry in drawings and to measure the gear in an inspection machine. Moreover, in many applications the transmission error needs to be minimized over a torque range, rather than for a spe-cific torque. The gear must also be robust. In other words, important characteristics of the gear such as the transmission error should not vary much when the torque is varied or when the microgeometry of the gear teeth varies due to manufacturing tolerances. LDP [6] was used to calculate the transmission error for the reference and optimized gear pairs at different torque levels. The robustness function in LDP was used to ana-lyze the sensitivity to deviations due to manufacturing tolerances. The “min, max, level” method was used with three values for each parameter. Thus the parameters for the pinion were assigned deviations from the nominal values as shown in Table 4. For example, the lead crowning for the pinion of the original gear pair was assigned the three values 12, 14 and 16 µm.

7
The deviations in Table 4 were used for both the reference gears and the optimized gears. The deviations do not correspond exactly to the tolerances given in Table 3 in order to facilitate comparison of the robustness, rather than find the absolutely worst case. Because there are five parameters, each with three levels, there are 35 = 243 dif-ferent combinations. For each torque level, the transmission error was calculated for all 243 combinations. Figure 4 shows the calculated first harmonic of the transmission error. Using the variations described in Table 4, the maximum, mean and minimum values are plotted for the original and optimized gear pair respectively.
min mean max Lead crowning dev. [µm] -2 0 +2 Involute alignment dev. [µm] -10 0 10 Involute crowning dev. [µm] -2 0 2 Lead alignment dev. [µm] -10 0 10 Bias dev. [µm] -5 0 5
Table 4. Gear microgeometry deviations used in robustness analysis
1st Harmonic of Calculated Transmission Error
00.20.40.60.8
11.21.41.61.8
2
0 200 400 600 800
Torque [Nm]
TE [µ
m]
Reference maxReference meanReference minOptimized maxOptimized meanOptimized min
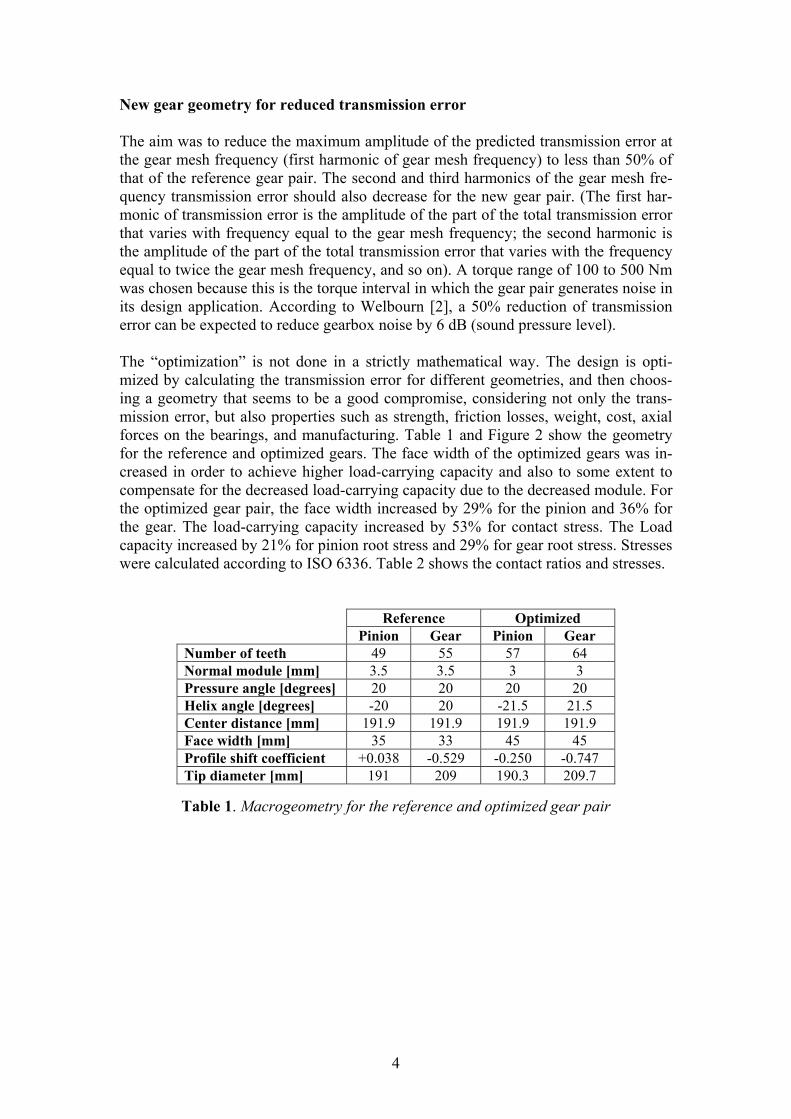
Figure 4. Predicted 1st harmonic of transmission error for the reference and opti-mized gear pair when using the deviations given in Table 4 The transmission error was also calculated for the reference and optimized gear pairs for actual measured gear microgeometry. The result is shown in Figure 5.
8
1st Harmonic of Calculated Transmission Error for Measured Gear Geometry
00.20.40.60.8
11.21.41.61.8
2
0 200 400 600 800 1000Torque [Nm]
TE [µ
m] Reference
Optimized
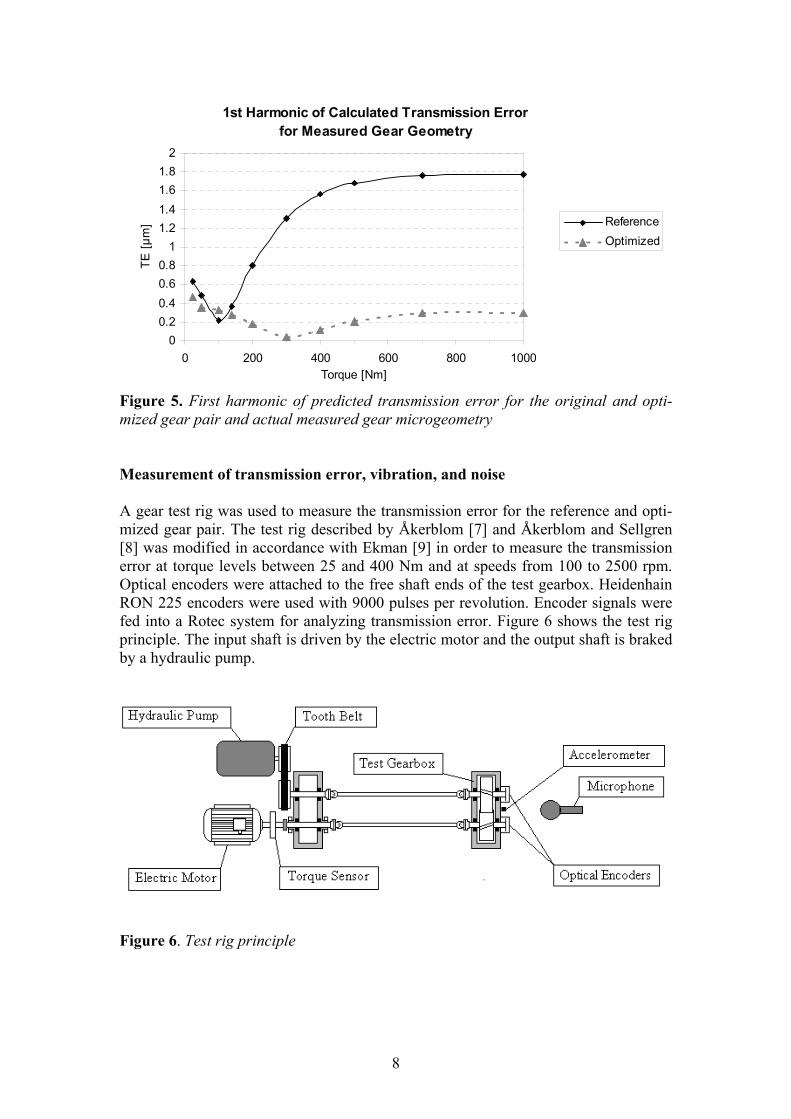
Figure 5. First harmonic of predicted transmission error for the original and opti-mized gear pair and actual measured gear microgeometry Measurement of transmission error, vibration, and noise A gear test rig was used to measure the transmission error for the reference and opti-mized gear pair. The test rig described by Åkerblom [7] and Åkerblom and Sellgren [8] was modified in accordance with Ekman [9] in order to measure the transmission error at torque levels between 25 and 400 Nm and at speeds from 100 to 2500 rpm. Optical encoders were attached to the free shaft ends of the test gearbox. Heidenhain RON 225 encoders were used with 9000 pulses per revolution. Encoder signals were fed into a Rotec system for analyzing transmission error. Figure 6 shows the test rig principle. The input shaft is driven by the electric motor and the output shaft is braked by a hydraulic pump.
Figure 6. Test rig principle

9
Measurements of (quasi-) static transmission error (TE) were made at low speeds (180 and 300 rpm) and at torque levels between 25 Nm and 400 Nm. Measurements of dy-namic transmission error (DTE) were made at torque levels 140 Nm and 400 Nm, with a pinion speed sweep from 500 rpm to 2500 rpm. The speed continuously in-creased over 70 s. Order tracking was used to evaluate the noise and vibrations related only to the gears. Measurement of noise and gearbox housing vibrations was also car-ried out during the speed sweep. Microphone and accelerometer positions were as de-scribed by Åkerblom and Pärssinen in [10]. Only accelerometer 1 and microphone 1 were used in these measurements. Figure 7 shows the first harmonic of the gear mesh frequency of the dynamic trans-mission error in a speed sweep from 500 to 2500 rpm. The two measurements were made before and after rebuilding the test gearbox with the same gear pair, reference gears. The pinion torque for both measurements was 400 Nm.
Measured 1st Harmonic of DTE for Reference Gears at 400 Nm
0
2
4
6
8
10
12
14
16
500 700 900 1100 1300 1500 1700 1900 2100 2300 2500
Pinion speed [rpm]
DTE
[μm
]
Reference 1Reference 2
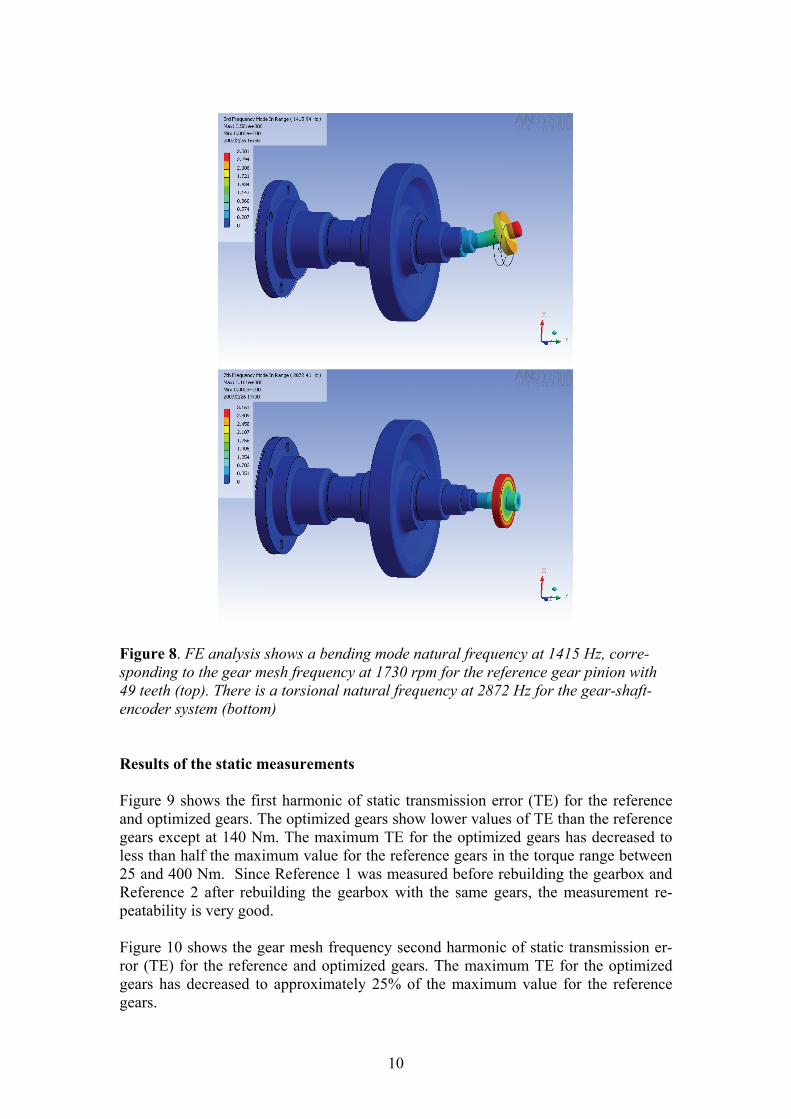
Figure 7. Measured first harmonic of dynamic transmission error (DTE) for the ref-erence gears at 400 Nm pinion torque. Reference 1 was measured before rebuilding the test gearbox and Reference 2 was measured after rebuilding the test gearbox with the same gears in order to investigate repeatability The peak at 1750 rpm pinion speed is most likely due to a resonance of the shaft con-necting the encoders to the gears. FE analysis shows a bending mode (Figure 8) whose frequency corresponds to the gear mesh frequency at 1730 rpm and 49 teeth, (a gear mesh frequency of 1415 Hz). The FE analysis also showed that the gear-shaft-encoder torsional resonance fre-quency is 2872 Hz. It is inappropriate to measure dynamic transmission error with frequencies near these resonances because the resonances are in the measuring system and not in the gearbox system.
10
Figure 8. FE analysis shows a bending mode natural frequency at 1415 Hz, corre-sponding to the gear mesh frequency at 1730 rpm for the reference gear pinion with 49 teeth (top). There is a torsional natural frequency at 2872 Hz for the gear-shaft-encoder system (bottom) Results of the static measurements Figure 9 shows the first harmonic of static transmission error (TE) for the reference and optimized gears. The optimized gears show lower values of TE than the reference gears except at 140 Nm. The maximum TE for the optimized gears has decreased to less than half the maximum value for the reference gears in the torque range between 25 and 400 Nm. Since Reference 1 was measured before rebuilding the gearbox and Reference 2 after rebuilding the gearbox with the same gears, the measurement re-peatability is very good. Figure 10 shows the gear mesh frequency second harmonic of static transmission er-ror (TE) for the reference and optimized gears. The maximum TE for the optimized gears has decreased to approximately 25% of the maximum value for the reference gears.

11
1st Harmonic of Measured Transmission Error
0
0.2
0.4
0.6
0.8
1
1.2
0 100 200 300 400 500
Torque [Nm]
TE [µ
m] Reference 1
Reference 2Optimized
Figure 9. Measured first harmonic of static transmission error for the reference and optimized gears at different torque levels. Reference 1 was measured before rebuild-ing the gearbox and Reference 2 after rebuilding the gearbox with the same gears
2nd Harmonic of Measured Transmission Error
0
0.1
0.2
0.3
0.4
0.5
0.6
0 100 200 300 400 500
Torque [Nm]
TE [µ
m] Reference 1
Reference 2Optimized
Figure 10. Measured second harmonic of static transmission error for the reference and optimized gears at different torque levels. Reference 1 was measured before re-building the gearbox and Reference 2 after rebuilding the gearbox with the same gears
12
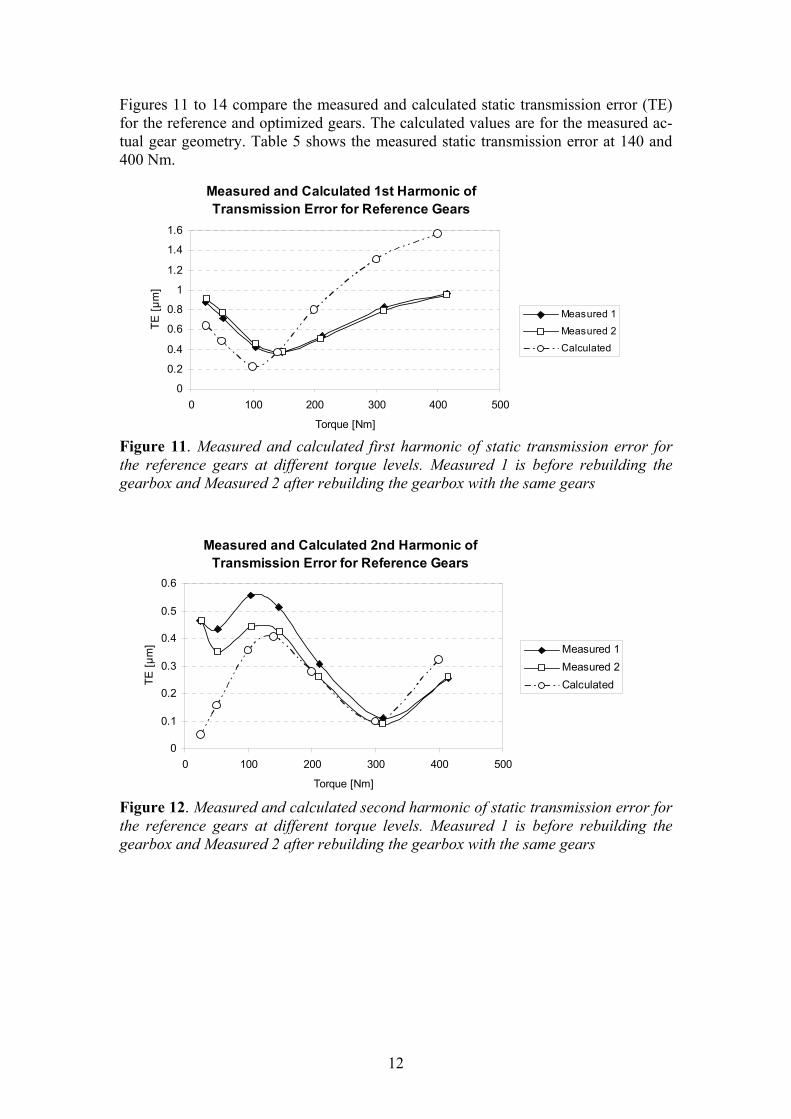
Figures 11 to 14 compare the measured and calculated static transmission error (TE) for the reference and optimized gears. The calculated values are for the measured ac-tual gear geometry. Table 5 shows the measured static transmission error at 140 and 400 Nm.
Measured and Calculated 1st Harmonic of Transmission Error for Reference Gears
0
0.2
0.4
0.6
0.8
1
1.2
1.4
1.6
0 100 200 300 400 500
Torque [Nm]
TE [µ
m]
Measured 1
Measured 2Calculated
Figure 11. Measured and calculated first harmonic of static transmission error for the reference gears at different torque levels. Measured 1 is before rebuilding the gearbox and Measured 2 after rebuilding the gearbox with the same gears
Measured and Calculated 2nd Harmonic of Transmission Error for Reference Gears
0
0.1
0.2
0.3
0.4
0.5
0.6
0 100 200 300 400 500
Torque [Nm]
TE [µ
m] Measured 1
Measured 2Calculated
Figure 12. Measured and calculated second harmonic of static transmission error for the reference gears at different torque levels. Measured 1 is before rebuilding the gearbox and Measured 2 after rebuilding the gearbox with the same gears

13
Measured and Calculated 1st Harmonic of Transmission Error for Optimized Gears
0
0.1
0.2
0.3
0.4
0.5
0 100 200 300 400 500
Torque [Nm]
TE [µ
m]
MeasuredCalculated
Figure 13. Measured and calculated first harmonic of static transmission error for the optimized gears at different torque levels
Measured and Calculated 2nd Harmonic of Transmission Error for Optimized Gears
0
0.02
0.04
0.06
0.08
0.1
0.12
0.14
0 100 200 300 400 500
Torque [Nm]
TE [µ
m]
MeasuredCalculated
Figure 14. Measured and calculated second harmonic of static transmission error for the optimized gears at different torque levels
Measured Static Transmission Error (TE) [µm] 1st harmonic 2nd harmonic 140 Nm 400 Nm 140 Nm 400 Nm
Reference Gears 0.37 0.95 0.43 0.26 Optimized Gears 0.36 0.14 0.047 0.089
Table 5. Measured first and second harmonic of static transmission error for the ref-erence and optimized gears at 140 and 400 Nm pinion torque

14
Results of the dynamic measurements Figure 15 shows the first harmonic of the gear mesh frequency of the dynamic trans-mission error (DTE) for the reference and optimized gears at 140 Nm and 400 Nm. The dynamic transmission error is plotted as a function of gear mesh frequency in-stead of rotational speed, so that peaks due to resonances will coincide despite the dif-ferent number of teeth for the reference and optimized gears.
1st Harmonic of Dynamic Transmission Error (DTE)
0,01
0,1
1
10
100
500 700 900 1100 1300 1500 1700 1900 2100 2300
Mesh Frequency [Hz]
DTE
[µm
]
Ref. 140 NmRef. 400 NmOpt. 140NmOpt. 400 Nm
Figure 15. First harmonic of measured dynamic transmission error (DTE) for the ref-erence and optimized gears at 140 Nm and 400 Nm pinion torque in a speed sweep from 500 to 2500 rpm In Figure 16, all plotted values are normalized to static transmission error = 1µm by multiplying all measured values by 1/TE. TE is the static measured transmission error for the respective gear pair and torque level using the values from Table 5 for the first harmonic. This normalization is made to determine whether the static transmission er-ror could be regarded as the excitation of a dynamic system. If this were the case, the curves should coincide more than they do in Figure 15. Of course there are dynamic differences due, for example, to different masses for the reference and the optimized gears, and also different mesh- and bearing stiffnesses at the different torque levels.

15
1st Harmonic of DTE Normalized to Static TE = 1μm
0,01
0,1
1
10
100
500 700 900 1100 1300 1500 1700 1900 2100 2300Mesh Frequency [Hz]
DTE
[µm
]Ref. 140 NmRef. 400 NmOpt. 140 NmOpt. 400 Nm
Figure 16. First harmonic of measured dynamic transmission error (DTE) for the ref-erence and optimized gears at 140 Nm and 400 Nm pinion torque. Normalization to static transmission error (TE = 1 μm) is done by multiplying all measured values by 1/TE (values in Table 5) Noise and gearbox housing vibration were measured at the same time as the meas-urement of the dynamic transmission error. Figure 17 shows the measured first har-monic of gear mesh frequency sound pressure level 20 cm from the gearbox. Figure 18 shows the measured first harmonic of gear mesh frequency vibration at the gearbox housing. Measurements were made for the reference and optimized gears at 140 Nm and 400 Nm in the speed sweep from 500 to 2500 rpm.
1st Harmonic of Sound Pressure Level
50
60
70
80
90
100
500 700 900 1100 1300 1500 1700 1900 2100 2300
Mesh Frequency [Hz]
SP
L [d
B]
Ref. 140 NmRef. 400 NmOpt. 140 NmOpt. 400 Nm
Figure 17. First harmonic of measured sound pressure level for the reference and op-timized gears at 140 Nm and 400 Nm pinion torque (dB ref. 2E-5 Pa)

16
1st Harmonic of Gearbox Housing Vibration
0,1
1
10
100
500 700 900 1100 1300 1500 1700 1900 2100 2300Mesh Frequency [Hz]
Acc
eler
atio
n [m
/s2 ]
Ref. 140 NmRef. 400 NmOpt. 140 NmOpt. 400 Nm
Figure 18. First harmonic of measured gearbox housing vibration for the reference and optimized gears at 140 Nm and 400 Nm pinion torque In order to investigate the correlation between dynamic transmission error (DTE), noise (SPL), and housing vibration, these quantities are plotted in the same diagram. Figure 19 shows the first harmonic of DTE, SPL, and housing vibration for the refer-ence gears at 140 Nm. The peak for the dynamic transmission error at 1415 Hz is due to the resonance of the shaft and encoder (Figure 8). It may be ignored as it is due to a resonance in the measuring system. Even after disregarding the surrounding frequen-cies from 1330 Hz to 1530 Hz, the SPL and housing vibration do not seem to “follow” the dynamic transmission error.
1st Harmonic of DTE, Vibration and SPL for Reference Gears at 140 Nm
40
50
60
70
80
90
100
500 700 900 1100 1300 1500 1700 1900 2100
Mesh Frequeny [Hz]
SP
L [d
B]
0.1
1
10
100
DTE
[μm
] A
cc. [
m/s
²]
SPLVibrationDTE
Figure 19. Measured first harmonic of dynamic transmission error (DTE), gearbox housing vibration, and noise, measured at 140 Nm pinion torque for the reference gears
17
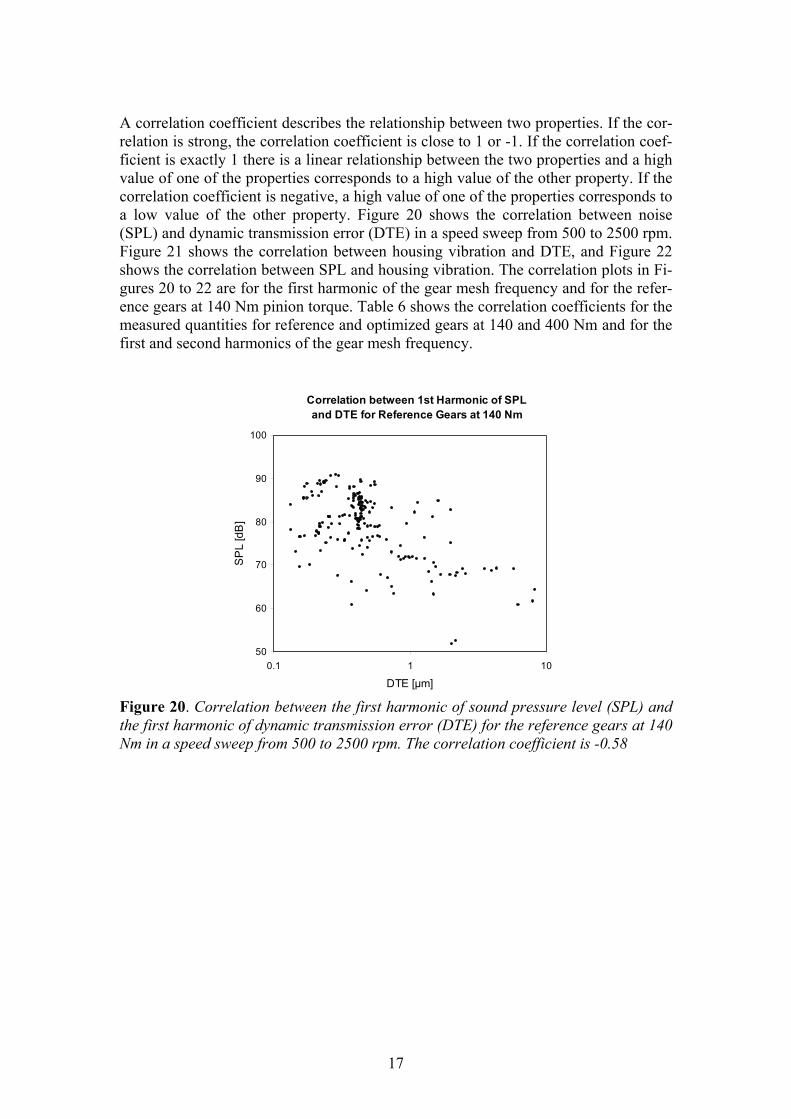
A correlation coefficient describes the relationship between two properties. If the cor-relation is strong, the correlation coefficient is close to 1 or -1. If the correlation coef-ficient is exactly 1 there is a linear relationship between the two properties and a high value of one of the properties corresponds to a high value of the other property. If the correlation coefficient is negative, a high value of one of the properties corresponds to a low value of the other property. Figure 20 shows the correlation between noise (SPL) and dynamic transmission error (DTE) in a speed sweep from 500 to 2500 rpm. Figure 21 shows the correlation between housing vibration and DTE, and Figure 22 shows the correlation between SPL and housing vibration. The correlation plots in Fi-gures 20 to 22 are for the first harmonic of the gear mesh frequency and for the refer-ence gears at 140 Nm pinion torque. Table 6 shows the correlation coefficients for the measured quantities for reference and optimized gears at 140 and 400 Nm and for the first and second harmonics of the gear mesh frequency.
Correlation between 1st Harmonic of SPL and DTE for Reference Gears at 140 Nm
50
60
70
80
90
100
0.1 1 10
DTE [μm]
SP
L [d
B]
Figure 20. Correlation between the first harmonic of sound pressure level (SPL) and the first harmonic of dynamic transmission error (DTE) for the reference gears at 140 Nm in a speed sweep from 500 to 2500 rpm. The correlation coefficient is -0.58

18
Correlation between 1st Harmonic of Housing Vibration and DTE for Reference Gears at 140 Nm
0.1
1
10
100
0.1 1 10
DTE [μm]
Hou
sing
Vib
ratio
n [m
/s2 ]
Figure 21. Correlation between the first harmonic of housing vibration and the first harmonic of dynamic transmission error (DTE) for the reference gears at 140 Nm in a speed sweep from 500 to 2500 rpm. The correlation coefficient is -0.50
Correlation between 1st Harmonic of SPL and Housing Vibration for Reference Gears at 140 Nm
40
50
60
70
80
90
100
0.1 1 10 100
Housing Vibration [m/s2]
SP
L [d
B]
Figure 22. Correlation between the first harmonic of sound pressure level (SPL) and the first harmonic of housing vibration for the reference gears at 140 Nm in a speed sweep from 500 to 2500 rpm. The correlation coefficient is 0.75

19
Correlation Coefficient Between 1st harmonic 2nd harmonic
DTE - SPL -0.58 0.35 DTE - Vibr. -0.50 0.45 Reference Gears
at 140 Nm Vibr. - SPL 0.75 0.75 DTE - SPL -0.09 0.30 DTE - Vibr. -0.11 0.63 Reference Gears
at 400 Nm Vibr. - SPL 0.66 0.52 DTE - SPL -0.36 0.10 DTE - Vibr. -0.36 0.20 Optimized Gears
at 140 Nm Vibr. - SPL 0.72 0.77 DTE - SPL -0.03 0.08 DTE - Vibr. -0.02 0.44 Optimized Gears
at 400 Nm Vibr. - SPL 0.62 0.47 Table 6. Correlation coefficients calculated for the logarithm of DTE [μm], SPL [dB] and the logarithm of housing vibrations [m/s2] in a speed sweep from 500 to 2500 rpm Discussion The calculated and measured static loaded transmission error correspond quite well. They show the same order of magnitude and the same trends regarding torque varia-tions. Differences between the calculated and measured transmission error could be due to measurement errors when measuring the transmission error, errors when meas-uring the gear geometry, and the somewhat simplified description of the gear micro-geometry used in the LDP calculations. To define the gear microgeometry to LDP, four teeth on each gear were measured and the average of the four teeth was used to describe the teeth. No involute form error was considered in the calculations as it was not possible to find a typical form deviation for the teeth, although there are always some deviations. Spacing errors and shaft deflections were also not included in the calculations. It would have been possible to include them, as well as geometrical er-rors for each tooth on each gear, but it was not considered to be worth the extra work and calculation time. Calculation results with and without shaft and bearing flexibility were compared, and the resulting difference in calculated gear mesh harmonics of transmission error was small. In other cases however, it may be necessary to include shaft and bearing flexibility as well as involute form deviations. Due to the resonance of the shaft and encoder at 1415 Hz it was inappropriate to measure the dynamic transmission error at frequencies close to 1400 Hz. Even with the frequency band from 1330 Hz to 1530 Hz excluded from the calculation of the correlation coefficients, no correlation was found between the dynamic transmission error and noise or housing vibration. For example, the correlation coefficient for the gear mesh frequency of dynamic transmission error and noise for the reference gears at 140 Nm was -0.58 using the entire frequency range, and -0.20 when excluding the frequencies from 1330 Hz to 1530 Hz.

20
In this work, no correlation was found between dynamic transmission error and gear-box noise in a speed sweep. Henriksson [3] found a correlation between dynamic transmission error and gearbox noise at constant speed and at different torque levels. The difference in the findings may also be related to the different complexity of the gearboxes studied, a complete truck gearbox in the work of Henriksson and a simple test gearbox in this paper. The suggestion of Velex and Ajmi [4] that the difference between the loaded static transmission error and the unloaded static transmission error (TES - NLTE) may be the main excitation of the gear system does not seem to be valid in this case. In Figure 11, the measured static transmission error for the reference gears shows a minimum of 0.4 μm at 140 Nm, while the values close to 0 Nm (25 Nm) and at 400 Nm are ap-proximately 1 μm. Consequently, the noise and housing vibration should be expected to be lower at 400 Nm than at 140 Nm. However, Figures 17 and 18 show this is not the case. Conclusions Moderate changes in the macro- and microgeometry of the gear considerably de-creased the static transmission error in the relevant torque range. In order to achieve robustness (the transmission error should not vary much when the gear microgeome-try varies due to inevitable manufacturing tolerances), variations in microgeometry due to manufacturing tolerances were considered. Robustness with respect to torque was also considered, meaning that the transmission error should not vary much when the torque varies. LDP is a useful tool when designing gear geometries with low trans-mission error. Static loaded transmission error appears to be a good measure of the ability of a gear pair to excite dynamic systems. A gearbox can be considered a complex dynamic sys-tem with a high number of degrees of freedom (dof). Some dofs are excited by trans-mission error. A torsional dof might lead to high values of dynamic transmission error when the gear mesh frequency corresponds to the natural frequency of that specific dof. This does not necessarily lead to high levels of housing vibration and noise be-cause the dof of the housing that is most likely to radiate noise might not be excited at a high amplitude. On the other hand, high levels of housing vibration and noise may occur when the gear mesh frequency corresponds to natural frequencies of the hous-ing, and do not necessarily correspond to high levels of dynamic transmission error. Thus different natural frequencies for different degrees of freedom of the dynamic system consisting of gears shafts, bearings, and housing result in a lack of correlation between dynamic transmission error and noise.

21
Acknowledgements This work was financially supported by Volvo Construction Equipment and the Swed-ish Strategic Research Foundation. The author would also like to acknowledge all col-leagues at Volvo and at the Royal Institute of Technology who contributed. The work was supervised by Professor Sören Andersson. Martin Ekman carried out a master thesis dealing with the adaptation of the test rig to make it possible to measure trans-mission error, and Janos Ribarits performed the measurement of transmission error. References [1] Harris O.J., Douglas M., James B.M., Wooley A.M. and Lack L.W., “Predict-
ing the Effects of Transmission Housing Flexibility and Bearing Stiffness on Gear Mesh Misalignment and Transmission Error,” Proc. 2nd MSC Worldwide Automotive Conference, http://www.mscsoftware.com/support/library/conf/auto00/p01500.pdf , 2000.
[2] Welbourn D.B., “Fundamental Knowledge of Gear Noise – A Survey”, Proc. Noise & Vib. of Eng. and Trans., I Mech E, Cranfield, UK, July 1979, pp 9-14.
[3] Henriksson M., “Analysis of Dynamic Transmission Error and Noise from a Two-stage Gearbox”, Licentiate thesis, TRITA-AVE-2005:34 / ISSN-1651-7660, Stockholm, 2005.
[4] Velex P. and Ajmi M., “On the Modelling of Excitations in Geared Systems by Transmission Errors”, Journal of Sound and Vibration, Vol. 290, Issues 3-5, 2006, pp 882-909.
[5] MackAldener M., “Tooth Interior Fatigue Fracture & Robustness of Gears”, Royal Institute of Technology, Stockholm, Doctoral Thesis, ISSN 1400-1179, 2001.
[6] Ohio State University, LDP Load Distribution Program, Version 2.2.0, http://www.gearlab.org/ , 2007.
[7] Åkerblom M., “Gear Test Rig for Noise and Vibration Testing of Cylindrical Gears”, Proceedings OST – 99 Symposium on Machine Design, KTH, Stock-holm, 1999.
[8] Åkerblom M. and Sellgren U., “Gearbox Noise and Vibration − Influence of Bearing Preload”, TRITA-MMK 2008:17 / ISSN 1400-1179 / ISRN/KTH/ MMK/R-08/17-SE, Stockholm, 2008.
[9] Ekman M. “Transmission Error Measurement – Modification of Gearbox and Development of Test Method”, Master of Science Thesis, MMK 2006:34 MME 784, Stockholm, 2006.
[10] Åkerblom M. and Pärssinen M., “A Study of Gear Noise and Vibration”, TRITA-MMK 2002:8 / ISSN 1400-1179 / ISRN/KTH/ MMK/R-02/8-SE, Stockholm, 2002.