
GB Auto - Initiation of Coverage - January 2016
31
PRIME INVESTMENT RESEARCH AUTOMOTIVE |EGYPT GB AUTO – INITIATION OF COVERAGE JANUARY, 14 TH 2016 PRIME INVESTMENT RESEARCH AUTOMOTIVE |EGYPT GB AUTO – INITIATION OF COVERAGE JANUARY, 18 TH 2016 WE INITIATE COVERAGE FOR … GB AUTO … ASSIGNING A “BUY” RATING AFTER APPLYING TOP-DOWN APPROACH ANALYSIS; STUDYING THE REGIONAL MARKET UNTIL GETTING TO GB AUTO; WE FOUND OUT THAT: GB AUTO IS A VERY DIVERSIFIED MARKET PLAYER; WITH A HUGE PORTFOLIO OF PRODUCTS` OFFERING. GB AUTO HAS INCREASED EXPOSURE TO MARKETS OTHER THAN EGYPT TO DIVERSIFY OPERATIONS AND MINIMIZE COUNTRY SPECIFIC RISKS. THE COMPANY ADDS NEW PRODUCTS TO ITS OFFERING THAT SUITS ITS TARGETED MARKETS ON CONTINUOUS BASIS. GB HAD SOLID FUNDAMENTALS AND SUCH PERFORMANCE IS ANTICIPATED TO CONTINUE SPECIALLY AFTER A SPECTACULAR PERFORMANCE IN 9M2015; THE HARDEST YEAR FOR THE INDUSTRY. GB AUTO NEVER MISS A YEAR WITHOUT MASS- INVESTMENTS. WE INITIATE COVERAGE FOR GB AUTO AT A FAIR VALUE OF EGP 5.44/SHARE IMPLYING A 99% UPSIDE POTENTIAL. HENCE, WE ASSIGN AUTO A “BUY” RATING.
-
Upload
mohamed-marei -
Category
Documents
-
view
172 -
download
0
Transcript of GB Auto - Initiation of Coverage - January 2016

PRIME INVESTMENT RESEARCH AUTOMOTIVE |EGYPT
GB AUTO – INITIATION OF COVERAGE JANUARY, 14TH
2016
PRIME INVESTMENT RESEARCH
AUTOMOTIVE |EGYPT GB AUTO – INITIATION OF COVERAGE
JANUARY, 18TH 2016
WE INITIATE COVERAGE FOR … GB AUTO … ASSIGNING A “BUY” RATING
AFTER APPLYING TOP-DOWN APPROACH ANALYSIS; STUDYING THE REGIONAL MARKET UNTIL GETTING TO GB
AUTO; WE FOUND OUT THAT:
GB AUTO IS A VERY DIVERSIFIED MARKET PLAYER; WITH A HUGE PORTFOLIO OF PRODUCTS` OFFERING.
GB AUTO HAS INCREASED EXPOSURE TO MARKETS
OTHER THAN EGYPT TO DIVERSIFY OPERATIONS AND
MINIMIZE COUNTRY SPECIFIC RISKS.
THE COMPANY ADDS NEW PRODUCTS TO ITS OFFERING
THAT SUITS ITS TARGETED MARKETS ON CONTINUOUS
BASIS.
GB HAD SOLID FUNDAMENTALS AND SUCH
PERFORMANCE IS ANTICIPATED TO CONTINUE
SPECIALLY AFTER A SPECTACULAR PERFORMANCE IN
9M2015; THE HARDEST YEAR FOR THE INDUSTRY.
GB AUTO NEVER MISS A YEAR WITHOUT MASS-INVESTMENTS.
WE INITIATE COVERAGE FOR GB AUTO AT A FAIR VALUE OF
EGP 5.44/SHARE IMPLYING A 99% UPSIDE POTENTIAL. HENCE, WE ASSIGN AUTO A “BUY” RATING.

2
PRIME INVESTMENT RESEARCH GB AUTO INITIATION OF COVERAGE
JANUARY, 2016
GB Auto is Egypt`s leading passenger car assembler, distributor and importer in the Middle East and North Africa. GB group is the largest market player in terms of sales revenue, market share and production capacity. GB Auto was able to historically outperform the market trend due to being the sole representative of Hyundai, Mazda and Geely passenger cars in Egypt. The company also owns the biggest distribution and after sales service networks.
GB Auto markets a variety of products with a wide range of sizes, prices and engine capacities; ranges from 1.1Lt engines to SUVs of 3.5Lt. Hence, enlarging its client base through capturing different preferences from all income classes.
Egypt`s Automotive industry is currently in stress. Mainly on FX shortages, leading production and assembly lines to stop as raw materials drop. Although, the country`s FX resources are deeply under pressure. We see the light at the tunnel end, indicating not more than a stressed 2-3 upcoming years.
Over 2016-2017, a new automotive comprehensive strategy is believed to replace the current one. The new strategy is believed to set new incentives for the domestic deteriorating industry status. The industry has also been suffering from unfair competition from imports coming from Free-Trade-Agreements involved countries. That seems better priced due to lower custom duties. The new strategy`s play might be on decreasing customs on non-related FTA imports, while raising sales` tax on all, to enhance competition. Or through providing tax breaks on vehicles assembled and/or produced domestically utilizing high local component contribution. Establishing high quality complementary and supplementary industries; to be able to source local inputs and become ready when turning to the phase of complete manufacturing.
The upcoming 5-6 years were set for the execution of a huge pipeline of projects. An aspect that would lead to higher economic status and hence, higher demand on commercial vehicles and construction equipment; to grow in positive correlation.
GB Auto raised EGP 960mn of capital to finance expansions targeting the highest GPM business lines “Funding a new Two & Three-Wheelers plant and a new Tires Plant”. GB Auto raised EGP 960mn through a rights issue in 2Q2015, to fund establishing 2-new production facilities. The wheelers plant is currently under construction and will be finalized by 2H2017 with production capacity of 240k vehicles per annum featuring Bajaj vehicles. The plant will be established at an estimated investment cost of around EGP 400mn. We are enthusiastic about the wheelers plant due to short term visible impact on margins. But we excluded the new tires plant from our valuation as no disclosures are released from the company defining its dynamics. However, as per the company`s management it is anticipated to be a mega-project.
We Initiate on GB Auto with a “BUY” rating driven from an Upside potential of 99%; as
a result of an estimated Fair Value of EGP 5.44. Using the DCF valuation methodology
for GB Auto; we valued GB Auto utilizing an average WACC over our forecasted horizon
of 12.83%, a risk free rate of 9.46%, and a market risk premium of 8%. We calculated GB
Auto`s adjusted statistical beta which came equivalent to 0.74, however as we believe
that the automotive industry carries high returns over the medium-to-long period we
also see its increasing risks and volatility over the medium term so we applied a beta of
1.0. We applied a perpetual growth rate of 3%, driven from our view over net
population growth coupled with real disposable income and spending power over the
medium term.
GB AUTO … RESILIENT, SKILLED & DIVERSIFIED … NAVIGATING THROUGH STORMS
Stock Data Outstanding Shares [in mn] 1,094 Mkt. Cap [in mn] 3,063.2 Bloomberg – Reuters AUTO EY / AUTO.CA 52-WEEKS EGP 2.45/EGP 6.45 DAILY AVERAGE TURNOVER (2015) EGP 3.722MN
Ownership Ghabbour Family 54.4% Free Float 45.6%
Financial Highlights
EGP mn 2014 2015E 2016E 2017E
Revenues 12,322.1 11,936.6 12,934.4 14,344.4 GPM (%) 12.8% 12.6% 13.1% 13.8% EBITDA 1,056.6 1,038.2 1,159.7 1,389.5
N.Income 235.7 251.3 353.3 516.1
EPS 0.16 0.17 0.24 0.35 P/E 17.23x 16.12x 11.47x 7.85x DPS - - - 0.19 BV/S 2.54 3.60 3.89 4.14 FCF/S (1.17) 0.31 1.10 0.39 GCF/S 0.76 0.76 0.84 0.97 EV/EBITDA 6.6x 6.7x 6.0x 5.0x
Source: GB AUTO, Prime Estimates All prices are as 17 January 2016
Source: Bloomberg
ource: GB AUTO, Prime Estimates
0
1
2
3
4
5
6
7
8
9
02-
01-
2014
02-
03-
2014
02-
05-
2014
02-
07-
2014
02-
09
-20
14
02-
11-2
014
02-
01-
2015
02-
03-
2015
02-
05-
2015
02-
07-
2015
02-
09
-20
15
02-
11-2
015
02-
01-
2016
Auto EGX-rebased
“BUY” MARKET PRICE EGP 2.74 FAIR VALUE EGP 5.44 POTENTIAL 99% UPSIDE
INVESTMENT GRADE “GROWTH”
Report Content Valuation & Risks 3 Financial Statements 4 A Brief on GB Auto 5 Operational Overview 6 Business Line – Intro 7
1- Passenger Cars 8 i- Egypt Passenger Cars 8 ii- New Comprehensive Strategy 11 iii- GB Egypt PC market 12 iv- GB & the MENA region 16
2- Commercial Vehicles & Commercial Equipment. 19
i- Egypt`s CV & CE Market Dynamics 19 ii- GB - The Exclusive Agent 21
3- Motorcycles & Three-Wheelers 24 4- Tires 26 5- Financing Business 28 6- Others 29 Disclaimer 30
3
PRIME INVESTMENT RESEARCH GB AUTO INITIATION OF COVERAGE
JANUARY, 2016
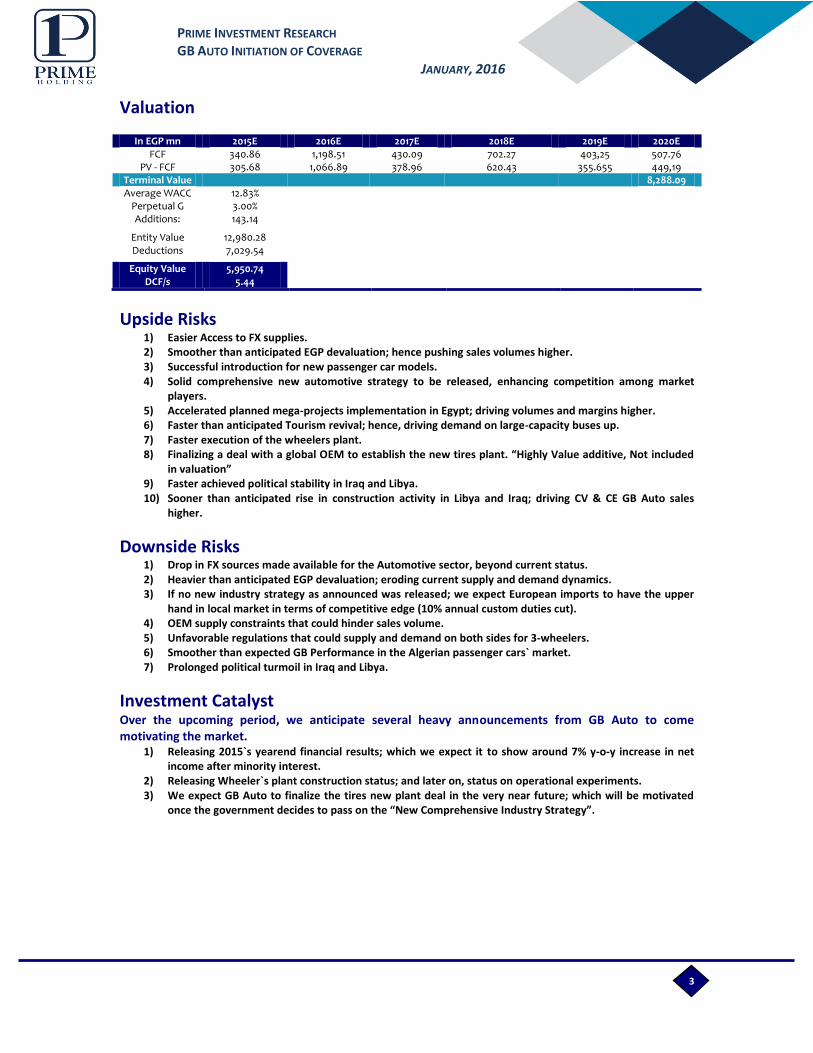
Valuation
In EGP mn 2015E 2016E 2017E 2018E 2019E 2020E FCF 340.86 1,198.51 430.09 702.27 403,25 507.76
PV - FCF 305.68 1,066.89 378.96 620.43 355.655 449,19 Terminal Value
8,288.09
Average WACC 12.83%
Perpetual G 3.00%
Additions: 143.14
Entity Value 12,980.28
Deductions 7,029.54
Equity Value 5,950.74
DCF/s 5.44
Upside Risks 1) Easier Access to FX supplies. 2) Smoother than anticipated EGP devaluation; hence pushing sales volumes higher. 3) Successful introduction for new passenger car models. 4) Solid comprehensive new automotive strategy to be released, enhancing competition among market
players. 5) Accelerated planned mega-projects implementation in Egypt; driving volumes and margins higher. 6) Faster than anticipated Tourism revival; hence, driving demand on large-capacity buses up. 7) Faster execution of the wheelers plant. 8) Finalizing a deal with a global OEM to establish the new tires plant. “Highly Value additive, Not included
in valuation” 9) Faster achieved political stability in Iraq and Libya. 10) Sooner than anticipated rise in construction activity in Libya and Iraq; driving CV & CE GB Auto sales
higher.
Downside Risks 1) Drop in FX sources made available for the Automotive sector, beyond current status. 2) Heavier than anticipated EGP devaluation; eroding current supply and demand dynamics. 3) If no new industry strategy as announced was released; we expect European imports to have the upper
hand in local market in terms of competitive edge (10% annual custom duties cut). 4) OEM supply constraints that could hinder sales volume. 5) Unfavorable regulations that could supply and demand on both sides for 3-wheelers. 6) Smoother than expected GB Performance in the Algerian passenger cars` market. 7) Prolonged political turmoil in Iraq and Libya.
Investment Catalyst Over the upcoming period, we anticipate several heavy announcements from GB Auto to come motivating the market.
1) Releasing 2015`s yearend financial results; which we expect it to show around 7% y-o-y increase in net income after minority interest.
2) Releasing Wheeler`s plant construction status; and later on, status on operational experiments. 3) We expect GB Auto to finalize the tires new plant deal in the very near future; which will be motivated
once the government decides to pass on the “New Comprehensive Industry Strategy”.

4
PRIME INVESTMENT RESEARCH GB AUTO INITIATION OF COVERAGE
JANUARY, 2016
SOURCE: GB AUTO, PRIME ESTIMATES
Financial Statements … Historical & Forecast Income Statement Brief Hist. Forecast
In EGP `000 2014 2015E 2016E 2017E 2018E
Revenues 12,322.1 11,936.6 12,934.36 14,344.37 15,158.76
Change 35.0% -3.1% 8.4% 10.9% 5.7%
COGS 10,740.41 10,431.90 11,241.93 12,366.06 12,916.18
Change 35.0% -2.9% 7.8% 10.0% 4.4%
Depreciation & Amortization 199.15 233.69 243.91 268.32 316.72
Gross Profit 1,581.68 1,504.71 1,692.43 1,978.31 2,242.59
GPM 12.8% 12.6% 13.1% 13.8% 14.8%
EBITDA 1,056.58 1,038.15 1,159.70 1,389.46 1,613.88
EBITDA Margin 8.6% 8.7% 9.0% 9.7% 10.6%
Net Income After MI 173.99 185.99 261.45 381.91 536.50
NPM 1.4% 1.6% 2.0% 2.7% 3.5%
Balance Sheet Brief Hist. Forecast
In EGP `000 2014 2015E 2016E 2017E 2018E Assets
Cash 1,176.84 1,735.35 1,284.87 1,062.33 1,112.42 Net Receivables 1,308.95 1,483.41 1,547.87 1,716.61 1,744.30 Net Inventory 2,345.71 2,105.17 2,080.22 2,250.96 2,428.95
Other Current Assets 1,147.20 1,184.65 1,202.86 1,253.02 1,258.94
Total Current Assets 5,978.70 6,508.58 6,115.82 6,282.93 6,544.60
Net PPE 2,988.84 3,180.67 3,332.99 3,720.33 3,800.73 Net Intangibles 282.46 281.54 280.62 309.50 308.49 Other LT-Assets 335.13 407.11 410.90 406.67 366.34
Total Long Term Assets 3,606.43 3,869.31 4,024.50 4,436.51 4,475.56
Total Assets 9,585.13 10,377.89 10,140.32 10,719.44 11,020.15
Liabilities
STD - incl CPLTD 4,144.84 3,298.00 2,542.26 2,719.47 2,591.88 Accounts Payable 842.14 1,286.13 1,539.99 1,626.22 1,698.57
Other Current Liabilities 557.92 601.06 639.46 727.39 777.12
Total Current Liabilities 5,544.90 5,185.18 4,721.71 5,073.08 5,067.56
LTD 656.14 639.42 478.39 382.71 287.04 Other Long Term liabilities 610.17 615.46 680.53 738.19 796.24 Total Long Term Liabilities 1,266.31 1,254.88 1,158.92 1,120.90 1,083.28
Total Liabilities 6,811.21 6,440.06 5,880.63 6,193.98 6,150.84
Equity
Paid-in-Capital 135.34 1,094.01 1,094.01 1,094.01 1,094.01 Reserves 1,334.05 1,371.25 1,410.46 1,467.75 1,548.23
RE 670.03 795.95 986.74 1,061.03 1,135.91 Minority interest 637.78 703.13 794.99 929.17 1,117.67
Total Equity 2,773.92 3,937.83 4,259.69 4,525.46 4,869.31
Cash Flow Brief Hist. Forecast
In EGP `000 2014 2015E 2016E 2017E 2018E 3-Blocks Cash Flow
CF from Operational Activities (22.90) 1,508.75 1,276.14 1,000.07 1,280.35
CF from Investment Activities (975.75) (593.49) (466.69) (705.83) (327.40)
CF from Financial Activities 1,091.81 (356.76) (1,259.93) (516.78) (902.86)
Change in Cash 93.17 558.51 (450.47) (222.54) 50.08
CF Sources & Uses
Sources of Funds 1,970.24 792.76 (237.57) 579.11 300.72 Uses of Funds 1,877.07 234.26 212.90 801.66 250.63
Change in Cash 93.17 558.51 (450.47) (222.54) 50.08

5
PRIME INVESTMENT RESEARCH GB AUTO INITIATION OF COVERAGE
JANUARY, 2016
GB AUTO`S OWNERSHIP STRUCTURE GB AUTO`S BOD
SOURCE: GB AUTO SOURCE: GB AUTO
A Brief on “Ghabbour Auto”
Ghabbour Auto (AUTO) is an Egyptian joint stock company incorporated on July 15th
, 1999 under the name of GB Capital for Trading and Capital Lease and under Law No. 159 of 1981. Based on the decision of Extraordinary General Assembly Meeting held on the 26 April 2007, it was agreed to change the Company name to GB Auto. GB Auto was listed on the Egyptian Exchange in 2007. The group’s main activities include trading, distributing and marketing of all transportation means including heavy trucks, semi-trucks, passenger cars, buses, mini buses, micro buses, agriculture tractors, pick-ups, mechanical tools` equipment for sail and motors with their different structures and types. The group also undertakes import and export activities, trading activities through its agencies, and selling locally manufactured and imported products for cash, on credit or through financial leasing (GB Leasing Arm). The group also provides transportation and cargo services.
GB Auto is Egypt`s automotive market leader; a significant player with weight to be considered. The company has launched a number of operations in key markets and sectors throughout the MENA region and is always in search for extending its offerings spectrum to new markets. GB Auto is a vertically-integrated company; as it manufactures certain vehicles` bodies and also carries assembly operations for imported knocked-down vehicles. GB Auto then shifts in chain to sales, distribution and marketing of concerned with previously mentioned operations besides distributing complete vehicles imported in one-piece as well. Playing on consumers retention; GB Auto has its own after-sales services offered to the wide range of its product`s portfolio through a chain of one-stop-shop retail outlets that offers various maintenance services, vehicles parts needed in addition to consumer finance available in outlets.
GB Auto is the exclusive regional partner and agent for a portfolio of global manufacturers, including Hyundai, Mazda, Geely, Bajaj, Marcopolo, Iveco Irisbus, Volvo, Great Wall, Mitsubishi, YTO, Sino Truck, Lassa, Yokohama, Diamond Back, Westlake, Grandstone, Rotalla and Triangle. We expect more recognized brands are to be included in such portfolio over the upcoming years as part of the company`s future expansion and penetration plans.
Ownership & Board of Directors
CEO Raouf Ghabbour Chairman/ Executive
Board
Members
Alaa El-din Hassouna Member/ Non-Executive
Waleed Suliman Member/ Non-Executive
Yasser Zaki Hashem Member/ Non-Executive
Moustafa El-Mahdy Executive
Nader Raouf Ghabbour Executive
Khaled Kandeel Member/ Non-Executive
24.4%
12.4%
9.4% 11.5%
42.3%
Raouf Ghabbour
Nader Raouf Ghabbour
Dina Raouf Ghabbour
Kamal Raouf Ghabbour
Free Float

6
PRIME INVESTMENT RESEARCH GB AUTO INITIATION OF COVERAGE
JANUARY, 2016
SOURCE: GB AUTO
Operational Overview … 5-Main Pillars GB Auto is Egypt`s giant when it comes to the automotive industry and a main player in the MENA region; thanks to its increasing points of presence. The company has been able to continuously rank as Egypt`s largest market share capturer thanks to its diversified products` mix and its skilled management. GB Auto operates with a workforce of around 8k divided between skilled labor, technicians and business experts.
GB Auto has been able to increase its footprint to include many points of presence in the MENA region, including Egypt, Iraq, Libya, Jordan and Algeria. The company`s points of presence are characterized by being high risk investments due to the current political turbulence and on-going wars in two major markets; namely Iraq and Libya. However, we find penetrating such markets at the current time being carries a clever investment strategy within. Of baring high risks in return for high returns when the right time comes. Specially in time when the company`s main market “Egypt” is sustainably performing well.
GB Auto conducts assembly operations for passenger cars (PCs) with capacity exceeding 50k cars per annum, commercial vehicles (CVs) and wheelers; the process takes place at 3 plants in Greater Cairo. Assembly operations refer to Completely-Knocked-Down (CKD) vehicles imported as kits from contracted international brands that are assembled including local content contribution as per the Egyptian law. GB Auto also invested in advancing through the value chain through increasing its abilities to surpass pure assembly and extend to manufacturing activities. The company currently design and produce different CVs models and sizes suiting the market at facilities in Greater Cairo and Suez but import engines and chassis. GB Auto extended its integration to include a forward one through distributing its products domestically and regionally; the company also sell and distributes Completely-Built-Up (CBU) vehicles imported in one-piece. The company also offers after-sales service for nearly all of its offered products through after-sales network, considered to be Egypt`s most and largest network. The company currently has around 7 PCs service centers, 6 CVs service centers, and a motorcycles & three-wheelers service center. The company also had 4 service centers in Iraq. GB Auto also provide automotive related and unrelated financial services, through growing its financing business to include financial leasing, microfinance, consumer finance, operational leasing and recently increased penetration to include another venture targeting the finance needed by female micro-entrepreneurs as well as retail micro-lending.
GB assembles
completely
Knocked-Down
passenger cars and
also carry
operations for 2*3-
wheelers.
GB Auto has the
capability to fully
manufacture bus
bodies, trailers and
super structures.
GB Auto is
currently a well-
known regional
player with
influence; through
its presence in
Egypt, Iraq, Libya,
Algeria & Jordan.
Currently includes
5-companies under
its umbrella.
Providing most
non-banking
financial services.
GB Auto provides
after-sale and
maintenance
services for GB
brands and
others.
Business Operations
Assembly Manufacturing Sales & Distribution Financing After-sales Services

7
PRIME INVESTMENT RESEARCH GB AUTO INITIATION OF COVERAGE
JANUARY, 2016
SOURCE: GB AUTO
Business Lines … Introduction GB Auto currently operates 6 business lines, with a portfolio of over 11 products and 20 brands. As previously indicated; Egypt is the back-bone, operations are supported by a very low motorization rate in comparison with smaller sizes nations. A populous country that is in need for more transportation vehicles, routes and means to be implemented. However, GB strategic planning has exposed it to Iraq and Libya, and we see high potential in those markets after they politically stabilize; especially for commercial vehicles and equipment. GB also distributes its PCs there and other markets as indicated in the diagram below according to company`s data.
Passenger Cars CVs & CEs 2 & 3-Wheelers Tires Financing Other
The company assembles
several models and sell
and distribute others as
CBU units.
GB Auto is the regional
exclusive agent for
Hyundai, Geely, and
Mazda.
A Tripartite agreement
with Egypt`s Aboul-
Fotouh & China`s Cherry
for CHERRY
DISTRIBUTION.
The company offers
after-sales service and
spare parts covering all
its product offerings.
GB is the exclusive agent
for the premium
wheelers brand “Bajaj”.
Assembles and
distributes motorcycles
and three-wheelers.
A new plant is UNDER-
CONSTRUCTION.
Also provides financing
options; due to the high
demand on such vehicles
by lower income
segments.
Provides after-sales
service and spare parts
needed as well.
Assembly and
distribution of different
globally premium
commercial vehicles
brands take place.
besides construction and
farming equipment.
Has full ability for bus
bodies manufacturing
through its JV with GB
Polo.
Offers after-sales service
and spare parts.
It’s a promising line;
EGYPT IS ON THE FAST-
TRACKED PROJECTS
ALARM.
This business line carries
an EXPANSIONARY
STORY not unveiled yet.
One of the highest
margin segments in the
automotive industry.
Distribution of all vehicle
types, categories and
sizes take place.
A business line that
never failed to astonish
the market.
Becoming big; GB keeps
on launching NEW
VENTURES over small
time horizons to ensure
diving further into the
high margin segment.
GB is currently the
exclusive distributor for
Gazprom-Neft lubricants;
we look for an
IMPRESSIVE SUCCESS
STORY over the
upcoming short-time
period.
GB has launched pre-
owned cars operations;
through which used cars
goes under maintenance
and repairs for a resale.
Business Lines
8
PRIME INVESTMENT RESEARCH GB AUTO INITIATION OF COVERAGE
JANUARY, 2016
SOURCE: AMIC, PRIME ESTIMATES
Business Lines … Analysis & Forecast 1- Passenger Cars
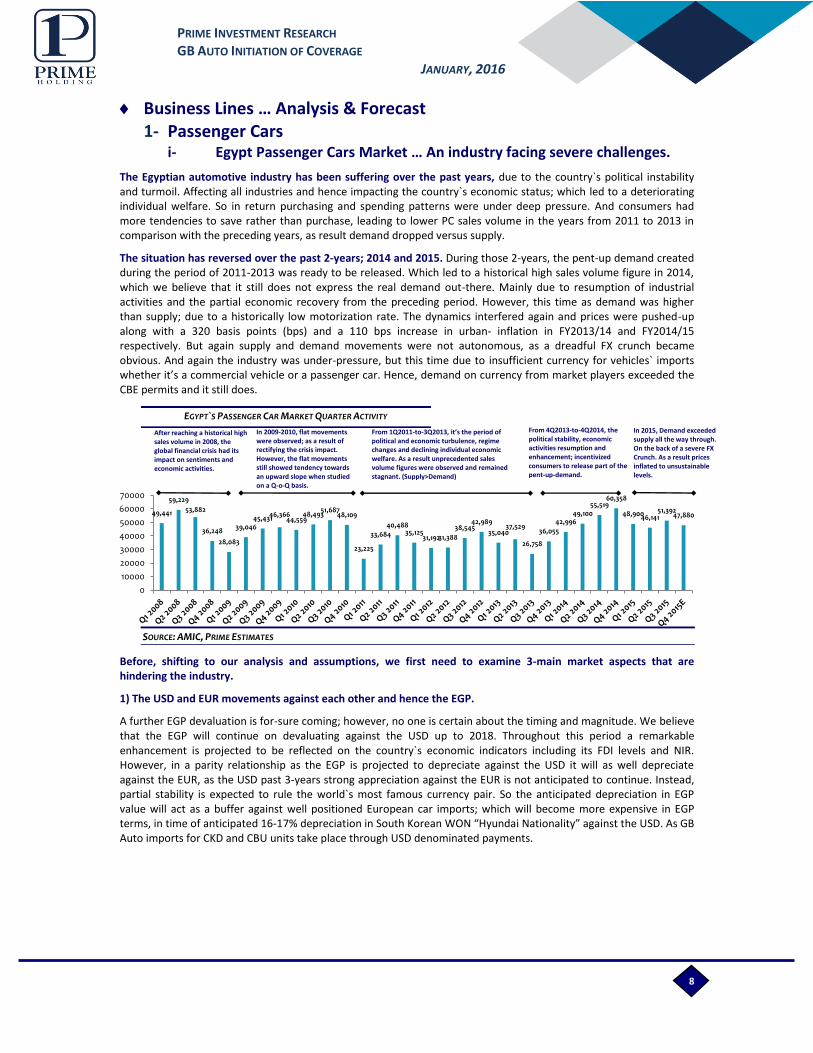
i- Egypt Passenger Cars Market … An industry facing severe challenges.
The Egyptian automotive industry has been suffering over the past years, due to the country`s political instability and turmoil. Affecting all industries and hence impacting the country`s economic status; which led to a deteriorating individual welfare. So in return purchasing and spending patterns were under deep pressure. And consumers had more tendencies to save rather than purchase, leading to lower PC sales volume in the years from 2011 to 2013 in comparison with the preceding years, as result demand dropped versus supply.
The situation has reversed over the past 2-years; 2014 and 2015. During those 2-years, the pent-up demand created during the period of 2011-2013 was ready to be released. Which led to a historical high sales volume figure in 2014, which we believe that it still does not express the real demand out-there. Mainly due to resumption of industrial activities and the partial economic recovery from the preceding period. However, this time as demand was higher than supply; due to a historically low motorization rate. The dynamics interfered again and prices were pushed-up along with a 320 basis points (bps) and a 110 bps increase in urban- inflation in FY2013/14 and FY2014/15 respectively. But again supply and demand movements were not autonomous, as a dreadful FX crunch became obvious. And again the industry was under-pressure, but this time due to insufficient currency for vehicles` imports whether it’s a commercial vehicle or a passenger car. Hence, demand on currency from market players exceeded the CBE permits and it still does.
Before, shifting to our analysis and assumptions, we first need to examine 3-main market aspects that are hindering the industry.
1) The USD and EUR movements against each other and hence the EGP.
A further EGP devaluation is for-sure coming; however, no one is certain about the timing and magnitude. We believe that the EGP will continue on devaluating against the USD up to 2018. Throughout this period a remarkable enhancement is projected to be reflected on the country`s economic indicators including its FDI levels and NIR. However, in a parity relationship as the EGP is projected to depreciate against the USD it will as well depreciate against the EUR, as the USD past 3-years strong appreciation against the EUR is not anticipated to continue. Instead, partial stability is expected to rule the world`s most famous currency pair. So the anticipated depreciation in EGP value will act as a buffer against well positioned European car imports; which will become more expensive in EGP terms, in time of anticipated 16-17% depreciation in South Korean WON “Hyundai Nationality” against the USD. As GB Auto imports for CKD and CBU units take place through USD denominated payments.
49,441
59,229
53,882
36,248
28,083
39,046 45,431
46,366 44,559
48,493 51,687
48,109
23,225
33,684
40,488 35,125
31,192 31,388
38,545 42,989
35,040 37,529
26,758
36,055
42,996 49,100
55,519 60,358
48,900 46,141
51,392 47,880
0
10000
20000
30000
40000
50000
60000
70000
EGYPT`S PASSENGER CAR MARKET QUARTER ACTIVITY
After reaching a historical high sales volume in 2008, the global financial crisis had its impact on sentiments and economic activities.
In 2009-2010, flat movements were observed; as a result of rectifying the crisis impact. However, the flat movements still showed tendency towards an upward slope when studied on a Q-o-Q basis.
From 1Q2011-to-3Q2013, it’s the period of political and economic turbulence, regime changes and declining individual economic welfare. As a result unprecedented sales volume figures were observed and remained stagnant. (Supply>Demand)
From 4Q2013-to-4Q2014, the political stability, economic activities resumption and enhancement; incentivized consumers to release part of the pent-up-demand.
In 2015, Demand exceeded supply all the way through. On the back of a severe FX Crunch. As a result prices inflated to unsustainable levels.

9
PRIME INVESTMENT RESEARCH GB AUTO INITIATION OF COVERAGE
JANUARY, 2016
SOURCE: MOP, PRIME ESTIMATES SOURCE: CBE, PRIME ESTIMATES
EGYPT`S GDP & INFLATION OUTLOOK THE EGP WEAKENING … LEADING TO MORE EXPENSIVE EUROPEAN PCS
WITH PICK-UP IN USD SOURCES … FX AVAILABILITY WILL BE ENHANCED
SOURCE: CBE, PRIME ESTIMATES
2) The USD anticipated strength against all currencies; ease competition based on differentials to the USD base rate. However, FX shortages are involuntary.
The current FX scarcity we have been witnessing since 2011 political calls; seems to be sustainable over the upcoming 2-3 years. But enhancements are being monitored as we speak. Although tourism received major hits over the past few years until current time; we believe in its revival over the upcoming 2-3 years. As the current regime is intensely focusing on setting security and stability standards.
On the bright side, Egypt`s Foreign Direct Investments have been increasing and are projected to continue on such path. Due to new projects announced, especially those in New Suez Canal Developmental Axis, numerous free and industrial zones announced and new mega investments in oil and gas including that of ENI and many others. Such aspects along with Suez Canal revenues anticipated increase due to 4102`s expansions and global trade conditions enhancement, FX reserves will pick-up. The automotive industry which is not on the CBE priorities list for FX pumping and ranks after crucial industries like Food and pharmaceuticals will then get bigger shares than current levels. Although We found that over 2014 and 2015 the industry was able to receive a good share of the stressed FX pumping, being able to import CBU PCs which is less favored at the CBE in comparison with CKD “due to local content contribution in CKD” that incentivizes local feeding industries.
GB Auto as a market leader got hit from the FX crunch as well; but we believe that a giant like GB will never get severely injured. Due to 1) the company`s contribution to the economy through its Commercial Vehicles lines essential for industrial and agriculture activities. 2) As a market leader operating for nearly 6-7 decades GB comes on the top of the automotive list in terms of priority as the company has major CKD operations benefiting feeding industries and hence the economy. 3) We believe that GB global recognition and strong fundamentals make raising short-term financing from global financial institutions easier. 4) The company`s regional operations tagged in foreign currencies may act as a buffer. Although, the company did not fully receive 4Q2015 FX-needs which led to the complete stoppage of production lines for around 20-days, hence impacting 4Q2015 operations, but the management as a defensive strategy wiped out piling inventory.
-
1,000
2,000
3,000
4,000
5,000
-
2,000
4,000
6,000
8,000
10,000
12,000
14,000
FDI - USD mn Tourism Revenues - USD mn
Suez Canal Revenues - USD mn GDP per Capita - USD (RHS)
2,459.03 2,827.48
3,279.87
3,804.65
4.7% 5.2%
1.8% 2.2% 2.1% 2.2%
4.2% 3.9% 4.4% 4.8%
16.3%
11.7% 11.0%
8.7%
6.9%
10.1% 11.2%
9.9% 10.5%
9.8%
0%
5%
10%
15%
20%
-
500
1,000
1,500
2,000
2,500
3,000
3,500
4,000
GDP at Current Prices - EGP bn Real GDP Growth rate
Urban Inflation
5.2 5.6
6.2 6.7
7.3 7.7
8.3 8.8
9.2 9.0 8.9
1.34 1.29 1.32 1.37 1.21 1.11 1.09 1.09 1.10 1.11 1.12
0.0
1.0
2.0
3.0
4.0
5.0
6.0
7.0
8.0
9.0
10.0
11.0
2010 2011 2012 2013 2014 2015 2016 2017 2018 2019 2020
EGP/USD (RHS) USD/EUR (RHS) EGP/EUR (RHS)

10
PRIME INVESTMENT RESEARCH GB AUTO INITIATION OF COVERAGE
JANUARY, 2016
SOURCE: GB AUTO
SOURCE: AMIC, PRIME ESTIMATES
SOURCE: AMIC, OICA, PRIME ESTIMATES
3) Egypt`s Free Trade Agreements and the unfair competition dilemma.
The Free Trade Agreements “FTA” Egypt signed whether it’s the EU-FTA, Agadir-FTA or Egypt-Turkey-FTA are for sure not in favor of importers from other countries not involved in such agreements. In our case, Asian PCs imports mainly from china, Japan and South Korea; the major Asian automotive producers, suffer from unfair competition. Such non-FTA-involved imports face heavy custom duties in comparison with their counterparts. Especially European manufacturers “EU-FTA” as it’s the base of the world`s most recognized and sophisticated Automakers. Egypt`s free trade agreement (FTA) with the EU has put manufacturers, Producers and assemblers under severe pressure; and has as well caused harm to the country`s growing economy. As the annual 10% reduction in custom duties for EU-imports that is planned to continue until complete removal by 2019-2020 has led the global auto-manufacturer “Mercedes Benz” to divest its Egyptian operations and fly to Algeria in May, 2014. A matter that send negative signals that alternative markets are around. Such policy would drive more European manufacturers based in Egypt to fly away as well and export their productions to Egypt and reap the custom duties` benefits and guarantee higher margins through saving high overhead costs. Although the custom duties annual cuts are said to be compensated by levying more sales taxes; sales taxes increases are applied to all passenger cars imports whether its European or not. So the competitive edge remains in favor of the European ones.
2016 Customs Custom Duties Development Tax Sales Tax CBUs EU Turkey Morocco Other Regions Across the Board Across the Board
Below 1.6Lt. 16% 16%
0%
40% 3% 15%
Above/Equal 1.6Lt. 54% 54% 135% 5% 30%
Above 2.0Lt. 54% 54% 135% 8.50% 45%
CKD Kits
Below 1.6Lt.
5-7%
3% 15%
Above/Equal 1.6Lt. 5% 30%
Above 2.0Lt. 8.50%
After considering all previously discussed aspects; it’s now more clear to formulate what we believe to be the upcoming path.
In 2015, a y-o-y drop of 6.6% is anticipated; driven from Egypt`s PCs 11-months sales performance. During 2016, we believe that Egypt`s FX-reserves will be slightly enhanced over 2015. In other words, as demand already exceed supply and will always exceed supply over the upcoming years due to low motorization rates; we believe that 2016`s 3% increase in PCs sales volume is the net effect of FX-reserves (availability) enhancement versus our overview for the EGP devaluation. In 2017, the cumulative effect of the expected reserves pick-up, enhancement in individual welfare and growing purchasing needs are believed to absorb the EGP devaluation in time of a growing population at high net rates closer to those of sales volume increase. In 2018, “last year of devaluation in our forecast” we believe that prices will become too expensive for individuals; hence, softening demand when supply is at high capacity. 2019, will be the new base to count on. A year in which we expect the EGP to start strengthening against the USD and EUR hence signaling incentivizing consumers appetite.
Egypt's Total PC Market 2014 2015E 2016E 2017E 2018E 2019E 2020E Population [in mn] 85.84 88.07 90.45 92.71 95.12 97.60 100.13
Change 2.4% 2.6% 2.7% 2.5% 2.6% 2.6% 2.6% PC Unit Sales - Absolute 207,973 194,313 200,142 210,150 203,845 224,230 235,441
Change 55.5% -6.6% 3.0% 5.0% -3.0% 10.0% 5.0% Egypt PC Fleet 4,100,000 4,274,882 4,455,010 4,644,145 4,827,605 5,029,412 5,241,309
Motorization Rate (PCs/1000 citizen) 47.76 48.54 49.25 50.09 50.75 51.53 52.34
Total Car Sales 2008 2009 2010 2011 2012 2013 2014 2015E Total 198,800 158,926 192,848 133,165 144,123 133,760 207,973 194,313 CBU 121,237 98,677 116,436 80,093 90,648 78,984 118,496 122,864
CBU Contribution 60.98% 62.09% 60.38% 60.15% 62.90% 59.05% 56.98% 63.23% CKD 77,563 60,249 76,412 53,072 53,475 54,776 89,477 71,451
CKD Contribution 39.02% 37.91% 39.62% 39.85% 37.10% 40.95% 43.02% 36.77% GB Auto Market Share 25.31% 26.06% 28.03% 32.39% 28.74% 30.55% 30.03% 27.68%

11
PRIME INVESTMENT RESEARCH GB AUTO INITIATION OF COVERAGE
JANUARY, 2016
ii- A New Comprehensive Strategy … Seems to be Real
On December 8, 2015, the 2nd
automotive summit was launched to tackle several crucial issues subjecting the industry to threats, and hindering growth. We believe the summit this year was organized to find cures for the deteriorating operating industry dynamics. The summit main theme this year was setting a new comprehensive strategy to save the industry from collapsing. As Egypt`s industry is facing severe challenges ranging from FX insufficient supplies to unequal custom duties levied due to Free Trade Agreements that adversely impact competition.
Egypt main industry obstacle is the absence of a clear strategy. We believe, the government will step in and set a new strategy in cooperation with market players. As red flags have been raised in a nation that used to be the leading automotive production and export hub in North Africa. We believe the new strategy to be announced over 2016-2017 must carry incentives to global investors and existing market players to retain Egypt`s position. And shift back Egypt`s automotive industry to the manufacturing zone instead of being focused on assembly-based operations. As well as, setting equality between custom duties for Free-Trade-Agreements involved countries and their counterparts. Maybe, through adjusting taxes to compensate for custom duties differentials. Such conditions of a non-incentivized industry led global recognized producers wishing to rebase in Africa to look for other growing markets in which the industry conditions are better. As younger aged industries established in South Africa, Morocco and Turkey outran the Egyptian industry due to providing better investment incentives, equipped free zones, with ready-to-move in production facilities.
In 2H2015, Ministry of Finance along with the Ministry of Industry and Trade presented an Automotive-industry Strategy to the cabinet for consideration and approval. The draft included raising local components in locally assembled vehicles from 45% to around 55% over the upcoming 15-years instead of the previously mandated 60% years. Such stipulation was included to ensure the enhancement in automotive feeding industries in return for sales taxes exemptions in accordance with manufacturers’ ability on increasing local components ratios included. The draft also came with announced customs and sales taxes system amendments that were not disclosed. However, we believe that customs on 1.6Lt engine capacity non-FTA-related passenger cars will drop to as much as 10% versus the current 40% to narrow the gap with FTA-related customs of currently being the area of 16% and planned to reach 0% by 2019-2020. We believe that current sales taxes until Value-Added-Tax is applied will not be fixed anymore on locally produced or assembled vehicles; however, it would be measured in relation to local component contribution in the production-assembly process. We believe such aspect would revive the industry to a great extent, as global producers will seek to relocate their production plants in Egypt to benefit from lower taxes on domestic productions versus those completely built-up units exported to Egypt.
Still, the industry lacks infrastructure, utilities and services investments. During the 2nd
automotive summit; discussion took place about launching an automotive industrial city. We believe that such move must materialize and that it is a crucial matter to be applied over the upcoming short term horizon. We have been monitoring the government serious steps towards attracting more foreign direct investments to Egypt, through establishing new free industrial zones. We believe, that a new automotive city must be included in such plans, especially with moves to turning the new Suez canal developmental corridor into the world`s most equipped trading center. The hypothesized city must include ready-to-move-in production facilities which might burden the government`s spending at the beginning but will pay-off later. In addition to, supplying such city with all infrastructure and utilities needed. And make room for not only production bases but for a state-of-the-art city including retail showrooms and after-sale service centers. If such matter materialized Egypt will be replicating what Turkey, South Africa and Morocco did to absorb new investments through providing investors with high privileges and incentive of +40% on investments; however, Egypt will then excel in competition backed-by its strategic location and anticipated new world trading and logistic center to be based in new Suez canal developmental corridor.
We believe, giants like “GB Auto” will be more than willing to contribute and participate heavily. We believe GB Auto would target to further enhance its integration through penetrating further manufacturing areas; once, the formation of the authority to be in charge for the economic zone within the axis take place in addition to the release of the new strategy to be applied. If such industry investments came to reality, we would be seeing around 70% of domestic demand supplied by local production “as per Raouf Ghabbour” driven by new brands launching operations in Egypt in addition to local players expanding.

12
PRIME INVESTMENT RESEARCH GB AUTO INITIATION OF COVERAGE
JANUARY, 2016
SOURCE: GB AUTO
GB AUTO SALES` VOLUMES & BLENDED PRICES(IN EGP)
SOURCE: GB AUTO
iii- GB Auto Egypt Passenger Cars Analysis & Forecast
Historically, GB Auto was able to grow from year to year:
Thanks for being a leading passenger car importer, assembler and distributor in the Middle East and North Africa. As GB group is the largest market player in terms of sales revenue, market share and production capacity. GB Auto was able to historically outperform the market trend due to being the sole representative of Hyundai, Mazda and Geely passenger cars in Egypt. The company also owns the biggest distribution and after sales service networks, which guaranteed consumers retention and satisfaction.
GB Auto markets a variety of products with a wide range of sizes, prices and engine capacities; ranges from 1.1Lt. Engine capacity cars to SUVs of 3.5Lt. Hence, enlarging its client base from different income classes targeting to own performing vehicles characterized by spare parts and continuous service availability. The past several years have seen GB Auto invest in expanding its assembly capacity to prepare for real demand to become realistic. The company increased its Prima plant capacity where it assembles Hyundai and Geely PCs.
Analysis & Assumptions
a- Hyundai
GB Auto revenues from Hyundai sales grew over the past years from 2010 to 2014 at a GAGR of 7.4%; although during such period the political unrest was heavy. The company`s after sale services and spare parts sales on average provided revenues of around 6.9% of Hyundai PC sales; but at higher margins.
GB Auto used to locally assemble the Verna 1.6Lt and the Sonata; however, in recent years the company CKD market share was solely obtained from Verna 1.6Lt sales. As GB Auto was able to conclude a deal with Hyundai to regain the assembling activities for the Verna 1.6Lt. The Verna assembly license is due the end of 2016; however, we expect a license renewal for the company`s and Egypt`s bestselling car. Due to its domestic popularity and high demand for such vehicle based on its strong engine capacity, good pricing and spare parts and maintenance availability
Hyundai - Historical Analysis 2010 2011 2012 2013 2014 CAGR
CKD 22,439.0 17,749.0 21,292.0 19,403.0 24,185.0 1.9% Market Share 11.6% 13.3% 14.8% 14.5% 11.6%
CBU 30,967.0 24,877.0 20,148.0 11,407.0 21,229.0 -9.0%
Market Share 16.1% 18.7% 14.0% 8.5% 10.2%
PC Sales Revenues - in EGP mn 3,506.3 3,315.3 3,153.9 2,741.6 4,667.1 7.4% GPM 12.4% 11.1% 11.2% 12.2% 11.8%
Services & Parts Revenues - in EGP mn 192.1 185.5 218.2 264.5 314.6 13.1%
GPM 40.8% 31.8% 33.5% 36.5% 31.0%
Total Market Share 27.7% 32.0% 28.7% 23.0% 21.8%
Total Revenues - in EGP mn 3,698.34 3,500.79 3,372.09 3,006.05 4,981.65 7.7%
Hyundai - Cumulative GPM 13.9% 12.2% 12.6% 14.3% 13.0%
22,439 17,749 21,292
28,764
39,135
31,613
25,382 20,158 12,104
23,321
66,538
78,135 76,112
84,091
94,653
-
10,000
20,000
30,000
40,000
50,000
60,000
70,000
80,000
90,000
100,000
-
10,000
20,000
30,000
40,000
50,000
60,000
70,000
2010 2011 2012 2013 2014
CKD CBU Blended Av. Price (RHS)
13
PRIME INVESTMENT RESEARCH GB AUTO INITIATION OF COVERAGE
JANUARY, 2016
SOURCE: PRIME ESTIMATES
SOURCE: GB AUTO
SOURCE: PRIME ESTIMATES
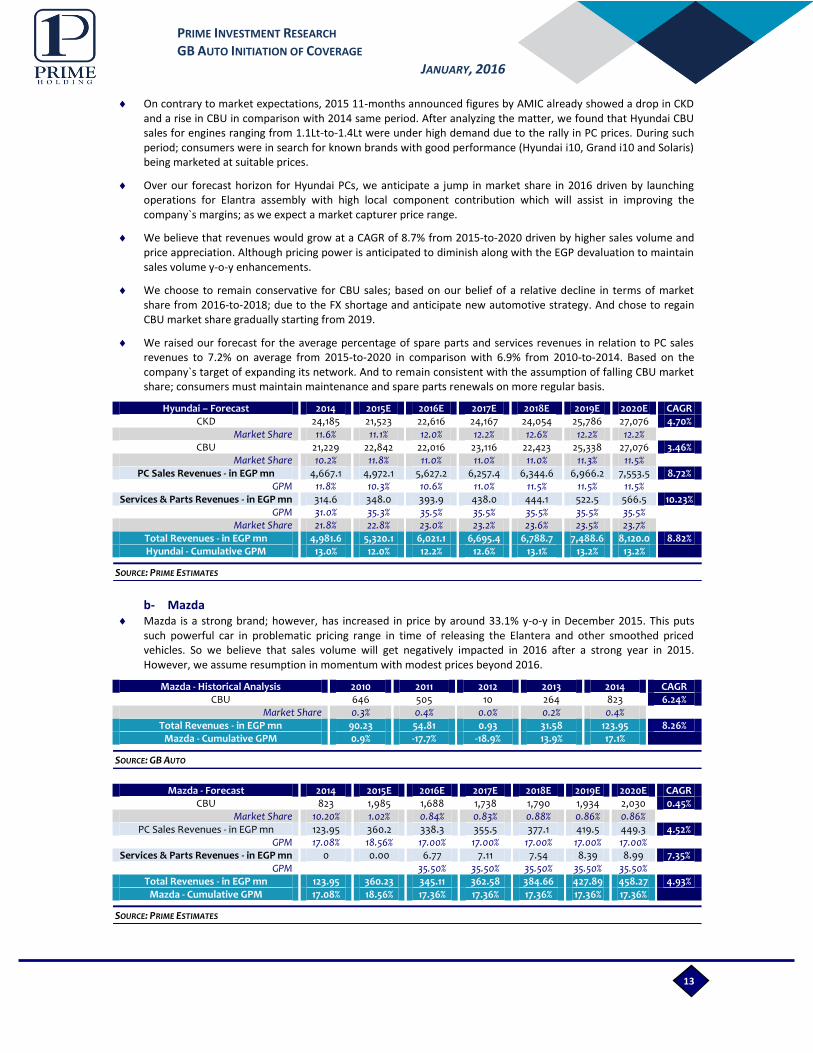
On contrary to market expectations, 2015 11-months announced figures by AMIC already showed a drop in CKD and a rise in CBU in comparison with 2014 same period. After analyzing the matter, we found that Hyundai CBU sales for engines ranging from 1.1Lt-to-1.4Lt were under high demand due to the rally in PC prices. During such period; consumers were in search for known brands with good performance (Hyundai i10, Grand i10 and Solaris) being marketed at suitable prices.
Over our forecast horizon for Hyundai PCs, we anticipate a jump in market share in 2016 driven by launching operations for Elantra assembly with high local component contribution which will assist in improving the company`s margins; as we expect a market capturer price range.
We believe that revenues would grow at a CAGR of 8.7% from 2015-to-2020 driven by higher sales volume and price appreciation. Although pricing power is anticipated to diminish along with the EGP devaluation to maintain sales volume y-o-y enhancements.
We choose to remain conservative for CBU sales; based on our belief of a relative decline in terms of market share from 2016-to-2018; due to the FX shortage and anticipate new automotive strategy. And chose to regain CBU market share gradually starting from 2019.
We raised our forecast for the average percentage of spare parts and services revenues in relation to PC sales revenues to 7.2% on average from 2015-to-2020 in comparison with 6.9% from 2010-to-2014. Based on the company`s target of expanding its network. And to remain consistent with the assumption of falling CBU market share; consumers must maintain maintenance and spare parts renewals on more regular basis.
Hyundai – Forecast 2014 2015E 2016E 2017E 2018E 2019E 2020E CAGR CKD 24,185 21,523 22,616 24,167 24,054 25,786 27,076 4.70%
Market Share 11.6% 11.1% 12.0% 12.2% 12.6% 12.2% 12.2% CBU 21,229 22,842 22,016 23,116 22,423 25,338 27,076 3.46%
Market Share 10.2% 11.8% 11.0% 11.0% 11.0% 11.3% 11.5% PC Sales Revenues - in EGP mn 4,667.1 4,972.1 5,627.2 6,257.4 6,344.6 6,966.2 7,553.5 8.72%
GPM 11.8% 10.3% 10.6% 11.0% 11.5% 11.5% 11.5% Services & Parts Revenues - in EGP mn 314.6 348.0 393.9 438.0 444.1 522.5 566.5 10.23%
GPM 31.0% 35.3% 35.5% 35.5% 35.5% 35.5% 35.5% Market Share 21.8% 22.8% 23.0% 23.2% 23.6% 23.5% 23.7% Total Revenues - in EGP mn 4,981.6 5,320.1 6,021.1 6,695.4 6,788.7 7,488.6 8,120.0 8.82%
Hyundai - Cumulative GPM 13.0% 12.0% 12.2% 12.6% 13.1% 13.2% 13.2%
b- Mazda
Mazda is a strong brand; however, has increased in price by around 33.1% y-o-y in December 2015. This puts such powerful car in problematic pricing range in time of releasing the Elantera and other smoothed priced vehicles. So we believe that sales volume will get negatively impacted in 2016 after a strong year in 2015. However, we assume resumption in momentum with modest prices beyond 2016.
Mazda - Historical Analysis 2010 2011 2012 2013 2014 CAGR CBU 646 505 10 264 823 6.24%
Market Share 0.3% 0.4% 0.0% 0.2% 0.4% Total Revenues - in EGP mn 90.23 54.81 0.93 31.58 123.95 8.26%
Mazda - Cumulative GPM 0.9% -17.7% -18.9% 13.9% 17.1%
Mazda - Forecast 2014 2015E 2016E 2017E 2018E 2019E 2020E CAGR CBU 823 1,985 1,688 1,738 1,790 1,934 2,030 0.45%
Market Share 10.20% 1.02% 0.84% 0.83% 0.88% 0.86% 0.86% PC Sales Revenues - in EGP mn 123.95 360.2 338.3 355.5 377.1 419.5 449.3 4.52%
GPM 17.08% 18.56% 17.00% 17.00% 17.00% 17.00% 17.00% Services & Parts Revenues - in EGP mn 0 0.00 6.77 7.11 7.54 8.39 8.99 7.35%
GPM
35.50% 35.50% 35.50% 35.50% 35.50% Total Revenues - in EGP mn 123.95 360.23 345.11 362.58 384.66 427.89 458.27 4.93%
Mazda - Cumulative GPM 17.08% 18.56% 17.36% 17.36% 17.36% 17.36% 17.36%
14
PRIME INVESTMENT RESEARCH GB AUTO INITIATION OF COVERAGE
JANUARY, 2016
SOURCE: GB AUTO, PRIME ESTIMATES
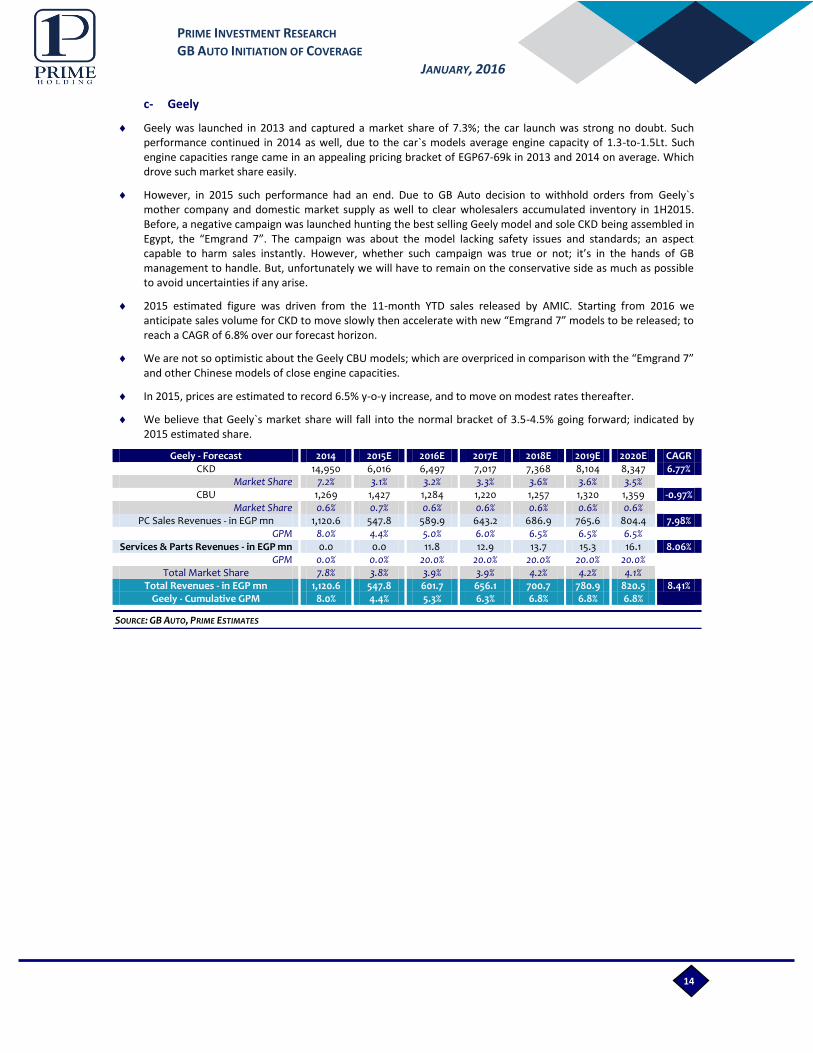
c- Geely
Geely was launched in 2013 and captured a market share of 7.3%; the car launch was strong no doubt. Such performance continued in 2014 as well, due to the car`s models average engine capacity of 1.3-to-1.5Lt. Such engine capacities range came in an appealing pricing bracket of EGP67-69k in 2013 and 2014 on average. Which drove such market share easily.
However, in 2015 such performance had an end. Due to GB Auto decision to withhold orders from Geely`s mother company and domestic market supply as well to clear wholesalers accumulated inventory in 1H2015. Before, a negative campaign was launched hunting the best selling Geely model and sole CKD being assembled in Egypt, the “Emgrand 7”. The campaign was about the model lacking safety issues and standards; an aspect capable to harm sales instantly. However, whether such campaign was true or not; it’s in the hands of GB management to handle. But, unfortunately we will have to remain on the conservative side as much as possible to avoid uncertainties if any arise.
2015 estimated figure was driven from the 11-month YTD sales released by AMIC. Starting from 2016 we anticipate sales volume for CKD to move slowly then accelerate with new “Emgrand 7” models to be released; to reach a CAGR of 6.8% over our forecast horizon.
We are not so optimistic about the Geely CBU models; which are overpriced in comparison with the “Emgrand 7” and other Chinese models of close engine capacities.
In 2015, prices are estimated to record 6.5% y-o-y increase, and to move on modest rates thereafter.
We believe that Geely`s market share will fall into the normal bracket of 3.5-4.5% going forward; indicated by 2015 estimated share.
Geely - Forecast 2014 2015E 2016E 2017E 2018E 2019E 2020E CAGR CKD 14,950 6,016 6,497 7,017 7,368 8,104 8,347 6.77%
Market Share 7.2% 3.1% 3.2% 3.3% 3.6% 3.6% 3.5%
CBU 1,269 1,427 1,284 1,220 1,257 1,320 1,359 -0.97% Market Share 0.6% 0.7% 0.6% 0.6% 0.6% 0.6% 0.6%
PC Sales Revenues - in EGP mn 1,120.6 547.8 589.9 643.2 686.9 765.6 804.4 7.98%
GPM 8.0% 4.4% 5.0% 6.0% 6.5% 6.5% 6.5%
Services & Parts Revenues - in EGP mn 0.0 0.0 11.8 12.9 13.7 15.3 16.1 8.06% GPM 0.0% 0.0% 20.0% 20.0% 20.0% 20.0% 20.0%
Total Market Share 7.8% 3.8% 3.9% 3.9% 4.2% 4.2% 4.1%
Total Revenues - in EGP mn 1,120.6 547.8 601.7 656.1 700.7 780.9 820.5 8.41%
Geely - Cumulative GPM 8.0% 4.4% 5.3% 6.3% 6.8% 6.8% 6.8%

15
PRIME INVESTMENT RESEARCH GB AUTO INITIATION OF COVERAGE
JANUARY, 2016
SOURCE: GB AUTO, PRIME ESTIMATES
SOURCE: GB AUTO, PRIME ESTIMATES
d- Cherry
GB Auto recently conducted a tripartite cooperation agreement with Aboul-Fotouh of Egypt and China`s Speranza brand “Cherry”. The deal provided GB Auto rights to plan orders, distribute and provide its after-sale services for those units assembled by Aboul-Fotouh and GB (CKD) or fully imported (CBU). Such deal adds to GB PCs portfolio a new Chinese offering at ideal prices suiting the Egyptian consumer preference; with engine capacities ranging 1.0-2.4Lt. Aboul-Fotouh was able to sell around 70k of such models since introduction in 2006; and currently operates at with capacity near 40k PC per annum that would be added to GB capacity of around 50k per annum to reach a combined one of 90k and hence benefit from economies of scale.
As earlier indicated, that we prefer being conservative rather than optimistic. Although being conservative “cherry” is a winner.
We assume operations launch to take place in early 2016 as indicated by GB management, we expect a 1% market share for GB Auto “independent from Aboul-Fotouh sales” that is anticipated to reach around 1.5% by mid-forecasted horizon and grow with the market thereafter. The reason behind our conservative initial sales volume is that Aboul-Fotouh “Speranza” sales volume did not cross the 6k pc mark in 4102 or 4105 as per AMIC.
However, GB wide network for spare parts and maintenance will for sure benefit from the deal at an average of 4.5-5% of Cherry PC revenues over our horizon.
PC sales revenues are seen growing at a CAGR of around 19.5%; driven by y-o-y enhancing sales along with a believed pricing power by GB Auto, mainly due to the market dynamics early discussed and Cherry suitability in terms of price range and engine capacity.
Cherry`s is expected to show a low GPM in 2016 due to launching and marketing and expenses and higher COGS; then starting from 2017 we anticipate a 10% GPM that will for sure come under more study.
Cherry - Forecast 2016E 2017E 2018E 2019E 2020E CAGR
CBU & CKD 2,000 2,600 2,990 3,289 3,453 14.63% Market Share 1.00% 1.24% 1.47% 1.47% 1.47%
PC Sales Revenues - in EGP mn 160.0 224.6 271.3 304.3 326.0 19.47% GPM 5.00% 10.00% 10.00% 10.00% 10.00%
Services & Parts Revenues - in EGP mn 4.80 11.23 13.56 15.22 16.30 35.74% GPM 20.00% 20.00% 20.00% 20.00% 20.00%
Total Revenues - in EGP mn 164.80 235.87 284.82 319.56 342.25 20.05% Cherry - Cumulative GPM 5.44% 10.48% 10.48% 10.48% 10.48%
e- GB Egypt PC sales portfolio
Total Egypt PC Sales 2014 2015E 2016E 2017E 2018E 2019E 2020E CAGR
Sales Volume 62,456 53,793 57,601 61,434 61,504 67,442 71,046 5.7% Change 52.8% -13.9% 7.1% 6.7% 0.1% 9.7% 5.3%
Total PC Sales Revenues - in EGP mn 5,911.7 5,880.1 6,715.5 7,480.7 7,679.9 8,455.6 9,133.1 9.2% Change 72.0% -0.5% 14.2% 11.4% 2.7% 10.1% 8.0%
Blended Av. Price 94,653 109,311 116,587 121,769 124,869 125,377 128,552 3.3% Change 12.6% 15.5% 6.7% 4.4% 2.6% 0.4% 2.5%
Total Gross Profit - in EGP mn 662.2 605.1 689.2 812.3 866.8 954.0 1,031.4 11.3% Total GPM 11.2% 10.3% 10.3% 10.9% 11.3% 11.3% 11.3%
Total Service & Parts Revenues - in EGP mn 314.6 348.1 417.3 469.2 479.0 561.4 607.9 11.8% Change 19.0% 10.6% 19.9% 12.5% 2.1% 17.2% 8.3%
Service & Parts Gross Profit - in EGP mn 97.5 122.8 145.6 162.8 165.8 194.6 210.8 11.4% GPM 31.0% 35.3% 34.9% 34.7% 34.6% 34.7% 34.7%
Total Egypt Sales Revenues - in EGP mn 6,226.2 6,228.2 7,132.7 7,949.9 8,158.8 9,017.0 9,741.0 9.4% Change 68.2% 0.0% 14.5% 11.5% 2.6% 10.5% 8.0%
Total Egypt Gross Profit - in EGP mn 759.8 727.9 834.8 975.1 1,032.6 1,148.6 1,242.1 11.3% Change 55.6% -4.2% 14.7% 16.8% 5.9% 11.2% 8.2%
Total GPM 12.2% 11.7% 11.7% 12.3% 12.7% 12.7% 12.8% 1.8%

16
PRIME INVESTMENT RESEARCH GB AUTO INITIATION OF COVERAGE
JANUARY, 2016
SOURCE: OICA, PRIME ESTIMATES
ALGERIA`S EXPECTED ANNUAL PC SALES VOLUMES AND FLEET
SOURCE: PRIME ESTIMATES
iv- GB Auto PCs MENA-Operations … Analysis & Forecast
a- Algeria
Algeria is a politically stable country to a great extent; the country`s population is estimated to come in the range of 39-40mn in 2015. Algeria`s GDP is estimated to reach USD 238bn in 2015; resulting in a GDP per Capita of around USD 5.9-6k. The country is characterized by enjoying healthy inflation rates averaging 3.2-3.4% which is anticipated to proceed over the upcoming period; coming below the anticipated average real GDP growth rate of 3.8-3.9% over our forecasted horizon. Algeria has a relatively high motorization rate that we expect to remain over the rate of 1-to-100 (PC-to-Citizens) until reaching around 140 per 1000 citizen by 2020.
GB Auto joined the Algerian market in 2013 through a 50%+ JV; hunting a share in a large market with annual sales currently in the 350k units-level. We expect the Algerian PC market to move at a CAGR of around 4.5% from 2015-to-2020, to cross the 430k PCs for the first time.
Analysis & Assumptions
In 9m2015, GB disclosed its Geely sales in Algeria for the first time. The company was able to sell 920 PC units; at an average price of EGP 57.6k. In 2015 total estimated sales, we anticipate 150 new PC units to be sold at 3Q2015 price level. Hence, taking the yearly average price slightly upward to EGP 57.9k.
We expect sales volume to become under pressure in 2016, as a result of, the severe competition and oversupply accumulation in 2015 that needs to be cleared first. Until a face lift or new better priced and more suitable models starts injection by 2017.
PC revenues are projected to grow at a CAGR of 4.12% over our forecast horizon. During such period, cumulative GPM is anticipated to diminish in comparison to 2015`s estimate. In order for GB to be able to maintain its market share in time of an increasing total market sales volume.
The devaluation in the Algerian Dinar has made EUR-tagged products from the EU more favorable due to the USD appreciation; the USD strength is anticipated to continue until 2016. Until the EUR starts showing an appreciating modest trend from 2018-to-2020.
Algeria "Geely" - Forecast 2015E 2016E 2017E 2018E 2019E 2020E CAGR
CBU 1070 984 1,004 1,044 1,086 1,129 1.09% Market Share 0.3% 0.3% 0.2% 0.3% 0.3% 0.3%
PC Sales Revenues - in EGP mn 61.9 58.7 61.6 66.0 70.7 75.8 4.12% GPM 7.0% 6.5% 6.0% 5.5% 5.5% 5.5%
Services & Parts Revenues - in EGP mn 5.7 6.0 6.3 6.8 7.3 7.8 6.27% GPM 16.7% 18.0% 15.0% 15.0% 15.0% 16.0%
Total Revenues - in EGP mn 67.6 64.7 68.0 72.8 78.0 83.5 4.31% Algeria - Cumulative GPM 7.8% 7.6% 6.8% 6.4% 6.4% 6.5%
3,946,029
4,296,197
4,681,382
5,059,014
5,455,528
5,871,868 351,046 368,598
405,458 397,508 417,383
438,252
-
1,000,000
2,000,000
3,000,000
4,000,000
5,000,000
6,000,000
7,000,000
-
50,000
100,000
150,000
200,000
250,000
300,000
350,000
400,000
450,000
500,000
2015E 2016E 2017E 2018E 2019E 2020E
PC Fleet (RHS) PC Sales Volume
17
PRIME INVESTMENT RESEARCH GB AUTO INITIATION OF COVERAGE
JANUARY, 2016
SOURCE: GB AUTO
SOURCE: PRIME ESTIMATES
b- Iraq
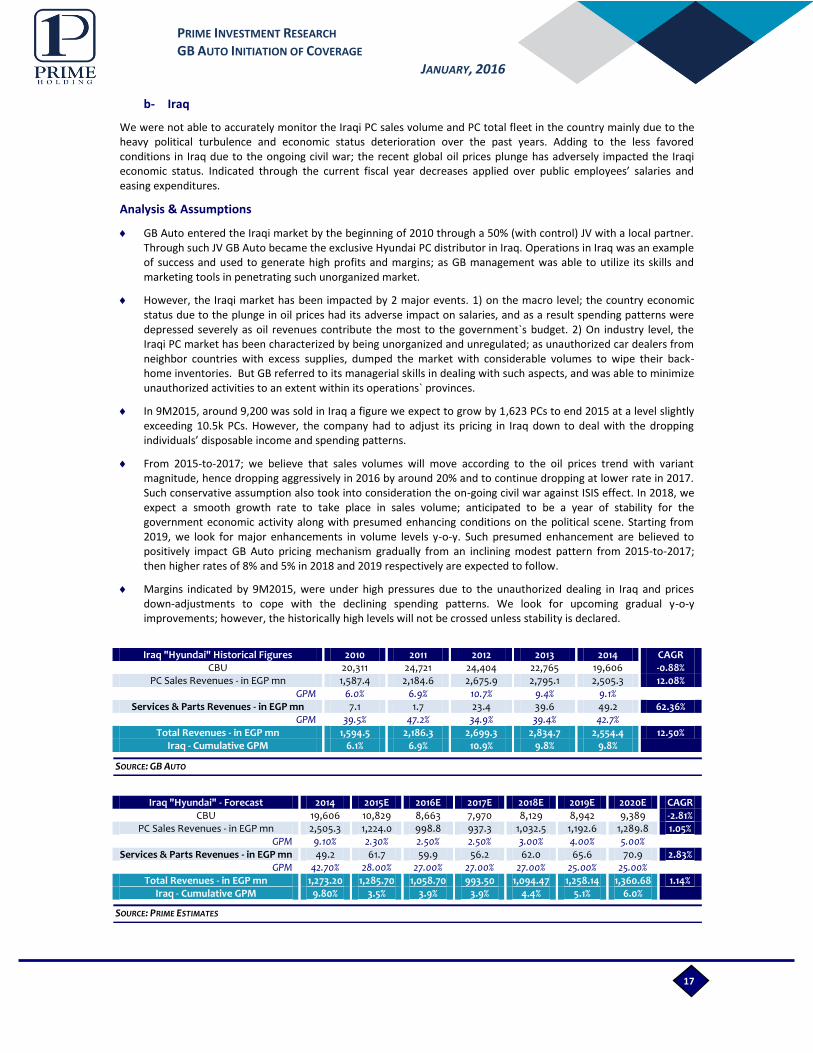
We were not able to accurately monitor the Iraqi PC sales volume and PC total fleet in the country mainly due to the heavy political turbulence and economic status deterioration over the past years. Adding to the less favored conditions in Iraq due to the ongoing civil war; the recent global oil prices plunge has adversely impacted the Iraqi economic status. Indicated through the current fiscal year decreases applied over public employees’ salaries and easing expenditures.
Analysis & Assumptions
GB Auto entered the Iraqi market by the beginning of 2010 through a 50% (with control) JV with a local partner. Through such JV GB Auto became the exclusive Hyundai PC distributor in Iraq. Operations in Iraq was an example of success and used to generate high profits and margins; as GB management was able to utilize its skills and marketing tools in penetrating such unorganized market.
However, the Iraqi market has been impacted by 2 major events. 1) on the macro level; the country economic status due to the plunge in oil prices had its adverse impact on salaries, and as a result spending patterns were depressed severely as oil revenues contribute the most to the government`s budget. 2) On industry level, the Iraqi PC market has been characterized by being unorganized and unregulated; as unauthorized car dealers from neighbor countries with excess supplies, dumped the market with considerable volumes to wipe their back-home inventories. But GB referred to its managerial skills in dealing with such aspects, and was able to minimize unauthorized activities to an extent within its operations` provinces.
In 9M2015, around 9,200 was sold in Iraq a figure we expect to grow by 1,623 PCs to end 2015 at a level slightly exceeding 10.5k PCs. However, the company had to adjust its pricing in Iraq down to deal with the dropping individuals’ disposable income and spending patterns.
From 2015-to-2017; we believe that sales volumes will move according to the oil prices trend with variant magnitude, hence dropping aggressively in 2016 by around 20% and to continue dropping at lower rate in 2017. Such conservative assumption also took into consideration the on-going civil war against ISIS effect. In 2018, we expect a smooth growth rate to take place in sales volume; anticipated to be a year of stability for the government economic activity along with presumed enhancing conditions on the political scene. Starting from 2019, we look for major enhancements in volume levels y-o-y. Such presumed enhancement are believed to positively impact GB Auto pricing mechanism gradually from an inclining modest pattern from 2015-to-2017; then higher rates of 8% and 5% in 2018 and 2019 respectively are expected to follow.
Margins indicated by 9M2015, were under high pressures due to the unauthorized dealing in Iraq and prices down-adjustments to cope with the declining spending patterns. We look for upcoming gradual y-o-y improvements; however, the historically high levels will not be crossed unless stability is declared.
Iraq "Hyundai" Historical Figures 2010 2011 2012 2013 2014 CAGR
CBU 20,311 24,721 24,404 22,765 19,606 -0.88% PC Sales Revenues - in EGP mn 1,587.4 2,184.6 2,675.9 2,795.1 2,505.3 12.08%
GPM 6.0% 6.9% 10.7% 9.4% 9.1% Services & Parts Revenues - in EGP mn 7.1 1.7 23.4 39.6 49.2 62.36%
GPM 39.5% 47.2% 34.9% 39.4% 42.7% Total Revenues - in EGP mn 1,594.5 2,186.3 2,699.3 2,834.7 2,554.4 12.50%
Iraq - Cumulative GPM 6.1% 6.9% 10.9% 9.8% 9.8%
Iraq "Hyundai" - Forecast 2014 2015E 2016E 2017E 2018E 2019E 2020E CAGR CBU 19,606 10,829 8,663 7,970 8,129 8,942 9,389 -2.81%
PC Sales Revenues - in EGP mn 2,505.3 1,224.0 998.8 937.3 1,032.5 1,192.6 1,289.8 1.05% GPM 9.10% 2.30% 2.50% 2.50% 3.00% 4.00% 5.00%
Services & Parts Revenues - in EGP mn 49.2 61.7 59.9 56.2 62.0 65.6 70.9 2.83% GPM 42.70% 28.00% 27.00% 27.00% 27.00% 25.00% 25.00%
Total Revenues - in EGP mn 1,273.20 1,285.70 1,058.70 993.50 1,094.47 1,258.14 1,360.68 1.14% Iraq - Cumulative GPM 9.80% 3.5% 3.9% 3.9% 4.4% 5.1% 6.0%
18
PRIME INVESTMENT RESEARCH GB AUTO INITIATION OF COVERAGE
JANUARY, 2016
SOURCE: GB AUTO, PRIME ESTIMATES
SOURCE: GB AUTO, PRIME ESTIMATES
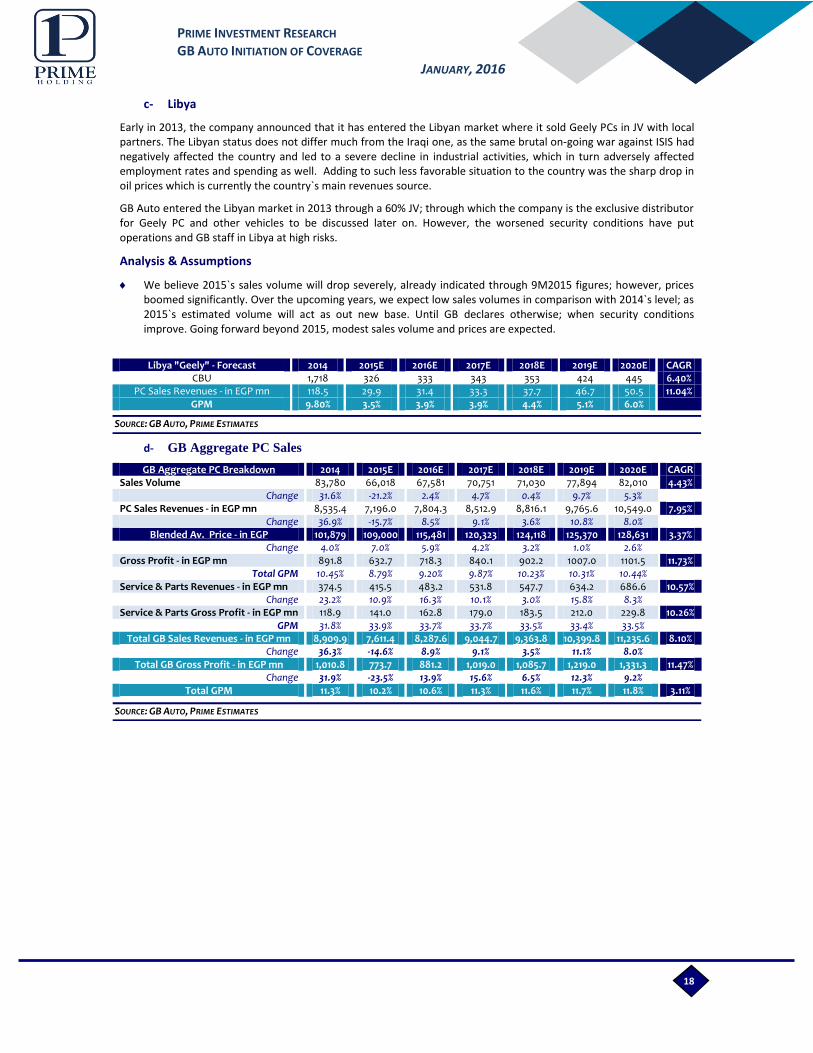
c- Libya
Early in 2013, the company announced that it has entered the Libyan market where it sold Geely PCs in JV with local partners. The Libyan status does not differ much from the Iraqi one, as the same brutal on-going war against ISIS had negatively affected the country and led to a severe decline in industrial activities, which in turn adversely affected employment rates and spending as well. Adding to such less favorable situation to the country was the sharp drop in oil prices which is currently the country`s main revenues source.
GB Auto entered the Libyan market in 2013 through a 60% JV; through which the company is the exclusive distributor for Geely PC and other vehicles to be discussed later on. However, the worsened security conditions have put operations and GB staff in Libya at high risks.
Analysis & Assumptions
We believe 2015`s sales volume will drop severely, already indicated through 9M2015 figures; however, prices boomed significantly. Over the upcoming years, we expect low sales volumes in comparison with 2014`s level; as 2015`s estimated volume will act as out new base. Until GB declares otherwise; when security conditions improve. Going forward beyond 2015, modest sales volume and prices are expected.
Libya "Geely" - Forecast 2014 2015E 2016E 2017E 2018E 2019E 2020E CAGR
CBU 1,718 326 333 343 353 424 445 6.40% PC Sales Revenues - in EGP mn 118.5 29.9 31.4 33.3 37.7 46.7 50.5 11.04%
GPM 9.80% 3.5% 3.9% 3.9% 4.4% 5.1% 6.0%
d- GB Aggregate PC Sales
GB Aggregate PC Breakdown 2014 2015E 2016E 2017E 2018E 2019E 2020E CAGR Sales Volume 83,780 66,018 67,581 70,751 71,030 77,894 82,010 4.43%
Change 31.6% -21.2% 2.4% 4.7% 0.4% 9.7% 5.3% PC Sales Revenues - in EGP mn 8,535.4 7,196.0 7,804.3 8,512.9 8,816.1 9,765.6 10,549.0 7.95%
Change 36.9% -15.7% 8.5% 9.1% 3.6% 10.8% 8.0% Blended Av. Price - in EGP 101,879 109,000 115,481 120,323 124,118 125,370 128,631 3.37%
Change 4.0% 7.0% 5.9% 4.2% 3.2% 1.0% 2.6% Gross Profit - in EGP mn 891.8 632.7 718.3 840.1 902.2 1007.0 1101.5 11.73%
Total GPM 10.45% 8.79% 9.20% 9.87% 10.23% 10.31% 10.44% Service & Parts Revenues - in EGP mn 374.5 415.5 483.2 531.8 547.7 634.2 686.6 10.57%
Change 23.2% 10.9% 16.3% 10.1% 3.0% 15.8% 8.3% Service & Parts Gross Profit - in EGP mn 118.9 141.0 162.8 179.0 183.5 212.0 229.8 10.26%
GPM 31.8% 33.9% 33.7% 33.7% 33.5% 33.4% 33.5% Total GB Sales Revenues - in EGP mn 8,909.9 7,611.4 8,287.6 9,044.7 9,363.8 10,399.8 11,235.6 8.10%
Change 36.3% -14.6% 8.9% 9.1% 3.5% 11.1% 8.0% Total GB Gross Profit - in EGP mn 1,010.8 773.7 881.2 1,019.0 1,085.7 1,219.0 1,331.3 11.47%
Change 31.9% -23.5% 13.9% 15.6% 6.5% 12.3% 9.2% Total GPM 11.3% 10.2% 10.6% 11.3% 11.6% 11.7% 11.8% 3.11%

19
PRIME INVESTMENT RESEARCH GB AUTO INITIATION OF COVERAGE
JANUARY, 2016
SOURCE: MOP, PRIME ESTIMATES
EGYPT`S GDP INFLUENTIAL SEGMENTS
SOURCE: AMIC, PRIME ESTIMATES
EGYPT`S TRUCKS QUARTER MARKET ACTIVITY
2- Commercial Vehicles & Construction Equipment
i- EGYPT`S CV & CE ARE HIGHLY CORRELATES WITH ECONOMIC ACTIVITY
The CV and CE business demand is generated from the most influential GDP segments mainly construction and building, manufacturing, real estate and agriculture activities. Hence, we expect high growth rates over such sectors driven by executing the numerous projects early presented by the government at March, Economic Conference over the upcoming 5-6 years. In addition to, the government`s plan to provide mass residential offers for low and medium income classes other than those provided by real estate developers. We expect Construction and Building to record one of the highest growth rates, projected to grow at a CAGR of 16.9% over the forecasted horizon. Followed by Real Estate spending (Incl. Public & Private spending) anticipated to grow at a CAGR of 14.4% from FY2014/15 to FY2019/2020. While agriculture and manufacturing sectors are anticipated to record less aggressive movements of 8.3% and 9.7% respectively. The reason behind believing in such high rates is Egypt`s huge projects pipeline that exceeds as per our finding USD 108.52bn divided over several sub-sectors coming under residential and non-residential projects, power and water projects and transportation and utilities.
Truck sales volumes in Egypt, recorded its historical high level on annual basis in 2014 jumping up by around 41.3% y-o-y, while the highest volumes on quarter basis was those conducted from 1Q2014-to-1Q2015. Driven by the huge dredging and construction activity that took place during the Suez Canal expansions. In addition, to the high sentiments for investments. In 2015, we expect the total volume will come around 50.2k of truck sales dropping by 7% y-o-y. Mainly due to fleets’ replenishment over 1Q2014-to-1Q2015, in addition to the FX shortage dilemma that hit such segment as well. Going forward we believe such business line to boom after access to FX sources become; and projects pipeline execution materialize on faster than current rates.
-
200.0
400.0
600.0
800.0
1,000.0
1,200.0
FY2014/15 FY2015/16 FY2016/17 FY2017/18 FY2018/19 FY2019/2020
Agriculture, Irrigation & Fishing Manufacturing [Excl. Refining]
Construction & Building Real Estate
7834 7181
8578
10156
12259 11826
9930 10828
7887 8493
7719
9347 9518 9918 10130 9,740
6,196
7,799 8,155 7,813 8,435 8,923 9,200 9,558
10,313 9,478
7,649
10846
12934 14000
13041 14113
14800
11439 11473 12577
0
2000
4000
6000
8000
10000
12000
14000
16000
Q1
200
7
Q2
200
7
Q3
200
7
Q4
20
07
Q1
200
8
Q2
200
8
Q3
200
8
Q4
20
08
Q1
200
9
Q2
200
9
Q3
200
9
Q4
20
09
Q1
2010
Q2
2010
Q3
2010
Q4
20
10
Q1
2011
Q2
2011
Q3
2011
Q4
20
11
Q1
2012
Q2
2012
Q3
2012
Q4
20
12
Q1
2013
Q2
2013
Q3
2013
Q4
20
13
Q1
2014
Q2
2014
Q3
2014
Q4
20
14
Q1
2015
Q2
2015
Q3
2015
Q4
20
15E
20
PRIME INVESTMENT RESEARCH GB AUTO INITIATION OF COVERAGE
JANUARY, 2016
SOURCE: AMIC, PRIME ESTIMATES
SOURCE: AMIC, PRIME ESTIMATES
SOURCE: AMIC, PRIME ESTIMATES
EGYPT`S BUSES QUARTER MARKET ACTIVITY
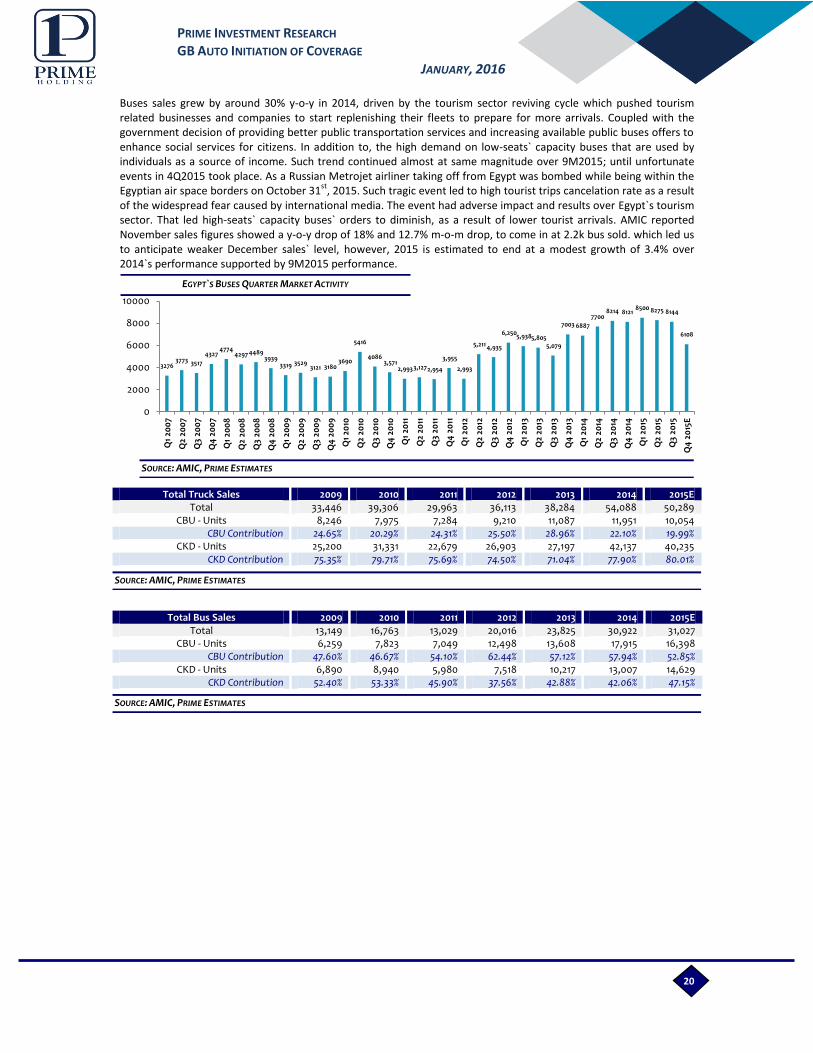
Buses sales grew by around 30% y-o-y in 2014, driven by the tourism sector reviving cycle which pushed tourism related businesses and companies to start replenishing their fleets to prepare for more arrivals. Coupled with the government decision of providing better public transportation services and increasing available public buses offers to enhance social services for citizens. In addition to, the high demand on low-seats` capacity buses that are used by individuals as a source of income. Such trend continued almost at same magnitude over 9M2015; until unfortunate events in 4Q2015 took place. As a Russian Metrojet airliner taking off from Egypt was bombed while being within the Egyptian air space borders on October 31
st, 2015. Such tragic event led to high tourist trips cancelation rate as a result
of the widespread fear caused by international media. The event had adverse impact and results over Egypt`s tourism sector. That led high-seats` capacity buses` orders to diminish, as a result of lower tourist arrivals. AMIC reported November sales figures showed a y-o-y drop of 18% and 12.7% m-o-m drop, to come in at 2.2k bus sold. which led us to anticipate weaker December sales` level, however, 2015 is estimated to end at a modest growth of 3.4% over 2014`s performance supported by 9M2015 performance.
Total Truck Sales 2009 2010 2011 2012 2013 2014 2015E Total 33,446 39,306 29,963 36,113 38,284 54,088 50,289
CBU - Units 8,246 7,975 7,284 9,210 11,087 11,951 10,054 CBU Contribution 24.65% 20.29% 24.31% 25.50% 28.96% 22.10% 19.99%
CKD - Units 25,200 31,331 22,679 26,903 27,197 42,137 40,235 CKD Contribution 75.35% 79.71% 75.69% 74.50% 71.04% 77.90% 80.01%
Total Bus Sales 2009 2010 2011 2012 2013 2014 2015E Total 13,149 16,763 13,029 20,016 23,825 30,922 31,027
CBU - Units 6,259 7,823 7,049 12,498 13,608 17,915 16,398 CBU Contribution 47.60% 46.67% 54.10% 62.44% 57.12% 57.94% 52.85%
CKD - Units 6,890 8,940 5,980 7,518 10,217 13,007 14,629 CKD Contribution 52.40% 53.33% 45.90% 37.56% 42.88% 42.06% 47.15%
3276 3773 3517
4327 4774
4297 4489 3939
3319 3529 3121 3180
3690
5416
4086 3,571
2,993 3,127 2,954
3,955
2,993
5,211 4,935
6,250 5,938 5,805
5,079
7003 6887
7700 8214 8121
8500 8275 8144
6108
0
2000
4000
6000
8000
10000
Q1
200
7
Q2
200
7
Q3
200
7
Q4
20
07
Q1
200
8
Q2
200
8
Q3
200
8
Q4
20
08
Q1
200
9
Q2
200
9
Q3
200
9
Q4
20
09
Q1
2010
Q2
2010
Q3
2010
Q4
20
10
Q1
2011
Q2
2011
Q3
2011
Q4
20
11
Q1
2012
Q2
2012
Q3
2012
Q4
20
12
Q1
2013
Q2
2013
Q3
2013
Q4
20
13
Q1
2014
Q2
2014
Q3
2014
Q4
20
14
Q1
2015
Q2
2015
Q3
2015
Q4
20
15E
21
PRIME INVESTMENT RESEARCH GB AUTO INITIATION OF COVERAGE
JANUARY, 2016
SOURCE: GB AUTO, PRIME ESTIMATES
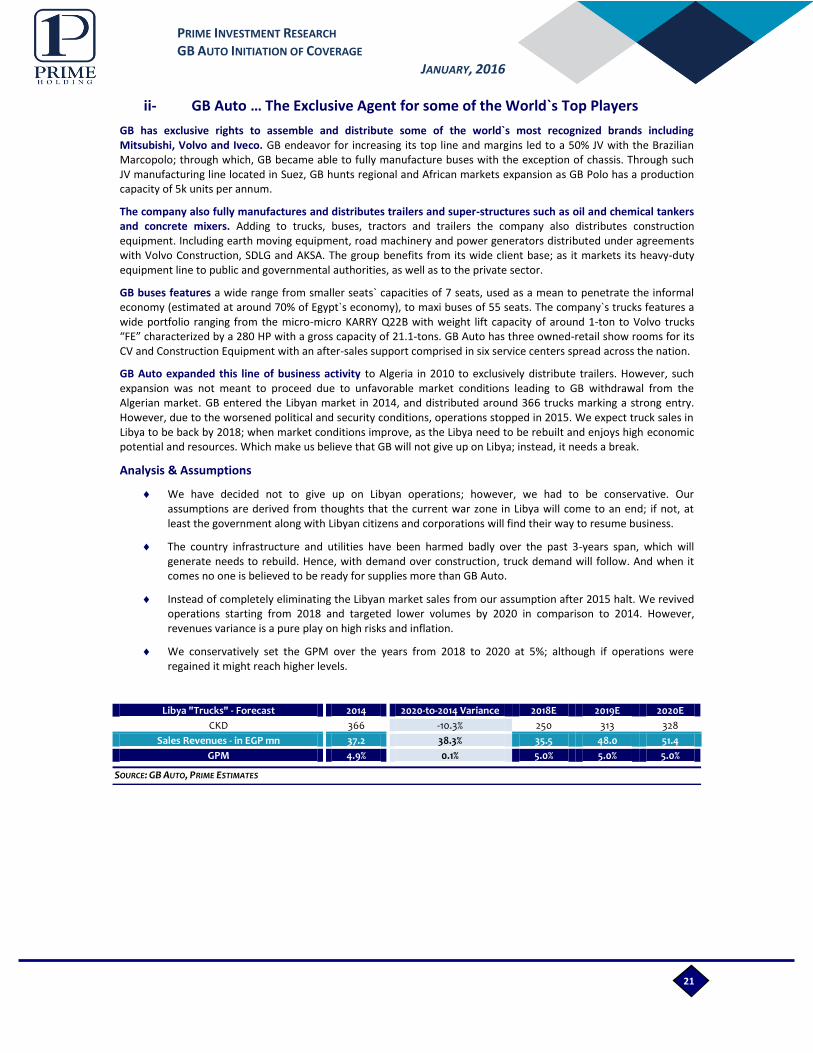
ii- GB Auto … The Exclusive Agent for some of the World`s Top Players
GB has exclusive rights to assemble and distribute some of the world`s most recognized brands including Mitsubishi, Volvo and Iveco. GB endeavor for increasing its top line and margins led to a 50% JV with the Brazilian Marcopolo; through which, GB became able to fully manufacture buses with the exception of chassis. Through such JV manufacturing line located in Suez, GB hunts regional and African markets expansion as GB Polo has a production capacity of 5k units per annum.
The company also fully manufactures and distributes trailers and super-structures such as oil and chemical tankers and concrete mixers. Adding to trucks, buses, tractors and trailers the company also distributes construction equipment. Including earth moving equipment, road machinery and power generators distributed under agreements with Volvo Construction, SDLG and AKSA. The group benefits from its wide client base; as it markets its heavy-duty equipment line to public and governmental authorities, as well as to the private sector.
GB buses features a wide range from smaller seats` capacities of 7 seats, used as a mean to penetrate the informal economy (estimated at around 70% of Egypt`s economy), to maxi buses of 55 seats. The company`s trucks features a wide portfolio ranging from the micro-micro KARRY Q22B with weight lift capacity of around 1-ton to Volvo trucks “FE” characterized by a 280 HP with a gross capacity of 21.1-tons. GB Auto has three owned-retail show rooms for its CV and Construction Equipment with an after-sales support comprised in six service centers spread across the nation.
GB Auto expanded this line of business activity to Algeria in 2010 to exclusively distribute trailers. However, such expansion was not meant to proceed due to unfavorable market conditions leading to GB withdrawal from the Algerian market. GB entered the Libyan market in 2014, and distributed around 366 trucks marking a strong entry. However, due to the worsened political and security conditions, operations stopped in 2015. We expect truck sales in Libya to be back by 2018; when market conditions improve, as the Libya need to be rebuilt and enjoys high economic potential and resources. Which make us believe that GB will not give up on Libya; instead, it needs a break.
Analysis & Assumptions
We have decided not to give up on Libyan operations; however, we had to be conservative. Our assumptions are derived from thoughts that the current war zone in Libya will come to an end; if not, at least the government along with Libyan citizens and corporations will find their way to resume business.
The country infrastructure and utilities have been harmed badly over the past 3-years span, which will generate needs to rebuild. Hence, with demand over construction, truck demand will follow. And when it comes no one is believed to be ready for supplies more than GB Auto.
Instead of completely eliminating the Libyan market sales from our assumption after 2015 halt. We revived operations starting from 2018 and targeted lower volumes by 2020 in comparison to 2014. However, revenues variance is a pure play on high risks and inflation.
We conservatively set the GPM over the years from 2018 to 2020 at 5%; although if operations were regained it might reach higher levels.
Libya "Trucks" - Forecast 2014 2020-to-2014 Variance 2018E 2019E 2020E
CKD 366 -10.3% 250 313 328
Sales Revenues - in EGP mn 37.2 38.3% 35.5 48.0 51.4
GPM 4.9% 0.1% 5.0% 5.0% 5.0%

22
PRIME INVESTMENT RESEARCH GB AUTO INITIATION OF COVERAGE
JANUARY, 2016
SOURCE: GB AUTO, PRIME ESTIMATES
Buses
So, let’s first go through buses sales; in 2015, we expect an increase in sales volume driven by the government project to upgrade its public service buses used for transportation and other purposes. However, during 2015 the sales mix changed in favor of the highest seats capacity buses which is estimated at around EGP 1mn/bus (300 delivered in 1Q2015 and another contract for around 150-bus was closed for delivery in 3Q2015). Hence, driving the blended average price/CV y-o-y to an impressive double digit growth rate.
In 2016, we expect a drop in volumes after fulfilling governmental and other private sector orders. And hence, drop in demand for high-capacity buses taking the blended average price back down.
Starting from 2018, we expect a double digit jump in volume in consistency with our assumption for a reviving tourism activity, which is assumed to raise orders for fleets’ renewals.
Trucks
Trucks cumulative volume is anticipated to drop in 2015 driven from; 1) halting Libyan operations and 2) fleets upgrading and additions that took place in 2014 by the public and private sector to implement the Suez canal expansion project and other real estate and construction sectors projects.
Demand is expected to gently decline in 2016, before a double digit jump in 2017 driven by anticipated huge pipeline of early announced real estate and construction projects “EEDC, March 4105” and by other real estate developers. In addition to, the high activity announced to launch Suez Canal developmental corridor.
Trailers
Volumes are seen growing along with that of trucks and tractors; however, jumps take place only relative to 2014`s low base.
Tractors
Tractors expected volume upward-movements are purely related to the huge reclamation project recently announced by Egypt`s president. As the project necessitate the urgent and accelerated launch of operations for field irrigation development in Delta and Nile Valley. The project was prepared by the Ministry of Agriculture to reclaim 1.5mn acres as phase-1 of a national project for land reclamation targeting 4mn acres.
Commercial Equipment
Earth moving equipment, road machinery, power generators and other industrial and agricultural related tools are expected to move in correlation with the rising economic activity and for preparation of the mega projects announced especially that 4mn acres reclamation.
The new 7-seater “Karry”
In 2015, GB Auto added an assembly line to its commercial vehicles business; namely “Karry” the new 7-seater comes at attractive pricing range, estimated at EGP58.9k/unit in 2015.
In 9M2015, GB sold 534 units equivalent to around 60 units/month. Over 4Q2015, we set our assumptions for monthly sales at around 30-35% on average over the 60 units/month. In 2015, Karry`s GPM is anticipated to come at (-2.8%) driven from launching and marketing expenses.
However, going forward we look for higher margins; that will for sure be revised once 4Q2015 and 1Q2016 are released to be able to monitor pure performance trends. However, at the current time a CAGR of 13.1% for revenues is projected from 2015-to-2020.
karry - Forecast 2015E 2016E 2017E 2018E 2019E 2020E CAGR CKD 783 940 1,081 1,167 1,225 1,250 9.80%
Sales Revenues - in EGP mn 46.2 58.2 68.9 76.6 82.1 85.4 13.09% GPM -2.8% 5.0% 7.0% 8.0% 8.0% 8.0%
Services & Parts Revenues - in EGP mn 0.0 1.7 2.1 2.3 2.5 2.6 GPM
15.0% 15.0% 15.0% 15.0% 15.0%
Total Revenues - in EGP mn 46.2 59.9 71.0 78.9 84.5 87.9 13.76% Karry - Cumulative GPM -2.8% 4.9% 6.8% 7.8% 7.8% 7.8%
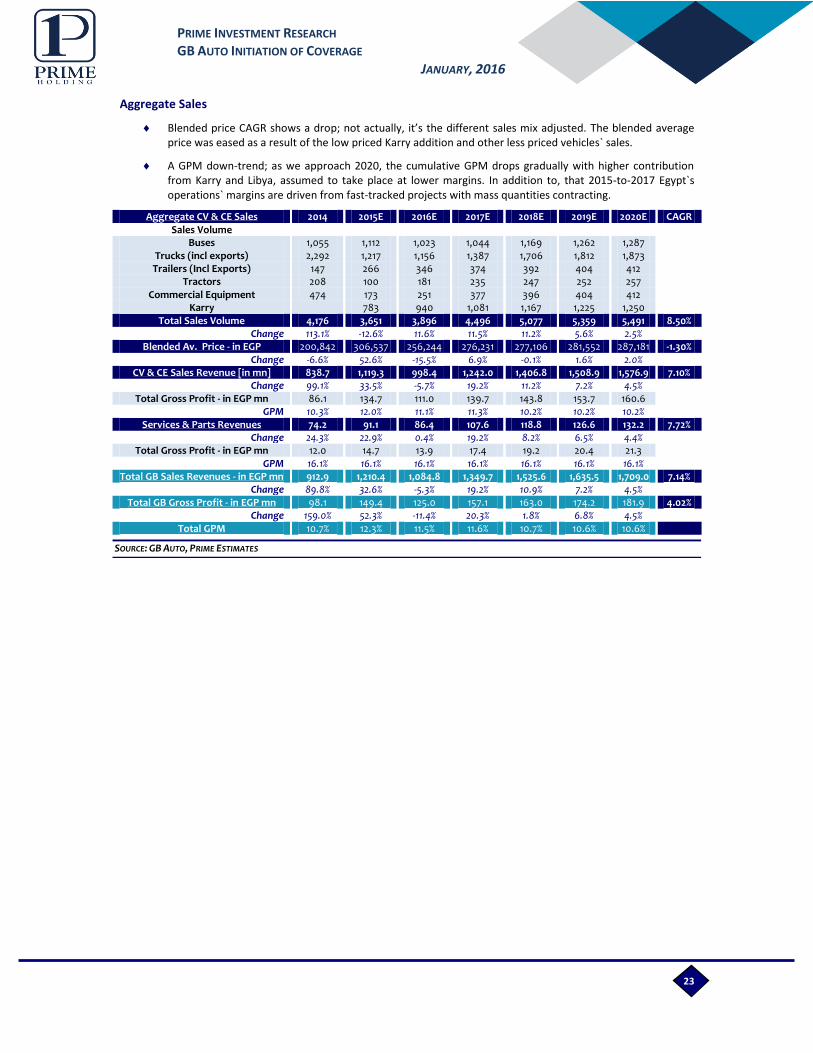
23
PRIME INVESTMENT RESEARCH GB AUTO INITIATION OF COVERAGE
JANUARY, 2016
SOURCE: GB AUTO, PRIME ESTIMATES
Aggregate Sales
Blended price CAGR shows a drop; not actually, it’s the different sales mix adjusted. The blended average price was eased as a result of the low priced Karry addition and other less priced vehicles` sales.
A GPM down-trend; as we approach 2020, the cumulative GPM drops gradually with higher contribution from Karry and Libya, assumed to take place at lower margins. In addition to, that 2015-to-2017 Egypt`s operations` margins are driven from fast-tracked projects with mass quantities contracting.
Aggregate CV & CE Sales 2014 2015E 2016E 2017E 2018E 2019E 2020E CAGR Sales Volume
Buses 1,055 1,112 1,023 1,044 1,169 1,262 1,287 Trucks (incl exports) 2,292 1,217 1,156 1,387 1,706 1,812 1,873 Trailers (Incl Exports) 147 266 346 374 392 404 412 Tractors 208 100 181 235 247 252 257 Commercial Equipment 474 173 251 377 396 404 412 Karry
783 940 1,081 1,167 1,225 1,250
Total Sales Volume 4,176 3,651 3,896 4,496 5,077 5,359 5,491 8.50% Change 113.1% -12.6% 11.6% 11.5% 11.2% 5.6% 2.5%
Blended Av. Price - in EGP 200,842 306,537 256,244 276,231 277,106 281,552 287,181 -1.30% Change -6.6% 52.6% -15.5% 6.9% -0.1% 1.6% 2.0%
CV & CE Sales Revenue [in mn] 838.7 1,119.3 998.4 1,242.0 1,406.8 1,508.9 1,576.9 7.10% Change 99.1% 33.5% -5.7% 19.2% 11.2% 7.2% 4.5%
Total Gross Profit - in EGP mn 86.1 134.7 111.0 139.7 143.8 153.7 160.6 GPM 10.3% 12.0% 11.1% 11.3% 10.2% 10.2% 10.2% Services & Parts Revenues 74.2 91.1 86.4 107.6 118.8 126.6 132.2 7.72%
Change 24.3% 22.9% 0.4% 19.2% 8.2% 6.5% 4.4% Total Gross Profit - in EGP mn 12.0 14.7 13.9 17.4 19.2 20.4 21.3 GPM 16.1% 16.1% 16.1% 16.1% 16.1% 16.1% 16.1% Total GB Sales Revenues - in EGP mn 912.9 1,210.4 1,084.8 1,349.7 1,525.6 1,635.5 1,709.0 7.14%
Change 89.8% 32.6% -5.3% 19.2% 10.9% 7.2% 4.5% Total GB Gross Profit - in EGP mn 98.1 149.4 125.0 157.1 163.0 174.2 181.9 4.02%
Change 159.0% 52.3% -11.4% 20.3% 1.8% 6.8% 4.5% Total GPM 10.7% 12.3% 11.5% 11.6% 10.7% 10.6% 10.6%
24
PRIME INVESTMENT RESEARCH GB AUTO INITIATION OF COVERAGE
JANUARY, 2016
3) Motorcycles & Three-Wheelers
GB Auto got the exclusive rights to distribute Bajaj three-wheelers and motorcycles in Egypt. The Indian Bajaj is the world`s largest known manufacturer of three-wheelers, often known as auto-rickshaws or “tuk-tuks”. GB Auto imports Semi Knocked-Down (SKD) units and assembles the vehicles locally at the company’s 6
th of October City
Industrial Zone factory. GB is Egypt`s market leader for such vehicles with around 40% market share, due to vehicles quality and GB`s Available after-sales service. GB also supports two &three wheelers sales through its financing venture “Mashroey” which we will discuss later, available in almost all the vehicles 21 company-owned retail showrooms. GB has also contracted third-parties for the sake of growing such business line, as the company is currently believed to have 50+ authorized service centers providers across Egypt and around 100+ authorized dealers.
GB also launched operations in Iraq in 1Q2015; however, figures are not estimated nor accounted for in our valuation as the company did not disclose operations or present sales` figures yet. But according to the company`s management, “Units sales to date are promising and management is optimistic about its long-term potential”. And it all makes sense due to the Iraqi economic activity plunge and destroyed infrastructure.
Motorcycles are the main transportation means for many families unable to afford passenger cars` prices and it also assist in conducting small delivery businesses. While, three-wheelers are Egypt`s informal economy exclusive vehicle and main sponsor. Such vehicles come to satisfy the country`s crucial need for lower-income class citizens to conduct small businesses, it also help in penetrating the inaccessible slums and in sometimes play ambulances roles.
However, the government does not seem to like such vehicles due to the assumption of being correlated with breaking laws and crime rate related. An aspect driving the government to take measures in 2012, of increasing customs and sales tax imposed on the three-wheelers by 30% and 5% respectively to stand at 40% customs and 15% sales tax. But after negotiations a reversal took place in customs. However, by 2013 the government increased customs again. In 2014, the government decided to escalate measures to a new strict level through banning two and three-wheelers for more than a full quarter; however, after removing such ban and proceeding activity GB Auto was able to end the year at a y-o-y 4.08% more units sold and at price appreciation of 4.5%. Now, custom duties for two and three-wheelers stand at 20%, while sales taxes stand at 10% for two-wheelers and 15% for three-wheelers.
GB Auto has raised capital for the establishment of a new mega factory with capacity of 240k per annum (120k per
each vehicle). Construction activity is set to begin in 1Q2016. The new factory will be a game changer for margins;
due to saving customs and benefiting from economies of scale. The plant is believed to be located in an industrial or
free zone; hence, receiving incentives. The project investment cost is estimated by the company at EGP 400mn; as the
plant`s capital structure is not finalized yet, we expect very minimal debt level to be raised and for major financing to
be pumped from the 2015`s EGP 960mn capital increase. We believe that Bajaj first motorized assembly line of
production outside of India, is not meant to only target Egypt, instead it will be the new gate to Africa specifically and
the MENA region in general.
Analysis & Assumptions
This business line showed incredible performance in 9M2015; as for the three-wheelers, a sky rocking change of 86.3% in sales volume was scored, while for the two-wheelers around 66.5% change took place. In our 2015, estimated figures, we believe in a blended y-o-y change of around 42%; as 9M2015 sales levels are not seen sustainable over 4Q2015 due to a more currency shortage starting September 2015, so we chose to downgrade the volume level by 10% q-o-q over each wheeler category.
We believe that volumes and prices will continue on a smooth journey up to 2017`s end, after 2015 hikes.
GB new wheelers` plant construction is supposed to begin in 1Q2016, around 18 months of construction are required for completion. However, we shift operations launch to 1Q2018 instead of 2H2017. To account for any uncertainty, or if the company is in negotiations with Egypt`s government over investment incentives or better conditions.
Starting from 2018-to-2020 the change in volumes is derived from an 80-to-90% utilization rates for three-wheelers production from the new plant. And for the two-wheelers utilization is set to move from 55% in 2018 to reach 65% in 2020.

25
PRIME INVESTMENT RESEARCH GB AUTO INITIATION OF COVERAGE
JANUARY, 2016
SOURCE: GB AUTO, PRIME ESTIMATES
In 2018, we expect a modest price drop to be used as an introductory marketing technique, while a jump in margins is certain that will lead to higher profits; the GPM jump will be equivalent to a 36.5% y-o-y increase in gross profit. From 2019-to-2020 low rates are applied over the pricing path.
Although Bajaj branded vehicles are known for better safety and quality measure in comparison to their Chinese rivals selling in the Egyptian market, 2018`s anticipated decline in prices will enhance the vehicles competitive edge. Especially for the two-wheelers, as three-wheelers are already very mature.
The domestic production; will lead to same positive margins` direction for spare parts sale as well.
Gross profit CAGR from 2015-to-2020 is to outrun that of cumulative operations` revenues.
Aggregate 2 & 3-wheelers Sales 2014 2015E 2016E 2017E 2018E 2019E 2020E CAGR Sales Volume
Three – Wheelers 61,068 87,011 88,752 91,414 96,000 102,000 108,000 4.42%
Two – Wheelers 36,801 52,195 54,805 57,545 66,000 72,000 78,000 8.37%
Total Sales Volume 97,869 139,207 143,557 148,959 162,000 174,000 186,000 5.97% Change 4.1% 42.2% 3.1% 3.8% 8.8% 7.4% 6.9%
Blended Av. Price - in EGP 12,989 13,639 13,911 14,190 13,764 14,039 14,320 0.98% Change 4.5% 5.0% 2.0% 2.0% -3.0% 2.0% 2.0%
Sales Revenue [in mn] 1271.2 1898.6 1997.1 2113.7 2229.8 2442.8 2663.5 7.01% Change 8.8% 49.3% 5.2% 5.8% 5.5% 9.6% 9.0%
Gross Profit - in EGP mn 234.2 314.6 330.9 359.3 490.5 537.4 586.0 GPM 18.4% 16.6% 16.6% 17.0% 22.0% 22.0% 22.0% Services & Parts Re venues 62.8 89.6 99.9 105.7 111.5 122.1 133.2 8.26%
Change 3.6% 42.6% 11.5% 5.8% 5.5% 9.6% 9.0% Gross Profit - in EGP mn 11.4 15.4 17.5 19.0 24.5 26.9 29.3 GPM 17.8% 17.2% 17.5% 18.0% 22.0% 22.0% 22.0% Cumulative Sales Revenues - in EGP mn 1,334.0 1,988.2 2,096.9 2,219.4 2,341.3 2,565.0 2,796.7 7.06%
Change 8.5% 49.0% 5.5% 5.8% 5.5% 9.6% 9.0% Cumulative Gross Profit - in EGP mn 245.6 330.0 348.4 378.3 515.1 564.3 615.3 13.27%
Change 29.0% 52.3% -11.4% 20.3% 1.8% 6.8% 4.5% Wheelers - Cumulative GPM 18.4% 16.6% 16.6% 17.0% 22.0% 22.0% 22.0%

26
PRIME INVESTMENT RESEARCH GB AUTO INITIATION OF COVERAGE
JANUARY, 2016
SOURCE: GB AUTO
SOURCE: GB AUTO, PRIME ESTIMATES
4) Tires
GB Auto has been in the tires business for too long; over such period the company was able to form a huge portfolio of brands. GB currently distributes passenger cars, vans, buses, light-trucks and other trucks` tires under licenses with Turkey’s Lassa, Japan’s Yokohama, China’s Westlake, Triangle, Diamond Back, Grandstone and Goodyear. GB tires business foot print has been growing year after year to reach a total of 5 markets in 2014 after getting into the Algerian market successfully.
Analysis & Assumptions
In 9M2015, domestic activity revenues fell by around 40% y-o-y driven by the FX-shortage, in addition to, the drop PC locally assembled sales volume in Egypt which had a minimal effect but supported the downtrend.
We believe that during 9M2015, as FX supplies were limited due to the CBE decision in prioritizing certain products. GB Auto focused its share from the FX supplies on other business lines and decided to wipe out tires inventory. We estimate revenues in 2015 end of year to follow 9M2015 change magnitude.
Going forward, as inventory is assumed to be wiped out and new purchases will for sure take place; higher prices will be charged. The assumed increase in FX supplies from the banking system, will also contribute in increasing tires imports from manufacturers and hence increase market supply.
Regional activity outperformed its historical track record in 9M2015; however, as we are worried about activity performance in Iraq and Libya in 4Q2015 but optimistic about Algeria. We assumed a replication of 3Q2015 figures in 2Q4105 as it’s the closest in terms of time span. And since sales value has been declining from 4Q2014 and 1Q2015 to 3Q2015.
Domestic Tires Sales 2014 2015E 2016E 2017E 2018E 2019E 2020E CAGR Sales Revenues - in EGP mn 315.4 187.0 243.1 316.1 363.5 399.8 419.8 17.55%
Change -6.4% -40.7% 30.0% 30.0% 15.0% 10.0% 5.0% Gross Profit - in EGP mn 56.2 15.0 29.2 44.2 58.2 64.0 67.2 34.89%
Total GPM 17.81% 8.04% 12.00% 14.00% 16.00% 16.00% 16.00% Regional Tires Sales 2014 2015E 2016E 2017E 2018E 2019E 2020E
Sales Revenues - in EGP mn 99.8 116.1 118.5 122.0 125.7 129.5 132.0 2.60% Change 86.5% 16.4% 2.0% 3.0% 3.0% 3.0% 2.0%
Gross Profit - in EGP mn 7.5 8.3 8.9 9.2 9.4 9.7 9.9 3.65% Total GPM 7.5% 7.1% 7.5% 7.5% 7.5% 7.5% 7.5%
Cumulative GB Sales Revenues - in EGP mn 415.2 303.2 361.6 438.1 489.2 529.3 551.9 12.73% Change 6.4% -27.0% 19.3% 21.2% 11.7% 8.2% 4.3%
Cumulative GB Gross Profit - in EGP mn 63.7 23.3 38.1 53.4 67.6 73.7 77.1 27.01% Change 9.3% -63.4% 63.2% 40.3% 26.6% 9.0% 4.6%
Cumulative GPM 15.3% 7.7% 10.5% 12.2% 13.8% 13.9% 14.0%
Tires Foot-print
Egypt Algeria Iraq Jordon Libya
Lassa PCs &
Light Truck tires.
West Lake PCs,
Light Truck, Trucks,
& Off-the-road
(OTR) tires.
Yokohama PCs,
Light Truck &
Trucks tires.
Lassa PCs &
Light Truck tires.
GRANDSTONE
Truck tires.
Good Year PCs,
Light Trucks &
Trucks tires.
West Lake PCs,
Light Truck, Trucks,
& Off-the-road
(OTR) tires.
Diamond Back
Light Trucks, Trucks
& Bus Radial tires
(TBR)
Diamond Back
Light Trucks, Trucks
& Bus Radial tires
(TBR)
Triangle Light
Trucks, Trucks &
Bus Radial tires
(TBR).
Triangle Light
Trucks, Trucks &
Bus Radial tires
(TBR).

27
PRIME INVESTMENT RESEARCH GB AUTO INITIATION OF COVERAGE
JANUARY, 2016
GB 2015`s raised capital was meant to contribute to the financing of 2-production facilities; the wheelers plant and another tires plant. However, the new tires plant is not included in our valuation, due to:
1) The company did not finalize the deal with featured global brand yet; however, we know that it’s among the global leaders.
2) As per the company`s management, the project is too be big and will be highly value additive. So as the company did not release data allowing us to evaluate the new plant “company”, we will watchdog GB releases.
But we were informed that, the project will be established over 3-phases. Through phase-1 the new plant will produce 4.6mn tires per annum. And over the 3-phases the project capacity is expected to exceed 6mn tires per annum.
The company did not finalize its decision about the plant`s location, to be in Egypt or another MENA market. We believe that it will be in Egypt, due to the expected new industrial free zones to be established that promise investors` incentives. In addition to that, Egypt targets becoming the world`s trade center through its Suez canal developmental axis.

28
PRIME INVESTMENT RESEARCH GB AUTO INITIATION OF COVERAGE
JANUARY, 2016
SOURCE: GB AUTO, PRIME ESTIMATES
5) Financing Business
GB Capital is the Group’s financial arm, currently encompassing 5-companies that serve all the automotive industry segments. GB Auto has been continuously investing in its financial arm until it became fundamentally strong and has been impressively contributing to the group`s profitability. The financial arm aggregate performance is distinctive, due to high revolving ratios and very low Non Performing Loans (NPLs) of less than 1% on average.
Financing-Arm Portfolio
i) GB Lease: was ranked as Egypt`s 2nd largest leasing company according to total contracts value as of
February 2015 by EFSA. GB Lease provides lease finance to commercial vehicles, corporate fleets and other asset classes. The company diversifies its risks by different asset classes, sectors and clients.
ii) Mashroey: is a micro-finance company that was launched with the purpose of financing wheelers`
clients, in addition to YTO tractors and vans on low income class suitable credit terms. Mashroey financing policy depends on short term financing. It currently operates through a network of over 70 branches.
iii) Drive: was launched with the purpose of financing passenger cars with sole focus on Hyundai and Geely. However, now it covers all GB Auto featured brands in addition to other brands not exclusive to GB Auto. Drive provides factoring besides its PC operations; GB Auto expects a boost in operations after regulations permitted enlarging factoring scope to allow Business-to-Consumer besides Business-to-Business operations.
iv) Haram “Tourist Transport”: Haram is a selective company offering car rental services to top-tier multinational companies, with average tenor and contracts of 3-years.
v) Tasaheel: Tasaheel is GB`s most recent addition, which joined GB Capital portfolio in August 2015. It
provides non-banking financial services, with focus on empowering women, through direct lending to micro-finance clients.
Analysis & Assumptions
This business got remarkably big in no time, thanks to GB Auto`s vision of providing various non-banking financial services to poorly served low-to-medium income class segments. Through the arm`s operations, GB Auto was able to maintain its passenger cars and wheelers leading market share. As for PCs the company`s portfolio is already skewed towards lower priced vehicles; which looks more appealing when comfortable financing terms are provided. While the highly priced Bajaj wheelers in comparison to Chinese counterparts; was strongly performing due to facilitated payment terms and financing coupled with the wheelers high safety and quality standards.
GB Capital portfolio is under-leveraged as per company`s management and still has around 2-to-3 folds of borrowing against their equity bases.
Non-banking financial services providers are currently focusing on penetrating the leasing and micro-finance business. An aspect we believe to intensify competition.
Financing Business Forecast 2014 2015E 2016E 2017E 2018E 2019E 2020E CAGR Revenues 722.7 997.3 1246.6 1471.0 1618.1 1747.5 1834.9 12.97%
Change 49% 38% 25% 18% 10% 8% 5% Gross Profit 168.8 219.4 286.7 353.0 388.3 419.4 440.4 14.95%
GPM 23% 22% 23% 24% 24% 24% 24%
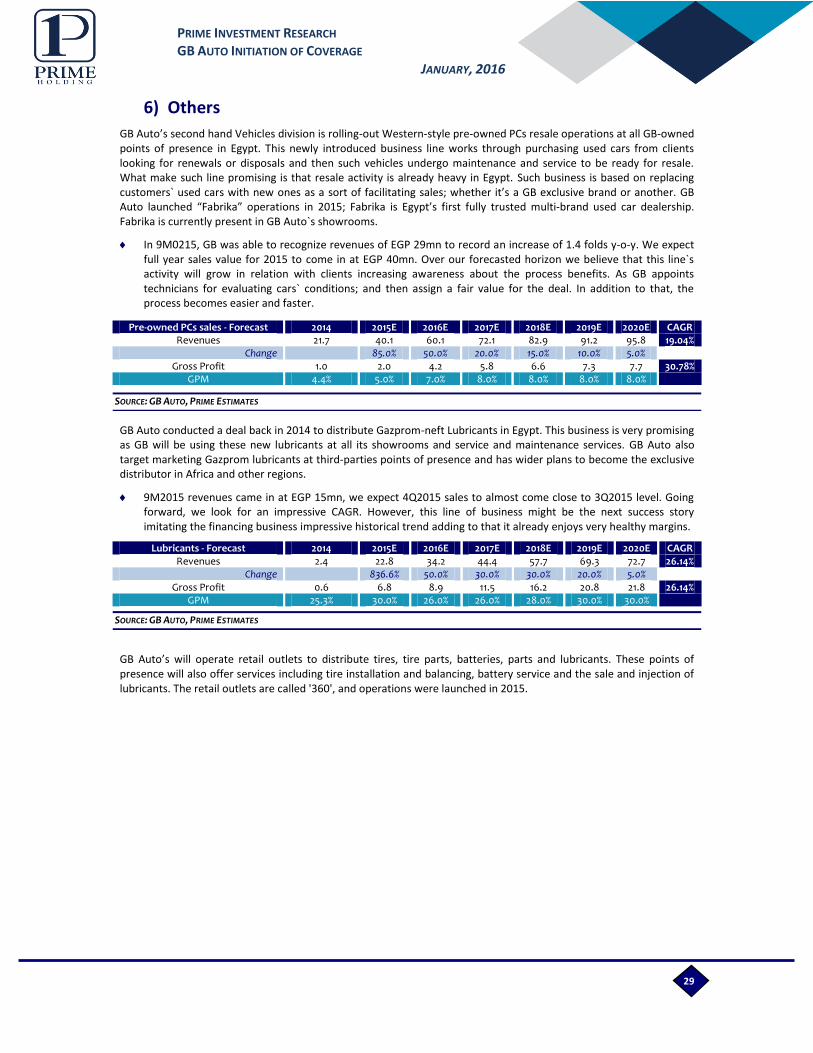
29
PRIME INVESTMENT RESEARCH GB AUTO INITIATION OF COVERAGE
JANUARY, 2016
SOURCE: GB AUTO, PRIME ESTIMATES
SOURCE: GB AUTO, PRIME ESTIMATES
6) Others
GB Auto’s second hand Vehicles division is rolling-out Western-style pre-owned PCs resale operations at all GB-owned points of presence in Egypt. This newly introduced business line works through purchasing used cars from clients looking for renewals or disposals and then such vehicles undergo maintenance and service to be ready for resale. What make such line promising is that resale activity is already heavy in Egypt. Such business is based on replacing customers` used cars with new ones as a sort of facilitating sales; whether it’s a GB exclusive brand or another. GB Auto launched “Fabrika” operations in 2015; Fabrika is Egypt’s first fully trusted multi-brand used car dealership. Fabrika is currently present in GB Auto`s showrooms.
In 9M0215, GB was able to recognize revenues of EGP 29mn to record an increase of 1.4 folds y-o-y. We expect full year sales value for 2015 to come in at EGP 40mn. Over our forecasted horizon we believe that this line`s activity will grow in relation with clients increasing awareness about the process benefits. As GB appoints technicians for evaluating cars` conditions; and then assign a fair value for the deal. In addition to that, the process becomes easier and faster.
GB Auto conducted a deal back in 2014 to distribute Gazprom-neft Lubricants in Egypt. This business is very promising as GB will be using these new lubricants at all its showrooms and service and maintenance services. GB Auto also target marketing Gazprom lubricants at third-parties points of presence and has wider plans to become the exclusive distributor in Africa and other regions.
9M2015 revenues came in at EGP 15mn, we expect 4Q2015 sales to almost come close to 3Q2015 level. Going forward, we look for an impressive CAGR. However, this line of business might be the next success story imitating the financing business impressive historical trend adding to that it already enjoys very healthy margins.
Lubricants - Forecast 2014 2015E 2016E 2017E 2018E 2019E 2020E CAGR Revenues 2.4 22.8 34.2 44.4 57.7 69.3 72.7 26.14%
Change
836.6% 50.0% 30.0% 30.0% 20.0% 5.0% Gross Profit 0.6 6.8 8.9 11.5 16.2 20.8 21.8 26.14%
GPM 25.3% 30.0% 26.0% 26.0% 28.0% 30.0% 30.0%
GB Auto’s will operate retail outlets to distribute tires, tire parts, batteries, parts and lubricants. These points of presence will also offer services including tire installation and balancing, battery service and the sale and injection of lubricants. The retail outlets are called '360', and operations were launched in 2015.
Pre-owned PCs sales - Forecast 2014 2015E 2016E 2017E 2018E 2019E 2020E CAGR Revenues 21.7 40.1 60.1 72.1 82.9 91.2 95.8 19.04%
Change
85.0% 50.0% 20.0% 15.0% 10.0% 5.0% Gross Profit 1.0 2.0 4.2 5.8 6.6 7.3 7.7 30.78%
GPM 4.4% 5.0% 7.0% 8.0% 8.0% 8.0% 8.0%

30
PRIME INVESTMENT RESEARCH GB AUTO INITIATION OF COVERAGE
JANUARY, 2016
31
PRIME INVESTMENT RESEARCH GB AUTO INITIATION OF COVERAGE
JANUARY, 2016
PRIME SALES TEAM
Hassan Samir Managing Director
+202 3300 5611 [email protected]
Mohamed Ezzat Head of Sales & Branches
+202 3300 5784 [email protected]
Shawkat Raslan Heliopolis Branch Manager
+202 3300 5110 [email protected]
Amr Saber Team Head-Institutions Desk
+202 3300 5659 [email protected]
Amr Alaa, CFTe Manager
+202 3300 5609 [email protected]
Mohamed Elmetwaly Manager
+202 3300 5610 [email protected]
Emad Elsafoury Manager
+202 3300 5624 [email protected]
RESEARCH TEAM
+202 3300 5728
HEAD OFFICE PRIME SECURITIES S.A.E. 2 Wadi El Nil St., Liberty Tower, 7th-8th Floor, Mohandessin, Giza, Egypt Tel: +202 33005700/770/650/649 Fax: +202 3760 7543
Disclaimer Information included in this report has no regard to specific investment objectives, financial situation, advices or particular needs of the report users.
The report is published for information purposes only and is not to be construed as a solicitation or an offer to buy or sell any securities or related financial instruments. Unless specifically stated otherwise, all price information is only considered as indicator.
No express or implied representation or guarantee is provided with respect to completeness, accuracy or reliability of information included in this report.
Past performance is not necessarily an indication of future results. Fluctuation of foreign currency rates of exchange may adversely affect the value, price or income of any products mentioned in this report.
Information included in this report should not be regarded by report users as a substitute for the exercise of their own due diligence and analysis based on own assessment and judgment criteria. Any opinions given are subject to change without notice and may significantly differ or be contrary to opinions expressed by other Prime business areas as a result of using different assumptions and criteria. Prime Group is under no obligation responsible to update or keep current the information contained herein.
Prime Group, its directors, officers, employees or clients may have or have had interests or long or short positions in the securities and/or currencies referred to herein, and may at any time make purchases and/or sales in them as principal or agent.
Prime Group, its related entities, directors, employees and agents accepts no liability whatsoever for any loss or damage of any kind arising from the use of all or part of these information included in this report. Certain laws and regulations impose liabilities which cannot be disclaimed. This disclaimer shall, in no way, constitute a waiver or limitation of any rights a person may have under such laws and/or regulations.
Furthermore, Prime Group or any of the group companies may have or have had a relationship with or may provide or have provided other services, within its objectives to the relevant companies. Prime Group 2016 all rights reserved. You are hereby notified that distribution and copying of this document is strictly prohibited without the prior approval of Prime Group.


![2010 06 14 Intershop Initiation of Coverage[1]](https://static.fdocuments.in/doc/165x107/54fe2a184a7959592e8b456c/2010-06-14-intershop-initiation-of-coverage1.jpg)