ARCC initiation of coverage
15
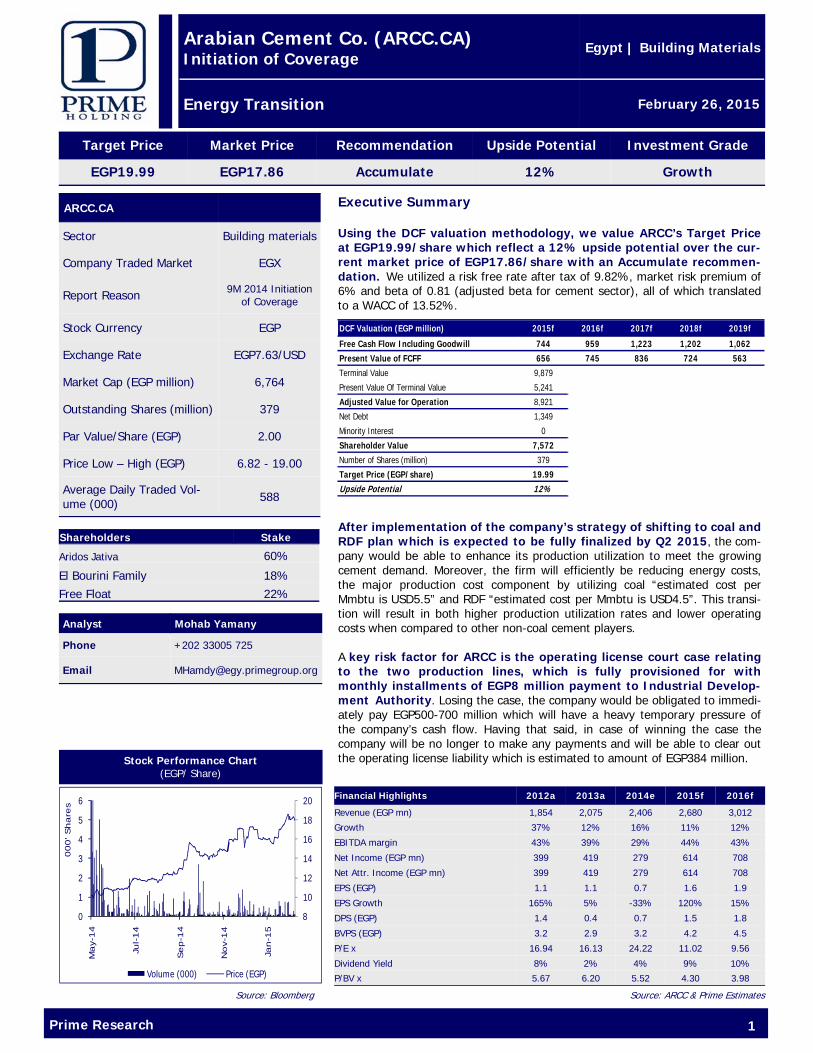
Target Price Market Price Investment Grade EGP19.99 EGP17.86 Growth Recommendation Accumulate Upside Potential 12% Source: ARCC & Prime Estimates Prime Research 1 Executive Summary Using the DCF valuation methodology, we value ARCC’s Target Price at EGP19.99/share which reflect a 12% upside potential over the cur- rent market price of EGP17.86/share with an Accumulate recommen- dation. We utilized a risk free rate after tax of 9.82%, market risk premium of 6% and beta of 0.81 (adjusted beta for cement sector), all of which translated to a WACC of 13.52%. After implementation of the company’s strategy of shifting to coal and RDF plan which is expected to be fully finalized by Q2 2015, the com- pany would be able to enhance its production utilization to meet the growing cement demand. Moreover, the firm will efficiently be reducing energy costs, the major production cost component by utilizing coal “estimated cost per Mmbtu is USD5.5” and RDF “estimated cost per Mmbtu is USD4.5”. This transi- tion will result in both higher production utilization rates and lower operating costs when compared to other non-coal cement players. A key risk factor for ARCC is the operating license court case relating to the two production lines, which is fully provisioned for with monthly installments of EGP8 million payment to Industrial Develop- ment Authority. Losing the case, the company would be obligated to immedi- ately pay EGP500-700 million which will have a heavy temporary pressure of the company’s cash flow. Having that said, in case of winning the case the company will be no longer to make any payments and will be able to clear out the operating license liability which is estimated to amount of EGP384 million. Stock Performance Chart (EGP/ Share) Analyst Mohab Yamany Phone +202 33005 725 Email [email protected] Arabian Cement Co. (ARCC.CA) Initiation of Coverage Energy Transition Egypt | Building Materials February 26, 2015 ARCC.CA Sector Building materials Company Traded Market EGX Stock Currency EGP Exchange Rate EGP7.63/USD Market Cap (EGP million) 6,764 Outstanding Shares (million) 379 Par Value/Share (EGP) 2.00 Price Low – High (EGP) 6.82 - 19.00 Average Daily Traded Vol- ume (000) 588 Report Reason 9M 2014 Initiation of Coverage Source: Bloomberg Shareholders Stake Aridos Jativa 60% El Bourini Family 18% Free Float 22% Financial Highlights 2012a 2013a 2014e 2015f 2016f Revenue (EGP mn) 1,854 2,075 2,406 2,680 3,012 Growth 37% 12% 16% 11% 12% EBITDA margin 43% 39% 29% 44% 43% Net Income (EGP mn) 399 419 279 614 708 Net Attr. Income (EGP mn) 399 419 279 614 708 EPS (EGP) 1.1 1.1 0.7 1.6 1.9 EPS Growth 165% 5% -33% 120% 15% DPS (EGP) 1.4 0.4 0.7 1.5 1.8 BVPS (EGP) 3.2 2.9 3.2 4.2 4.5 P/E x 16.94 16.13 24.22 11.02 9.56 Dividend Yield 8% 2% 4% 9% 10% P/BV x 5.67 6.20 5.52 4.30 3.98 DCF Valuation (EGP million) 2015f 2016f 2017f 2018f 2019f Free Cash Flow Including Goodwill 744 959 1,223 1,202 1,062 Present Value of FCFF 656 745 836 724 563 Terminal Value 9,879 Present Value Of Terminal Value 5,241 Adjusted Value for Operation 8,921 Net Debt 1,349 Minority Interest 0 Shareholder Value 7,572 Number of Shares (million) 379 Target Price (EGP/share) 19.99 Upside Potential 12% 8 10 12 14 16 18 20 0 1 2 3 4 5 6 May-14 Jul-14 Sep-14 Nov-14 Jan-15 000' Shares Volume (000) Price (EGP)
-
Upload
mohab-yamany-cma -
Category
Economy & Finance
-
view
92 -
download
1
Transcript of ARCC initiation of coverage
Target Price Market Price Investment Grade
EGP19.99 EGP17.86 Growth
Recommendation
Accumulate
Upside Potential
12%
Source: ARCC & Prime Estimates
Prime Research 1
Executive Summary Using the DCF valuation methodology, we value ARCC’s Target Price at EGP19.99/share which reflect a 12% upside potential over the cur-rent market price of EGP17.86/share with an Accumulate recommen-dation. We utilized a risk free rate after tax of 9.82%, market risk premium of 6% and beta of 0.81 (adjusted beta for cement sector), all of which translated to a WACC of 13.52%.
After implementation of the company’s strategy of shifting to coal and RDF plan which is expected to be fully finalized by Q2 2015, the com-pany would be able to enhance its production utilization to meet the growing cement demand. Moreover, the firm will efficiently be reducing energy costs, the major production cost component by utilizing coal “estimated cost per Mmbtu is USD5.5” and RDF “estimated cost per Mmbtu is USD4.5”. This transi-tion will result in both higher production utilization rates and lower operating costs when compared to other non-coal cement players. A key risk factor for ARCC is the operating license court case relating to the two production lines, which is fully provisioned for with monthly installments of EGP8 million payment to Industrial Develop-ment Authority. Losing the case, the company would be obligated to immedi-ately pay EGP500-700 million which will have a heavy temporary pressure of the company’s cash flow. Having that said, in case of winning the case the company will be no longer to make any payments and will be able to clear out the operating license liability which is estimated to amount of EGP384 million. Stock Performance Chart
(EGP/ Share)
Analyst Mohab Yamany
Phone +202 33005 725
Email [email protected]
Arabian Cement Co. (ARCC.CA) Initiation of Coverage
Energy Transition
Egypt | Building Materials
February 26, 2015
ARCC.CA
Sector Building materials
Company Traded Market EGX
Stock Currency EGP
Exchange Rate EGP7.63/USD
Market Cap (EGP million) 6,764
Outstanding Shares (million) 379
Par Value/Share (EGP) 2.00
Price Low – High (EGP) 6.82 - 19.00
Average Daily Traded Vol-ume (000) 588
Report Reason 9M 2014 Initiation of Coverage
Source: Bloomberg
Shareholders Stake
Aridos Jativa 60%
El Bourini Family 18% Free Float 22%
Financial Highlights 2012a 2013a 2014e 2015f 2016f
Revenue (EGP mn) 1,854 2,075 2,406 2,680 3,012
Growth 37% 12% 16% 11% 12%
EBITDA margin 43% 39% 29% 44% 43%
Net Income (EGP mn) 399 419 279 614 708
Net Attr. Income (EGP mn) 399 419 279 614 708
EPS (EGP) 1.1 1.1 0.7 1.6 1.9
EPS Growth 165% 5% -33% 120% 15%
DPS (EGP) 1.4 0.4 0.7 1.5 1.8
BVPS (EGP) 3.2 2.9 3.2 4.2 4.5
P/E x 16.94 16.13 24.22 11.02 9.56
Dividend Yield 8% 2% 4% 9% 10%
P/BV x 5.67 6.20 5.52 4.30 3.98
DCF Valuation (EGP million) 2015f 2016f 2017f 2018f 2019f
Free Cash Flow Including Goodwill 744 959 1,223 1,202 1,062Present Value of FCFF 656 745 836 724 563Terminal Value 9,879
Present Value Of Terminal Value 5,241
Adjusted Value for Operation 8,921
Net Debt 1,349
Minority Interest 0
Shareholder Value 7,572Number of Shares (million) 379
Target Price (EGP/share) 19.99Upside Potential 12%
8
10
12
14
16
18
20
0
1
2
3
4
5
6
May-
14
Jul-14
Sep-1
4
Nov-
14
Jan-1
5
000' Share
s
Volume (000) Price (EGP)
Prime Research 2
Arabian Cement Co. (ARCC.CA)
Initiation of Coverage
Egypt | Building Materials
February 26, 2015
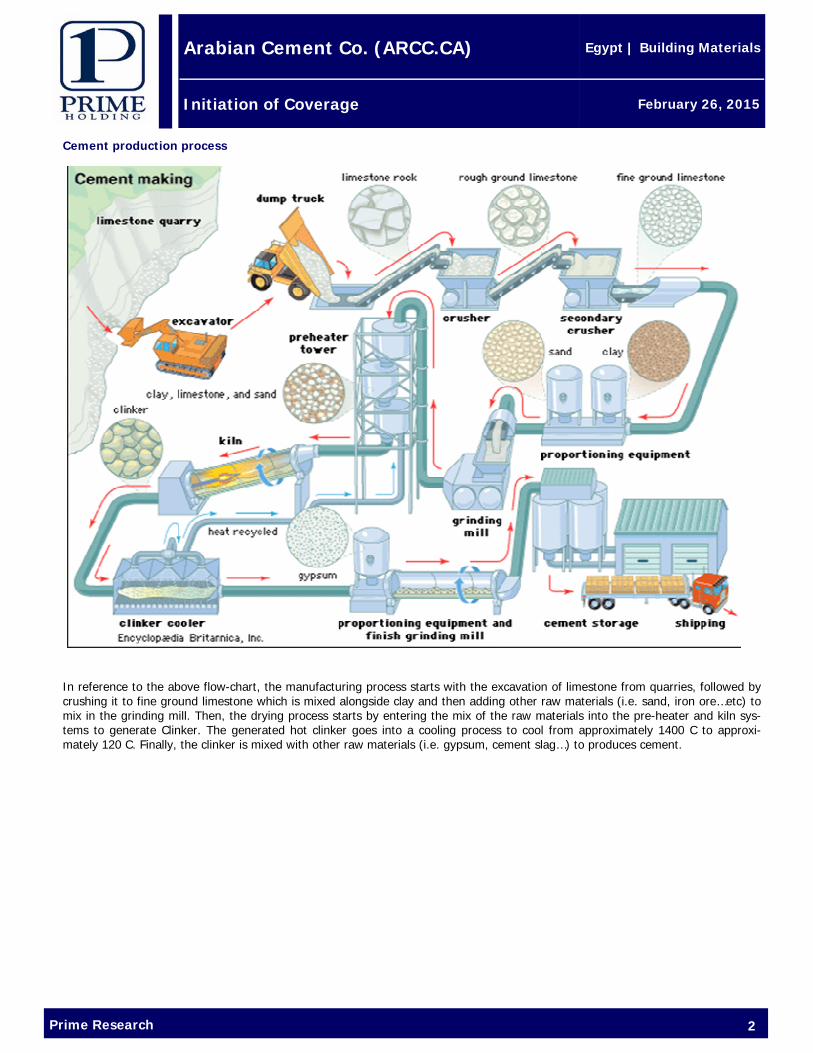
Cement production process
In reference to the above flow-chart, the manufacturing process starts with the excavation of limestone from quarries, followed by crushing it to fine ground limestone which is mixed alongside clay and then adding other raw materials (i.e. sand, iron ore…etc) to mix in the grinding mill. Then, the drying process starts by entering the mix of the raw materials into the pre-heater and kiln sys-tems to generate Clinker. The generated hot clinker goes into a cooling process to cool from approximately 1400 C to approxi-mately 120 C. Finally, the clinker is mixed with other raw materials (i.e. gypsum, cement slag…) to produces cement.
Prime Research 3
Arabian Cement Co. (ARCC.CA)
Initiation of Coverage
Egypt | Building Materials
February 26, 2015
• Major industry related events world wide:
Global oil prices have dropped dramatically over the past six months hitting its lowest value since 2009. Benchmark Brent crude, was trading at around USD50 per barrel in January 2015, down by more than 56% from last year’s peak in June of above USD115. How did that happen and what will be the effect on Egypt’s cement industry?
How did that happen ? • This crises initially started from the emergence of shale oil in the United States and Canada through the newly discovered
techniques of hydraulic fracturing and horizontal drilling that helped in extracting oil and gas from Shale rock. Adoption of these methods resulted significant production growth during the past two years in the United States and Canada, which are now driving virtually all non-OPEC production growth.
• Slower global growth that resulted in a lower demand for oil, especially in China • Increase in supply especially from Libya and Iraq. • Increase in production from OPEC countries. • The refusal of OPEC countries to cut down production to stabilize prices, which was against expectations.
This sharp decline in oil prices will affect all oil producers negatively. However, OPEC’s view is to maintain their market share taking an advantage of such prices decline with hopes that Shale-oil high cost producing firms will eventually exit the industry. Hoping that in time till the supply and demand will go back to it’s norm. Many of shale oil firms operate at production costs hovering between USD65 to USD70 per BBLT, such firms will suffer the most from price declines and are expected to exit the market as per OPEC’s strategy. In the mean time OPEC countries depend on their reserve till they pass the Oil crises. The price decline will have a posi-tive effect on the importing countries including but not limited to Egypt.
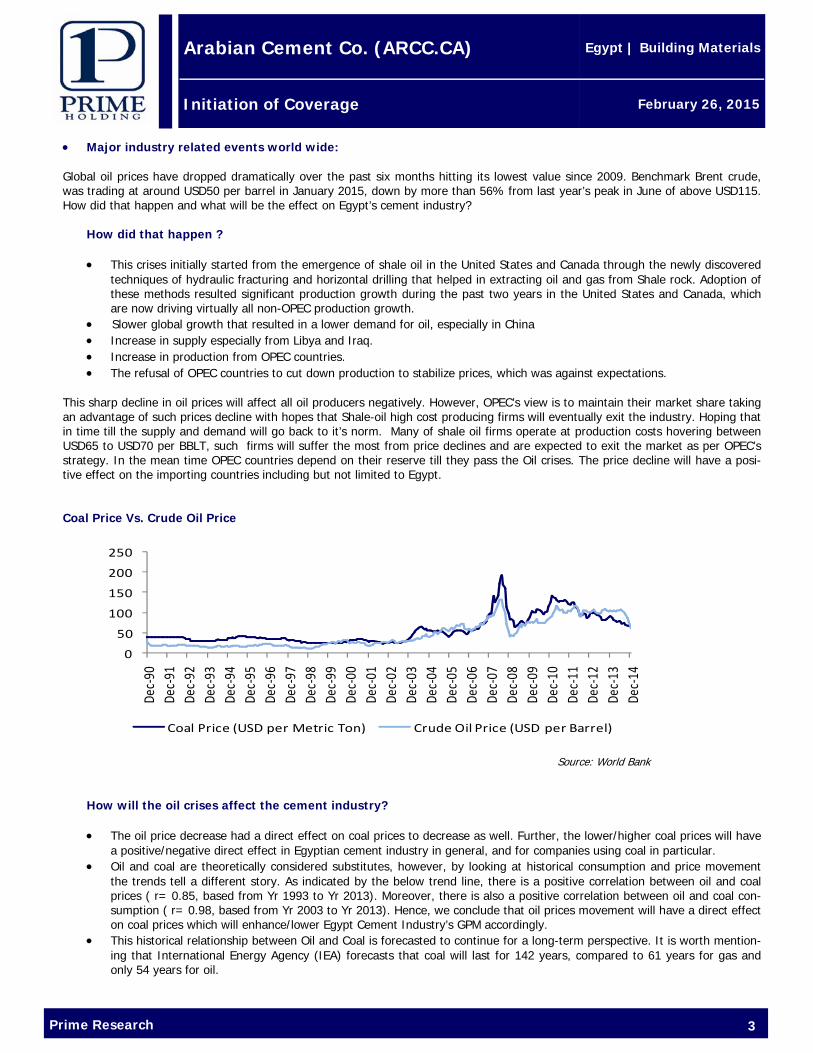
Coal Price Vs. Crude Oil Price
How will the oil crises affect the cement industry? • The oil price decrease had a direct effect on coal prices to decrease as well. Further, the lower/higher coal prices will have
a positive/negative direct effect in Egyptian cement industry in general, and for companies using coal in particular. • Oil and coal are theoretically considered substitutes, however, by looking at historical consumption and price movement
the trends tell a different story. As indicated by the below trend line, there is a positive correlation between oil and coal prices ( r= 0.85, based from Yr 1993 to Yr 2013). Moreover, there is also a positive correlation between oil and coal con-sumption ( r= 0.98, based from Yr 2003 to Yr 2013). Hence, we conclude that oil prices movement will have a direct effect on coal prices which will enhance/lower Egypt Cement Industry’s GPM accordingly.
• This historical relationship between Oil and Coal is forecasted to continue for a long-term perspective. It is worth mention-ing that International Energy Agency (IEA) forecasts that coal will last for 142 years, compared to 61 years for gas and only 54 years for oil.
Source: World Bank
0
50
100
150
200
250
Dec‐90
Dec‐91
Dec‐92
Dec‐93
Dec‐94
Dec‐95
Dec‐96
Dec‐97
Dec‐98
Dec‐99
Dec‐00
Dec‐01
Dec‐02
Dec‐03
Dec‐04
Dec‐05
Dec‐06
Dec‐07
Dec‐08
Dec‐09
Dec‐10
Dec‐11
Dec‐12
Dec‐13
Dec‐14
Coal Price (USD per Metric Ton) Crude Oil Price (USD per Barrel)
Prime Research 4
Arabian Cement Co. (ARCC.CA)
Initiation of Coverage
Egypt | Building Materials
February 26, 2015
Industry outlook – positive for ARCC • Major industry related events in Egypt: Early 2014, Egypt became vulnerable to energy shortages and the Egyptian government sought out different strategies to overcome the energy shortage consequences. In April 2014, the government permitted the use of coal in cement plants with a commitment to environmental controls, standards and obtaining the approval of the environmental impact assessment studies in all related phases. The government also requested to expand the usage of refuse-derived fuel (RDF) to reach utilization rates of 40% in cement pro-duction. By November 2014, the environment minister permitted 12 coal usage approvals to cement plants. Having that said, Ara-bian Cement is one of the few cement companies which took the initiative and started an early coal & RDF conver-sion process and as per the company plans, the energy production will be utilized by 70% coal and 30% RDF in Q1 2015. Hence, cost saving as a result of coal usage will positively affect ARCC’s 2015 GPM higher than other cement firms which obtained the governmental approval to use coal, but still will start converting/is converting to coal.
Local Cement Industry Overview • Cement consumption in Egypt is spread out into three sectors; residential, infrastructure and non-residential sectors with 85%,
5% and 10% of cement consumption respectively. • Therefore, we initially forecasted the building & construction sector based on its substantially well-built historical relationship
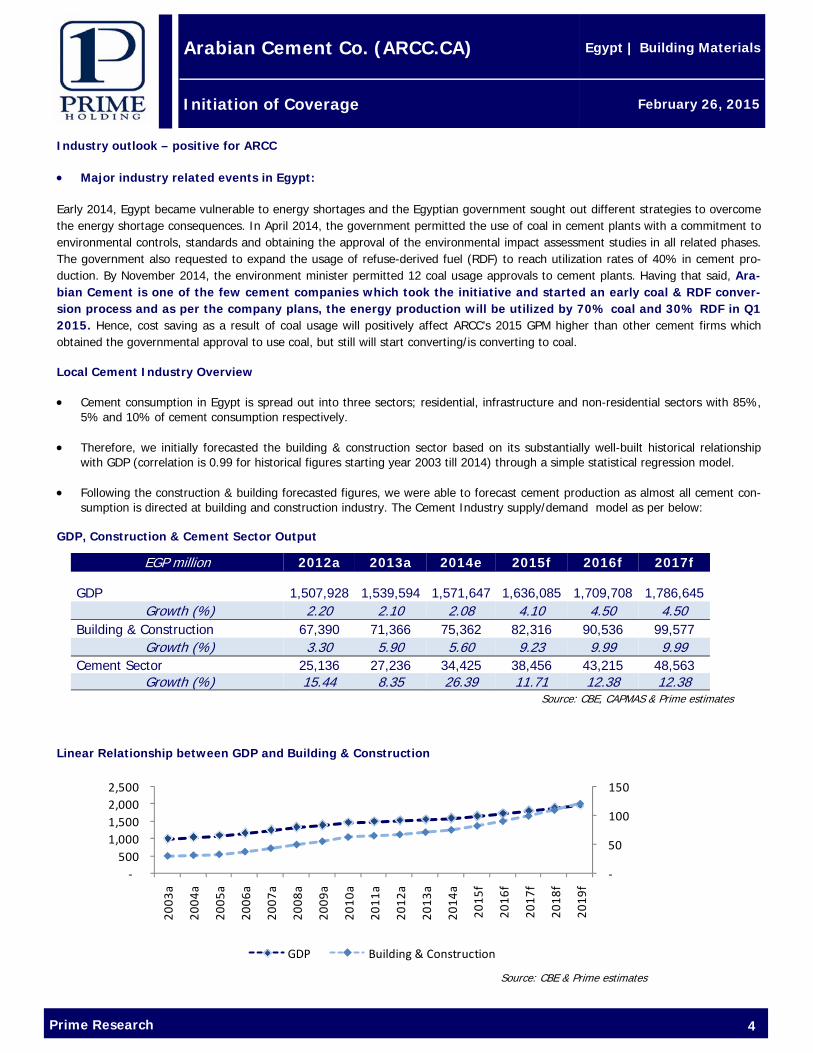
with GDP (correlation is 0.99 for historical figures starting year 2003 till 2014) through a simple statistical regression model. • Following the construction & building forecasted figures, we were able to forecast cement production as almost all cement con-
sumption is directed at building and construction industry. The Cement Industry supply/demand model as per below: GDP, Construction & Cement Sector Output
Linear Relationship between GDP and Building & Construction
Source: CBE, CAPMAS & Prime estimates
EGP million 2012a 2013a 2014e 2015f 2016f 2017f
GDP 1,507,928 1,539,594 1,571,647 1,636,085 1,709,708 1,786,645 Growth (%) 2.20 2.10 2.08 4.10 4.50 4.50
Building & Construction 67,390 71,366 75,362 82,316 90,536 99,577 Growth (%) 3.30 5.90 5.60 9.23 9.99 9.99
Cement Sector 25,136 27,236 34,425 38,456 43,215 48,563 Growth (%) 15.44 8.35 26.39 11.71 12.38 12.38
‐
50
100
150
‐500
1,000 1,500 2,000 2,500
2003
a
2004
a
2005
a
2006
a
2007
a
2008
a
2009
a
2010
a
2011
a
2012
a
2013
a
2014
a
2015
f
2016
f
2017
f
2018
f
2019
f
GDP Building & Construction
Source: CBE & Prime estimates
Prime Research 5
Arabian Cement Co. (ARCC.CA)
Initiation of Coverage
Egypt | Building Materials
February 26, 2015
• Following the construction & building forecasted figures, we were able to forecast cement production as almost all cement con-sumption is directed at building and construction industry. The Cement Industry supply/demand model as per below:
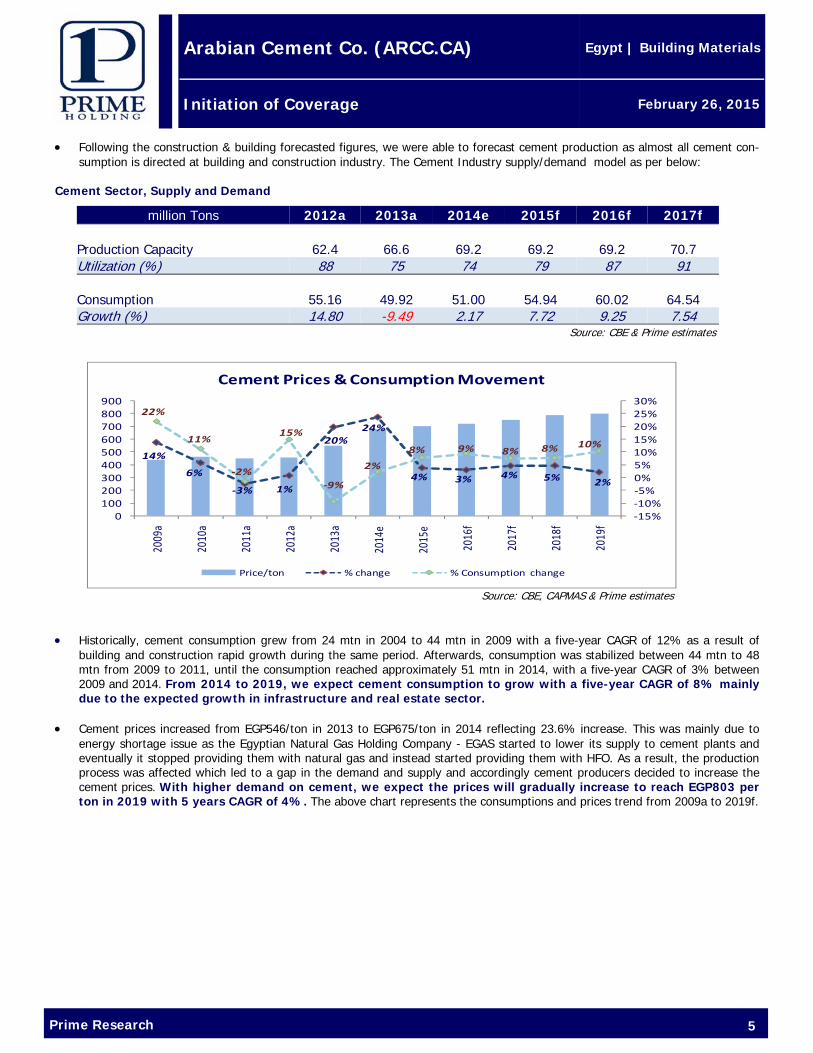
Cement Sector, Supply and Demand • Historically, cement consumption grew from 24 mtn in 2004 to 44 mtn in 2009 with a five-year CAGR of 12% as a result of
building and construction rapid growth during the same period. Afterwards, consumption was stabilized between 44 mtn to 48 mtn from 2009 to 2011, until the consumption reached approximately 51 mtn in 2014, with a five-year CAGR of 3% between 2009 and 2014. From 2014 to 2019, we expect cement consumption to grow with a five-year CAGR of 8% mainly due to the expected growth in infrastructure and real estate sector.
• Cement prices increased from EGP546/ton in 2013 to EGP675/ton in 2014 reflecting 23.6% increase. This was mainly due to
energy shortage issue as the Egyptian Natural Gas Holding Company - EGAS started to lower its supply to cement plants and eventually it stopped providing them with natural gas and instead started providing them with HFO. As a result, the production process was affected which led to a gap in the demand and supply and accordingly cement producers decided to increase the cement prices. With higher demand on cement, we expect the prices will gradually increase to reach EGP803 per ton in 2019 with 5 years CAGR of 4%. The above chart represents the consumptions and prices trend from 2009a to 2019f.
million Tons 2012a 2013a 2014e 2015f 2016f 2017f Production Capacity 62.4 66.6 69.2 69.2 69.2 70.7 Utilization (%) 88 75 74 79 87 91 Consumption 55.16 49.92 51.00 54.94 60.02 64.54 Growth (%) 14.80 -9.49 2.17 7.72 9.25 7.54
Source: CBE & Prime estimates
14%
6%
‐3% 1%
20%24%
4% 3% 4% 5% 2%
22%
11%
‐2%
15%
‐9%
2%
8% 9% 8% 8% 10%
‐15%‐10%‐5%0%5%10%15%20%25%30%
0100200300400500600700800900
2009
a
2010
a
2011
a
2012
a
2013
a
2014
e
2015
e
2016
f
2017
f
2018
f
2019
f
Cement Prices & Consumption Movement
Price/ton % change % Consumption change
Source: CBE, CAPMAS & Prime estimates
Prime Research 6
Arabian Cement Co. (ARCC.CA)
Initiation of Coverage
Egypt | Building Materials
February 26, 2015
Arabian Cement – Company brief • Arabian Cement started operations in 2008 with majority ownership by Cementos La Union (“CLU”), a Spanish cement firm
operating in several countries. The company has two production lines with a capacity of 5 Mmpta of cement spread equally over the two lines with overall market share of approximately 7%. The company is currently shifting its energy towards 70% coal and 30% RDF by Q1 2015. The companies limestone quarry is 2.8 Km away from the plant, while Clay and Gypsum are transferred from Zaafarana (100 Km) away from the plant. During 2014, the company was able to distribute 57% of its pro-duction through Express Wassal and its warehouses.
Financial Statement Analysis
Arabian Cement revenues increased from EGP1,354 million in 2011 to EGP2,075 million in 2013 with a CAGR of 23% which resulted from the 2nd cement line addition that led the cement production to increase from 3,272 thousand tons in 2011 to reach 4,010 thousand tons in 2013. Meanwhile, the company’s average selling price reached EGP515/ton in 2013 which is 38% higher the price level of 2011. In 2014, we believe that the firm revenues will grow by 20% despite lower utilization rates as the revenue growth is coming from an increase in cement prices reaching EGP675 per ton increasing approximately 24% compared to 2013 local industry average. In 2015 and afterwards, we believe that the company will continue to maintain its strategy of selling 5% below market prices and preserve its market share. It worth mentioning that by maintaining the company’s market share, the cement production will reach its full operating capacity “ 5 mtn “ by 2017f.
Source: ARCC & Prime Estimates
Revenue Key Operational Assumptions 2013a 2014e 2015f 2016f 2017f 2018f 2019f Clinker capacity (million ton) 4,200 4,200 4,200 4,200 4,200 4,200 4,200
Clinker production (million ton) 3,242 3,390 3,610 3,944 4,469 4,469 4,469 Clinker utilization rate (%) 77 81 86 94 106 106 106
Clinker-cement conversion rate 1.24 1.12 1.12 1.12 1.12 1.12 1.12 Cement capacity (million ton) 5,000 5,000 5,000 5,000 5,000 5,000 5,000
Cement production (million ton) 4,010 3,792 4,039 4,412 5,000 5,000 5,000 Cement utilization rates (%) 80 76 81 88 100 100 100
ARCC Market Share 7.9 7.4 7.4 7.4 7.4 7.4 7.4 Average Local Cement Prices (EGP/Ton) 546 675 700 720 752 787 803 ARCC Average Selling Prices (EGP/Ton) 515 635 658 677 707 740 755
Energy mix Gas/diesel (%) 98 80 0 0 0 0 0
Coal (%) 0 16 70 70 70 70 70 RDF (%) 2 4 30 30 30 30 30
Blended energy price (USD/Mmbtu) 6.0 6.8 5.0 5.3 5.4 5.6 5.7 Cash cost/ton * 316 446 370 385 396 410 423
EBITDA/ton 200 187 291 295 315 334 336 * Cash costs include SG&A expenses
Prime Research 7
Arabian Cement Co. (ARCC.CA)
Initiation of Coverage
Egypt | Building Materials
February 26, 2015
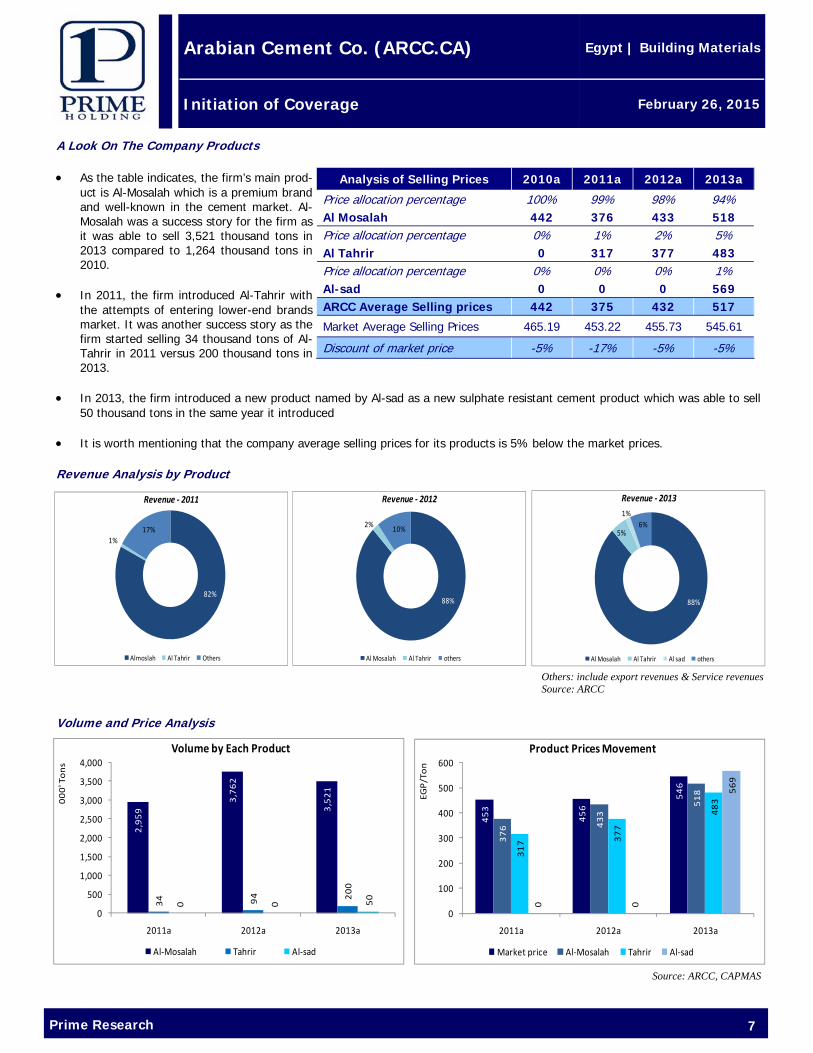
A Look On The Company Products • As the table indicates, the firm’s main prod-
uct is Al-Mosalah which is a premium brand and well-known in the cement market. Al-Mosalah was a success story for the firm as it was able to sell 3,521 thousand tons in 2013 compared to 1,264 thousand tons in 2010.
• In 2011, the firm introduced Al-Tahrir with
the attempts of entering lower-end brands market. It was another success story as the firm started selling 34 thousand tons of Al-Tahrir in 2011 versus 200 thousand tons in 2013.
• In 2013, the firm introduced a new product named by Al-sad as a new sulphate resistant cement product which was able to sell
50 thousand tons in the same year it introduced • It is worth mentioning that the company average selling prices for its products is 5% below the market prices.
Revenue Analysis by Product
Volume and Price Analysis
Others: include export revenues & Service revenues Source: ARCC
Source: ARCC, CAPMAS
Analysis of Selling Prices 2010a 2011a 2012a 2013a
Price allocation percentage 100% 99% 98% 94% Al Mosalah 442 376 433 518 Price allocation percentage 0% 1% 2% 5% Al Tahrir 0 317 377 483 Price allocation percentage 0% 0% 0% 1% Al-sad 0 0 0 569 ARCC Average Selling prices 442 375 432 517
Market Average Selling Prices 465.19 453.22 455.73 545.61
Discount of market price -5% -17% -5% -5%
88%
2% 10%
Revenue ‐ 2012
Al Mosalah Al Tahrir others
88%
5%
1%6%
Revenue ‐ 2013
Al Mosalah Al Tahrir Al sad others
82%
1%17%
Revenue ‐ 2011
Almoslah Al Tahrir Others
453
456
546
376 433
518
317 377
483
0 0
569
0
100
200
300
400
500
600
2011a 2012a 2013a
EGP/Ton
Product Prices Movement
Market price Al‐Mosalah Tahrir Al‐sad
2,959
3,762
3,521
34 94 200
0 0 50
0
500
1,000
1,500
2,000
2,500
3,000
3,500
4,000
2011a 2012a 2013a
000' Tons
Volume by Each Product
Al‐Mosalah Tahrir Al‐sad
Prime Research 8
Arabian Cement Co. (ARCC.CA)
Initiation of Coverage
Egypt | Building Materials
February 26, 2015
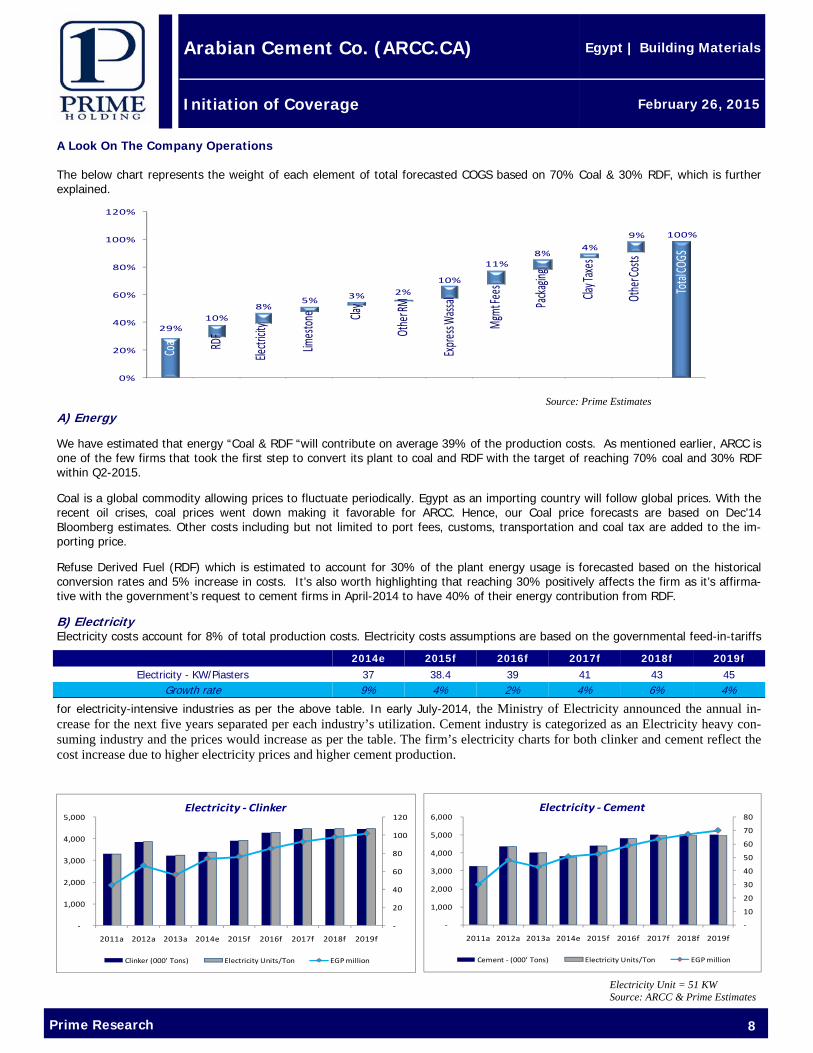
A Look On The Company Operations The below chart represents the weight of each element of total forecasted COGS based on 70% Coal & 30% RDF, which is further explained. A) Energy We have estimated that energy “Coal & RDF “will contribute on average 39% of the production costs. As mentioned earlier, ARCC is one of the few firms that took the first step to convert its plant to coal and RDF with the target of reaching 70% coal and 30% RDF within Q2-2015. Coal is a global commodity allowing prices to fluctuate periodically. Egypt as an importing country will follow global prices. With the recent oil crises, coal prices went down making it favorable for ARCC. Hence, our Coal price forecasts are based on Dec’14 Bloomberg estimates. Other costs including but not limited to port fees, customs, transportation and coal tax are added to the im-porting price. Refuse Derived Fuel (RDF) which is estimated to account for 30% of the plant energy usage is forecasted based on the historical conversion rates and 5% increase in costs. It’s also worth highlighting that reaching 30% positively affects the firm as it’s affirma-tive with the government’s request to cement firms in April-2014 to have 40% of their energy contribution from RDF.
B) Electricity Electricity costs account for 8% of total production costs. Electricity costs assumptions are based on the governmental feed-in-tariffs
for electricity-intensive industries as per the above table. In early July-2014, the Ministry of Electricity announced the annual in-crease for the next five years separated per each industry’s utilization. Cement industry is categorized as an Electricity heavy con-suming industry and the prices would increase as per the table. The firm’s electricity charts for both clinker and cement reflect the cost increase due to higher electricity prices and higher cement production.
Source: Prime Estimates
2014e 2015f 2016f 2017f 2018f 2019f Electricity - KW/Piasters 37 38.4 39 41 43 45
Growth rate 9% 4% 2% 4% 6% 4%
‐
20
40
60
80
100
120
‐
1,000
2,000
3,000
4,000
5,000
2011a 2012a 2013a 2014e 2015f 2016f 2017f 2018f 2019f
Electricity ‐ Clinker
Clinker (000' Tons) Electricity Units/Ton EGP million
‐
10
20
30
40
50
60
70
80
‐
1,000
2,000
3,000
4,000
5,000
6,000
2011a 2012a 2013a 2014e 2015f 2016f 2017f 2018f 2019f
Electricity ‐ Cement
Cement ‐ (000' Tons) Electricity Units/Ton EGP million
Electricity Unit = 51 KW Source: ARCC & Prime Estimates
100%
29%10%
8%5% 3% 2%
10%
11%8%
4%
9%
0%
20%
40%
60%
80%
100%
120%
Coal
RDF
Ele
ctri
cit
y
Limest
one
Clay
Ot
her
RM
Expres
s
Wassa
l
Mgmt
fees
Packin
g Clay
taxes
othe
r
cost
s
Tota
l
Cost
RDF
Coal
Electr
icity
Limeston
e Clay
Othe
rRM
Expre
ss Wa
ssal
Mgmt
Fees
Packa
ging
Clay T
axes
Othe
r Costs
Total
COGS
Prime Research 9
Arabian Cement Co. (ARCC.CA)
Initiation of Coverage
Egypt | Building Materials
February 26, 2015
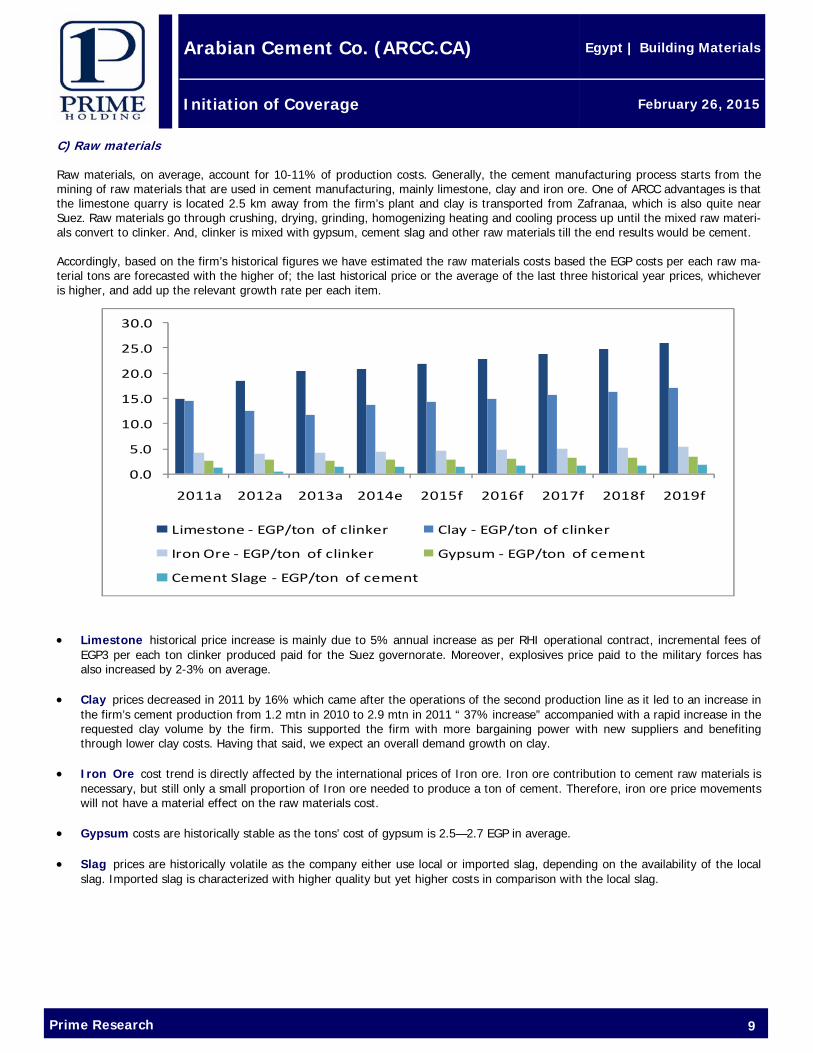
C) Raw materials
Raw materials, on average, account for 10-11% of production costs. Generally, the cement manufacturing process starts from the mining of raw materials that are used in cement manufacturing, mainly limestone, clay and iron ore. One of ARCC advantages is that the limestone quarry is located 2.5 km away from the firm’s plant and clay is transported from Zafranaa, which is also quite near Suez. Raw materials go through crushing, drying, grinding, homogenizing heating and cooling process up until the mixed raw materi-als convert to clinker. And, clinker is mixed with gypsum, cement slag and other raw materials till the end results would be cement. Accordingly, based on the firm’s historical figures we have estimated the raw materials costs based the EGP costs per each raw ma-terial tons are forecasted with the higher of; the last historical price or the average of the last three historical year prices, whichever is higher, and add up the relevant growth rate per each item. • Limestone historical price increase is mainly due to 5% annual increase as per RHI operational contract, incremental fees of
EGP3 per each ton clinker produced paid for the Suez governorate. Moreover, explosives price paid to the military forces has also increased by 2-3% on average.
• Clay prices decreased in 2011 by 16% which came after the operations of the second production line as it led to an increase in
the firm’s cement production from 1.2 mtn in 2010 to 2.9 mtn in 2011 “ 37% increase” accompanied with a rapid increase in the requested clay volume by the firm. This supported the firm with more bargaining power with new suppliers and benefiting through lower clay costs. Having that said, we expect an overall demand growth on clay.
• Iron Ore cost trend is directly affected by the international prices of Iron ore. Iron ore contribution to cement raw materials is
necessary, but still only a small proportion of Iron ore needed to produce a ton of cement. Therefore, iron ore price movements will not have a material effect on the raw materials cost.
• Gypsum costs are historically stable as the tons’ cost of gypsum is 2.5—2.7 EGP in average. • Slag prices are historically volatile as the company either use local or imported slag, depending on the availability of the local
slag. Imported slag is characterized with higher quality but yet higher costs in comparison with the local slag.
0.0
5.0
10.0
15.0
20.0
25.0
30.0
2011a 2012a 2013a 2014e 2015f 2016f 2017f 2018f 2019f
Limestone ‐ EGP/ton of clinker Clay ‐ EGP/ton of clinker
Iron Ore ‐ EGP/ton of clinker Gypsum ‐ EGP/ton of cement
Cement Slage ‐ EGP/ton of cement
Prime Research 10
Arabian Cement Co. (ARCC.CA)
Initiation of Coverage
Egypt | Building Materials
February 26, 2015
D) Express “Wassal” Transportation costs accounted for 10% of total production costs. Express “Wassal”, a project initiated by the firm in 2011 with the purpose of providing full transportation services. This would have different benefits to the firm which includes reducing the firm dependency on external transportation, full control products flow to non-designated markets, ensure price positioning in the market by the extra services, and penetrating high demand scattered markets. In addition, ARCC is the only cement producer that has its own warehouses, which are located in Damanhour, Benha, and Mansoura. Combining both features, enables the firm to have a competitive edge over competitors.
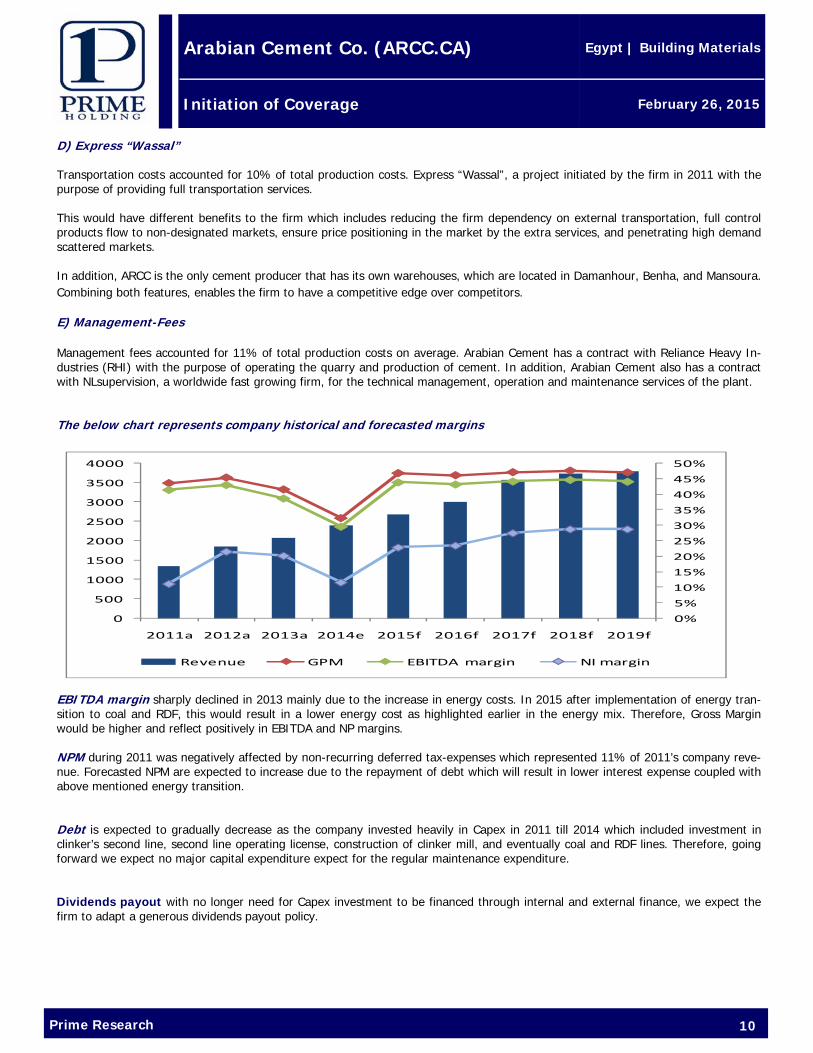
E) Management-Fees Management fees accounted for 11% of total production costs on average. Arabian Cement has a contract with Reliance Heavy In-dustries (RHI) with the purpose of operating the quarry and production of cement. In addition, Arabian Cement also has a contract with NLsupervision, a worldwide fast growing firm, for the technical management, operation and maintenance services of the plant. The below chart represents company historical and forecasted margins
EBITDA margin sharply declined in 2013 mainly due to the increase in energy costs. In 2015 after implementation of energy tran-sition to coal and RDF, this would result in a lower energy cost as highlighted earlier in the energy mix. Therefore, Gross Margin would be higher and reflect positively in EBITDA and NP margins. NPM during 2011 was negatively affected by non-recurring deferred tax-expenses which represented 11% of 2011’s company reve-nue. Forecasted NPM are expected to increase due to the repayment of debt which will result in lower interest expense coupled with above mentioned energy transition. Debt is expected to gradually decrease as the company invested heavily in Capex in 2011 till 2014 which included investment in clinker’s second line, second line operating license, construction of clinker mill, and eventually coal and RDF lines. Therefore, going forward we expect no major capital expenditure expect for the regular maintenance expenditure. Dividends payout with no longer need for Capex investment to be financed through internal and external finance, we expect the firm to adapt a generous dividends payout policy.
0%
5%
10%
15%
20%
25%
30%
35%
40%
45%
50%
0
500
1000
1500
2000
2500
3000
3500
4000
2011a 2012a 2013a 2014e 2015f 2016f 2017f 2018f 2019f
Revenue GPM EBITDA margin NI margin
Prime Research 11
Arabian Cement Co. (ARCC.CA)
Initiation of Coverage
Egypt | Building Materials
February 26, 2015
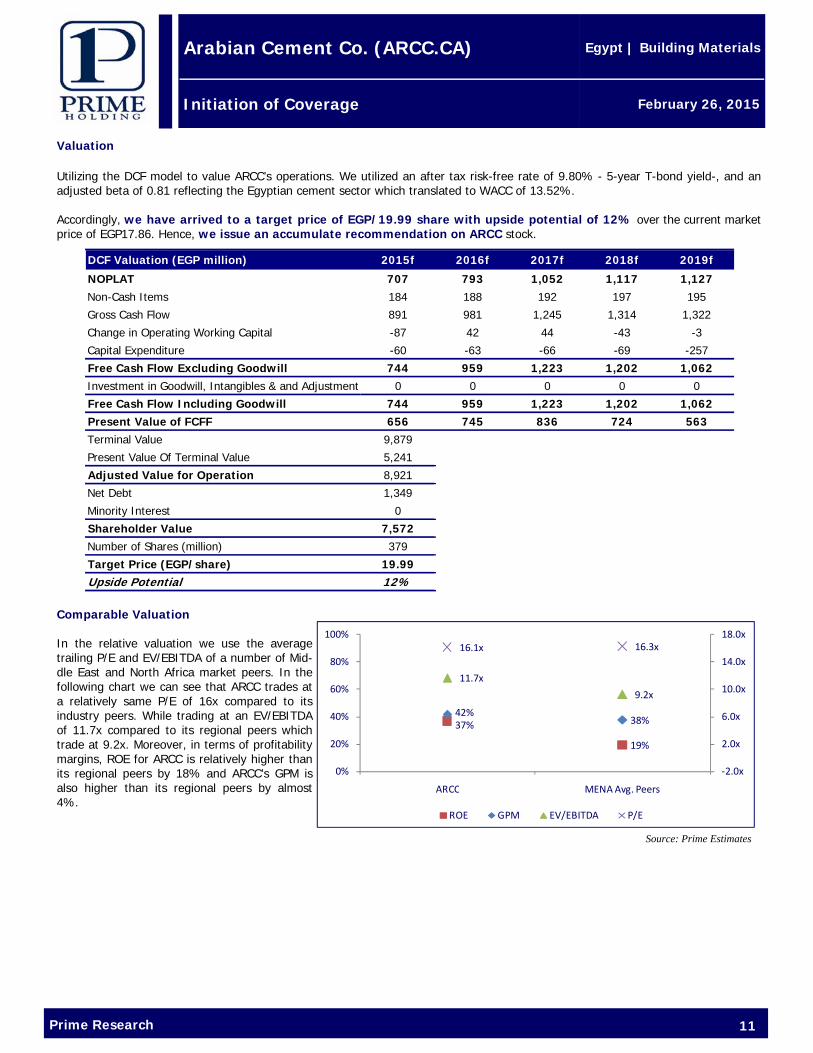
Valuation Utilizing the DCF model to value ARCC’s operations. We utilized an after tax risk-free rate of 9.80% - 5-year T-bond yield-, and an adjusted beta of 0.81 reflecting the Egyptian cement sector which translated to WACC of 13.52%. Accordingly, we have arrived to a target price of EGP/19.99 share with upside potential of 12% over the current market price of EGP17.86. Hence, we issue an accumulate recommendation on ARCC stock.
Comparable Valuation In the relative valuation we use the average trailing P/E and EV/EBITDA of a number of Mid-dle East and North Africa market peers. In the following chart we can see that ARCC trades at a relatively same P/E of 16x compared to its industry peers. While trading at an EV/EBITDA of 11.7x compared to its regional peers which trade at 9.2x. Moreover, in terms of profitability margins, ROE for ARCC is relatively higher than its regional peers by 18% and ARCC’s GPM is also higher than its regional peers by almost 4%.
Source: Prime Estimates
DCF Valuation (EGP million) 2015f 2016f 2017f 2018f 2019f
NOPLAT 707 793 1,052 1,117 1,127Non-Cash Items 184 188 192 197 195
Gross Cash Flow 891 981 1,245 1,314 1,322
Change in Operating Working Capital -87 42 44 -43 -3
Capital Expenditure -60 -63 -66 -69 -257
Free Cash Flow Excluding Goodwill 744 959 1,223 1,202 1,062Investment in Goodwill, Intangibles & and Adjustment 0 0 0 0 0
Free Cash Flow Including Goodwill 744 959 1,223 1,202 1,062Present Value of FCFF 656 745 836 724 563Terminal Value 9,879
Present Value Of Terminal Value 5,241
Adjusted Value for Operation 8,921
Net Debt 1,349
Minority Interest 0
Shareholder Value 7,572Number of Shares (million) 379
Target Price (EGP/share) 19.99Upside Potential 12%
37%
19%
42%38%
11.7x
9.2x
16.1x 16.3x
‐2.0x
2.0x
6.0x
10.0x
14.0x
18.0x
0%
20%
40%
60%
80%
100%
ARCC MENA Avg. Peers
ROE GPM EV/EBITDA P/E
Prime Research 12
Arabian Cement Co. (ARCC.CA)
Initiation of Coverage
Egypt | Building Materials
February 26, 2015
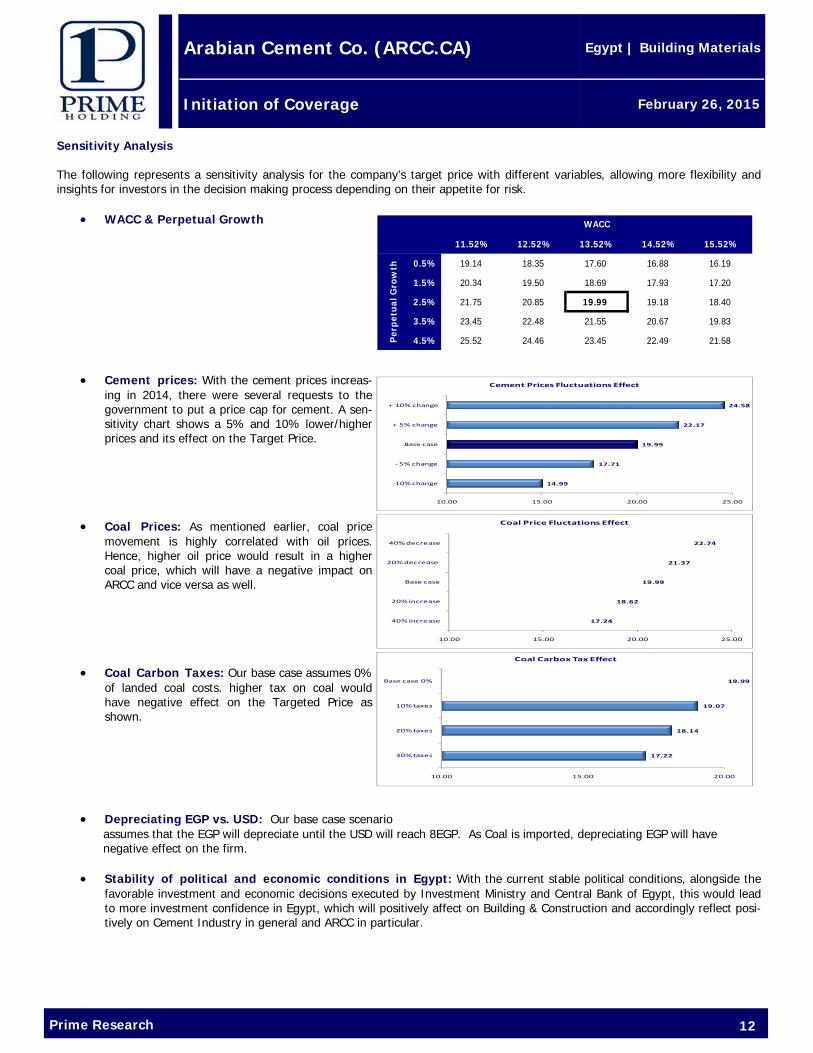
Sensitivity Analysis The following represents a sensitivity analysis for the company’s target price with different variables, allowing more flexibility and insights for investors in the decision making process depending on their appetite for risk.
• WACC & Perpetual Growth
• Cement prices: With the cement prices increas-ing in 2014, there were several requests to the government to put a price cap for cement. A sen-sitivity chart shows a 5% and 10% lower/higher prices and its effect on the Target Price.
• Coal Prices: As mentioned earlier, coal price
movement is highly correlated with oil prices. Hence, higher oil price would result in a higher coal price, which will have a negative impact on ARCC and vice versa as well.
• Coal Carbon Taxes: Our base case assumes 0%
of landed coal costs. higher tax on coal would have negative effect on the Targeted Price as shown.
• Depreciating EGP vs. USD: Our base case scenario assumes that the EGP will depreciate until the USD will reach 8EGP. As Coal is imported, depreciating EGP will have negative effect on the firm. • Stability of political and economic conditions in Egypt: With the current stable political conditions, alongside the
favorable investment and economic decisions executed by Investment Ministry and Central Bank of Egypt, this would lead to more investment confidence in Egypt, which will positively affect on Building & Construction and accordingly reflect posi-tively on Cement Industry in general and ARCC in particular.
11.52% 12.52% 13.52% 14.52% 15.52%
0.5% 19.14 18.35 17.60 16.88 16.19
1.5% 20.34 19.50 18.69 17.93 17.20
2.5% 21.75 20.85 19.99 19.18 18.40
3.5% 23.45 22.48 21.55 20.67 19.83
4.5% 25.52 24.46 23.45 22.49 21.58
WACC
Per
pet
ual
Gro
wth
14.99
17.71
19.99
22.17
24.58
10.00 15.00 20.00 25.00
‐10% change
‐ 5% change
Base case
+ 5% change
+ 10% change
Cement Prices Fluctuations Effect
17.24
18.62
19.99
21.37
22.74
10.00 15.00 20.00 25.00
40% increase
20% increase
Base case
20% decrease
40% decrease
Coal Price Fluctations Effect
17.22
18.14
19.07
19.99
10.00 15.00 20.00
30% taxes
20% taxes
10% taxes
Base case 0%
Coal Carbox Tax Effect
Prime Research 13
Arabian Cement Co. (ARCC.CA)
Initiation of Coverage
Egypt | Building Materials
February 26, 2015
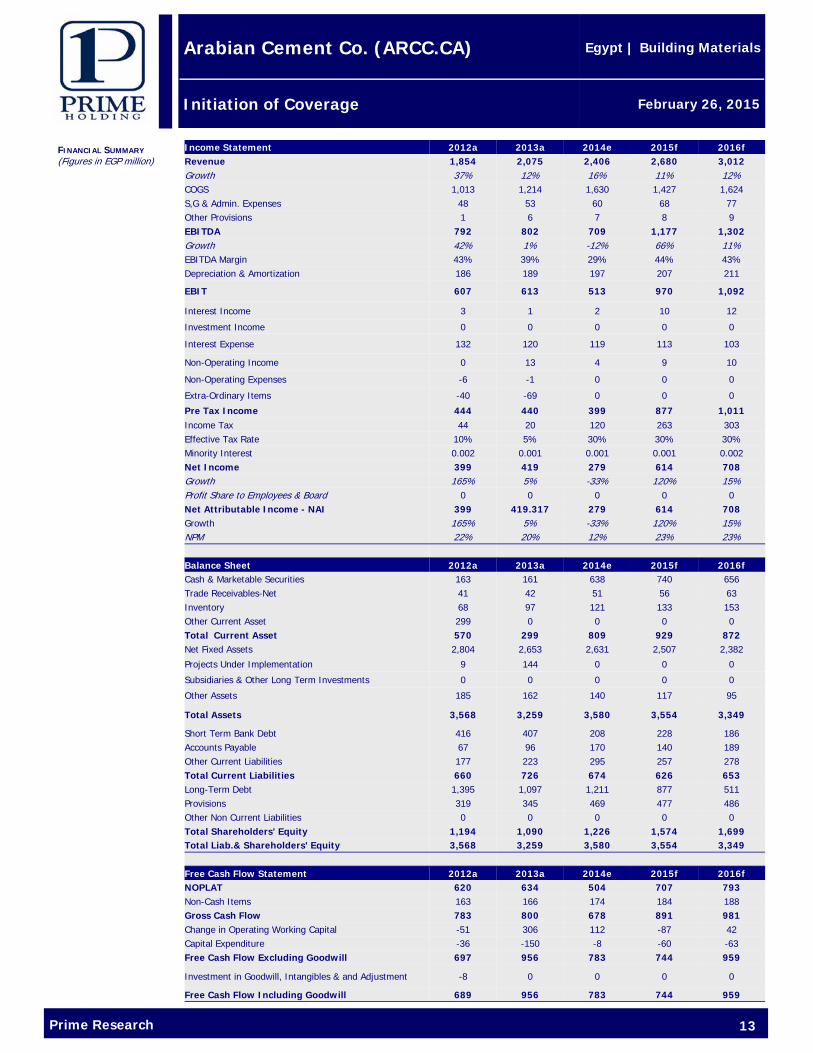
FINANCIAL SUMMARY (Figures in EGP million))
Income Statement 2012a 2013a 2014e 2015f 2016f Revenue 1,854 2,075 2,406 2,680 3,012 Growth 37% 12% 16% 11% 12% COGS 1,013 1,214 1,630 1,427 1,624 S,G & Admin. Expenses 48 53 60 68 77 Other Provisions 1 6 7 8 9 EBITDA 792 802 709 1,177 1,302 Growth 42% 1% -12% 66% 11% EBITDA Margin 43% 39% 29% 44% 43% Depreciation & Amortization 186 189 197 207 211
EBIT 607 613 513 970 1,092
Interest Income 3 1 2 10 12
Investment Income 0 0 0 0 0
Interest Expense 132 120 119 113 103
Non-Operating Income 0 13 4 9 10
Non-Operating Expenses -6 -1 0 0 0
Extra-Ordinary Items -40 -69 0 0 0
Pre Tax Income 444 440 399 877 1,011 Income Tax 44 20 120 263 303 Effective Tax Rate 10% 5% 30% 30% 30% Minority Interest 0.002 0.001 0.001 0.001 0.002 Net Income 399 419 279 614 708 Growth 165% 5% -33% 120% 15% Profit Share to Employees & Board 0 0 0 0 0 Net Attributable Income - NAI 399 419.317 279 614 708 Growth 165% 5% -33% 120% 15% NPM 22% 20% 12% 23% 23% Balance Sheet 2012a 2013a 2014e 2015f 2016f Cash & Marketable Securities 163 161 638 740 656 Trade Receivables-Net 41 42 51 56 63 Inventory 68 97 121 133 153 Other Current Asset 299 0 0 0 0 Total Current Asset 570 299 809 929 872 Net Fixed Assets 2,804 2,653 2,631 2,507 2,382
Projects Under Implementation 9 144 0 0 0
Subsidiaries & Other Long Term Investments 0 0 0 0 0
Other Assets 185 162 140 117 95
Total Assets 3,568 3,259 3,580 3,554 3,349
Short Term Bank Debt 416 407 208 228 186 Accounts Payable 67 96 170 140 189 Other Current Liabilities 177 223 295 257 278 Total Current Liabilities 660 726 674 626 653 Long-Term Debt 1,395 1,097 1,211 877 511 Provisions 319 345 469 477 486 Other Non Current Liabilities 0 0 0 0 0 Total Shareholders' Equity 1,194 1,090 1,226 1,574 1,699 Total Liab.& Shareholders' Equity 3,568 3,259 3,580 3,554 3,349 Free Cash Flow Statement 2012a 2013a 2014e 2015f 2016f NOPLAT 620 634 504 707 793 Non-Cash Items 163 166 174 184 188 Gross Cash Flow 783 800 678 891 981 Change in Operating Working Capital -51 306 112 -87 42 Capital Expenditure -36 -150 -8 -60 -63 Free Cash Flow Excluding Goodwill 697 956 783 744 959
Investment in Goodwill, Intangibles & and Adjustment -8 0 0 0 0
Free Cash Flow Including Goodwill 689 956 783 744 959
Prime Research 14
Arabian Cement Co. (ARCC.CA)
Initiation of Coverage
Egypt | Building Materials
February 26, 2015
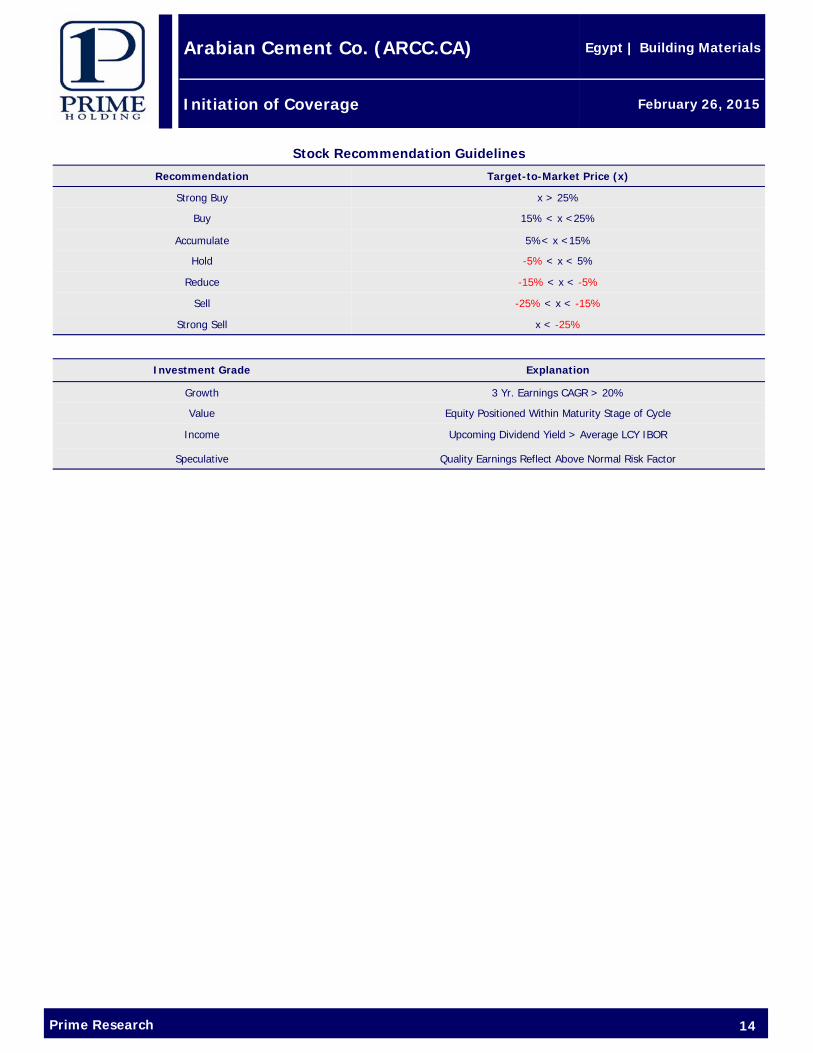
Recommendation Target-to-Market Price (x)
Strong Buy x > 25%
Buy 15% < x <25%
Accumulate 5%< x <15%
Hold -5% < x < 5%
Reduce -15% < x < -5%
Strong Sell x < -25%
Stock Recommendation Guidelines
Sell -25% < x < -15%
Investment Grade Explanation
Growth 3 Yr. Earnings CAGR > 20%
Value Equity Positioned Within Maturity Stage of Cycle
Income Upcoming Dividend Yield > Average LCY IBOR
Speculative Quality Earnings Reflect Above Normal Risk Factor
Prime Research 15
Arabian Cement Co. (ARCC.CA)
Initiation of Coverage
Egypt | Building Materials
February 26, 2015
HEAD OFFICE PRIME SECURITIES S.A.E. Regulated by CMA license no. 179 Members of the Cairo Stock Exchange 2 Wadi El Nil St., Liberty Tower, 7th-8th Floor, Mohandessin, Giza, Egypt Tel: +202 33005700/770/650/649 Fax: +202 3760 7543
PRIME EMIRATES LLC. (UAE) Arjan building -Defense road, Abu Dhabi – UAE TEL: +97155 - 3214567
PRIME SALES TEAM
Hassan Samir Managing Director +202 3300 5611 [email protected]
Mohamed Ezzat Head of Sales & Branches +202 3300 5784 [email protected]
Shawkat Raslan Heliopolis Branch Manager +202 3300 5110 [email protected]
Mohamed Higazy Manager – Institutions Desk +202 3300 5621 [email protected]
Amr Alaa, CFTe Manager +202 3300 5609 [email protected]
Mohamed Elmetwaly Manager +202 3300 5610 [email protected]
Emad Elsafoury Manager +202 3300 5624 [email protected]
RESEARCH TEAM
[email protected] +202 3300 5728
Disclaimer Information included in this report has no regard to specific investment objectives, financial situation, advices or particular needs of the report users. The report is published for information purposes only and is not to be construed as a solicitation or an offer to buy or sell any securities or related financial instruments. Unless specifically stated otherwise, all price information is only considered as indicator.
No express or implied representation or guarantee is provided with respect to completeness, accuracy or reliability of information included in this report.
Past performance is not necessarily an indication of future results. Fluctuation of foreign currency rates of exchange may adversely affect the value, price or income of any products mentioned in this report.
Information included in this report should not be regarded by report users as a substitute for the exercise of their own due diligence and analysis based on own assessment and judgment criteria. Any opinions given are subject to change without notice and may significantly differ or be contrary to opinions expressed by other Prime business areas as a result of using different assumptions and criteria. Prime Group is under no obligation responsible to update or keep current the information contained herein.
Prime Group, its directors, officers, employees or clients may have or have had interests or long or short positions in the securities and/or currencies referred to herein, and may at any time make purchases and/or sales in them as principal or agent.
Prime Group, its related entities, directors, employees and agents accepts no liability whatsoever for any loss or damage of any kind arising from the use of all or part of these information included in this report. Certain laws and regulations impose liabilities which cannot be disclaimed. This dis-claimer shall, in no way, constitute a waiver or limitation of any rights a person may have under such laws and/or regulations.
Furthermore, Prime Group or any of the group companies may have or have had a relationship with or may provide or have provided other ser-vices, within its objectives to the relevant companies. Prime Group 2015 all rights reserved. You are hereby notified that distribution and copying of this document is strictly prohibited without the prior approval of Prime Group.