
Gaussian Mixture Models with Constrained Flexibility for ...
6
Gaussian Mixture Models with Constrained Flexibility for Fiing Tomographic Tilt Series Kasra Manavi University of New Mexico Albuquerque, New Mexico 87131 [email protected] Sahba Tashakkori University of New Mexico Albuquerque, New Mexico 87131 [email protected] Lydia Tapia University of New Mexico Albuquerque, New Mexico 87131 [email protected] ABSTRACT Electron Microscopy (EM) has become an invaluable part of modern structural biology. As the limits of EM techniques are explored, issues arise with model reconstruction and fitting, especially at resolutions lower than 10 Å where structural detail is lost. In this paper, we introduce methods to model and fit molecular structures into low resolution EM datasets (20-40 Å resolution). First, we use Gaussian Mixture Models (GMMs) to describe molecular systems with high flexibility and enable efficient conformation sampling. Then, GMM parameters are optimized to best describe the model molecular structure. Finally, these GMMs are placed into a fitting procedure to generate a conformation of the GMM that fits an input set of tilt series tomograms, a set of 2D images of a 3D molecule taken at a variety of angles. We evaluate our method by fitting a model of the IgE-Fcϵ RI complex to a variety of simulated single tilt axis datasets. This work was done in preparation for analysis of larger aggregate structures of IgE. KEYWORDS Molecular Structural Biology; Flexible Fitting; EM Tomography 1 INTRODUCTION Fitting a known structure to experimentally imaged molecules is critical to understanding molecular conformations. One such tool to image molecules, Electron Microscopy (EM), has become an essen- tial part of understanding cellular function [13]. EM is performed by preparing a sample and placing it into an electron microscope. The microscope produces an image (tomogram) of the sample. A tomogram can be thought of as a 2D image of a 3D object where the intensity of the image pixel is proportional to the density of the 3D object. Electron Tomography (ET) is a technique that utilizes a series of EM tomograms to produce a 3D reconstruction of the molecular structure. Tomograms of a sample are captured from a variety of angles and are then combined to produce a 3D density map. These tomograms can be collected in an ordered fashion (e.g., single/dual axis tilt series) or an unordered fashion (e.g., single mol- ecule imaged in solution). EM and ET are becoming cornerstones of modern structural biology research, but several challenges remain, including model fitting and reconstruction evaluation [9]. Permission to make digital or hard copies of all or part of this work for personal or classroom use is granted without fee provided that copies are not made or distributed for profit or commercial advantage and that copies bear this notice and the full citation on the first page. Copyrights for components of this work owned by others than ACM must be honored. Abstracting with credit is permitted. To copy otherwise, or republish, to post on servers or to redistribute to lists, requires prior specific permission and/or a fee. Request permissions from [email protected]. ACMBCB ’17, August 2017, Boston, MA, USA © 2017 Association for Computing Machinery. ACM ISBN 978-1-4503-4722-8/17/08. . . $15.00 https://doi.org/10.1145/3107411.3107504 Depending on the type of sample, density map reconstruction can be challenging. This step, required before an atomic model can be fit, can suffer from issues including distortions in tomogram alignment and the missing wedge problem [15]. Distortions in alignment occur when the tomograms of a dataset are clustered and aligned to produce an averaged tomogram from a given perspective. The quality of the clustering/alignment results are highly dependent on the size of the input dataset and tomogram quality. The missing wedge problem occurs during reconstruction of a tilt series, a set of projections captured by rotating the sample about an axis. If the angle range is narrow, portions of the sample are not imaged, resulting in a loss of information that elongate reconstructions. In addition to the challenge of reconstruction, fitting structural models, typically all-atom structures, to reconstructed density maps can be difficult. Resolution of a density map is important to the type of fitting technique used. At high resolution (< 10 Å), all-atom fitting techniques work well, but lower resolutions (20-40 Å) still pose a challenge to existing methods due to a lack of detail [26]. This is particularly true for larger asymmetric molecular systems that are typically imaged at lower resolutions. In order to address both the issues of reconstruction quality and fitting at lower resolutions, we propose a method that uses a flex- ible reduced-resolution molecular model for fitting directly to a series of tomograms. These tomograms depict images of a static molecular structure at a series of angles which can be efficiently fit with our GMM by comparing projections of our reduced-resolution molecular model at corresponding angles of the tomograms. In order to represent flexibility of the model that may exist in the imaged molecule, we use a multi-body GMM with constrained flex- ible joints. GMM fit evaluation is performed against all tomograms in the dataset, thus enabling evaluation of a conformation of the GMM against experimental data. While this method does not di- rectly provide all-atom structures, it provides a quick assessment of the imaged molecule and the reasonableness of the conformation. Our motivation for this approach is determination of structures of large molecular assemblies, specifically antibody/antigen aggre- gates critical to the understanding of the human allergic immune response. As a first step toward this goal, we focus on one compo- nent of these assemblies, the large antibody complex (IgE-Fcϵ RI). These molecules are potentially highly dynamic, so we are inspired by static images such as datasets captured via Cryo EM where sam- ples are flash frozen before imaging. To evaluate our construction procedure, we generate a GMM of IgE-Fcϵ RI and assess how well the GMM can model a variety of datasets by optimizing parameters of the GMM. We then evaluate our fitting technique by generating a set of IgE-Fcϵ RI conformations under a variety of conditions and attempting to fit them to the known native conformation. We show that our GMM is flexible enough to model a variety of datasets and is capable of fitting tilt series data. Computational Structural Bioinformatics Workshop (CSBW) ACM-BCB’17, August 20–23, 2017, Boston, MA, USA 710
Transcript of Gaussian Mixture Models with Constrained Flexibility for ...
Gaussian Mixture Models with Constrained Flexibility forFitting Tomographic Tilt Series
Kasra ManaviUniversity of New Mexico
Albuquerque, New Mexico [email protected]
Sahba TashakkoriUniversity of New Mexico
Albuquerque, New Mexico [email protected]
Lydia TapiaUniversity of New Mexico
Albuquerque, New Mexico [email protected]
ABSTRACTElectronMicroscopy (EM) has become an invaluable part of modernstructural biology. As the limits of EM techniques are explored,issues arise with model reconstruction and fitting, especially atresolutions lower than 10 Å where structural detail is lost. In thispaper, we introduce methods to model and fit molecular structuresinto low resolution EM datasets (20-40 Å resolution). First, we useGaussian Mixture Models (GMMs) to describe molecular systemswith high flexibility and enable efficient conformation sampling.Then, GMM parameters are optimized to best describe the modelmolecular structure. Finally, these GMMs are placed into a fittingprocedure to generate a conformation of the GMM that fits an inputset of tilt series tomograms, a set of 2D images of a 3D moleculetaken at a variety of angles. We evaluate our method by fitting amodel of the IgE-FcϵRI complex to a variety of simulated single tiltaxis datasets. This work was done in preparation for analysis oflarger aggregate structures of IgE.
KEYWORDSMolecular Structural Biology; Flexible Fitting; EM Tomography
1 INTRODUCTIONFitting a known structure to experimentally imaged molecules iscritical to understanding molecular conformations. One such tool toimage molecules, Electron Microscopy (EM), has become an essen-tial part of understanding cellular function [13]. EM is performedby preparing a sample and placing it into an electron microscope.The microscope produces an image (tomogram) of the sample. Atomogram can be thought of as a 2D image of a 3D object wherethe intensity of the image pixel is proportional to the density of the3D object. Electron Tomography (ET) is a technique that utilizesa series of EM tomograms to produce a 3D reconstruction of themolecular structure. Tomograms of a sample are captured from avariety of angles and are then combined to produce a 3D densitymap. These tomograms can be collected in an ordered fashion (e.g.,single/dual axis tilt series) or an unordered fashion (e.g., single mol-ecule imaged in solution). EM and ET are becoming cornerstones ofmodern structural biology research, but several challenges remain,including model fitting and reconstruction evaluation [9].
Permission to make digital or hard copies of all or part of this work for personal orclassroom use is granted without fee provided that copies are not made or distributedfor profit or commercial advantage and that copies bear this notice and the full citationon the first page. Copyrights for components of this work owned by others than ACMmust be honored. Abstracting with credit is permitted. To copy otherwise, or republish,to post on servers or to redistribute to lists, requires prior specific permission and/or afee. Request permissions from [email protected] ’17, August 2017, Boston, MA, USA© 2017 Association for Computing Machinery.ACM ISBN 978-1-4503-4722-8/17/08. . . $15.00https://doi.org/10.1145/3107411.3107504
Depending on the type of sample, densitymap reconstruction canbe challenging. This step, required before an atomic model can be fit,can suffer from issues including distortions in tomogram alignmentand the missing wedge problem [15]. Distortions in alignmentoccur when the tomograms of a dataset are clustered and alignedto produce an averaged tomogram from a given perspective. Thequality of the clustering/alignment results are highly dependenton the size of the input dataset and tomogram quality. The missingwedge problem occurs during reconstruction of a tilt series, a setof projections captured by rotating the sample about an axis. Ifthe angle range is narrow, portions of the sample are not imaged,resulting in a loss of information that elongate reconstructions.
In addition to the challenge of reconstruction, fitting structuralmodels, typically all-atom structures, to reconstructed density mapscan be difficult. Resolution of a density map is important to thetype of fitting technique used. At high resolution (< 10 Å), all-atomfitting techniques work well, but lower resolutions (20-40 Å) stillpose a challenge to existing methods due to a lack of detail [26].This is particularly true for larger asymmetric molecular systemsthat are typically imaged at lower resolutions.
In order to address both the issues of reconstruction quality andfitting at lower resolutions, we propose a method that uses a flex-ible reduced-resolution molecular model for fitting directly to aseries of tomograms. These tomograms depict images of a staticmolecular structure at a series of angles which can be efficiently fitwith our GMM by comparing projections of our reduced-resolutionmolecular model at corresponding angles of the tomograms. Inorder to represent flexibility of the model that may exist in theimaged molecule, we use a multi-body GMM with constrained flex-ible joints. GMM fit evaluation is performed against all tomogramsin the dataset, thus enabling evaluation of a conformation of theGMM against experimental data. While this method does not di-rectly provide all-atom structures, it provides a quick assessment ofthe imaged molecule and the reasonableness of the conformation.
Our motivation for this approach is determination of structuresof large molecular assemblies, specifically antibody/antigen aggre-gates critical to the understanding of the human allergic immuneresponse. As a first step toward this goal, we focus on one compo-nent of these assemblies, the large antibody complex (IgE-FcϵRI).These molecules are potentially highly dynamic, so we are inspiredby static images such as datasets captured via Cryo EM where sam-ples are flash frozen before imaging. To evaluate our constructionprocedure, we generate a GMM of IgE-FcϵRI and assess how wellthe GMM can model a variety of datasets by optimizing parametersof the GMM. We then evaluate our fitting technique by generatinga set of IgE-FcϵRI conformations under a variety of conditions andattempting to fit them to the known native conformation. We showthat our GMM is flexible enough to model a variety of datasets andis capable of fitting tilt series data.
Computational Structural Bioinformatics Workshop (CSBW) ACM-BCB’17, August 20–23, 2017, Boston, MA, USA
710
2 RELATEDWORKProjection Matching. Several computational geometry methodshave been used to model volumes from projection information andvice versa [2, 17, 19, 27]. For example, the optimal packing/coveringproblems have been solved using Phi-functions which were devel-oped to evaluate the interaction of geometric objects [2]. Anotherexample is shadow art, the idea of occluding light from a sourceto produce an image. One such method uses light sources and adesired shadow art as input and produces a sculpture that is capableof generating the scene [17]. This work has been expanded to modelshadow theater where shadow art is generated by the pose of asingle or multiple performance artists [27]. Another similar methodturns 2D silhouettes from different perspectives into 3D models[19].
EM and Structure Determination. Integrating comparativemodeling and EM data to produce atomic models is reviewed in [25].Fitting structures to reconstructed 3D EM data can be broken downinto two main methodologies, rigid and flexible [7]. Most six degreeof freedom rigid fitting is done using methods like geometric tech-niques [4], GMMs [12], or Zernike descriptors [6]. Flexible fittingfocuses on using molecular simulation methods [14, 23], roboticmotion planning techniques [1], as well as statistical techniques[5, 22] to determine candidate conformations. GMMs have beenapplied to other aspects of EM analysis, including reconstructionof single particles imaging [11] and structural dynamic evaluation[10].
Antibody Structure. Antibodies are immunological moleculeswhich identify and target foreign threats to the body. Immunoglob-ulin (Ig) proteins have been determined to be highly flexible andcan form asymmetrical structures [3, 21]. The structures obtainedfrom X-ray diffraction analysis show that IgG is composed of threemajor structural subunits: two identical binding arms (Fab arms)and a membrane bound constant domain [20]. Since antibodies areknown to have very flexible and dynamic structures, populationsof different conformations have been found to co-exist in images[24, 28]. Therefore, commonly used methods such as X-ray crystal-lography, which rely on molecular averaging, often do not reflectprotein dynamics and flexibility [29]. In contrast, EM can be usedto reconstruct unique and independent samples [20].
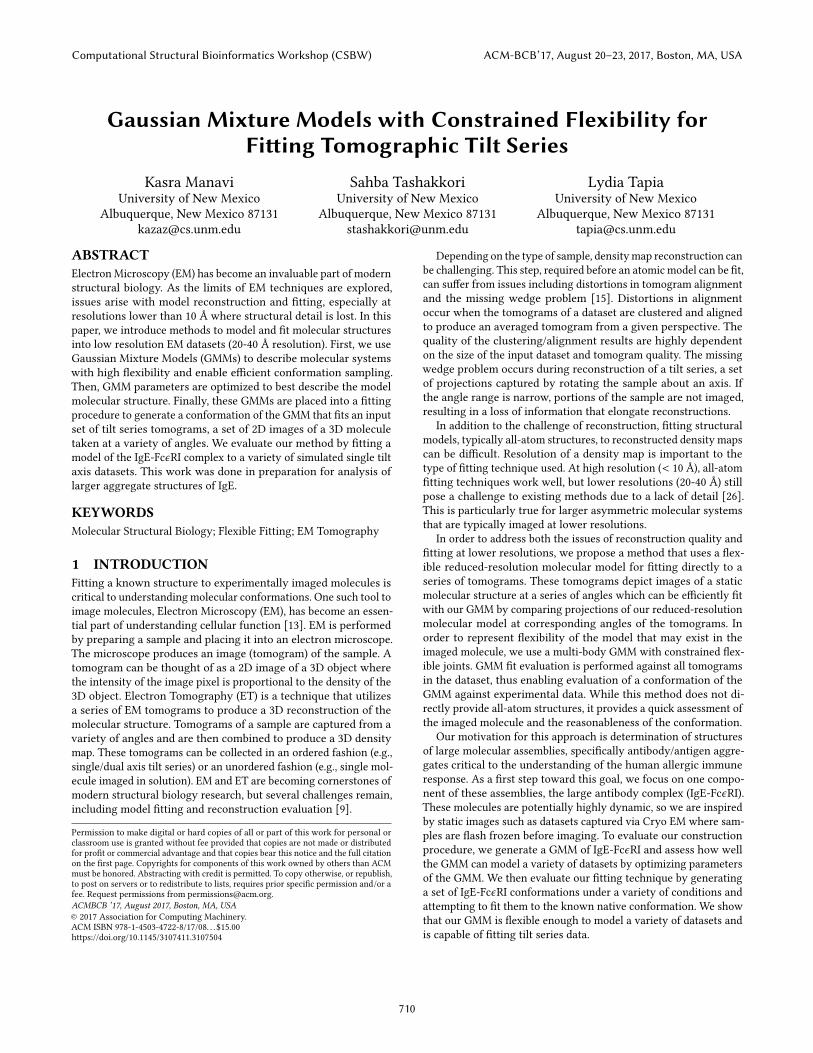
3 METHODSTo generate a semi-flexible reduced resolution model of a molecularsystem, we start with an all-atom molecular structure. This struc-ture is decomposed into rigid subunits, and Principal ComponentAnalysis (PCA) is applied to these subunits to generate a GMM.Flexibility between rigid regions is added, and GMM subunits arerefined to complete the model construction. This process is outlinedin Figure 1. The resulting model is used to fit tomographic tilt series.In this paper, evaluation focuses on the IgE-FcϵRI complex [16].The model was constructed using available PDB structures (1OAU,2VWE, 1O0V, 1F6A) and is composed of 1,709 amino acids (13,477atoms total) [16].
3.1 Model ConstructionTo begin model construction, we identify rigid subunits of themodel by performing rigidity analysis of the all-atom model usingKinari-Web [8]. If a sequence of residues is considered flexible, weidentify the rigid subunits at the termini of the flexible sequence.
Figure 1: Process of taking an all-atomstructure and generat-ing a GMM. First, the atomic model (top left) is decomposedinto rigid subunits (top right). The rigid subunits are thenprocessed using PCA (bottom left). The results of PCA arethen used to construct a GMM (bottom right).
If both ends of the sequence are associated with the same subunit,the sequence is considered a rigid part of that subunit. For our IgEmodel, ten rigid subunits were classified into five regions outlinedin Table 1.
Structural Subunit Chain & Residues RegionFcϵRIα 1 A 5-84 1FcϵRIα 2 A 88-169 1Constant 1 H 256-355, I 256-355 1Constant 2a H 364-462 1Constant 2b I 364-462 1Constant 3 H 469-571, I 469-571 1Fab 1 - C terminal H 151-247, L 140-234 2Fab 1 - N terminal H 21-144, L 26-127 3Fab 2 - C terminal I 151-247, M 140-234 4Fab 2 - N terminal I 21-144, M 26-127 5
Table 1: IgE-FcϵRI subunits calculated from rigidity analysis.A flexible region is considered part of a rigid region if bothends of the region are associated with the same structuralsubunit.
After rigid subunits have been identified, we convert the de-composed subunits into a GMM representation. This is done byperforming PCA on the atom positions of each subunit structureidentified by rigidity analysis decomposition (Figure 1, bottom left).
Computational Structural Bioinformatics Workshop (CSBW) ACM-BCB’17, August 20–23, 2017, Boston, MA, USA
711
If the difference between the lowest and highest eigenvalues of thePCA is high, the subunit is divided. From our data we used a ratio of1.8x or larger as a cutoff for division. For the IgE complex, subunits1 and 2 of FcϵRIα and constant subunits 2a and 2b were split alongtheir principle component.
Using the results of PCA, molecular subunits are converted to aGMM description with Gaussian functions centered at the subunit’smean µ with standard deviation σ set to the square root of thelargest subunit eigenvalue. For each subunit, we include a σ -scalingfactor to compensate for potential differences in model resolution,discussed in Section 3.2. This construction method is applied toall subunits of the IgE complex, resulting in a model composed offourteen Gaussian functions (Figure 1, bottom right).
To capture flexibility that may exist between rigid subunits, weincorporate distance constraints into the GMM. Specifically, dis-tances between GMM subunits that are linked together via non-rigid portions of the protein backbone are maintained. If a flexibleregion is found to connect rigid subunits during rigidity analysis,the α-carbons of the amino acids on both termini of the flexibleregions are stored with their associated GMM subunit. These pointsare evaluated for distance when a new GMM conformation is gen-erated. The distance must be less than n·d , where n is the numberof amino acids in the flexible region and d is the average distancebetween α-carbons. For our IgE-FcϵRI complex model, we use theaverage distance between the α-carbons of the flexible regions.
In the IgE complex, there are six flexible regions that connectmolecular subunits. Each Fab arm is connected to the constant do-main, resulting in two distance constraints. Fab arms are composedof two subunits connected together by two flexible regions, result-ing in two distance constraints per arm. This results in six distanceconstraints total, outlined in Table 2.
Class Subunits Chain & Residues LengthArm Linker Con 1, Fab 1C H 248-255 8Arm Linker Con 1, Fab 2C I 248-255 8Fab Short Fab 1C, Fab 1N H 145-150 6Fab Long Fab 1C, Fab 1N L 128-139 12Fab Short Fab 2C, Fab 2N I 145-150 6Fab Long Fab 2C, Fab 2N M 128-139 12
Table 2: Flexible regions between rigid antibody subunits.Con 1 represents the Constant subunit and Fab subunits arelabeled “Fab XY ”, X being the arm index (1 or 2) and Y beingthe termini (N or C). Length is in number of residues in theflexible region.
3.2 GMM Refinement and FittingIn this section we discuss how we refine GMM parameters to tailorour GMMs to a particular experiment (Algorithm 1).We then outlinehow we minimize GMM conformation to identify a best fit to theprovided EM tilt series (Algorithm 2).
When tomograms and density maps are generated, various levelsof image and post processing are applied to prepare the data forreconstruction/fitting. Depending on the parameterization of theseprocesses, results can differ from experiment to experiment. This
Algorithm 1 GMM Parameter RefinementInput. GMM model cinit , dataset projections P, parameter ranges
R and maximum iteration count itermaxOutput. conformation copt optimized to match P1: ccur ← cinit2: ocur ← EvalOverlap(ccur , P)3: for iter = 0; iter ≤ itermax ; iter++ do4: vcur ← EvalParams(ccur ,R,ocur )5: ccur ← UpdateParams(ccur ,vcur )6: ocur ← EvalOverlap(ccur , P)7: end for8: copt ← ccur
can alter the ability of the GMM to represent the data. In orderto capture these differences, we introduce Algorithm 1 which per-forms parameter refinement, a method that produces a GMM thatis tailored to a particular dataset that can also be used to fit otherdatasets from the same experiment.
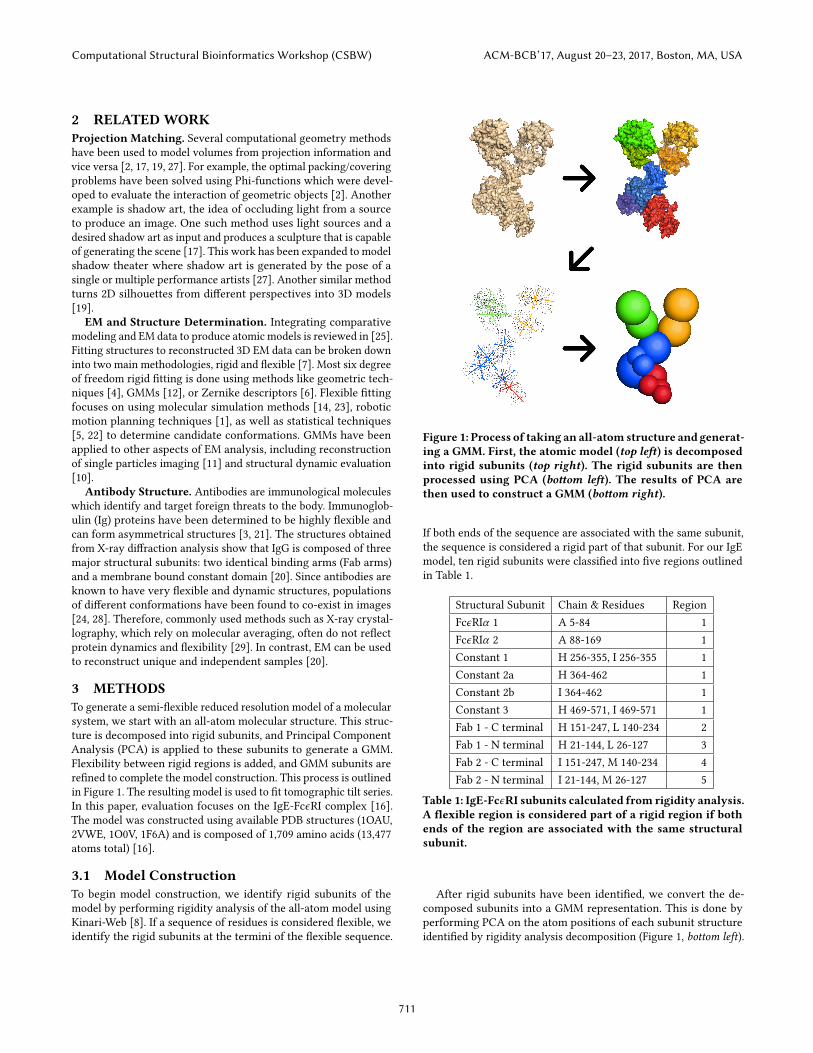
To generate a GMM specific to a given dataset, each parameterof the GMM needs to be optimized (positions and σ -scales) withrespect to the input dataset. Parameter refinement begins with eval-uating the initial GMM quality (line 2). To determine the qualityof the match between a conformation and a dataset, we compareprojections of the GMM and dataset from the same perspective.Projections are generated and compared as seen in Figure 2. Corre-sponding pixel values of the projections are evaluated using the ORand XOR operators. The OR operator provides us with the numberof pixels in the projections occupied by both the GMM (u) and thepart of the dataset visualized as the non-black pixels in the lastrow of Figure 2. The XOR operator provides us with the numberof pixels that are occupied by either GMM or dataset but not both(x ), representing the differences in projections (red and blue pixelsin the last row of Figure 2). The overlap score is the proportion ofpixels that overlap in the union, ((u - x) / u).
Figure 2: Comparison of tilt series to evaluate overlap score.Molecular data (top left) andGMM (bottom left) orthogonallyprojected at angles {-60,0,60} (top/middle rows, right). Projec-tions from the same perspective are overlaid and evaluatedfor OR and XOR (bottom row, right).
Computational Structural Bioinformatics Workshop (CSBW) ACM-BCB’17, August 20–23, 2017, Boston, MA, USA
712

To perform GMM parameter refinement, we use a binary searchscheme over a range of values (R) centered at the initial parametervalues of the input GMM (Cinit ). For each iteration, every parameteris evaluated for overlap score at 3 values, at the upper and lowerbounds of the range and the middle (line 4). The overlap scoresare compared and the parameter values with the highest overlapscores are used to update the saved values and the ranges for thenext iteration (line 5). The process is iterated for a specified numberof times (itermax ), and the resulting GMM parameter values arereturned.
Algorithm 2 GMM conformation FittingInput. GMM model conformation cinit and tilt series projections t,
maximum iteration count itermax , window averaging widthwand local minima detection interval i
Output. conformation cmin that is the best fit of t1: ccur ← cinit2: cbest ← ccur3: socur ← EvalSubOverlap(ccur )4: sobest ← socur5: for iter = 0; iter ≤ itermax ; iter++ do6: cnew ← UpdateGMM(ccur , t)7: IsCollisionFree ← CollisionResolution(Cnew )8: IsDCSatis f ied ← DCSatis f action(cnew )9: if InLocalMin(w, i) then10: ccur ← Resample(cnew )11: else12: if !IsCollisionFree | | !IsDCSatis f ied then13: ccur ← Resample(cnew )14: else15: ccur = cnew16: end if17: end if18: socur = EvalSubOverlap(ccur )19: if EvalNewMax(socur , sobest ) == True then20: cbest = ccur21: sobest ← socur22: end if23: end for
At this point, we have a GMM for fitting a tilt series. Our proce-dure for conformational fitting is described in Algorithm 2. To beginfitting, we start by generating a GMM conformation to fit. Prepa-ration of the initial GMM conformation for minimization can beperformed using a variety of methods including rigid body fitting,user specified conformations, or using a sampling-based methods.For the IgE-FcϵRI-complex, we evaluate the procedure with an anal-ysis of minimizing a wide variety of initial GMM conformations.We evaluate and score the fit of a given conformation directly tothe tilt series by generating projections of our GMM conformationand individual subunits and compare the projections to their tiltseries counterpart (line 3).
The overlap scores of the individual subunits are stored to a listused to monitor minimization progress. For each iteration, we eval-uate changes in overlap score for each subunit. At a given positionalresolution, all subunits are translated each axis in both directions(6 evaluations total) and overlap scores are calculated. If necessary,
i.e., for evaluating a multi-component subunit, orientation is eval-uated in a similar fashion to positions using rotation. The resultsof position and orientation evaluation are used to generate a newconformation cnew (line 6). The new conformation is resolved ofany collisions and evaluated for distance constraint satisfaction.
To avoid getting stuck in local minima, we monitor the progressof the score throughout the minimization process. We do this bycalculating the current average overlap score by averaging the lastwoverlap scores of the minimization. We evaluate progress by addingthe current average overlap score to the list of previously averagedoverlap scores and calculate the differences between consecutiveaverage scores (deltas). If the most recent delta values of the localminima interval, i , are less than or equal to zero, the conformationis considered to be in a local minima (line 9) and is resampled. Forresampling, individual subunit overlap scores are evaluated and theworst performing subunit is resampled. If the new conformation isnot considered in a local minima, the new sample cnew is validated(line 12). If cnew is collision free and satisfies all distance constraints,it is assigned to ccur . If not, the conformation is resampled.
Once a new conformation is generated, ccur is updated andcompared to the current best conformation and is stored if theoverlap score is better (lines 18-21). The best scoring conformationis returned.
4 EXPERIMENTS4.1 GMM Parameter RefinementTo evaluate whether or not our GMM model is robust enough tofit datasets of varying quality, we refine the parameters of ourGMM to a variety of tilt series collected from simulated densitymaps of the native conformation of IgE-FcϵRI. Density maps weregenerated at three resolutions (20, 30, and 40 Å) using the molecularmodeling software Chimera [18]. Density maps are rendered at aspecified isolevel, producing an image of the surface of a densitymap that has been thresholded at the isolevel value. Higher isolevelvalues render surfaces that represent higher density volumes inthe map. For lower isolevel values, the surface is typically largersince the lower threshold results in an increase of volume to render.As mentioned previously, values can vary between density mapsso isolevel values for rendering are evaluated empirically on a perdataset basis. For our evaluation, the maps were rendered at twoisolevel values (0.09 and 0.06), resulting in six datasets.
To generate projections for GMM parameter refinement, werotate our sample molecule along the X and Y axis (dual-axis).Rotations about the X axis were generated over 180◦ in 10◦ intervals(18 angles total). Rotations about the Y axis were generated over360◦ in 10◦ intervals (36 angles total). All combinations of X and Yangle values are evaluated, resulting in a total of 648 projections.
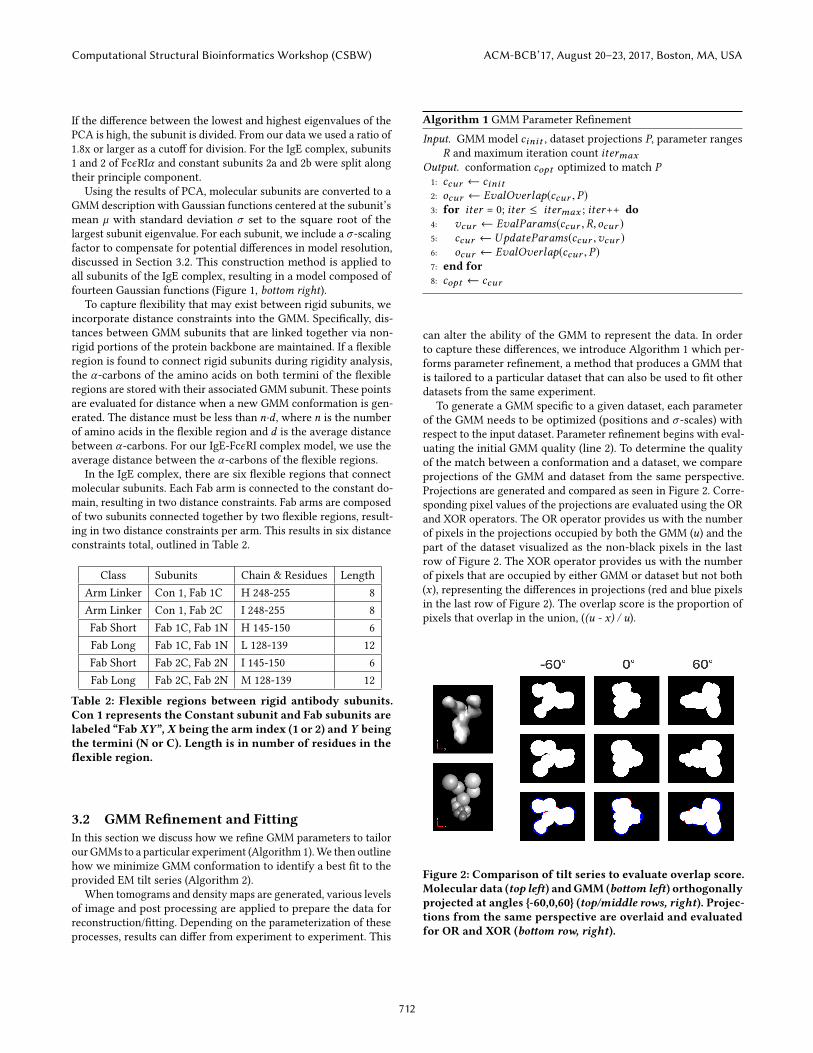
For our experiments, two rounds of ten iterations refinementwere used (Algorithm 1). The first round started with an initial con-formation, and the second started with the results of the first round(Figure 3). We observed that two rounds of refinement providedan exceptional increase in model quality, but more rounds did notsignificantly improve the result.
From the results, GMM is able to model a variety of densitymaps and isosurface values well. Overlap scores of the initial GMMrange from ∼70-85% to the different datasets. After refinement, oursix different datasets all produced GMM parameters with overlapscores between 91% and 95%, Figure 3. This increase in overlap
Computational Structural Bioinformatics Workshop (CSBW) ACM-BCB’17, August 20–23, 2017, Boston, MA, USA
713
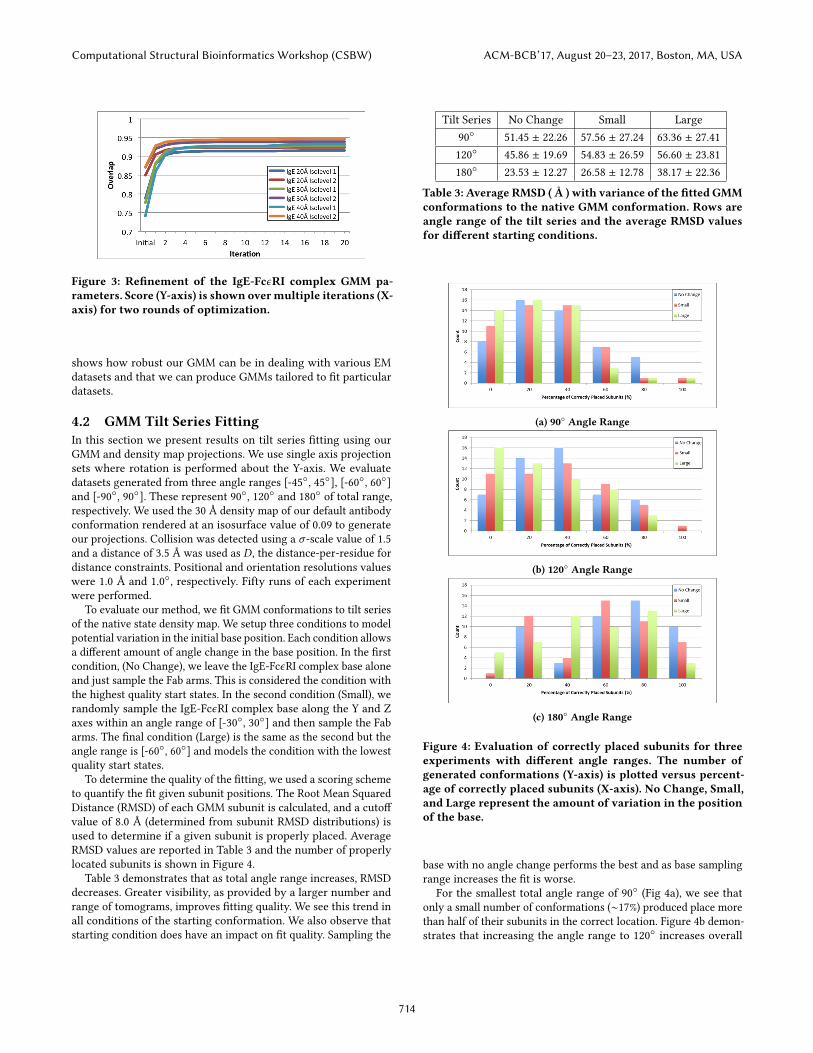
Figure 3: Refinement of the IgE-FcϵRI complex GMM pa-rameters. Score (Y-axis) is shown overmultiple iterations (X-axis) for two rounds of optimization.
shows how robust our GMM can be in dealing with various EMdatasets and that we can produce GMMs tailored to fit particulardatasets.
4.2 GMM Tilt Series FittingIn this section we present results on tilt series fitting using ourGMM and density map projections. We use single axis projectionsets where rotation is performed about the Y-axis. We evaluatedatasets generated from three angle ranges [-45◦, 45◦], [-60◦, 60◦]and [-90◦, 90◦]. These represent 90◦, 120◦ and 180◦ of total range,respectively. We used the 30 Å density map of our default antibodyconformation rendered at an isosurface value of 0.09 to generateour projections. Collision was detected using a σ -scale value of 1.5and a distance of 3.5 Å was used as D, the distance-per-residue fordistance constraints. Positional and orientation resolutions valueswere 1.0 Å and 1.0◦, respectively. Fifty runs of each experimentwere performed.
To evaluate our method, we fit GMM conformations to tilt seriesof the native state density map. We setup three conditions to modelpotential variation in the initial base position. Each condition allowsa different amount of angle change in the base position. In the firstcondition, (No Change), we leave the IgE-FcϵRI complex base aloneand just sample the Fab arms. This is considered the condition withthe highest quality start states. In the second condition (Small), werandomly sample the IgE-FcϵRI complex base along the Y and Zaxes within an angle range of [-30◦, 30◦] and then sample the Fabarms. The final condition (Large) is the same as the second but theangle range is [-60◦, 60◦] and models the condition with the lowestquality start states.
To determine the quality of the fitting, we used a scoring schemeto quantify the fit given subunit positions. The Root Mean SquaredDistance (RMSD) of each GMM subunit is calculated, and a cutoffvalue of 8.0 Å (determined from subunit RMSD distributions) isused to determine if a given subunit is properly placed. AverageRMSD values are reported in Table 3 and the number of properlylocated subunits is shown in Figure 4.
Table 3 demonstrates that as total angle range increases, RMSDdecreases. Greater visibility, as provided by a larger number andrange of tomograms, improves fitting quality. We see this trend inall conditions of the starting conformation. We also observe thatstarting condition does have an impact on fit quality. Sampling the
Tilt Series No Change Small Large90◦ 51.45 ± 22.26 57.56 ± 27.24 63.36 ± 27.41120◦ 45.86 ± 19.69 54.83 ± 26.59 56.60 ± 23.81180◦ 23.53 ± 12.27 26.58 ± 12.78 38.17 ± 22.36
Table 3: Average RMSD ( Å ) with variance of the fitted GMMconformations to the native GMM conformation. Rows areangle range of the tilt series and the average RMSD valuesfor different starting conditions.
(a) 90◦ Angle Range
(b) 120◦ Angle Range
(c) 180◦ Angle Range
Figure 4: Evaluation of correctly placed subunits for threeexperiments with different angle ranges. The number ofgenerated conformations (Y-axis) is plotted versus percent-age of correctly placed subunits (X-axis). No Change, Small,and Large represent the amount of variation in the positionof the base.
base with no angle change performs the best and as base samplingrange increases the fit is worse.
For the smallest total angle range of 90◦ (Fig 4a), we see thatonly a small number of conformations (∼17%) produced place morethan half of their subunits in the correct location. Figure 4b demon-strates that increasing the angle range to 120◦ increases overall
Computational Structural Bioinformatics Workshop (CSBW) ACM-BCB’17, August 20–23, 2017, Boston, MA, USA
714

conformation quality. This is observed in the increase of conforma-tions with correctly placed subunits, where ∼26% of results placedmore than half of the subunits correctly. This trend is continuedin Figure 4c where the largest angle range of 180◦ produces thelargest percentage of correctly positioned conformations (∼64%).Of these correct conformations, about 13% have all subunits in thestructure correctly positioned.
5 DISCUSSION AND CONCLUSIONIn this paper, we presented a method for flexible fitting of GMMmodels to projections from tilt series. We performed this by gener-ating a GMM representation of atomic models of the IgE-FcϵRI com-plex. We showed that our GMM can represent a range of tomogramresolutions. We also showed that the our GMM parameters can berefined to be compatible with a wide array of datasets. We then usedour GMM to fit tilt series projections directly and evaluated ourmethod’s ability to perform flexible fitting. From our fitting results,we are able to see that the minimization scheme we implementedworks better with more information and performs better when theinitial conformation is closer to the conformation described by thetilt series. For future work, our goal is to work with our experimen-tal collaborators who produce cryo EM tilt series and begin fittingtheir datasets.
ACKNOWLEDGMENTSThis work was supported in part by the National Science Founda-tion (NSF) under Grant Numbers IIS-1528047, IIS-1553266 (Tapia,CAREER), and CCF-1518861 and by National Institutes of HealthGrant P50GM085273 to the New Mexico SpatioTemporal ModelingCenter. The authors would like to thank the University of NewMexico Center for Advanced Research Computing for the computa-tional resources they provided, as well as Bridget Wilson and NielsVolkmann for their discussions and input.
REFERENCES[1] Kamal Al Nasr and Jing He. 2009. An Effective Convergence Independent Loop
Closure Method Using Forward Backward Cyclic Coordinate Descent. Interna-tional Journal of Data Mining and Bioinformatics 3, 3 (2009), 346–361.
[2] J. Bennell, G. Scheithauer, Y. Stoyan, and T. Romanova. 2010. Tools of mathemati-cal modeling of arbitrary object packing problems. Annals of Operations Research179, 1 (2010), 343–368.
[3] L Bongini, D Fanelli, F Piazza, P De Los Rios, S Sandin, and U Skoglund. 2005.Dynamics of antibodies from cryo-electron tomography. Biophysical Chemistry115, 2 (2005), 235–240.
[4] Pablo Chacón andWillyWriggers. 2002. Multi-resolution contour-based fitting ofmacromolecular structures. Journal of Molecular Biology 317, 3 (2002), 375–384.
[5] Pilar Cossio and Gerhard Hummer. 2013. Bayesian analysis of individual elec-tron microscopy images: Towards structures of dynamic and heterogeneousbiomolecular assemblies. Journal of Structural Biology 184, 3 (2013), 427 – 437.
[6] Juan Esquivel-Rodríguez and Daisuke Kihara. 2012. Fitting Multimeric ProteinComplexes into Electron Microscopy Maps Using 3D Zernike Descriptors. TheJournal of Physical Chemistry B 116, 23 (2012), 6854–6861.
[7] Juan Esquivel-Rodríguez and Daisuke Kihara. 2013. Computational methodsfor constructing protein structure models from 3D electron microscopy maps.Journal of Structural Biology 184, 1 (2013), 93–102.
[8] Naomi Fox, Filip Jagodzinski, Yang Li, and Ileana Streinu. 2011. KINARI-Web:a server for protein rigidity analysis. Nucleic acids research 39, suppl 2 (2011),W177–W183.
[9] Richard Henderson, Andrej Sali, Matthew L Baker, Bridget Carragher, BatsalDevkota, Kenneth H Downing, Edward H Egelman, Zukang Feng, Joachim Frank,Nikolaus Grigorieff, and others. 2012. Outcome of the first electron microscopyvalidation task force meeting. Structure 20, 2 (2012), 205–214.
[10] Slavica Jonić andCarlos Óscar Sánchez Sorzano. 2016. Coarse-graining of volumesfor modeling of structure and dynamics in electron microscopy: Algorithm toautomatically control accuracy of approximation. IEEE Journal of Selected Topicsin Signal Processing 10, 1 (2016), 161–173.
[11] Paul Joubert and Michael Habeck. 2015. Bayesian inference of initial models incryo-electron microscopy using pseudo-atoms. Biophysical Journal 108, 5 (2015),1165–1175.
[12] Takeshi Kawabata. 2008. Multiple Subunit Fitting into a Low-Resolution DensityMap of a Macromolecular Complex Using a Gaussian Mixture Model. BiophysicalJournal 95, 10 (2008), 4643 – 4658.
[13] Catherine L. Lawson, Matthew L. Baker, Christoph Best, Chunxiao Bi, MatthewDougherty, Powei Feng, Glen van Ginkel, Batsal Devkota, Ingvar Lagerstedt,Steven J. Ludtke, Richard H. Newman, Tom J. Oldfield, Ian Rees, Gaurav Sahni,Raul Sala, Sameer Velankar, Joe Warren, John D. Westbrook, Kim Henrick, Ger-ard J. Kleywegt, HelenM. Berman, andWah Chiu. 2011. EMDataBank.org: unifieddata resource for CryoEM. Nucleic Acids Research 39 (2011), D456 – D464.
[14] Steffen Lindert, Nathan Alexander, Nils Wötzel, Mert Karakaş, Phoebe L. Stew-art, and Jens Meiler. 2012. EM-Fold: De Novo Atomic-Detail Protein StructureDetermination from Medium-Resolution Density Maps. Structure 20, 3 (2012),464 – 478.
[15] Vladan Lučić, Friedrich Förster, and Wolfgang Baumeister. 2005. Structuralstudies by electron tomography: from cells to molecules. Annu. Rev. Biochem. 74(2005), 833–865.
[16] Avanika Mahajan, Dipak Barua, Patrick Cutler, Diane S. Lidke, Flor A. Espinoza,Carolyn Pehlke, Rachel Grattan, Yuko Kawakami, Chang-Shung Tung, AndrewR. M. Bradbury, William S. Hlavacek, and Bridget S. Wilson. 2014. OptimalAggregation of FcϵRI with a Structurally Defined Trivalent Ligand OverridesNegative Regulation Driven by Phosphatases. ACS Chemical Biology 9, 7 (2014),1508–1519.
[17] Niloy J. Mitra and Mark Pauly. 2009. Shadow Art. ACM Trans. Graph. 28, 5 (Dec.2009), 156:1–156:7.
[18] Eric F. Pettersen, Thomas D. Goddard, Conrad C. Huang, Gregory S. Couch,DanielM. Greenblatt, Elaine C.Meng, and Thomas E. Ferrin. 2004. UCSFChimera–A visualization system for exploratory research and analysis. Journal of Compu-tational Chemistry 25, 13 (2004), 1605–1612.
[19] Alec Rivers, Frédo Durand, and Takeo Igarashi. 2010. 3D Modeling with Silhou-ettes. ACM Trans. Graph. 29, 4 (2010), 109:1–109:8.
[20] Sara Sandin, Lars-Göran Öfverstedt, Ann-Charlotte Wikström, Örjan Wrange,and Ulf Skoglund. 2004. Structure and flexibility of individual immunoglobulinG molecules in solution. Structure 12, 3 (2004), 409–415.
[21] Erica Ollmann Saphire, Robyn L Stanfield, MD Max Crispin, Paul WHI Parren,Pauline M Rudd, Raymond A Dwek, Dennis R Burton, and Ian A Wilson. 2002.Contrasting IgG structures reveal extreme asymmetry and flexibility. Journal ofMolecular Biology 319, 1 (2002), 9–18.
[22] Sjors H.W. Scheres. 2012. RELION: Implementation of a Bayesian approach tocryo-EM structure determination. Journal of Structural Biology 180, 3 (2012), 519– 530.
[23] Gunnar F. Schröder, Axel T. Brunger, and Michael Levitt. 2007. CombiningEfficient Conformational Sampling with a Deformable Elastic Network ModelFacilitates Structure Refinement at Low Resolution. Structure 15, 12 (2007), 1630– 1641.
[24] Huimin Tong, Lei Zhang, Allan Kaspar, Matthew J Rames, Liqing Huang, GaryWoodnutt, and Gang Ren. 2013. Peptide-conjugation induced conformationalchanges in human IgG1 observed by optimized negative-staining and individual-particle electron tomography. Scientific Reports 3 (2013), 1089:1–1089:9.
[25] Maya Topf and Andrej Sali. 2005. Combining electron microscopy and compar-ative protein structure modeling. Current Opinion in Structural Biology 15, 5(2005), 578 – 585.
[26] Elizabeth Villa and Keren Lasker. 2014. Finding the right fit: chiseling structuresout of cryo-electron microscopy maps. Current Opinion in Structural Biology 25(2014), 118–125.
[27] JungdamWon and Jehee Lee. 2016. Shadow Theatre: Discovering Human Motionfrom a Sequence of Silhouettes. ACMTrans. Graph. 35, 4 (July 2016), 147:1–147:12.
[28] Lei Zhang and Gang Ren. 2012. IPET and FETR: Experimental Approach forStudying Molecular Structure Dynamics by Cryo-Electron Tomography of aSingle-Molecule Structure. PLOS ONE 7, 1 (2012), 1–19.
[29] Xing Zhang, Lei Zhang, Huimin Tong, Bo Peng, Matthew J Rames, ShengliZhang, and Gang Ren. 2015. 3D structural fluctuation of IgG1 antibody revealedby individual particle electron tomography. Scientific Reports 5 (2015), 9803:1–9803:13.
Computational Structural Bioinformatics Workshop (CSBW) ACM-BCB’17, August 20–23, 2017, Boston, MA, USA
715