GAP 709 Master Document - ISRM · 2011-10-27 · measured in the stope at 1 m from the pillar ........
59
R O C K B E H A V I O U R O F T H E B U S H V E L D M E R E N S K Y R E E F A N D T H E D E S I G N O F C R U S H P I L L A R S Prepared by: Bryan Philip Watson PhD For: ISRM Secretary General In consideration for the Rocha Medal November 2010
Transcript of GAP 709 Master Document - ISRM · 2011-10-27 · measured in the stope at 1 m from the pillar ........

R O C K B E H A V I O U R O F T H E B U S H V E L D M E R E N S K Y R E E F A N D T H E D E S I G N O F C R U S H
P I L L A R S
Prepared by:
Bryan Philip Watson PhD
For:
ISRM Secretary General In consideration for the Rocha Medal
November 2010

ii
Executive summary
Design of pillars on the tabular Merensky and UG2 reefs is empirical using
experience and strength formulae derived for other ore bodies. The consequence
of this uncertain methodology is to cut oversize pillars, which lowers the
extraction ratio. In addition, pillars cut in the deeper levels (>600 m) are required
to fail in a stable manner during or soon after being cut. These pillars are known
as crush pillars and their residual strengths provide the required support
resistance to prevent stope backbreaks or collapses. A recent series of pillar
bursts, as a result of the pillars not fracturing and crushing at the stope face, has
had serious consequences, and raised questions about the design of these
pillars.
The aim of this research was to provide a proper design procedure for Merensky
reef crush pillars, based primarily on underground measurements. The interaction
between pillars and the rock mass was elucidated by literature studies, laboratory
testing and numerical modelling. Three sites with different geotechnical
conditions were selected. Nonlinear rock behaviour was measured at one of the
sites. The nonlinear behaviour also occurred in laboratory tests on samples
extracted from high stress conditions at the other sites, but the rock mass was
not nonlinear at these sites. A methodology for determining stress from strain
measured in nonlinear rock was established.
The research also established that there is an approximately linear relationship
between peak pillar strength and w/h ratio at ratios between about 1.2 and 8. The
so called „squat‟ effect is not observed because pillar failure is not contained
within the pillar but extends into the foundations. A linear peak pillar strength
formula was established from back analyses of underground pillar failures and
was confirmed by numerical modelling. Pillar behaviour was established from
underground measurements on one stability pillar and six crush pillars, on which
peak and residual strengths were determined. Also, stable and unstable loading
conditions were established from an analysis of pillar bursts and the minimum
strata stiffness for stable pillar failure was determined. This stiffness is only
achieved near the advancing face and pillars that fail in the back areas are likely
iii
to burst. For this reason, crush pillar design needs to include the peak strength as
large pillars may be too strong and fail in the back area. The residual strength
also needs to be considered as the load-bearing capacity of these pillars needs
to satisfy the criterion of 1 MPa across the stope to prevent back-breaks. This
translates into a pillar stress of about 10 MPa if the pillar lines are spaced 30 m
apart. The peak and residual requirements have been included in a design chart,
and the relationship between w/h ratio and residual strength is provided in a
graph for easy design.
The research has contributed to the South African platinum industry by providing
guidelines for Merensky crush pillar design (based on underground
measurements), which was not previously available. Proper implementation of
the guidelines will result in improved extraction ratios and/or safer mining using
optimal pillar dimensions to ensure stable pillar crushing. A formula for peak pillar
strength was also determined, for use at the Impala platinum- and other similar
mines.
In particular, this research has contributed significantly to the understanding of
Merensky pillar behaviour in narrow tabular excavations.

iv
CONTENTS
Executive summary ii
1 General introduction 1
1.1 Location of the Bushveld platinum orebodies 1
1.2 Stope layouts 3
1.3 Pillars used on the Bushveld platinum mines 5
1.4 Typical geology around the Merensky Reef 7
1.5 Aims of the research 8
2 Description of underground experimental sites 9
3 Nonlinear behaviour of rock 10
4 Rock mass behaviour 13
4.1 Virgin stress conditions 13
4.2 Validity of elasticity for analysis of rock mass behaviour 13
4.3 Effect of boundary conditions 15
4.4 Boundary conditions at the Amandelbult site 16
5 Pillar behaviour 18
5.1 Pillar system 18
5.2 Pillar and stope measurements 21
5.3 Peak pillar strength 27
5.4 Residual pillar strength 30
5.5 Design of crush pillars 39
6 Conclusions 43
Nonlinear behaviour of rock 43

v
Rock mass behaviour 43
Pillar behaviour 45
Crush pillar design 46
7 References 48

vi
LIST OF FIGURES
Figure 1-1 Map showing the western, northern and eastern lobes of the Bushveld Complex and the locations of the platinum mines ......................... 2
Figure 1-2 Sketch showing the Merensky and UG2 reefs and typical shaft-access system. The detail of the on-reef stoping and pillars are presented in Figure 1-3 .................................................................................. 2
Figure 1-3 Plan view of a typical breast configured stope on the Merensky Reef (after Özbay and Roberts, 1988) ................................................... 3
Figure 1-4 Zoom into Figure 1-3, showing the directions of the photographs in Figure 1-5 ..................................................................................... 4
Figure 1-5 In-stope views of: A – breast face, B – „crush‟ pillar, C – stope below pillars, D – into stope from the gully, E –gully without sidings and F –gully with sidings ......................................................................... 4
Figure 1-6 Illustrative stress-strain behaviour of various pillar types, showing the change in behaviour for different ranges of pillar w/h ratio (after Jager and Ryder, 1999) ................................................................ 6
Figure 1-7 Stratigraphic column showing the typical rock sequence above the Merensky Reef .............................................................................. 7
Figure 3-1 Typical uniaxial test results of linear and nonlinear anorthosites from the Amandelbult and Impala mine sites, respectively .................. 10
Figure 4-1 Impala site: section along the extensometer hole, drilled through the centre of Pillar P2 (not drawn to scale) ........................................ 14
Figure 4-2 Impala site: measured and elastic hangingwall deformations above the centre of Pillar P2, between the pillar top contact and 4.18 m above the pillar. Ε = 83 GPa and ν = 0.32 were used in the model Negative face advances represent the face position behind the instrument. Positive deformation represents compression .......... 14
Figure 4-3 Impala site: footwall extensometer below the centre of Pillar P2, between the pillar bottom contact and 14.5 m below the pillar. Measured and elastic deformations plotted against the advance of the 8s face. Negative face advances represent the face position behind the instrument. Positive deformation represents compression ............................................................................... 15
Figure 4-4 Amandelbult site: measured closure and modelled elastic convergence. 1 m up-dip and 2 m down-dip of P2 ...................... 16
vii
Figure 5-1 FLAC model properties (the more ductile model was calibrated from underground measurements) ...................................................... 18
Figure 5-2 FLAC: Effect of pillar w/h ratio for pillars that are allowed to punch, as well as for pillars that are surrounded by an infinitely strong rock mass. High density mesh and varying brittleness ........................ 19
Figure 5-3 FLAC: failure distribution, using dense mesh and ductile material; w/h =2.0 (left) and 5.0 (right) (double symmetry) ............................... 20
Figure 5-4 Impala site: fracturing and jointing observed in the slot adjacent to P1. The fracturing was exposed when a holing was cut through the footwall after pillar failure. The yellow line indicates the position of a shallow-dipping, curved fracture. Vertical fractures can also be seen ............................................................................................ 21
Figure 5-5 Impala site: section along the shallow-dipping extensometer borehole, drilled over the top of Pillar P1 (not drawn to scale) .................... 22
Figure 5-6 Impala site: horizontal dilation in the hangingwall across the top of Pillar P1, about 0.9 m above the pillar. Compression is positive .. 22
Figure 5-7 Impala site: deformation along a shallow-dipping borehole, between 1.5 m and 5.5 m above Panel 8s. Measurements made by the sub-horizontal extensometer over a length of 19.6 m. Compression is positive ....................................................................................... 23
Figure 5-8 Impala site: comparison between the measured closure and elastic convergence from a MinSim model for an isolated panel. Measurements and model initiate at a face position of 6.5 m from the instrument line ....................................................................... 24
Figure 5-9 Impala site: P1 stress-strain curve estimated from 2D stress measurements conducted 5.3 m above the pillar and deformation measured in the stope at 1 m from the pillar ............................... 25
Figure 5-10 Sketch showing Impala Pillar P1 in relation to the 8s panel face abutment and other pillars at failure, plan view............................ 26
Figure 5-11 Impala site: section showing the straincell position above P1 (not drawn to scale)............................................................................ 26
Figure 5-12 Plot of failed and unfailed pillars with the linear formula compared to the modelled strengths (Equation 5-1) ........................................ 28
Figure 5-13 Comparison of the strengths predicted from the database (Linear back-analysis), FLAC modelling (brittle and ductile) and laboratory tests performed by Spencer and York (1999) .............................. 29

viii
Figure 5-14 Comparison between the measured pillar strengths and the „back-fit‟ pillar strengths, using the linear pillar-strength formula (Equation 5-1) ............................................................................................. 30
Figure 5-15 Pillar w/h ratio-strengthening effects on residual APS. The underground measurements are compared to the Barron (1983) and Salamon (1992) solutions (Φb = 30°), Spencer and York laboratory tests (1999) and FLAC models (Φb = 40°) .................. 32
Figure 5-16 Comparison between the Salamon formula (Equation 5-5), assuming Φb = 30° and Co = 1.6, and the measured Amandelbult P1 stress profile .......................................................................................... 33
Figure 5-17 Results of laboratory punch tests (after Spencer and York, 1999) .. 34
Figure 5-18 Ultimate bearing capacity of the foundation, assuming friction angles of 30° and 40° ............................................................................. 37
Figure 5-19 Stress-strain curves of pillar-systems with different pillar w/h ratios. Generated by FLAC, assuming a constant pillar width and varying the pillar height. Residual cohesion = 1.0 MPa ............................ 38
Figure 5-20 Acceptable (B) and unacceptable (A) stiffness of the surrounding strata for stable crush pillar design .............................................. 40
Figure 5-21 Pillar residual strength as a function of w/h ratio ............................. 41
Figure 5-22 Flowchart for Merensky crush pillar design ..................................... 41

1
1 General introduction
Design of pillars on the Merensky and UG2 reefs is mainly empirical using
experience and strength formulae derived for other hard-rock mines. The
consequence of this uncertain methodology is to cut oversize pillars, which
lowers the extraction ratio. In addition, pillars cut in the deeper levels are required
to fail in a stable manner during or soon after being cut. These pillars are known
as crush pillars and their residual strengths provide the required support
resistance to prevent backbreaks. A recent series of pillar bursts, with serious
consequences, has raised questions about the design of these pillars.
This thesis describes the behaviour of pillars and the rock mass during the
stoping of narrow tabular reefs on the Bushveld Complex platinum mines, based
on underground measurements made at three Merensky Reef sites. The aim of
the investigation was to develop a robust design methodology for Merensky Reef
crush pillars and to determine the strength and behaviour of these pillars. To
achieve this objective seven pillars were instrumented and monitored for periods
of up to three years. The instrumentation included 132 stress measurements, 160
laboratory tests, 41 closure and closure-ride stations, 8 extensometers and 9
borehole camera surveys. In addition, 183 elastic MinSim models (COMRO,
1981) and 28 FLAC models (Itasca, 1993) with strainsoftening were run.
1.1 Location of the Bushveld platinum orebodies
The Bushveld Complex is a large layered igneous intrusion, which spans about
350 km from east to west and is divided into the eastern, northern and western
lobes (Figure 1-1). This remarkable geological phenomenon hosts not only the
majority of the world‟s platinum group metals but also vast quantities of chromium
and vanadium in seams parallel to the platinum ore bodies.
2
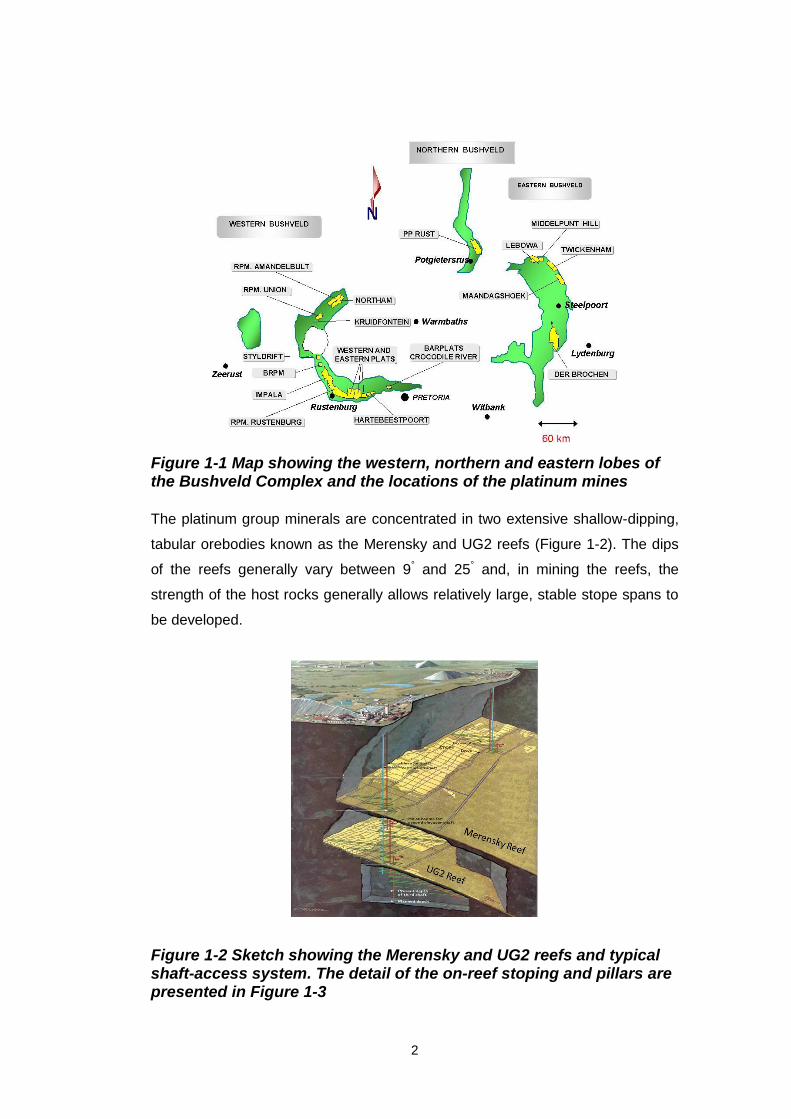
Figure 1-1 Map showing the western, northern and eastern lobes of the Bushveld Complex and the locations of the platinum mines
The platinum group minerals are concentrated in two extensive shallow-dipping,
tabular orebodies known as the Merensky and UG2 reefs (Figure 1-2). The dips
of the reefs generally vary between 9° and 25° and, in mining the reefs, the
strength of the host rocks generally allows relatively large, stable stope spans to
be developed.
Figure 1-2 Sketch showing the Merensky and UG2 reefs and typical shaft-access system. The detail of the on-reef stoping and pillars are presented in Figure 1-3

3
1.2 Stope layouts
Stope spans on the Bushveld Complex mines are determined according to what
worked in the past and are primarily based on economic and practical
considerations (Swart et al, 2000). Stopes consist of several panels, each of
which is typically about 30 m wide. These panels are separated by stable, crush
or „yield‟ pillars, as shown in Figure 1-3.
Reg
ion
al p
illa
r
Reg
ion
al p
illa
rR
eg
ion
al p
illa
r80 m
Dyke used
As regional
pillar
60 m
20 m
Dip direction
SolidSolid
Crush pillars
30 m
Mined
150 m
3 m
Zoom
Gully
Figure 1-3 Plan view of a typical breast configured stope on the Merensky Reef (after Özbay and Roberts, 1988)

4
An enlargement of the zoom area in Figure 1-3 is provided in Figure 1-4, where
the directions of photographs „A‟ to „F‟ that make up the photographs in Figure
1-5 are shown.
B
Dip direction
A
Min
ing
dir
ection
Min
ing
dire
ctio
nD
Figure 1-4 Zoom into Figure 1-3, showing the directions of the photographs in Figure 1-5
Figure 1-5 In-stope views of: A – breast face, B – ‘crush’ pillar, C – stope below pillars, D – into stope from the gully, E –gully without sidings and F –gully with sidings
The most common mining configuration is breast mining, where the mining face
is advanced on strike (Figure 1-3). However, up-dip and down-dip mining is also
done for various reasons and the pillar lines are then oriented on dip. Regional
5
pillars are designed to carry the overburden to surface and are spaced about
150 m apart.
1.3 Pillars used on the Bushveld platinum mines
Özbay et al (1995) reviewed hard rock pillar designs in use in South Africa in the
mid 1990s. They exposed a considerable range in design practices (including the
choice of pillar type) and uncertainty about key issues, notably the estimation of
in situ strengths. Four common types of pillars are used on the platinum mines at
shallow to intermediate depth:
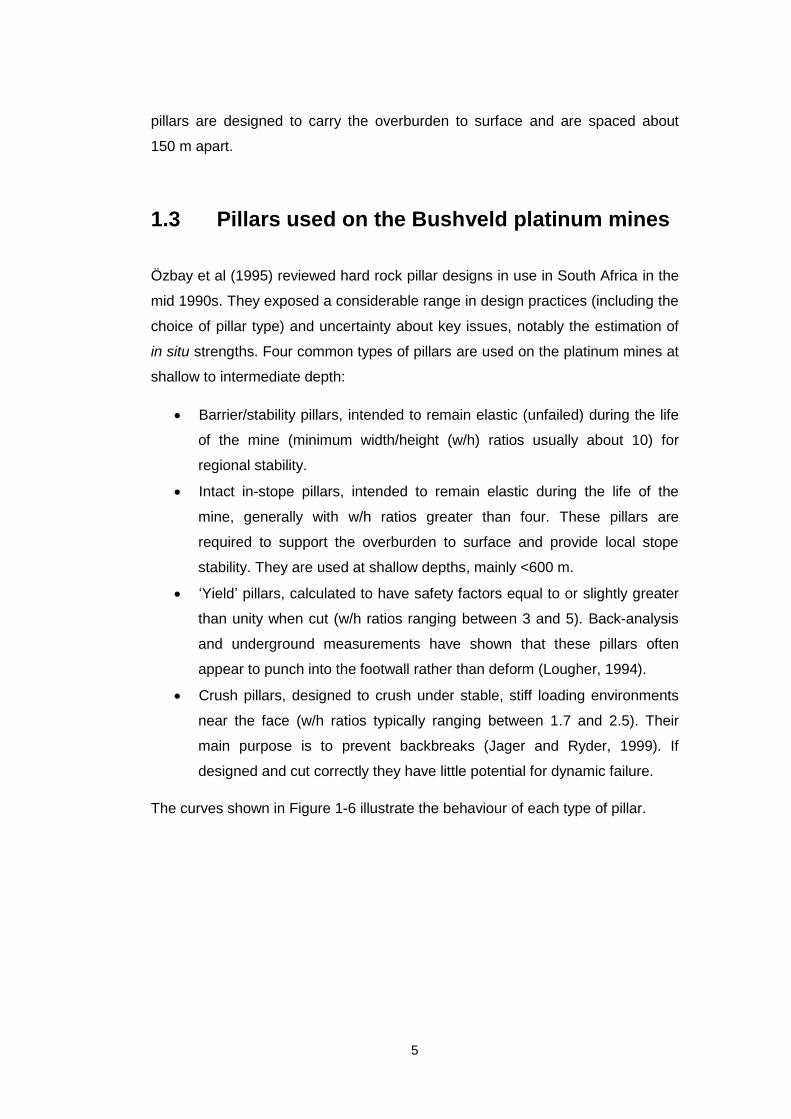
Barrier/stability pillars, intended to remain elastic (unfailed) during the life
of the mine (minimum width/height (w/h) ratios usually about 10) for
regional stability.
Intact in-stope pillars, intended to remain elastic during the life of the
mine, generally with w/h ratios greater than four. These pillars are
required to support the overburden to surface and provide local stope
stability. They are used at shallow depths, mainly <600 m.
„Yield‟ pillars, calculated to have safety factors equal to or slightly greater
than unity when cut (w/h ratios ranging between 3 and 5). Back-analysis
and underground measurements have shown that these pillars often
appear to punch into the footwall rather than deform (Lougher, 1994).
Crush pillars, designed to crush under stable, stiff loading environments
near the face (w/h ratios typically ranging between 1.7 and 2.5). Their
main purpose is to prevent backbreaks (Jager and Ryder, 1999). If
designed and cut correctly they have little potential for dynamic failure.
The curves shown in Figure 1-6 illustrate the behaviour of each type of pillar.

6
Figure 1-6 Illustrative stress-strain behaviour of various pillar types, showing the change in behaviour for different ranges of pillar w/h ratio (after Jager and Ryder, 1999)
Jager and Ryder (1999) suggest that there is a transition zone of approximately
300 m to 600 m below surface within which crush pillars cannot readily be used.
At these depths below surface the pillars may remain intact when cut and only
crush when loaded in the back areas, triggering violent failure or a potentially
hazardous pillar run. At shallower depths, pillars are required to stabilise the
surface and should therefore support the overburden to surface. In stopes
> 600 m in depth the continued use of intact pillars is possible but only at reduced
extraction ratios because of the heavier cover loads borne.
The behaviour of foundations is an integral part of pillar behaviour and must be
included in pillar design (Watson et al, 2008). Lougher (1994) and York et al
(1998) also show that pillars and stopes comprise an interactive system. Ryder et
al (2005) demonstrated that the height of the vertical tensile zone above a stope
is dependent both on the stress on the pillars and abutments surrounding the
stope and/or the span between these pillars. The behaviour of pillars is,
therefore, an integral part of stope stability. The pillar, hangingwall and footwall
must be considered as components of an integrated and interacting system. To
7
design these systems effectively, rock and rock mass behaviour must be
understood. The mutual dependence of the stope and the pillars means that the
two had to be studied together in the current research.
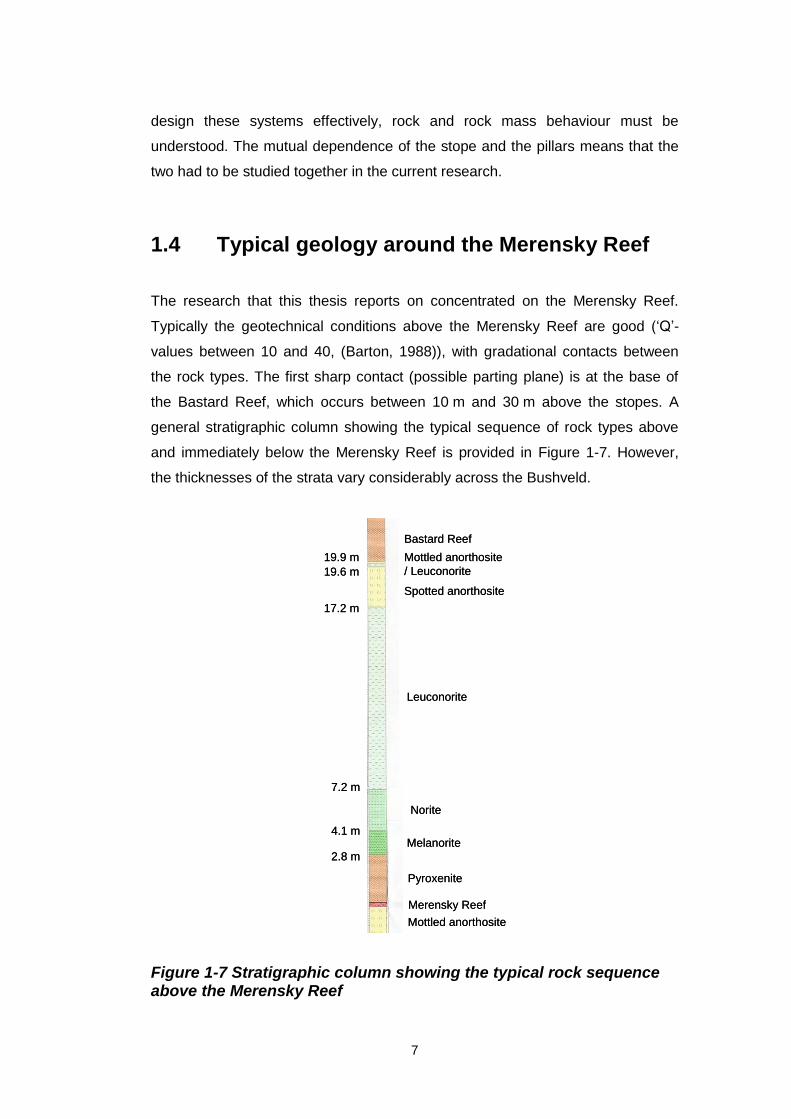
1.4 Typical geology around the Merensky Reef
The research that this thesis reports on concentrated on the Merensky Reef.
Typically the geotechnical conditions above the Merensky Reef are good („Q‟-
values between 10 and 40, (Barton, 1988)), with gradational contacts between
the rock types. The first sharp contact (possible parting plane) is at the base of
the Bastard Reef, which occurs between 10 m and 30 m above the stopes. A
general stratigraphic column showing the typical sequence of rock types above
and immediately below the Merensky Reef is provided in Figure 1-7. However,
the thicknesses of the strata vary considerably across the Bushveld.
2.8 m
4.1 m
7.2 m
17.2 m
19.6 m
19.9 m
Merensky Reef
Pyroxenite
Melanorite
Norite
Leuconorite
Spotted anorthosite
Mottled anorthosite
/ Leuconorite
Mottled anorthosite
Bastard Reef
2.8 m
4.1 m
7.2 m
17.2 m
19.6 m
19.9 m
Merensky Reef
Pyroxenite
Melanorite
Norite
Leuconorite
Spotted anorthosite
Mottled anorthosite
/ Leuconorite
Mottled anorthosite
Bastard Reef
Figure 1-7 Stratigraphic column showing the typical rock sequence above the Merensky Reef
8
On the Merensky Reef, crush and „yield‟ pillars are designed to maintain rock
mass stability to the base of the overlying Bastard Reef. The pillars also reduce
the demand on local stope support by restricting the height of the vertical tensile
zone.
1.5 Aims of the research
The intention of the research was to provide the South African platinum industry
with guidelines on crush pillar design for the Merensky Reef. The provision of
these guidelines entailed an understanding of peak and residual pillar strengths,
primarily from underground measurements. In addition, laboratory tests, standard
analytical solutions and numerical models were used in the final analysis.

9
2 Description of underground experimental sites
The underground sites were classified using rock mass rating systems, i.e. RQD
(Barton, 1988), Q (Barton, 1988) and N” (Watson, 2003), and are described as
follows:
Amandelbult – Shallow depth good rock mass conditions (Q = 18.3)
Impala – Intermediate depth good rock mass conditions (Q = 50)
Union – Intermediate-depth poor rock mass conditions (Q = 3.2)
The ratio of horizontal to vertical stress (k-ratio) varies across the Bushveld
complex. The k-ratios were measured to be: unity, 1.3 and 0.5 for the
Amandelbult, Impala and Union sites, respectively. All sites were mined on breast
with strike spans varying between about 50 m and 150 m
Cylindrical-shaped rock samples were collected and geomechanically tested from
boreholes drilled at all three sites. Some of the test results showed nonlinear
stress-strain behaviour, which complicated the interpretation of stress
measurements. The nonlinear behaviour was noticed at all three sites, but only
the Impala site was exclusively nonlinear.
10
3 Nonlinear behaviour of rock
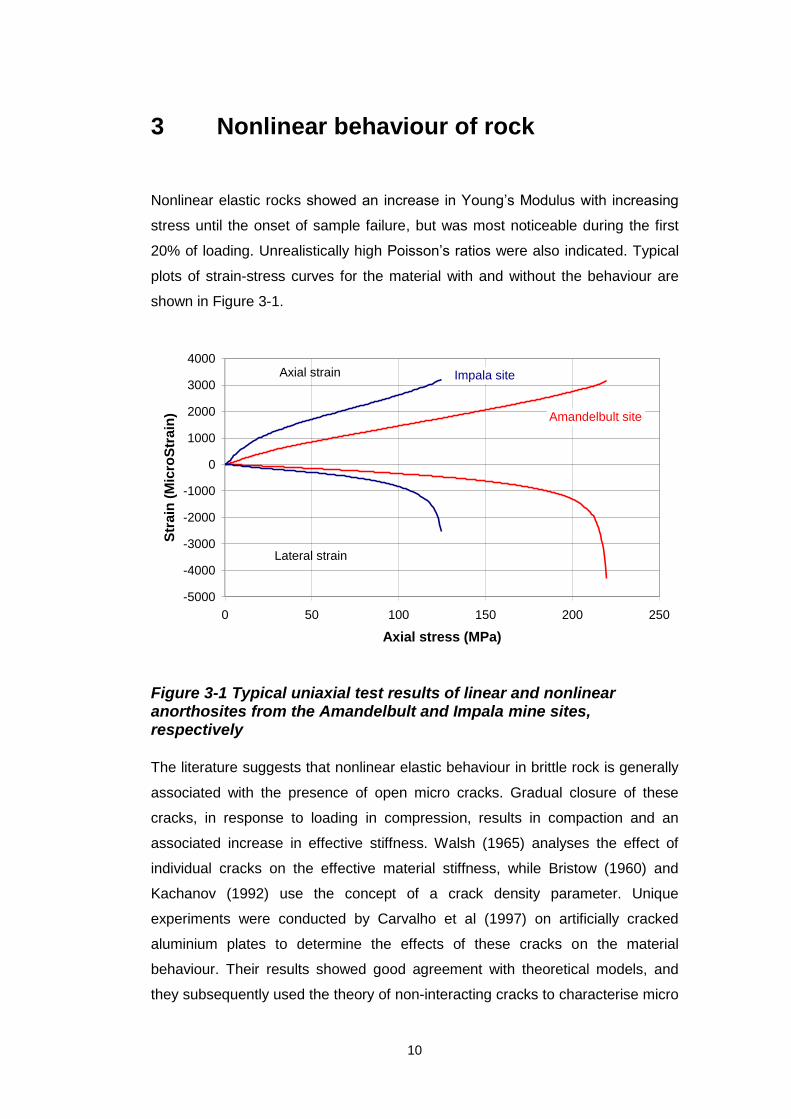
Nonlinear elastic rocks showed an increase in Young‟s Modulus with increasing
stress until the onset of sample failure, but was most noticeable during the first
20% of loading. Unrealistically high Poisson‟s ratios were also indicated. Typical
plots of strain-stress curves for the material with and without the behaviour are
shown in Figure 3-1.
-5000
-4000
-3000
-2000
-1000
0
1000
2000
3000
4000
0 50 100 150 200 250
Axial stress (MPa)
Str
ain
(M
icro
Str
ain
)
Impala site
Amandelbult site
Axial strain
Lateral strain
Figure 3-1 Typical uniaxial test results of linear and nonlinear anorthosites from the Amandelbult and Impala mine sites, respectively
The literature suggests that nonlinear elastic behaviour in brittle rock is generally
associated with the presence of open micro cracks. Gradual closure of these
cracks, in response to loading in compression, results in compaction and an
associated increase in effective stiffness. Walsh (1965) analyses the effect of
individual cracks on the effective material stiffness, while Bristow (1960) and
Kachanov (1992) use the concept of a crack density parameter. Unique
experiments were conducted by Carvalho et al (1997) on artificially cracked
aluminium plates to determine the effects of these cracks on the material
behaviour. Their results showed good agreement with theoretical models, and
they subsequently used the theory of non-interacting cracks to characterise micro

11
cracks in Charcoal Granite. In the current research, a simple 2D FLAC model of a
closing crack provided a good match to the profiles of the nonlinear samples from
the instrumentation sites.
The theory of non-interacting cracks suggests that the behaviour of nonlinear
rocks is characterised by two components of strain – i.e. the solid rock around
micro cracks (‟matrix‟) and the closure and sliding of these cracks. This
assumption led to the development of a methodology to carry out successful
stress measurements in nonlinear rock. A better understanding of the rock mass
behaviour was also facilitated in the affected areas. It should be noted that the
microfracturing also reduces the strength of the rock, 210 MPa to 120 MPa in
Figure 3-1.
Teufel (1983, 1989) found that seismic wave velocities could be correlated to the
amount of time-dependent (anelastic) strain recovered in a core sample. This
phenomenon was interpreted as being caused by the generation of micro cracks
during anelastic strain recovery. The concept is based on the assumption that
over-coring of stressed rock can lead to differential stress and strain relaxation.
An unloaded specimen, therefore, contains residual stresses that can result in the
formation or opening of micro cracks. Relaxation of residual stresses may have a
time-dependent component, according to which the rate of (anelastic) strain
recovery decreases with time. Sakaguchi et al (2002) investigated the stress
concentrations associated with the over-coring process and they concluded that
the tensile stresses induced near the end of a core stub play a major role in
micro-fracturing in a rock core during stress relief. This last is an important
conclusion, as the over-coring process may cause (additional) damage in a core
sample and promote the strain relaxation process.
From the literature it is apparent that nonlinear behaviour is more likely in
polycrystalline materials such as those found in the Bushveld. Micro cracking
occurs between mineral grains with different moduli during unloading, when the
virgin stress conditions are sufficiently high. This behaviour related to a stress
condition of about 36 MPa and 28 MPa for the horizontal and vertical stresses at
the Impala site. It appears that the critical stress condition was exceeded at the
Impala site because of its depth below surface and a comparatively high k-ratio.
12
The virgin stress conditions at the other two sites appear to have been too low for
these micro cracks to form in the rock mass during mining. Thus the rock mass
itself did not appear to become nonlinear at these two sites. However, nonlinear
behaviour was observed at these sites in areas where the test samples were
extracted from „high‟ stress situations, such as above the pillars. In these cases, it
appears that the tensile stresses that developed at the drill-bit tip probably
enabled a sufficient stress drop for the micro cracks to form. Nonlinear rock
behaviour does not appear to have affected the pillar behaviour at the Impala site
either. Thus, it appears that the observed nonlinear behaviour did not influence
pillar behaviour at any of the sites.
An important result of this work is that it was possible to convert nonlinear strain
measurements into reliable stresses. The methodology involved in this
conversion is fully described in the thesis.
13
4 Rock mass behaviour
4.1 Virgin stress conditions
The k-ratios in the pyroxenites at the Impala and Union sites were ubiquitously
about 0.5. This k-ratio was also observed in the pyroxenites in the tunnels below
the Merensky stope at the Union site. The uniform low k-ratio in the pyroxenites
at both stopes suggests that the original horizontal stresses of the Bushveld
Complex, at formation, may have relaxed. However, this relaxation does not
appear to have occurred in the anorthosites, resulting in variable and
comparatively higher stresses in this rock type. The higher horizontal stresses in
the anorthositic rocks has invoked the concept of tectonic stress „channelling‟.
This „channelling‟ may be a reason for the preferred footwall fracturing in the
Impala and Union stopes. The uniform and relatively low k-ratio in the pyroxenites
was not, however, observed at the Amandelbult site and further research is
required to fully understand the phenomenon.
4.2 Validity of elasticity for analysis of rock mass behaviour
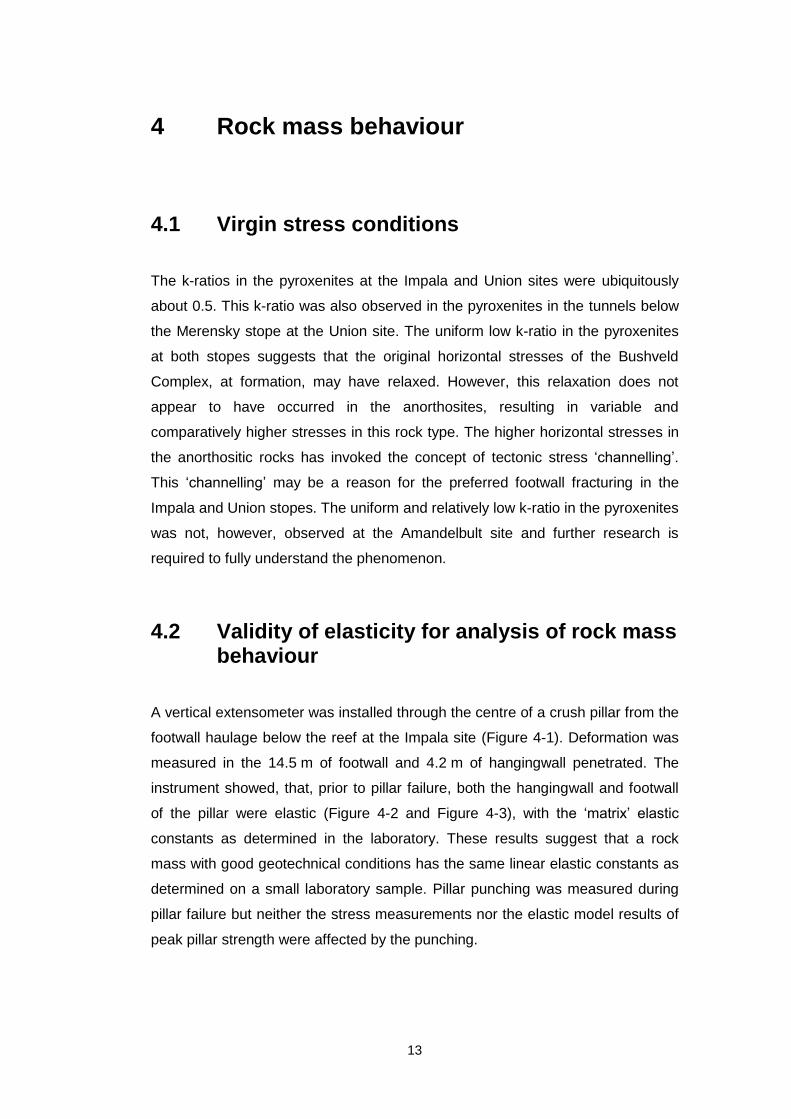
A vertical extensometer was installed through the centre of a crush pillar from the
footwall haulage below the reef at the Impala site (Figure 4-1). Deformation was
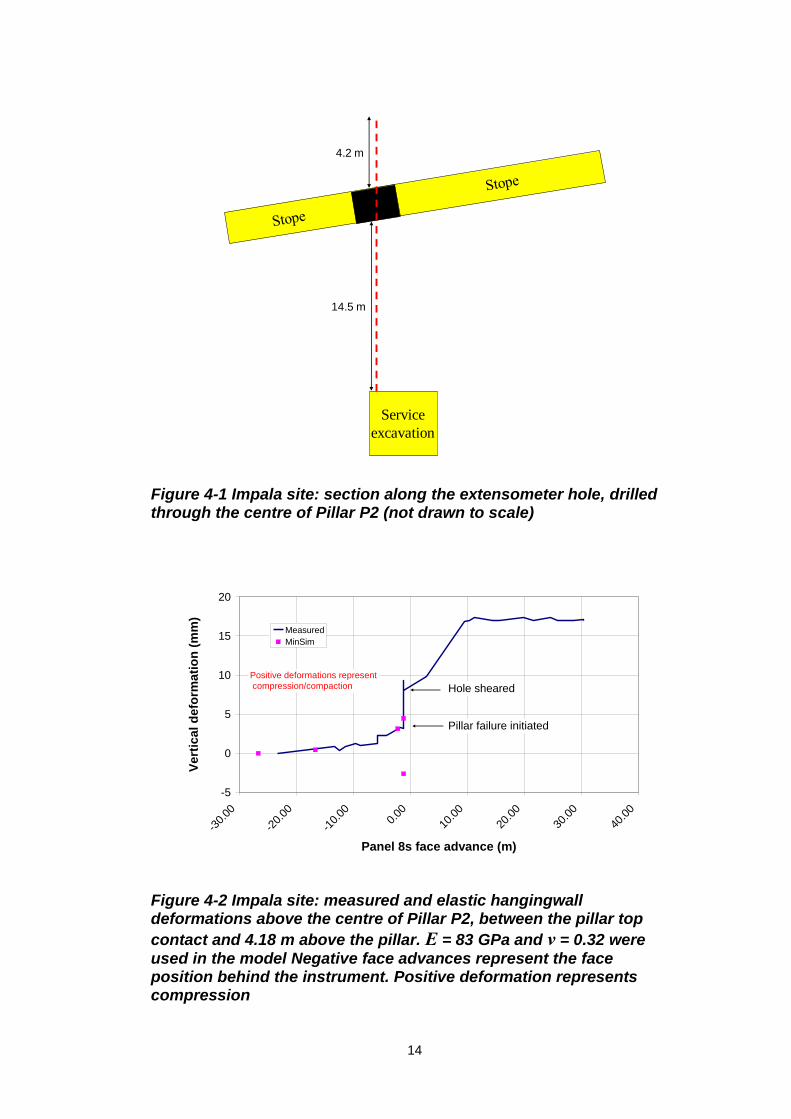
measured in the 14.5 m of footwall and 4.2 m of hangingwall penetrated. The
instrument showed, that, prior to pillar failure, both the hangingwall and footwall
of the pillar were elastic (Figure 4-2 and Figure 4-3), with the „matrix‟ elastic
constants as determined in the laboratory. These results suggest that a rock
mass with good geotechnical conditions has the same linear elastic constants as
determined on a small laboratory sample. Pillar punching was measured during
pillar failure but neither the stress measurements nor the elastic model results of
peak pillar strength were affected by the punching.
14
Service
excavation
4.2 m
14.5 m
Figure 4-1 Impala site: section along the extensometer hole, drilled through the centre of Pillar P2 (not drawn to scale)
-5
0
5
10
15
20
-30.
00
-20.
00
-10.
000.
00
10.0
0
20.0
0
30.0
0
40.0
0
Panel 8s face advance (m)
Vert
ica
l d
efo
rmati
on
(m
m)
Measured
MinSim
Pillar failure initiated
Hole sheared
Positive deformations represent
compression/compaction
Figure 4-2 Impala site: measured and elastic hangingwall deformations above the centre of Pillar P2, between the pillar top
contact and 4.18 m above the pillar. Ε = 83 GPa and ν = 0.32 were used in the model Negative face advances represent the face position behind the instrument. Positive deformation represents compression
15
-10
-8
-6
-4
-2
0
2
4
6
8
-50.
00
-40.
00
-30.
00
-20.
00
-10.
000.
00
10.0
0
20.0
0
30.0
0
40.0
0
Panel 8s face advance (m)
Defo
rmati
on
(m
m)
Measured
MinSim
Pillar failure
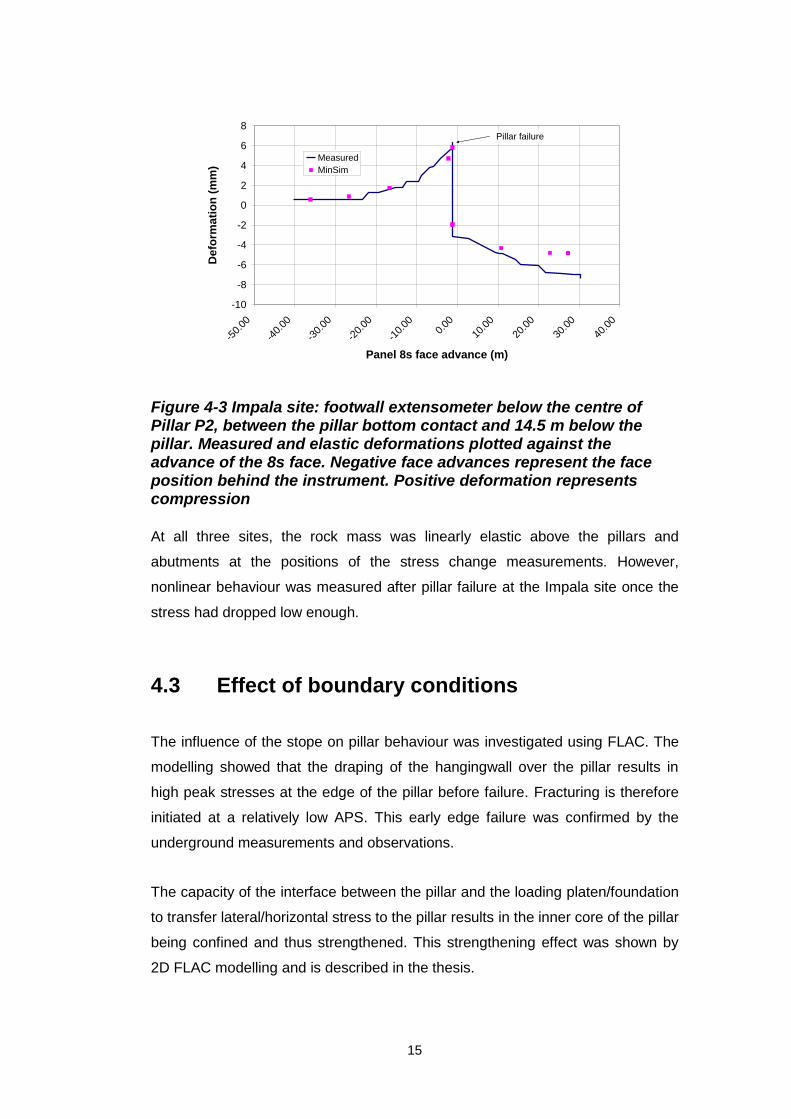
Figure 4-3 Impala site: footwall extensometer below the centre of Pillar P2, between the pillar bottom contact and 14.5 m below the pillar. Measured and elastic deformations plotted against the advance of the 8s face. Negative face advances represent the face position behind the instrument. Positive deformation represents compression
At all three sites, the rock mass was linearly elastic above the pillars and
abutments at the positions of the stress change measurements. However,
nonlinear behaviour was measured after pillar failure at the Impala site once the
stress had dropped low enough.
4.3 Effect of boundary conditions
The influence of the stope on pillar behaviour was investigated using FLAC. The
modelling showed that the draping of the hangingwall over the pillar results in
high peak stresses at the edge of the pillar before failure. Fracturing is therefore
initiated at a relatively low APS. This early edge failure was confirmed by the
underground measurements and observations.
The capacity of the interface between the pillar and the loading platen/foundation
to transfer lateral/horizontal stress to the pillar results in the inner core of the pillar
being confined and thus strengthened. This strengthening effect was shown by
2D FLAC modelling and is described in the thesis.

16
A realistic model allows the fracturing or damage to expand beyond the pillar, into
its foundations. This punching phenomenon becomes an important aspect of the
failure mechanism of the pillar system, and effectively controls the pillar strength
at larger width-to-height ratios.
The literature, model results, underground measurements and observations show
the importance of including the footwall and hangingwall in pillar behaviour
evaluations. These evaluations should be done with realistic stope geometries as
the draping of the hangingwall and footwall contribute to the overall behaviour.
The investigations show that pillar behaviour cannot be simply extrapolated from
laboratory tests between metal platens.
4.4 Boundary conditions at the Amandelbult site
The closure measurements at the Amandelbult site established that the rock
mass over the stope was behaving in an almost elastic manner. These
measurements together with borehole camera surveys established that only
minor fracturing occurred above and below the pillars at this site. A comparison
between the closure measurements and elastic modelling results showed that the
fractures only influenced convergence on the immediate up-dip side of the pillars
(Figure 4-4).
0
10
20
30
40
50
60
-5.0 0.0 5.0 10.0 15.0 20.0 25.0 30.0 35.0 40.0
Face position from edge of pillar (m)
Co
nv
erg
en
ce
(m
m)
Measured Up-dip
Measured Down-dip
MinSim Up-dip
MinSim Down-dip
Figure 4-4 Amandelbult site: measured closure and modelled elastic convergence. 1 m up-dip and 2 m down-dip of P2

17
The fact that very little foundation fracturing took place at the Amandelbult site
makes this site ideal for comparison to analytical solutions that do not consider
the affects of the foundations on pillar behaviour. Thus the residual stress profiles
measured over Pillar P1, at this site, will be compared to relevant analytical
solutions for residual pillar strength in the following chapter. The almost elastic
closure that occurred at this site also made it possible to accurately measure
pillar deformations without the errors associated with foundation fracturing. The
measurements of pillar stress and strain at this site were therefore used to
calibrate FLAC models. These models are described in the following chapter.

18
5 Pillar behaviour
5.1 Pillar system
The influence of the footwall and/or hangingwall on pillar behaviour was
investigated using numerical modelling, underground instrumentation,
underground observations and laboratory tests. A series of FLAC models were
constructed to interrogate the influence of the pillar footwall and/or hangingwall
on pillar behaviour. Two sets of models were run: those represented by a more
ductile material and calibrated by underground measurements from Pillar P1 at
the Amandelbult site; and those represented by a more brittle material. The input
parameters for these models are shown in Figure 5-1. The hangingwalls and
footwalls were included with the same strain-softening parameters as the pillars.
In all models the stope span was about five times the pillar width (extraction ratio
~ 83%) and the model height was more than eight times the pillar width.
0
5
10
15
20
25
0 20 40 60 80 100 120
Plastic shear strain (MilliStrain)
Co
he
sio
n (
MP
a)
0
5
10
15
20
25
30
35
40
45
An
gle
(D
eg
ree
s)Brittle cohesion
Ductile cohesion
Internal friction
Residual dilation
Figure 5-1 FLAC model properties (the more ductile model was calibrated from underground measurements)
The ultimate foundation failure resistance for brittle and ductile materials was
determined by comparing the strengths of pillar systems where the foundations
were not allowed to fail to models where failure occurred in both the pillar and the

19
foundations. The results of the comparison are shown in Figure 5-2, the infinitely
strong foundation results being denoted by “Pillar brittle” and “Pillar ductile”.
Failure was concentrated in the pillar where the foundations were infinitely strong
and the so-called “squat” effects were demonstrated. Suites of pillars with w/h
ratios ranging from 0.5 to 10 were used in the comparison. It was found that
punching could initiate at a w/h ratio of 1.2 for Merensky pillars, whereas this
initiation occurred at a higher w/h in more brittle materials. At smaller w/h ratios,
the pillars fail by progressively crushing from the edges towards the core, but in
the wider pillars additional fracturing of the hangingwall and/or footwall rock is
initiated. There is a disparity between the strengths of pillars with and without
elastic (infinitely strong) foundations. This disparity suggests that punching is
initiated once the stress exceeds 250 MPa (~3 x UCS). Little or no damage is
likely in the foundations below these critical w/h ratios (w/h < 1.3 for Merensky
pillars).
0
100
200
300
400
500
600
700
800
0 2 4 6 8 10 12
w/h ratio
Peak s
tren
gth
(M
Pa)
Brittle
Pillar brittle
Ductile
Pillar ductile
Punch, brittle
Punch, ductile
UCS
Figure 5-2 FLAC: Effect of pillar w/h ratio for pillars that are allowed to punch, as well as for pillars that are surrounded by an infinitely strong rock mass. High density mesh and varying brittleness
The results of the FLAC investigation suggested that a linear relationship exists
between strength and w/h ratio between w/h ratios of about 1.2 and 8. At a w/h
ratio of about 10, the punch resistance is almost at a maximum and little further
increase in strength occurs with greater w/h ratios (Figure 5-2).

20
Failure of a pillar system, which includes the adjacent footwall and/or hangingwall
rock, involves in essence a combination of three mechanisms. First, there is
fracturing and crushing of the pillar itself. This fracturing occurs at small w/h ratios
and often is reproduced under laboratory conditions even with unrealistic
boundary conditions. Secondly vertical “Herzian” cracks (Hertz, 1896) form in the
foundation (Figure 5-3 - left). However, this type of footwall and/or hangingwall
fracturing is not synonymous with foundation failure. Subsequently, wedges form
by shear fracturing (Figure 5-3 - right). These shear fractures and wedges control
the ultimate punch resistance. Finally, punching is accommodated by horizontal
dilation along Prandtl wedge-type fractures (Prandtl, 1921), which would add to
the inelastic closure observed in a panel. The latter-type fractures only occur
under/over pillars with w/h ratio >3.
Hertzian
crack
Hertzian
crack
“Prandtl
wedge”-type
fracture
Wedges in core
of the pillar
“Prandtl
wedge”-type
fracture
Wedges in core
of the pillar
Figure 5-3 FLAC: failure distribution, using dense mesh and ductile material; w/h =2.0 (left) and 5.0 (right) (double symmetry)
A Prandtl wedge-type fracture was observed at the Impala site in a footwall slot
that had been cut between the pillar and the gully (Figure 5-4). Evidence of
Prandtl wedge-type fracture development was also shown by measurements of
closure and ride that demonstrated footwall heave at the Union site.

21
Figure 5-4 Impala site: fracturing and jointing observed in the slot adjacent to P1. The fracturing was exposed when a holing was cut through the footwall after pillar failure. The yellow line indicates the position of a shallow-dipping, curved fracture. Vertical fractures can also be seen
5.2 Pillar and stope measurements
One stability pillar and six crush-size pillars were monitored at the three
instrumentation sites. Stress change was monitored by suitably placed straincells
in the hangingwall. Pillar strain was estimated from closure measurements made
in the stope between 1 m and 2 m from the pillar edge. From these
measurements the strength of pillars as well as pre- and post-failure pillar
behaviour could be interrogated using models, laboratory tests and analytical
solutions. The results were checked with MinSim models using a small grid size.
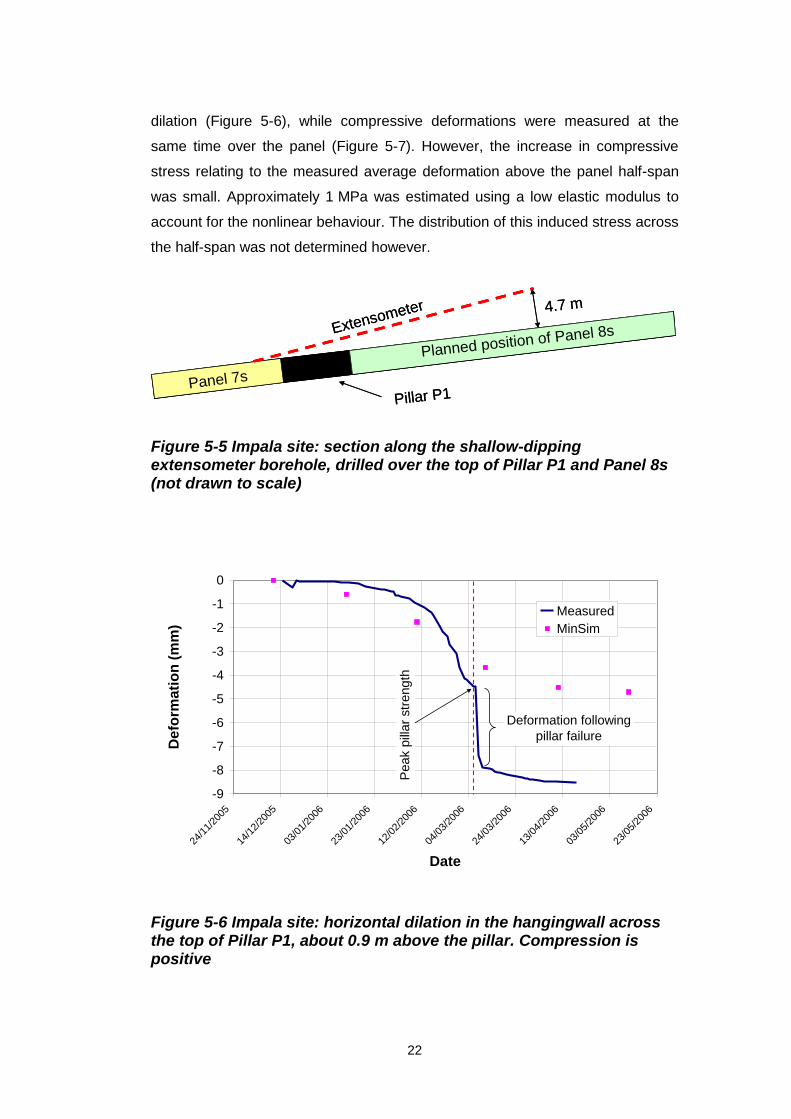
The influence of pillar dilation on the immediate hangingwall above and adjacent
to a pillar was established by a shallow-dipping extensometer (Figure 5-5). This
extensometer was installed over a pillar (P1) and also extended over the adjacent
panel at the Impala site. During pillar failure the anchors over the pillar showed
22
dilation (Figure 5-6), while compressive deformations were measured at the
same time over the panel (Figure 5-7). However, the increase in compressive
stress relating to the measured average deformation above the panel half-span
was small. Approximately 1 MPa was estimated using a low elastic modulus to
account for the nonlinear behaviour. The distribution of this induced stress across
the half-span was not determined however.
Planned position of Panel 8s
Panel 7s
Extensometer 4.7 m
Pillar P1
Planned position of Panel 8s
Panel 7s
Extensometer 4.7 m
Pillar P1
Figure 5-5 Impala site: section along the shallow-dipping extensometer borehole, drilled over the top of Pillar P1 and Panel 8s (not drawn to scale)
-9
-8
-7
-6
-5
-4
-3
-2
-1
0
24/1
1/20
05
14/1
2/20
05
03/0
1/20
06
23/0
1/20
06
12/0
2/20
06
04/0
3/20
06
24/0
3/20
06
13/0
4/20
06
03/0
5/20
06
23/0
5/20
06
Date
De
form
ati
on
(m
m)
Measured
MinSim
Peak p
illar
str
ength
Deformation following
pillar failure
Figure 5-6 Impala site: horizontal dilation in the hangingwall across the top of Pillar P1, about 0.9 m above the pillar. Compression is positive
23
-2
-1
0
1
2
3
4
5
6
23/0
1/20
06
12/0
2/20
06
04/0
3/20
06
24/0
3/20
06
13/0
4/20
06
03/0
5/20
06
23/0
5/20
06
Date
De
form
ati
on
(m
m)
Measured
MinSim
Pill
ar
failu
re
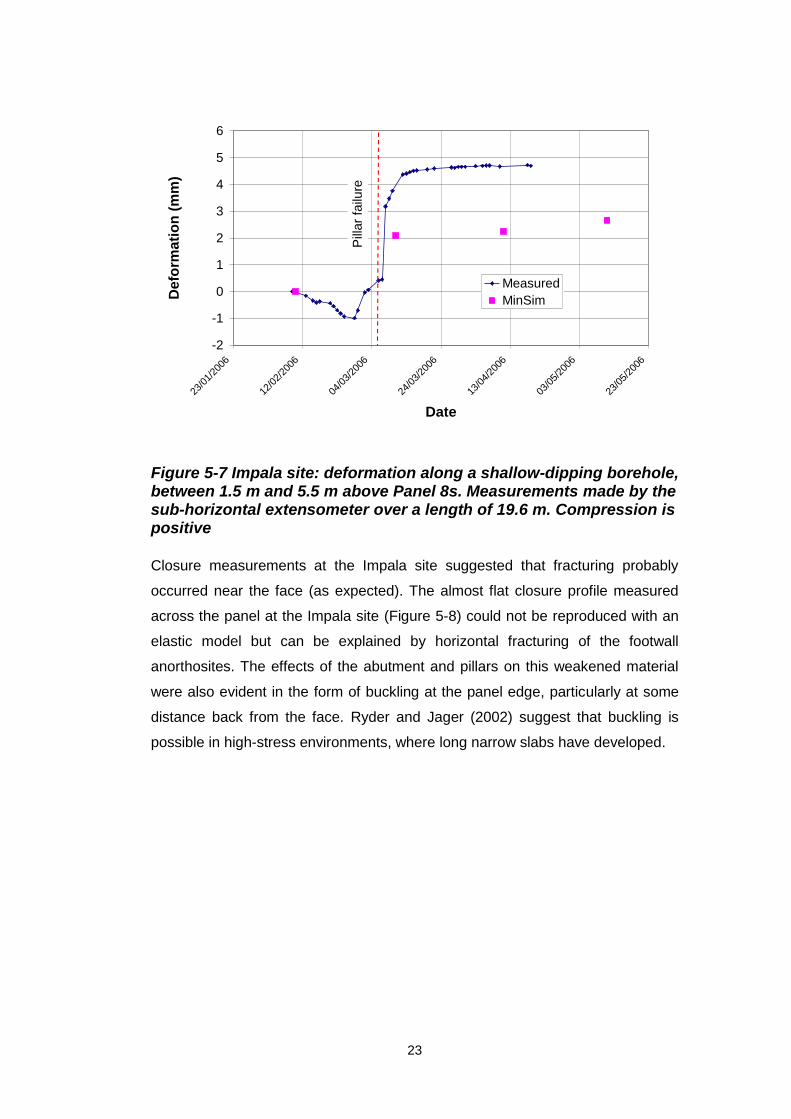
Figure 5-7 Impala site: deformation along a shallow-dipping borehole, between 1.5 m and 5.5 m above Panel 8s. Measurements made by the sub-horizontal extensometer over a length of 19.6 m. Compression is positive
Closure measurements at the Impala site suggested that fracturing probably
occurred near the face (as expected). The almost flat closure profile measured
across the panel at the Impala site (Figure 5-8) could not be reproduced with an
elastic model but can be explained by horizontal fracturing of the footwall
anorthosites. The effects of the abutment and pillars on this weakened material
were also evident in the form of buckling at the panel edge, particularly at some
distance back from the face. Ryder and Jager (2002) suggest that buckling is
possible in high-stress environments, where long narrow slabs have developed.

24
0
10
20
30
40
50
60
70
80
90
0 5 10 15 20 25 30
Distance from up dip abutment (m)
Co
nve
rgen
ce (
mm
)Measured 11.8 m
Measured 22.1 m
Measured 32.7 m
MinSim 11.8 m
MinSim 22 m
MinSim 33 m
MinSim Ε = 15 GPa
ν = 0.32
Figure 5-8 Impala site: comparison between the measured closure and elastic convergence from a MinSim model for an isolated panel. Measurements and model initiate at a face position of 6.5 m from the instrument line
The flat fracturing may have weakened the pillars at the Impala and Union sites
by increasing the effective pillar height. The lack of flat fracturing at the
Amandelbult site could explain why the pillars were slightly stronger than at the
other two sites.
Measurements carried out on Pillar P1 at Impala are plotted as a stress-strain
curve in Figure 5-9. The dimensions of this pillar were 6.8 m x 5.6 m (length x
width) and an average height of 1.6 m. Similar curves were produced from
measurements taken on all seven pillars.

25
0.00
50.00
100.00
150.00
200.00
250.00
300.00
350.00
0.00 50.00 100.00 150.00 200.00 250.00
Strain (MilliStrain)
Vert
ical str
ess (
MP
a)
Pill
ar
form
ed
Rock mass becomes nonlinear
at the measurement position
Figure 5-9 Impala site: P1 stress-strain curve estimated from 2D stress measurements conducted 5.3 m above the pillar and deformation measured in the stope at 1 m from the pillar
At the Impala P1 site, a 2D straincell was installed ahead of the up-dip face. Thus
stress changes were measured as the stress built up in the abutment and pillar
failure occurred when the face had advanced 2.7 m past the pillar (Figure 5-10).
Modelling showed that the effects of the surrounding pillars and face abutment on
the measurement point at failure were minimal. The initial readings were
converted to stress, based on the assumption that the rock mass was linearly
elastic in the region where the gauges were applied (Figure 5-11). Nonlinear
behaviour was only measured when the stress at the measurement point
dropped to about 6 MPa. The conversion of the measurements to pillar stresses
was made with the help of appropriate elastic models. The section of the curve to
the right of the sudden drop in stress (dotted region in Figure 5-9) was evaluated
using the techniques developed during the research, described in the thesis, for
evaluating nonlinear behaviour.

26
Scale
30 m
Pillar P1
Strain cell
2.7 m
Reef dip
Figure 5-10 Sketch showing Impala Pillar P1 in relation to the 8s panel face abutment and other pillars at failure, plan view
0.74 m
5.28 m
20°
Pillar P1
Borehole
Panel 7s
Measurement position
above the panel
0.74 m
5.28 m
20°
Pillar P1
Borehole
Panel 7s
Measurement position
above the panel
Figure 5-11 Impala site: section showing the straincell position above P1 (not drawn to scale)
The P1 analysis suggests pillar peak and residual strengths of 295 MPa and
32 MPa, respectively. The strain was calculated from closure measurements
conducted in the stope about 1 m down-dip of the pillar.
27
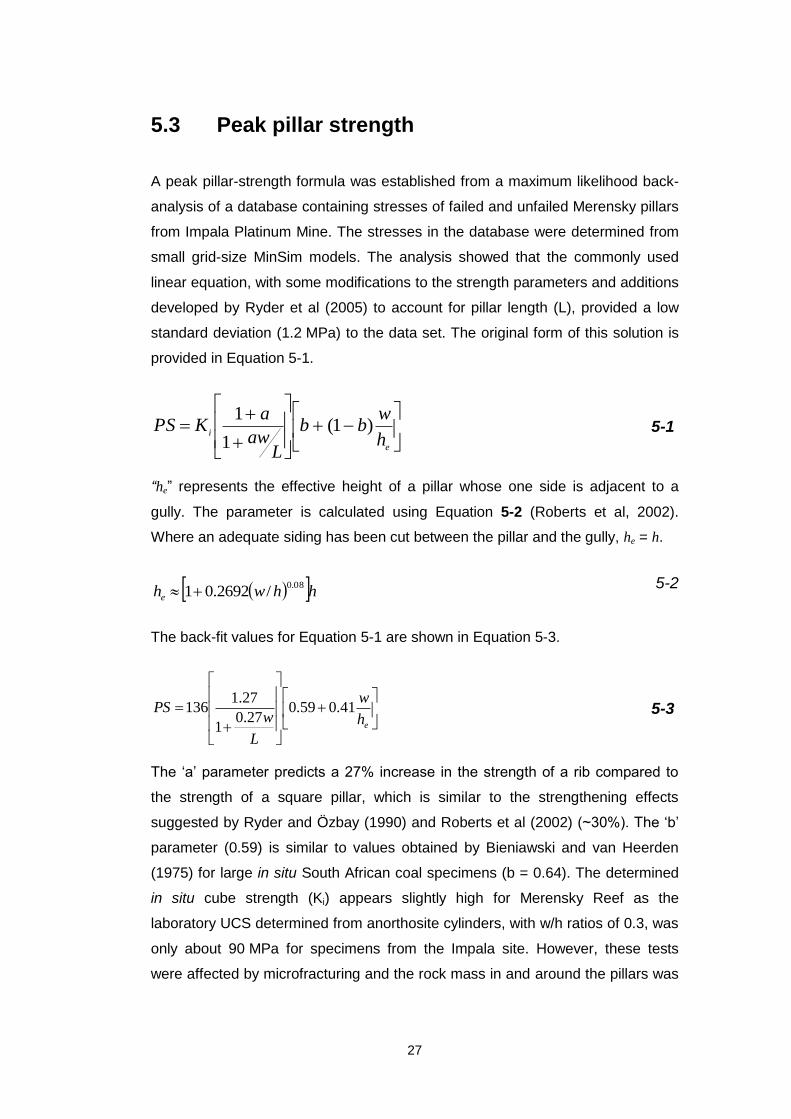
5.3 Peak pillar strength
A peak pillar-strength formula was established from a maximum likelihood back-
analysis of a database containing stresses of failed and unfailed Merensky pillars
from Impala Platinum Mine. The stresses in the database were determined from
small grid-size MinSim models. The analysis showed that the commonly used
linear equation, with some modifications to the strength parameters and additions
developed by Ryder et al (2005) to account for pillar length (L), provided a low
standard deviation (1.2 MPa) to the data set. The original form of this solution is
provided in Equation 5-1.
e
ih
wbb
Law
aKPS )1(
1
1 5-1
“he” represents the effective height of a pillar whose one side is adjacent to a
gully. The parameter is calculated using Equation 5-2 (Roberts et al, 2002).
Where an adequate siding has been cut between the pillar and the gully, he = h.
hhwhe
08.0/2692.01
5-2
The back-fit values for Equation 5-1 are shown in Equation 5-3.
eh
w
L
wPS 41.059.0
27.01
27.1136 5-3
The „a‟ parameter predicts a 27% increase in the strength of a rib compared to
the strength of a square pillar, which is similar to the strengthening effects
suggested by Ryder and Özbay (1990) and Roberts et al (2002) (~30%). The „b‟
parameter (0.59) is similar to values obtained by Bieniawski and van Heerden
(1975) for large in situ South African coal specimens (b = 0.64). The determined
in situ cube strength (Ki) appears slightly high for Merensky Reef as the
laboratory UCS determined from anorthosite cylinders, with w/h ratios of 0.3, was
only about 90 MPa for specimens from the Impala site. However, these tests
were affected by microfracturing and the rock mass in and around the pillars was

28
not. The linear relationship between w/h ratio and peak strength was confirmed
by the suite of calibrated FLAC models described in Section 5.1.
The in situ dimensions of the evaluated pillars were directly measured and the
presence/absence of sidings adjacent to pillars was noted. Pillar condition was
documented according to the following scale of condition codes (CC):
>3: Pillar presumed failed, date/geometry at failure not accurately known;
3: Pillar definitely failed (or burst), date/geometry at failure known; and
<3: Pillar presumed not failed, date/geometry known.
A comparison between the modelled APS and calculated strength values using
Equation 5-3 is shown in Figure 5-12. The figure shows a good separation
between failed (CC>3) and unfailed (CC<3) pillars, with a correspondingly low
evaluated standard deviation. The good fit is particularly evident from the CC = 3
cases in which pillar failure strength was obtained with confidence.
0
100
200
300
400
500
600
700
800
0 100 200 300 400 500 600 700 800
Modelled APS (MPa)
Lin
ea
r F
it S
tre
ng
th (
MP
a)
CC< 3
CC = 3
CC>3
Linear (45 degrees)
Figure 5-12 Plot of failed and unfailed pillars with the linear formula compared to the modelled strengths (Equation 5-3)
In Figure 5-13 the calibrated FLAC pillar analysis is compared to Equation 5-3
and some specially prepared laboratory tests performed by Spencer and York
(1999). The laboratory tests were carried out using a cylindrical punch of 25 mm
diameter and a foundation cylinder of 80 mm for the diameter and the height. The

29
foundation was confined by a metal ring that was heat-shrunk around the cylinder
prior to testing. Both the punch and the foundation were prepared from
anorthositic norite pillar and footwall material from the Impala Platinum Mine. The
w/h ratio of the punch was varied by changing the height. The boundary condition
at the top of the punch (steel to rock) was unrealistic and this parameter controls
the effective w/h ratio. If the interface between the punch and the metal platen
were frictionless, the w/h ratio would be halved as this interface acts as an axis of
symmetry (absence of shear stress). Since this interface had a friction angle of
about 12° (York et al, 1998), it could neither be regarded as a plane of symmetry
nor a rough interface similar to the one between the punch and the foundation.
The true w/h ratio therefore will be greater than 50% of the actual w/h ratio of the
punch, but the effective ratio cannot be quantified with any certainty. In addition,
the shape of the pillar was different from the normal underground pillars and the
ratio in size between the punch and foundation did not adequately represent the
underground situation. These issues need to be considered in any comparison
between the laboratory results and the strength back-analysis or the modelling.
Despite these differences, a remarkable similarity is shown by the curves Figure
5-13. In particular, a good correlation is shown between Equation 5-3 and the
numerical results obtained for the ductile material. Both suggest an approximately
linear relationship between pillar strength and pillar w/h ratio for the range of pillar
sizes in the database.
0
100
200
300
400
500
600
700
800
0 1 2 3 4 5 6 7 8
we/he
Pe
ak
str
en
gth
(M
Pa
)
system brittle
system ductile
Linear back-analysis
Laboratory tests
Figure 5-13 Comparison of the strengths predicted from the database (Linear back-analysis), FLAC modelling (system brittle and system ductile) and laboratory tests performed by Spencer and York (1999)
30
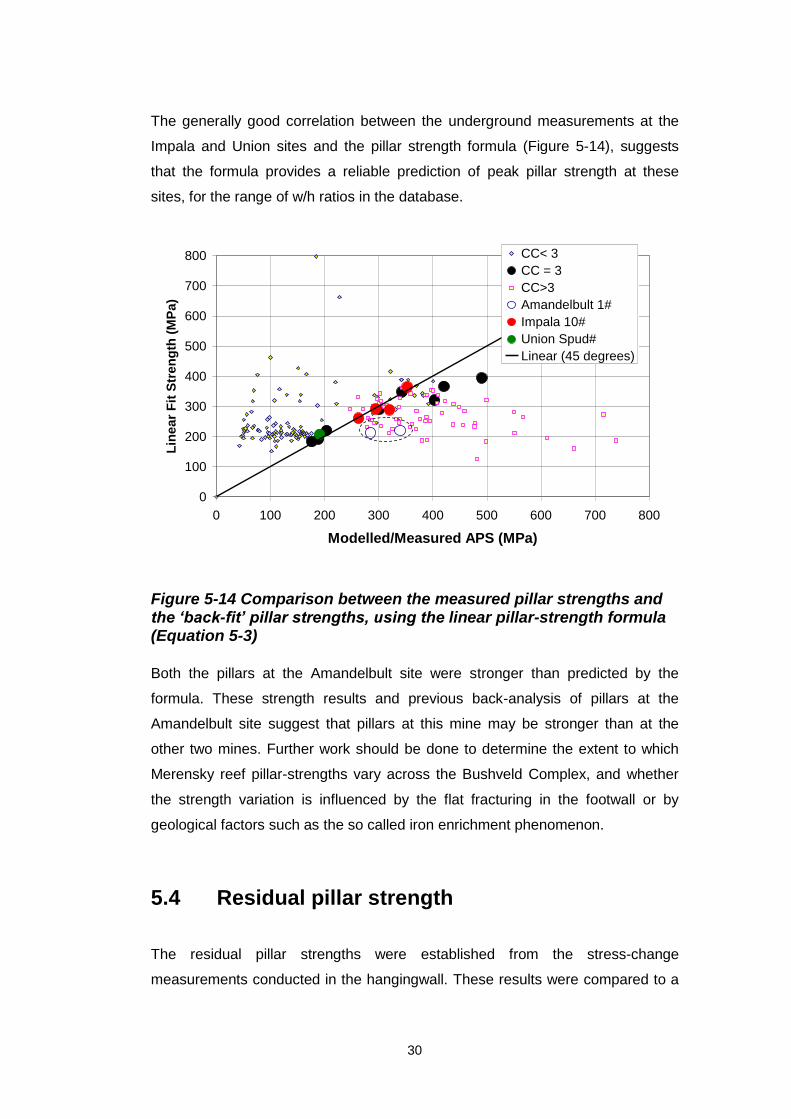
The generally good correlation between the underground measurements at the
Impala and Union sites and the pillar strength formula (Figure 5-14), suggests
that the formula provides a reliable prediction of peak pillar strength at these
sites, for the range of w/h ratios in the database.
0
100
200
300
400
500
600
700
800
0 100 200 300 400 500 600 700 800
Modelled/Measured APS (MPa)
Lin
ea
r F
it S
tre
ng
th (
MP
a)
CC< 3
CC = 3
CC>3
Amandelbult 1#
Impala 10#
Union Spud#
Linear (45 degrees)
Figure 5-14 Comparison between the measured pillar strengths and the ‘back-fit’ pillar strengths, using the linear pillar-strength formula (Equation 5-3)
Both the pillars at the Amandelbult site were stronger than predicted by the
formula. These strength results and previous back-analysis of pillars at the
Amandelbult site suggest that pillars at this mine may be stronger than at the
other two mines. Further work should be done to determine the extent to which
Merensky reef pillar-strengths vary across the Bushveld Complex, and whether
the strength variation is influenced by the flat fracturing in the footwall or by
geological factors such as the so called iron enrichment phenomenon.
5.4 Residual pillar strength
The residual pillar strengths were established from the stress-change
measurements conducted in the hangingwall. These results were compared to a
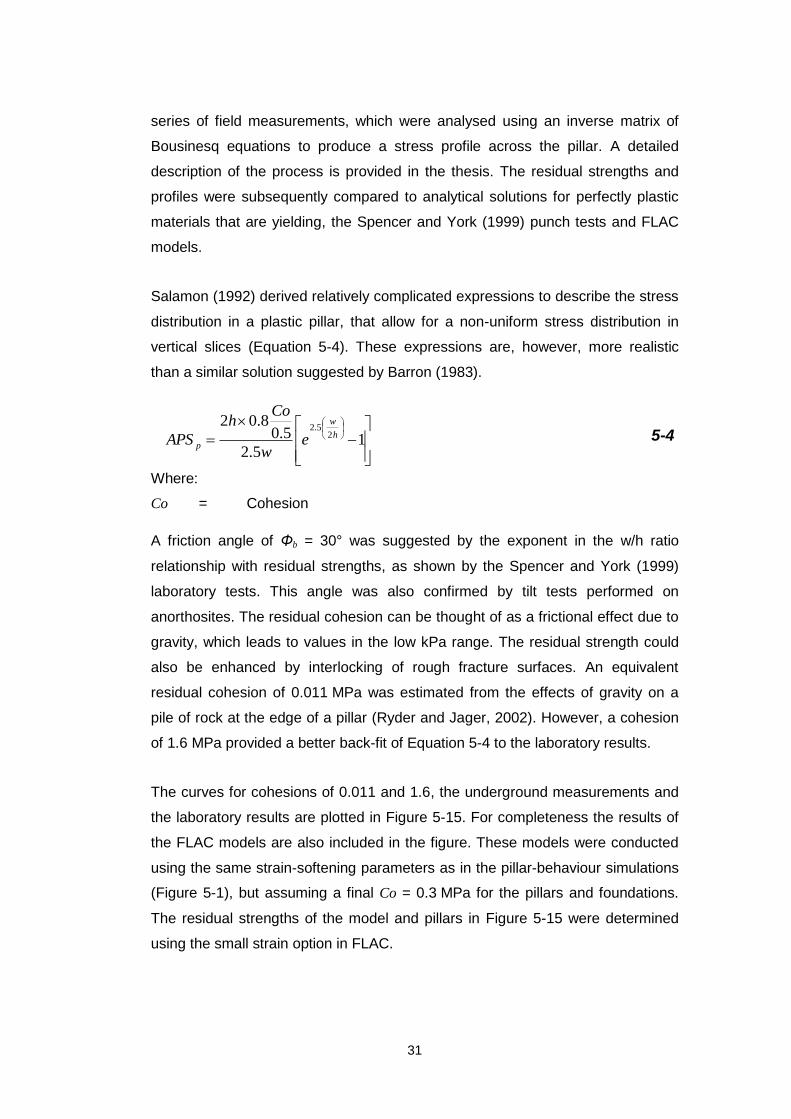
31
series of field measurements, which were analysed using an inverse matrix of
Bousinesq equations to produce a stress profile across the pillar. A detailed
description of the process is provided in the thesis. The residual strengths and
profiles were subsequently compared to analytical solutions for perfectly plastic
materials that are yielding, the Spencer and York (1999) punch tests and FLAC
models.
Salamon (1992) derived relatively complicated expressions to describe the stress
distribution in a plastic pillar, that allow for a non-uniform stress distribution in
vertical slices (Equation 5-4). These expressions are, however, more realistic
than a similar solution suggested by Barron (1983).
15.2
5.08.02
25.2
h
w
p ew
Coh
APS 5-4
Where:
Co = Cohesion
A friction angle of Φb = 30° was suggested by the exponent in the w/h ratio
relationship with residual strengths, as shown by the Spencer and York (1999)
laboratory tests. This angle was also confirmed by tilt tests performed on
anorthosites. The residual cohesion can be thought of as a frictional effect due to
gravity, which leads to values in the low kPa range. The residual strength could
also be enhanced by interlocking of rough fracture surfaces. An equivalent
residual cohesion of 0.011 MPa was estimated from the effects of gravity on a
pile of rock at the edge of a pillar (Ryder and Jager, 2002). However, a cohesion
of 1.6 MPa provided a better back-fit of Equation 5-4 to the laboratory results.
The curves for cohesions of 0.011 and 1.6, the underground measurements and
the laboratory results are plotted in Figure 5-15. For completeness the results of
the FLAC models are also included in the figure. These models were conducted
using the same strain-softening parameters as in the pillar-behaviour simulations
(Figure 5-1), but assuming a final Co = 0.3 MPa for the pillars and foundations.
The residual strengths of the model and pillars in Figure 5-15 were determined
using the small strain option in FLAC.

32
0
50
100
150
200
250
0 2 4 6 8 10 12
Resid
ual A
PS
(M
Pa)
w/h ratio
Barron (Co=0.011 MPa)
Salamon (Co=0.011 MPa)
Salamon (Co=1.6 MPa)
Amandelbult & Union Measurements
Impala measurements
Spencer & York laboratory tests
FLAC (Co=0.3 MPa)
Residual punch resistance of the foundation
Figure 5-15 Pillar w/h ratio-strengthening effects on residual APS. The underground measurements are compared to the Barron (1983) and Salamon (1992) solutions (Φb = 30°), Spencer and York laboratory tests (1999) and FLAC models (Φb = 40°)
The curve resulting from Equation 5-4 fitted the underground measurements at
the Amandelbult and Union sites as well as the laboratory tests when a residual
cohesion of 1.6 MPa was assumed in the equation. However, the underground
data from these sites is clustered within a very small range of w/h ratios.
In order to check the validity of the Salamon equation for determining the effects
of pillar w/h ratio on strength, Equation 5-4 was differentiated and compared to
the measured stress distribution across Amandelbult Pillar P1. The differentiated
equation is shown in Equation 5-5, and provides the vertical stress distribution,
horizontally across the centre of a pillar (h), assuming b = 30° and a cohesion of
1.6.
h
x
yyeS 2
5.2
8.02.3 5-5
The comparison between the solution and the measured stress profile for
Amandelbult P1 is provided in Figure 5-16. It should be noted that neither the
Barron (1983) nor the Salamon equation (1992) considers the effects of the
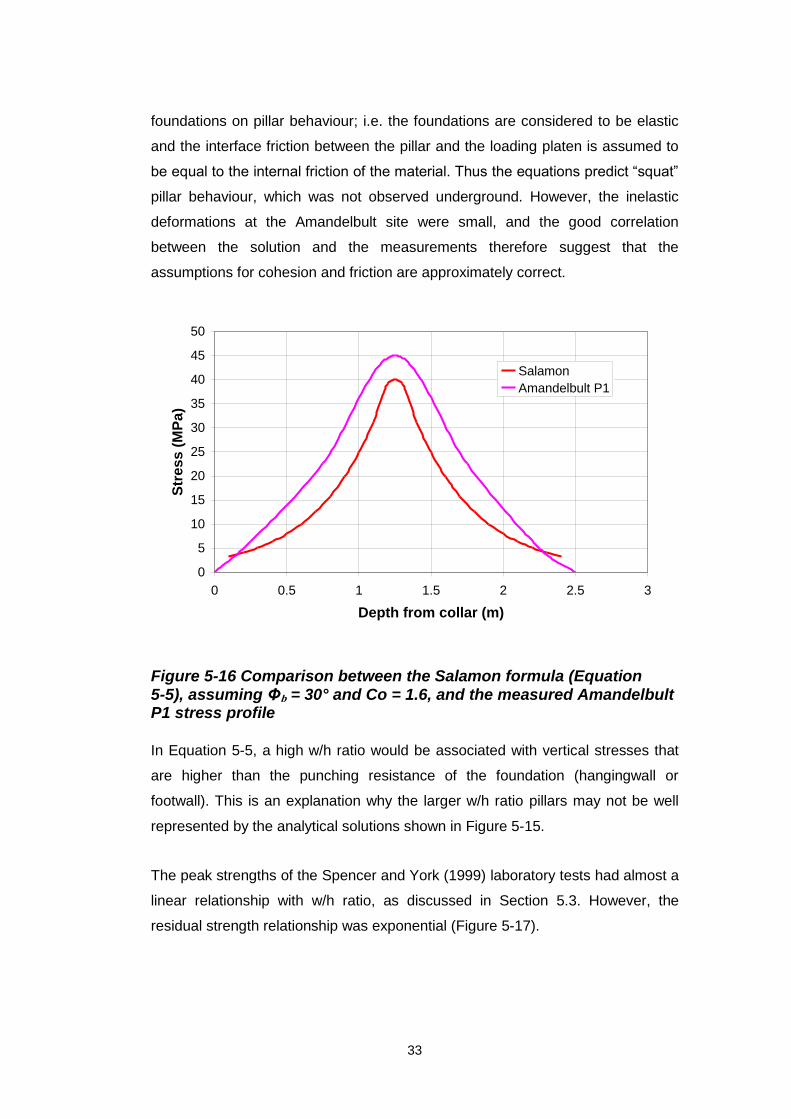
33
foundations on pillar behaviour; i.e. the foundations are considered to be elastic
and the interface friction between the pillar and the loading platen is assumed to
be equal to the internal friction of the material. Thus the equations predict “squat”
pillar behaviour, which was not observed underground. However, the inelastic
deformations at the Amandelbult site were small, and the good correlation
between the solution and the measurements therefore suggest that the
assumptions for cohesion and friction are approximately correct.
0
5
10
15
20
25
30
35
40
45
50
0 0.5 1 1.5 2 2.5 3
Depth from collar (m)
Str
es
s (
MP
a)
Salamon
Amandelbult P1
Figure 5-16 Comparison between the Salamon formula (Equation 5-5), assuming Φb = 30° and Co = 1.6, and the measured Amandelbult P1 stress profile
In Equation 5-5, a high w/h ratio would be associated with vertical stresses that
are higher than the punching resistance of the foundation (hangingwall or
footwall). This is an explanation why the larger w/h ratio pillars may not be well
represented by the analytical solutions shown in Figure 5-15.
The peak strengths of the Spencer and York (1999) laboratory tests had almost a
linear relationship with w/h ratio, as discussed in Section 5.3. However, the
residual strength relationship was exponential (Figure 5-17).

34
0
50
100
150
200
250
300
350
400
450
500
0 1 2 3 4 5 6
Width to height ratio
Str
en
gth
(M
Pa
)
0
0.5
1
1.5
2
2.5
3
Dep
th o
f d
am
ag
e
(dep
th:w
idth
)
Peak
Residual
Damage
Figure 5-17 Results of laboratory punch tests (after Spencer and York, 1999)
The initially higher rate of increase of peak strength with w/h ratio in Figure 5-17
was also shown by the FLAC modelling. A drop in the rate of strength increase at
higher w/h ratios indicates pillar punching, assuming the punches, foundations
and confinements provided to the foundations by the metal rings in the three tests
were all the same. This punching was also illustrated by a large increase in the
depth of damage into the foundation when w/h ratios were increased from one to
three in the laboratory tests (Figure 5-17). The increase in the depth of damage
between w/h ratios of three and five is smaller, possibly as a result of the
mobilisation of Prandtl wedge-type fractures.
It should be emphasised that there are fundamental differences between the
laboratory tests and analytical solutions. For instance, the analytical solution is
based on the limit equilibrium of the material that is loaded between two solid
platens; in contrast, the punch test allows for damage in the foundation. This
foundation damage can have significant implications for peak pillar strength as
has been described in Section 5.2. In addition, the formulae are based on plane
strain conditions, whereas the laboratory tests were axisymetrical. This geometric
effect will also result in different relationships between w/h ratio and strength.
Despite the differences, an attempt was made to match the laboratory results
with the Salamon analytical model (Equation 5-4). Since the Salamon equation
overestimates the stress around the core of the pillar, the average pillar stresses

35
may also be overestimated. This would be particularly true for larger w/h ratios. In
order to match the Salamon equation with the results of the laboratory tests, a
relatively low effective friction angle has therefore to be selected in this equation.
The actual material friction angle can thus be expected to be higher.
It can also be argued that the w/h ratio of the laboratory specimens was affected
by the boundary conditions, especially the interface between the steel platen and
the small rock disc. The limited friction along this interface would cause a
decrease in the effective w/h ratio of the disc because of a reduced clamping
effect. If it is assumed that this decrease could be as much as 25%, the
parameters for the Salamon equation (Equation 5-4) need to be adjusted. A
sensitivity analysis showed that the friction angle and the residual cohesion could
vary between 25° and 31° and 1.6 MPa and 0.7 MPa, respectively, to match the
laboratory results with the equation.
The magnitude of the calibrated internal friction angle (30°) seems realistic,
especially since the actual material friction angle can be expected to be slightly
higher as explained above. The cohesion is much higher than would be expected
of a crushed material. One possible explanation is that the material is not
completely crushed and that the broken rock actually maintains a surprisingly
high residual strength. The pillar centre may also be more ductile and therefore
less fractured as a result of confining stresses that could develop here. The effect
of confinement on brittleness was researched by Fang and Harrison (2002). The
residual strength resulting from friction between blocks, held together by gravity,
would only account for about 1% of the calibrated value. The relatively high
strength of broken rock has not been reported previously but it is an extremely
important parameter, especially for the design and behaviour of crush pillars. The
residual strength is probably influenced by a combination of the following factors:
Interlocking blocks;
Block size;
Failure violence;
Peak strength; and
Residual cohesion.
These factors may not be constant.

36
The uncertainty of retaining the relatively high residual cohesion is of concern as
a drop in the cohesion may result in a drop in residual strength. This possible
drop in cohesion was suggested by the time dependant decrease in stress that
was measured over a period of years after mining had been completed at the
Union site.
Neither the analytical nor the laboratory results matched the flat, linear
relationship between pillar residual strength and w/h ratio as measured
underground at the Impala site (Figure 5-15). Since the pillars at this site
represent mainly the higher w/h ratios, the effects of the fractured foundation
bearing capacity were investigated using FLAC modelling and an analytical
solution for bearing capacity.
The ultimate bearing capacity of the pillar foundation is dependent on the
cohesion and friction and dilation angles of the foundation material. No further
increase in residual pillar strength can be expected above the bearing capacity.
The results in Figure 5-15 suggest that an increase in residual strength with w/h
ratio only occurs up to pillar w/h ratios of about three. No further increase in
strength can be expected for greater w/h ratios. The relationship between
cohesion (C0) and bearing capacity (BC) for a given friction angle is shown in
Equation 5-6 (Meyerhof, 1951). The dilation and friction angles are assumed to
be the same in the equation (associative flow rule).
0
2tan cot12
45tan CeBC
5-6
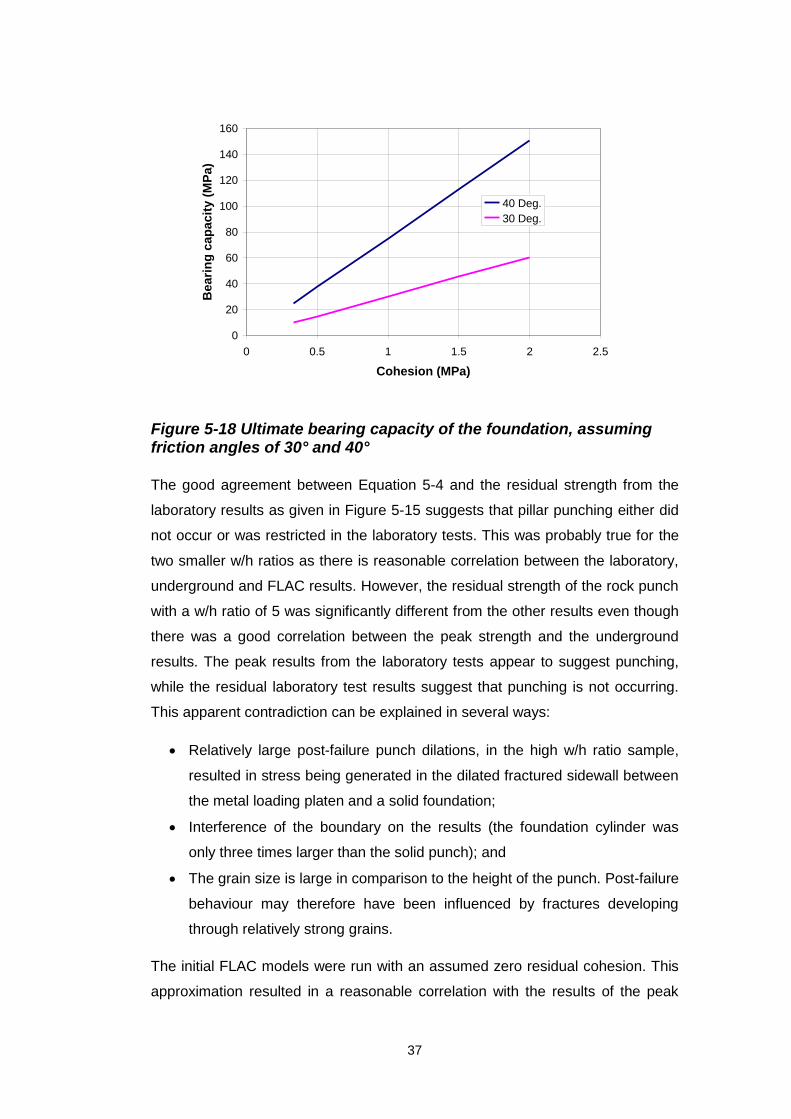
Bearing capacity has been plotted as a function of cohesion for friction angles of
30° and 40° in Figure 5-18. The ultimate bearing capacity of the pillars, as shown
in Figure 5-15, appears to be about 33 MPa. This suggests cohesions of about
1.1 MPa or 0.4 MPa for friction angles of 30° or 40°, respectively. The FLAC
models indicated a cohesion of 0.3 MPa at a friction angle of 40°. The difference
between the model and the analytical solution is probably because the
associative flow rule was not assumed in the model. The dilation angle in the
model was 10°.
37
0
20
40
60
80
100
120
140
160
0 0.5 1 1.5 2 2.5
Cohesion (MPa)
Be
ari
ng
cap
ac
ity (
MP
a)
40 Deg.
30 Deg.
Figure 5-18 Ultimate bearing capacity of the foundation, assuming friction angles of 30° and 40°
The good agreement between Equation 5-4 and the residual strength from the
laboratory results as given in Figure 5-15 suggests that pillar punching either did
not occur or was restricted in the laboratory tests. This was probably true for the
two smaller w/h ratios as there is reasonable correlation between the laboratory,
underground and FLAC results. However, the residual strength of the rock punch
with a w/h ratio of 5 was significantly different from the other results even though
there was a good correlation between the peak strength and the underground
results. The peak results from the laboratory tests appear to suggest punching,
while the residual laboratory test results suggest that punching is not occurring.
This apparent contradiction can be explained in several ways:
Relatively large post-failure punch dilations, in the high w/h ratio sample,
resulted in stress being generated in the dilated fractured sidewall between
the metal loading platen and a solid foundation;
Interference of the boundary on the results (the foundation cylinder was
only three times larger than the solid punch); and
The grain size is large in comparison to the height of the punch. Post-failure
behaviour may therefore have been influenced by fractures developing
through relatively strong grains.
The initial FLAC models were run with an assumed zero residual cohesion. This
approximation resulted in a reasonable correlation with the results of the peak

38
pillar strength back-analysis shown in Section 5.3. The residual strength results
were, however, different from the underground and laboratory results,
A second set of FLAC models was run using the original material parameters but
assuming that the cohesion did not drop to zero at residual strength levels. A
residual cohesion of 1.0 MPa was used together with a loading rate that was
reduced to zero at the end of the runs. The results are shown in Figure 5-19. A
significant drop in stress occurred when the loading rate was reduced to zero, but
in these models a more realistic residual strength was obtained. The subsequent
very slow loading rate also did not change the residual strength. These models
showed that there is an almost linear increase in residual strength with w/h ratio
up to a w/h ratio of about 3 (Figure 5-15). Although the models appear to have
reached the bearing capacity of the foundations at a w/h ratio of 3, the peak
strength increased with w/h ratio to a ratio of about 10 as discussed in Section
5.3. The peak strengths were again modelled, including the residual cohesion
and a very slow loading rate. There was very little difference between the results
of the former and latter models on the peak pillar strength.
0
100
200
300
400
500
600
700
800
900
0.0 2.0 4.0 6.0 8.0 10.0 12.0 14.0 16.0 18.0
Strain (MilliStrain)
Str
ess (
MP
a)
w/h=1
w/h=2
w/h=3
w/h=4
w/h=6
w/h=12
Figure 1-3
Loading
stopped
Very slow
loading
Figure 5-19 Stress-strain curves of pillar-systems with different pillar w/h ratios. Generated by FLAC, assuming a constant pillar width and varying the pillar height. Residual cohesion = 1.0 MPa
A good match between the underground results, the two lower w/h ratio
laboratory tests and the FLAC models was shown if a cohesion of 0.3 MPa was

39
assumed in the model. These FLAC results have been included in Figure 5-15.
Finally, the friction angle of 40°, which may be applicable to the pre-failed pillar,
may be too high for the failed pillars.
The results shown in Figure 5-19 suggest that the currently accepted pillar
behaviour, as shown in Figure 1-6 does not apply to a pillar system that includes
foundations with similar or weaker strength properties than the pillar. Both the
models and underground measurements showed that Merensky pillars with w/h
ratios greater than five can fail under sufficiently high loading conditions. The
conditions shown in Figure 1-6 only hold if relatively low strains are considered,
such as indicated by the dashed line in Figure 5-19.
5.5 Design of crush pillars
The design of crush pillars should provide for sufficient residual strength while
ensuring that the pillar is small enough to fail stably. The residual strength
requirement is for a minimum support resistance of 1 MPa across the stope
(Roberts et al, 2005). This translates into a pillar stress of about 10 MPa if the
pillar lines are spaced 30 m apart.
Crush pillars that are designed or cut too large are a potential safety hazard as
oversized pillars are too strong and may burst if failure occurs under soft loading
conditions. At shallower depths violent failures of over-sized pillars generally
occur at a significant distance behind the working area with little risk. However,
as mining proceeds deeper, violent failures occur closer to the working area. An
investigation into pillar bursts showed that these bursts occur from about 10 m to
14 m behind the advancing face. MinSim models were used to determine the
strata loading stiffness at 10 m behind the face. A loading stiffness of about
5.0 mm/GN (line “A” in Figure 5-20) was determined from the models. None of
the instrumented crush pillars burst and the average unloading conditions were
about 3.2 mm/GN (Line “B” in Figure 5-20). A semi-stable pillar failure occurred
within 7 m from the lagging face. For this reason a strata loading stiffness of
about 3.2 mm/GN can be considered safe for Merensky pillars, and this is
normally achieved within 5 m of the face in shallow to intermediate depth
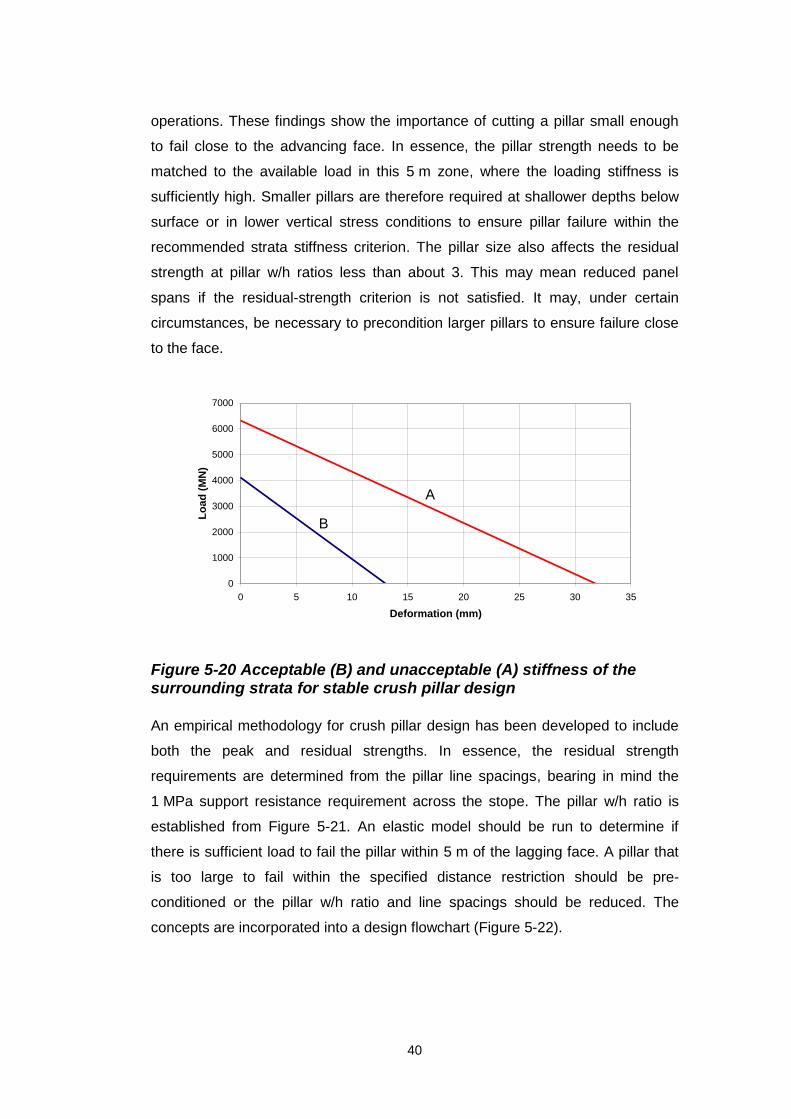
40
operations. These findings show the importance of cutting a pillar small enough
to fail close to the advancing face. In essence, the pillar strength needs to be
matched to the available load in this 5 m zone, where the loading stiffness is
sufficiently high. Smaller pillars are therefore required at shallower depths below
surface or in lower vertical stress conditions to ensure pillar failure within the
recommended strata stiffness criterion. The pillar size also affects the residual
strength at pillar w/h ratios less than about 3. This may mean reduced panel
spans if the residual-strength criterion is not satisfied. It may, under certain
circumstances, be necessary to precondition larger pillars to ensure failure close
to the face.
0
1000
2000
3000
4000
5000
6000
7000
0 5 10 15 20 25 30 35
Deformation (mm)
Lo
ad
(M
N)
A
B
Figure 5-20 Acceptable (B) and unacceptable (A) stiffness of the surrounding strata for stable crush pillar design
An empirical methodology for crush pillar design has been developed to include
both the peak and residual strengths. In essence, the residual strength
requirements are determined from the pillar line spacings, bearing in mind the
1 MPa support resistance requirement across the stope. The pillar w/h ratio is
established from Figure 5-21. An elastic model should be run to determine if
there is sufficient load to fail the pillar within 5 m of the lagging face. A pillar that
is too large to fail within the specified distance restriction should be pre-
conditioned or the pillar w/h ratio and line spacings should be reduced. The
concepts are incorporated into a design flowchart (Figure 5-22).

41
0
5
10
15
20
25
30
35
40
45
50
0 2 4 6 8 10 12
w/h ratio
Resid
ual
AP
S (
MP
a)
Approximate design line
Amandelbult & Union Measurements
Impala measurements
Spencer & York laboratory tests
FLAC (Co=0.3 MPa)
Merensky crush
pillar design
Residual punch resistance
of the foundation
Figure 5-21 Pillar residual strength as a function of w/h ratio
Determine the available load
from an elastic model
Stress sufficient to
fail pillar near facePreconditioning
Change panel
span or pillar size
Optimum pillar dimensions
from Figure 5-21
Yes
NoNo
Stop
Determine residual strength
requirements
Determine peak pillar strength
from Equation 5-3
Determine the available load
from an elastic model
Stress sufficient to
fail pillar near facePreconditioning
Change panel
span or pillar size
Optimum pillar dimensions
from Figure 5-21
Yes
NoNo
Stop
Determine residual strength
requirements
Determine peak pillar strength
from Equation 5-3
Figure 5-22 Flowchart for Merensky crush pillar design

42
The design line shown in Figure 5-21 is divided into two sections. To the left of
the dashed line, the design profile is described by the Salamon equation (5-4),
which was calibrated by the Spencer and York (1999) laboratory tests. The
remarkable fit to the FLAC results and the underground measurements lends
credence to the exponential profile of this line for pillars with w/h ratios up to
about three. Both the underground measurements and the FLAC modelling show
a flat profile to the right of the dashed line. The design line in this region of the
graph assumes a fractured foundation with a bearing capacity of 33 MPa. There
is therefore no strength benefit of cutting pillars with w/h ratios greater than about
3.2.
43
6 Conclusions
In the literature there are few references to underground measurements of peak
and residual pillar strengths and pillar behaviour. The comprehensive
measurement and analysis programme that was conducted for this thesis is the
most extensive research into hard rock pillar behaviour in South Africa and
perhaps in the world. In particular, this research has contributed significantly to
the understanding of Merensky pillar behaviour in narrow tabular excavations.
The discovery of nonlinear elastic conditions in the laboratory rock tests
necessitated further studies of this behaviour in order to understand the rock
mass behaviour. From the results of the research, the following conclusions can
be drawn:
Nonlinear behaviour of rock
Laboratory tests performed on nonlinear elastic rock materials showed an initial
increase in Young‟s Modulus with increasing stress. Unrealistically high Poisson‟s
ratios were also indicated. The research suggests that the behaviour of these
rocks is influenced by closure and sliding of microcracks. Laboratory results were
therefore controlled by two components of strain, i.e. a linear elastic „matrix‟ and
the behaviour of the microcracks. In the context of Rock Mechanics, the concept
of two strain components was used to develop a methodology to evaluate the
stress measurements conducted in this material.
Rock mass behaviour
The results of extensometers showed the validity of using elastic theory for the
analysis of the underground measurements conducted in unfractured rock. This
extensometer was installed through the centre of a pillar from the haulage below.
44
Nonlinear elastic behaviour was observed in laboratory tests from all three of the
instrumentation sites. However, at the Amandelbult and Union sites, only
samples retrieved from high stress areas showed the phenomenon. At these
sites, the test samples were influenced by the tensile stresses at the drill-tip
during drilling and the rock mass did not become nonlinear. However, the rock
mass at the Impala site was nonlinear in areas where the stress had dropped
below 6 MPa.
The concept of stress „channelling‟ in the anorthositic rocks was suggested by
measurements conducted at the Impala and Union sites. The comparatively
higher horizontal stress in this rock type is thought to be a reason for the footwall
fracturing at these two sites. However, the phenomenon was not measured at the
Amandelbult site and further research is therefore required to verify the concept.
This fracturing may have influenced the effective pillar w/h ratios and could be an
explanation for the stronger pillars at the Amandelbult site.
FLAC models were used to clarify the interrelationship between stopes and
pillars. It was found that the draping of the hangingwall and footwall over the
pillars results in premature edge failure of pillars and subsequently also effects
their brittleness. In addition, where the foundations are of similar strength to the
pillar, failure may not be contained in the pillar only but in larger w/h ratio pillars
will extend into the foundations.
In essence, the failure behaviour of a pillar system involves a combination of
three mechanisms. Initially, there is fracturing and crushing of the pillar itself,
which occurs at small w/h ratios. Subsequently vertical “Herzian” cracks form in
the foundation. However, this footwall and/or hangingwall fracturing is not
synonymous with foundation failure. Finally, shear fracturing and wedge
formation occurs below larger w/h ratio pillars which controls the ultimate punch
resistance. Punching is accommodated by horizontal dilation along Prandtl
wedge-type fractures, that would add to the inelastic closure observed in a panel.
Vertical fractures were observed in the hangingwall above pillars at the
Amandelbult and Impala sites. The dilation that occurred during the formation of
these fractures was also measured by a sub-horizontal extensometer installed
45
over a pillar at the Impala site. Prandtl wedge-type fractures were observed in a
cutting that was blasted between the gully and a pillar at the Impala site.
The pillars at the Amandelbult site were ideal for calibrating numerical models as
little inelastic deformation occurred where the closure measurements were made.
It was therefore possible to measure the strain associated with pillar failure
without the errors associated with footwall or hangingwall fracturing.
Pillar behaviour
Strain softening parameters were determined from the pillar measurements at
Amandelbult. A series of FLAC models were run to determine the effect of w/h
ratio on peak and residual strength. A sensitivity analysis was done on brittleness
and the effects of infinitely strong, elastic foundations were investigated. The
results showed that punching initiated at ~3 x UCS. The w/h ratio at which
punching initiated was influenced by material brittleness. Little or no damage is
likely in the foundations below pillars with low w/h ratios. In the more ductile
(calibrated) models, the initial rate of strength increase with w/h ratio appears to
have been steeper until the initiation of foundation failure. An approximately linear
relationship between pillar strength and w/h ratio was shown in the range from
one to about eight.
A linear relationship between peak pillar strength and w/h ratio was also
suggested by the results of a Maximum Likelihood evaluation of a database of
failed and unfailed Merensky pillars. An empirical equation for peak pillar strength
was derived from the analysis of the Impala pillars. Infinitely long pillars were
used in the equation to allow comparison with the calibrated FLAC models, and a
good correlation was observed. A series of appropriate laboratory tests also
correlated well with the model results.
Underground stress change measurements were conducted at optimum heights
above seven pillars with a range of w/h ratios at the three sites. Both the peak
and residual strengths were determined from these measurements. The peak
measurements were checked using small grid-size MinSim models. The APS of

46
the pillars at the Impala and Union sites correlated well with the derived formula
for peak pillar strength.
The measured pillar residual strengths were compared to a set of suitably
prepared laboratory tests, analytical solutions for perfectly plastic materials that
are yielding and FLAC models. The solutions and the laboratory tests suggested
an exponential relationship between strength and w/h ratio for pillars ranging up
to a w/h ratio of 3.2. However, no significant increase in pillar strength was
measured in pillars with w/h ratios greater than 3.2, and this limit was also
confirmed by FLAC models. The FLAC models also correlated well with the
laboratory tests and pillar measurements for w/h ratios less than 3.2. The pillar
measurements and FLAC models suggest that the bearing capacity of the
fractured foundations is 33 MPa and no further increase in strength can be
expected.
The internal friction angle for the crushed pillars was established to be between
30° and 40°. The laboratory tests, analytical solutions and the FLAC models
showed unexpectedly high values of cohesion for these friction angles. An
analytical solution for bearing capacity confirmed the high cohesions, ranging
between 1.1 MPa and 0.4 MPa for the 30° to 40° friction angles. This range of
cohesions was established assuming a bearing capacity of 33 MPa in the
solution. The uncertainty of retaining the high residual cohesion is of concern as
a drop in this parameter will result in a drop in the residual strength of the pillar.
Further research is therefore recommended to determine the mechanism/reasons
for this high cohesion.
Although the models appear to have reached the bearing capacity of the
foundations at a w/h ratio of 3, the peak strength increased with w/h ratio to a w/h
ratio of about 10.
Crush pillar design
The established relationships of peak and residual pillar strengths with w/h ratio
were used to develop a design methodology for Merensky crush pillars. The

47
literature suggests that a stress of 1 MPa across the panel is required to avoid a
backbreak. This translates into a residual stress of 10 MPa if the pillar lines are
spaced 30 m apart. The residual strength requirements determine the pillar w/h
ratio. Pillars cut too wide for the loading environment may fail violently under a
soft loading environment. It was found that, at shallow to intermediate depth
below surface, violent failure did not occur when pillars failed within 5 m of the
lagging face. The loading stiffness of the surrounding strata is about 3.2 mm/GN
in this stable loading environment. Should the loading capacity of the strata be
insufficient to fail the pillars within 5 m of the face, either lower w/h ratio pillars are
required or preconditioning could be considered. Smaller pillars should be
designed in the context of the 1 MPa support requirements, which may mean a
reduction in the panel span.
As a consequence of this work on monitoring the stopes and pillars, a better
understanding of rock mass behaviour around stopes and pillars has been
gained. It is realised that the design of pillars must be considered as a system
including the pillars, foundations and the stope. The design is based on the
minimum of 1 MPa support resistance across the stope which in turn defines the
dimensions and spacings of pillars. A flowchart was developed to enable easy
crush pillar design (Figure 5-22).
The research has contributed to the South African platinum industry by providing
guidelines for Merensky crush pillar design (based on underground
measurements), which was not previously available. Proper implementation of
the guidelines will result in improved extraction ratios and/or safety using optimal
pillar dimensions to ensure stable pillar crushing. In addition, a formula for peak
pillar strength was established for use at the Impala platinum- and other similar
mines. A comparable study of UG2 behaviour would be required for design of
crush pillars on this reef.
48
7 References
Barron, K. (1983). An analytical approach to the design of pillars in coal,
Contract Report No. 1SQ80-00161, Canada Center for Mineral and Energy
Technology, Energy, Mines and Resources, Canada, pp. 36-42.
Barton, N. (1988). Rock mass classification and tunnel reinforcement selection
using the Q-system, Rock classification systems for engineering purposes. ASTM
STP 984 Louis Kirkaldie. Ed., American Society for Testing and Materials.
Philadelphia, USA, pp. 59-88.
Bieniawski, Z.T. and Van Heerden, W.L. (1975). The significance of in situ tests
on large rock specimens, Int. J. Rock Mech. Min. Sci. and Geomech. Abstr., Vol.
12 no.4, pp. 101-113.
Bristow, J.R. (1960) Micro-cracks and the static and dynamic elastic constants
of annealed and heavily cold-worked metals, British J. Appl. J. Phys., Vol. 11, pp.
81-85.
Carvalho, F.C.S., Chen, C. and Labuz, J.F. (1997) Measurements of effective
elastic modulus and microcrack density, Int. J. Rock Mech. and Min. Sci., Vol. 34,
No. 3–4, Paper No. 043, p. 548.
COMRO. (1981). MINSIM-D User‟s Manual, Chamber of Mines of South Africa,
Johannesburg, RSA.
Fang, Z. and Harrison, J.P. (2002). Application of a local degradation model to
the analysis of brittle fracture of laboratory scale rock specimens under triaxial
conditions, Int. J. of Rock Mech. and Min. Sci., Vol. 39, pp. 459-476.
Hertz, H. (1896). On the contact of rigid solids and on hardness, Miscellaneous
Papers, Macmillan, London, UK.
Itasca consulting group, inc. (1993). Fast Lagrangian Analysis of Continua
(FLAC), Vers. 3.2. Minneapolis Minnesota, USA.

49
Jager, AJ and Ryder, JA. (1999). A Handbook on Rock Engineering Practice for
Tabular Hard Rock Mines, The Safety in Mines Research Advisory Committee
(SIMRAC), Braamfontein, RSA.
Kachanov, M. (1992). Effective elastic properties of cracked solids: critical
review of some basic concepts, Appl. Mech. Rev., Vol. 45, pp. 304-335.
Lougher, D.R. (1994). An in-situ investigation into the behaviour of the
surrounding rock mass in a hard rock pillar mining environment, MSc research
report, Dept. of Mining Engineering, University of Witwatersrand, Johannesburg,
RSA.
Meyerhof, G.G. (1951). The ultimate bearing capacity of foundations,
Geotechnique, Vol. 5, pp. 301-332.
Özbay, MU and Roberts, MKC. (1988). Yield pillars in stope support, Proc. Rock
Mechanics in Africa, SANGORM Congress 1988, Johannesburg, RSA.
Özbay, MU; Ryder, JA and Jager, AJ. (1995). The design of pillar systems as
practised in shallow hard-rock tabular mines in South Africa, J. S.A. Inst. Min. and
Metall., Jan/Feb 1995, pp. 7-18.
Prandtl, L. (1921). Zeit. Angew. Math. Mech., Vol.1, No.1, pp. 15-20.
Roberts, D.P., Canbulat, I. and Ryder, J.A. (2002). Design parameters for mine
pillars: strength of pillars adjacent to gullies; design of stable pillars with w/h ratio
greater than 6; optimum depth for crush pillars, SIMRAC GAP617 Final Report,
The Safety in Mines Research Advisory Committee (SIMRAC), Braamfontein,
RSA.
Roberts, D.P., Roberts, M.K.C., Jager, A.J. and Coetzer, S. (2005). The
determination of the residual strength of hard rock crush pillars with a width to
height ratio of 2:1, J. S.A. Inst. Min. and Metall., Vol. 105, pp. 401-408.

50
Ryder, J.A. and Jager, A.J. (2002). A textbook on rock mechanics for tabular
hard rock mines, The Safety in Mines Research Advisory Committee (SIMRAC),
Braamfontein, RSA, pp. 174-278.
Ryder, J.A. and Özbay, M.U. (1990). A methodology for designing pillar layouts
for shallow mining, Int. Symp. on Static and Dynamic considerations in Rock
Eng., Swaziland, ISRM, pp. 273-286.
Ryder, J.A., Watson, B.P. and Kataka, M.O. (2005). Pillar strength back-
analyses, PlatMine project report 1.2, CSIR, Division of Miningtek, Johannesburg.
RSA.
Sakaguchi, K. Iino, W. and Matsuki, K. (2002). Damage in a rock core caused
by induced tensile stresses and its relation to differential strain curve analysis, Int.
J. Rock Mech. Min. Sc., Vol.39, pp. 367-380.
Salamon, M.D.G. (1992). Strength and stability of coal pillars, Workshop on coal
pillar mechanics and design, US Bureau of the Interior, US Bureau of Mines,
Santa Fe, USA.
Spencer, D and York, G. (1999). Back-analysis of yielding pillar system
behaviour at Impala Platinum Mine, Proc. SARES99, Johannesburg, RSA, pp 44-
52.
Swart, A.H., Stacey, T.R., Wesseloo, J., Joughin, W.C., le Roux, K., Walker,
D. and Butcher, R. (2000). Investigation of factors governing the
stability/instability of stope panels in order to define a suitable design
methodology for near surface and shallow mining operations, SIMRAC Project
Report OTH 501, The Safety in Mines Research Advisory Committee (SIMRAC),
Braamfontein, RSA.
Teufel, L.W. (1983). Determination of in-situ stress from anelastic strain recovery
measurements of oriented cores, SPE/DOE 11649, Denver, USA, pp. 421-430.
51
Teufel, L.W. (1989). A mechanism for anelastic strain recovery of cores from
deep boreholes: time-dependent micro cracking, Eos, Trans. Am. Geophys.
Union, Vol. 70, pp. 476.
Walsh, J.B. (1965). The effect of cracks on the uniaxial elastic compression of
rocks, J. Geophys. Res., Vol. 70, pp. 399-411.
Watson, B.P. (2003). The feasibility of using rock mass ratings for the design of
panel spans and support in the shallow to intermediate depth Bushveld Platinum
Mines, MSc dissertation, Dept. of Mining Engineering, University of
Witwatersrand, Johannesburg, RSA.
Watson, B.P., Ryder, J.A., Kataka, M.O., Kuijpers, J.S. and Leteane, F.P.
(2008). Merensky pillar strength formulae based on back-analysis of pillar failures
at Impala Platinum, J. S.A. Inst. Min. and Metall., Vol.108, pp. 449-461.
York, G., Canbulat, I., Kabeya, K.K., Le Bron, K., Watson, B.P. and Williams,
S.B. (1998). Develop guidelines for the design of pillar systems for shallow and
intermediate depth, tabular, hard rock mines and provide a methodology for
assessing hangingwall stability and support requirements for the panels between
pillars, SIMRAC project GAP 334, The Safety in Mines Research Advisory
Committee (SIMRAC), Braamfontein, RSA.

![PointLoadTestofHalf-CylinderCoreUsingtheNumericalModel … · 2019. 7. 30. · Mechanics (ISRM) [3] and have been widely adopted. ... ment method of stope ground pressure and the](https://static.fdocuments.in/doc/165x107/60ceedc244bba17a503ea08e/pointloadtestofhalf-cylindercoreusingthenumericalmodel-2019-7-30-mechanics.jpg)