gann arc.pdf
8
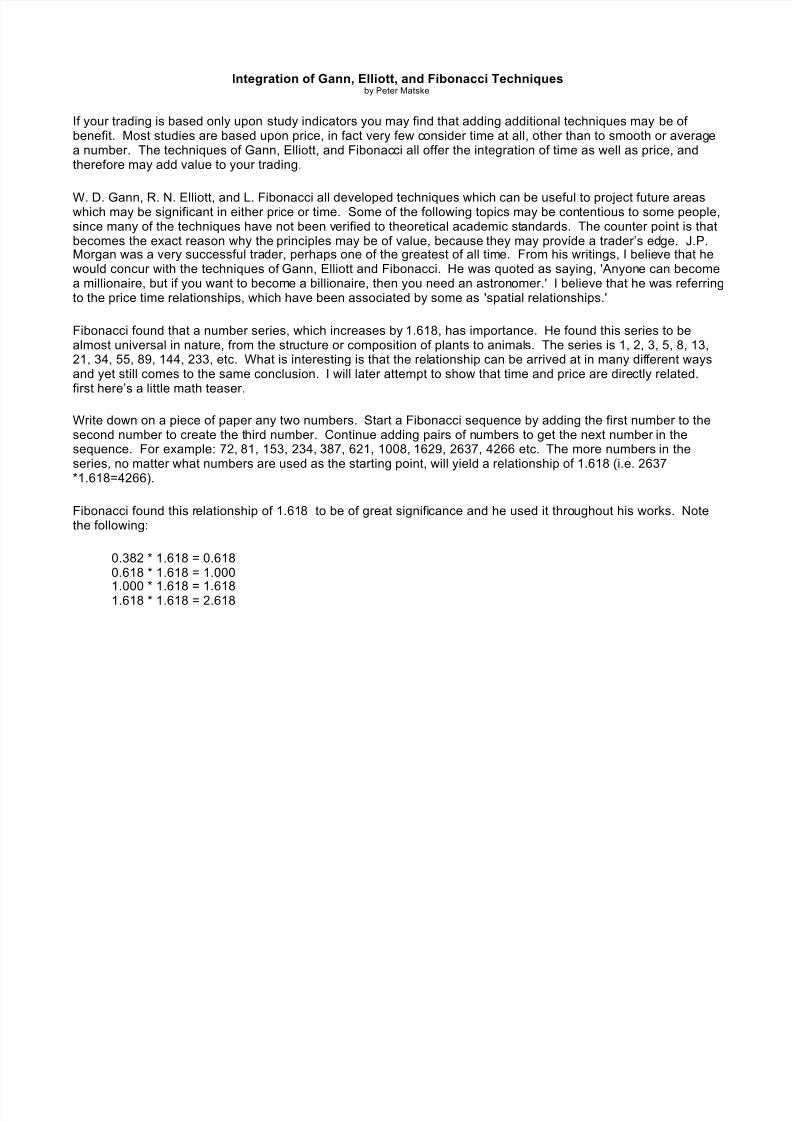
Integration of Gann, Elliott, and Fibonacci Techniques by Peter Matske If your trading is based only upon study indicators you may find that adding additional techniques may be of benefit. Most studies are based upon price, in fact very few c onsider time at all, other than to smooth or averag e a number. The techniques of Gann, Elliott, and Fibonac ci all offer the integration of time as well as price, and therefore may add value to your trading. W. D. Gann, R. N. Elliott, and L. Fibonacci all developed techniques which can be useful to project future areas which may be significant in either pri ce or time. Some of the following topics may be contentious to some people, since many of the techniques have not been v erified to theoretical academic st andards. The counter point is that becomes the exact reason why the principles may be of value, because they may provide a trader’s ed ge. J.P. Morgan was a very successful tra der, perhaps one of the greatest of all time. From his writings, I belie ve that he would concur with the techniques of Gann, Elliott and Fibonacci. He was quoted as saying, 'Anyon e can become a millionaire, but if you want to become a billionaire, then you need an astron omer.' I believe that he was referring to the price time relationships, which have been associated by some as 'spatial relationships.' Fibonacci found that a number series, which increases by 1.618, has importance. He found this series to be almost universal in nature, from the structure or composition of plants to animal s. The series is 1, 2, 3, 5, 8, 13, 21, 34, 55, 89, 144, 233, etc. What is interesting is that the rel ationship can be arrived at in many dif ferent ways and yet still comes to the same conclusion. I will later attempt to show that time and price are dire ctly related. first here’s a little math teaser. Write down on a piece of paper any two numbers. Start a Fibonacci sequence by adding the first number to the second number to create the third number. Continue adding pairs of n umbers to get the next number in the sequence. For example: 72, 81, 153, 234, 387, 621, 1008, 1629, 2637, 4266 etc. The more numbers in the series, no matter what numbers are used as the starting point, will yield a relationship of 1.618 (i.e. 2637 *1.618=4266). Fibonacci found this r elationship of 1.61 8 to be of great signifi cance and he used it thro ughout his works. Note the following: 0.382 * 1.618 = 0.618 0.618 * 1.618 = 1.000 1.000 * 1.618 = 1.618 1.618 * 1.618 = 2.618
-
Upload
mohit-jain -
Category
Documents
-
view
481 -
download
13
Transcript of gann arc.pdf
7/22/2019 gann arc.pdf
http://slidepdf.com/reader/full/gann-arcpdf 1/8
Integration of Gann, Elliott, and Fibonacci Techniquesby Peter Matske
If your trading is based only upon study indicators you may find that adding additional techniques may be ofbenefit. Most studies are based upon price, in fact very few consider time at all, other than to smooth or averagea number. The techniques of Gann, Elliott, and Fibonacci all offer the integration of time as well as price, andtherefore may add value to your trading.
W. D. Gann, R. N. Elliott, and L. Fibonacci all developed techniques which can be useful to project future areaswhich may be significant in either price or time. Some of the following topics may be contentious to some people,since many of the techniques have not been verified to theoretical academic standards. The counter point is thatbecomes the exact reason why the principles may be of value, because they may provide a trader’s edge. J.P.Morgan was a very successful trader, perhaps one of the greatest of all time. From his writings, I believe that hewould concur with the techniques of Gann, Elliott and Fibonacci. He was quoted as saying, 'Anyone can becomea millionaire, but if you want to become a billionaire, then you need an astronomer.' I believe that he was referringto the price time relationships, which have been associated by some as 'spatial relationships.'
Fibonacci found that a number series, which increases by 1.618, has importance. He found this series to bealmost universal in nature, from the structure or composition of plants to animals. The series is 1, 2, 3, 5, 8, 13,21, 34, 55, 89, 144, 233, etc. What is interesting is that the relationship can be arrived at in many different waysand yet still comes to the same conclusion. I will later attempt to show that time and price are directly related.
first here’s a little math teaser.
Write down on a piece of paper any two numbers. Start a Fibonacci sequence by adding the first number to thesecond number to create the third number. Continue adding pairs of numbers to get the next number in thesequence. For example: 72, 81, 153, 234, 387, 621, 1008, 1629, 2637, 4266 etc. The more numbers in theseries, no matter what numbers are used as the starting point, will yield a relationship of 1.618 (i.e. 2637*1.618=4266).
Fibonacci found this relationship of 1.618 to be of great significance and he used it throughout his works. Notethe following:
0.382 * 1.618 = 0.6180.618 * 1.618 = 1.000
1.000 * 1.618 = 1.6181.618 * 1.618 = 2.618
7/22/2019 gann arc.pdf
http://slidepdf.com/reader/full/gann-arcpdf 2/8
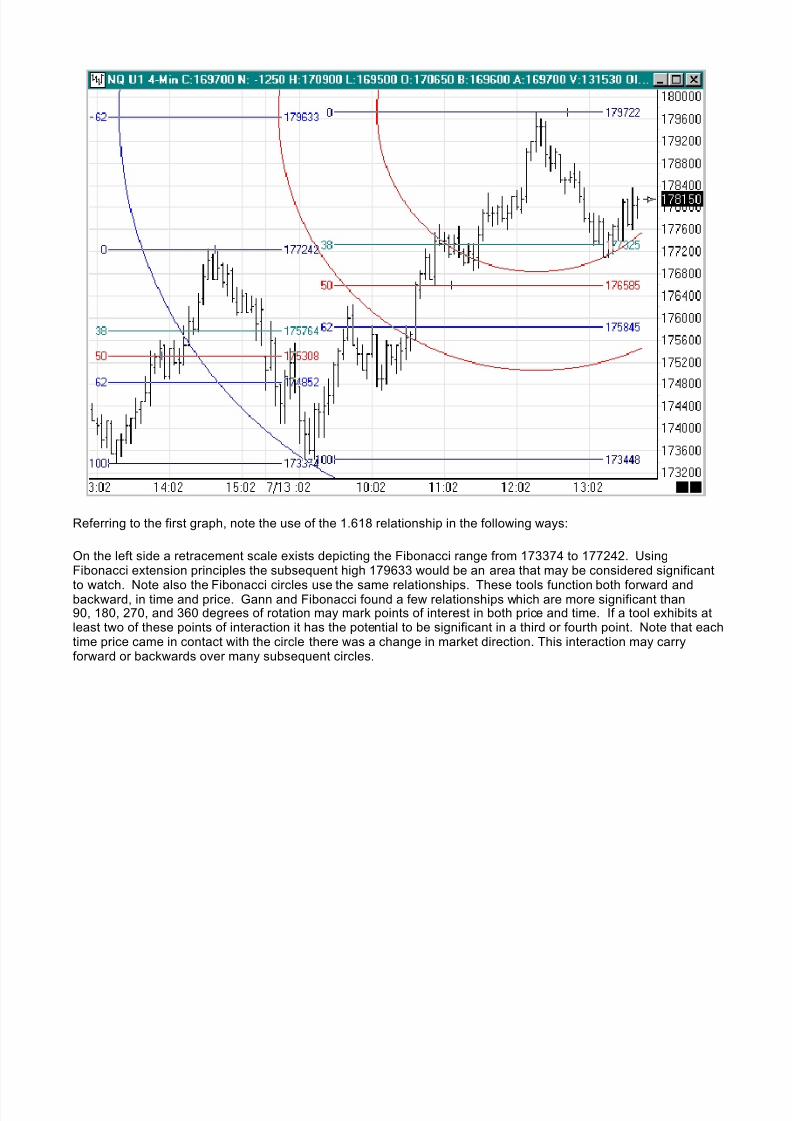
Referring to the first graph, note the use of the 1.618 relationship in the following ways:
On the left side a retracement scale exists depicting the Fibonacci range from 173374 to 177242. UsingFibonacci extension principles the subsequent high 179633 would be an area that may be considered significant
to watch. Note also the Fibonacci circles use the same relationships. These tools function both forward andbackward, in time and price. Gann and Fibonacci found a few relationships which are more significant than90, 180, 270, and 360 degrees of rotation may mark points of interest in both price and time. If a tool exhibits atleast two of these points of interaction it has the potential to be significant in a third or fourth point. Note that eachtime price came in contact with the circle there was a change in market direction. This interaction may carryforward or backwards over many subsequent circles.
7/22/2019 gann arc.pdf
http://slidepdf.com/reader/full/gann-arcpdf 3/8
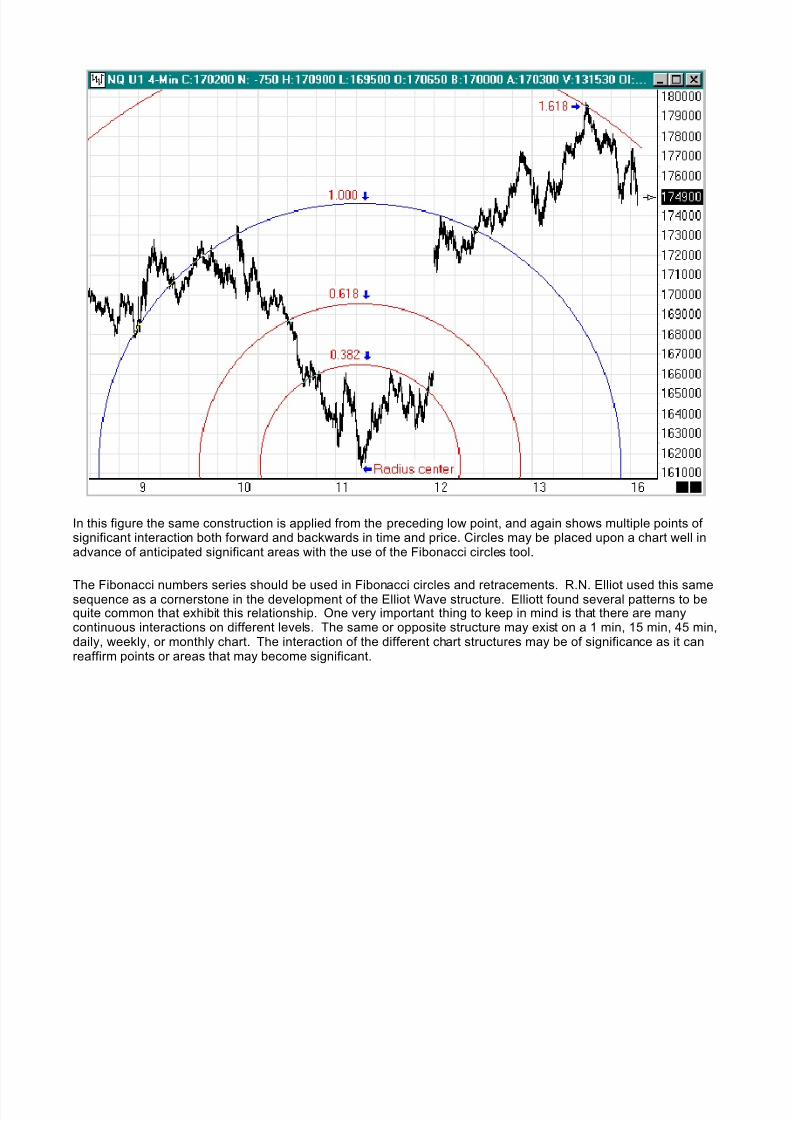
In this figure the same construction is applied from the preceding low point, and again shows multiple points ofsignificant interaction both forward and backwards in time and price. Circles may be placed upon a chart well inadvance of anticipated significant areas with the use of the Fibonacci circles tool.
The Fibonacci numbers series should be used in Fibonacci circles and retracements. R.N. Elliot used this samesequence as a cornerstone in the development of the Elliot Wave structure. Elliott found several patterns to bequite common that exhibit this relationship. One very important thing to keep in mind is that there are manycontinuous interactions on different levels. The same or opposite structure may exist on a 1 min, 15 min, 45 min,daily, weekly, or monthly chart. The interaction of the different chart structures may be of significance as it canreaffirm points or areas that may become significant.
7/22/2019 gann arc.pdf
http://slidepdf.com/reader/full/gann-arcpdf 4/8
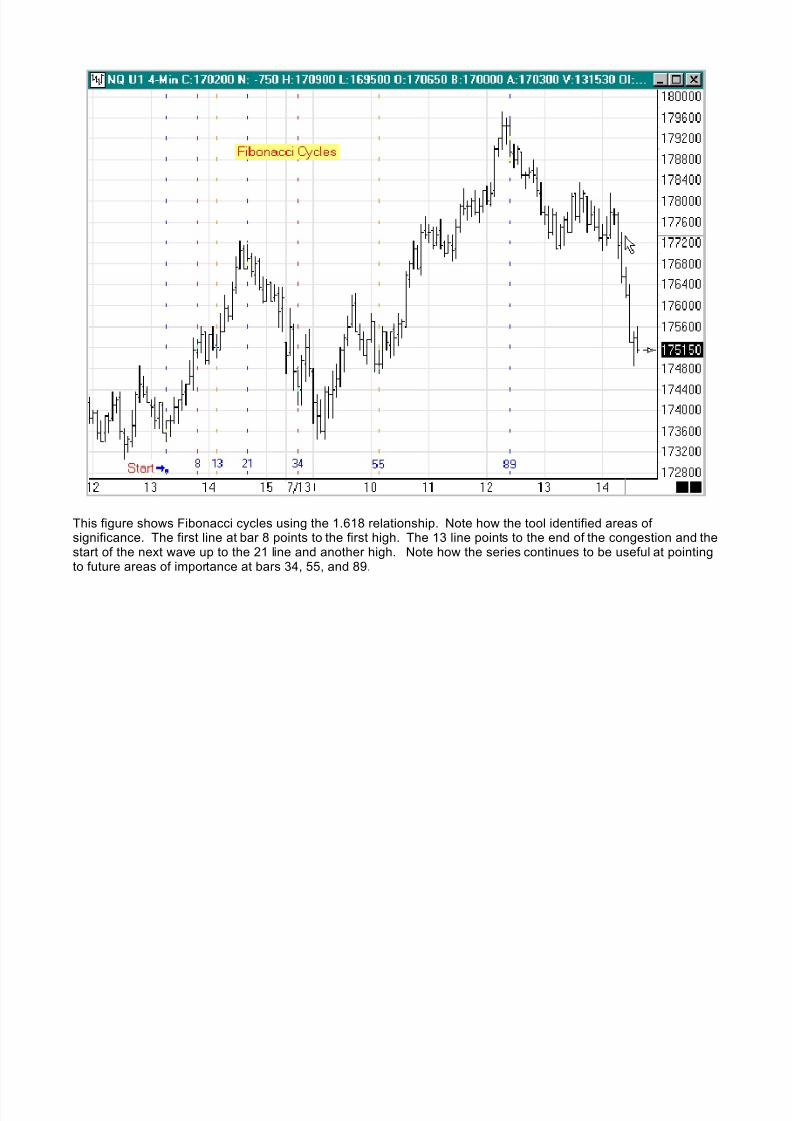
This figure shows Fibonacci cycles using the 1.618 relationship. Note how the tool identified areas ofsignificance. The first line at bar 8 points to the first high. The 13 line points to the end of the congestion and thestart of the next wave up to the 21 line and another high. Note how the series continues to be useful at pointingto future areas of importance at bars 34, 55, and 89.
7/22/2019 gann arc.pdf
http://slidepdf.com/reader/full/gann-arcpdf 5/8
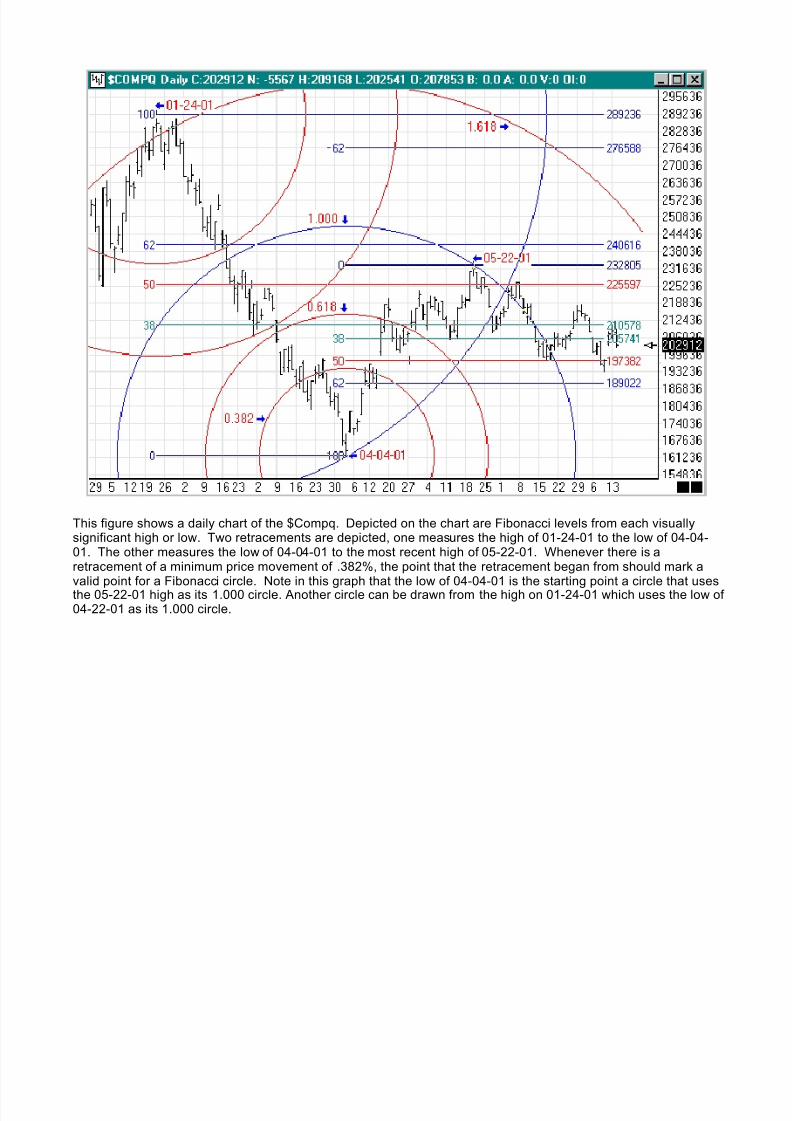
This figure shows a daily chart of the $Compq. Depicted on the chart are Fibonacci levels from each visuallysignificant high or low. Two retracements are depicted, one measures the high of 01-24-01 to the low of 04-04-01. The other measures the low of 04-04-01 to the most recent high of 05-22-01. Whenever there is aretracement of a minimum price movement of .382%, the point that the retracement began from should mark avalid point for a Fibonacci circle. Note in this graph that the low of 04-04-01 is the starting point a circle that usesthe 05-22-01 high as its 1.000 circle. Another circle can be drawn from the high on 01-24-01 which uses the low of04-22-01 as its 1.000 circle.
7/22/2019 gann arc.pdf
http://slidepdf.com/reader/full/gann-arcpdf 6/8
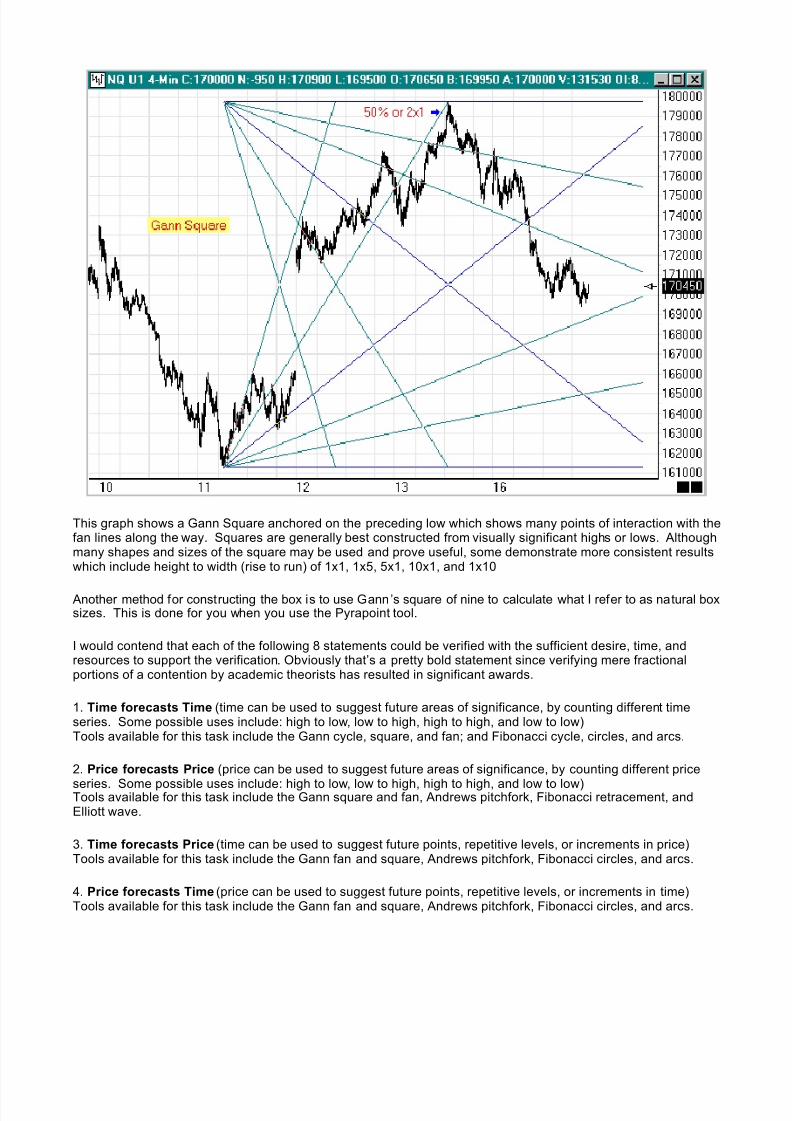
This graph shows a Gann Square anchored on the preceding low which shows many points of interaction with thefan lines along the way. Squares are generally best constructed from visually significant highs or lows. Althoughmany shapes and sizes of the square may be used and prove useful, some demonstrate more consistent resultswhich include height to width (rise to run) of 1x1, 1x5, 5x1, 10x1, and 1x10
Another method for constructing the box is to use Gann’s square of nine to calculate what I refer to as natural boxsizes. This is done for you when you use the Pyrapoint tool.
I would contend that each of the following 8 statements could be verified with the sufficient desire, time, andresources to support the verification. Obviously that’s a pretty bold statement since verifying mere fractionalportions of a contention by academic theorists has resulted in significant awards.
1. Time forecasts Time (time can be used to suggest future areas of significance, by counting different timeseries. Some possible uses include: high to low, low to high, high to high, and low to low)Tools available for this task include the Gann cycle, square, and fan; and Fibonacci cycle, circles, and arcs.
2. Price forecasts Price (price can be used to suggest future areas of significance, by counting different price
series. Some possible uses include: high to low, low to high, high to high, and low to low)Tools available for this task include the Gann square and fan, Andrews pitchfork, Fibonacci retracement, andElliott wave.
3. Time forecasts Price (time can be used to suggest future points, repetitive levels, or increments in price)Tools available for this task include the Gann fan and square, Andrews pitchfork, Fibonacci circles, and arcs.
4. Price forecasts Time (price can be used to suggest future points, repetitive levels, or increments in time)Tools available for this task include the Gann fan and square, Andrews pitchfork, Fibonacci circles, and arcs.
7/22/2019 gann arc.pdf
http://slidepdf.com/reader/full/gann-arcpdf 7/8
5. Time forecasts Price and Time (time can be used to suggest future points in price and time)Tools available for this task include the Gann fan and square, Andrews pitchfork, Fibonacci circles, and arcs.
6. Price forecasts Price and Time (price can be used to suggest future points in price and time)Tools available for this task include the Gann fan and square, Andrews pitchfork, Fibonacci circles, and arcs.
7. Price and Time forecasts Price (price and time can be used in conjunction to suggest future points in price)Tools available for this task include the Gann fan and square, Andrews pitchfork, Fibonacci circles, and arcs.
8. Price and Time forecasts Time (price and time can be used in conjunction to suggest future points in time)Tools available for this task include the Gann fan and square, Andrews pitchfork, Fibonacci circles, and arcs.
The numbers or series may be created by any of the following methods and may be viable: addition, subtraction,multiplication, division, squaring or square root of a number.
The relationships may also be represented graphically in simple geometric shapes: circle, triangle, square. Theymay be represented in two or three dimensions: square to cube, circle to sphere etc. Three-dimensionalrepresentations can often demonstrate speed of movement, as what may appear to be congestion in an x-y planemay be continuous motion in the y-z plane.
Ensign Windows provides the tools to easily create forward-looking interactions. I find it useful when multipletechniques point to the same conclusion. This may suggest that the identified area may become significant andthat may provide the desired trader’s edge.
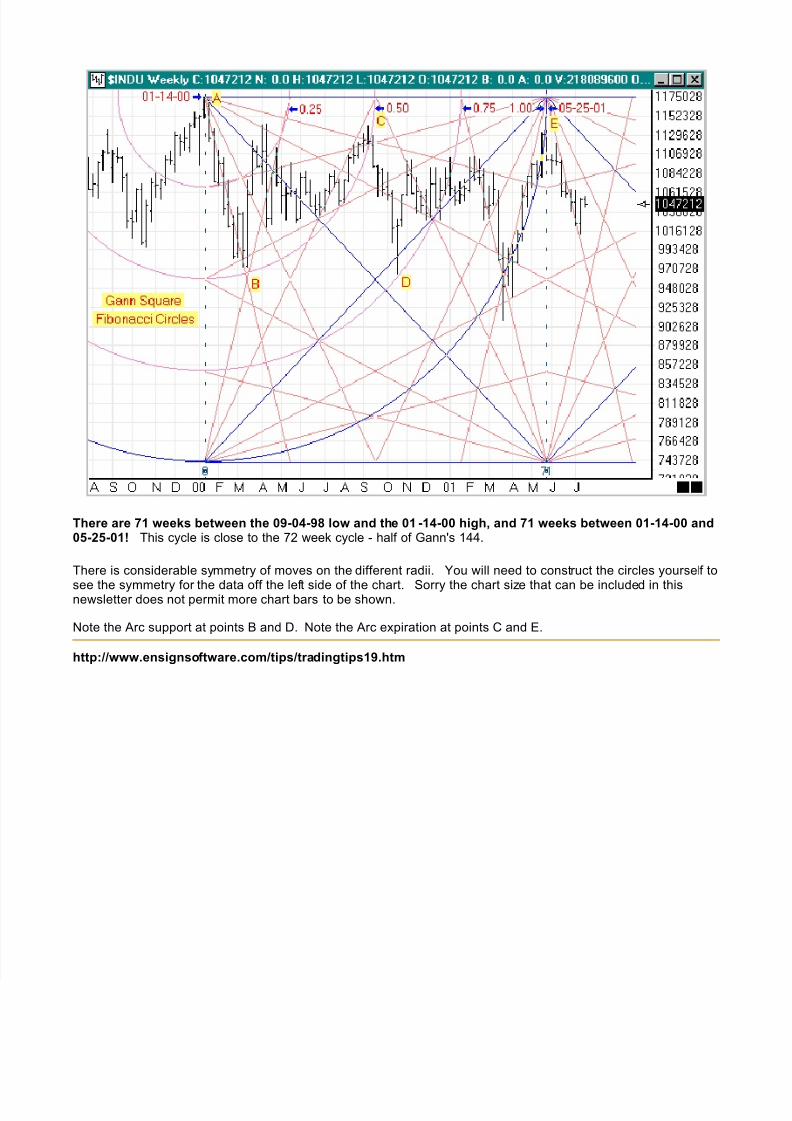
Trading Tip:Gann Squares and Fibonacci Circles
Analysis by Steve Grimaldi [email protected] Text by Howard Arrington
This chart is the weekly Dow Jones Industrial, analyzed using the major high of 11750.28 on 01-14-00 (point A)and the prior major low of 7400.30 on 09-04-98 (not shown). All constructions are based on these two majorpoints. Both the major high and the major low are marked by horizontal blue lines.
The Gann Square was sized so its vertical range used these two major prices, and its horizontal width used the
01-14-00 bar for its left edge and the recent high on 05-25-01 as the right edge. The Fibonacci circles were sizedwith the center on the major high on 01-14-00 and the 1.00 circle passing through 05-25-01. The chart scale wasadjusted so the 45 degree line from the circle tool would pass through the corners of the Gann Square, thussquaring Time and Price.
7/22/2019 gann arc.pdf
http://slidepdf.com/reader/full/gann-arcpdf 8/8
There are 71 weeks between the 09-04-98 low and the 01 -14-00 high, and 71 weeks between 01-14-00 and05-25-01! This cycle is close to the 72 week cycle - half of Gann's 144.
There is considerable symmetry of moves on the different radii. You will need to construct the circles yourself to
see the symmetry for the data off the left side of the chart. Sorry the chart size that can be included in thisnewsletter does not permit more chart bars to be shown.
Note the Arc support at points B and D. Note the Arc expiration at points C and E.
http://www.ensignsoftware.com/tips/tradingtips19.htm