
Gaming Expansion in New Jersey - · PDF fileGaming Expansion in New Jersey January 2016 i |...
115
Gaming Expansion in New Jersey Assessing the Impacts on the Atlantic City Region Prepared At The Request Of: Resorts Casino Hotel, Atlantic City, NJ Prepared By: Morowitz Gaming Advisors, LLC & Global Gaming & Hospitality, LLC January 22, 2016
Transcript of Gaming Expansion in New Jersey - · PDF fileGaming Expansion in New Jersey January 2016 i |...

Gaming Expansion in New Jersey
Assessing the Impacts on the Atlantic City Region
Prepared At The Request Of: Resorts Casino Hotel, Atlantic City, NJ
Prepared By:
Morowitz Gaming Advisors, LLC & Global Gaming & Hospitality, LLC
January 22, 2016

Gaming Expansion in New Jersey January 2016
i | P a g e
This Economic Impact Assessment and Financial Analysis (the “Report”) has been prepared by Morowitz Gaming Advisors, LLC and Global Gaming & Hospitality LLC (collectively hereinafter referred to as “GGH” or the “Advisors”), including its subsidiaries, affiliates, and independent contractors, which include Leisure Dynamics Research, LLC, at the request of Resorts Casino Hotel (the “Company”). The sole purpose of the Report is to assess the impacts of gaming expansion in northern New Jersey on the gaming industry and economies of the Atlantic City region and State of New Jersey. This Report does not purport to contain information that a prospective interested party may rely upon to evaluate any investment related to a potential transaction involving anything associated with Atlantic City. This Report has been prepared for informational purposes only. All information set forth in this Report has been prepared by GGH based upon information furnished by various third‐party sources. GGH does not assume any responsibility for such information, including the estimates and projections of future financial and operating performance of any of the companies or entities mentioned in this report, if any, and other forward‐looking statements, or of any additional evaluation material made available in connection with any further investigation of the market or the impacts of northern New Jersey gaming expansion. Any estimates, projections and forward‐looking statements contained herein have been prepared and based on information currently available to GGH and involve subjective assumptions, judgments and analyses, which may or may not be correct. GGH or the Company undertake no obligation to update any such estimates, projections or forward‐looking statements or to provide access to any additional information. Neither GGH nor the Company make any express or implied representation or warranty as to the accuracy or completeness of the information contained in, or for any omissions from, the Report or any additional evaluation material made available in connection with any further investigation of the impacts of northern New Jersey gaming expansion. Each of GGH and the Company expressly disclaims any and all liability which may be based on such information, errors therein or omissions therefrom. .
Neither the receipt of this Report by any person nor any information contained herein or supplied herewith or subsequently communicated to any person in connection herewith is to be taken as providing legal, tax, accounting, or investment advice by GGH to any such person. Further, the information contained herein, as well as any other communications or information provided by GGH is not intended to be, and shall not be regarded or construed as, a recommendation to participate in a transaction or to make any investment. GGH does not provide tax, legal or accounting advice. You should conduct a thorough and independent review of the legal, tax and accounting aspects of any information contained in this report and an independent assessment of the merits of pursuing a transaction related to Atlantic City or the potential northern New Jersey gaming expansion and should consult your own professional advisors in light of your particular circumstances.
This Report does not constitute a solicitation of funds, an offer to sell a financial interest in the Company or anything else related to the potential northern New Jersey gaming expansion or any other entity, or an offer to accept any proposal, nor does it constitute an offer to sell, or a solicitation of offers to buy, securities of the Company or any other entity. In furnishing this Report, neither GGH nor the Company undertake any obligation to provide the recipient with access to any evaluation material. This Report shall neither be deemed an indication of the state of affairs of the Company or other casinos or businesses in New Jersey nor constitute an indication that there has been no change in the business affairs of the Company or New Jersey since the date hereof or since the dates as of which information is provided herein.
All communications, inquiries and requests for information relating to this Report should be addressed directly to GGH at the contact information listed below.

Gaming Expansion in New Jersey January 2016
ii | P a g e
GGH Contact Information:
Cory Morowitz Morowitz Gaming Advisors, LLC Chairman & Managing Member
Michael S. Kim Global Gaming & Hospitality LLC Managing Partner, New York
248 South New York Road
Galloway, NJ 8205 T 609.652.6472 F 609.652.6473
299 Park Avenue, 6th Floor New York, NY 10171 T 646.719.1096 F 702.823.1926
www.morowitzgaming.com www.gghsp.com

Gaming Expansion in New Jersey January 2016
iii | P a g e
Gaming Expansion in New Jersey – Impacts on Atlantic City Region
TABLE OF CONTENTS
I. EXECUTIVE SUMMARY ................................................................................... 4
II. BACKGROUND, METHODOLOGY & SIGNIFICANT ASSUMPTIONS .................. 7
III. ATLANTIC CITY – AN EVOLVING GAMING MARKET ..................................... 10
IV. THE REGIONAL ECONOMY ........................................................................... 24
V. THE FUTURE OF ATLANTIC CITY WITHOUT NEW JERSEY EXPANSION .......... 43
VI. NON‐GAMING AND CONVENTIONS ............................................................. 59
VII. THE IMPACT OF NORTH JERSEY GAMING EXPANSION ON ATLANTIC CITY
CASINOS ....................................................................................................... 65
VIII. THE FLOW THROUGH IMPACTS TO THE REGION FROM NORTH JERSEY
GAMING EXPANSION ................................................................................... 82
IX. LIMITING CONDITIONS .............................................................................. 109
X. APPENDIX – ABOUT THE AUTHORS OF THIS REPORT ................................ 110

Gaming Expansion in New Jersey January 2016
4 | P a g e
I. EXECUTIVE SUMMARY The State of New Jersey is considering the expansion of casino gaming into northern New Jersey. Recent proposed legislation calls for no more than two casinos, each to be located in a different county in municipalities more than 72 miles from Atlantic City. This expansion comes at a time that Atlantic City’s gaming industry, after several years of decline owing to an increasingly competitive northeast gaming market, is finally finding its footing. Atlantic City has right sized its gaming industry, is in the middle of several strategic investments and despite potential new out‐of‐state competition, has stabilized and is poised for new growth. Expansion of gaming to Northern New Jersey could jeopardize Atlantic City’s recovery and negatively impact not only the gaming industry, but the entire region. GGH (Morowitz Gaming Advisors and Global Gaming & Hospitality) was requested by Resorts Casino Hotel (the “Company”) to prepare an analysis of the expansion of gaming in New Jersey. Specifically, GGH analyzed the impact of two large scale casino investments in northern New Jersey on the competitive environment impacting New Jersey and Atlantic City and quantified the potential impacts on the casinos in Atlantic City and the overall economy of the Atlantic City region. We did not analyze or quantify the offsetting economic impacts of casino expansion in northern New Jersey because there is simply not enough detail in the proposed legislation to determine those impacts. This analysis therefore focuses solely on the impacts to the Atlantic City region. Our analysis and conclusions are based on a number of analytical techniques including an in depth qualitative and quantitative analysis of the trends through the date of this report impacting the gaming industry in Atlantic City as well as governmental spending and trends in the region. Our analysis also relies on the development and utilization of a gravity model, which is a modeling technique used throughout the gaming industry to measure the impacts of new gaming supply on existing competitors and the market as a whole. Atlantic County has grown significantly during the casino era in terms of population and almost all of that growth has been confined to the municipalities and towns in the mainland communities surrounding Atlantic City. This growth was catalyzed and supported by the gaming industry and necessitated much in the way of infrastructure to support this growth including roads, schools and government services. As the industry has contracted, the area has come under considerable stress. As of September 2015, the casino industry generated $2.6 billion of net revenue, $404 million of EBITDA, employed 24,431 employees, over $590 million in wages (not including tips) and was paying approximately $381 million in State and local taxes (including property taxes). On a pro forma basis, those amounts are expected to decline marginally with the opening of new out‐of‐state competitors anticipated in Pennsylvania, Maryland, New York and Massachusetts to $2.45 billion of gaming revenue, $356 million of EBITDA, 23,029 employees, $557 million in wages and $363 million in taxes. At this point, due to saturation of the U.S. market, it is highly unlikely that

Gaming Expansion in New Jersey January 2016
5 | P a g e
there will be additional out‐of‐state expansion and the Atlantic City casino industry should stabilize and even potentially grow. However, if casinos expand to northern New Jersey, Atlantic City’s casino industry will contract significantly, losing net revenue ranging from $624 million to $1.4 billion with industry EBITDA declining to anywhere from $162 million to $195 million. However, the more likely result is that anywhere from three to five casinos will close, causing a spiral downward with net revenues declining by a range of $1.0 billion to $1.4 billion, EBITDA declining by between $162 million and $170 million, employment declining by between 11,800 and 15,000, wages (not including tips) declining by between $285 million and $365 million and industry tax payments declining by between $128 million and $158 million.
Impacts of North Jersey Expansion on Atlantic City Casinos
Based on our analysis we have concluded that the expansion of gaming in northern New Jersey will have significant and far reaching impacts on the Atlantic City region. The major impacts are summarized as follows:
Gaming revenue declines of $691 million to $1.4 billion
Three to five additional casino closures
Total job losses to the region ranging from 23,000 to 30,000 and regional unemployment rates of 25% to 30%
Foreclosure rates (already among the highest in the nation) increasing significantly
Lost regional and state economic output of $1.5 billion to $2.0 billion
Potential increases in New Jersey State transitional and school subsidies to municipalities and school districts of $134 million to $367 million
Reductions in Atlantic City Expressway tolls of $11 to $15 million
Reductions in state tax payments by Atlantic City casinos of $86 million to $111 million
Potential for $100 million of reduced spending at Boardwalk based small businesses
(in 000's except Employees TTM 9/15 Baseline No Closures 3 Closures Impact % 4 Closures Impact % 5 Closures Impact %
Revenues
Gaming 2,474,066$ 2,285,898$ 1,594,254$ 1,194,844$ (1,091,055)$ (47.7%) 1,006,471$ (1,279,427)$ (56.0%) 856,580$ (1,429,318)$ (62.5%)
Non‐gaming 999,387 964,683 790,253 641,193 (323,490) (33.5%) 562,394 (402,289) (41.7%) 521,453 (443,230) (45.9%)
Gross Revenue 3,473,453 3,250,581 2,384,507 1,836,037 (1,414,544) (43.5%) 1,568,865 (1,681,716) (51.7%) 1,378,034 (1,872,548) (57.6%)
Promo 860,232 797,443 556,161 406,222 (391,221) (49.1%) 352,985 (444,458) (55.7%) 302,595 (494,848) (62.1%)
Net Revenue 2,613,221 2,453,138 1,828,346 1,429,815 (1,023,323) (41.7%) 1,215,880 (1,237,259) (50.4%) 1,075,439 (1,377,700) (56.2%)
EBITDA 404,545 356,226 161,108 186,283 (169,943) (47.7%) 186,529 (169,697) (47.6%) 193,942 (162,284) (45.6%)
% Margin 15.5% 14.5% 8.8% 13.0% (1.5%) (10.3%) 15.3% 0.8% 5.6% 18.0% 3.5% 24.2%
Gaming as % of Gross 71.2% 70.3% 66.9% 65.1% (5.2%) (7.5%) 64.2% (6.2%) (8.8%) 62.2% (8.2%) (11.6%)
Occupancy 80.9% 81.6% 80.3% 85.5% 3.9% 4.7% 88.6% 7.0% 8.6% 90.4% 8.8% 10.8%
ADR 102.37$ 102.26$ 96.95$ 107.79$ 5.52$ 5.4% 113.93$ 11.67$ 11.4% 120.65$ 18.39$ 18.0%
# of Employees 24,431 23,029 16,318 11,205 (11,824) (51.3%) 9,353 (13,676) (59.4%) 7,990 (15,039) (65.3%)
Salaries & Wages 590,710$ 556,675$ 394,907$ 271,619$ (285,056)$ (51.2%) 227,341$ (329,334)$ (59.2%) 192,156$ (364,520)$ (65.5%)
Average Salary 24.18 24.17 24.20 24.24 0.07 0.3% 24.31 0.13 0.6% 24.05 (0.12) (0.5%)
Taxes
Gaming Tax 175,322$ 165,667$ 117,720$ 90,740$ (74,927)$ (45.2%) 78,082$ (87,585)$ (52.9%) 67,883$ (97,784)$ (59.0%)
CRDA Fee 19,390 28,574 19,928 14,936 (13,638) (47.7%) 12,581 (15,993) (56.0%) 10,707 (17,866) (62.5%)
Property Tax 151,162 124,979 90,000 90,000 (34,979) (28.0%) 90,000 (34,979) (28.0%) 90,000 (34,979) (28.0%)
Parking Fee 3,620 3,344 2,332 1,748 (1,596) (47.7%) 1,473 (1,872) (56.0%) 1,253 (2,091) (62.5%)
Room Fee 11,897 11,997 11,809 8,706 (3,290) (27.4%) 7,009 (4,988) (41.6%) 6,433 (5,564) (46.4%)
Total 361,391$ 334,561$ 241,789$ 206,130$ (128,430)$ (38.4%) 189,144$ (145,416)$ (43.5%) 176,276$ (158,284)$ (47.3%)

Gaming Expansion in New Jersey January 2016
6 | P a g e
These impacts are summarized in the following tables.
Summary of Regional Impacts on Jobs, Income and Economic Output
Job Losses Income Loss
Loss in Economic Output Unemployment Rate
Direct Casino Impacts 12,500 to 16,000 jobs
$372 million to $490 million
Vendor Impacts 5,000 to 7,000
jobs
$185 million to $242 million
Total Regional Economic Impact from Casino 17,500 to 23,000
$556 million to $733 million
$664 million to $888 million 20% to 25%
Spending Outside Casinos 5,600 to 7,300
$153 million to $201 million
$364 million to $477 million
Total Regional Economic Impact with Casinos and Boardwalk
23,000 to 30,000
$709 million to $934 million
$1.0 billion to $1.36 billion 25% to 30%
Summary of Direct Casino Toll and Tax Related Impacts
SJTA Tolls Gaming Revenue Tax Luxury Tax Room Tax Parking Tax
Total Impact $11.4 million to $14.9 million
$75 million to $98 million
$5.6 million
$3.3 million to $5.6 million
$1.6 million to $2.1 million
Summary of Potential Government Impacts
Transitional Aid Range School Aid Range Total
Government Impacts $31 million to $54 million $103 million to $313
million $134 million to $367 million Annually
Potential Reduced Economic Output Beyond Atlantic County Region
Decline in Economic Output Outside Atlantic County
Annual Impact Per Non‐Atlantic County
Resident
Multiplier Impacts of Atlantic City Economic Decline to Rest of State $275 million to $369 million $32 to $43
Direct, Indirect and Induced Impacts of Vendor Spending Declines Outside of Atlantic County $185 million $21
Total Decline Outside Atlantic County $460 million to $554 million $53 to $64
Our analysis, methodology and conclusions are detailed in the accompanying report and economic impact study and magnify the importance of studying the overall impact of gaming expansion in New Jersey. The key issue is that casinos in northern New Jersey will not just impact Atlantic City. They will impact the wellbeing of an entire region of the State of New Jersey. In the absence of other significant economic catalysts, the Atlantic County region could become a significant and permanent ward of the state of New Jersey.

Gaming Expansion in New Jersey January 2016
7 | P a g e
II. BACKGROUND, METHODOLOGY & SIGNIFICANT ASSUMPTIONS
Background The State of New Jersey is considering the expansion of casino gaming into northern New Jersey. Recent proposed legislation calls for no more than two casinos, each to be located in a different county in municipalities more than 72 miles from Atlantic City. Potential locations include Bergen County and Hudson County. Gaming in northern New Jersey carries risks for the gaming industry in Atlantic City and will impact revenues and profitability. The issue facing New Jersey is not so much the impact on the individual casino operators. Rather, it is the potential impact on an entire region. The greater Atlantic City region is already in crisis. The regional workforce has already shed almost 13,000 jobs since 2007 (approximately 9%) representing over $500 million of economic output for a region in dire need. This has resulted in unemployment still hovering near 9% and a foreclosure rate over 4 times the national average (and among the highest in the country). This is not just an Atlantic City issue, it is an issue that impacts the entire region including the towns surrounding Atlantic City. Interestingly, the gaming industry in Atlantic City is finally finding its footing. The Atlantic City casinos are gaining profitability and the tourism economy of the city is diversifying. Gaming expansion into northern New Jersey will negatively impact this recovery. GGH was requested by Resorts Casino Hotel (the “Company”) to prepare an analysis of the expansion of gaming in New Jersey. Specifically, GGH analyzed the impact of two large scale casino investments in northern New Jersey on the competitive environment impacting New Jersey and Atlantic City and quantified the potential impacts on the casinos in Atlantic City and the overall economy of the Atlantic City region. We did not analyze or quantify the offsetting economic impacts of casino expansion in northern New Jersey because there is simply not enough detail in the proposed legislation to determine those impacts. For instance, it is unknown exactly where the casinos will be located, what the tax rate will be, what kind of amenities they will have, their total investment or other details that would be required to develop a fulsome analysis of the positive impacts. Therefore, this analysis focuses specifically on the impacts of adding two large scale casinos to northern New Jersey to the Atlantic City casino industry and the regional economy. Methodology
Our conclusions are based on the following analyses and tasks.
Assessed the market for casino gaming in New Jersey in order to provide an assessment of the impacts of proposed new casinos in Northern New Jersey on the economy of the Atlantic City region.
Interviewed regional business and government officials including officials from Atlantic City, Egg Harbor Township, Galloway Township and Atlantic County.

Gaming Expansion in New Jersey January 2016
8 | P a g e
Evaluated the Atlantic City gaming and entertainment market, its evolution and current trends, and developed a baseline of potential future gaming revenue, other revenue, and casino profitability (“Baseline Scenario”). Our analysis included the development of a regional gravity model calibrated to current gaming revenues and other econometric models and trend analyses of current casino based‐gaming revenues.
Provided qualitative and quantitative analyses of the Atlantic City gaming industry and analysis of its current financial health and likely future if gaming is not expanded in New Jersey. This included applying the gravity model and trend models to a future scenario without expanded gaming in New Jersey.
Quantified the impact on the Atlantic City gaming market (using the gravity model methodology) if gaming expands to Northern New Jersey.
Analyzed and quantified the potential revenue and resulting profitability impacts on Atlantic City casinos and the likelihood of additional casino closures.
Analyzed the prior impact of casino closures on the greater Atlantic City region including the impacts on regional macroeconomic factors such as employment, real estate values (including property tax revenue trends), foreclosure rates, and other economic statistics.
Qualitatively and quantitatively analyzed the flow through economic impacts on the Atlantic City regional economy (including both Atlantic City individually and the surrounding towns and county) of additional potential casino closures including the following:
a. Employment and unemployment b. Regional Economic Output and Impacts on the rest of New Jersey c. Foreclosure rates d. Regional tax generation
Assumptions
The following assumptions are an integral part of this study:
While the final form of legislation is at this time unknown, this study assumes there will be two casinos in northern New Jersey. For purposes of our analyses, we assumed the casinos would be located in Bergen County and Hudson County. However, as the report will show, any location in New Jersey within a 90 to 180 minute drive of Atlantic City will have a significant negative impact on Atlantic City.
The casinos in northern New Jersey would each have up to 5,000 gaming positions, significant non‐gaming amenities such as hotels, retail, dining and entertainment and over $1 billion of investment.
The tax rate applied to casino revenues in northern New Jersey is unknown at this time but it is assumed it will be similar to those proposed for resort casinos in New York and Massachusetts.
Both properties will:
o Have management personnel with extensive experience operating comparable casino and resort operations

Gaming Expansion in New Jersey January 2016
9 | P a g e
o Utilize comprehensive accounting and gaming control systems capable of providing management with accurate and timely performance data
o Be properly maintained and annual capital expenditures required to keep them at a competitive level will be made
o Develop a marketing and advertising campaign and a promotional plan to ensure adequate patronage from local and regional customers
Gaming Expansion in New Jersey January 2016
10 | P a g e
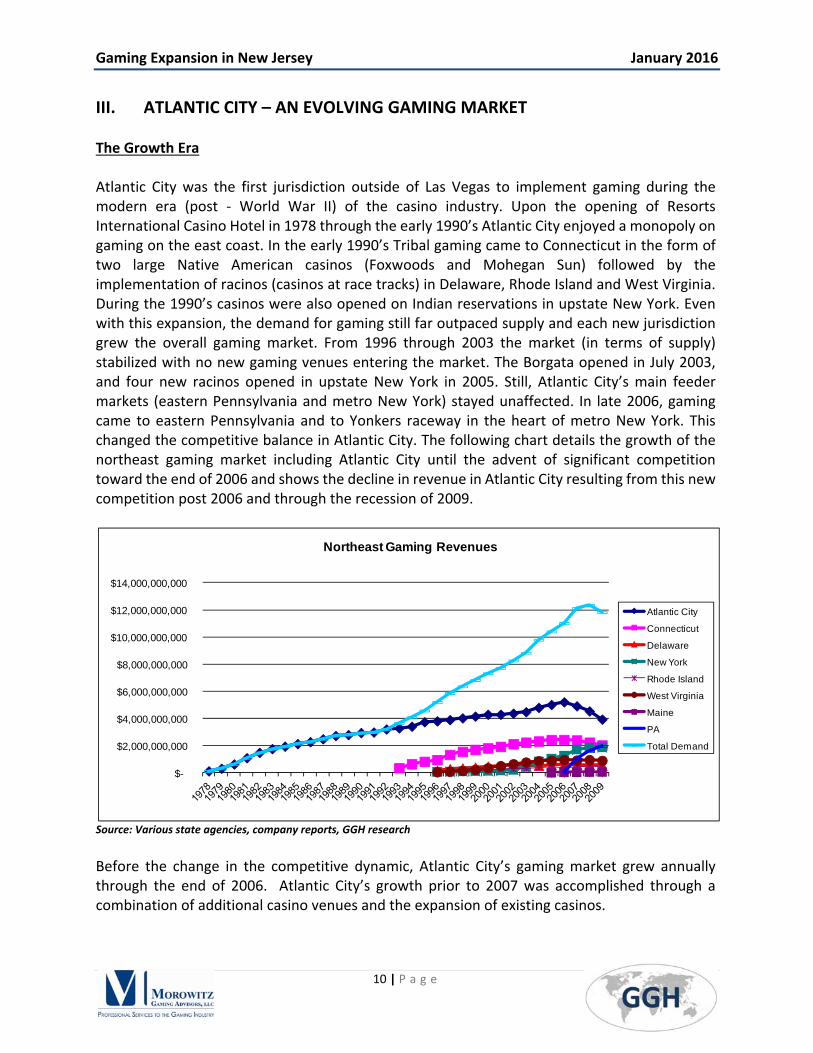
III. ATLANTIC CITY – AN EVOLVING GAMING MARKET The Growth Era Atlantic City was the first jurisdiction outside of Las Vegas to implement gaming during the modern era (post ‐ World War II) of the casino industry. Upon the opening of Resorts International Casino Hotel in 1978 through the early 1990’s Atlantic City enjoyed a monopoly on gaming on the east coast. In the early 1990’s Tribal gaming came to Connecticut in the form of two large Native American casinos (Foxwoods and Mohegan Sun) followed by the implementation of racinos (casinos at race tracks) in Delaware, Rhode Island and West Virginia. During the 1990’s casinos were also opened on Indian reservations in upstate New York. Even with this expansion, the demand for gaming still far outpaced supply and each new jurisdiction grew the overall gaming market. From 1996 through 2003 the market (in terms of supply) stabilized with no new gaming venues entering the market. The Borgata opened in July 2003, and four new racinos opened in upstate New York in 2005. Still, Atlantic City’s main feeder markets (eastern Pennsylvania and metro New York) stayed unaffected. In late 2006, gaming came to eastern Pennsylvania and to Yonkers raceway in the heart of metro New York. This changed the competitive balance in Atlantic City. The following chart details the growth of the northeast gaming market including Atlantic City until the advent of significant competition toward the end of 2006 and shows the decline in revenue in Atlantic City resulting from this new competition post 2006 and through the recession of 2009.
Source: Various state agencies, company reports, GGH research
Before the change in the competitive dynamic, Atlantic City’s gaming market grew annually through the end of 2006. Atlantic City’s growth prior to 2007 was accomplished through a combination of additional casino venues and the expansion of existing casinos.
$-
$2,000,000,000
$4,000,000,000
$6,000,000,000
$8,000,000,000
$10,000,000,000
$12,000,000,000
$14,000,000,000
Northeast Gaming Revenues
Atlantic City
Connecticut
Delaware
New York
Rhode Island
West Virginia
Maine
PA
Total Demand

Gaming Expansion in New Jersey January 2016
11 | P a g e
During this period of continuous gaming growth, a combination of factors including, but not limited to regulatory constraints, inertia and a lack of competition resulted in the industry looking inward and a focus on high frequency gamers took hold. While Las Vegas was diversifying its business and non‐gaming was becoming a larger part of its revenue base1, Atlantic City remained dependent on gaming revenue. We can see this dichotomy in the following chart. Atlantic City realized over 80% of its revenues from gaming throughout the 1990s and up to the mid‐2000s before seeing that percentage decline to around 70%. During this period, large Las Vegas Strip properties became less reliant on gaming revenues as their percentage of total revenues declined from 57% in 1990 to 37% in 2015.
Source: NJCCC, NJDGE and Nevada Gaming Control Board
Interestingly, Atlantic City and Las Vegas Strip revenue per property rose in lockstep with each other until 2007. This is when Atlantic City’s reliance on gaming became apparent. As a result of several years of investment and diversification, Las Vegas casinos continued on an upward trajectory (aside from a recession induced trough). Atlantic City casinos however saw their average revenues decline to $317 million per casino before heading upward in 2015 (with less casinos) to $437 million. Coupled with the increase in the percentage of non‐gaming revenue, this indicates a strategic shift is occurring in Atlantic City.
1 Based on study of Las Vegas Strip large property ($72 million and over gaming revenues) and profit and loss statements included in Nevada Gaming Abstract (Nevada Gaming Control Board publication)
0.0%
10.0%
20.0%
30.0%
40.0%
50.0%
60.0%
70.0%
80.0%
90.0%
1990
1991
1992
1993
1994
1995
1996
1997
1998
1999
2000
2001
2002
2003
2004
2005
2006
2007
2008
2009
2010
2011
2012
2013
2014
TTM 2015
Gaming as % of Total Revenue
LV % Gaming AC % Gaming
Gaming Expansion in New Jersey January 2016
12 | P a g e
Source: NJCCC, NJDGE and Nevada Gaming Control Board
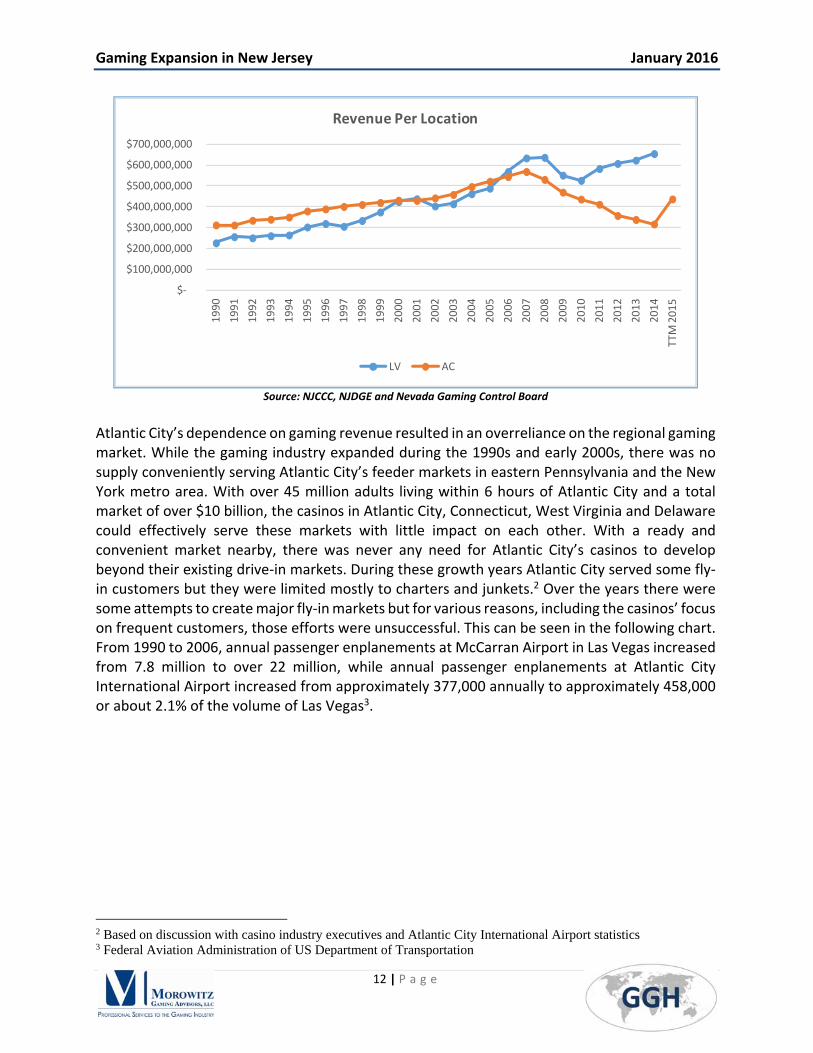
Atlantic City’s dependence on gaming revenue resulted in an overreliance on the regional gaming market. While the gaming industry expanded during the 1990s and early 2000s, there was no supply conveniently serving Atlantic City’s feeder markets in eastern Pennsylvania and the New York metro area. With over 45 million adults living within 6 hours of Atlantic City and a total market of over $10 billion, the casinos in Atlantic City, Connecticut, West Virginia and Delaware could effectively serve these markets with little impact on each other. With a ready and convenient market nearby, there was never any need for Atlantic City’s casinos to develop beyond their existing drive‐in markets. During these growth years Atlantic City served some fly‐in customers but they were limited mostly to charters and junkets.2 Over the years there were some attempts to create major fly‐in markets but for various reasons, including the casinos’ focus on frequent customers, those efforts were unsuccessful. This can be seen in the following chart. From 1990 to 2006, annual passenger enplanements at McCarran Airport in Las Vegas increased from 7.8 million to over 22 million, while annual passenger enplanements at Atlantic City International Airport increased from approximately 377,000 annually to approximately 458,000 or about 2.1% of the volume of Las Vegas3.
2 Based on discussion with casino industry executives and Atlantic City International Airport statistics 3 Federal Aviation Administration of US Department of Transportation
$‐
$100,000,000
$200,000,000
$300,000,000
$400,000,000
$500,000,000
$600,000,000
$700,000,000
1990
1991
1992
1993
1994
1995
1996
1997
1998
1999
2000
2001
2002
2003
2004
2005
2006
2007
2008
2009
2010
2011
2012
2013
2014
TTM 2015
Revenue Per Location
LV AC

Gaming Expansion in New Jersey January 2016
13 | P a g e
Source: Federal Aviation Administration of US Department of Transportation
Despite this lack of air service and reliance on a regional market, Atlantic City’s casinos flourished. From 1990 through 2006 industry Earnings Before Interest, Taxes, Depreciation and Amortization (EBITDA) increased from $500 million to $1.2 billion4, a compound annual growth rate (CAGR) of 5.7%.
Source: NJCCC
In 2006, competition loomed in Atlantic City’s feeder markets. New gaming legislation and expansion would bring casino gaming to eastern Pennsylvania and the New York metro market. At the time, the general consensus was that Atlantic City would survive this onslaught because high tax rates in the new jurisdictions would limit investment in those new casinos. However,
4 Atlantic City casinos industry quarterly reports and individual casinos quarterly reports supplies by NJ Casino Control Commission (NJCCC)
‐
5,000,000
10,000,000
15,000,000
20,000,000
25,000,000
Passenger Emplanements
Atlantic City Las Vegas
$‐
$0.2
$0.4
$0.6
$0.8
$1.0
$1.2
$1.4
1990 1991 1992 1993 1994 1995 1996 1997 1998 1999 2000 2001 2002 2003 2004 2005 2006
Atlantic City 1990‐2006 ‐ EBITDA Trends ($ Billion)

Gaming Expansion in New Jersey January 2016
14 | P a g e
despite significant investment in Atlantic City, the casinos there were still dependent on convenience oriented, high frequency gamers and those gamers would switch their allegiance to more conveniently located competitors. Atlantic City was thus unprepared for the changing dynamics of a newly competitive market. Competition and Decline Competition in the northeast heated up in 2006 and 2007 with the expansion of gaming in Pennsylvania and New York. During this period casinos opened along the border in Pennsylvania in Chester, Philadelphia, Bensalem, Bethlehem, Mount Airy and Scranton – Wilkes Barre. In New York during the same period a racino opened at Yonkers Raceway just north of New York City, followed by another in 2011 at Aqueduct Racetrack (now Resorts World) in Queens. Casinos also opened in Maryland in 2012 through 2014. This new competition in Atlantic City’s previously underserved feeder markets effectively encircled Atlantic City and combined with Atlantic City’s focus on high frequency gaming customers, caused the industry to decline.
New Casinos Impacting Atlantic City 2007‐2014
The timeline on the following page depicts the downward trend of Atlantic City gaming revenues as various events occurred starting in 20075.
5 Based on GGH/MGA analysis of news archives, gaming regulatory filings, proprietary database, company news releases and company public filings

Gaming Expansion in New Jersey January 2016
15 | P a g e
Timeline of Events Impacting Atlantic City and Gaming Revenue by Year
Developments
EconomyFinancial markets turn negative mid
2007
Lehman Brothers Bankruptcy Sep '08
Small recoveryRecovery Continues
AC
Casinos close for three days for
budget impasse in Jul '06
Harrahs Pool and major expansion opens in Spring; Borgata opens
Water Club Jun '08; Taj Mahal hotel
tow er opens in Q4
Resorts sale closes Dec '10
Landry's acquires Trump Marina May '11; Casinos close for three days in
August for Hurricane Irene
Casinos close for 5 days due to
Hurricane Sandy Oct. 2012; Revel opens Apr '12
Online Gambling Nov '13
Four casinos close in 2014:
Atlantic Club Jan; Show boat Aug; Plaza and Revel
Sep
NYYonkers opens Oct
'06
Yonkers expands to 5,000 slots by
end of Mar
Resorts World opens Oct '11
Resorts World expands to 5,000 slots by Jan '12
PA
Mohegan Pocono opens Nov '06;
Phila. Park opens Dec '06
Harrahs Chester opens Jan '07; Mt Airy opens Oct '07
Mohegan opens permanent facility Aug '08; Penn Nat'l
opens Feb '08
Sands Bethlehem opens May '09
Phila.Park opens permanent facility
Jan '10; Table Games Jul '10;
SugarHouse opens Sep '10
Sands Bethlehem opens hotel May
'11
Valley Forge opens Mar '12
Mohegan Pocono opens new hotel
CT
Foxw oods MGM opens May '08;
Mohegan expansion opens in
Sep '08;
DESports Wagering
Sep '09Table Games Jun
'10Online Gambling
MDHollyw ood
Perryville opens Sep '10
Ocean Dow ns opens Jan '11
Live! opens Jun '12Perryville and Live! offer table games
Mar/Apr '13
Horseshoe opens Aug '14
$5,018,276,523$5,217,877,474
$4,920,786,970
$4,545,235,597
$3,943,171,237
$3,564,330,358$3,317,720,532
$3,051,335,548$2,862,068,918
$2,619,250,906$2,425,177,507
$0
$1,000,000,000
$2,000,000,000
$3,000,000,000
$4,000,000,000
$5,000,000,000
$6,000,000,000
2005 2006 2007 2008 2009 2010 2011 2012 2013 2014 TTM Sep '15
Atlantic City Gaming Revenues

Gaming Expansion in New Jersey January 2016
16 | P a g e
From 2006 through 2013, gaming industry net revenues declined from $5.1 billion to $3.0 billion while industry operating profits (EBITDA) declined from $1.2 billion to $0.1 billion during the same period. As a result, and despite the opening of Revel casino in 2012, several casinos closed in 2014 (Atlantic Club, Showboat, Revel and Trump Plaza), leading to further revenue declines, down to $2.6 billion as of September 2015. However, the closure of those casinos in 2014 led to the right sizing of the industry and profits have recovered from their low of $83.9 million in 2013, to $183.5 million in 2014 and $400.5 million for the trailing twelve months ended September 2015. The right sizing of the industry and increased profits clearly indicates the industry has stabilized.
Source: NJDGE, GGH analysis
Stabilization The trend in profits by individual casinos reveals how the industry has stabilized and is trending upward. Since the industry’s nadir in 2013 when EBITDA hit $83.9 million, EBITDA has recovered to $400.5 million. Essentially, the weakest casinos have closed, taking their losses with them. What is left are eight casinos who are beginning to re‐invest and diversify their revenue and are on a significantly positive trajectory, as well as two purely digital companies in start‐up mode that are heading toward profitability. Only the Taj Mahal is operating at negative EBITDA and that is principally due to its ongoing bankruptcy and labor issues that presumably will be resolved once they emerge from bankruptcy and new leadership takes control. The table below depicts EBITDA by casino from 2013 through the most recent twelve month period ending in September of 2015. EBITDA at remaining casinos (those still open) rose by $147.9 million since the end of 2014 and $173.9 million since 2013. All land based casinos6 (except the Taj Mahal) saw increases since 2013.7
6 Caesars Interactive and Resorts Digital have no land based operations 7 Individual company results also impacted by real estate tax appeals and refunds, some of which may be non-recurring.
$1.2
$1.1
$0.8
$0.6
$0.4 $0.3
$0.2 $0.1
$0.2
$0.4
$‐
$1.0
$2.0
$3.0
$4.0
$5.0
$6.0
$‐
$0.2
$0.4
$0.6
$0.8
$1.0
$1.2
$1.4
2006 2007 2008 2009 2010 2011 2012 2013 2014 2015
Net Reven
ue
EBITDA
Atlantic City Casino IndustryNet Revenue and EBITDA Trend ($Billion)
EBITDA Net Revenue

Gaming Expansion in New Jersey January 2016
17 | P a g e
Atlantic City Casinos – EBITDA Trends ($ Million)
Source: NJDGE and GGH analysis, Resorts Digital still in start‐up mode
At $400 million, industry EBITDA is at its highest point since before 2010 and is trending upward.
Source: NJDGE and GGH analysis
The improvement in industry profitability can be explained by several factors. First, the market has right sized. In 2014, there simply was too much capacity for the market as it is currently configured. Atlantic City’s casinos are undergoing fundamental change. Whereby the industry was previously laser focused on high frequency casino gamers, it is now evolving into one more
2013 2014
TTM Sept
2015
Change
from 2013
%
Change
from
2013
Change
from 2014
%
Change
from
2014
Bally's 4,968$ (6,722)$ 13,326$ 8,358$ 168.2% 20,048$ 298.2%
Borgata 119,413$ 156,076$ 194,319$ 74,906$ 62.7% 38,243$ 24.5%
Caesars 41,015$ 32,045$ 56,300$ 15,285$ 37.3% 24,255$ 75.7%
Caesars Interactive (1,534)$ (13,297)$ 914$ 2,448$ 159.6% 14,211$ 106.9%
Golden Nugget (10,886)$ 2,256$ 18,449$ 29,335$ 269.5% 16,193$ 717.8%
Harrah's 55,711$ 47,276$ 82,413$ 26,702$ 47.9% 35,137$ 74.3%
Resorts (12,625)$ 517$ 9,703$ 22,328$ 176.9% 9,186$ 1776.8%
Resort's Digital ‐$ (1,664)$ (4,925)$ (4,925)$ N/A (3,261)$ N/A
Tropicana 17,555$ 52,224$ 35,442$ 17,887$ 101.9% (16,782)$ ‐32.1%
Taj Mahal 13,016$ (16,048)$ (5,407)$ (18,423)$ ‐141.5% 10,641$ 66.3%
ACH (13,295)$ (1,853)$ ‐$ 13,295$ 100.0% 1,853$ 100.0%
Showboat 13,769$ (2,492)$ ‐$ (13,769)$ ‐100.0% 2,492$ ‐100.0%
Trump Plaza (11,763)$ (15,118)$ ‐$ 11,763$ 100.0% 15,118$ 100.0%
Revel (131,428)$ (49,747)$ ‐$ 131,428$ 100.0% 49,747$ 100.0%
Total All Casinos 83,916$ 183,453$ 400,534$ 316,618$ 377.3% 217,081$ 118.3%
Remaining Casinos 226,633$ 252,663$ 400,534$ 173,901$ 76.7% 147,871$ 58.5%
Former Casinos (142,717)$ (69,210)$ ‐$ 142,717$ 100.0% 69,210$ 100.0%
$1.2 $1.1
$0.8
$0.6
$0.4 $0.3
$0.2 $0.1
$0.2
$0.4
$‐
$0.2
$0.4
$0.6
$0.8
$1.0
$1.2
$1.4
2006 2007 2008 2009 2010 2011 2012 2013 2014 2015
EBITDA
Atlantic City Casino Industry EBITDA Trend ($Billion)
EBITDA

Gaming Expansion in New Jersey January 2016
18 | P a g e
like that of Las Vegas or even Reno where non‐gaming revenues are over 51%, more diversified and more reliant on non‐gaming and entertainment to drive profitability. Second and along these lines, the remaining casinos have made several investments in non‐gaming amenities to enhance their facilities and appeal to a more diverse audience. Recent investments include the following:
Resorts Casino Hotel invested in a Margaritaville themed destination dining and entertainment facility, added several quick serve dining options, added conference space and upgraded its rooms, casino floor and public areas.
The Borgata developed an outdoor entertainment facility and is improving its nightlife offering.
The Tropicana added a high end health club, improved its boardwalk retail offering and façade, added a high tech light show and improved its room product.
Harrah’s added a 100,000 square‐foot meeting space expansion including two 50,000 square‐foot ballrooms. The conference center has been deemed the largest hotel‐conference center complex from Baltimore to Boston and will expand Atlantic City’s meeting and convention market.
The Golden Nugget received approval to add two luxury suites that should draw high end gamers from its other properties, allow it to expand its entertainment offerings and attract higher end acts and act as a mid‐week meeting space and hospitality space to attract additional meetings to the property.
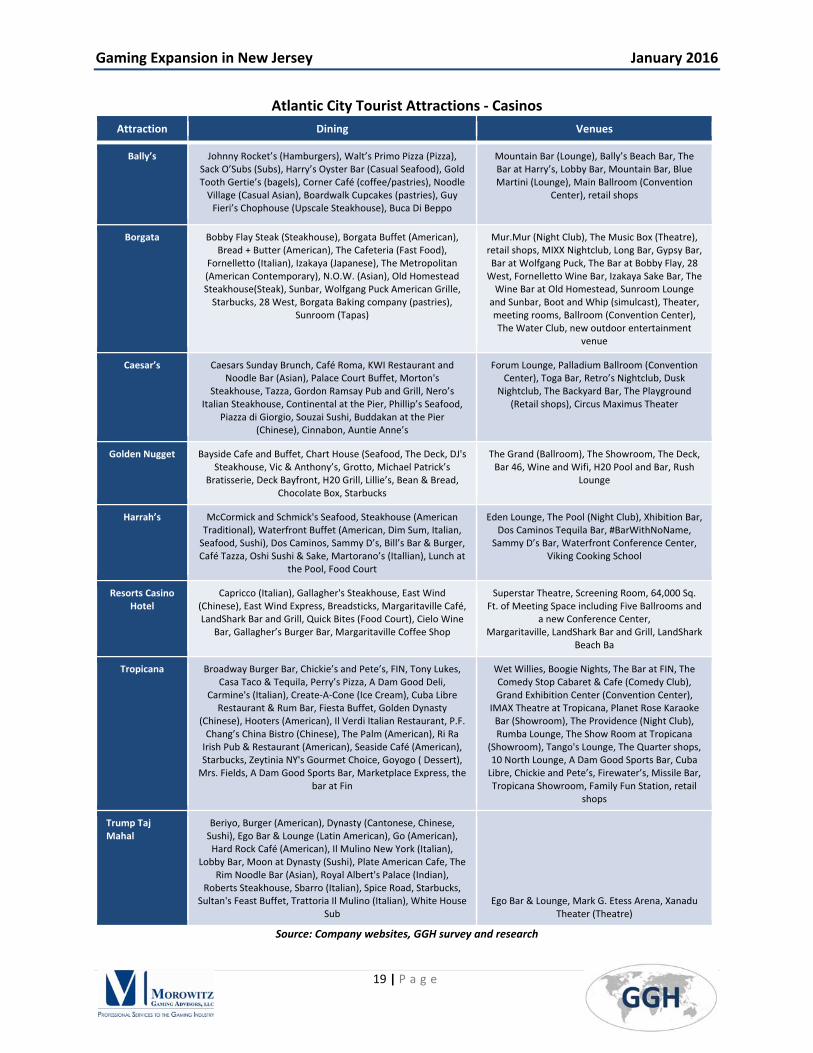
Finally, the City’s non‐gaming offerings have made Atlantic City a true destination resort. The City offers a critical mass of attractions that together lead to over 23 million visitors annually. The following table lists the non‐gaming offerings at Atlantic City casinos.
Gaming Expansion in New Jersey January 2016
19 | P a g e
Atlantic City Tourist Attractions ‐ Casinos
Attraction Dining Venues
Bally’s Johnny Rocket’s (Hamburgers), Walt’s Primo Pizza (Pizza), Sack O’Subs (Subs), Harry’s Oyster Bar (Casual Seafood), Gold Tooth Gertie’s (bagels), Corner Café (coffee/pastries), Noodle Village (Casual Asian), Boardwalk Cupcakes (pastries), Guy Fieri’s Chophouse (Upscale Steakhouse), Buca Di Beppo
Mountain Bar (Lounge), Bally’s Beach Bar, The Bar at Harry’s, Lobby Bar, Mountain Bar, Blue Martini (Lounge), Main Ballroom (Convention
Center), retail shops
Borgata Bobby Flay Steak (Steakhouse), Borgata Buffet (American), Bread + Butter (American), The Cafeteria (Fast Food),
Fornelletto (Italian), Izakaya (Japanese), The Metropolitan (American Contemporary), N.O.W. (Asian), Old Homestead Steakhouse(Steak), Sunbar, Wolfgang Puck American Grille, Starbucks, 28 West, Borgata Baking company (pastries),
Sunroom (Tapas)
Mur.Mur (Night Club), The Music Box (Theatre), retail shops, MIXX Nightclub, Long Bar, Gypsy Bar, Bar at Wolfgang Puck, The Bar at Bobby Flay, 28 West, Fornelletto Wine Bar, Izakaya Sake Bar, The Wine Bar at Old Homestead, Sunroom Lounge and Sunbar, Boot and Whip (simulcast), Theater, meeting rooms, Ballroom (Convention Center), The Water Club, new outdoor entertainment
venue
Caesar’s Caesars Sunday Brunch, Café Roma, KWI Restaurant and Noodle Bar (Asian), Palace Court Buffet, Morton's
Steakhouse, Tazza, Gordon Ramsay Pub and Grill, Nero’s Italian Steakhouse, Continental at the Pier, Phillip’s Seafood,
Piazza di Giorgio, Souzai Sushi, Buddakan at the Pier (Chinese), Cinnabon, Auntie Anne’s
Forum Lounge, Palladium Ballroom (Convention Center), Toga Bar, Retro’s Nightclub, Dusk
Nightclub, The Backyard Bar, The Playground (Retail shops), Circus Maximus Theater
Golden Nugget Bayside Cafe and Buffet, Chart House (Seafood, The Deck, DJ's Steakhouse, Vic & Anthony’s, Grotto, Michael Patrick’s
Bratisserie, Deck Bayfront, H20 Grill, Lillie’s, Bean & Bread, Chocolate Box, Starbucks
The Grand (Ballroom), The Showroom, The Deck, Bar 46, Wine and Wifi, H20 Pool and Bar, Rush
Lounge
Harrah’s McCormick and Schmick's Seafood, Steakhouse (American Traditional), Waterfront Buffet (American, Dim Sum, Italian, Seafood, Sushi), Dos Caminos, Sammy D’s, Bill’s Bar & Burger, Café Tazza, Oshi Sushi & Sake, Martorano’s (Itallian), Lunch at
the Pool, Food Court
Eden Lounge, The Pool (Night Club), Xhibition Bar, Dos Caminos Tequila Bar, #BarWithNoName,
Sammy D’s Bar, Waterfront Conference Center, Viking Cooking School
Resorts Casino Hotel
Capricco (Italian), Gallagher's Steakhouse, East Wind (Chinese), East Wind Express, Breadsticks, Margaritaville Café, LandShark Bar and Grill, Quick Bites (Food Court), Cielo Wine
Bar, Gallagher’s Burger Bar, Margaritaville Coffee Shop
Superstar Theatre, Screening Room, 64,000 Sq. Ft. of Meeting Space including Five Ballrooms and
a new Conference Center, Margaritaville, LandShark Bar and Grill, LandShark
Beach Ba
Tropicana Broadway Burger Bar, Chickie’s and Pete’s, FIN, Tony Lukes, Casa Taco & Tequila, Perry’s Pizza, A Dam Good Deli,
Carmine's (Italian), Create‐A‐Cone (Ice Cream), Cuba Libre Restaurant & Rum Bar, Fiesta Buffet, Golden Dynasty
(Chinese), Hooters (American), Il Verdi Italian Restaurant, P.F. Chang’s China Bistro (Chinese), The Palm (American), Ri Ra Irish Pub & Restaurant (American), Seaside Café (American), Starbucks, Zeytinia NY's Gourmet Choice, Goyogo ( Dessert), Mrs. Fields, A Dam Good Sports Bar, Marketplace Express, the
bar at Fin
Wet Willies, Boogie Nights, The Bar at FIN, The Comedy Stop Cabaret & Cafe (Comedy Club), Grand Exhibition Center (Convention Center),
IMAX Theatre at Tropicana, Planet Rose Karaoke Bar (Showroom), The Providence (Night Club), Rumba Lounge, The Show Room at Tropicana
(Showroom), Tango's Lounge, The Quarter shops, 10 North Lounge, A Dam Good Sports Bar, Cuba Libre, Chickie and Pete’s, Firewater’s, Missile Bar, Tropicana Showroom, Family Fun Station, retail
shops
Trump Taj Mahal
Beriyo, Burger (American), Dynasty (Cantonese, Chinese, Sushi), Ego Bar & Lounge (Latin American), Go (American), Hard Rock Café (American), Il Mulino New York (Italian),
Lobby Bar, Moon at Dynasty (Sushi), Plate American Cafe, The Rim Noodle Bar (Asian), Royal Albert's Palace (Indian),
Roberts Steakhouse, Sbarro (Italian), Spice Road, Starbucks, Sultan's Feast Buffet, Trattoria Il Mulino (Italian), White House
Sub Ego Bar & Lounge, Mark G. Etess Arena, Xanadu
Theater (Theatre)
Source: Company websites, GGH survey and research
Gaming Expansion in New Jersey January 2016
20 | P a g e
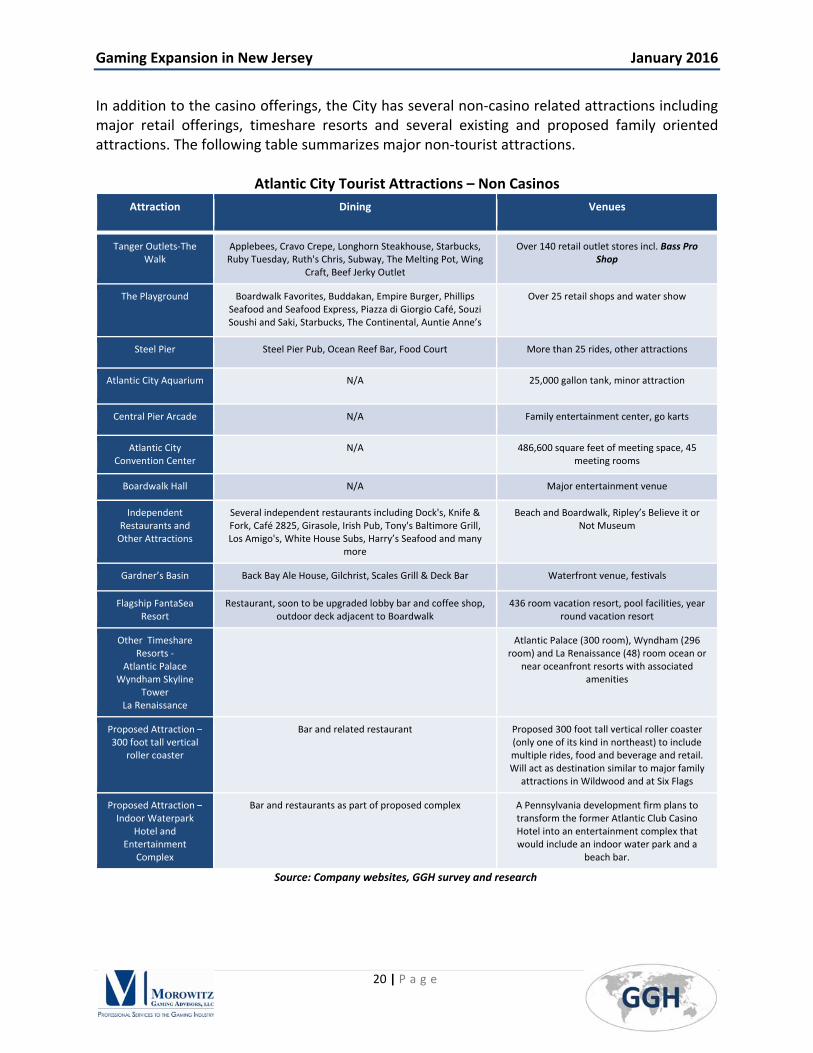
In addition to the casino offerings, the City has several non‐casino related attractions including major retail offerings, timeshare resorts and several existing and proposed family oriented attractions. The following table summarizes major non‐tourist attractions.
Atlantic City Tourist Attractions – Non Casinos
Attraction Dining Venues
Tanger Outlets‐The Walk
Applebees, Cravo Crepe, Longhorn Steakhouse, Starbucks, Ruby Tuesday, Ruth's Chris, Subway, The Melting Pot, Wing
Craft, Beef Jerky Outlet
Over 140 retail outlet stores incl. Bass Pro Shop
The Playground Boardwalk Favorites, Buddakan, Empire Burger, Phillips Seafood and Seafood Express, Piazza di Giorgio Café, Souzi Soushi and Saki, Starbucks, The Continental, Auntie Anne’s
Over 25 retail shops and water show
Steel Pier Steel Pier Pub, Ocean Reef Bar, Food Court More than 25 rides, other attractions
Atlantic City Aquarium N/A 25,000 gallon tank, minor attraction
Central Pier Arcade N/A Family entertainment center, go karts
Atlantic City Convention Center
N/A 486,600 square feet of meeting space, 45 meeting rooms
Boardwalk Hall N/A Major entertainment venue
Independent Restaurants and Other Attractions
Several independent restaurants including Dock's, Knife & Fork, Café 2825, Girasole, Irish Pub, Tony's Baltimore Grill, Los Amigo's, White House Subs, Harry’s Seafood and many
more
Beach and Boardwalk, Ripley’s Believe it or Not Museum
Gardner’s Basin Back Bay Ale House, Gilchrist, Scales Grill & Deck Bar Waterfront venue, festivals
Flagship FantaSea Resort
Restaurant, soon to be upgraded lobby bar and coffee shop, outdoor deck adjacent to Boardwalk
436 room vacation resort, pool facilities, year round vacation resort
Other Timeshare Resorts ‐
Atlantic Palace Wyndham Skyline
Tower La Renaissance
Atlantic Palace (300 room), Wyndham (296 room) and La Renaissance (48) room ocean or
near oceanfront resorts with associated amenities
Proposed Attraction – 300 foot tall vertical
roller coaster
Bar and related restaurant Proposed 300 foot tall vertical roller coaster (only one of its kind in northeast) to include multiple rides, food and beverage and retail. Will act as destination similar to major family
attractions in Wildwood and at Six Flags
Proposed Attraction – Indoor Waterpark
Hotel and Entertainment
Complex
Bar and restaurants as part of proposed complex A Pennsylvania development firm plans to transform the former Atlantic Club Casino Hotel into an entertainment complex that would include an indoor water park and a
beach bar.
Source: Company websites, GGH survey and research

Gaming Expansion in New Jersey January 2016
21 | P a g e
The strategic shift from gaming centric to a tourist destination coupled with the non‐casino offerings is fundamentally changing the visitor profile of Atlantic City. The following table summarizes the visitor profile in 2013 vs. 2004. It shows how the primary purpose of visiting Atlantic City has shifted from gaming to more of a leisure orientation. In 2004, 85% of visitors to Atlantic City reported gambling as the primary purpose of their trip. As of 2013 that percentage had declined to 27% and had been replaced mostly by people looking for a getaway or visiting friends and family8.
Source: ACCVA, Stockton University
Atlantic City’s Gaming Industry Today Atlantic City’s casinos today are a $3.5 billion industry (gross revenue), featuring 13,424 hotel rooms and employing over 23,750 people in a region with total employment of 133,0009, with total wages (not including tips) of over $590 million10. The Atlantic City casinos spent over $1.2 billion on goods and services in 2014, approximately 41% of which was spent in Atlantic County and 58% in New Jersey. The casinos collectively have taxable value of $3.9 billion (54% of the City’s ratable base)11. Despite their decline, they remain the most viable and important industry in the region. As of September 30, 2015 the industry earned operating profits of $523.0 million and EBITDA of $400.5 million, up from $339.5 million and $183.5 million respectively at the end of 2014.
8 Visitor surveys for 2004 and 2013 were completed by two different entities and reporting categories are slightly different. Although the methodology for these two surveys was somewhat different, potentially inflating the percentage in 2003, the essential point remains; the core reason for visiting Atlantic City is changing. 9 Bureau of Labor Statistics data for Atlantic City‐Hammonton MSA as of September 2015 10 Estimate based on 2014 data at remaining casinos. Tips by casino operator estimates adds another 15% or approximately $90 million. 11 GGH research and information gleaned from Atlantic City 2015 – Series A Bond Offering Memorandum
0% 10% 20% 30% 40% 50% 60% 70% 80% 90%
Other
Visit friends/Family
Special Event
Vacation/Getaway
Gamble
Business Meeting
Conv/Trade Show
Visitor Profile Survey ‐ Primary Purpose of Trip
2004 2013

Gaming Expansion in New Jersey January 2016
22 | P a g e
Key Atlantic City Statistics ($000)
Source: NJDGE and GGH research
While the gaming industry has declined, it remains vibrant and is still a vital part of the local economy. It accounts for approximately 60% of the leisure and hospitality employment base12 with jobs that are generally considered well paying for the area and in most cases include benefits. The leisure and hospitality industry is the largest employment segment for the Atlantic City‐Hammonton MSA (which covers all of Atlantic County as defined by the Bureau of Labor Statistics), representing approximately 30% of all employment.
12 Based on Bureau of Labor Statistics data for Atlantic City‐Hammonton MSA employment by industry
2014 TTM Sept 2015
Revenue:
Casino 2,669,976$ 2,497,703$
Rooms 472,409 405,931
Food and Beverage 485,210 442,782
Other 180,383 152,377
Total Revenue 3,807,978$ 3,498,793$
Less: Promotional Allowances 982,382 862,164
Net Revenue 2,825,596$ 2,636,629$
Costs and Expenses:
Casino 1,163,855 1,048,804
Rooms, Food & Beverage 344,793 292,943
General, Administrative & Other 977,479 771,911
Total Costs and Expenses 2,486,127$ 2,113,658$
Gross Operating Profit 339,469$ 522,971$
Industry EBITDA 183,453$ 400,534$
Total Employees 28,259 23,753 1
Wages and Salaries 684,032$ 591,000$ 2
1 Based on November employment report
2 Estimate based on 2014 wages at remaining casinos
39.8
23.6
21.7
19.2
9.9
6.3
5.6
3.8
2.2
0.7
‐ 5.0 10.0 15.0 20.0 25.0 30.0 35.0 40.0 45.0
Leisure and Hospitality
Government
Trade, Transportation, and Utilities
Education and Health Services
Professional and Business Services
Other Services
Mining, Logging, and Construction
Financial Activities
Manufacturing
Information
ATLANTIC CITY‐HAMMONTON MSA EMPLOYMENT BY INDUSTRY (000)

Gaming Expansion in New Jersey January 2016
23 | P a g e
Source: Bureau of Labor Statistics
Source: Bureau of Labor Statistics
This is a defining moment for Atlantic City, its gaming industry and the region. Atlantic City is changing. Through its various phases (growth, decline and stabilization) it is evolving from a gaming centric city to a multi‐faceted entertainment destination, with gaming as a crucial part of its appeal. After several years of turmoil the gaming industry has stabilized, and it remains the largest regional employer. The industry has rightsized and has made crucial investments to reposition itself. This repositioning appears to be working as profits have increased and are trending upward. The single most important issue facing the region is whether this industry will be allowed to continue its recovery.
Gaming Expansion in New Jersey January 2016
24 | P a g e
IV. THE REGIONAL ECONOMY
Historical Overview
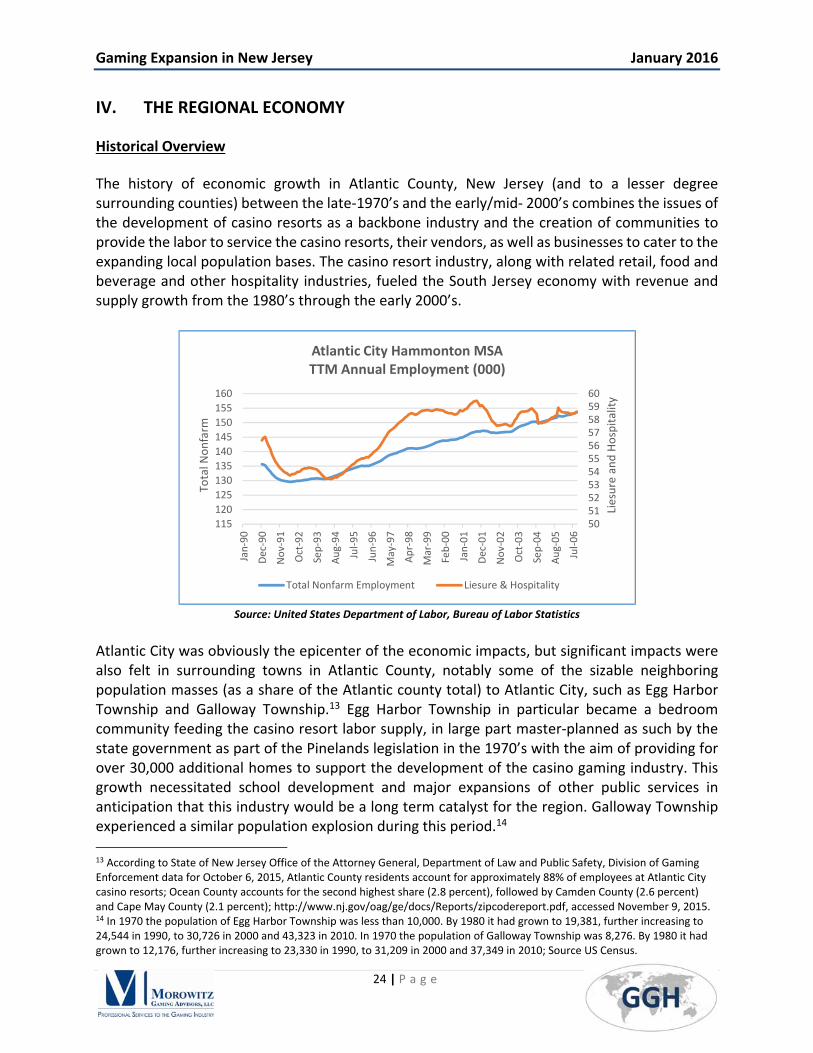
The history of economic growth in Atlantic County, New Jersey (and to a lesser degree surrounding counties) between the late‐1970’s and the early/mid‐ 2000’s combines the issues of the development of casino resorts as a backbone industry and the creation of communities to provide the labor to service the casino resorts, their vendors, as well as businesses to cater to the expanding local population bases. The casino resort industry, along with related retail, food and beverage and other hospitality industries, fueled the South Jersey economy with revenue and supply growth from the 1980’s through the early 2000’s.
Source: United States Department of Labor, Bureau of Labor Statistics
Atlantic City was obviously the epicenter of the economic impacts, but significant impacts were also felt in surrounding towns in Atlantic County, notably some of the sizable neighboring population masses (as a share of the Atlantic county total) to Atlantic City, such as Egg Harbor Township and Galloway Township.13 Egg Harbor Township in particular became a bedroom community feeding the casino resort labor supply, in large part master‐planned as such by the state government as part of the Pinelands legislation in the 1970’s with the aim of providing for over 30,000 additional homes to support the development of the casino gaming industry. This growth necessitated school development and major expansions of other public services in anticipation that this industry would be a long term catalyst for the region. Galloway Township experienced a similar population explosion during this period.14
13 According to State of New Jersey Office of the Attorney General, Department of Law and Public Safety, Division of Gaming Enforcement data for October 6, 2015, Atlantic County residents account for approximately 88% of employees at Atlantic City casino resorts; Ocean County accounts for the second highest share (2.8 percent), followed by Camden County (2.6 percent) and Cape May County (2.1 percent); http://www.nj.gov/oag/ge/docs/Reports/zipcodereport.pdf, accessed November 9, 2015. 14 In 1970 the population of Egg Harbor Township was less than 10,000. By 1980 it had grown to 19,381, further increasing to 24,544 in 1990, to 30,726 in 2000 and 43,323 in 2010. In 1970 the population of Galloway Township was 8,276. By 1980 it had grown to 12,176, further increasing to 23,330 in 1990, to 31,209 in 2000 and 37,349 in 2010; Source US Census.
5051525354555657585960
115
120
125
130
135
140
145
150
155
160
Jan‐90
Dec‐90
Nov‐91
Oct‐92
Sep‐93
Aug‐94
Jul‐95
Jun‐96
May‐97
Apr‐98
Mar‐99
Feb‐00
Jan‐01
Dec‐01
Nov‐02
Oct‐03
Sep‐04
Aug‐05
Jul‐06
Liesure and Hospitality
Total N
onfarm
Atlantic City Hammonton MSA TTM Annual Employment (000)
Total Nonfarm Employment Liesure & Hospitality
Gaming Expansion in New Jersey January 2016
25 | P a g e
The increased competition from out of state casinos documented in the prior section of this report has led to market saturation, resulting in a sharp gaming revenue and patronage decline for casinos in Atlantic City, as well as revenues and patronage for affiliated hospitality industries. The sustained decline led to the closure of four Atlantic City casino resorts in 2014, as well as many other businesses outside of the casino resort establishments, as fewer gamer visits equates to a decline in tourist dollars being spent throughout the economy. Industries providing services to the casino resorts have also suffered as their client base has shrunk with the casino resort closures. Additionally, the casino hotel workforce in the region has declined by more than 20,000 since 2005, meaning that there has been a significant decline in regional consumer spending outside of the resort environment as well, along with pressure on the housing market that has resulted in/from Atlantic County having one of the highest foreclosure rate in the country.15
Demographic Overview
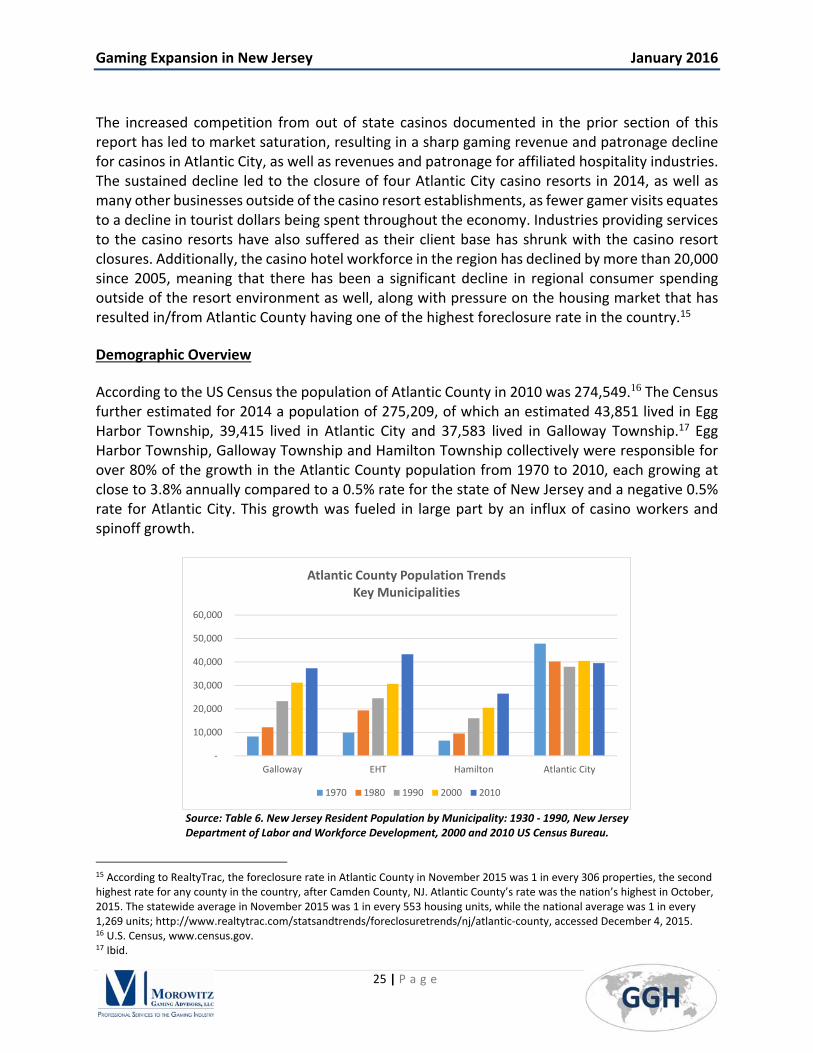
According to the US Census the population of Atlantic County in 2010 was 274,549.16 The Census further estimated for 2014 a population of 275,209, of which an estimated 43,851 lived in Egg Harbor Township, 39,415 lived in Atlantic City and 37,583 lived in Galloway Township.17 Egg Harbor Township, Galloway Township and Hamilton Township collectively were responsible for over 80% of the growth in the Atlantic County population from 1970 to 2010, each growing at close to 3.8% annually compared to a 0.5% rate for the state of New Jersey and a negative 0.5% rate for Atlantic City. This growth was fueled in large part by an influx of casino workers and spinoff growth.
Source: Table 6. New Jersey Resident Population by Municipality: 1930 ‐ 1990, New Jersey Department of Labor and Workforce Development, 2000 and 2010 US Census Bureau.
15 According to RealtyTrac, the foreclosure rate in Atlantic County in November 2015 was 1 in every 306 properties, the second highest rate for any county in the country, after Camden County, NJ. Atlantic County’s rate was the nation’s highest in October, 2015. The statewide average in November 2015 was 1 in every 553 housing units, while the national average was 1 in every 1,269 units; http://www.realtytrac.com/statsandtrends/foreclosuretrends/nj/atlantic‐county, accessed December 4, 2015. 16 U.S. Census, www.census.gov. 17 Ibid.
‐
10,000
20,000
30,000
40,000
50,000
60,000
Galloway EHT Hamilton Atlantic City
Atlantic County Population Trends Key Municipalities
1970 1980 1990 2000 2010

Gaming Expansion in New Jersey January 2016
26 | P a g e
A notable assumption by the US Census between 2010 and 2014 for Atlantic County, as well as each of these four jurisdictions within Atlantic County (as can be surmised by the 2010 and 2014 figures), was that population growth was relatively flat between 2010 and 2014 despite the continued economic decline. It is worth noting that the 2014 figures would not capture the impact of the September closures of three casino resorts, or possibly the early‐2014 closure of the Atlantic Club Casino. Those that lost their jobs late in the year likely would not have immediately relocated, or would have been recognized by Census estimators as being a source of potential mass exodus, which appears to have been occurring given the fact that the industry and overall macroeconomic downturn resulted in foreclosure rates in these communities that are amongst the highest in the country. Some former casino resort employees (or others in Atlantic County that have lost their jobs) have left as a result of having their homes foreclosed on or have found job opportunities elsewhere, but many others remain in the area despite losing their jobs, as the prospect of selling one’s home is unattractive when faced with a glut of foreclosed‐upon homes for sale in the market at depressed prices. As a result, regional unemployment rates are much higher than they were prior to the recession, while statewide the unemployment rate is back down to 2008 levels. The size of the Atlantic County and city/township labor forces are smaller than they were prior to the casino‐resort closures, but have not nearly declined at the same level as the regional hospitality industry job decline. Regional unemployment can best be defined as structural, i.e. these former hospitality industry employees may need to learn new skills to find good, new jobs, which could be especially difficult and long‐term as a result of there being few regional developed industry alternatives to transition to. For example, the remaining major employers in Galloway Township and Egg Harbor Township are Stockton University and the Atlanticare Regional Medical Center, neither of which are easy job transitions for people whose work experience has been in the hospitality industry. Similarly, major non‐casino resort employers in Atlantic City include the Atlanticare hospital complex or at The Tanger Outlets, which are large‐scale retail venues along Atlantic Avenue. These retail jobs are the ones that are the easiest transition for those with the skill set of former casino‐resort workers, but they are also at close to minimum wage, much lower than they, on average, historically earned. Based on the US Census’ County Business Patterns data from 2011 to 2013 for the Atlantic City‐Hammonton MSA, it is evident that this is where much of the transition has been, as retail trade has been the largest sector demonstrating employment growth in the metropolitan area (the Census has a lengthy lag in preparing data, as it is currently only available through 2013).18
Further examination of comparative unemployment rates, as well as the hospitality industry’s share of employment declines, will be addressed later in this analysis. The prospect of additional hospitality industry job declines in the face of additional competition, and its other macroeconomic implications, will also be addressed.
18 County Business Patterns, http://censtats.census.gov/cgi‐bin/msanaic/msasect.pl

Gaming Expansion in New Jersey January 2016
27 | P a g e
Macroeconomic and Microeconomic Labor Overviews
Casino Resort Employment Overview
Employment at casino resorts in Atlantic City peaked during the period from 1992 to 2005, generally being in the range of 44,000 to 49,000 employees, declining slightly during the latter years as technology made slot operations more efficient.19 Competitive factors that drove the Atlantic City market downturn brought the employment total down below 40,000 in 2008 and below 35,000 in 2010.20 As a result of the closure of the Atlantic Club in January 2014 and Revel, Showboat and Trump Plaza in September 2014 the total has fallen to less than 24,000, approximately half of the peak total.21
Casino Resort Employment, 2004‐2015
Year Casino employees
2004 year end 45,501
2005 year end 44,542
2006 year end 42,456
2007 year end 40,788
2008 year end 38,585
2009 year end 36,377
2010 year end 34,145
2011 year end 32,827
2012 year end 34,698
2013 year end 32,427
2014 year end 24,817
LTM average (12/2014‐11/2015) 24,314
2015 November 23,764
Source: http://www.nj.gov/oag/ge/employee_licensing.html and NJ Casino Control Commission. The 2014 year‐end figure includes 104 employees at Revel and 26 employees at Trump Plaza, despite both no longer being operational. Similarly, the November 2015 total includes 20 employees at Trump Plaza.
The current (November 2015) employment figures total 23,744 for the remaining eight casinos and are as follows:
Current Casino Employee Figures (November 2015)
Casino Employment
Bally's AC 2,653
Borgata 5,805
Caesars 2,911
Golden Nugget 2,141
Harrah's Marina 3,314
Resorts Casino Hotel 1,823
19 State of New Jersey Casino Control Commission; http://www.state.nj.us/casinos/financia/histori/, accessed November 9, 2015. 20 Ibid. 21 State of New Jersey Office of the Attorney General, Department of Law and Public Safety, Division of Gaming Enforcement; http://www.nj.gov/oag/ge/casinohotelempfigures.html, accessed December 15, 2015.
Gaming Expansion in New Jersey January 2016
28 | P a g e
Tropicana 2,846
Trump Taj Mahal 2,251 Source: State of New Jersey Office of the Attorney General, Division of Gaming Enforcement casino hotel employment figures; http://www.nj.gov/oag/ge/casinohotelempfigures.html. Note: the reported totals do not differentiate between full‐time and part‐time employment.
At present approximately 88% of the Atlantic City casino resort employees reside in Atlantic County, or nearly 21,000 employees.22 Ocean County provides the next largest share, approximately 2.8% of the total (667 employees), followed by Camden County with approximately 2.6% (613 employees) and Cape May County with 2.1% (500 employees).23 The nearly 21,000 jobs in Atlantic County is a significant percentage of the Atlantic County labor force (132,457, as of the third quarter 2015) and employed population (121,308, as of the third quarter 2015), such that any sizable industry layoff in the future will have significant ripple effects on regional consumer spending.24 These ripple effects also are a function of changes in vendor spending by the casino resorts, as any cutback in casino resort spending may result in a decline in revenues by Atlantic County‐based vendors. We provide later in this analysis the historical relationships between casino closures and overall economic activity in Atlantic County, demonstrating that it is not just the Atlantic City casino industry that is at risk if casinos are added in North Jersey, but the entirety of an already fragile South Jersey economy.
State and Atlantic County Labor Overview Atlantic County has a labor force of approximately 132,000, down from over 140,000 a decade ago.25 Atlantic City, Egg Harbor Township and Galloway Township are the major population centers in Atlantic County, each accounting for between 16,000 and 22,000 labor force participants. However, that still amounts to nearly 80,000 persons residing elsewhere in Atlantic County. The labor force in Atlantic City is slowly declining, but reached 16,032 in September, 2015, its lowest monthly total in over 25 years (data was only available for the last 25 years).26
22 State of New Jersey, Office of the Attorney General, Division of Gaming Enforcement, as at October 6, 2015; http://www.nj.gov/oag/ge/docs/Reports/zipcodereport.pdf, accessed December 15, 2015. We note that this is a slightly higher percentage than the reported share of those employed in Atlantic County in all industries also being from within the county (based on Census estimates from 2009‐2013) – according to the US Census Bureau Local Employment Dynamics approximately 80% of those employed in Atlantic County also lived there, followed by Cape May County at 4.4%.
23 Ibid. 24 U.S. Bureau of Labor Statistics non‐seasonally adjusted data, from economagic.com. 25 U.S. Bureau of Labor Statistics 26 Ibid.

Gaming Expansion in New Jersey January 2016
29 | P a g e
Source: U.S. Bureau of Labor Statistics
As noted in the preceding paragraph, casino resort employment has fallen from approximately 45,000 a decade ago to less than 24,000 in 2015. The middle years of this decline coincided with the largest macroeconomic downturn in several generations, but clearly the trajectory here has not corrected itself in concert with the macroeconomic recovery. As demonstrated in the following chart, regional unemployment rates were generally close to statewide unemployment rates before the increased competition and recession, but now average approximately 2% more than the statewide rate. The exception is Atlantic City, where the unemployment rate in the mid‐2000s was approximately 3 to 4% greater than the statewide average. The gap grew during the recession, after which the differential grew to approximately 7% during the summer months and 10% during the winter months.
State, Atlantic County and Local Unemployment Rates
Source: U.S. Bureau of Labor Statistics. Note: State data is seasonally adjusted; County, City and Township data
is not seasonally adjusted.
‐
20,000
40,000
60,000
80,000
100,000
120,000
140,000
160,000
Quarterly Labor Force Totals
Atl County Other Atlantic City Egg Harbor Twp Galloway Twp
0.0%
2.0%
4.0%
6.0%
8.0%
10.0%
12.0%
14.0%
16.0%
18.0%
20.0%
Quarterly Unemployment Rates
State Atl County Atl City Egg Harbor Galloway

Gaming Expansion in New Jersey January 2016
30 | P a g e
Due to the fact that there was some economic recovery from 2010 to 2015, it is not possible to graphically depict a clear relationship between the casino resort job losses and the regional employment level impacts on a broader macroeconomic level. Some of those who have lost their casino jobs or casino service jobs have moved to other regions, some have changed careers and moved into other industries, some work in other regions and some no longer work. But with otherwise macroeconomic stability, any new job losses attributable to casino closures or downsizing may not be as easily transitioned into alternative employment as they had during the macroeconomic recovery years. Regional Public Finance and Public Service The regional governments, at both the Atlantic County level and for the municipalities, primarily are funded through property taxes. The majority of these taxes are then spent on schools, along with public works, public safety, health insurance and other fringe benefits (including pensions), municipal bond debt service and public assistance programs. According to the Atlantic County Administration, approximately 40% of Atlantic County residents receive some sort of public assistance. Public school enrolments have not changed significantly over the past decade, but the cost per student has steadily increased as a result of keeping student/teacher ratios consistent and an increasing percentage of students receiving subsidized meals. Health insurance costs are also rapidly increasing, at a much higher rate than the 2% ceiling on tax revenue growth, such that fringe benefits account for an increasing percentage of municipal budgets. The economic downturn has also resulted in a high, and continuously growing, share of the population relying on public assistance. As a result, there has been a need to cut back on other services, freeze salaries or downsize other departments, in order to maintain balanced budgets. Moreover, as a result of new assessment levels for casinos, homeowners and other commercial businesses are experiencing increasing tax bills, providing a disincentive to bring business to the area and for homeowners to stay in the area. This has a snowball effect, as outward migration of residents and businesses simply means higher taxes for those that remain. And those that do remain are experiencing cutbacks in the provision of public services. The situation therefore is already bad for governments and taxpayers. If the economy faces a further downturn with the closure of additional casinos and/or large‐scale labor cutbacks, it is unclear how the municipal governments can continue to function. The current proposed legislation (and potential referendum to voters) suggests that some portion of gaming taxes from north Jersey casinos would provide some public finance assistance to Atlantic City. But as we note below, as well as from the demographic overview above, Atlantic County and Atlantic City’s neighboring townships are directly impacted by anything that happens to the Atlantic City economy. At present these jurisdictions are excluded in the proposed legislation from receiving any support. The following section provides some detail on the financial health of the Atlantic County and municipal governments analyzed for this report.

Gaming Expansion in New Jersey January 2016
31 | P a g e
Atlantic County Atlantic County operates on an approximate $200 million annual budget, not including dedicated tax programs for public health and libraries. From 2010 to 2015 County expenditures have increased at a compound average annual growth rate of 1.3%. Tax revenues have increased at an annual rate of 1.9% during this period, as revenues from other sources, along with surplus funds, have declined over the past six years. Notable changes in the budget have been increased costs for Law and Public Safety for the past two years and rising insurance and pension costs (fringe benefits). In order to annually increase tax revenues it has been necessary to increase the property tax millage rates, increasing the burden on residents and small commercial businesses. The anticipated PILOT tax program for the casino resorts will likely mean a fixed ceiling (adjusted upward by 2% annually) on the taxes paid by the casino resorts, but they could also pay as much as $30 million less if new North Jersey competition arises, further eroding Atlantic City’s Gross Gaming Revenue, one of the factors which determines the amount Atlantic City casinos are required to contribute to the PILOT program each year. In that event, Atlantic County would have to figure a way to make up the budget shortfall by raising taxes on homeowners and other businesses, which currently only makes up a fraction of the revenues received. As a result, there would likely need to be some combination of major spending cuts and tax hikes.

Gaming Expansion in New Jersey January 2016
32 | P a g e
Atlantic County Budget Summaries, 2010‐2015 Atlantic County Budget 2010 2011 2012 2013 2014 2015 CAGR
Total Expenditures $188,750,380 $190,739,294 $194,091,547 $193,837,030 $196,133,473 $201,101,721 1.3%
Support Services $7,988,826 $8,118,833 $7,905,316 $8,053,372 $8,090,263 $7,892,680 ‐0.2%
Direct Services (Planning, Public Works and Human Services)
$29,125,914 $29,001,744 $29,451,468 $29,935,975 $30,343,209 $30,623,158 1.0%
Law & Public Safety $50,378,024 $50,603,828 $50,470,724 $50,729,349 $52,537,721 $54,485,708 1.6%
State Programs $10,894,786 $10,737,696 $11,184,142 $10,968,367 $11,173,711 $11,736,860 1.5%
Fringe Benefits $42,364,809 $44,327,067 $45,710,670 $45,697,012 $46,597,055 $47,565,526 2.3%
Group Insurance* $21,614,556 $21,900,000 $22,853,600 $23,822,000 $23,909,242 $24,376,814 2.4%
Educational Institutions $12,562,000 $12,701,620 $12,790,258 $13,093,764 $13,088,393 $13,091,393 0.8%
State Mandates $2,843,779 $2,987,376 $2,965,150 $3,081,042 $2,636,698 $3,134,697 2.0%
Debt Service $21,780,607 $21,780,823 $21,770,714 $21,770,962 $21,770,962 $21,850,962 0.1%
Major Accounts $8,108,324 $8,277,092 $8,641,288 $8,697,271 $7,835,871 $8,652,583 1.3%
Grants $2,703,311 $2,203,216 $3,201,817 $1,809,916 $2,059,590 $2,068,154 ‐5.2%
Total Revenues $188,750,380 $190,739,294 $194,091,547 $193,837,030 $196,133,473 $201,101,721 1.3%
County Taxes $146,224,156 $149,777,167 $152,745,744 $155,598,082 $156,500,165 $160,646,006 1.9%
Surplus $7,722,000 $7,752,000 $7,743,000 $7,155,000 $7,644,000 $7,474,000 ‐0.7%
General Revenues $34,804,224 $33,210,127 $33,602,803 $31,083,948 $31,989,307 $32,981,714 ‐1.1%
Dedicated Tax Programs Public Health Expenditure $9,584,769 $9,267,534 $9,192,750 $9,078,592 $9,157,135 $9,188,080 ‐0.8%
Public Health Revenues Surplus $577,000 $500,000 $600,000 $550,000 $609,000 $700,000 3.9%
Anticipated Revenues $2,813,314 $2,410,584 $2,283,207 $2,328,123 $2,306,055 $2,314,913 ‐3.8%
Public Health Tax $6,194,455 $6,356,950 $6,309,543 $6,200,469 $6,242,080 $6,173,167 ‐0.1%
Library Expenditures $9,363,043 $9,344,927 $8,953,635 $8,979,000 $8,943,180 $8,679,189 ‐1.5%
Library Revenues Surplus $1,300,000 $1,200,000 $982,000 $1,075,000 $1,075,000 $1,042,008 ‐4.3%
Library Tax $8,063,043 $8,144,927 $7,971,635 $7,904,000 $7,868,180 $7,637,181 ‐1.1%
Source: Atlantic County Annual Budget Summaries, http://www.aclink.org/Budget/index.asp. * Group insurance figure provided as a major component of Fringe.

Gaming Expansion in New Jersey January 2016
33 | P a g e
One of the major challenges facing Atlantic County is that it currently has one of the highest foreclosure rates in the country, with approximately 1 in every 306 housing units in foreclosure. This may make some population estimates unreliable, as residents have been forced out of their homes, with the only reliable measures of inter‐Census populations being school student populations and senior subsidies – in between (the working age population) it is likely that the population has fallen below Census estimates given the increasing number of foreclosures. The chart below depicts foreclosure rates (in percentage terms) for National, New Jersey, Atlantic City, Atlantic County, Absecon/Galloway and Egg Harbor Township and shows the concentration of foreclosure activity in surrounding towns where rates are as much as five times the national average and over two times the New Jersey average.
Source: RealtyTrac; http://www.realtytrac.com/statsandtrends/
The foreclosure issue is problematic for a myriad of reasons. The actual foreclosure process takes well over a year to go through the notice cycle and a bank’s ability to put it back on the market. Given that there were several casino closures in September 2014, there are likely many imminent foreclosures not reflected in the November 2015 rate (most recent data available). If banks put foreclosed properties on the market, given the decreasing number of job opportunities, there is limited demand, other than possibly for speculators. The difficulty in selling a home essentially has meant that many people who have lost jobs have simply moved away and stopped paying their mortgages, recognizing that there are few buyers in the market. This in turn has resulted in excess supply in the market of homes for sale, making it even harder to sell homes for near their initial purchase price. Foreclosure also essentially means extra work by municipalities of trying to collect property taxes. As municipalities operate with a lean staffing levels, the increased workload of trying to collect taxes on foreclosed homes increases as the number of foreclosed properties increases. This also creates a lag in collections. If the commercial tax base declines or has fixed payments, maintaining steady tax revenues would mean higher taxes paid by homeowners. This, even without casino
0.40%
0.38%
0.33%
0.27%
0.18%
0.08%
0.00% 0.05% 0.10% 0.15% 0.20% 0.25% 0.30% 0.35% 0.40% 0.45%
EHT
Absecon/Galloway
Atlantic County
Atlantic City
NJ
National Average
Foreclosure Rates

Gaming Expansion in New Jersey January 2016
34 | P a g e
closures, will induce residents to move, or abandon their properties (pushing them into the foreclosure pool). This issue is one that has no clear remedy if there is additional New Jersey casino competition that could result in additional Atlantic City casino closures. While there may be monies provided to assist Atlantic County and/or Atlantic City financially, they would stay in public coffers; there is no mechanism for avoidance of foreclosures and the related misery for area residents (we note that the current bills proposing North Jersey casinos have no financial assistance earmarked for Atlantic County. We also note and analyze later in this study that amounts proposed as the share of tax revenues earmarked for Atlantic City will likely be well below the economic impacts expected from the closure of several casinos and thus unlikely to mitigate those impacts). Atlantic City The annual operating budget for the City of Atlantic City is slightly larger than that of Atlantic County, at $262 million for 2015. The gaming industry transformed Atlantic City into one of America’s largest gaming destinations, providing job opportunities and fiscal benefits for the City and its residents. But as a result of the combined timing of the recession and the downturn of the gaming industry in Atlantic City, the tax impacts on local businesses and residents have become increasingly onerous in order to maintain basic public services. The total assessed value of private and commercial property has declined from $20.5 billion in 2010 to $7.35 billion in 2015, such that it has been necessary to nearly double the property tax rates between 2010 ($1.809/$100 of net valuation taxable) and 2015 ($3.422/$100 of net valuation taxable).27 Even with the tax rate increases, it has been necessary to incur cuts or other staffing adjustments in many city departments over the past several years. For example, several departments had relatively constant budgets from 2010 to 2014, but were sharply cut in 2015. Public Works had a budget ranging from $16.0 million to $16.4 million annually from 2010 to 2014, but was cut to $13.4 million in 2015.28 Health and Human Services budgets increased from $6.4 million to $7.5 million from 2010 to 2014, but declined to $5.1 million in 2015.29 This coincided with a decline in spending for the License and Inspections department, as they now fall under a single directorship, but also included a significant drop in funding for recreation. The City Council and Clerk budget has declined from $1.5 million in 2010 to $0.8 million in 2015.30 Even with these changes the increasing tax rates has meant voluminous tax appeals and tax credit settlements, resulting in revenues below expectations and the need for additional bond financing, putting the City on shakier ground. Additionally, Atlantic City, like Atlantic County, has a foreclosure problem, but the rate currently is not as bad as it is at the Atlantic County level or in some of the surrounding townships. This may be attributable to the fact that real estate values in Atlantic City did not appreciate as high as in the townships, such that as a result of the economic downturn not as many homeowners had negative equity on their homes. Additionally, many Atlantic City residents are renters or have
27 City of Atlantic City General Obligation Bond Offering document (Bank of America Merrill Lynch) Dated May 21, 2015 28 City of Atlantic City adopted budgets, 2010 to 2015; http://www.cityofatlanticcity.org/doclib.aspx. 29 Ibid. 30 Ibid.

Gaming Expansion in New Jersey January 2016
35 | P a g e
resided there for a long time/lifetime, such that outstanding mortgage amounts may not be as onerous. Nevertheless, according to RealtyTrac, the city foreclosure rate, at 1 in every 369 for November 2015, is still well above the statewide rate (1 in every 553) and nearly four times the national average (1 in every 1,269).31 Moreover, the problem is getting worse. The number of properties that received a foreclosure filing in Atlantic City in October 2015 was 4% higher than in September 2015 and 192% higher than in October 2014.32 Additionally, a change in the ratable property tax base that results from casino hotels involved in a PILOT program means that small businesses and homeowners will feel the burden of growing City financial needs, or would need to make up the difference if the PILOT funds decline (which will be the case if North Jersey competition is permitted as it will assuredly result in declining casino resort revenues or closures). If more of these homeowners are unemployed as a result of the closure of the casino resorts, it is reasonable to assume that the foreclosure rate will increase substantially without substantial State assistance to make up the potential shortfall in the City budget.
31 RealtyTrac; http://www.realtytrac.com/statsandtrends/ 32 Ibid.

Gaming Expansion in New Jersey January 2016
36 | P a g e
City of Atlantic City Annual Budget Appropriations, 2010‐2015 2010 2011 2012 2013 2014 2015 CAGR
Total Expenditure $216,671,481 $243,836,830 $244,307,262 $257,653,895 $265,212,382 $262,445,114 3.9%
Administration $46,997,451 $48,222,227 $47,041,969 $50,601,248 $52,665,572 $37,026,664 ‐4.7%
Human Resources $964,118 $985,453 $913,702 $876,086 $916,066 $779,178 ‐4.2%
Planning & Development $341,877 $847,908 $874,330 $942,829 $1,698,078 $1,791,109 39.3%
Revenue & Finance $2,639,641 $2,520,087 $2,529,736 $2,264,099 $2,398,455 $2,080,975 ‐4.6%
Public Safety $72,719,323 $70,901,441 $72,348,956 $73,814,776 $81,274,364 $86,421,972 3.5%
Public Works $16,399,036 $15,987,486 $16,199,285 $16,051,403 $16,343,572 $13,395,815 ‐4.0%
Health & Human Services $6,384,273 $6,784,171 $7,016,739 $7,157,951 $7,476,901 $5,079,397 ‐4.5%
License & Inspection $1,602,911 $1,666,762 $1,719,674 $1,538,072 $1,627,904 $1,448,468 ‐2.0%
City Council & Clerk $1,486,468 $1,082,971 $1,101,587 $975,252 $894,091 $807,486 ‐11.5%
Construction Officials $1,941,312 $2,022,806 $2,084,027 $1,959,855 $2,134,022 $1,826,210 ‐1.2%
Utilities $6,525,000 $6,710,000 $7,127,000 $7,125,000 $7,175,000 $6,750,000 0.7%
Reserve for Tax Appeal $700,000 $700,000 $27,500,000 n/a
Deferred Charges/Payments $14,451,119 $27,007,751 $26,318,100 $35,409,431 $27,921,850 $9,172,406 ‐8.7%
Library Maintenance $7,032,661 $5,388,115 $5,921,880 $5,008,492 $5,030,736 $3,755,692 ‐11.8%
Misc. Public and Private Programs offset by Revenues
$2,455,821 $20,040,051 $12,575,912 $9,963,781 $7,057,591 $17,239,087 47.7%
Reserve for Uncollected Taxes $1,075,181 $2,708,386 $2,721,323 $4,328,290 $5,062,400 $5,037,209 36.2%
Misc. Other $13,266,158 $8,591,398 $4,602,860 $2,885,000 $8,639,955 $7,636,082 ‐10.5%
Debt Service $20,389,131 $21,669,817 $32,510,182 $36,752,330 $36,895,825 $34,697,364 11.2%
Total General Revenues $216,671,481 $243,836,830 $244,307,262 $257,653,895 $265,212,382 $262,445,114 3.9%
Anticipated Surplus $100,000 Local Revenues $8,952,518 $10,125,516 $8,892,111 $9,280,184 $8,544,321 $8,981,323 0.1%
State Aid $6,262,050 $6,260,714 $6,260,714 $6,260,714 $19,260,714 $29,260,714 36.1%
Other Miscellaneous Revenues $11,313,293 $28,887,747 $24,169,508 $38,759,068 $34,251,946 $89,536,739 51.2%
Delinquent Taxes $150,000 $600,000 $500,000 $4,000,000 $1,000,000 $2,500,000 75.5%
Local Taxes for Muni Purposes $189,993,620 $192,474,738 $198,563,049 $194,345,437 $197,124,665 $128,410,646 ‐7.5%
Minimum Library Tax $5,388,115 $5,921,880 $5,008,492 $5,030,736 $3,755,692 n/a Source: City of Atlantic City Adopted Annual Budgets, http://www.cityofatlanticcity.org/doclib.aspx. Note: Figures for 2010 to 2014 are based on the subsequent years’ reports. The growth in spending for the Planning and Development department is attributable to it being new in 2010 and adding a city engineer and CDGB economic development spending in 2014. The decline in Administration spending in 2015 is attributable to a $20 million insurance benefits payment owed to the State being deferred. Public Safety expenses combine departmental expenses under CAPS as well as grant money.
Gaming Expansion in New Jersey January 2016
37 | P a g e
Egg Harbor Township Egg Harbor Township boomed with the development of the casino resort industry in Atlantic City, but has been hit hard by the loss of jobs and spending attributable to the casino closures. While Census estimates have the population of the Township remaining relatively steady through 2015, foreclosure figures suggest that this is unlikely to be the case. In November 2015 the foreclosure rate in Egg Harbor Township was 1 in every 248 properties, well over twice the statewide rate (1 in every 553 properties) and more than 5 times the national average (1 in every 1,269).33 The Township has made an effort to maintain its public services and school quality, but it has meant increased taxes and an increased tax rate. The police department has slowly downsized its staff from 101 officers a decade ago to 85 currently. But continually escalating property tax rates have resulted in an increasing foreclosure rate, and there is little incentive for people or businesses to move into the market with such onerous property taxes. The Township deals with a large number of tax appeals, as property values have fallen by approximately 25% and homeowners are incapable of selling them when they try.34 The following table provides budget summaries for Egg Harbor Township from 2010 to 2015. In 2015 the Township is operating on an approximate $38.5 million annual budget, with a compound annual growth rate of approximately 2.7% since 2010. There have been steady increases in the spending on debt service, as well as steady growth in local tax collections.
33 RealtyTrac; http://www.realtytrac.com/statsandtrends/ 34 Phone interview with Egg Harbor Township Mayor Sonny McCollough, November 17, 2015.

Gaming Expansion in New Jersey January 2016
38 | P a g e
Egg Harbor Township Adopted Annual Budgets, 2010‐2015 2010 2011 2012 2013 2014 2015 CAGR
Total Expenditures $33,715,340 $35,803,058 $34,936,228 $36,691,231 $37,801,762 $38,512,282 2.7%
General Appropriations for Municipal Services within CAPS
$25,598,450 $27,977,230 $27,704,592 $28,967,476 $30,129,986 $30,936,006 3.9%
Operations Excluded from CAPS
Other Operations $1,752,236 $321,548 $373,772 $359,929 $287,802 $328,183 ‐28.5%
Shared Service Agreements $574,950 $430,634 $625,499 $889,851 $913,272 $936,622 10.3%
Public/Private Programs Offset by Revenues $370,083 $1,511,803 $432,499 $445,900 $591,126 $310,176 ‐3.5%
Capital Improvements $730,000 $580,000 $710,000 $450,000 $590,000 $331,000 ‐14.6%
Debt Service $4,133,378 $3,988,843 $3,891,591 $4,390,475 $4,339,576 $4,625,784 2.3%
Deferred Charges $100,000 $300,000 $505,275 $552,600 $300,000 $306,170 25.1%
Reserve for Uncollected Taxes $456,243 $693,000 $693,000 $635,000 $650,000 $738,341 10.1%
Total General Revenues $33,715,340 $35,803,058 $34,936,228 $36,691,231 $37,801,763 $38,512,282 2.7%
Anticipated Surplus $648,753 $1,065,000 $900,000 $402,943 $350,000 $300,000 ‐14.3%
Local Revenues $3,691,103 $3,474,889 $3,497,369 $3,787,376 $3,988,879 $4,028,813 1.8%
State Aid without Offsetting Appropriations $6,026,787 $6,039,065 $6,039,065 $6,039,065 $6,039,065 $6,039,065 0.0%
Other Miscellaneous $5,594,788 $6,200,513 $5,479,285 $5,715,918 $5,976,783 $6,323,057 2.5%
Receipts from Delinquent Taxes $82,041 $84,100 $152,294 $359,108 $308,162 $210,000 20.7%
Local Tax $17,671,868 $18,939,491 $18,868,215 $20,386,821 $21,138,874 $21,611,347 4.1%
Source: Egg Harbor Township Adopted Annual Budgets, http://www.ehtgov.org/Budgets/index.cfm. Note: Figures for 2010 to 2014 are based on the subsequent year budget documents.
Gaming Expansion in New Jersey January 2016
39 | P a g e
Galloway Township Like the surrounding jurisdictions, the tax base for Galloway Township is shrinking and mandatory expenditures for some departments and line items have made some departments face cuts. The local police department has had to cut its staff, through attrition, from 79 down to 51 over the past five years. Public Works expenditures have fallen by 30%. There has been a mandatory furlough at the municipal complex on Fridays (since ended), along with layoffs. This has all been necessary since there are some unavoidable costs that are increasing at a relatively rapid rate, such as pension contributions and health care costs.35 Stockton University and the Atlanticare hospital system are the major area employers and commercial operations in the area (although they are both exempt from real estate taxes and operate under PILOT agreements), but the planning and development department is working to bring business to the area since the ratable base is predominantly residential; less than 20% of the ratable property is commercial. A major, recent addition to the commercial mix was the acquisition of the former Lenox porcelain company plant by Railing Dynamics, Inc., providing 250 jobs. But additions of companies like Railing Dynamics are infrequent, such that the burden of increasing Township budgets falls almost entirely on homeowners. Moreover, Galloway Township at one time enjoyed a sizable amount of annual revenues from construction permits; the construction industry is now virtually non‐existent since there is no migration to the area, providing additional burdens on homeowners and higher tax rates. The result, like the neighboring jurisdictions, are a large number of vacant properties and foreclosures.36 In November 2015 the foreclosure rate in Absecon (which includes Galloway Township) had a foreclosure rate of 1 in every 264 properties. The following table provides budget summaries for Galloway Township from 2010 to 2015. In 2015 the Township is operating on an approximately $27.3 million annual budget, with a compound annual growth rate of approximately 3.7% since 2010. There have been steady increases in the spending on debt service, as well as steady growth in local tax collections.
35 Interview with Township officials, November 17, 2015. 36 RealtyTrac does not list the ratio of foreclosures to properties in Galloway Township

Gaming Expansion in New Jersey January 2016
40 | P a g e
Galloway Township Adopted Annual Budgets, 2010‐2015 2010 2011 2012 2013 2014 2015 CAGR
Total Expenditures $22,807,480 $23,382,958 $24,723,542 $25,426,736 $26,144,415 $27,309,410 3.7%
General Appropriations for Municipal Services within CAPS
$18,069,109 $18,373,089 $18,446,191 $17,760,353 $17,929,600 $18,671,591 0.7%
Operations Excluded from CAPS
Other Operations $123,250 $125,367 $131,655 $135,000 $206,617 $135,338 1.9%
Uniform Construction Code Appropriation $45,000 $45,000 $45,000 $45,000 $35,000 $0
Shared Service Agreements $0 $0 $0 $0 $52,459 $53,000
Public/Private Programs Offset by Revenues $592,928 $792,360 $1,118,090 $1,764,986 $272,203 $305,746 ‐12.4%
Capital Improvements $0 $58,000 $158,000 $58,000 $290,000 $1,195,000
Debt Service $3,069,092 $3,074,142 $3,119,315 $3,614,871 $4,860,200 $4,734,671 9.1%
Deferred Charges $240,000 $240,000 $640,000 $356,000 $689,790 $190,000 ‐4.6%
Reserve for Uncollected Taxes $668,101 $675,000 $1,065,291 $1,692,526 $1,808,546 $2,024,064 24.8%
Total General Revenues $22,807,480 $23,382,958 $24,723,542 $25,426,736 $26,144,415 $27,309,410 3.7%
Anticipated Surplus $2,535,000 $2,000,000 $2,460,000 $1,490,000 $2,000,000 $3,929,664 9.2%
Local Revenues $1,638,000 $1,561,000 $1,536,200 $1,504,600 $1,530,000 $1,420,000 ‐2.8%
State Aid without Offsetting Appropriations $2,577,193 $2,581,284 $2,581,284 $2,581,284 $2,590,948 $2,581,284 0.0%
Other Miscellaneous $955,356 $1,384,518 $1,804,018 $2,878,368 $1,457,349 $1,095,891 2.8%
Receipts from Delinquent Taxes $20,165 $20,000 $20,000 $20,000 $20,000 $20,000 ‐0.2%
Local Tax $15,081,766 $15,836,156 $16,322,040 $16,952,484 $18,546,118 $18,262,571 3.9%
Source: Galloway Township Adopted Annual Budgets, http://www.gallowaytwp‐nj.gov/finance.html Note: Figures for 2010 to 2014 are based on the subsequent year budget documents.

Gaming Expansion in New Jersey January 2016
41 | P a g e
Other Regional Data The recent casino closures have caused additional disruptions among the Atlantic County population. From 2011 to 2014, the number of households receiving Food Stamp assistance has risen from 6,623 to 12,627 (an increase of over 6,000 households or over 90%). The percentage of households on Food Stamp assistance has risen from 8% to 12.5% during that same period. This does not include 2015 data and there could be a lag between casino layoffs in September 2014 and the date on which those affected received assistance indicating that this statistic could have risen in 2015.
Source: U.S. Census data and estimates for 2010‐2014
Regional Economy Conclusion The gaming industry in Atlantic City has been largely responsible for the outsized growth of the populations of the region and the towns surrounding Atlantic City. For the four decades since gaming was enacted, the mainland towns of Atlantic County, notably Egg Harbor Township and Galloway Township have accommodated much of this growth, resulting in increased government services, school construction and infrastructure. Since peaking at close to 50,000 employees, the casino industry has shed over 25,000 jobs including over 10,000 most recently in 2014 when four casinos closed. With the downsizing of the casino industry, the Atlantic County region has come under considerable stress. The mainland municipalities have some of the highest foreclosure rates in the country, dragging down real estate values and causing numerous tax appeals. High unemployment rates exacerbate these problems and towns have reacted by cutting some services including public safety. Atlantic County has also experienced a significant increase in the number of households on Food Stamp assistance and the Atlantic County Administration reports that 40% of all residents receive some sort of state or Federal assistance.
6,623 8,116 9,776 11,740 12,627
6.5%
8.0%
9.7%
11.6%
12.5%
4.0%
5.0%
6.0%
7.0%
8.0%
9.0%
10.0%
11.0%
12.0%
13.0%
4,000
5,000
6,000
7,000
8,000
9,000
10,000
11,000
12,000
13,000
14,000
2010 2011 2012 2013 2014
Households Receiving Food Stamp Assistance
Households With Food Stamp % of Households with Food Stamp

Gaming Expansion in New Jersey January 2016
42 | P a g e
However, despite the significant losses of casino jobs, the casino industry remains the largest employer in the region. One of the most significant issues facing the regional economy is the lack of alternative employment in the region and the inability of laid off casino workers to migrate to other employment outside the region with similar wage and benefit levels. The recent stabilization of the industry has put the local economy on a better footing for the time being. However, a further decline in casino industry employment would have an extremely detrimental, if not catastrophic, impact.

Gaming Expansion in New Jersey January 2016
43 | P a g e
V. THE FUTURE OF ATLANTIC CITY WITHOUT NEW JERSEY EXPANSION Regional Gaming Trends A review of the Mid‐Atlantic and Northeast gaming markets is particularly important to understanding the potential dynamics of gaming throughout these regions. While the State of New Jersey has no control over the expansion of gaming outside of New Jersey, it can control added competition with Atlantic City from within New Jersey. The regional market includes a total of 52 existing casinos in New York, Connecticut, New Jersey, Pennsylvania, West Virginia, Delaware, Maryland and Ohio (which will potentially increase to 64 after expansion in PA, NY, MA, CT and MD). We have identified five separate sub‐groupings for these gaming markets/casinos (although there is overlap among several of these) as follows:
Regional Market Competitors
Market Current Participants Potential Future Participants Mid‐Atlantic 8 Atlantic City casinos; 4 Maryland casinos;
3 Delaware racinos; 8 Pennsylvania casinos; 1 WV racino; 3 New York racinos
Philadelphia casino; MGM National Harbor (MD); 2 Slot Parlors in Long Island; Montreign (Sullivan County, NY)
New England 2 Native American casinos in CT; 2 casinos in RI (with proposal to relocate Newport Grand to Tiverton); 1 racino in MA
Three resort casinos in MA (Boston, Springfield and Taunton); Potential casino in Hartford, CT
Upstate NY 3 racinos (with proposed Tioga Downs expansion); 2 Native American casinos (Turning Stone and Yellow Brick Road)
Proposed resort casinos (Lago and Rivers)
Western NY 3 racinos; 4 Native American casinos (Seneca); 1 PA racino
Western PA 3 PA casinos; 2 WV racinos; 1 MD casino; 1 OH racino
Proposed PA racino (Lawrence Downs)
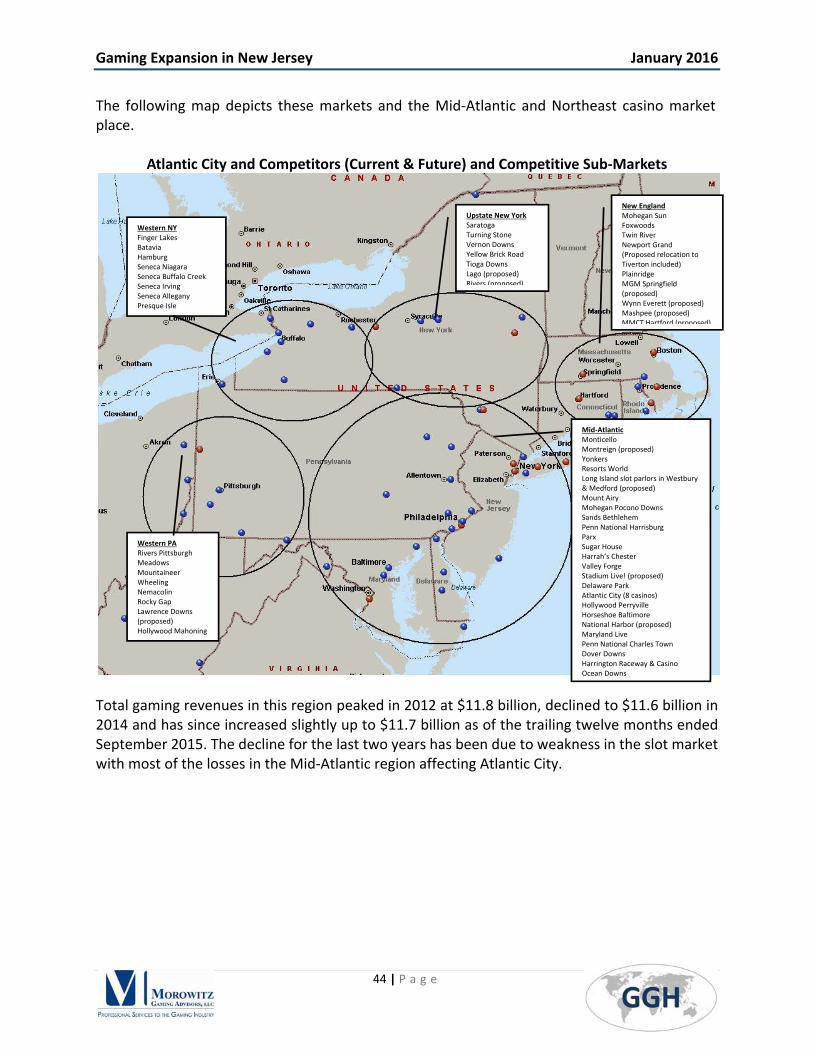
Gaming Expansion in New Jersey January 2016
44 | P a g e
The following map depicts these markets and the Mid‐Atlantic and Northeast casino market place.
Atlantic City and Competitors (Current & Future) and Competitive Sub‐Markets
Total gaming revenues in this region peaked in 2012 at $11.8 billion, declined to $11.6 billion in 2014 and has since increased slightly up to $11.7 billion as of the trailing twelve months ended September 2015. The decline for the last two years has been due to weakness in the slot market with most of the losses in the Mid‐Atlantic region affecting Atlantic City.
Mid‐Atlantic Monticello Montreign (proposed) Yonkers Resorts World Long Island slot parlors in Westbury & Medford (proposed) Mount Airy Mohegan Pocono Downs Sands Bethlehem Penn National Harrisburg Parx Sugar House Harrah’s Chester Valley Forge Stadium Live! (proposed) Delaware Park Atlantic City (8 casinos) Hollywood Perryville Horseshoe Baltimore National Harbor (proposed) Maryland Live Penn National Charles Town Dover Downs Harrington Raceway & Casino Ocean Downs
Western NY Finger Lakes Batavia Hamburg Seneca Niagara Seneca Buffalo Creek Seneca Irving Seneca Allegany Presque Isle
Western PA Rivers Pittsburgh Meadows Mountaineer Wheeling Nemacolin Rocky Gap Lawrence Downs (proposed) Hollywood Mahoning
Upstate New York Saratoga Turning Stone Vernon Downs Yellow Brick Road Tioga Downs Lago (proposed) Rivers (proposed)
New England Mohegan Sun Foxwoods Twin River Newport Grand (Proposed relocation to Tiverton included) Plainridge MGM Springfield (proposed) Wynn Everett (proposed) Mashpee (proposed) MMCT Hartford (proposed)

Gaming Expansion in New Jersey January 2016
45 | P a g e
Reported Gaming Revenues in Regional Markets ($Million)
Source: Various state agencies and GGH research – Atlantic City includes free play
Current Regional Expansion (Before North Jersey Casinos) Casinos first came to Atlantic City in 1978 and New Jersey enjoyed a monopoly on gaming on the east coast until the early 1990s. As we documented earlier in this study, gaming expansion started in the early 1990s with the opening of casinos in Connecticut (Foxwoods and Mohegan Sun) and
2007 2008 2009 2010 2011 2012 2013 2014 TTM 9/2015
Mid‐Atlantic/Metro NYC
Monitcello 64.3$ 58.1$ 53.8$ 57.4$ 60.9$ 63.9$ 62.8$ 59.1$ 59.6$
Atlantic City 4,920.8$ 4,545.2$ 3,943.2$ 3,565.0$ 3,317.7$ 3,051.3$ 2,862.4$ 2,619.3$ 2,425.2$
Delaware Park 272.6$ 253.3$ 235.0$ 236.2$ 222.6$ 211.8$ 167.8$ 156.7$ 158.0$
Harrahs Chester 286.0$ 328.4$ 315.9$ 326.5$ 349.1$ 340.8$ 311.2$ 286.8$ 282.6$
Sugar House ‐$ ‐$ ‐$ 54.2$ 245.2$ 274.1$ 265.6$ 265.1$ 269.5$
Parx 285.0$ 345.5$ 359.3$ 432.6$ 491.2$ 494.5$ 487.7$ 490.6$ 515.6$
Valley Forge ‐$ ‐$ ‐$ ‐$ ‐$ 58.0$ 96.3$ 106.7$ 111.4$
Sands Bethlehem ‐$ ‐$ 142.3$ 286.1$ 377.3$ 438.0$ 465.0$ 470.0$ 507.9$
Mount Airy 25.7$ 176.4$ 164.6$ 163.3$ 185.4$ 189.5$ 183.4$ 183.7$ 184.7$
Mohegan Pocono 175.5$ 185.6$ 220.8$ 243.2$ 274.8$ 274.9$ 263.4$ 262.8$ 262.4$
Penn Hollywood PA ‐$ 171.1$ 237.7$ 268.5$ 287.3$ 282.6$ 266.8$ 247.4$ 250.3$
Resorts World (Aqueduct) ‐$ ‐$ ‐$ ‐$ 89.3$ 672.6$ 785.1$ 808.0$ 825.4$
Empire Slots (Yonkers Raceway) 394.3$ 486.5$ 540.5$ 581.2$ 624.4$ 544.7$ 559.9$ 537.5$ 553.1$
Ocean Downs ‐$ ‐$ ‐$ ‐$ 44.9$ 49.9$ 51.9$ 51.8$ 54.3$
Penn Perryville ‐$ ‐$ ‐$ 27.6$ 110.8$ 98.6$ 87.5$ 82.9$ 77.0$
Midway 122.9$ 122.1$ 121.5$ 125.0$ 115.1$ 107.2$ 97.7$ 92.7$ 91.6$
Dover 216.9$ 213.6$ 207.7$ 210.1$ 209.6$ 201.5$ 166.6$ 154.3$ 153.3$
Penn National Charles Town 465.3$ 444.8$ 426.8$ 458.1$ 553.2$ 543.4$ 456.2$ 392.4$ 389.4$
Horseshoe Baltimore ‐$ ‐$ ‐$ ‐$ ‐$ ‐$ ‐$ 96.9$ 281.7$
Maryland Live ‐$ ‐$ ‐$ ‐$ ‐$ 229.3$ 586.0$ 655.7$ 623.2$
Total Mid‐Atlantic/Metro NYC 7,229.3$ 7,330.6$ 6,969.1$ 7,035.1$ 7,558.9$ 8,126.8$ 8,223.2$ 8,020.4$ 8,076.2$
New England
Mohegan Sun 1,293.3$ 1,197.5$ 1,077.3$ 1,041.1$ 1,032.2$ 955.6$ 914.4$ 880.3$ 879.2$
Foxwoods table games‐estimated) 783.4$ 728.0$ 684.4$ 649.0$ 633.8$ 576.8$ 530.6$ 483.6$ 464.8$
Twin River 375.8$ 407.5$ 399.7$ 423.8$ 462.8$ 477.8$ 511.7$ 565.9$ 569.5$
Newport Grand 72.7$ 67.5$ 61.5$ 53.3$ 50.1$ 50.1$ 46.4$ 45.2$ 44.6$
Plainridge 52.1$
Total New England 2,525.2$ 2,400.6$ 2,222.9$ 2,167.2$ 2,178.9$ 2,060.3$ 2,003.1$ 1,974.9$ 2,010.2$
Upstate New York
Tioga Downs 41.4$ 47.2$ 49.4$ 53.0$ 57.0$ 61.7$ 59.6$ 55.9$ 56.5$
Saratoga 129.8$ 134.4$ 136.0$ 139.7$ 150.4$ 159.8$ 159.6$ 158.8$ 160.3$
Vernon Downs 32.1$ 37.3$ 37.1$ 41.3$ 42.3$ 43.7$ 43.7$ 41.5$ 39.7$
Turning Stone (Does not report) ‐$ ‐$ ‐$ ‐$ ‐$ ‐$ ‐$ ‐$ ‐$
Yellow Brick Road (Does not report) ‐$ ‐$ ‐$ ‐$ ‐$ ‐$ ‐$ ‐$ ‐$
Total Upstate New York 203.3$ 218.9$ 222.5$ 234.0$ 249.7$ 265.1$ 262.9$ 256.2$ 256.5$
Western New York
Finger Lakes 93.2$ 101.4$ 111.1$ 115.7$ 122.0$ 129.6$ 131.5$ 124.4$ 124.5$
Batavia 28.2$ 32.5$ 36.3$ 37.7$ 39.8$ 45.1$ 43.7$ 49.0$ 50.6$
Fairgrounds 44.9$ 50.0$ 55.1$ 61.6$ 73.1$ 81.2$ 76.8$ 64.2$ 63.8$
Seneca Casinos (stopped reporting) ‐$ ‐$ ‐$ ‐$ ‐$ ‐$ ‐$ ‐$ ‐$
Presque Isle 142.2$ 164.5$ 166.7$ 180.2$ 188.4$ 169.6$ 144.6$ 132.5$ 129.7$
Total Western New York 308.5$ 348.3$ 369.2$ 395.3$ 423.3$ 425.6$ 396.6$ 370.0$ 368.6$
Western PA
Rivers ‐$ ‐$ 78.8$ 267.7$ 343.1$ 351.5$ 352.0$ 346.3$ 348.1$
The Meadows 124.6$ 244.1$ 278.5$ 264.1$ 282.9$ 284.4$ 264.3$ 245.4$ 245.5$
Mountaineer 229.3$ 254.6$ 235.1$ 202.2$ 201.4$ 195.7$ 176.0$ 164.9$ 144.3$
Wheeling 175.5$ 189.7$ 179.0$ 144.9$ 137.2$ 122.4$ 99.8$ 94.0$ 95.7$
Nemacolin ‐$ ‐$ ‐$ ‐$ ‐$ ‐$ 13.8$ 31.7$ 35.5$
Rocky Gap ‐$ ‐$ ‐$ ‐$ ‐$ ‐$ 23.2$ 43.7$ 45.2$
Hollywood Mahoning ‐$ ‐$ ‐$ ‐$ ‐$ ‐$ ‐$ 28.7$ 91.8$
Total Western PA 529.4$ 688.3$ 771.4$ 878.9$ 964.7$ 954.0$ 929.2$ 954.7$ 1,006.1$
Total 10,795.7$ 10,986.7$ 10,555.2$ 10,710.6$ 11,375.6$ 11,831.8$ 11,815.0$ 11,576.3$ 11,717.7$

Gaming Expansion in New Jersey January 2016
46 | P a g e
then proceeded with racinos in Delaware, Rhode Island and West Virginia and Tribal facilities in upstate New York. During the 2000s New York entered the fray with racinos throughout the state and Pennsylvania followed with racinos and slot parlors. As the northeast became more competitive in the late 2000s, the industry expanded with legislation allowing table games in West Virginia, Pennsylvania and Delaware. New casinos in Maryland, Maine and Massachusetts came online over the last several years. As land based casinos proliferated, New Jersey and Delaware added online gaming bringing casino games into patrons homes in both those states. The negative impacts of this expansion on Atlantic City were documented earlier in this report. In the next few years additional casinos are slated to open in Philadelphia (Cordish) the Washington, D.C. area, in Massachusetts (3 new casinos in Boston, Springfield and southeastern MA), Long Island New York (two slot parlors) and New York State (4 casinos in Monticello, Schenectady, Binghamton and between Rochester and Syracuse). This expansion will cut further into the gaming market, impacting all casino operators throughout the northeast, including Atlantic City. However, since most of these new out‐of‐state competitors will be on the outer reaches of Atlantic City’s feeder markets, most of the impacts of this expansion will be felt by Atlantic City’s competitors in New York, Pennsylvania, Maryland and Delaware.
Current Anticipated Gaming Expansion
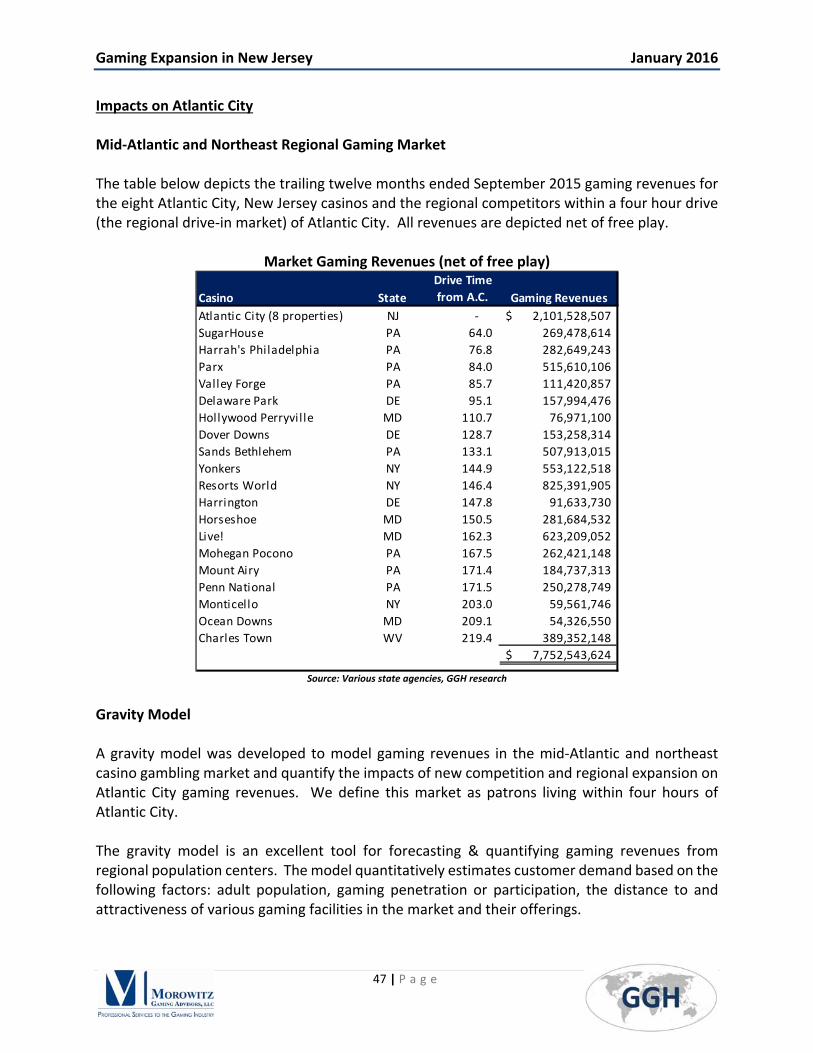
Gaming Expansion in New Jersey January 2016
47 | P a g e
Impacts on Atlantic City Mid‐Atlantic and Northeast Regional Gaming Market The table below depicts the trailing twelve months ended September 2015 gaming revenues for the eight Atlantic City, New Jersey casinos and the regional competitors within a four hour drive (the regional drive‐in market) of Atlantic City. All revenues are depicted net of free play.
Market Gaming Revenues (net of free play)
Source: Various state agencies, GGH research
Gravity Model A gravity model was developed to model gaming revenues in the mid‐Atlantic and northeast casino gambling market and quantify the impacts of new competition and regional expansion on Atlantic City gaming revenues. We define this market as patrons living within four hours of Atlantic City. The gravity model is an excellent tool for forecasting & quantifying gaming revenues from regional population centers. The model quantitatively estimates customer demand based on the following factors: adult population, gaming penetration or participation, the distance to and attractiveness of various gaming facilities in the market and their offerings.
Casino State
Drive Time
from A.C. Gaming Revenues
Atlantic City (8 properties) NJ ‐ 2,101,528,507$
SugarHouse PA 64.0 269,478,614
Harrah's Philadelphia PA 76.8 282,649,243
Parx PA 84.0 515,610,106
Valley Forge PA 85.7 111,420,857
Delaware Park DE 95.1 157,994,476
Hollywood Perryvil le MD 110.7 76,971,100
Dover Downs DE 128.7 153,258,314
Sands Bethlehem PA 133.1 507,913,015
Yonkers NY 144.9 553,122,518
Resorts World NY 146.4 825,391,905
Harrington DE 147.8 91,633,730
Horseshoe MD 150.5 281,684,532
Live! MD 162.3 623,209,052
Mohegan Pocono PA 167.5 262,421,148
Mount Airy PA 171.4 184,737,313
Penn National PA 171.5 250,278,749
Monticello NY 203.0 59,561,746
Ocean Downs MD 209.1 54,326,550
Charles Town WV 219.4 389,352,148
7,752,543,624$

Gaming Expansion in New Jersey January 2016
48 | P a g e
The gravity model derives its name and basic premise from Isaac Newton’s law of gravity. William Reilly developed Reilly’s Law of Retail Gravitation for purposes of determining “Retail Gravitation.” Gravity models are commonly used in the retail and gaming industries to determine the interaction between or likely number of trips from population centers (generators) to shopping malls or casinos (attractors). The model is used to predict the likely number of gamers in the market and at which properties (or proposed properties) they spend (or would spend) their gaming dollars. The gravity model formula is as follows:
Gamers x (Gaming Positions & Hotel Rooms) x Attraction) / Distance2 In developing our model, we calibrate regional gaming revenues in the model to actual market performance for a recent twelve month period. There are two key drivers we use to estimate the gaming revenues in the regional market. Those drivers are as follows: The first is the estimated gaming penetration of the market, i.e. the percentage of adults in the market that participate in casino gambling. According to many published surveys, in jurisdictions with significant gaming capacity, we often see state‐wide participation rates up to and exceeding 40%. Our model estimates participation rates based on a negative exponential curve. This means that adults in zip codes closest to casinos participate at the highest level and as distance between zip codes and their closest casino increases, estimated participation rates decrease and do so at an increasing rate. Thus, as shown below, $1.2 billion or 59% of Atlantic City’s current market, resides within a 120 to 180 minute drive, a large portion of which is at risk of being be siphoned off by North Jersey casinos. The second driver is the estimated annual gaming budget per participant. Throughout the United States, these budgets typically range from $700 to over $1,100 annually. Higher budgets exist where gaming product is readily accessible to populations. In calibrating our model to the actual gaming revenues in the market for the trailing twelve months ended September 2015, we calibrated to a maximum annual gaming budget of $1,019 per participant, which is then adjusted based on the per capita income of each zip code in the model. Based on our assumptions of participation and spend, our gravity model was calibrated to yield the trailing twelve month gaming revenues (net of free play) of the eight casinos that operated during that period (the Atlantic Club closed in January of 2014, Showboat in August 2014 and Trump Plaza and Revel in September 2014). We also assume that Atlantic City generates most of its gaming revenues from within a four hour radius which is well within the area North Jersey casinos would draw from. This assumption is based on discussions with casino operators and analysis of casino database information by geographic region. Our analysis indicates that revenues coming from beyond four hours are minimal. The model output below depicts adult population, participation and gaming revenues by drive time bands for the market within four hours of Atlantic City.

Gaming Expansion in New Jersey January 2016
49 | P a g e
TTM September 2015 Calibrated Gravity Model Summary
Source: DemographicsNow, 4C GeoWorks, GGH research
The model calibrates to $2.1 billion of current gaming revenue (net of free play) in Atlantic City. It indicates that a significant amount of that revenue (over $1.4 billion) comes from beyond two hours of Atlantic City, mostly in areas around the New York metro market. These are areas that will be most at risk if casinos are permitted in North Jersey. There are presently an estimated $8.6 billion of gaming revenues generated from gamers living within four hours of Atlantic City (some of these patrons gamble at casinos located more than four hours from Atlantic City and that spending is not included in casinos within four hours from Atlantic City). The model yields an average participation rate of 28.8% and average annual gaming budget of $929 per gamer. Regional Spend per Adult Benchmarks Our gravity model also yields average spend per adult of $292 within 3 hours and $267 within 4 hours of Atlantic City. We benchmark these figures to actual spend per adult amounts calculated for the entire United States and for specific east coast markets. At a national level gaming revenues at both commercial and Native American casinos have been approximately $66 billion annually37. Spend per adult has remained fairly consistent from 2012 through 2014 and was $289 for 2014.
37 National benchmarks include free play in certain jurisdictions and are therefore slightly overstated leading to an artificially high benchmark for spend per adult.
Minutes
Adult
Population
Per Capita
Income
Partici‐
pation
% Gamers
Avg.
Annual
Budget Estimated Market
Spend
per
Adult
Atlantic City
Revenues
Market
Share
< 30 Minutes 193,119 28,309$ 37.6% 72,527 914$ 66,257,455$ $ 343 65,725,730$ 99.2%
30‐60 Minutes 1,038,510 31,119$ 28.6% 296,793 938$ 278,391,107$ $ 268 147,080,876$ 52.8%
60‐90 Minutes 3,238,588 31,168$ 34.0% 1,100,021 898$ 987,788,220$ $ 305 203,431,655$ 20.6%
90‐120 Minutes 3,420,013 36,342$ 26.8% 916,418 974$ 892,469,769$ $ 261 236,323,218$ 26.5%
120‐180 Minutes 15,988,946 34,738$ 32.5% 5,191,278 914$ 4,745,108,881$ $ 297 1,241,665,115$ 26.2%
180‐240 Minutes 8,092,840 39,350$ 20.2% 1,630,890 970$ 1,582,372,373$ $ 196 207,301,914$ 13.1%
Total 31,972,016 35,563$ 28.8% 9,207,927 929$ 8,552,387,804$ $ 267 2,101,528,507$ 24.6%
Cumulative
Minutes
Adult
Population
Per Capita
Income
Partici‐
pation
% Gamers
Avg.
Annual
Budget Estimated Market
Spend
per
Adult
Atlantic City
Revenues
Market
Share
<30 193,119 28,309$ 37.6% 72,527 914$ 66,257,455$ $ 343 65,725,730$ 99.2%
<60 1,231,629 30,671$ 30.0% 369,319 933$ 344,648,562$ $ 280 212,806,605$ 61.7%
<90 4,470,217 31,034$ 32.9% 1,469,341 907$ 1,332,436,782$ $ 298 416,238,261$ 31.2%
<120 7,890,230 33,346$ 30.2% 2,385,759 933$ 2,224,906,551$ $ 282 652,561,479$ 29.3%
<180 23,879,176 34,274$ 31.7% 7,577,037 920$ 6,970,015,432$ $ 292 1,894,226,594$ 27.2%
<240 31,972,016 35,563$ 28.8% 9,207,927 929$ 8,552,387,804$ $ 267 2,101,528,507$ 24.6%

Gaming Expansion in New Jersey January 2016
50 | P a g e
Spend per Adult – United States
Source: Various state agencies, NICG, U.S. Census, GGH research
We also calculated spend per adult for a Mid‐Atlantic region (defined as 100 miles from Bethlehem, PA) which includes 22 casinos with over $6.3 billion of gaming revenues for the trailing twelve months ended September 2015. This region is depicted on the following map.
Mid‐Atlantic Region
Source: Microsoft MapPoint and casinocity.com
Spend per adult for this region was $289 (net of free play) as calculated below or slightly higher than the National average when considering the adjustment for free play.
2012 2013 2014
Commercial Casinos ($B) 37.4$ 38.0$ 37.6$
Native American ($B) 27.9 28.0 28.5
65.3$ 66.0$ 66.0$
Estimated U.S. Adult Population 224,799,506 226,506,695 228,195,328
Spend Per Adult 291$ 291$ 289$

Gaming Expansion in New Jersey January 2016
51 | P a g e
Spend per Adult – Mid‐Atlantic Region
Source: Various state agencies, GGH research
Finally we looked to a combined mid‐Atlantic and northeast market similar to the market we modeled. Atlantic City casinos compete with Mohegan Sun and Foxwoods in Connecticut as well as Sands Bethlehem, Yonkers and Resorts World for customers in the densely populated New York Metro area which lies at the heart of this market.
Mid‐Atlantic and Northeast Region
Source: Microsoft MapPoint and casinocity.com
City State TTM Sep. 2015
Atlantic City Casinos Atlantic City NJ 2,101,528,507$
SugarHouse Philadelphia PA 269,478,614
Harrah's Philadelphia Chester PA 282,649,243
Parx Bensalem PA 515,610,106
Valley Forge King of Prussia PA 111,420,857
Delaware Park Wilmington DE 157,994,476
Hollywood Perryvil le Perryvil le MD 76,971,100
Dover Downs Dover DE 153,258,314
Sands Bethlehem PA 507,913,015
Yonkers Yonkers NY 553,122,518
Resorts World Jamaica NY 825,391,905
Mohegan Pocono Wilkes‐Barre PA 262,421,148
Mount Airy Mount Pocono PA 184,737,313
Hollywood Grantvil le Grantvil le PA 250,278,749
Monticello Monticello NY 59,561,746
6,312,337,612$
Adult Population 21,838,359
289$

Gaming Expansion in New Jersey January 2016
52 | P a g e
This combined region approximates a 4 hour drive time radius from New York City and has an adult population of over 35 million. The region includes 30 casinos from Massachusetts to the north to Maryland and Delaware to the south with over $9.5 billion of gaming revenues. Spend per adult for this region was $269 (net of free play) as calculated below. This is lower than the national benchmark, but considering free play is included in the national totals, it appears the market is relatively mature.
Spend per Adult – Mid‐Atlantic & Northeast Region
Source: Various state agencies, GGH research
Estimated Future Impacts to Atlantic City Gaming Revenues from New Out‐Of‐State Competition We utilized our calibrated gravity model to estimate potential impacts to Atlantic City gaming revenues of the known future out‐of‐state competition in the regional gaming market (exclusive of northern New Jersey casinos). The table below provides details on the current competitive set and highlights both known and potential future out‐of‐state casinos that may enter the market.
City State TTM Sep. 2015
Atlantic City Casinos Atlantic City NJ 2,101,528,507$
SugarHouse Philadelphia PA 269,478,614
Harrah's Philadelphia Chester PA 282,649,243
Parx Bensalem PA 515,610,106
Valley Forge King of Prussia PA 111,420,857
Delaware Park Wilmington DE 157,994,476
Hollywood Perryvil le Perryvil le MD 76,971,100
Dover Downs Dover DE 153,258,314
Sands Bethlehem PA 507,913,015
Yonkers Yonkers NY 553,122,518
Resorts World Jamaica NY 825,391,905
Harrington Harrington DE 91,633,730
Horseshoe Baltimore Baltimore MD 281,684,532
Maryland Live! Hanover MD 623,209,052
Mohegan Pocono Wilkes‐Barre PA 262,421,148
Mount Airy Mount Pocono PA 184,737,313
Hollywood Grantvil le Grantvil le PA 250,278,749
Monticello Monticello NY 59,561,746
Mohegan Sun Uncasvil le CT 878,521,473
Foxwoods Mashantucket CT 699,782,941
Twin River Lincoln RI 569,514,632
Newport Grand Newport RI 44,586,178
Plainridge Park Plainvil le MA 52,146,969
9,553,417,117$
Adult Population 35,457,420
269$

Gaming Expansion in New Jersey January 2016
53 | P a g e
Casinos within 6 Hours of Atlantic City
Source: Various state agencies, casinocity.com, GGH research
Casino City ST
Drive time
from A.C. Slots Tables Conv SF Rooms Rests Venues Parking
Bally's Atlantic City NJ ‐ 1,840 170 225,340 1,169 13 6 3,478
Borgata Atlantic City NJ ‐ 3,038 316 70,000 2,767 16 4 7,100
Caesars Atlantic City NJ ‐ 1,854 150 33,730 1,141 15 8 2,938
Golden Nugget Atlantic City NJ ‐ 1,376 91 30,500 727 11 4 3,015
Harrah's Atlantic City NJ ‐ 2,156 176 19,407 2,590 16 4 3,396
Resorts Atlantic City NJ ‐ 1,578 71 39,000 942 9 2 1,349
Tropicana Atlantic City NJ ‐ 2,316 130 122,000 2,078 27 9 5,684
Taj Mahal Atlantic City NJ ‐ 2,519 130 155,000 2,010 20 4 4,000
Total A.C. 16,677 1,234 694,977 13,424 127 41 30,960
SugarHouse Philadelphia PA 64.0 1,604 84 ‐ ‐ 2 ‐ 1,700
Stadium Philadelphia PA 66.5 TBD TBD TBD TBD TBD TBD TBD
Harrah's Chester PA 76.8 2,800 116 11,000 ‐ 9 ‐ 2,662
Parx Bensalem PA 84.0 3,285 170 ‐ ‐ 8 ‐ ‐
Valley Forge King of Prussia PA 85.7 600 50 54,000 488 7 3 ‐
Delaware Park Wilmington DE 95.1 2,352 88 ‐ ‐ 11 2 7,600
Hollywood Perryvil le MD 110.7 850 22 41,000 ‐ 2 ‐ 1,600
Dover Downs Dover DE 128.7 2,355 28 35,000 500 14 2 2,300
Sands Bethlehem PA 133.1 3,013 207 22,000 300 8 4 3,500
Yonkers Yonkers NY 144.9 5,237 ‐ ‐ ‐ 6 1 ‐
Resorts World Jamaica NY 146.4 5,145 ‐ ‐ ‐ 10 2 6,400
Harrington Harrington DE 147.8 1,807 42 10,000 ‐ 4 2 550
Horseshoe Baltimore MD 150.5 2,200 178 ‐ ‐ 9 ‐ 3,500
Maryland Live! Hanover MD 162.3 4,059 202 ‐ ‐ 9 1 5,000
Nassau County Westbury NY 163.3 1,000 ‐ TBD ‐ TBD TBD TBD
Mohegan Pocono Wilkes‐Barre PA 167.5 232 91 20,000 238 14 7 4,000
Mount Airy Mount Pocono PA 171.4 1,868 80 6,000 188 4 2 ‐
Hollywood Grantville PA 171.5 2,397 69 6,500 ‐ 6 1 4,100
Suffolk County Medford NY 163.3 1,000 ‐ TBD ‐ TBD TBD TBD
MGM National Harbor MD 197.0 TBD TBD TBD TBD TBD TBD TBD
Montreign Thompson NY 201.7 2,150 82 TBD 344 TBD TBD TBD
Monticello Monticello NY 203.0 1,110 ‐ ‐ ‐ 4 2 5,000
Ocean Downs Berlin MD 209.1 800 ‐ ‐ ‐ 5 ‐ 500
Hollywood Charles Town WV 219.4 2,602 119 ‐ 153 7 1 6,084
Tioga Downs Nichols NY 255.8 802 ‐ ‐ 4 2 ‐
Mohegan Sun Uncasvil le CT 263.1 5,126 100,000 1,176 35 5 13,000
Rocky Gap Flintstone MD 266.2 627 ‐ ‐ ‐ ‐ ‐
Rivers NY Schenectady NY 267.3 ‐ ‐ 185 ‐ ‐ ‐
Foxwoods Mashantucket CT 275.3 4,583 150,000 2,224 33 11 10,750
MGM Springfield Springfield MA 276.3 3,000 ‐ 250 ‐ ‐ ‐
Saratoga Saratoga Springs NY 281.2 1,733 ‐ ‐ 7 3 ‐
Yellow Brick Road Chittenango NY 304.5 436 ‐ ‐ 5 1 ‐
Twin River Lincoln RI 313.4 4,266 29,000 ‐ 16 7 6,000
Newport Grand Newport RI 317.5 1,097 ‐ ‐ 2 1 2,200
Turning Stone Verona NY 319.5 2,150 100,000 709 14 6 5,000
Lady Luck Nemacoli Farmington PA 322.5 597 ‐ ‐ ‐ ‐ ‐
Plainridge Park Plainvil le MA 325.2 1,250 ‐ ‐ 9 ‐ 1,500
Lago Tyre NY 328.3 2,000 ‐ ‐ 6 ‐ ‐
Vernon Downs Vernon NY 329.0 761 20,000 175 7 ‐ 5,000
Rivers Pittsburgh Pittsburgh PA 342.5 2,954 15,000 ‐ 8 ‐ ‐
Wynn Everett Everett MA 344.4 4,000 ‐ ‐ ‐ ‐ ‐
Finger Lakes Farmington NY 354.7 1,200 26,200 ‐ 5 ‐ 4,000
The Meadows Washington PA 359.2 3,317 ‐ ‐ 7 1 1,684
Total 105,042 2,862 1,340,677 20,354 424 108 134,590
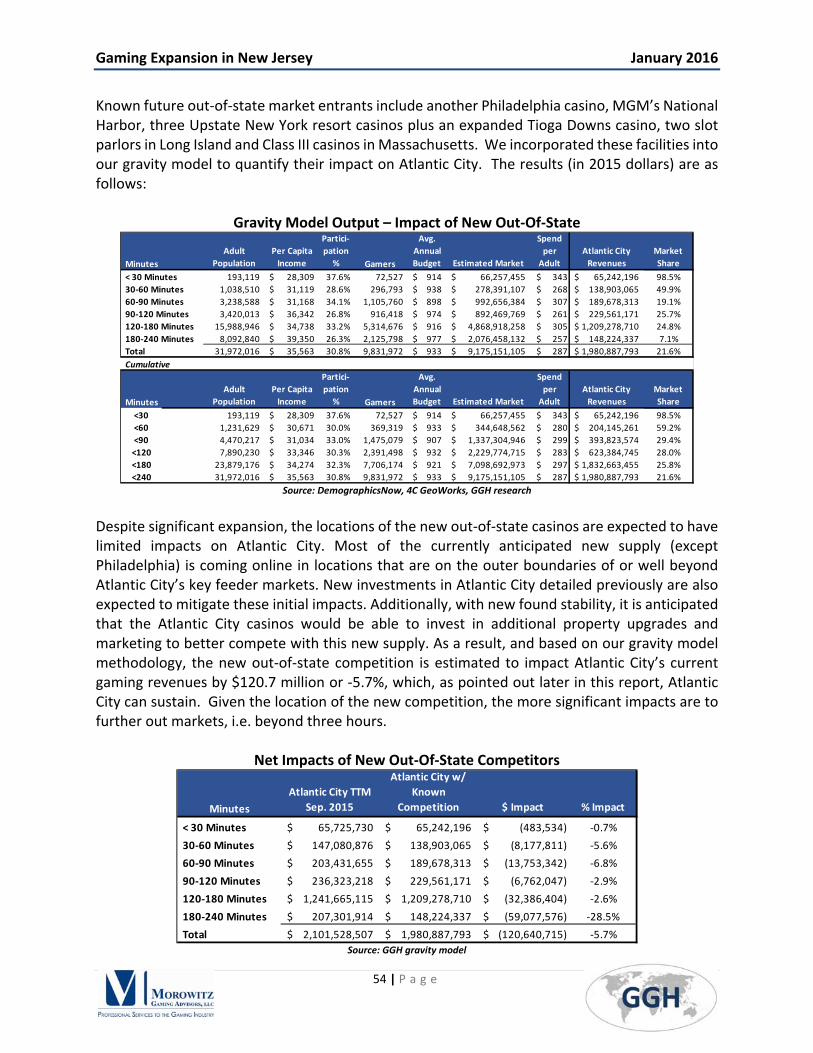
Gaming Expansion in New Jersey January 2016
54 | P a g e
Known future out‐of‐state market entrants include another Philadelphia casino, MGM’s National Harbor, three Upstate New York resort casinos plus an expanded Tioga Downs casino, two slot parlors in Long Island and Class III casinos in Massachusetts. We incorporated these facilities into our gravity model to quantify their impact on Atlantic City. The results (in 2015 dollars) are as follows:
Gravity Model Output – Impact of New Out‐Of‐State
Source: DemographicsNow, 4C GeoWorks, GGH research
Despite significant expansion, the locations of the new out‐of‐state casinos are expected to have limited impacts on Atlantic City. Most of the currently anticipated new supply (except Philadelphia) is coming online in locations that are on the outer boundaries of or well beyond Atlantic City’s key feeder markets. New investments in Atlantic City detailed previously are also expected to mitigate these initial impacts. Additionally, with new found stability, it is anticipated that the Atlantic City casinos would be able to invest in additional property upgrades and marketing to better compete with this new supply. As a result, and based on our gravity model methodology, the new out‐of‐state competition is estimated to impact Atlantic City’s current gaming revenues by $120.7 million or ‐5.7%, which, as pointed out later in this report, Atlantic City can sustain. Given the location of the new competition, the more significant impacts are to further out markets, i.e. beyond three hours.
Net Impacts of New Out‐Of‐State Competitors
Source: GGH gravity model
Minutes
Adult
Population
Per Capita
Income
Partici‐
pation
% Gamers
Avg.
Annual
Budget Estimated Market
Spend
per
Adult
Atlantic City
Revenues
Market
Share
< 30 Minutes 193,119 28,309$ 37.6% 72,527 914$ 66,257,455$ $ 343 65,242,196$ 98.5%
30‐60 Minutes 1,038,510 31,119$ 28.6% 296,793 938$ 278,391,107$ $ 268 138,903,065$ 49.9%
60‐90 Minutes 3,238,588 31,168$ 34.1% 1,105,760 898$ 992,656,384$ $ 307 189,678,313$ 19.1%
90‐120 Minutes 3,420,013 36,342$ 26.8% 916,418 974$ 892,469,769$ $ 261 229,561,171$ 25.7%
120‐180 Minutes 15,988,946 34,738$ 33.2% 5,314,676 916$ 4,868,918,258$ $ 305 1,209,278,710$ 24.8%
180‐240 Minutes 8,092,840 39,350$ 26.3% 2,125,798 977$ 2,076,458,132$ $ 257 148,224,337$ 7.1%
Total 31,972,016 35,563$ 30.8% 9,831,972 933$ 9,175,151,105$ $ 287 1,980,887,793$ 21.6%
Cumulative
Minutes
Adult
Population
Per Capita
Income
Partici‐
pation
% Gamers
Avg.
Annual
Budget Estimated Market
Spend
per
Adult
Atlantic City
Revenues
Market
Share
<30 193,119 28,309$ 37.6% 72,527 914$ 66,257,455$ $ 343 65,242,196$ 98.5%
<60 1,231,629 30,671$ 30.0% 369,319 933$ 344,648,562$ $ 280 204,145,261$ 59.2%
<90 4,470,217 31,034$ 33.0% 1,475,079 907$ 1,337,304,946$ $ 299 393,823,574$ 29.4%
<120 7,890,230 33,346$ 30.3% 2,391,498 932$ 2,229,774,715$ $ 283 623,384,745$ 28.0%
<180 23,879,176 34,274$ 32.3% 7,706,174 921$ 7,098,692,973$ $ 297 1,832,663,455$ 25.8%
<240 31,972,016 35,563$ 30.8% 9,831,972 933$ 9,175,151,105$ $ 287 1,980,887,793$ 21.6%
Minutes
Atlantic City TTM
Sep. 2015
Atlantic City w/
Known
Competition $ Impact % Impact
< 30 Minutes 65,725,730$ 65,242,196$ (483,534)$ ‐0.7%
30‐60 Minutes 147,080,876$ 138,903,065$ (8,177,811)$ ‐5.6%
60‐90 Minutes 203,431,655$ 189,678,313$ (13,753,342)$ ‐6.8%
90‐120 Minutes 236,323,218$ 229,561,171$ (6,762,047)$ ‐2.9%
120‐180 Minutes 1,241,665,115$ 1,209,278,710$ (32,386,404)$ ‐2.6%
180‐240 Minutes 207,301,914$ 148,224,337$ (59,077,576)$ ‐28.5%
Total 2,101,528,507$ 1,980,887,793$ (120,640,715)$ ‐5.7%

Gaming Expansion in New Jersey January 2016
55 | P a g e
Post Competition Stability
After these new casinos are absorbed, the northeast will be almost fully built out. Assuming no further expansion (in northern New Jersey or New York), Atlantic City will finally find stability. Based on current levels of revenue and profitability and expected trends, the industry should be able to remain at or close to current levels in terms of number of properties open, employment and viability. Further, these expected impacts in many respects might be offset by investment initiatives that have been made or are ongoing throughout Atlantic City. These include the convention center at Harrah’s, the entertainment assets at Borgata, the redevelopment of both the Golden Nugget and Resorts Casino Hotel, significant improvements to the Tropicana and the expected takeover of the Taj Mahal by new management. We have modeled the potential impact of the new market entrants in Philadelphia, Maryland, New York and Massachusetts on individual property and industry wide Atlantic City revenues, EBITDA, employment and taxes. We first analyze current profitability and key metrics including number of employees, salaries and wages and taxes for the most recent fiscal period (trailing 12 months September 2015). The industry realized over $400 million of EBITDA during this period and all casinos had positive EBITDA except the Taj Mahal. This is a key metric because EBITDA is normally used as a proxy for cash flow in the gaming industry and represents the amount that casinos have available to reinvest in their properties, service debt and pay a fair return to investors. With almost all properties showing positive cash flow, the industry is in position to absorb a potential reduction of revenue of less than 6%.
Atlantic City Gaming Industry – Key Financial Metrics September 2015
Source: NJDGE, GGH analysis
TTM 9/15
(in 000's except Employees) Bally's Borgata Caesars
Golden
Nugget Harrah's Resorts Tropicana Taj Mahal Total
Casino 212,484$ 713,750$ 322,213$ 211,864$ 377,092$ 155,562$ 298,316$ 182,785$ 2,474,066$
Non‐Gaming 92,987 308,011 115,110 66,031 199,158 45,936 101,330 70,824 999,387
Gross Revenue 305,471 1,021,761 437,323 277,895 576,250 201,498 399,646 253,609 3,473,453
Promo 77,837 231,401 117,416 70,559 149,289 50,961 83,064 79,705 860,232
Net Revenue 227,634$ 790,360$ 319,907$ 207,336$ 426,961$ 150,537$ 316,582$ 173,904$ 2,613,221$
EBITDA 13,326$ 194,319$ 56,300$ 18,449$ 82,413$ 9,703$ 35,442$ (5,407)$ 404,545$
% Margin 5.9% 24.6% 17.6% 8.9% 19.3% 6.4% 11.2% (3.1%) 15.5%
Gaming % of Gross Rev 69.6% 69.9% 73.7% 76.2% 65.4% 77.2% 74.6% 72.1% 71.2%
Occupancy 92.3% 88.2% 89.6% 82.6% 82.4% 81.2% 75.5% 62.2% 80.9%
ADR $94.65 $133.53 $98.23 $79.80 $101.79 $79.66 $92.97 $89.11 $102.37
# of Employees 2,993 5,786 2,698 2,081 3,663 1,881 2,857 2,472 24,431
Salaries & Wages 71,071$ 139,637$ 69,667$ 55,442$ 80,334$ 42,340$ 68,495$ 63,724$ 590,710$
Average Salary $0.00 $24.13 $25.82 $26.64 $21.93 $22.51 $23.97 $25.78 $24.18
Taxes
Gaming Taxes 15,506$ 50,356$ 23,768$ 14,200$ 27,894$ 11,202$ 19,591$ 12,804$ 175,322$
CRDA Fee 3,588 8,143 4,871 2,465 3,009 (348) (1,576) (762) 19,390
Property Taxes 8,370 30,969 20,925 4,687 31,806 4,018 22,766 27,621 151,162
ACA 2,768 7,762 4,038 1,953 4,395 1,654 3,035 2,709 28,314
Parking Fee 311 1,044 471 310 552 228 436 267 3,620
Room Fee 1,184 2,672 1,119 657 2,337 838 1,719 1,370 11,897
Total Taxes 31,727$ 100,947$ 55,192$ 24,273$ 69,994$ 17,591$ 45,972$ 44,009$ 389,705$ Notes:
(1) Excludes Caesars Interactive and Resorts Digital)
Gaming Expansion in New Jersey January 2016
56 | P a g e
As detailed previously in this report, we estimate a 5.7% reduction in net gaming revenue (exclusive of free play) when all new out‐of‐state competition comes online. We estimate the net impact of this decline on overall gaming industry profitability based on the following methodology.
Casino revenues are grossed up from the gravity model to account for free play based on historical percentages of free play to net revenue.
Non‐gaming revenues are estimated based on historical occupancy and ADR levels and historical relationships of food and beverage and other revenues to gaming and hotel revenues.
Promotional allowances are based on historical relationship as of September 30, 2015.
Operating expenses are estimated based on historical industry fixed and variable cost relationships and labor is estimated by department based on historical levels and estimates of fixed and variable labor.
Gaming taxes, CRDA fees, ACA, parking fees and room fees are estimated based on pro forma revenues and statutory rates.
Property taxes are estimated based on the proposed Pilot payment of $125 million annually.
We estimate that gross gaming revenues (including free play) will decline by 7.6% (a larger impact than on net gaming revenue) and net revenues will decline by 6.1% as hotel and other non‐gaming revenue become more important revenue streams. We further estimate that industry EBITDA will decline by approximately $65 million or 16%.

Gaming Expansion in New Jersey January 2016
57 | P a g e
Atlantic City Gaming Industry Pro Forma Financial Metrics after Absorbing Out-Of-State Competition
Source: GGH analysis38 Based on the analysis above, the industrywide impact on EBITDA will be approximately 30.2% of the net revenue impact. By applying this percentage to each casino’s trailing twelve month EBITDA as of September 30, 2015 we can estimate the potential resulting EBITDA at each casino.
38 Casino revenues are grossed up from gravity model for free play based on historical % of free play to net revenue. Non‐gaming revenues are estimated based on historical occupancy and ADR levels and historical relationships of food and beverage and other revenues to gaming and hotel revenues. Promotional allowances are based on historical relationship as of September 30, 2015. Operating expenses are estimated based on historical industry fixed and variable cost relationships and labor is estimated by department based on historical levels and estimates of fixed and variable labor. Gaming taxes, CRDA fees, ACA, parking fees and room fees are estimated based on pro forma revenues and statutory rates. Property taxes are estimated based on proposed Pilot payment.
BASELINE AFTER INDUSTRY IMPACT
(in 000's except Employees)
TTM 9/15
TOTAL
BASELINE
TOTAL
Industry Impact
$
Industry
Impact %
Casino 2,474,066$ 2,285,898$ (188,168)$ (7.6%)
Non‐Gaming 999,387 964,683 (34,704) (3.5%)
Gross Revenue 3,473,453 3,250,581 (222,872) (6.4%)
Promo 860,232 797,443 (62,789) (7.3%)
Net Revenue 2,613,221$ 2,453,138$ (160,083)$ (6.1%)
EBITDA 404,545$ 356,226$ (48,319)$ (11.9%)
% Margin 15.5% 14.5%
Gaming % of Gross Rev 71.2% 70.3% (0.9%) (1.3%)
Occupancy 80.9% 81.6% 0.7% 0.8%
ADR $102.37 $102.26 ($0.10) (0.1%)
# of Employees 24,431 23,029 (1,402) (5.7%)
Salaries & Wages 590,710$ 556,675$ (34,035)$ (5.8%)
Average Salary $24.18 $24.17
Taxes
Gaming Taxes 175,322$ 165,667$ (9,655)$ (5.5%)
CRDA Fee 19,390 28,574 9,184 47.4%
Property Taxes 151,162 124,979 (26,183) (17.3%)
Parking Fee 3,620 3,344 (275) (7.6%)
Room Fee 11,897 11,997 100 0.8%
Total Taxes 361,391$ 334,561$ (26,830)$ (7.4%)
Notes:
(1) Excludes Caesars Interactive and Resorts Digital)
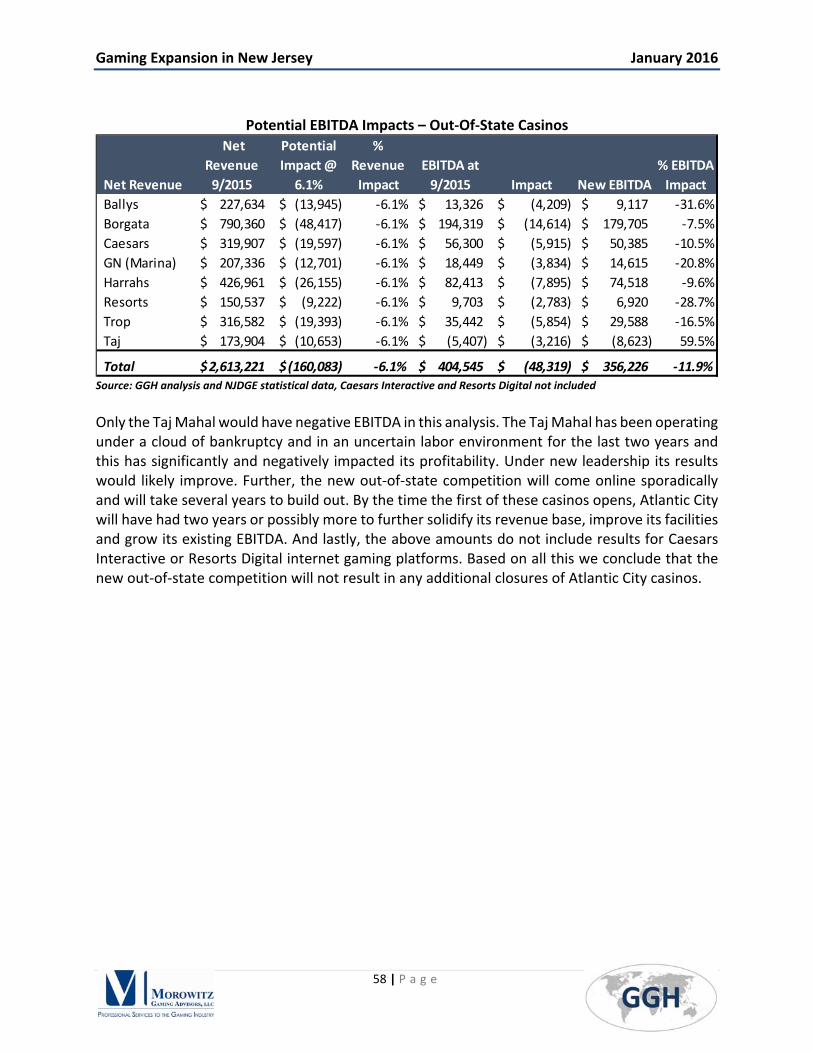
Gaming Expansion in New Jersey January 2016
58 | P a g e
Potential EBITDA Impacts – Out‐Of‐State Casinos
Source: GGH analysis and NJDGE statistical data, Caesars Interactive and Resorts Digital not included
Only the Taj Mahal would have negative EBITDA in this analysis. The Taj Mahal has been operating under a cloud of bankruptcy and in an uncertain labor environment for the last two years and this has significantly and negatively impacted its profitability. Under new leadership its results would likely improve. Further, the new out‐of‐state competition will come online sporadically and will take several years to build out. By the time the first of these casinos opens, Atlantic City will have had two years or possibly more to further solidify its revenue base, improve its facilities and grow its existing EBITDA. And lastly, the above amounts do not include results for Caesars Interactive or Resorts Digital internet gaming platforms. Based on all this we conclude that the new out‐of‐state competition will not result in any additional closures of Atlantic City casinos.
Net Revenue
Net
Revenue
9/2015
Potential
Impact @
6.1%
%
Revenue
Impact
EBITDA at
9/2015 Impact New EBITDA
% EBITDA
Impact
Ballys 227,634$ (13,945)$ ‐6.1% 13,326$ (4,209)$ 9,117$ ‐31.6%
Borgata 790,360$ (48,417)$ ‐6.1% 194,319$ (14,614)$ 179,705$ ‐7.5%
Caesars 319,907$ (19,597)$ ‐6.1% 56,300$ (5,915)$ 50,385$ ‐10.5%
GN (Marina) 207,336$ (12,701)$ ‐6.1% 18,449$ (3,834)$ 14,615$ ‐20.8%
Harrahs 426,961$ (26,155)$ ‐6.1% 82,413$ (7,895)$ 74,518$ ‐9.6%
Resorts 150,537$ (9,222)$ ‐6.1% 9,703$ (2,783)$ 6,920$ ‐28.7%
Trop 316,582$ (19,393)$ ‐6.1% 35,442$ (5,854)$ 29,588$ ‐16.5%
Taj 173,904$ (10,653)$ ‐6.1% (5,407)$ (3,216)$ (8,623)$ 59.5%
Total 2,613,221$ (160,083)$ ‐6.1% 404,545$ (48,319)$ 356,226$ ‐11.9%

Gaming Expansion in New Jersey January 2016
59 | P a g e
VI. NON‐GAMING AND CONVENTIONS As noted in the previous section and throughout this study, Atlantic City is in the middle of a repositioning of its assets and customer base. There is a symbiotic relationship between the number of visitors to Atlantic City and the non‐gaming amenities it offers. Indeed, the casino industry provides the lion’s share of the rooms, restaurants, nightlife and entertainment offerings that currently bring over 23 million visitors to the City annually. Given that visitors to Atlantic City will be siphoned off by North Jersey casinos, these non‐gaming amenities will suffer. This will undermine the current efforts of Atlantic City casino operators to improve profitability by offering more non‐gaming amenities. For example, Harrah’s added a major new convention facility and Resorts Casino Hotel repurposed dining assets into a convention facility focused on the small meetings market. As these initiatives take hold, the convention and meetings market will become more important to Atlantic City. With lower demand for gaming, Atlantic City can now allocate significantly more of its room inventory to the convention and meeting segment. However, if gaming is permitted in North Jersey, there will be closures of Atlantic City casinos, as shown elsewhere in this report, reducing the number of hotel rooms available for conventions. The following tables detail the convention facilities in and near Atlantic City. There are over 1.4 million square feet of meeting space in Atlantic City and approximately 88 square feet of meeting space per room.
Atlantic City Casino Based Meeting Space
Source: Atlantic City Convention Center and http://www.meetinac.com/meet/ac/atlantic‐city‐fact‐sheet
Gaming Properties# of Hotel
Rooms
Total
Meeting
Space
# of
Meeting
Rooms
# of
Committable
Hotel Rooms
Distance from
Convention
Center in Blocks /
Minutes
Bal ly's Atlantic Ci ty 1,245 Grand Bal l room 14,432 80,000 33 800 3 Blocks
Borgata Hotel Cas ino & Spa 2,800 Events Center 30,000 70,000 24 1,000 4 Minutes
The Water Club, Borgata 800 Tides 3,000 18,000 14 200 4 Minutes
Caesar's Atlantic City 1,144 Pal ladium 17,135 28,000 12 400 3 Blocks
Harrah's Atlantic City 2,590Wildwoon & Avalon
Bal l rooms98,894 248,894 36 1,000 4 Minutes
Golden Nugget Atlantic City 724 Grand Bal l room 16,920 42,700 20 400 4 Minutes
Resorts Atlantic City 942 Bal l room 13,000 64,000 13 350 8 Blocks
Tropicana Hotel and Cas ino 2,078Grand Exhibition
Center20,000 122,000 50 1,000 9 Blocks
Trump Taj Mahal Resort 2,010 Mark G. Etess Arena 63,000 155,000 22 700 9 Blocks
TOTALS 14,333 276,381 828,594 224 5,850
Largest Meeting Space (gsf)

Gaming Expansion in New Jersey January 2016
60 | P a g e
Atlantic City Non‐Casino Based Meeting Space
Source: Atlantic City Convention Center and http://www.meetinac.com/meet/ac/atlantic‐city‐fact‐sheet
The following table depicts convention and trade show data for shows and meetings at the Atlantic City Convention Center and individual hotels in Atlantic City. The data indicates that delegate spending at the convention center is up considerably from 2012 but is somewhat flat from 2013 through 2015. Interestingly, delegate spending at individual properties is flat compared to 2012, but up significantly from both 2013 and 2014. It appears that the remaining casinos and other hotels in Atlantic City have embraced the meeting and convention business as the gaming industry has declined. Overall delegate spending was $179.2 million in the twelve months ending August 2015, up from $156.9 million in calendar year 2014 and $140.6 million in 2012, an increase of 14.2% from 2014 and 28% from 2012. Clearly, the convention and meetings market is expanding.
Non‐Gaming Properties# of Hotel
Rooms
Total
Meeting
Space
# of
Meeting
Rooms
# of
Committable
Hotel Rooms
Distance from
Convention
Center in Blocks /
Minutes
Atlantic City Convention Center1 0 Hal l A 29,400 486,600 45 0 0
Boardwalk Hal l Arena 0 Arena 22,355 22,355 1 0 4
Boardwalk Hal l2 0
Adrian Phi l l ips
Bal l room23,100 28,134 7 0 4 Blocks
The Claridge Hotel 500 Southampton 2,004 9,000 1 400 4 Blocks
Sheraton Atlantic City 502 Crown Bal l room 11,700 27,000 23 425 Connected
Stockton Seaview Resort 296 Pres identia l Bal l room 6,644 39,500 26 270 13 Minutes
Courtyard by Marriott 206 Executive Boardroom 433 1,200 2 100 9 Blocks
Red Roof Inn & Suites AC 200 The Atlantic Room 600 600 1 25 4 Miles
The Chelsea 337 Crysta l Bal l room 4,400 5,600 4 200 9 Blocks
TOTALS 2,041 100,636 619,989 110 1,420
GRAND TOTALS 16,374 377,017 1,448,583 334 7,270
Largest Meeting Space (gsf)
1 does not include exhibi t space2 does not include arena

Gaming Expansion in New Jersey January 2016
61 | P a g e
Atlantic City Convention Trends
Source: Casino Reinvestment Development Authority (convention and visitor data in monthly Atlantic City, NJ Tourism Barometers)
Hotel rooms are a key element in terms of the ability of Atlantic City to successfully grow its convention business. The following table compares convention statistics for major cities which Atlantic City competes with. Atlantic City has underperformed in terms of the number of meetings and number of delegates, in part because of its low room count.
Northeast and Mid‐Atlantic Convention Benchmarks
Source: CVENT Supplier Network, Las Vegas Convention and Visitors Authority (LCCVA), Clark County, NV, NYCGO Annual Report, www.discoverphl.com/facts‐and‐research/annual‐report/, Washington.org, massconvention.com/about‐us/about‐us, Visit Baltimore Annual Reports. Atlantic City rooms includes both convention rooms listed above and additional rooms in the area.
2012 2013 2014 TTM 8/2015 YTD 2015 YTD 2014
Convention Sales Activities
Conventions/Tradeshows/Meeting ‐ Atlantic City Convention Center
No. of Shows 91 81 83 82 41 349
No. of Room Nights 64,072 75,364 92,431 94,729 45,640 43,342
No. of Delegates 166,318 216,037 227,539 236,731 135,356 126,164
Delegate Spending 84,778,134$ 110,087,397$ 117,841,846$ 118,076,653$ 58,687,625$ 58,452,818$
Public Shows ‐ Atlantic City Convention Center
No. of Shows 9 10 9 11 7 33
No. of Room Nights 6,916 2,992 3,165 18,134 17,730 2,761
No. of Delegates 99,942 107,344 105,321 123,324 116,179 98,176
Delegate Spending 10,707,871$ 11,902,278$ 11,493,113$ 13,428,436$ 12,489,242$ 10,553,919$
Total Convention Center Bookings
No. of Shows 100 91 92 93 48 382
No. of Room Nights 70,988 78,356 95,596 112,863 63,370 46,103
No. of Delegates 266,260 323,381 332,860 360,055 251,535 224,340
Delegate Spending 95,486,005$ 121,989,675$ 129,334,959$ 131,505,089$ 71,176,867$ 69,006,737$
Hotel ‐ Individual Properties
No. of Shows 88 74 82 125 88 285
No. of Room Nights 40,656 37,783 38,946 58,035 40,748 21,659
No. of Delegates 166,056 34,583 48,929 113,465 96,509 31,973
Delegate Spending 45,069,488$ 24,374,863$ 27,519,931$ 47,696,488$ 35,701,256$ 15,524,699$
Monthly Totals
No. of Shows 188 165 174 218 136 667
No. of Room Nights 111,644 116,139 134,542 170,898 104,118 67,762
No. of Delegates 432,316 357,964 381,789 473,520 348,044 256,313
Delegate Spending 140,555,493$ 146,364,538$ 156,854,890$ 179,201,577$ 106,878,123$ 84,531,436$
City Convention SF Rooms
Convention
Delegates
# of Conventions/
Meetings
Convention SF Per
Room
Delegates Per
Room
New York 2,100,000 102,000 6,100,000 643 21 60
Boston 2,100,000 20,301 724,292 262 103 36
Atlantic City 1,449,000 16,374 473,520 218 88 29
Baltimore 1,225,000 10,972 503,686 400 112 46
Philadelphia, PA 804,120 16,490 400,000 520 49 24
Washington DC 703,000 29,079 1,000,000 808 24 34
AC Rank (out of 6) 3 5 5 6 4 5

Gaming Expansion in New Jersey January 2016
62 | P a g e
In order to better understand the relationship between rooms and convention delegates we performed several regression analyses. The following charts include an analysis of several national convention cities including Atlantic City, an analysis of the larger northeast and Mid‐Atlantic convention cities and an additional analysis of the northeast and Mid‐Atlantic Cities with New York excluded. The first regression analysis is for several major convention cities across the U.S. including Las Vegas and Reno, Nevada. This analysis shows an upward sloping line and a correlation coefficient of 57.4% indicating that over 57% of the change in convention delegates across these cities can be explained by the number of hotel rooms.
Source: GGH analysis, see prior table.
The next regression analysis is for the Northeast and Mid‐Atlantic convention cities. This analysis indicates that almost 98% of the change in convention delegates across cities can be explained by the number of rooms. This intuitively makes sense because New York has so many more rooms than the other cities in the sample. As noted later in this report, the likely closure of Atlantic City casinos will further reduce hotel room inventory, driving down the opportunities for convention business.
y = 29.873x + 59797R² = 0.574
‐
1,000,000
2,000,000
3,000,000
4,000,000
5,000,000
6,000,000
7,000,000
‐ 20,000 40,000 60,000 80,000 100,000 120,000 140,000 160,000
Annual Convnetion Delegates
Hotel Rooms
Regression Analysis of Hotel Rooms to Convention Delegates Major Convention Cities

Gaming Expansion in New Jersey January 2016
63 | P a g e
Source: Source: GGH analysis, see prior table.
Since New York is an outlier compared to other cities in the region, we remove it from our final regression analysis. This analysis indicates a 43.7% correlation and suggests that while rooms are still important, other factors contribute to the level of convention delegates as well.
Source: GGH analysis, see prior table.
In addition to these quantitative analyses, we interviewed officials from Meet AC, the entity responsible for marketing the City’s convention industry. Those officials indicated the importance of the casino room inventory to Atlantic City and confirmed the current strength of the City’s convention business. The City’s convention business is expected to generate over $240 million of meetings and related business in Atlantic City in the future and approximately 50% of that is at risk if several more casinos close and/or if the proposed casinos in northern New Jersey open with significant convention facilities.39
39 Interview with President of Meet AC, January 2016.
y = 65.58x ‐ 694311R² = 0.9796
‐
1,000,000
2,000,000
3,000,000
4,000,000
5,000,000
6,000,000
7,000,000
‐ 20,000 40,000 60,000 80,000 100,000 120,000
Annual Convnetion Delegates
Hotel Rooms
Regression Analysis of Hotel Rooms to Convention Delegates ‐Major Northeast and Mid‐Atlantic Convention Cities
y = 22.796x + 156031R² = 0.4367
‐
200,000
400,000
600,000
800,000
1,000,000
1,200,000
‐ 5,000 10,000 15,000 20,000 25,000 30,000 35,000Annual Convnetion Delegates
Hotel Rooms
Regression Analysis of Hotel Rooms to Convention Delegates ‐Major Northeast and Mid‐Atlantic Convention Cities
(Excluding NYC)

Gaming Expansion in New Jersey January 2016
64 | P a g e
These analyses make it clear that there is an important relationship between the number of rooms in a city and the number of annual convention delegates. Atlantic City’s ability to compete within its region for convention business and to successfully diversify its offering will require that the city at the very least maintain its current room base, if not add additional rooms. Atlantic City cannot afford the closure of additional casinos which is likely to occur if casinos are legalized in North Jersey. It is also extremely unlikely that closed casinos could be converted to hotel use. All of the casino hotels were designed as casino operations and the physical plant and fixed operating costs of these facilities require the operation and revenues of a casino to make them viable.
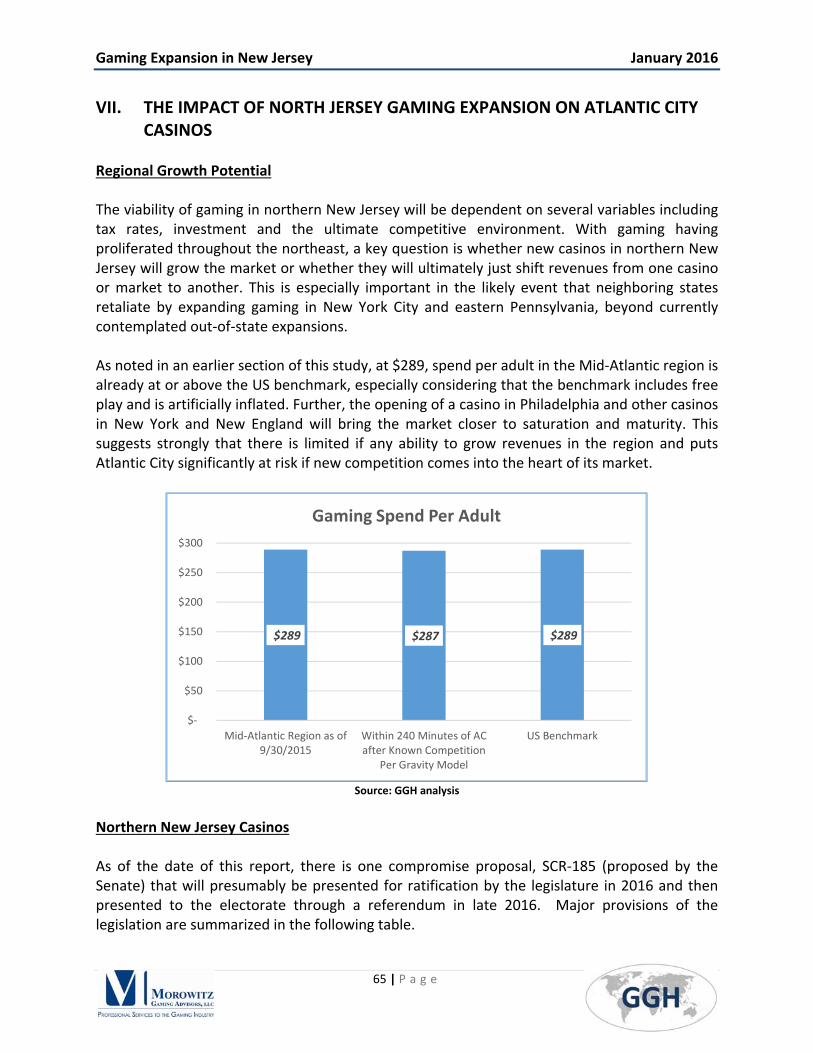
Gaming Expansion in New Jersey January 2016
65 | P a g e
VII. THE IMPACT OF NORTH JERSEY GAMING EXPANSION ON ATLANTIC CITY CASINOS
Regional Growth Potential The viability of gaming in northern New Jersey will be dependent on several variables including tax rates, investment and the ultimate competitive environment. With gaming having proliferated throughout the northeast, a key question is whether new casinos in northern New Jersey will grow the market or whether they will ultimately just shift revenues from one casino or market to another. This is especially important in the likely event that neighboring states retaliate by expanding gaming in New York City and eastern Pennsylvania, beyond currently contemplated out‐of‐state expansions. As noted in an earlier section of this study, at $289, spend per adult in the Mid‐Atlantic region is already at or above the US benchmark, especially considering that the benchmark includes free play and is artificially inflated. Further, the opening of a casino in Philadelphia and other casinos in New York and New England will bring the market closer to saturation and maturity. This suggests strongly that there is limited if any ability to grow revenues in the region and puts Atlantic City significantly at risk if new competition comes into the heart of its market.
Source: GGH analysis
Northern New Jersey Casinos As of the date of this report, there is one compromise proposal, SCR‐185 (proposed by the Senate) that will presumably be presented for ratification by the legislature in 2016 and then presented to the electorate through a referendum in late 2016. Major provisions of the legislation are summarized in the following table.
$289 $287 $289
$‐
$50
$100
$150
$200
$250
$300
Mid‐Atlantic Region as of9/30/2015
Within 240 Minutes of ACafter Known Competition
Per Gravity Model
US Benchmark
Gaming Spend Per Adult

Gaming Expansion in New Jersey January 2016
66 | P a g e
Comparison of Proposed North Jersey Gaming Expansion Legislation SCR (Senate Proposal)‐18540
Number of Casinos 2
Minimum Distance from Atlantic City
72 Miles
Application of State Revenues
Establishes NJ Investment Fund which will allocate certain tax receipts to Atlantic City and other New Jersey programs
Minimum Investment $1 billion for each casino
Eligibility License eligibility for both casinos requires majority ownership by current holders of New Jersey casino license
Source: NJ Legislature website (see footnotes)
The final form of casino development will depend on legislative constraints including investment and tax rates. Market conditions will play a role as well. Lower tax rates allow for higher investment while higher tax rates could yield more to the state but restrict the level of investment. While this analysis assumes that two large casinos (5,000 gaming positions) will be developed in northern New Jersey, with tax rates similar to those proposed for resort casinos in New York and Massachusetts, any addition of casinos in North Jersey is likely to have large effects on Atlantic City, regardless of changes in the assumptions noted above. With a minimum investment of $1 billion, the casinos could also include significant non‐gaming amenities such as hotels, retail, dining and entertainment. We assume these casinos will be located (1) in Bergen County and (2) in Hudson County. Regardless of specific location, casinos anywhere in northern New Jersey will have a significant impact on Atlantic City due to the concentration of gamers located within the northern New Jersey market, their proximity to the proposed new casinos and their current importance to Atlantic City.
40 http://www.njleg.state.nj.us/2014/Bills/SCR/185_I1.HTM
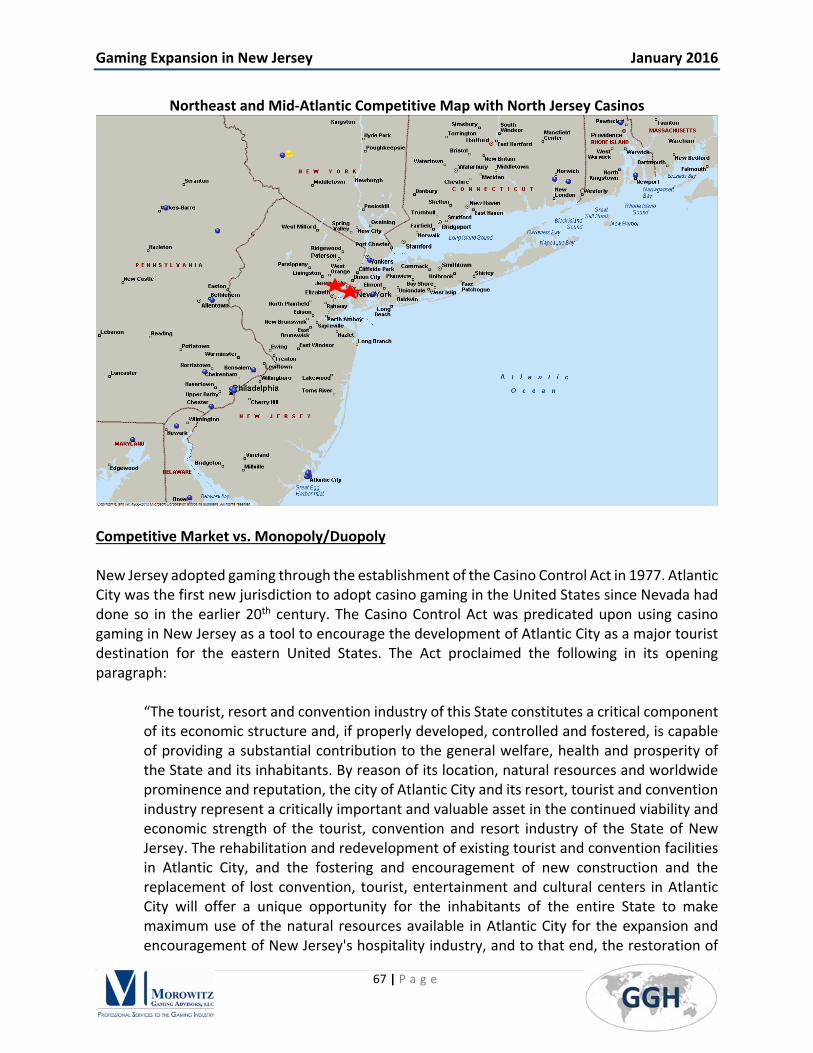
Gaming Expansion in New Jersey January 2016
67 | P a g e
Northeast and Mid‐Atlantic Competitive Map with North Jersey Casinos
Competitive Market vs. Monopoly/Duopoly New Jersey adopted gaming through the establishment of the Casino Control Act in 1977. Atlantic City was the first new jurisdiction to adopt casino gaming in the United States since Nevada had done so in the earlier 20th century. The Casino Control Act was predicated upon using casino gaming in New Jersey as a tool to encourage the development of Atlantic City as a major tourist destination for the eastern United States. The Act proclaimed the following in its opening paragraph:
“The tourist, resort and convention industry of this State constitutes a critical component of its economic structure and, if properly developed, controlled and fostered, is capable of providing a substantial contribution to the general welfare, health and prosperity of the State and its inhabitants. By reason of its location, natural resources and worldwide prominence and reputation, the city of Atlantic City and its resort, tourist and convention industry represent a critically important and valuable asset in the continued viability and economic strength of the tourist, convention and resort industry of the State of New Jersey. The rehabilitation and redevelopment of existing tourist and convention facilities in Atlantic City, and the fostering and encouragement of new construction and the replacement of lost convention, tourist, entertainment and cultural centers in Atlantic City will offer a unique opportunity for the inhabitants of the entire State to make maximum use of the natural resources available in Atlantic City for the expansion and encouragement of New Jersey's hospitality industry, and to that end, the restoration of
Gaming Expansion in New Jersey January 2016
68 | P a g e
Atlantic City as the Playground of the World and the major hospitality center of the Eastern United States.”41
At the time of the adoption of this legislation, the casino industry was limited only to Nevada and the general conception of gaming was to contain it in an area that was far from major population centers. Atlantic City, a shore town in southern New Jersey fit the bill. While close enough to significant populations in the eastern United States, it was located in a sparsely populated part of the state. Atlantic City is an anomaly among gaming markets. Nevada (principally Las Vegas and Reno) and New Jersey were the first two major gaming jurisdictions in the United States. Both of these states developed their gaming industries predicated on a few guiding principles which included a suitability requirement for licensed operators, low gaming tax rates (which encouraged capital investment), and unlimited licenses i.e. there were no artificial limits put on the number of casinos that could operate. Rather, the market would determine the number of casinos that could operate in a given jurisdiction. This model served New Jersey well with over $10 billion of gross capital invested to date.42 By contrast, total investment in the twelve licensed Pennsylvania casinos (the nation’s second largest gaming jurisdiction in terms of revenue) are estimated by GGH at less than $5 billion. Pennsylvania limits the number and location of its gaming licenses, thereby allowing each casino to dominate the locals market in which it operates. Pennsylvania, whose first casino opened in 2006, followed the trend of almost all other new gaming jurisdictions whereby a limited number of licenses have been conveyed to a select few operators in exchange for high upfront license fees and / or tax rates. This trend has turned the industry on its head. Instead of fostering an industry to grow through investment and innovation, the granting of quasi government sanctioned monopolies puts shackles on casinos through higher tax rates and in many cases, onerous regulation. This essentially limits these casinos to local or regional properties serving nearby populations, and with little in the way of amenities. This has also created a symbiotic relationship between States and Casinos whereby growth and investment in terms of new participants is sacrificed in exchange for outsized tax payments. This trend has been one of the major reasons for Atlantic City’s decline. Investment in the casino industry in Atlantic City was made under a guiding premise. With several competitors, success would require significant investment, disciplined operations and the ability to provide a casino resort experience. The prospect of a duopoly in the heart of Atlantic City’s feeder market turns this premise on its head. The casinos industry in Atlantic City, already competitive within the city, would now have to compete with two state sanctioned monopolies, strategically located to siphon off a significant percentage of its customers.
41 chapter 12 of title 5 of the new jersey statutes, n.j.s.a. 5:12-1 42 Based on analysis of historical balance sheets of Atlantic City casinos on NJDGE website
Gaming Expansion in New Jersey January 2016
69 | P a g e
Iterative Approach and the Importance of Critical Mass As noted later in this study, expansion of gaming to northern New Jersey will not occur in a vacuum. New casinos in northern New Jersey will very likely bring additional gaming expansion to neighboring states. In this section we quantify the impacts of gaming expansion in northern New Jersey on the casino industry in Atlantic City by means of an iterative approach.
We begin with our baseline model, derived previously, of where we expect Atlantic City to be in terms of gaming revenue and industry profitability after absorbing new out‐of‐state competition.
We then layer on the impacts of two new casinos in northern New Jersey using a gravity modeling approach.
Declines in gaming revenues in Atlantic City are then studied to determine if there would be a resulting decrease in supply (possible closure of casinos)
As supply is taken out of the market, the gravity model is run again to determine the further impacts on Atlantic City
Further analysis is done to determine the overall industry impacts in Atlantic City including the impacts on non‐gaming revenues and expenses
The scenario in a previous section presents the baseline for quantifying the additional impact of potential casinos in North Jersey. As noted above, to estimate that impact we assume, based on the most recent version of the proposed gaming expansion legislation, press reports and our general knowledge of the industry, that two casinos will be developed in North Jersey; one in Bergen County and a second in Hudson County (Jersey City). For modeling purposes we also assume that each of these casinos would have 4,000 slot machines and 167 table games (5,000 gaming positions). The following model output presents our initial iteration of the impact of North Jersey casinos. Here we quantify the impact on Atlantic City assuming that the resort maintains its current levels of gaming capacity and hotel room inventory, i.e. none of the existing casinos are forced to close as a result of the two new casinos. In this scenario, Atlantic City gaming revenues (net of free play) would decline to $1.38 billion from the estimated level of $1.98 billion after new competitors open in Philadelphia, Maryland, New York and Massachusetts.

Gaming Expansion in New Jersey January 2016
70 | P a g e
Gravity Model Output – Impact of North Jersey Casinos
Source: DemographicsNow, 4C GeoWorks, GGH research
Under this scenario we estimate an initial impact of $599.3 million or ‐30.3% of baseline gaming revenues. As indicated in the table below, over 80% of the impacts will occur in the 120 to 180 minute drive time bands where Atlantic City is most vulnerable i.e. those closest to the large populations of the New York metro area that would be intercepted by the north Jersey casinos.
Impact of North Jersey Casinos (3 Casino Closures) by Drive Time Band
Source: DemographicsNow, 4C GeoWorks, GGH research
We estimate the flow through impact on individual property performance and the total industry through a similar methodology as was used to estimate the impact on casino operations of the present out‐of‐state expansion of gaming. Our analysis assumes that if gaming were to come to northern New Jersey, Atlantic City casinos would hunker down, invest limited if any capital in their properties (due to expected negative returns) and enact significant cost cutting through labor and other expense reductions. The following table summarizes our analysis of the impacts on the existing casinos assuming no casino closures.
Minutes
Adult
Population
Per Capita
Income
Partici‐
pation
% Gamers
Avg.
Annual
Budget Estimated Market
Spend
per
Adult
Atlantic City
Revenues
Market
Share
< 30 Minutes 193,119 28,309$ 37.6% 72,527 914$ 66,257,455$ $ 343 65,144,775$ 98.3%
30‐60 Minutes 1,038,510 31,119$ 28.6% 296,793 938$ 278,391,107$ $ 268 134,638,592$ 48.4%
60‐90 Minutes 3,238,588 31,168$ 34.3% 1,111,921 898$ 998,876,049$ $ 308 176,304,673$ 17.7%
90‐120 Minutes 3,420,013 36,342$ 31.5% 1,076,708 964$ 1,038,159,888$ $ 304 166,543,276$ 16.0%
120‐180 Minutes 15,988,946 34,738$ 34.9% 5,582,715 918$ 5,125,466,136$ $ 321 702,152,751$ 13.7%
180‐240 Minutes 8,092,840 39,350$ 26.3% 2,125,798 977$ 2,076,458,132$ $ 257 136,762,005$ 6.6%
Total 31,972,016 35,563$ 32.1% 10,266,461 933$ 9,583,608,768$ $ 300 1,381,546,071$ 14.4%
Cumulative
Minutes
Adult
Population
Per Capita
Income
Partici‐
pation
% Gamers
Avg.
Annual
Budget Estimated Market
Spend
per
Adult
Atlantic City
Revenues
Market
Share
<30 193,119 28,309$ 37.6% 72,527 914$ 66,257,455$ $ 343 65,144,775$ 98.3%
<60 1,231,629 30,671$ 30.0% 369,319 933$ 344,648,562$ $ 280 199,783,367$ 58.0%
<90 4,470,217 31,034$ 33.1% 1,481,241 907$ 1,343,524,611$ $ 301 376,088,040$ 28.0%
<120 7,890,230 33,346$ 32.4% 2,557,949 931$ 2,381,684,499$ $ 302 542,631,316$ 22.8%
<180 23,879,176 34,274$ 34.1% 8,140,663 922$ 7,507,150,635$ $ 314 1,244,784,067$ 16.6%
<240 31,972,016 35,563$ 32.1% 10,266,461 933$ 9,583,608,768$ $ 300 1,381,546,071$ 14.4%
Minutes
Baseline Before
North Jersey
No A.C. Casino
Closures $ Impact % Impact
< 30 Minutes 65,242,196$ 65,144,775$ (97,421)$ ‐0.1%
30‐60 Minutes 138,903,065$ 134,638,592$ (4,264,473)$ ‐3.1%
60‐90 Minutes 189,678,313$ 176,304,673$ (13,373,640)$ ‐7.1%
90‐120 Minutes 229,561,171$ 166,543,276$ (63,017,895)$ ‐27.5%
120‐180 Minutes 1,209,278,710$ 702,152,751$ (507,125,960)$ ‐41.9%
180‐240 Minutes 148,224,337$ 136,762,005$ (11,462,333)$ ‐7.7%
Total 1,980,887,793$ 1,381,546,071$ (599,341,722)$ ‐30.3%

Gaming Expansion in New Jersey January 2016
71 | P a g e
Atlantic City Gaming Industry –
Pro Forma Financial Metrics after Absorbing North Jersey Competition No Casino Closures
Source: GGH analysis 43
Based on our analysis we estimate that gaming revenue as a percentage of gross revenue will continue to decline and total industry gross and net revenues will decline by 26.6% and 25.5% respectively. We also estimate that industry EBITDA will decline to $161.1 million (similar to the results of 2013 and 2014 when the industry experienced its last trough). Based on the above analysis, if all casinos in Atlantic City stayed open the average EBITDA per casino would decline to $20.1 million. However, historically, the Borgata has realized a large and increasing share of EBITDA. From 2008 through 2015 its share of EBITDA has risen from 24.5% of EBITDA to 48% and during 2013 and 2014 its share was much higher. This indicates that profitability in terms of EBITDA is highly concentrated in Atlantic City.
43 Casino revenues are grossed up from gravity model for free play based on historical % of free play to net revenue. Non‐gaming revenues are estimated for each casino based on historical occupancy and ADR levels and historical relationships of food and beverage and other revenues to gaming and hotel revenues. Promotional allowances are based on historical relationship as of September 30, 2015. Operating expenses are estimated based on historical fixed and variable cost relationships and labor is estimated by department based on historical levels and estimates of fixed and variable labor. Gaming taxes, CRDA fees, ACA, parking fees and room fees are estimated based on pro forma revenues and statutory rates. Property taxes are estimated based on proposed Pilot payment.
NORTH JERSEY IMPACT: NO CLOSURES
(in 000's except Employees)
BASELINE
TOTAL
NO CLOSURES
Total
Industry Impact
$
Industry
Impact %
Casino 2,285,898$ 1,594,254$ (691,644)$ (30.3%)
Non‐Gaming 964,683 790,253 (174,430) (18.1%)
Gross Revenue 3,250,581 2,384,507 (866,075) (26.6%)
Promo 797,443 556,161 (241,282) (30.3%)
Net Revenue 2,453,138$ 1,828,346$ (624,792)$ (25.5%)
EBITDA 356,226$ 161,108$ (195,118)$ (54.8%)
% Margin 14.5% 8.8%
Gaming % of Gross Rev 70.3% 66.9% (3.5%) (4.9%)
Occupancy 81.6% 80.3% (1.3%) (1.6%)
ADR $102.26 $96.95 ($5.31) (5.2%)
# of Employees 23,029 16,318 (6,711) (29.1%)
Salaries & Wages 556,675$ 394,907$ (161,769)$ (29.1%)
Average Salary $24.17 $24.20
Taxes
Gaming Taxes 165,667$ 117,720$ (47,947)$ (28.9%)
CRDA Fee 28,574 19,928 (8,646) (30.3%)
Property Taxes 124,979 90,000 (34,979) (28.0%)
Parking Fee 3,344 2,332 (1,012) (30.3%)
Room Fee 11,997 11,809 (188) (1.6%)
Total Taxes 334,561$ 241,789$ (92,772)$ (27.7%)
Notes:(1) Excludes Caesars Interactive and Resorts Digital)
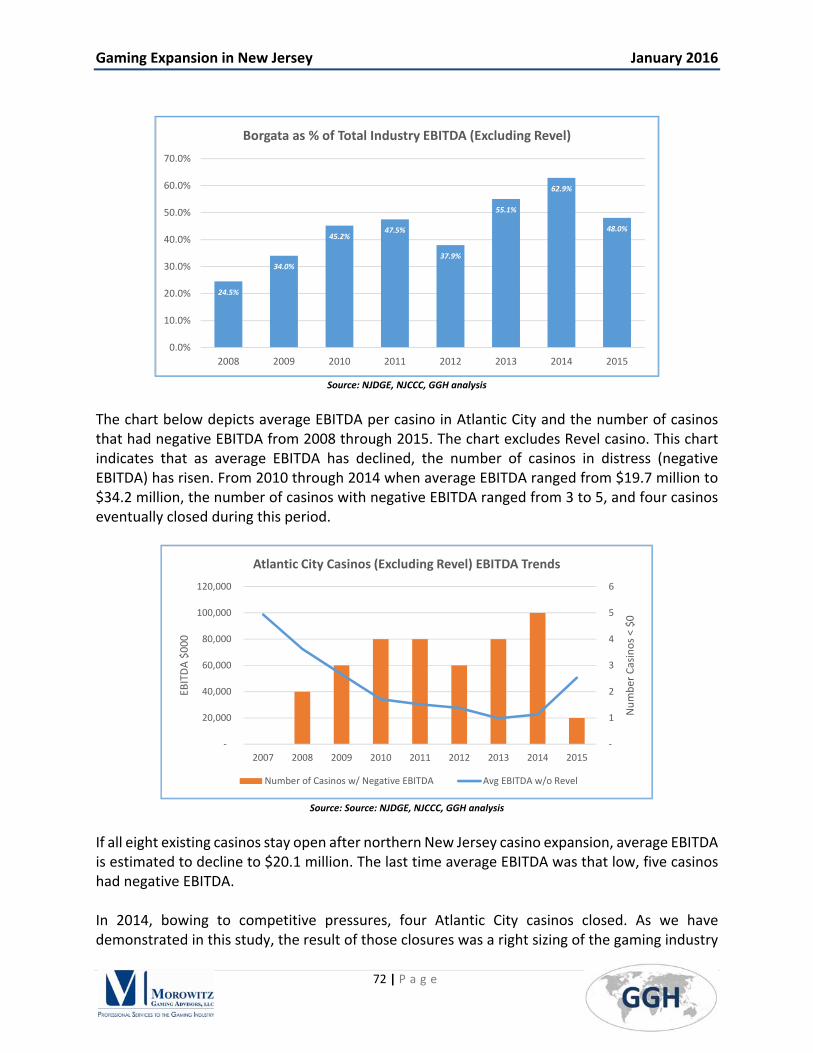
Gaming Expansion in New Jersey January 2016
72 | P a g e
Source: NJDGE, NJCCC, GGH analysis
The chart below depicts average EBITDA per casino in Atlantic City and the number of casinos that had negative EBITDA from 2008 through 2015. The chart excludes Revel casino. This chart indicates that as average EBITDA has declined, the number of casinos in distress (negative EBITDA) has risen. From 2010 through 2014 when average EBITDA ranged from $19.7 million to $34.2 million, the number of casinos with negative EBITDA ranged from 3 to 5, and four casinos eventually closed during this period.
Source: Source: NJDGE, NJCCC, GGH analysis
If all eight existing casinos stay open after northern New Jersey casino expansion, average EBITDA is estimated to decline to $20.1 million. The last time average EBITDA was that low, five casinos had negative EBITDA. In 2014, bowing to competitive pressures, four Atlantic City casinos closed. As we have demonstrated in this study, the result of those closures was a right sizing of the gaming industry
24.5%
34.0%
45.2%47.5%
37.9%
55.1%
62.9%
48.0%
0.0%
10.0%
20.0%
30.0%
40.0%
50.0%
60.0%
70.0%
2008 2009 2010 2011 2012 2013 2014 2015
Borgata as % of Total Industry EBITDA (Excluding Revel)
‐
1
2
3
4
5
6
‐
20,000
40,000
60,000
80,000
100,000
120,000
2007 2008 2009 2010 2011 2012 2013 2014 2015
Number Casinos < $0
EBITDA $000
Atlantic City Casinos (Excluding Revel) EBITDA Trends
Number of Casinos w/ Negative EBITDA Avg EBITDA w/o Revel

Gaming Expansion in New Jersey January 2016
73 | P a g e
and with that, stabilization of the industry’s financial condition. Considering this history and the expected impacts of competition from northern New Jersey casinos, it is reasonable to assume that additional casinos would close if the industry’s revenues declined as expected. As part of this iterative process we re‐calibrate our gravity model assuming three of the unprofitable casinos were to close. For modeling purposes (removing gaming capacity and rooms from the model) we assume 8,163 gaming positions and 4,121 hotel rooms would be removed from Atlantic City’s capacity. This has a significant impact on gaming revenues because it reduces the critical mass of assets that Atlantic City relies upon to drive revenues from further distances than other convenience oriented competitors. Removing these assets result in additional revenue declines above those initially depicted, resulting in an additional 17% decline from our estimated baseline gaming revenues and leaving industry gaming revenues (net of free play) at $1.04 billion.
Gravity Model Output – Impact of North Jersey Casinos (3 Casino Closures)
Source: DemographicsNow, 4C GeoWorks, GGH research
This puts the estimated impact of North Jersey casinos at a 47.3% decline from our baseline gaming revenues. As indicated in the table below and similar to the previous analysis, almost all the impacts will occur in the 90 to 180 minute drive time bands i.e. those closest to the large populations of the New York metro area and eastern Pennsylvania. The impacts expand in the 90‐120 minute band because fewer casinos in Atlantic City make the industry more vulnerable to casinos that serve that geographic market, including in Pennsylvania.
Impact of North Jersey Casinos (3 Casino Closures) by Drive Time Band
Source: DemographicsNow, 4C GeoWorks, GGH research
Minutes
Adult
Population
Per Capita
Income
Partici‐
pation
% Gamers
Avg.
Annual
Budget Estimated Market
Spend
per
Adult
Atlantic City
Revenues
Market
Share
< 30 Minutes 193,119 28,309$ 37.6% 72,527 914$ 66,257,455$ $ 343 64,633,947$ 97.5%
30‐60 Minutes 1,038,510 31,119$ 28.6% 296,793 938$ 278,391,107$ $ 268 117,378,948$ 42.2%
60‐90 Minutes 3,238,588 31,168$ 34.3% 1,111,921 898$ 998,876,049$ $ 308 134,897,147$ 13.5%
90‐120 Minutes 3,420,013 36,342$ 31.5% 1,076,708 964$ 1,038,159,888$ $ 304 119,933,878$ 11.6%
120‐180 Minutes 15,988,946 34,738$ 34.9% 5,582,715 918$ 5,125,466,136$ $ 321 510,638,670$ 10.0%
180‐240 Minutes 8,092,840 39,350$ 26.3% 2,125,798 977$ 2,076,458,132$ $ 257 96,823,149$ 4.7%
Total 31,972,016 35,563$ 32.1% 10,266,461 933$ 9,583,608,768$ $ 300 1,044,305,740$ 10.9%
Cumulative
Minutes
Adult
Population
Per Capita
Income
Partici‐
pation
% Gamers
Avg.
Annual
Budget Estimated Market
Spend
per
Adult
Atlantic City
Revenues
Market
Share
<30 193,119 28,309$ 37.6% 72,527 914$ 66,257,455$ $ 343 64,633,947$ 97.5%
<60 1,231,629 30,671$ 30.0% 369,319 933$ 344,648,562$ $ 280 182,012,895$ 52.8%
<90 4,470,217 31,034$ 33.1% 1,481,241 907$ 1,343,524,611$ $ 301 316,910,043$ 23.6%
<120 7,890,230 33,346$ 32.4% 2,557,949 931$ 2,381,684,499$ $ 302 436,843,921$ 18.3%
<180 23,879,176 34,274$ 34.1% 8,140,663 922$ 7,507,150,635$ $ 314 947,482,591$ 12.6%
<240 31,972,016 35,563$ 32.1% 10,266,461 933$ 9,583,608,768$ $ 300 1,044,305,740$ 10.9%
Minutes
Baseline Before
North Jersey
3 A.C. Casinos
Close
Incremental $
Impact
Incremental
% Impact $ Impact % Impact
< 30 Minutes 65,242,196$ 64,633,947$ (510,828)$ ‐0.8% (608,248)$ ‐0.9%
30‐60 Minutes 138,903,065$ 117,378,948$ (17,259,644)$ ‐12.4% (21,524,117)$ ‐15.5%
60‐90 Minutes 189,678,313$ 134,897,147$ (41,407,526)$ ‐21.8% (54,781,166)$ ‐28.9%
90‐120 Minutes 229,561,171$ 119,933,878$ (46,609,398)$ ‐20.3% (109,627,293)$ ‐47.8%
120‐180 Minutes 1,209,278,710$ 510,638,670$ (191,514,080)$ ‐15.8% (698,640,040)$ ‐57.8%
180‐240 Minutes 148,224,337$ 96,823,149$ (39,938,856)$ ‐26.9% (51,401,189)$ ‐34.7%
Total 1,980,887,793$ 1,044,305,740$ (337,240,331)$ ‐17.0% (936,582,053)$ ‐47.3%
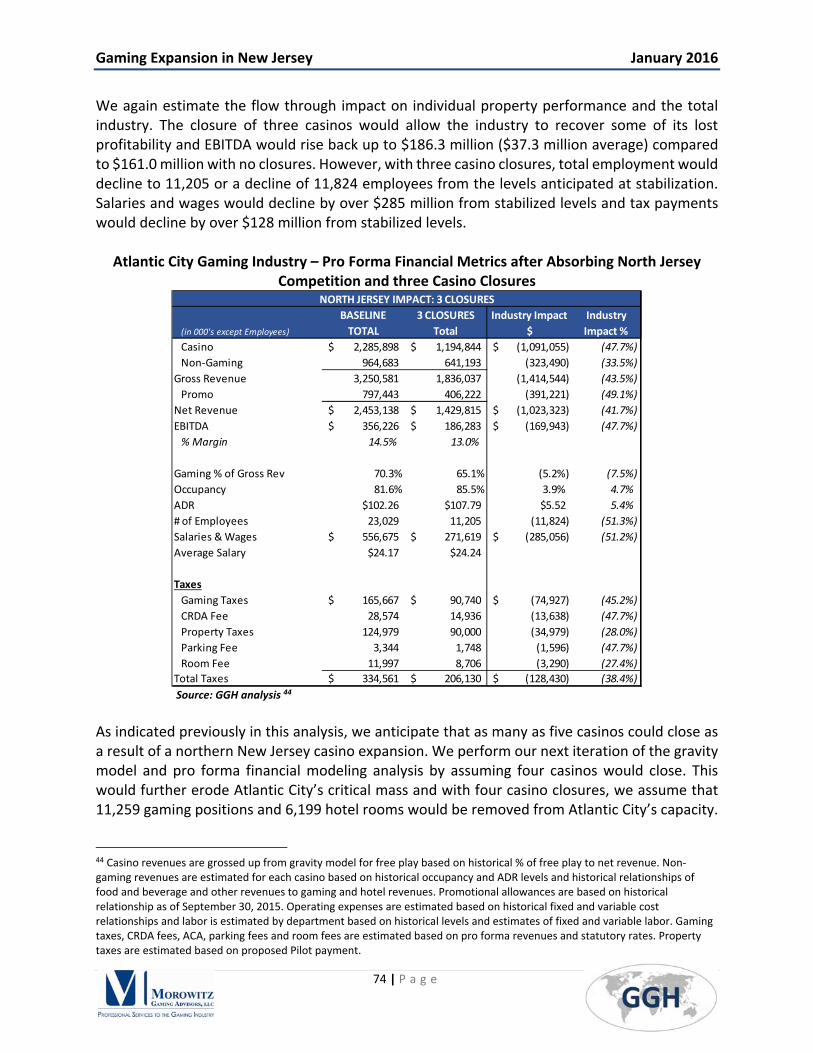
Gaming Expansion in New Jersey January 2016
74 | P a g e
We again estimate the flow through impact on individual property performance and the total industry. The closure of three casinos would allow the industry to recover some of its lost profitability and EBITDA would rise back up to $186.3 million ($37.3 million average) compared to $161.0 million with no closures. However, with three casino closures, total employment would decline to 11,205 or a decline of 11,824 employees from the levels anticipated at stabilization. Salaries and wages would decline by over $285 million from stabilized levels and tax payments would decline by over $128 million from stabilized levels.
Atlantic City Gaming Industry – Pro Forma Financial Metrics after Absorbing North Jersey Competition and three Casino Closures
Source: GGH analysis 44
As indicated previously in this analysis, we anticipate that as many as five casinos could close as a result of a northern New Jersey casino expansion. We perform our next iteration of the gravity model and pro forma financial modeling analysis by assuming four casinos would close. This would further erode Atlantic City’s critical mass and with four casino closures, we assume that 11,259 gaming positions and 6,199 hotel rooms would be removed from Atlantic City’s capacity.
44 Casino revenues are grossed up from gravity model for free play based on historical % of free play to net revenue. Non‐gaming revenues are estimated for each casino based on historical occupancy and ADR levels and historical relationships of food and beverage and other revenues to gaming and hotel revenues. Promotional allowances are based on historical relationship as of September 30, 2015. Operating expenses are estimated based on historical fixed and variable cost relationships and labor is estimated by department based on historical levels and estimates of fixed and variable labor. Gaming taxes, CRDA fees, ACA, parking fees and room fees are estimated based on pro forma revenues and statutory rates. Property taxes are estimated based on proposed Pilot payment.
NORTH JERSEY IMPACT: 3 CLOSURES
(in 000's except Employees)
BASELINE
TOTAL
3 CLOSURES
Total
Industry Impact
$
Industry
Impact %
Casino 2,285,898$ 1,194,844$ (1,091,055)$ (47.7%)
Non‐Gaming 964,683 641,193 (323,490) (33.5%)
Gross Revenue 3,250,581 1,836,037 (1,414,544) (43.5%)
Promo 797,443 406,222 (391,221) (49.1%)
Net Revenue 2,453,138$ 1,429,815$ (1,023,323)$ (41.7%)
EBITDA 356,226$ 186,283$ (169,943)$ (47.7%)
% Margin 14.5% 13.0%
Gaming % of Gross Rev 70.3% 65.1% (5.2%) (7.5%)
Occupancy 81.6% 85.5% 3.9% 4.7%
ADR $102.26 $107.79 $5.52 5.4%
# of Employees 23,029 11,205 (11,824) (51.3%)
Salaries & Wages 556,675$ 271,619$ (285,056)$ (51.2%)
Average Salary $24.17 $24.24
Taxes
Gaming Taxes 165,667$ 90,740$ (74,927)$ (45.2%)
CRDA Fee 28,574 14,936 (13,638) (47.7%)
Property Taxes 124,979 90,000 (34,979) (28.0%)
Parking Fee 3,344 1,748 (1,596) (47.7%)
Room Fee 11,997 8,706 (3,290) (27.4%)
Total Taxes 334,561$ 206,130$ (128,430)$ (38.4%)

Gaming Expansion in New Jersey January 2016
75 | P a g e
Industry gaming revenues (net of free play) are then estimated at $886 million as depicted in the table below.
Gravity Model Output – Impact of North Jersey Casinos (4 Casino Closures)
Source: DemographicsNow, 4C GeoWorks, GGH research
This results in a loss of an additional $158 million (8.0%) of baseline gaming revenues bringing the total impact to ‐55.3%.
Source: DemographicsNow, 4C GeoWorks, GGH research
We again estimate the flow through impact on industry EBITDA performance. The closure of four casinos would maintain EBITDA at close to $186.5 million (compared to $161.1 million with no closures) but still a $170 million decline from the baseline level. This also assumes that Atlantic City’s gaming industry would remain viable and does not take into account the impact of the loss of critical mass due to the closure of four casinos and the negative impact of the closures on the rest of Atlantic City. With four casino closures, total employment would decline to 9,353 or a decline of 13,676 employees from the levels anticipated at stabilization. Salaries and wages would decline by over $329 million from stabilized levels and tax payments (real estate, CRDA fees, ACA, Parking Fees and Room fees), would decline by over $145 million from stabilized levels.
Minutes
Adult
Population
Per Capita
Income
Partici‐
pation
% Gamers
Avg.
Annual
Budget Estimated Market
Spend
per
Adult
Atlantic City
Revenues
Market
Share
< 30 Minutes 193,119 28,309$ 37.6% 72,527 914$ 66,257,455$ $ 343 64,244,816$ 97.0%
30‐60 Minutes 1,038,510 31,119$ 28.6% 296,793 938$ 278,391,107$ $ 268 107,892,420$ 38.8%
60‐90 Minutes 3,238,588 31,168$ 34.3% 1,111,921 898$ 998,876,049$ $ 308 114,775,695$ 11.5%
90‐120 Minutes 3,420,013 36,342$ 31.5% 1,076,708 964$ 1,038,159,888$ $ 304 98,461,766$ 9.5%
120‐180 Minutes 15,988,946 34,738$ 34.9% 5,582,715 918$ 5,125,466,136$ $ 321 421,911,666$ 8.2%
180‐240 Minutes 8,092,840 39,350$ 26.3% 2,125,798 977$ 2,076,458,132$ $ 257 78,792,981$ 3.8%
Total 31,972,016 35,563$ 32.1% 10,266,461 933$ 9,583,608,768$ $ 300 886,079,344$ 9.2%
Cumulative
Minutes
Adult
Population
Per Capita
Income
Partici‐
pation
% Gamers
Avg.
Annual
Budget Estimated Market
Spend
per
Adult
Atlantic City
Revenues
Market
Share
<30 193,119 28,309$ 37.6% 72,527 914$ 66,257,455$ $ 343 64,244,816$ 97.0%
<60 1,231,629 30,671$ 30.0% 369,319 933$ 344,648,562$ $ 280 172,137,236$ 49.9%
<90 4,470,217 31,034$ 33.1% 1,481,241 907$ 1,343,524,611$ $ 301 286,912,932$ 21.4%
<120 7,890,230 33,346$ 32.4% 2,557,949 931$ 2,381,684,499$ $ 302 385,374,698$ 16.2%
<180 23,879,176 34,274$ 34.1% 8,140,663 922$ 7,507,150,635$ $ 314 807,286,364$ 10.8%
<240 31,972,016 35,563$ 32.1% 10,266,461 933$ 9,583,608,768$ $ 300 886,079,344$ 9.2%
Minutes
Baseline Before
North Jersey
4 A.C. Casinos
Close
Incremental $
Impact
Incremental
% Impact $ Impact % Impact
< 30 Minutes 65,242,196$ 64,244,816$ (389,131)$ ‐0.6% (997,380)$ ‐1.5%
30‐60 Minutes 138,903,065$ 107,892,420$ (9,486,528)$ ‐6.8% (31,010,645)$ ‐22.3%
60‐90 Minutes 189,678,313$ 114,775,695$ (20,121,452)$ ‐10.6% (74,902,618)$ ‐39.5%
90‐120 Minutes 229,561,171$ 98,461,766$ (21,472,112)$ ‐9.4% (131,099,405)$ ‐57.1%
120‐180 Minutes 1,209,278,710$ 421,911,666$ (88,727,005)$ ‐7.3% (787,367,045)$ ‐65.1%
180‐240 Minutes 148,224,337$ 78,792,981$ (18,030,168)$ ‐12.2% (69,431,357)$ ‐46.8%
Total 1,980,887,793$ 886,079,344$ (158,226,396)$ ‐8.0% (1,094,808,448)$ ‐55.3%

Gaming Expansion in New Jersey January 2016
76 | P a g e
Atlantic City Gaming Industry – Pro Forma Financial Metrics after Absorbing North Jersey Competition and Four Casino Closures
Source: GGH analysis 45 Determining which casinos will close is not possible with a high degree of precision. Different casinos will react in different ways to competition, multi‐property owners will have different criteria than single property owners and single property owners will have differing outlooks and capitalization. A significant issue will be the clustering of casinos. The two most successful casinos today (Borgata and Harrah’s) exist in the Marina district and those two casinos are in the best position to survive the impacts of northern New Jersey competition. This would leave at most two casinos on the boardwalk, leading to further degradation of Atlantic City’s competitive position. We demonstrated earlier in this analysis the importance of hotel rooms to Atlantic City’s convention and meeting industry. The loss of four casinos would remove approximately 6,200
45 Casino revenues are grossed up from gravity model for free play based on historical % of free play to net revenue. Non‐gaming revenues are estimated for each casino based on historical occupancy and ADR levels and historical relationships of food and beverage and other revenues to gaming and hotel revenues. Promotional allowances are based on historical relationship as of September 30, 2015. Operating expenses are estimated based on historical fixed and variable cost relationships and labor is estimated by department based on historical levels and estimates of fixed and variable labor. Gaming taxes, CRDA fees, ACA, parking fees and room fees are estimated based on pro forma revenues and statutory rates. Property taxes are estimated based on proposed Pilot payment.
NORTH JERSEY IMPACT: 4 CLOSURES
(in 000's except Employees)
BASELINE
TOTAL
4 CLOSURES
Total
Industry Impact
$
Industry
Impact %
Casino 2,285,898$ 1,006,471$ (1,279,427)$ (56.0%)
Non‐Gaming 964,683 562,394 (402,289) (41.7%)
Gross Revenue 3,250,581 1,568,865 (1,681,716) (51.7%)
Promo 797,443 352,985 (444,458) (55.7%)
Net Revenue 2,453,138$ 1,215,880$ (1,237,259)$ (50.4%)
EBITDA 356,226$ 186,529$ (169,697)$ (47.6%)
% Margin 14.5% 15.3%
Gaming % of Gross Rev 70.3% 64.2% (6.2%) (8.8%)
Occupancy 81.6% 88.6% 7.0% 8.6%
ADR $102.26 $113.93 $11.67 11.4%
# of Employees 23,029 9,353 (13,676) (59.4%)
Salaries & Wages 556,675$ 227,341$ (329,334)$ (59.2%)
Average Salary $24.17 $24.31
Taxes
Gaming Taxes 165,667$ 78,082$ (87,585)$ (52.9%)
CRDA Fee 28,574 12,581 (15,993) (56.0%)
Property Taxes 124,979 90,000 (34,979) (28.0%)
Parking Fee 3,344 1,473 (1,872) (56.0%)
Room Fee 11,997 7,009 (4,988) (41.6%)
Total Taxes 334,561$ 189,144$ (145,416)$ (43.5%)
Notes:(1) Excludes Caesars Interactive and Resorts Digital)
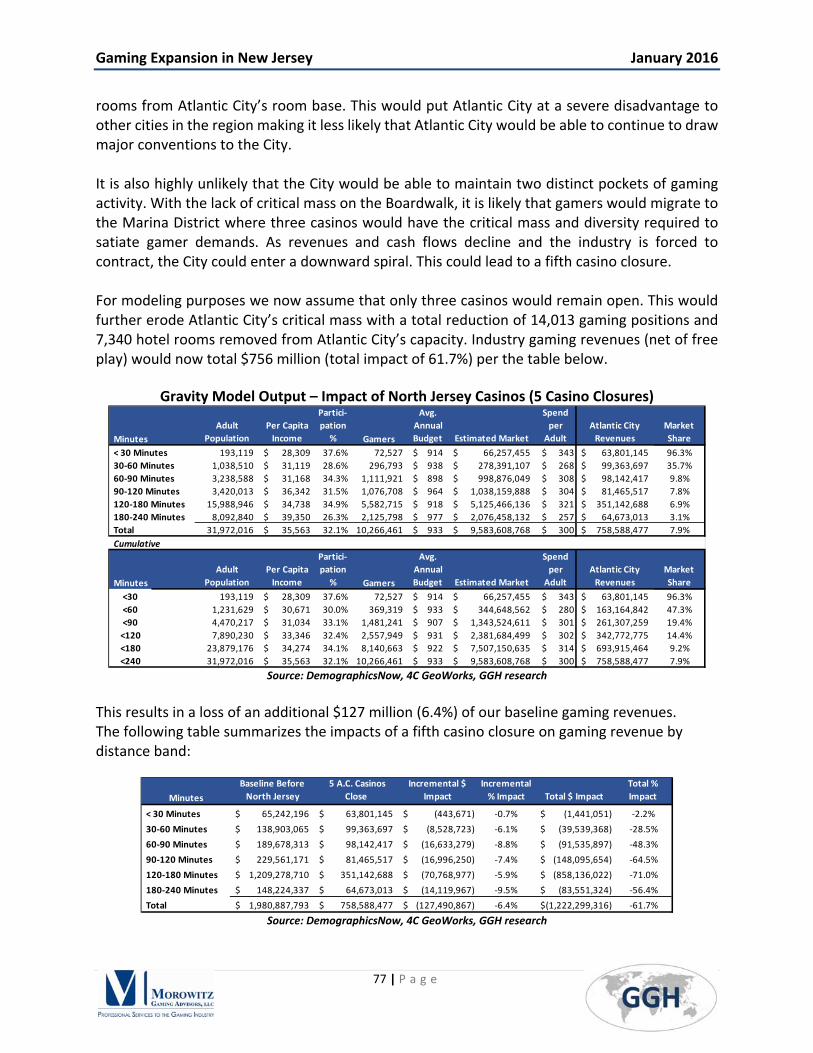
Gaming Expansion in New Jersey January 2016
77 | P a g e
rooms from Atlantic City’s room base. This would put Atlantic City at a severe disadvantage to other cities in the region making it less likely that Atlantic City would be able to continue to draw major conventions to the City. It is also highly unlikely that the City would be able to maintain two distinct pockets of gaming activity. With the lack of critical mass on the Boardwalk, it is likely that gamers would migrate to the Marina District where three casinos would have the critical mass and diversity required to satiate gamer demands. As revenues and cash flows decline and the industry is forced to contract, the City could enter a downward spiral. This could lead to a fifth casino closure. For modeling purposes we now assume that only three casinos would remain open. This would further erode Atlantic City’s critical mass with a total reduction of 14,013 gaming positions and 7,340 hotel rooms removed from Atlantic City’s capacity. Industry gaming revenues (net of free play) would now total $756 million (total impact of 61.7%) per the table below.
Gravity Model Output – Impact of North Jersey Casinos (5 Casino Closures)
Source: DemographicsNow, 4C GeoWorks, GGH research
This results in a loss of an additional $127 million (6.4%) of our baseline gaming revenues. The following table summarizes the impacts of a fifth casino closure on gaming revenue by distance band:
Source: DemographicsNow, 4C GeoWorks, GGH research
Minutes
Adult
Population
Per Capita
Income
Partici‐
pation
% Gamers
Avg.
Annual
Budget Estimated Market
Spend
per
Adult
Atlantic City
Revenues
Market
Share
< 30 Minutes 193,119 28,309$ 37.6% 72,527 914$ 66,257,455$ $ 343 63,801,145$ 96.3%
30‐60 Minutes 1,038,510 31,119$ 28.6% 296,793 938$ 278,391,107$ $ 268 99,363,697$ 35.7%
60‐90 Minutes 3,238,588 31,168$ 34.3% 1,111,921 898$ 998,876,049$ $ 308 98,142,417$ 9.8%
90‐120 Minutes 3,420,013 36,342$ 31.5% 1,076,708 964$ 1,038,159,888$ $ 304 81,465,517$ 7.8%
120‐180 Minutes 15,988,946 34,738$ 34.9% 5,582,715 918$ 5,125,466,136$ $ 321 351,142,688$ 6.9%
180‐240 Minutes 8,092,840 39,350$ 26.3% 2,125,798 977$ 2,076,458,132$ $ 257 64,673,013$ 3.1%
Total 31,972,016 35,563$ 32.1% 10,266,461 933$ 9,583,608,768$ $ 300 758,588,477$ 7.9%
Cumulative
Minutes
Adult
Population
Per Capita
Income
Partici‐
pation
% Gamers
Avg.
Annual
Budget Estimated Market
Spend
per
Adult
Atlantic City
Revenues
Market
Share
<30 193,119 28,309$ 37.6% 72,527 914$ 66,257,455$ $ 343 63,801,145$ 96.3%
<60 1,231,629 30,671$ 30.0% 369,319 933$ 344,648,562$ $ 280 163,164,842$ 47.3%
<90 4,470,217 31,034$ 33.1% 1,481,241 907$ 1,343,524,611$ $ 301 261,307,259$ 19.4%
<120 7,890,230 33,346$ 32.4% 2,557,949 931$ 2,381,684,499$ $ 302 342,772,775$ 14.4%
<180 23,879,176 34,274$ 34.1% 8,140,663 922$ 7,507,150,635$ $ 314 693,915,464$ 9.2%
<240 31,972,016 35,563$ 32.1% 10,266,461 933$ 9,583,608,768$ $ 300 758,588,477$ 7.9%
Minutes
Baseline Before
North Jersey
5 A.C. Casinos
Close
Incremental $
Impact
Incremental
% Impact Total $ Impact
Total %
Impact
< 30 Minutes 65,242,196$ 63,801,145$ (443,671)$ ‐0.7% (1,441,051)$ ‐2.2%
30‐60 Minutes 138,903,065$ 99,363,697$ (8,528,723)$ ‐6.1% (39,539,368)$ ‐28.5%
60‐90 Minutes 189,678,313$ 98,142,417$ (16,633,279)$ ‐8.8% (91,535,897)$ ‐48.3%
90‐120 Minutes 229,561,171$ 81,465,517$ (16,996,250)$ ‐7.4% (148,095,654)$ ‐64.5%
120‐180 Minutes 1,209,278,710$ 351,142,688$ (70,768,977)$ ‐5.9% (858,136,022)$ ‐71.0%
180‐240 Minutes 148,224,337$ 64,673,013$ (14,119,967)$ ‐9.5% (83,551,324)$ ‐56.4%
Total 1,980,887,793$ 758,588,477$ (127,490,867)$ ‐6.4% (1,222,299,316)$ ‐61.7%

Gaming Expansion in New Jersey January 2016
78 | P a g e
We again iterate the flow through impact on industry EBITDA performance. The closure of five casinos would allow the industry to recover a greater amount of its lost profitability with EBITDA rising back up to $193.9 million (an average of $68.6 million) compared to $161.1 million with no closures, but still $162 million less than the baseline level. With five casino closures, total employment would decline to 7,990 or a decline of 15,039 employees from the levels anticipated at stabilization. Salaries and wages would decline by over $364.5 million from stabilized levels and tax payments would decline by over $158 million from stabilized levels. All of this assumes that that the Atlantic City gaming industry, with only three casinos remaining, would be viable, despite the impact of the loss of critical mass due to the closure of five casinos.
Atlantic City Gaming Industry – Pro Forma Financial Metrics after Absorbing North Jersey Competition and Five Casino Closures
Source: GGH analysis 46
46 Casino revenues are grossed up from gravity model for free play based on historical % of free play to net revenue. Non‐gaming revenues are estimated for each casino based on historical occupancy and ADR levels and historical relationships of food and beverage and other revenues to gaming and hotel revenues. Promotional allowances are based on historical relationship as of September 30, 2015. Operating expenses are estimated based on historical fixed and variable cost relationships and labor is estimated by department based on historical levels and estimates of fixed and variable labor. Gaming taxes, CRDA fees, ACA, parking fees and room fees are estimated based on pro forma revenues and statutory rates. Property taxes are estimated based on proposed Pilot payment.
NORTH JERSEY IMPACT: 5 CLOSURES
(in 000's except Employees)
BASELINE
TOTAL
5 CLOSURES
Total
Industry Impact
$
Industry
Impact %
Casino 2,285,898$ 856,580$ (1,429,318)$ (62.5%)
Non‐Gaming 964,683 521,453 (443,230) (45.9%)
Gross Revenue 3,250,581 1,378,034 (1,872,548) (57.6%)
Promo 797,443 302,595 (494,848) (62.1%)
Net Revenue 2,453,138$ 1,075,439$ (1,377,700)$ (56.2%)
EBITDA 356,226$ 193,942$ (162,284)$ (45.6%)
% Margin 14.5% 18.0%
Gaming % of Gross Rev 70.3% 62.2% (8.2%) (11.6%)
Occupancy 81.6% 90.4% 8.8% 10.8%
ADR $102.26 $120.65 $18.39 18.0%
# of Employees 23,029 7,990 (15,039) (65.3%)
Salaries & Wages 556,675$ 192,156$ (364,520)$ (65.5%)
Average Salary $24.17 $24.05
Taxes
Gaming Taxes 165,667$ 67,883$ (97,784)$ (59.0%)
CRDA Fee 28,574 10,707 (17,866) (62.5%)
Property Taxes 124,979 90,000 (34,979) (28.0%)
Parking Fee 3,344 1,253 (2,091) (62.5%)
Room Fee 11,997 6,433 (5,564) (46.4%)
Total Taxes 334,561$ 176,276$ (158,284)$ (47.3%)
Notes:(1) Excludes Caesars Interactive and Resorts Digital)

Gaming Expansion in New Jersey January 2016
79 | P a g e
We summarize the potential impacts of northern New Jersey gaming expansion on the Atlantic City casino industry in the table on the following page. As of September 2015, the casino industry generated $2.6 billion of net revenue, $404 million of EBITDA, employed 24,431 employees, over $590 million in wages (not including tips) and was paying approximately $381 million in state and local taxes (including property taxes). On a pro forma basis, those amounts are expected to decline marginally with the opening of new out‐of‐state competitors anticipated in Pennsylvania, Maryland, New York and Massachusetts to $2.45 billion of gaming revenue, $356 million of EBITDA, 23,029 employees, $557 million in wages and $363 million in taxes. At this point, due to saturation of the northeast market, it is highly unlikely that there will be additional out‐of‐state expansion and the Atlantic City casino industry should stabilize and even potentially grow However, if casinos expand to northern New Jersey, Atlantic City’s casino industry will contract significantly, losing net revenue ranging from $624 million to $1.4 billion with industry EBITDA declining to anywhere from $162 million to $195 million. However, the more likely result is that anywhere from three to five casinos will close, causing a spiral downward with net revenues declining by a range of $1.0 billion to $1.4 billion, EBITDA declining by between $162 million and $170 million, employment declining by between 11,800 and 15,000, wages (not including tips) declining by between $285 million and $365 million and industry tax payments declining by between $128 million and $158 million. The impacts of this potential industry contraction on the wider Atlantic City economy will be significant and are studied further in the next section of this study. At a minimum, the issues that the area currently faces with regard to a declining tax base, high unemployment and a high foreclosure rate will be exacerbated.

Gaming Expansion in New Jersey January 2016
80 | P a g e
Atlantic City Gaming Industry – Pro Forma Financial Metrics for all Scenarios
Source: GGH analysis
(in 000's except Employees TTM 9/15 Baseline No Closures 3 Closures Impact % 4 Closures Impact % 5 Closures Impact %
Revenues
Gaming 2,474,066$ 2,285,898$ 1,594,254$ 1,194,844$ (1,091,055)$ (47.7%) 1,006,471$ (1,279,427)$ (56.0%) 856,580$ (1,429,318)$ (62.5%)
Non‐gaming 999,387 964,683 790,253 641,193 (323,490) (33.5%) 562,394 (402,289) (41.7%) 521,453 (443,230) (45.9%)
Gross Revenue 3,473,453 3,250,581 2,384,507 1,836,037 (1,414,544) (43.5%) 1,568,865 (1,681,716) (51.7%) 1,378,034 (1,872,548) (57.6%)
Promo 860,232 797,443 556,161 406,222 (391,221) (49.1%) 352,985 (444,458) (55.7%) 302,595 (494,848) (62.1%)
Net Revenue 2,613,221 2,453,138 1,828,346 1,429,815 (1,023,323) (41.7%) 1,215,880 (1,237,259) (50.4%) 1,075,439 (1,377,700) (56.2%)
EBITDA 404,545 356,226 161,108 186,283 (169,943) (47.7%) 186,529 (169,697) (47.6%) 193,942 (162,284) (45.6%)
% Margin 15.5% 14.5% 8.8% 13.0% (1.5%) (10.3%) 15.3% 0.8% 5.6% 18.0% 3.5% 24.2%
Gaming as % of Gross 71.2% 70.3% 66.9% 65.1% (5.2%) (7.5%) 64.2% (6.2%) (8.8%) 62.2% (8.2%) (11.6%)
Occupancy 80.9% 81.6% 80.3% 85.5% 3.9% 4.7% 88.6% 7.0% 8.6% 90.4% 8.8% 10.8%
ADR 102.37$ 102.26$ 96.95$ 107.79$ 5.52$ 5.4% 113.93$ 11.67$ 11.4% 120.65$ 18.39$ 18.0%
# of Employees 24,431 23,029 16,318 11,205 (11,824) (51.3%) 9,353 (13,676) (59.4%) 7,990 (15,039) (65.3%)
Salaries & Wages 590,710$ 556,675$ 394,907$ 271,619$ (285,056)$ (51.2%) 227,341$ (329,334)$ (59.2%) 192,156$ (364,520)$ (65.5%)
Average Salary 24.18 24.17 24.20 24.24 0.07 0.3% 24.31 0.13 0.6% 24.05 (0.12) (0.5%)
Taxes
Gaming Tax 175,322$ 165,667$ 117,720$ 90,740$ (74,927)$ (45.2%) 78,082$ (87,585)$ (52.9%) 67,883$ (97,784)$ (59.0%)
CRDA Fee 19,390 28,574 19,928 14,936 (13,638) (47.7%) 12,581 (15,993) (56.0%) 10,707 (17,866) (62.5%)
Property Tax 151,162 124,979 90,000 90,000 (34,979) (28.0%) 90,000 (34,979) (28.0%) 90,000 (34,979) (28.0%)
Parking Fee 3,620 3,344 2,332 1,748 (1,596) (47.7%) 1,473 (1,872) (56.0%) 1,253 (2,091) (62.5%)
Room Fee 11,897 11,997 11,809 8,706 (3,290) (27.4%) 7,009 (4,988) (41.6%) 6,433 (5,564) (46.4%)
Total 361,391$ 334,561$ 241,789$ 206,130$ (128,430)$ (38.4%) 189,144$ (145,416)$ (43.5%) 176,276$ (158,284)$ (47.3%)
Gaming Expansion in New Jersey January 2016
81 | P a g e
Potential Legislative Initiatives from Surrounding States The gaming industry does not operate in a vacuum. Expansion in one state typically results in similar or competing legislation in other states. We saw this as the current expansion wave took hold in the mid‐2000s when Delaware reacted to gaming expansion in Pennsylvania by enacting table game and sports wagering legislation, Pennsylvania pushed back by enacting table game legislation of its own and New Jersey followed suit by implementing online gaming. If gaming expansion comes to northern New Jersey, there is a reasonable probability that nearby states will react by passing further gaming reforms and expansion. For instance, in Pennsylvania legislation is under consideration for online gaming, for the easing of certain restrictions at certain “Resort” casinos and for the expansion of slot machines to off track gaming facilities. This legislation would surely become a reality if gaming comes to northern New Jersey as Pennsylvania attempts to keep its gaming dollars from crossing the border into New Jersey or attempts to lure additional gamers from New Jersey. Pennsylvania might also consider other ways of expanding gaming such as providing marketing or capital expenditure reimbursements from tax collections (similar to New York) or even adding additional casino locations. In New York, legislators enacted a hiatus on gaming in New York City. That hiatus would likely be reduced or lifted as well. The results of additional gaming expansion in New York City and other surrounding states will surely have a profound impact on Atlantic City in addition to those quantified previously in this section of our study. As important, expansion in surrounding states would also impact the revenues at northern New Jersey casinos.

Gaming Expansion in New Jersey January 2016
82 | P a g e
VIII. THE FLOW THROUGH IMPACTS TO THE REGION FROM NORTH JERSEY GAMING EXPANSION
Recent Casino Resort Employment and Payroll Trends As a result of the reduction of the number of casinos in the Atlantic City market the remaining casinos have been able to capture enough revenues to become profitable in terms of their ability to spend on capital projects and service debt. Property reinvestment has been successful in making them viable venues in the current competitive environment. The profitability of each of these casinos varies, however, with some becoming very lean operations in order to remain operational. This has meant some scaling down of employment over the past five years as revenue declined, but a leveling off of employment over the past couple years as revenues stabilized. Resorts, Bally’s and Taj Mahal, however, remain operating at a level where labor costs account for 30% or more of casino gross gaming revenues; these properties may be at greatest risk of layoff or closure if market revenues decline significantly (as would be the case if North Jersey adds casinos). Golden Nugget, while having a high labor cost through 2014 relative to gaming revenues, has had a financially strong 2015 through September, such that it is now a profitable property (whereas it was not in 2014). Based on the relative staffing levels (September 2015 versus year‐end 2014) and comparative casino revenues through the third quarter of 2015 and 2014, we estimate the labor costs for Golden Nugget have fallen to approximately 25% of Gross Gaming Revenue (GGR) for 2015. If Golden Nugget can maintain this level it is possible that it could be one of the casino resorts that survives increased competition, otherwise it may fall into the aforementioned category of properties at risk. The following table presents the total employment, labor costs and ratios of employees and labor costs to GGR for each of the existing and recently closed Atlantic City casinos from 2011 to 2014.

Gaming Expansion in New Jersey January 2016
83 | P a g e
Historical Casino Resort Staffing and Related Metrics
Employees (year‐end) Salaries and Wages ($ million)
2011 2012 2013 2014 2011 2012 2013 2014
Atlantic Club 1,701 1,713 1,663 n/a $53.0 $42.4 $38.9 n/a
Bally's 3,856 3,418 3,147 2,993 $95.2 $79.5 $69.7 $71.1
Borgata 6,211 5,936 5,841 6,042 $149.1 $145.9 $141.4 $139.6
Caesars 3,090 2,996 2,850 2,698 $81.6 $74.2 $70.0 $69.7
Golden Nugget 1,659 1,779 1,881 2,081 $40.6 $40.3 $41.2 $55.4
Harrah's Marina 4,115 3,924 3,639 3,663 $89.7 $84.0 $76.1 $80.3
Resorts Casino Hotel 1,937 1,962 1,884 1,881 $47.1 $42.7 $42.6 $42.3
Revel 3,516 2,792 n/a $70.8 $82.6 $45.7
Showboat 2,488 2,308 2,159 n/a $60.0 $54.8 $48.5 $31.4
Tropicana 2,952 2,918 2,748 2,857 $73.6 $69.9 $66.5 $68.5
Trump Plaza 1,443 1,177 1,046 n/a $45.6 $32.5 $25.3 $16.2
Taj Mahal 3,375 3,051 2,777 2,472 $88.7 $77.9 $71.7 $63.7
Employees/$1M in GGR Salaries and Wages as % of GGR
2011 2012 2013 2014 2011 2012 2013 2014
Atlantic Club 11.9 13.6 11.8 n/a 37% 34% 28% n/a
Bally's 10.2 11.5 12.9 13.5 25% 27% 29% 32%
Borgata 9.6 9.7 9.5 9.0 23% 24% 23% 21%
Caesars 7.7 8.4 8.5 8.2 20% 21% 21% 21%
Golden Nugget 14.1 13.8 15.5 11.5 34% 31% 34% 31%
Harrah's Marina 9.4 9.9 10.3 10.2 21% 21% 22% 22%
Resorts Casino Hotel 12.7 15 14.6 13.7 31% 33% 33% 31%
Revel 29.3 24.4 n/a 59% 72% 48%
Showboat 9.7 10.3 14.5 n/a 23% 24% 33% 29%
Tropicana 10.8 11.8 12.2 9.9 27% 28% 30% 24%
Trump Plaza 10.6 11.6 17.5 n/a 33% 32% 42% 43%
Taj Mahal 9.7 10.4 10.8 11.6 26% 27% 28% 30%
Source: State of New Jersey Office of the Attorney General, Division of Gaming Enforcement quarterly financial reports; http://www.nj.gov/oag/ge/quarterlyfinancialrpt.html. Note: wages and salaries figures are non‐inclusive of gratuities, which for many positions are a significant share of incomes.
Notably excluded from these ratios are the labor costs and labor employment affiliated with third party operations at each of the casino resorts, such as leased retail and restaurant venues. This data is not reported or accessible for the purpose of this analysis (revenues, however, are publicly disseminated in quarterly reports by the Division of Gaming Enforcement). It is, however, pertinent data given that it reflects potential job losses and regional spending cuts in the event of closures. We estimate these incremental values later in this section of the report (see schedule of Current Direct Labor Impacts, page 79), based in part on proprietary data provided to us by some of the casino‐resort owners that surveyed their tenants. The preceding table demonstrates a decline in casino resort employment over the past four years, but U.S. Bureau of Labor Statistics data for various hospitality industries in the Atlantic
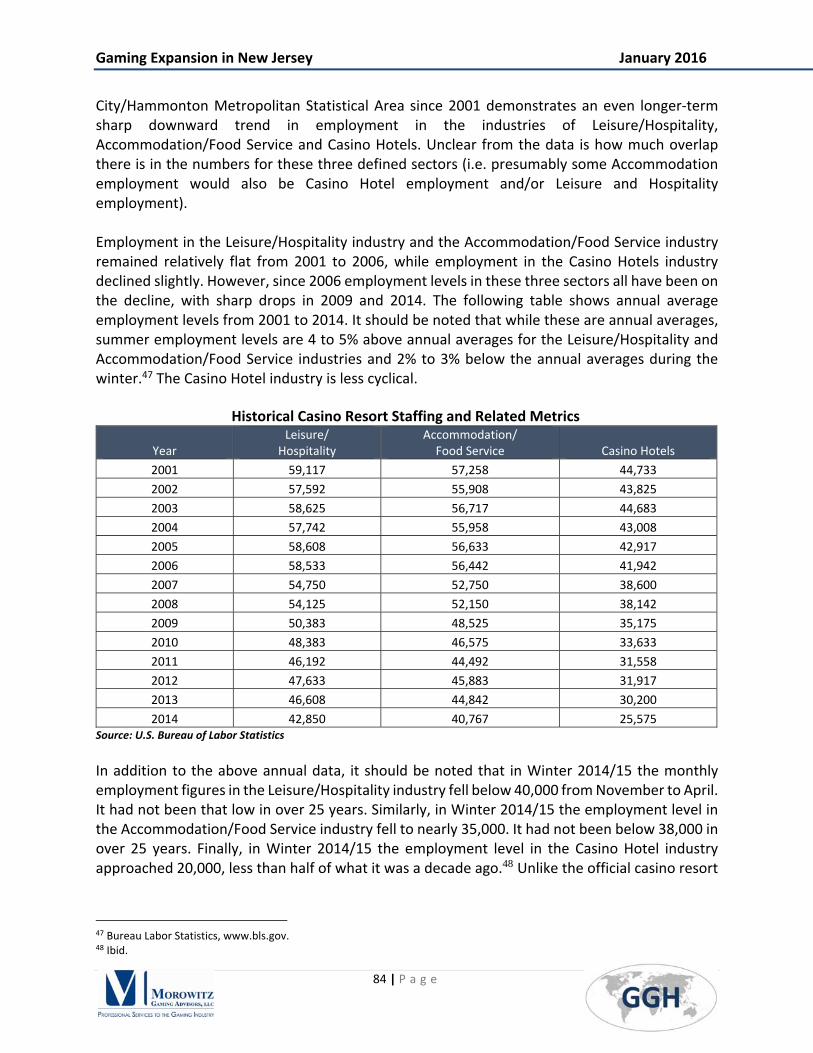
Gaming Expansion in New Jersey January 2016
84 | P a g e
City/Hammonton Metropolitan Statistical Area since 2001 demonstrates an even longer‐term sharp downward trend in employment in the industries of Leisure/Hospitality, Accommodation/Food Service and Casino Hotels. Unclear from the data is how much overlap there is in the numbers for these three defined sectors (i.e. presumably some Accommodation employment would also be Casino Hotel employment and/or Leisure and Hospitality employment). Employment in the Leisure/Hospitality industry and the Accommodation/Food Service industry remained relatively flat from 2001 to 2006, while employment in the Casino Hotels industry declined slightly. However, since 2006 employment levels in these three sectors all have been on the decline, with sharp drops in 2009 and 2014. The following table shows annual average employment levels from 2001 to 2014. It should be noted that while these are annual averages, summer employment levels are 4 to 5% above annual averages for the Leisure/Hospitality and Accommodation/Food Service industries and 2% to 3% below the annual averages during the winter.47 The Casino Hotel industry is less cyclical.
Historical Casino Resort Staffing and Related Metrics
Year Leisure/
Hospitality Accommodation/ Food Service Casino Hotels
2001 59,117 57,258 44,733
2002 57,592 55,908 43,825
2003 58,625 56,717 44,683
2004 57,742 55,958 43,008
2005 58,608 56,633 42,917
2006 58,533 56,442 41,942
2007 54,750 52,750 38,600
2008 54,125 52,150 38,142
2009 50,383 48,525 35,175
2010 48,383 46,575 33,633
2011 46,192 44,492 31,558
2012 47,633 45,883 31,917
2013 46,608 44,842 30,200
2014 42,850 40,767 25,575 Source: U.S. Bureau of Labor Statistics
In addition to the above annual data, it should be noted that in Winter 2014/15 the monthly employment figures in the Leisure/Hospitality industry fell below 40,000 from November to April. It had not been that low in over 25 years. Similarly, in Winter 2014/15 the employment level in the Accommodation/Food Service industry fell to nearly 35,000. It had not been below 38,000 in over 25 years. Finally, in Winter 2014/15 the employment level in the Casino Hotel industry approached 20,000, less than half of what it was a decade ago.48 Unlike the official casino resort
47 Bureau Labor Statistics, www.bls.gov. 48 Ibid.

Gaming Expansion in New Jersey January 2016
85 | P a g e
numbers, this table would be inclusive of the third‐party operated restaurants and retail facilities, thus more representative of the direct impacts of casino closures and overall demand declines. Casino Resort Vendor Spending Trends The decline in spending on labor as a result of the downsizing of the casino industry is not the only regional impact. Regional businesses provide a broad array of support services and supplies to casinos resorts, with demand for these goods and services naturally declining as revenues and visitation has declined. The Casino Control Commission provides in its Annual Reports the aggregate vendor spending by the casino resorts annually, broken down by in‐state versus out‐of‐state, as well as by New Jersey county. While the job losses are a significant impact of market downsizing, the decline in regional vendor spending has been even more sharp, particularly during the past several years. Overall vendor spending declined from a peak of $4.15 billion in 2008 to $2.2 billion in 2010, and falling to less than $1.2 billion in 2014.49 From 2005 to 2010 the in‐state vendor spending varied widely as a percentage of the total, between 40% and 63%.50 This range has narrowed during the past three years, with in‐state vendor spending accounting for approximately 60% of the overall vendor spending.51 These figures are non‐inclusive of any purchases made by third‐party operators within the casino resorts, such as restaurants and retail shops operating under leases, but are inclusive of capital expenditures for casinos, which provides some outliers (specifically 2011 ‐ Revel). During the past decade Atlantic County vendors have accounted for between 57% and 71% of in‐state casino resort spending, and 25% to 40% of overall spending.52 From 2012 to 2014 Atlantic County as a share of the statewide total has stabilized at approximately 70% (41% to 43% of the overall spending).
49 New Jersey Casino Control Commission Annual Reports; http://www.state.nj.us/casinos/reports/. From 2012 to 2014 the annual decline in overall vendor spending was over 16% per year, while the decline in total casino resort salaries and wages was down 5 to 12%. 50 Ibid. 51 Ibid. 52 Calendar Year 2011 was a major outlier year in all regards as it included development costs for Revel.

Gaming Expansion in New Jersey January 2016
86 | P a g e
Casino Resort Spending by Vendor Location
2005 2006 2007 2008 2009 2010 2011 2012 2013 2014
Atlantic County $1,136.2M $1,385.7M $1,622.7M $1,437.9M $733.5M $672.0M $1,436.2M $718.8M $604.0M $477.6M
Burlington County $99.8M $73.1M $75.2M $78.9M $60.7M $57.2M $64.0M $57.8M $45.2M $43.7M
Gloucester County $89.4M $90.9M $112.5M $98.6M $70.7M $61.7M $60.5M $49.8M $44.2M $37.3M
Salem County $22.1M $23.8M $15.8M $16.6M not listed $34.1M $28.7M $28.4M $28.6M $27.5M
Camden County $141.0M $141.8M $122.1M $106.1M $29.1M $32.5M $31.9M $23.5M $29.0M $23.7M
Cumberland County $30.9M $38.6M $70.4M $55.1M $43.5M $21.1M $63.7M $41.3M $11.4M $11.5M
Other NJ Counties* $453.5M $404.4M $520.0M $543.0M $266.8M $220.1M $174.4M $125.5M $86.4M $65.4M
NJ Total $1,972.8M $2,158.4M $2,538.8M $2,336.2M $1,204.3M $1,098.7M $1,859.4M $1,045.2M $848.9M $686.6M
Atlantic/NJ Total 57.6% 64.2% 63.9% 61.5% 60.9% 61.2% 77.2% 68.8% 71.2% 69.6%
Atlantic/Overall Total 34.3% 39.4% 40.1% 34.6% 24.7% 31.1% 55.3% 42.0% 43.2% 40.8%
NJ Total/Overall Total 59.5% 61.4% 62.7% 56.3% 40.5% 50.8% 71.6% 61.0% 60.7% 58.7%
Overall Total $3,315.2M $3,513.5M $4,048.2M $4,150.5M $2,972.4M $2,161.6M $2,597.5M $1,712.8M $1,398.9M $1,170.2M
Source: New Jersey Casino Control Commission Annual Reports; http://www.state.nj.us/casinos/reports/ *In 2014 no other county accounted for more than $10M in vendor revenues. The table is ordered according to 2014 vendor spending by county.
Gaming Expansion in New Jersey January 2016
87 | P a g e
In 2014 the existing eight casinos generated gross revenues of $3.4 billion, of which $2.4 billion reflected gross gaming revenues, $402 million was room revenues, $437 million was food and beverage (F&B) revenues and $154 million was other revenues. An additional $203 million in revenues was recorded by third‐party operators at the casino resorts.53 Based on the third‐party supply of F&B, retail, spas and salons at each of the properties, and through a combination of proprietary data provided by Atlantic City operators and our estimates based on the supply per property, we estimate that the breakdown of current revenues for third party operated venues by venue type. First, we estimate that third‐party F&B venues at existing casino resorts generated approximately $170 million in revenues in 2014. We estimate that these venues employ 1,459 persons. Wages and salaries for these employees are estimated at $38 million based on these revenues, not including gratuities or labor burden. Assuming gratuities equate to approximately 15% of revenues (taking into consideration that some venues are food courts where gratuities may be less common), labor income would increase by $26 million to a total of $64 million. Additionally, based on the revenues, we estimate the cost of goods sold (local purchases by the operators) amounts to approximately $82 million annually. Similarly, based on data provided by Atlantic City operators and our estimates based on the retail venue supply per property, we estimate that the 2014 revenues for third‐party operated retail facilities at currently existing Atlantic City casino resorts totaled approximately $30 million annually. We estimate that these venues in aggregate employed 213 persons. The wages and salaries for these employees, not including labor burden, is estimated at $3.2 million based on these revenues. Additionally, based on the revenues, we estimate the cost of goods sold amounts to approximately $18.0 million annually. However, unlike food and beverage goods, it is unlikely that much of the retail supply would come from local sources. We consider a 10% local sourcing of retail goods and services to be conservative, or nearly $2 million. Finally, there are some spas and salons operated by third parties within the casino resorts. We estimate revenues for these properties totaled approximately $2.8 million in 2014. Labor earnings, including tips but excluding labor burden, are estimated to total approximately $1.3 million annually, with an additional $1.0 million spent by the operators for the cost of goods and services (as was the case for retail, the majority likely is not regionally‐sourced). In total, we therefore estimate the average employment level at Atlantic City casino resorts over the past 12 months equals approximately 26,123, comprised of 24,431 employed by the properties and 1,692 by third parties. Total wages, salaries and gratuities, not including labor burden, are estimated in aggregate to total $807 million.54
53 State of New Jersey, Office of the Attorney General, Division of Gaming Enforcement, Quarterly Press Releases and Statistical Summaries, 4Q2014, http://www.nj.gov/oag/ge/docs/Financials/PressRel2014/FINAL4thQTR2014PressRelease.pdf 54 Casino‐hotel gratuity is estimated (based on slot/table gaming revenue mix) at 2.88% of GGR for dealers plus $2.50 per occupied room plus 15% of F&B revenue.

Gaming Expansion in New Jersey January 2016
88 | P a g e
Current Direct Labor Impacts (all revenues in $000s) LTM ending 9/2015
Casino Resort
Jobs 24,431
Labor Income $590,710
Gratuities $147,584
Third Party
Jobs 1,692
Labor Income $42,487
Gratuities $25,927
Total
Jobs 26,123
Labor Income $633,197
Gratuities $173,511
Total Income $806,708
Based on the 2014 vendor revenue figures and our aggregate expenditure estimate of $101 million by third‐party operators on goods and services, we estimate total expenditures on goods and services in 2014 totaled $1.271 billion. We further estimate that approximately $520 million of this total was consummated within Atlantic County, based on the reported casino vendor spending pattern and our estimate of the third‐party vendor spending patterns. Impact Projections of New Operations Forecasts with New Out‐of‐State Competitors Future competition from out of state is anticipated in the next several years, most notably including a new casino opening in Philadelphia, a casino in Maryland, a casino resort in the Catskills and slot facilities on Long Island potentially drawing away gamers from Atlantic City. In a previous section we quantified the potential impacts of this new competition (exclusive of northern New Jersey casinos) and summarize it as follows. We project that these new facilities collectively could have an impact of approximately 7.6% on gross gaming revenues (including free play) relative to the last 12 months of operations ($2.47 billion for LTM ending Sept 2015), or a decline to $2.29 billion (in 2015 dollars). Non‐gaming revenues for venues owned and operated by the resorts are projected to decline by 3.5 percent, to a total of $965 million, down from a current $999 million (omitting room revenues, the decline is projected to be a decline of 6.6 percent, but varying by property). Based on the scale of the third‐party operations at each of the Atlantic City casino resorts and our projection of the percentage declines in revenues at operator‐owned non‐gaming venues, we project the percentage decline at the third‐party operated venue revenues will be slightly greater (approximately 7.2% decline), from $202.7 million to $188.1 million.

Gaming Expansion in New Jersey January 2016
89 | P a g e
The impact on casino‐resort labor (not including third party operations) from new non‐Jersey competition is forecast by GGH to be 1,402 jobs, or a 5.7% decline. The decline for third‐party operated venues could be at a higher rate, given that a 7.2% decline in revenues is forecast. Assuming a 7.2% decline as well in third‐party venue labor, total employment would decline from 26,123 to 24,599, or a 5.8% overall decline. The overall labor earnings impact is projected to also be 5.8% for this scenario, such that employee earnings would decline from $807 million to $760 million. Projected Direct Labor Impact with New Out‐Of‐State Competition (income figures in $000s)
LTM ending 9/2015 Future Baseline Change % Change
Casino Resort
Jobs 24,431 23,029 1,402 ‐5.7%
Labor Income $590,710 $556,675 $34,035 ‐5.8%
Gratuities $147,584 $139,514 $8,070 ‐5.5%
Third Party ‐
Jobs 1,692 1,570 130 ‐7.2%
Labor Income $42,487 $39,428 $3,059 ‐7.2%
Gratuities $25,927 $24,060 $1,867 ‐7.2%
Total ‐
Jobs 26,123 24,599 1,524 ‐5.8%
Labor Income $633,197 $596,103 $37,094 ‐5.9%
Gratuities $173,511 $163,574 $9,937 ‐5.7%
Total Income $806,708 $759,678 $47,030 ‐5.8%
Based on typical costs for different casino resort operations, along with the reported vendor spending in Atlantic County in 2014, we estimate that vendor expenditures roughly equate to 10% of gross gaming revenues, 6% of hotel revenues and 28% of other non‐gaming revenues, not including third party venues. We assume that approximately 28% of third‐party venue revenue was also spent on Atlantic County vendor goods and services. Based on these percentages, we estimate that for the most recent 12‐month period the direct spending by the casino resorts in Atlantic County on vendor goods and services was $446 million (the 2014 figure was $478 million, as provided earlier in this report). Third‐party operation revenues of $203 million provide for an additional $56.7 million, for a total current vendor expenditure of approximately $503 million. Based on the projected declines in gaming revenues, hotel revenues and all other non‐gaming revenues as attributable to new out‐of‐state competition entering the market, assuming the cost of sales ratios remains relatively constant, total vendor expenditure would decline by 6.6% ($33.2 million) to $469.6 million. Forecasts with New In‐State Competitors The addition of in‐state competition would provide significantly larger declines in gaming and non‐gaming revenues, including property closures, as well as steep declines in purchases from regional vendors. GGH provides a range of potential impacts of new casino openings in North

Gaming Expansion in New Jersey January 2016
90 | P a g e
Jersey, demonstrating a potential loss of between 3 and 5 casinos in the Atlantic City market. We note that these projections only include the impacts of the casino resort closures, as well as the spin‐off losses resulting from the decline in vendor purchases. We do not evaluate the other negative externalities of casino‐hotel closures, i.e. how the convention center can be supported without a solid hotel room base, the attractiveness of the boardwalk with multiple shuttered properties, etc. Gross gaming revenues in Atlantic City, with in‐state competition, is projected to range from $857 million (5 casinos closing) to $1.185 billion (3 casinos closing), reflecting a decline of 47.7% ($1.091 billion) to 62.5% ($1.429 billion) from the baseline model of just new out‐of‐state competition. Non‐gaming revenues from casino‐hotel operated venues are projected to decline to a range of $521 million to $641 million, from a $965 million baseline, a 33.5% to 45.9% decline. The projected impact on employment ranges from a loss of 11,824 jobs (51.3% decline) to a loss of 15,039 jobs (65.3 percent). This does not include the job losses at third‐party operations. The change in third party revenues may be disproportionate to the overall casino‐resort impacts, as each property has a different mix of third‐party vs self‐operated venues. For example, Borgata’s non‐gaming amenities are predominantly self‐operated. Tropicana predominantly has third‐party venue operations. We project as a result of job losses at third party operations their employment levels could fall to a range of 325 to 804, depending on the quantity (and to some extent which of the casinos) that close (the significant decline in the following table between 3 casinos and 4 casinos reflects the assumption that Tropicana, featuring the largest third‐party operations, may be victim). In total, we project the total employment at casino resorts in Atlantic City could decline to between 8,315 and 12,009 if casinos are added in North Jersey, equating to a decline of between 51% and 66%. Total labor income for casino‐resort workers, including those at third‐party operations, are projected to range from $270 million to $388 million with in‐state competition, down from $760 million without, a 49% to 65% decline. This includes salaries, wages and gratuities.

Gaming Expansion in New Jersey January 2016
91 | P a g e
Projected Direct Labor Impact with New In‐ State Competition (income figures in $1,000s) Casinos remaining in Atlantic City
Future Baseline 5 casinos 4 casinos 3 casinos
Casino Resort
Jobs 23,029 11,205 9,353 7,990
Labor Income $556,675 $271,619 $227,341 $192,156
Gratuities $139,514 $83,384 $71,941 $64,497
Third Party
Jobs 1,570 804 461 325
Labor Income $39,428 $20,191 $11,577 $8,162
Gratuities $24,060 $12,321 $7,065 $4,980
Total
Jobs 24,599 12,009 9,814 8,315
Labor Income $596,103 $291,810 $238,918 $200,318
Gratuities $163,574 $95,705 $79,005 $69,477
Total Income $759,678 $387,515 $317,923 $269,795
Job ∆ ‐12,590 ‐14,785 ‐16,284
Job % ∆ ‐51.2% ‐60.1% ‐66.2%
Income ∆ ‐$372,163 ‐$441,754 ‐$489,883
Income % ∆ ‐49.0% ‐58.2% ‐64.5%
We assume vendor spending patterns would remain unchanged relative to the Baseline scenario whether there are 3, 4 or 5 casinos (or 8) left in Atlantic City. As a result of the projected declines in gaming revenues, hotel revenues and other non‐gaming amenities, both casino‐operated and third‐party operated, we project spending on Atlantic County vendors will fall to a range of $188.4 million to $264.1 million, reflecting a decline of 44% to 60% from the baseline of just out‐of‐state competition.
Casinos remaining in Atlantic City
Future Baseline 5 casinos 4 casinos 3 casinos
Atlantic County Vendor Expenditures $469,588 $264,141 $218,772 $188,377
Regional Impacts
Impact of Casino‐Resort Employee and Property Spending
The economic impact of casino closures and revenue declines in Atlantic City will be felt not only by employees and vendors of the casino resorts, but also as a result of the decline in business by the vendors and the decline in visitor spending at facilities other than the casino resorts, i.e. area F&B venues and retail facilities (ranging from pizza and t‐shirt shops on the Boardwalk to upscale

Gaming Expansion in New Jersey January 2016
92 | P a g e
restaurants and retail shops city‐wide). The impact of the decline in casino spending and casino‐resort employee spending is calculated using economic multipliers for Atlantic County, using IMPLAN’s Input‐Output/Social Accounting Matrix Model (“I‐O/SAM”).55 The Input‐Output economic model depicts how the total output of each industry in an economy depends on inter‐industry demands and final demands by putting transactions in a matrix framework. In other words, a commercial operation like a casino resort has significant effects on other industries in its trade area. The I‐O/SAM model measures those effects by using a series of multipliers. These multipliers consider all aspects of the Input‐Output framework, including what Inputs and Outputs will come from the Subject region. In this model we consider the vendor spending within Atlantic County and the employee earnings as the Direct Impacts and the inputs for the model. In the baseline scenario (Atlantic City with only existing and proposed out‐of‐state casinos) spending by the casino resorts on vendors and spending by casino resort employees will generate $1.44 billion in annual economic output, with the casino resorts supporting $1.15 billion in regional labor earnings for 35,133 persons. This does not include any casino/tourist patron spending impacts. If casinos open in North Jersey, between three and five casinos are projected to close in Atlantic City, the annual economic impacts by the casinos will be roughly halved, or worse. In the scenario where only three casinos close we project the annual impacts of the remaining five casinos will be $776 million in annual economic output, with the casino resorts supporting $594 million in regional labor earnings for 17,590 persons. If half (four) of the casinos close, the annual impacts decline to $643 million in annual economic output, supporting $489 million in labor earnings for 14,469 persons. In our worst‐case scenario with five casinos closing, we project the annual impacts will decline to $552 million in annual economic output, supporting $417 million in labor earnings for 12,307 persons. In total, we project new in‐state competition would take away between $664 million and $888 million in annual economic impact. Additionally, incomes of area residents will decline in aggregate by $556 million to $733 million, including the elimination of between 17,542 jobs and 22,826 jobs. Considering there are only approximately 132,500 persons in the labor force, with already close to 10% unemployment, this could push the unemployment rate up to between 20% and 25%. 55 IMPLAN, which stands for “IMpact Analysis for PLANning,” was developed by the USDA Forest Service. The Minnesota Implan Group (MIG) began work on the IMPLAN database in 1987 at the University of Minnesota. The MIG was formed as a private entity to develop and maintain IMPLAN data and software.

Gaming Expansion in New Jersey January 2016
93 | P a g e
Annual Economic Impact of Casino Resort Operations Employment Labor Income Output
Baseline
Direct Effect 24,599 $759,677,794 $469,587,613
Indirect Effect 5,712 $180,213,229 $360,278,573
Induced Effect 4,822 $209,507,334 $610,076,355
Total Effect 35,133 $1,149,398,357 $1,439,942,542
5 stay open
Direct Effect 12,009 $387,515,071 $264,141,091
Indirect Effect 3,091 $97,901,517 $196,634,824
Induced Effect 2,490 $108,202,464 $315,081,352
Total Effect 17,590 $593,619,053 $775,857,268
∆ from baseline (17,542) ($555,779,304) ($664,085,273)
4 stay open
Direct Effect 9,814 $317,923,437 $218,772,317
Indirect Effect 2,602 $82,266,172 $164,909,865
Induced Effect 2,053 $89,204,947 $259,761,486
Total Effect 14,469 $489,394,556 $643,443,669
∆ from baseline (20,664) ($660,003,801) ($796,498,873)
3 stay open
Direct Effect 8,315 $269,795,109 $188,377,317
Indirect Effect 2,244 $70,941,372 $142,180,163
Induced Effect 1,748 $75,952,512 $221,170,975
Total Effect 12,307 $416,688,993 $551,728,455
∆ from baseline (22,826) ($732,709,364) ($888,214,087)
Impact of Casino‐Resort Patron Spending Outside of the Casino Resorts The impact of casino resort closures, revenue declines and declines in visitation will be felt beyond just the casinos themselves and the vendors serving the casino resorts and their employees. There are myriad businesses in Atlantic County that are patronized by tourists and gamers coming to Atlantic City. If these visits decline notably in quantity, as is forecast with new competition from North Jersey, there are many businesses that will be at risk. Overnight visitors to Atlantic City frequently visit retail and F&B facilities outside of the casino properties. In our baseline scenario we estimate that there are approximately 19 million gamer visits, based on the forecast gaming win of $2.2 billion. If the average visitor spends $20 on F&B and $10 on retail during their visit off‐site, they would be spending over $570 million annually off‐site. If casinos are in North Jersey the forecast gaming win and patronage could decline by 48% to 63%. As a result, visitor off‐site spending could decline to a range of $214 million to $299 million.

Gaming Expansion in New Jersey January 2016
94 | P a g e
There are currently 149 shops on the Boardwalk, plus an additional 51 shops at the Playground at the Pier (with an additional three in the development phase), for a total of approximately 200 businesses servicing the tourism industry in Atlantic City.56 Most of these businesses operate year‐round, with 15% to 20% of the shops being seasonal, based on surveying conducted by GGH. There have already been significant closures of shops in the area between the now‐shuttered Showboat and Revel properties, as well as proximate to Trump Plaza. Additional retail/F&B shops are likely to be shuttered if additional hotel‐casinos close. These venues thrive on the critical mass of tourists and complementary Boardwalk attractions and shops. As the number of these venues declines, there may no longer be a critical mass, such that shops would close for the simple reason that the Boardwalk will lose its appeal as a tourist destination. The economic impact of these potential closures was not addressed in the economic impact calculations. However, for each shop that closes, several to dozens of employees could lose their jobs, and millions in revenues, earnings and sales taxes could be lost. GGH’s model forecasts a decline in visitation of 10 to 12 million gamers per year. If the average visitor spends $10 on the Boardwalk per visit (i.e. a t‐shirt or a beer and a slice of pizza), conceivably the decline in spending could be more than $100 million at these businesses. At an average revenue loss of over $500,000 annually, many could be expected to go out of business. As noted in our analysis, there are no benefit packages being proposed by the State to support these businesses or their employees. The Atlantic City Convention Center would also be indirectly impacted by having a much smaller room base if several hotel‐casinos on the Boardwalk close. They currently boast proximity to 14,000 hotel rooms in the market, including properties in the Marina area. If there are three to five hotel‐casino closures, this figure could potentially be halved, limiting the marketability of what is now the largest convention facility in the state. If it then becomes difficult to attract conventions, it makes it even more difficult for the hotel‐casinos to attract non‐gaming visitors. A decline in conventioneers would therefore also have an impact on Boardwalk retail and F&B vendors, accentuating the potential negative impacts of hotel‐casino closures. This decline in regional spending by tourists has ripple effects in the local economy just like the decline in casino spending. The impact model includes just the margin on retail sales, along with the F&B purchases as the direct impacts. Indirect impacts relate to inter‐industry purchases and ripple effects of the retail and F&B venues making purchases in the regional economy. The induced effects result from the spending by employees of these establishments within the Atlantic County economy. The result of new in‐state competition is projected to be an annual decline of between $364 million and $477 million in economic output, with a decline in regional labor income of $154 million to $201 million and an additional loss of 5,621 to 7,364 jobs. This reflects between 4.2% and 5.5% of the Atlantic County labor force.
56 Based on GGH physical survey of boardwalk on December 30, 2015

Gaming Expansion in New Jersey January 2016
95 | P a g e
Annual Economic Impact of Off‐Site Visitor Spending Employment Labor Income Output
Baseline
Direct Effect 9,565 $226,275,920 $468,418,655
Indirect Effect 862 $36,796,449 $123,540,404
Induced Effect 1,350 $58,642,792 $170,768,566
Total Effect 11,777 $321,715,161 $762,727,625
5 stay open
Direct Effect 5,000 $118,274,880 $244,843,376
Indirect Effect 450 $19,233,578 $64,574,818
Induced Effect 706 $30,652,706 $89,261,074
Total Effect 6,156 $168,161,164 $398,679,268
∆ from baseline (5,621) ($153,553,997) ($364,048,356)
4 stay open
Direct Effect 4,212 $99,628,308 $206,242,705
Indirect Effect 379 $16,201,317 $54,394,305
Induced Effect 594 $25,820,167 $75,188,660
Total Effect 5,185 $141,649,792 $335,825,670
∆ from baseline (6,592) ($180,065,369) ($426,901,955)
3 stay open
Direct Effect 3,584 $84,790,923 $175,527,515
Indirect Effect 323 $13,788,497 $46,293,502
Induced Effect 506 $21,974,837 $63,991,008
Total Effect 4,413 $120,554,257 $285,812,025
∆ from baseline (7,364) ($201,160,905) ($476,915,599)
The combined impact of the decline in casino‐resort spending, casino‐resort employee spending and casino‐resort patron spending within the local community could push local unemployment up over 25 percent, potentially up to 30 percent. These forecasts do not include the many other types of businesses that provide goods and services to tourists to Atlantic City, such as entertainment piers and the convention center. If there are no, or only one or two casino hotels left on the boardwalk, it is reasonable to assume mass closures of the many small businesses there and along Atlantic and Pacific Avenues. In total, we project annual economic activity in Atlantic County could decline by over $1 billion, to as much as $1.37 billion. Labor incomes could decline by over $709 million, to as much as $934 million annually. This reflects our estimate that between 23,164 and 30,190 jobs will be lost in Atlantic County, for which there are virtually no prospects for meaningful employment alternatives.
Annual Total Changes in Economic Activity Attributable to In‐State Competition Employment Labor Income Output
5 stay open (23,164) ($709,333,301) ($1,028,133,630)
4 stay open (27,256) ($840,069,170) ($1,223,400,828)
3 stay open (30,190) ($933,870,269) ($1,365,129,686)

Gaming Expansion in New Jersey January 2016
96 | P a g e
Governor Christie has proposed a retraining program to support the job losses attributable to the casino closures, but this ignores two significant issues:
1. Retraining only helps if there are jobs to transition to once someone has been trained
a. Training does not happen overnight, so these individuals could be unemployed for
very lengthy periods, during which time many would face foreclosure
b. This assumes that there will be businesses that people could transition to once
they become trained, though there are few businesses willing to move to an area
with exorbitant property tax rates and an unskilled population base; and
2. The proposal is for training programs for casino workers that lose their jobs. As
demonstrated in the preceding tables, we estimate that between 12,590 and 16,284 of
the job losses will be by casino‐hotel workers, or approximately 54% of the forecast job
losses. The additional 10,574 to 13,906 work elsewhere in the local economy servicing
the tourists and the vendors – there is no re‐training being proposed for these individuals.
An equally dire result of the closures will be what can happen to the housing market, which impacts the ability for regional governments to collect property taxes and provide public services. According to an October 2014 Press of Atlantic City article citing Daren Blomquist, VP of RealtyTrac, "While Blomquist isn’t familiar enough with the Atlantic City market to issue a prediction, he said there tends to be a strong correlation between job losses and foreclosures, citing studies he’s seen indicating one foreclosure for every six jobs lost."57 According to the US Census there are 127,375 housing units in Atlantic County. If there is one foreclosure for every six jobs lost, there would be between 3,861 and 5,032 new foreclosures attributable to North Jersey casinos opening, a ratio of between 1 in 25 and 1 in 33 homes. Currently the foreclosure rate is approximately 1 in 300, and that is among the highest in the country. Suffice to say, anything below a rate of 1 in 100 would be catastrophic to the market. South Jersey Transportation Authority – Toll Impacts The South Jersey Transportation Authority (SJTA) operates the Atlantic City Expressway, the major toll road feeding Atlantic City and serving as a connector to points south of Atlantic City (e.g. Ocean City, Stone Harbor, Avalon, Cape May, etc.) via the Garden State Parkway. Since 2006, toll traffic has declined from 66.8 million annually to less than 51 million in 2014, a 24% drop. Revenues were higher in 2014 than they were in 2006 only because the Authority significantly raised tolls along the Expressway in 2009. Despite this toll increase, total revenue from tolls has declined from a peak of $82.2 million in 2009 to less than $75 million in 2014. These declines have coincided with the decline in Atlantic City gaming revenues. Despite these declines, the SJTA remains dependent on toll revenues for its economic viability as the percentage of revenues from tolls has remained above 71% of total revenue.
57 Press of Atlantic City, October 12, 2014, http://www.pressofatlanticcity.com/business/real_estate/atlantic-county-foreclosure-rate-second-highest-in-nation/article_1c0c0964-5025-11e4-89a4-0be5ba708d21.html, accessed December 23, 2015.

Gaming Expansion in New Jersey January 2016
97 | P a g e
South Jersey Transportation Authority Toll Data
Toll Traffic Toll Revenue Revenue Per
Toll Total SJTA Revenues
% of Revenue From Tolls
2006 66,820,291 $59,477,706 $ 0.89 $ 83,676,217 71.1%
2007 66,728,789 $61,830,498 $ 0.93 $ 89,416,482 69.1%
2008 66,961,243 $63,476,068 $ 0.95 $ 91,605,689 69.3%
2009 58,432,437 $82,162,229 $ 1.41 $ 109,632,566 74.9%
2010 54,977,031 $78,914,150 $ 1.44 $ 108,654,245 72.6%
2011 53,382,708 $76,895,065 $ 1.44 $ 106,046,142 72.5%
2012 52,995,151 $77,569,176 $ 1.46 $ 107,021,581 72.5%
2013 52,079,719 $76,124,544 $ 1.46 $ 104,981,542 72.5%
2014 50,985,868 $74,956,149 $ 1.47 $ 105,082,910 71.3%
Source: SJTA 2014 annual report
Absent a toll increase (which will further erode drive‐in traffic to Atlantic City), the closure of additional casinos will lead to further declines in toll revenue. In order to determine the potential decline in SJTA revenues we performed the following regression analysis comparing the relationship between Atlantic City gaming revenues and toll traffic. The following chart indicates a correlation between these two variables of 94.4% meaning that over 94% of the decline in toll traffic can be explained by the decline in gaming revenue.
We use the formula depicted on the chart above and information from our gravity model analysis to forecast the potential impact of further market revenue declines on toll collections. With out‐of‐State completion, toll revenues are expected to decline 4.75% from current levels or approximately $3.5 million. With the closure of three to five casinos, toll revenues are expected to decline an additional $14.9 million to $18.4 million or 16% to 21% from baseline levels. This would be a disaster for the South Jersey transportation authority and absent a significant toll increase (of at least 25%), the SJTA will likely default on its debt obligations.
y = 0.0071x + 31,218,591.8660R² = 0.9438
‐
10,000,000
20,000,000
30,000,000
40,000,000
50,000,000
60,000,000
70,000,000
80,000,000
$‐ $2,000,000,000 $4,000,000,000 $6,000,000,000
Toll Traffic
AC Gaming Revenues
Linear Regression of Atlantic City Gaming Revenue to SJTA Toll Transactions

Gaming Expansion in New Jersey January 2016
98 | P a g e
Analysis of Toll Revenue Impacts
Luxury Tax and Casino Related Tax Impacts Atlantic City Luxury Sales Taxes are levied on the receipts from specified retail sales within Atlantic City, including sales of alcoholic beverages for on‐premises consumption; cover, minimum, or entertainment charges; room rental in hotels, inns, rooming, or boarding houses; hiring of rolling chairs, beach chairs, and cabanas; and tickets of admission within Atlantic City. Revenues are forwarded to the Sports and Exposition Authority for funding and operating the Atlantic City Convention facilities.58 The receipts fund over $240 million of Casino Reinvestment Development Authority Bonds as well as capital improvements to convention facilities and the marketing budget of Meet AC. A Fitch Ratings report from October of 2015 reported a 19.1% decline in luxury tax receipts through July of 2015 and an expectation of a 20% decline for the entire year. The Fitch report noted that luxury taxes had historically increased through the decline in gaming revenues but the closure of four casinos ended that trend. The decline in luxury tax revenues of 20% in 2015 far outpaced the City’s decline in gaming revenue during 2015. A further decline of 20% (based on additional casino closures) could reduce luxury tax receipts by an additional $5.6 million. The closure of three to five additional casinos would negatively impact the CRDA bonds and also significantly impact the CRDA’s ability to maintain the convention facilities in Atlantic City or continue to market the convention industry. Casinos also pay taxes on gross gaming revenue, parking fees and room fees. Based on our analysis depicted previously in this study, Casino Gross Gaming Taxes are expected to decline by $75 million (43%) to $98 million annually, parking fees by $1.6 million (43%) to $2.1 million annually and room fees by $3.3 million (37%) to $5.6 million annually. Municipal Budget Impacts The State of New Jersey provides aid to municipalities through several programs. The Consolidated Property Tax Relief Aid (CMPTRA) Energy Tax Receipts aid (ETR), Garden State Trust and Watershed Moratorium programs were all put in place to assist municipalities with offsetting property tax levies. These programs are all essentially fixed in terms of how much is provided to
58 http://www.state.nj.us/treasury/taxation/acluxury_over.shtml
Coefficient 0.007100 Intercept 31,218,592
Scenario Gaming Revenue Toll Traffic
Revenue
Per Toll Toll Revenue
Impact from
Current
Impact
from
Baseline
Current 2,619,250,906$ 49,815,273 1.47$ $73,235,216 0.00% N/A
Baseline 2,285,898,000$ 47,448,468 1.47$ $69,755,690 ‐4.75% 0.00%
3 Casino Closures 1,194,844,000$ 39,701,984 1.47$ $58,367,308 ‐20.30% ‐16.33%
4 Casino Closures 1,006,471,000$ 38,364,536 1.47$ $56,401,077 ‐22.99% ‐19.14%
5 Casino Closures 856,580,000$ 37,300,310 1.47$ $54,836,520 ‐25.12% ‐21.39%

Gaming Expansion in New Jersey January 2016
99 | P a g e
individual municipalities. The Transitional Aid program was put in place in 2011 to aid cities in distress and appropriates approximately $140 million annually to cities through an application process. There are two cycles for Transitional Aid, one for municipalities operating under a Calendar Year (CY) budget, and one for municipalities operating under a State Fiscal Year (SFY) budget. This program requires cities to adopt certain best practices and reforms that are designed to allow them to transition away from these grants. However, several distressed cities continue to receive grants under this program. Recent amendments to the program have been proposed through the legislature to benefit municipalities that lose commercial ratables that by themselves make up over 10% of the municipality ratable base. The following table lists the various cities that have received aid under the Transitional Aid program. The table indicates that Atlantic City had not received transitional aid prior to 2014 when it was approved for a $13 million grant. It applied for and received that amount again in fiscal year 2015‐2016. The table also indicates that certain cities (Camden, Paterson, Trenton and Union City) have remained in the program for long periods of time at very high levels of aid. These cities have annual municipal budgets ranging from $112 million to $246 million and are receiving aid ranging from 8.1% (Camden) to 15.8% (Union City) of their total municipal budgets. At one time, Camden received $69 million in transitional municipal aid.

Gaming Expansion in New Jersey January 2016
100 | P a g e
New Jersey Transitional Aid Recipients 2010‐2015 CY 2010 CY 2011 CY 2012 CY 2013 CY 2014 CY 2015
Asbury Park $11,750,000 $10,375,000 $3,500,000 $3,450,000 $2,300,000 $1,500,000
Atlantic City $13,000,000 $13,000,000
Beverly $337,000 $300,000
Bound Brook $960,000
Chesilhurst $200,000 $200,000
Haledon $300,000
Harrison $1,500,000 $1,500,000 $1,950,000 $1,950,000 $1,950,000 $1,600,000
Kearny $2,500,000 $1,500,000
Maurice River $135,000 $270,000 $265,000
Mount Arlington $500,000
Newark $10,000,000 $1,000,000
North Arlington $400,000
Penns Grove $750,000 $750,000 $600,000 $600,000 $600,000 $280,000
Plumstead $300,000 $140,000
Prospect Park $400,000 $100,000
Salem $300,000 $0 $300,000
Sussex $100,000
Washington $400,000
Subtotal $17,695,000 $13,195,000 $16,615,000 $6,477,000 $20,650,000 $19,180,000
SFY 2011 SFY 2012 SFY 2013 SFY 2014 SFY 2015 SFY 2016
Bridgeton $855,000
Camden $69,000,000 $61,400,000 $15,500,000 $15,000,000 $14,500,000 N/A
East Orange $2,850,000
Irvington $1,000,000
Lawnside $1,400,000 $700,000
Passaic $1,450,000
Paterson $22,325,000 $21,000,000 $22,400,000 $23,000,000 $25,000,000 N/A
Trenton $27,100,000 $22,000,000 $25,400,000 $22,860,000 $24,860,000 N/A
Union City $13,000,000 $12,000,000 $11,900,000 $18,000,000 $17,900,000 N/A
Subtotal $138,125,000 $117,100,000 $75,200,000 $78,860,000 $82,260,000 $0
Total $155,820,000 $130,295,000 $91,815,000 $85,337,000 $102,910,000 $19,180,000
Notes:
N/A ‐ Application made but no grant as of report date Source: State of NJ, Department of Community Affairs59
Of the 27 cities that have received aid under this program since 2011, seven have remained in the program to varying degrees, and another twelve were in the program for multiple years. This analysis makes clear that cities that require transitional aid usually do so for several years. Atlantic City currently receives approximately 5% of its budget in the form of transitional aid and based on the experience of distressed cities with similar budgets, that percentage could rise in the future to over 15%. All of Atlantic City’s aid has been incremental to amounts spent by the state from its general fund in prior years. With three to five casino closures and the attendant job losses, reduction in economic output and potential rise in foreclosures associated therewith throughout Atlantic County, there is a reasonable probability that the towns and municipalities surrounding Atlantic City could find themselves in financial distress as well. The following table
59 http://www.state.nj.us/dca/divisions/dlgs/resources/muni_stateaid.html

Gaming Expansion in New Jersey January 2016
101 | P a g e
lists those towns and their most recently published municipal budgets as well as the potential additional aid that might be required if these towns fall into distress.
Municipalities Surrounding Atlantic City Annual Budgets and Potential Aid
Source: Municipality websites (EHT is 2014 budget)
In addition to transitional aid provided to Atlantic City, if the towns surrounding Atlantic City fall into severe financial distress, additional transitional aid to the region could range from $8 million to $17 million. If Atlantic City is factored in, and if their aid amount rises to that of other distressed cities, total transitional aid to the Atlantic County region could range from $21 million to over $34 million annually. If Atlantic County government, with a budget of $200 million is factored in, total transitional aid to the region could range from $31 million to $54 million. School Budget Impacts Atlantic County is comprised of 25 public school districts, which in the 2014‐15 school year had an aggregate budget for K‐12 of approximately $910 million, down from $917 million in 2013‐14. Funding for these schools comes from a combination of Local taxes, State funding, federal grants and appropriations, with the Local (generally ranging from 56% to 60% of total revenues, or $510 million to $520 million annually for each of the past three years) and State components (generally ranging from 34% to 37% of total revenues, or $307 million to $315 million annually for each of the past three years, of which $282 million to $288 million is for operations, with the balance being for debt service and grants) being by far the largest shares. These totals include support for operations, as well as debt service and grants. Overall, State funding per capita for operations
2015 Municipal
Budget
Hamilton $25,920,923
Egg Harbor Township $38,512,282
Galloway Township $26,144,415
Pleasantville $29,011,293
Northfield $13,320,399
Absecon $10,718,915
Linwood $12,419,108
Somers Point $14,765,678
Total $170,813,013
Potentail Aid at 5% 8,540,651$
Potential Aid at 10% 17,081,301$
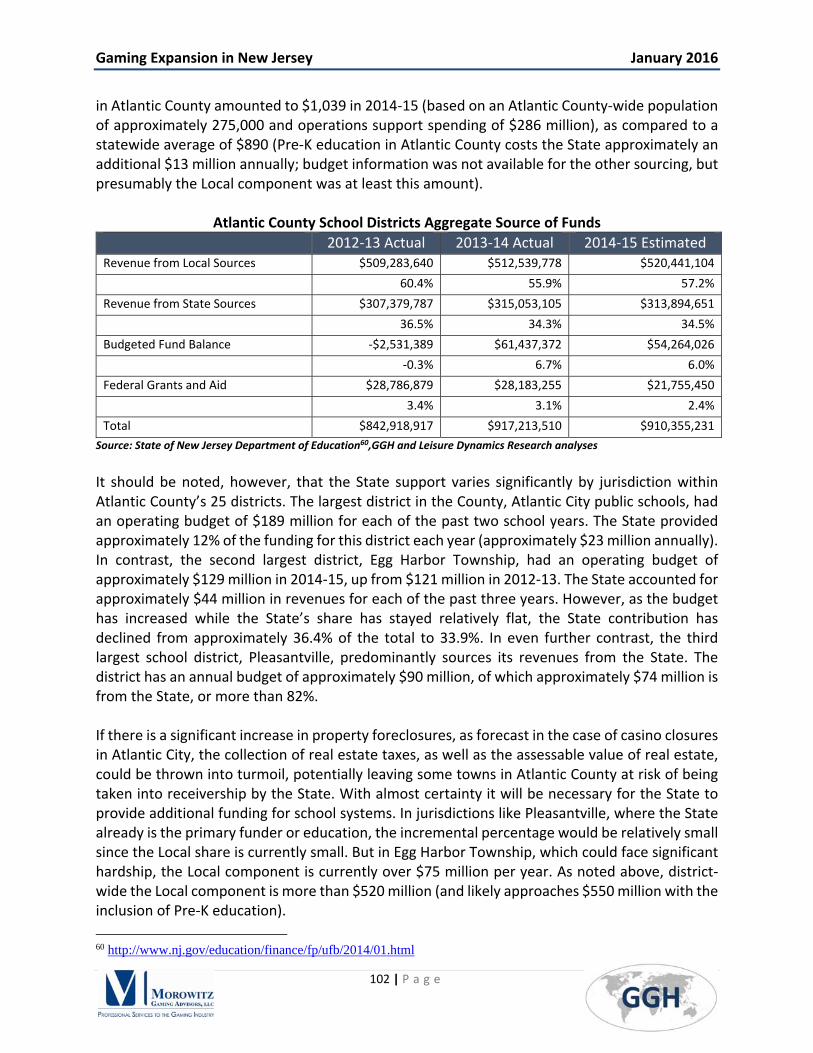
Gaming Expansion in New Jersey January 2016
102 | P a g e
in Atlantic County amounted to $1,039 in 2014‐15 (based on an Atlantic County‐wide population of approximately 275,000 and operations support spending of $286 million), as compared to a statewide average of $890 (Pre‐K education in Atlantic County costs the State approximately an additional $13 million annually; budget information was not available for the other sourcing, but presumably the Local component was at least this amount).
Atlantic County School Districts Aggregate Source of Funds
2012‐13 Actual 2013‐14 Actual 2014‐15 Estimated Revenue from Local Sources $509,283,640 $512,539,778 $520,441,104
60.4% 55.9% 57.2%
Revenue from State Sources $307,379,787 $315,053,105 $313,894,651
36.5% 34.3% 34.5%
Budgeted Fund Balance ‐$2,531,389 $61,437,372 $54,264,026
‐0.3% 6.7% 6.0%
Federal Grants and Aid $28,786,879 $28,183,255 $21,755,450
3.4% 3.1% 2.4%
Total $842,918,917 $917,213,510 $910,355,231
Source: State of New Jersey Department of Education60,GGH and Leisure Dynamics Research analyses
It should be noted, however, that the State support varies significantly by jurisdiction within Atlantic County’s 25 districts. The largest district in the County, Atlantic City public schools, had an operating budget of $189 million for each of the past two school years. The State provided approximately 12% of the funding for this district each year (approximately $23 million annually). In contrast, the second largest district, Egg Harbor Township, had an operating budget of approximately $129 million in 2014‐15, up from $121 million in 2012‐13. The State accounted for approximately $44 million in revenues for each of the past three years. However, as the budget has increased while the State’s share has stayed relatively flat, the State contribution has declined from approximately 36.4% of the total to 33.9%. In even further contrast, the third largest school district, Pleasantville, predominantly sources its revenues from the State. The district has an annual budget of approximately $90 million, of which approximately $74 million is from the State, or more than 82%. If there is a significant increase in property foreclosures, as forecast in the case of casino closures in Atlantic City, the collection of real estate taxes, as well as the assessable value of real estate, could be thrown into turmoil, potentially leaving some towns in Atlantic County at risk of being taken into receivership by the State. With almost certainty it will be necessary for the State to provide additional funding for school systems. In jurisdictions like Pleasantville, where the State already is the primary funder or education, the incremental percentage would be relatively small since the Local share is currently small. But in Egg Harbor Township, which could face significant hardship, the Local component is currently over $75 million per year. As noted above, district‐wide the Local component is more than $520 million (and likely approaches $550 million with the inclusion of Pre‐K education).
60 http://www.nj.gov/education/finance/fp/ufb/2014/01.html
Gaming Expansion in New Jersey January 2016
103 | P a g e
There is no evidence of significant outward migration as a result of the 2014 casino closures in Atlantic City, and if/when there is an epidemic of foreclosures in the event of additional casino closures post‐North Jersey casino additions, people will be reluctant/unable to move at that time either (total enrolment declined from 51,385 in 2012‐13 to 49,433 in 2014‐15) and any decline in student population might be cancelled out by inflation. As a result, it is possible that a significant share of this $520 million Local component would need to be funded by the State, i.e. taxpayers from throughout New Jersey. It should be additionally noted that North Jersey casino proposals provide for economic aid only to Atlantic City. Presently, Atlantic City accounts for 27.7%, or $144 million, of the $520 million in K‐12 Local funding. As a result, over $375 million in local funding represents school districts that are in towns that will be unassisted and negatively impacted by North Jersey casino competition. In short, districts outside of Atlantic City may need more than 2.5x more assistance than Atlantic City schools; at present there is no mechanism for this aid, but the amount clearly is not trivial. We note above that the State aid per capita in Atlantic County was $1,039 in 2014‐15. While this was greater than the statewide average for all counties, it was far from the highest. The average expenditure per capita in neighboring Cumberland County was $2,178, followed by $1,484 in Essex County, $1,445 in Passaic County, $1,367 in Salem County and $1,362 in Camden County (in total 7 counties out of 20 had a higher cost per capita). If the expenditure per capita in Atlantic County increased to a range more comparable to Essex, Passaic, Salem and Camden, i.e. an additional $375 per capita (to an average of $1,424), it would equate to $103 million in additional State aid. Increasing the amount to an expenditure in line with the Cumberland County expense would mean $313 million in additional State aid. The impact of the impending Atlantic County economic crisis in the face of casino closures would likely be within this broad range. Importance of Casino Jobs In the Atlantic County Community Fact Book ‐ June 2013, NJ Department of Labor and Workforce Development, forecasts were made for Atlantic County regarding the industries and occupations which would provide the greatest amount of job growth between 2010 and 2020. The top occupations were casino dealer and waiters/waitresses, each forecast to provide an average of 390 new jobs annually. As noted on the Atlantic County Economic Development website61, the majority of the top 25 ranking occupations are related to the hotel‐casino industry and other restaurant/hospitality/tourism‐related industries. Atlantic County was projected to have an average of 5,550 job openings per year through 2020, with the top 25 occupations accounting for approximately 46% of all job openings.62 Clearly, anything related to hotel‐casino job openings was over‐projected, given the job cuts related to the 2014 casino closures. Moreover, if there are additional casino closures later in the decade as related to North Jersey casino openings, the forecast would be even more erroneous. In that case, the job openings would be far outweighed by the number of job losses. It should be noted that the data demonstrates that there are few industries that casino workers that lose
61 http://www.acbiz.org/Facts Stats and Maps/occupation-outlook.asp 62 Ibid.

Gaming Expansion in New Jersey January 2016
104 | P a g e
their jobs can transition to. Beyond the hotel‐casino and other hospitality industries, the only occupations where there is forecast employment growth of more than 100 jobs per year are in retail sales, cashiers and registered nursing. Unless someone transitions into a management position in retail, the entry level salary will be close to minimum wage. A nursing position would likely be an impossible transition for a hospitality worker. In short, there are few alternative job opportunities forecast in Atlantic County through 2020 for non‐hospitality employment. Atlantic County is heavily reliant on the sustainability of the hospitality and tourism industry. Statewide Impacts While this economic impact forecast primarily addresses the potential impacts on the Atlantic County economy and the economies of cities and towns within Atlantic County, other parts of the state will also feel the impacts of the decline in Atlantic City hotel‐casino vendor spending, as well as from ripple effects of spending within Atlantic County. Some areas of the state will naturally benefit from having new gaming facilities in their area, but we note that these downturns should be netted against those gains. As noted earlier in this document, in‐state spending on vendors by the Atlantic City casino resorts amounted to $687 million in 2014, down from $849 million in 2013. Vendors in Atlantic County accounted for 71.2% of this total in 2013 and 69.6% in 2014. As a result, as a baseline we estimate the spending within New Jersey but outside of Atlantic County on vendors will be $201 million annually. However, if there is in‐state competition, we project that the in‐state spending by Atlantic City casinos outside of Atlantic County (not including spending by North Jersey casinos to in‐state vendors) could fall to a range of $81 million to $113 million (using a 70%/30% ratio of Atlantic/non‐Atlantic vendor spending, consistent with the 2013 and 2014 spending pattern, along with the forecast total vendor spending). The following table demonstrates the counties that would be most affected by this decline. Burlington, Gloucester, Salem and Camden Counties can each expect a direct impact decline of more than $10 million in vendor revenues as a result of North Jersey casino operations, with the impacts in Burlington and Gloucester each potentially exceeding $20 million.
Atlantic City Casinos – Vendor Spend by County Casinos remaining in Atlantic City
Future Baseline 5 casinos 4 casinos 3 casinos
Atlantic County Vendor Expenditures $469.6M $264.1M $218.8M $188.4M
Other County Vendor Expenditures $201.3M $113.2M $93.8M $80.7M
Burlington County $40.3M $22.6M $18.8M $16.1M
Gloucester County $36.1M $20.3M $16.8M $14.5M
Salem County $25.4M $14.3M $11.8M $10.2M
Camden County $23.2M $13.0M $10.8M $9.3M
Cumberland County $10.4M $5.9M $4.9M $4.2M
Other NJ Counties* $65.9M $37.1M $30.7M $26.4M
Source: New Jersey Casino Control Commission *In 2014 no other county accounted for more than $10M in vendor revenues.

Gaming Expansion in New Jersey January 2016
105 | P a g e
The decline in income for these vendor businesses will result in a decline in their spending power, as well as the spending of their employees. We do not have a breakdown of what industries this spending reflects, nor do we forecast it, but in general the economic multiplier for wholesale type businesses at a statewide level are in the range of 1.5 to 2.0, meaning that if there is approximately a $100 million decline in vendor spending in these other New Jersey counties, there could be an additional decline of $50 to $100 million in indirect and induced spending. Additionally, we noted earlier in this document that the overall impact within Atlantic County is forecast to be a decline of between $1.03 billion and $1.36 billion in output and $709 million to $934 million in labor earnings). The ripple effect of the spending within Atlantic County will extend beyond the county boundaries, such that neighboring counties and other parts of the state will feel an impact. By definition, statewide multipliers should be greater than those of counties within a state. The indirect and induced (ripple effects) at the Atlantic County level accounts for $229 million to $303 million of the Atlantic County labor earnings decline (the balance being the direct labor earnings decline), with $599 million to $709 million of the output decline being indirect or induced spending. This reflects an average output multiplier at the local level of approximately 1.58 at the Atlantic County level. If the statewide multiplier is 1.85, it would reflect an additional decline in economic activity of $275 million to $369 million for other counties in the state.63 These impacts would be incremental to the decline in non‐Atlantic County vendor spending addressed above; if there is approximately a $100 million decline in vendor spending outside of Atlantic County, a 1.85 multiplier would mean an overall $185 million impact of that decline. Thus, combined with the ripple effect of spending within Atlantic County, the overall decline in spending outside of Atlantic County could be in the range of $460 million to $554 million. Conclusion The Atlantic City market has scaled down to 8 casinos as a result of regional competition, but the remaining casinos have largely been able to reach a level of financial stability. Based on casino reporting and our estimates of third party vendors, we estimate that currently there are over 26,000 employees at the 8 properties. These properties (including third party vendors) spend over a half billion dollars annually in Atlantic County and $700 million in New Jersey on goods and services. The closure of 4 casinos in 2014 resulted in the loss of nearly 10,000 jobs in the industry, resulting in a shrinking labor force, combined with some moderate growth in retail and administrative type employment. However, these closures resulted in a growing foreclosure rate and a shrinking tax base, causing significant stress on local governments.
63 A May 2010 report prepared by Rutgers University (page 25) for the Casino Association of New Jersey entitled “The Contribution of the Casino Hotel Industry to New Jersey’s Economy” suggests that more than $850,000 worth of indirect and induced output is created from each $1 million in direct output from the Atlantic City casino industry. http://recon.rutgers.edu/wp-content/uploads/2014/03/RUTGERS-The-Contribution-of-the-Casino-Hotel-Industry-to-New-Jerseys-EconomyFinal-May-26-2010-Revision3.pdf.

Gaming Expansion in New Jersey January 2016
106 | P a g e
New casinos in North Jersey will create economic chaos to the Atlantic County region. Legislation proposed as part of the North Jersey casino effort purport to provide for some economic assistance to the City of Atlantic City and some free training to casino employees, but that barely scratches the surface of what would be needed to offset the negative impacts of North Jersey casinos on the region that it renders such economic assistance meaningless and inconsequential. The impact of casinos in North Jersey would be the likely closure of 3 to 5 casinos in Atlantic City. Between 12,500 and 16,000 jobs at the casino resorts (including third party vendors) would be lost, equating to an income loss for area residents of $370 million to $490 million. But this is only one piece of the story. Vendors will also suffer, as will businesses that sell to the vendors and the casino resort employees. Indirect and induced economic impacts of these closures could mean an additional 5,000 to 7,000 jobs lost by employees of ancillary industries, for a total decline in regional labor earnings of $555 million to $732 million. Nowhere in any pending legislation is there any discussion on how to mitigate the impact on these individuals. The decline in tourism will also mean a decline in visitor spending outside of the casino hotels, particularly in terms of resulting in an empty Boardwalk. There are currently approximately 200 restaurants and shops on the Boardwalk, including the Pier. We estimate that there are currently 19 million gamer visits per year spending an average of $30 per visit on retail and F&B off‐site, or $570 million annually. Based on our forecast of a 48% to 63% decline in visitation, this total could decline to a range of $214 million to $299 million. If $10 of this $30 reflects spending on the Boardwalk, it would equate to a $105 million (+/‐ $15 million) impact on Boardwalk businesses, or on average approximately a $500,000 decline per business. Many would likely be forced to close as a result, putting even more area residents out of work, most without any other job skills. Similarly, the Convention Center would be dysfunctional without the room supply. The closure of three to five casinos and the decline of Atlantic City’s gaming revenue would also impact the South Jersey Transportation Authority which is dependent on toll revenues for its operations and to fund its debt. We have established that there is a significant relationship between Atlantic City gaming revenues and toll receipts. As gaming revenues have fallen, toll traffic and receipts has fallen with them. By our estimates, SJTA toll receipts could fall by $11.4 million to $14.9 million if North Jersey gaming expansion is permitted. This decline would jeopardize the viability of the SJTA and require a significant toll hike. Similar to the decline in toll revenues, other taxes paid by the Atlantic City casinos would decline as well. We estimate that gaming revenue taxes would decline by $75 million to $98 million, luxury taxes could decline by $5.6 million and room and parking fees could decline by $3.3 million to $5.6 million and $1.6 million to $2.1 million respectively. The aforementioned job losses will translate into increased foreclosures, for which Atlantic County is already amongst the Nation’s highest. Experts suggest that there is one foreclosure for every six job losses. If there are over 20,000 jobs lost, the foreclosure rate could reach a level that would obliterate the housing market. In so doing, real estate values would plummet to a level

Gaming Expansion in New Jersey January 2016
107 | P a g e
whereby assessments would be well in excess of actual values and tax collections would likely decline. This would make attracting new businesses to the area even harder than it is now. As a result, providing training programs would be pointless, as it would only induce people to move away. Additionally, while training, these tens of thousands of individuals would have no income. In short, the area would be devastated. The City would get some relief, but there is no benefit provided to Atlantic County or surrounding Townships. They would all become incapable of providing public services and public safety with these cuts. In addition to the public services that are funded out of the General Funds, school districts throughout Atlantic County operate on an aggregate budget of nearly $1 billion annually, of which over $575 million comes from Local sources (cities, towns or counties). The inability to collect real estate taxes would result in an inability to pay for public schools, which would therefore require more State funding. Currently the State accounts for approximately one‐third of the funding for schools in Atlantic County. At present the State pays approximately $1,040 per capita in Atlantic County for educational funding in Atlantic County. Seven of the 20 other counties in the state receive more per capita. There is both the precedence, as well as the likely need, for the State to spend an additional $375 per capita for education (bringing it up to the average of Essex, Salem, Passaic and Camden Counties, but still well below Cumberland), which would equate to an additional $103 million. This may be a conservative estimate, as it would reflect less than a 20% shortfall in spending by the local jurisdictions. The amount could be as much as $300 million if it reached the per capita level of nearby Salem County. Most likely this additional funding would range between $100 million and $300 million annually. There will also be significant impacts to the state of New Jersey beyond Atlantic County. A potential shortfall in municipal tax receipts could lead to an increase in transitional aid to Atlantic County municipalities. This aid could total as much as $31 million to $54 million annually. The aforementioned school funding shortfall could result in a range of $100 million to $300 million of additional school aid for Atlantic County school districts. When spread amongst the residents of New Jersey, the impacts are significant. Additional state aid to school districts and local municipalities represent approximately $15 to over $40 annually per resident or a range of over $30 to over $80 annually for a typical household. As noted in the previous section of this report, lower spending at vendors in counties outside Atlantic County could result in reduced economic output outside of Atlantic County in the range of $460 million to $554 million. The reduction in economic output will have far reaching consequences. We estimate the impact of reduced economic output to residents outside Atlantic County at approximately $53 to $64 annually for every resident or over $110 to $130 per household in New Jersey annually. We summarize the impacts in the following tables:

Gaming Expansion in New Jersey January 2016
108 | P a g e
Summary of Regional Impacts on Jobs, Income and Economic Output
Job Losses Income Loss
Loss in Economic Output
Unemployment Rate
Direct Casino Impacts 12,500 to 16,000 jobs
$372 million to $490 million
Vendor Impacts 5,000 to 7,000 jobs
$185 million to $242 million
Total Regional Economic Impact from Casino 17,500 to 23,000
$556 million to $733 million
$664 million to $888 million 20% to 25%
Spending Outside Casinos 5,600 to 7,300
$153 million to $201 million
$364 million to $477 million
Total Regional Economic Impact with Casinos and Boardwalk
23,000 to 30,000
$709 million to $934 million
$1.0 billion to $1.36 billion 25% to 30%
Summary of Direct Casino Toll and Tax Related Impacts
SJTA Tolls Gaming Revenue Tax
Luxury Tax Room Tax Parking Tax
Total Impact $11.4 million to $14.9 million
$75 million to $98 million
$5.6 million
$3.3 million to $5.6 million
$1.6 million to $2.1 million
Summary of Potential Government Impacts
Transitional Aid
Range School Aid Range Total
Government Impacts $31 million to $54 million
$103 million to $313 million
$134 million to $367 million Annually
Potential Reduced Economic Output Beyond Atlantic County Region
Decline in Economic Output Outside Atlantic
County
Annual Impact Per Non‐Atlantic County Resident
Multiplier Impacts of Atlantic City Economic Decline to Rest of State
$275 million to $369 million $32 to $43
Direct, Indirect and Induced Impacts of Vendor Spending Declines Outside of Atlantic County $185 million $21
Total Decline Outside Atlantic County $460 million to $554
million $53 to $64
Gaming Expansion in New Jersey January 2016
109 | P a g e
IX. LIMITING CONDITIONS GGH has been requested by Resorts Casino Hotel to assess the impacts of gaming expansion in northern New Jersey on the gaming industry and economy of the Atlantic City region. Certain information included in this report contains forward‐looking estimates, projections, and/or statements. GGH has based these projections, estimates and/or statements on our current expectations about future events. These forward‐looking items include statements that reflect our existing beliefs and knowledge regarding the operating environment, existing trends, existing plans, objectives, goals, expectations, anticipations, results of operations, and future performance. Further, statements that include the words: “may,” “could,” “should,” “would,” “believe,” “expect,” “anticipate,” “estimate,” “intend,” “plan,” “project,” or other words or expressions of similar meaning have been utilized. These statements reflect our judgment on the date they are made and we have no duty to update such statements after the date of this report. Supply and demand projections are, by their very nature, only estimates of what may occur in the future. Any number of variables may change over time and methodologies that work under certain conditions may not work in other or changing conditions. Additionally, some of the assumptions used in our study may not materialize and unanticipated events and circumstances may occur; therefore, actual results achieved during the period of our analysis will vary from our projections. However, even if variations are significant, any form of casino gaming in North Jersey will destroy Atlantic City and the regional economy that depends on it. This will have a negative impact on the entire New Jersey economy as well. As noted in the introduction, the Advisors accept no liability in relation to the estimates or projections provided herein. GGH has no duty to update the conclusions in this report for events and circumstances occurring after the date of this report.
Gaming Expansion in New Jersey January 2016
110 | P a g e
X. APPENDIX – ABOUT THE AUTHORS OF THIS REPORT Cory H. Morowitz, MBA – Managing Partner, GGH / Morowitz Gaming Advisors, LLC, Atlantic City Cory Morowitz is Managing Partner of Morowitz Gaming Advisors, LLC, a gaming consultancy, and a partner in GGH with Global Gaming & Hospitality, LLC. He is the publisher and editor of the Morowitz Quarterly (on hiatus), and previously Industry Director of the Wharton Program for Gaming Executives. He is also a former adjunct professor on staff at Drexel University where he developed and taught a Masters Level course called “Casino Financial Analysis.” Mr. Morowitz received his Masters of Business Administration from the Wharton School of the University of Pennsylvania in 1996. He received his undergraduate degree with honors from the State University of New York, College at Oneonta, in Business Economics in 1981. For over thirty years Mr. Morowitz has advised gaming and other business clients on operations improvement, market entry and expansion, strategy, and finance. He has testified numerous times on valuation and business litigation. Mr. Morowitz is the author of a number of continuing education and masters level courses as follows:
Accounting and Financial Analysis for Non‐Accountants in the Hospitality Industry
Financial and Operations Analysis Techniques for Gaming Industry Professionals
Operations Management Techniques for Gaming and Hospitality Executives
Family Business Value Management – Growing the Value of Your Family Business
Ultimate Budgeting for Gaming Industry Professionals
Forecasting and Analysis Techniques for Gaming Industry Professionals
Drexel University – Casino Financial Analysis (Hospitality Masters Program) Mr. Morowitz lectures frequently on the topic of business valuation and business growth. He has presented at the following venues:
Global Gaming Expo (G2E) in 2002 and 2003 ‐ budgeting and forecasting
Global Gaming Expo (G2E) 2006 – Revenue Management
Global Gaming Expo (G2E) 2007 – Education and Gaming
Global Gaming Expo (G2E) 2008 – Sustainable cost cutting
Global Gaming Expo (G2E) 2008 – Succession planning
Global Gaming Expo (G2E) 2009 – Restructuring the Gaming Industry
Global Gaming Expo (G2E Asia) 2011 – Sustainable Cost Management
Global Gaming Expo (G2E) 2012 – Managing Corporate Cash
Gaming & Technology Conference in Atlantic City ‐ 2000‐2003
UNLV – Quarterly Seminars on Gaming Management
Hospitality Finance and Technical Professionals – 2001 Keynote Speaker on Finance and Strategy
Wharton School ‐ Guest lecturer for Marketing Strategy Class, fall 2005, 2006, 2007 and 2010
Rutgers Family Business Forum – Frequent lecturer on business growth and valuation

Gaming Expansion in New Jersey January 2016
111 | P a g e
Ultimate Budgeting for Gaming Industry Finance Professionals – 2004 and 2005 Atlantic City Convention Center and 2006 in Las Vegas at Green Valley Ranch and Venetian and in 2007 at UNLV
Drexel University, Casino Financial Analysis – Spring Quarter, 2011, Adjunct Professor and course developer
As Industry Director of the Wharton School Program for Gaming Industry Executives, Mr. Morowitz was responsible for conception and development of a comprehensive training program for senior gaming industry executives at the World’s premier business school. Mr. Morowitz is the publisher of the Morowitz Quarterly (currently on hiatus), an award winning gaming industry strategy and finance newsletter. He is also the author of numerous articles, studies and white papers. His articles have been published in The Morowitz Quarterly, Gaming Industry Observer and Global Gaming Business magazine. Previously, Mr. Morowitz was appointed Chief Financial Officer of a public gaming firm during its transition through bankruptcy. Mr. Morowitz was part of a team of executives that successfully reorganized the firms’ debt from $130 million to less than $26 million, preserved three Indian gaming contracts and the successful emergence from bankruptcy. Mr. Morowitz and his associates typically consult to the gaming industry on financial and strategic issues. Here is a sampling of the types of projects he has consulted on:
Feasibility, market and economic impact studies for new casinos in almost every U.S. market
Consultant and expert witness on major Atlantic City tax appeal case
Consultant on implementation of new customer service system that has revolutionized slot service in the gaming industry.
Determination of optimal customer service windows for new casino in Atlantic City
Design and implementation of employee scheduling and service systems in casinos
Market impact study for Delaware racino industry quantifying the impact of Pennsylvania gaming on existing racinos
Impact study on implementation of sports wagering in Delaware and testified to legislative committee
Study on behalf of market leading Atlantic City operator of internet gaming potential for the state of New Jersey
Internal audit and accounting outsourcing to Native American tribes and casinos throughout the United States
Pre‐opening activities including budgets and internal controls for several casinos in eastern U.S.
Investment optimization analysis for new casinos
Valuation analysis for termination of Indian Gaming contract rights and assistance with negotiation and buyout of partner
Stock buyback analysis for a public gaming firm
Part of three man team to lead a public gaming firm through bankruptcy reorganization and successful emergence from bankruptcy while keeping three tribal gaming management contracts in force
Co‐developed and launched a slot machine with Sands Casino and Alliance Gaming

Gaming Expansion in New Jersey January 2016
112 | P a g e
Strategic analysis for a Nevada based gaming firm whereby we quantified the impacts of closing one of its three casinos.
Developer of a gaming floor optimization product
Accounting due diligence for several casino acquisitions
Analysis of the impacts of a tax on promotional gaming credits on Pennsylvania casinos and the state of Pennsylvania
Strategic scenario and options analysis for a Midwest casino in order to quantify the strategic options associated with its two gaming licenses
Strategic planning facilitations for executive management teams of several casinos throughout U.S.
Buy side due diligence for several casino transactions

Gaming Expansion in New Jersey January 2016
113 | P a g e
Scott Fisher ‐ Leisure Dynamics Research, New Orleans Summary of Qualifications
Over 15 years experience in analyzing the global gaming market and financial performance of individual gaming and resort properties;
Experienced evaluator of market demand and risk for development in established and emerging markets, including large‐scale resort feasibility projects in:
Australia; Canada; Cambodia; C.N.M.I.; Cyprus; Germany; Hungary; Laos; Latvia; Macau; Myanmar; Philippines; Singapore; S. Korea; Spain; Taiwan; U.K.; U.S.; Vietnam
Broad experience working with senior gaming industry executives, investment banking analysts, governmental officials and tribal leaders.
President, Leisure Dynamics Research, LLC, New Orleans, LA 2009‐present
Established independent consultancy in leisure development projects and operations;
Performed gaming and hotel market assessments, financial forecasts and valuations, and marketing strategies for resorts worldwide;
Responsible for all aspects of LLC setup and operations. Co‐Owner and Managing Director of The Innovation Group, New Orleans, LA 1997‐2009
Arrived as an analyst with a microeconomics background and helped develop complex models to forecast demand, costs and economic impacts for a broad array of casino and resort amenities of all sizes for our clients;
Promoted from junior analyst position to Managing Director of a 28‐person consulting firm and manager of an office of nine employees, producing over 250 studies per year as a global group;
Spoke frequently on panels at U.S. and international gaming congresses;
Performed market analyses throughout the world, with specific emphasis on Macau and other Asian gaming markets, as well as established and emerging European markets;
Provided economic impact assessments and provided legislative testimony in support of gaming bills and referendums;
Provided calculations of IRR and ROI for development projects and cost estimation to determine project feasibility and development budgets;
Authored several articles published in Global Gaming Business;
Frequently interviewed for newspapers and magazines in the U.S. and Asia on gaming‐related issues, as well as on National Public Radio.
Research Analyst, Oakland Econometrics, New Orleans, LA 1993‐1997
Provided research assistance and wrote reports for small economics consultancy firm;
Provided economic impact analyses for the Louisiana Department of Tourism to justify annual advertising budget in excess of $10 million per year;

Gaming Expansion in New Jersey January 2016
114 | P a g e
Provided economic impact assessment for the City of New Orleans to justify allocations of State funds towards the metro area.
Published articles (partial list):
Global Gaming Business, March 2009 “Island Fever”, discussing legalization of gaming in Taiwan.
http://www.ggbmagazine.com/articles/Island_Fever;
Casino Design, 2008 Q&A interview “The Asian Experience”;
Global Gaming Business, December 2006 “Asian Excitement” discussing Macau’s parallel as the Las Vegas of Asia, and how other existing and emerging Asian markets compare to large U.S. markets.
Speaking/Presentation Experience (partial list):
2013 Southern Gaming Summit speaker, “Non‐Gaming Amenity Technology Changes, 2020”;
2010 Global Gaming Expo (G2E) speaker, “Singapore: Integrated Resort Model or Stand Alone Success?”;
2008 G2E Asia moderator “The Macau Market: How Much is Too Much?”;
2008 Southern Gaming Summit panelist, “Fighting for Finance”;
2007 G2E panelist in session “Emerging Gaming Markets Asia”, with presentation “Asian Gaming Expansion Potential Opportunities”;
2007 Goldman Sachs Investment Forum at G2E Asia “Betting the Bank: Profitability and Performance of the Asian Gaming Market”;
2005 G2E panelist “Meeting in Macau : A Report on the First Year of Expanded Gaming”;
2004 Asian Gaming Expo, Singapore, panelist on gaming market potential in emerging markets;
2004 G2E panelist “Macau: Explosive Growth, A Risky Experiment or Both?”;
2003 Racino, session on racino expansion;
2002 G2E, panelist on racino legislation and emerging markets. Educational background:
Freeman School of Business, Tulane University, New Orleans, LA – Executive MBA with Finance Concentration (2009‐2011); Beta Gamma Sigma honors;
Tulane University, New Orleans, LA – M.A. and Ph.D. in Economics – (1990‐1997);
Union College, Schenectady, NY ‐ BS in Mathematics/Economics (1985‐1989).