Galvanic Corrosion Behaviour of Ti and Ti6Al4V Coupled...
15
Int. J. Electrochem. Sci., 8 (2013) 406 - 420 International Journal of ELECTROCHEMICAL SCIENCE www.electrochemsci.org Galvanic Corrosion Behaviour of Ti and Ti6Al4V Coupled to Noble Dental Alloys Cristina Solá 1 , Armanda Amorim 2 , Ángel Espías 3 , Sofia Capelo 1,4 , João Fernandes 5 , Luís Proença 1,2 , Luis Sanchez 3 , Inês Fonseca 1,* 1 Centro de Ciências Moleculares e Materiais (CCMM), Departamento de Química e Bioquímica, Faculdade de Ciências da Universidade de Lisboa, Campo Grande, C8, 1749-016 Lisboa, Portugal. 2 Centro de Investigação Interdisciplinar Egas Moniz, Instituto Superior de Ciências da Saúde Egas Moniz, Caparica, Portugal. 3 Facultad de Odontología, Universidad de Barcelona, Spain 4 Escola de Ciências e Tecnologia, Universidade de Évora, Portugal 5 DEQ/ICEMS, Instituto Superior Técnico, Universidade Técnica de Lisboa, Lisboa, * E-mail: [email protected] . Received: 3 October 2012 / Accepted: 28 November 2012 / Published: 1 January 2013 This study aims to evaluate the electrochemical corrosion behaviour of titanium and Ti6Al4V alloy coupled to the following noble dental alloys: Pontor® 2, Cerapall® 2, V-Gnathos® Plus and Pagalin® 2. The study was conducted in artificial saliva, pH 7.1, at 37 , by linear sweep voltammetry, electrochemical impedance spectroscopy and chronoamperometry.The Rp values of the noble dental alloys varied from 10 4 to 10 5 Ω cm 2 . Data from E ocp curves, linear polarization resistance, Tafel plots and electrochemical impedance spectroscopy lead to the same order for the resistance against corrosion of the four noble alloys in artificial saliva. The order from the less to the more reactive alloy is: Cerapall ® 2 → Pontor ® 2 → V-Gnathos ® Plus → Pagalin ® 2. Values of the i couple , varying between 0.2 and 0.7 μA cm -2 , were obtained for the four noble alloys when coupled to pure titanium or to the titanium alloy, respectively. Among the couples studied the Pontor® 2 | Ti was found to be the more resistant galvanic couple, while the Cerapall® 2 | Ti6Al4V presents the lowest corrosion resistance. Keywords: Titanium, Ti6Al4V alloy, noble dental alloys, corrosion resistance, electrochemical techniques, galvanic couples. 1. INTRODUCTION Commercially pure titanium (CP Ti) and titanium based alloys have been widely used in restorative surgery, such as dental and orthopedic prostheses, due to their excellent mechanical
Transcript of Galvanic Corrosion Behaviour of Ti and Ti6Al4V Coupled...

Int. J. Electrochem. Sci., 8 (2013) 406 - 420
International Journal of
ELECTROCHEMICAL SCIENCE
www.electrochemsci.org
Galvanic Corrosion Behaviour of Ti and Ti6Al4V Coupled to
Noble Dental Alloys
Cristina Solá1, Armanda Amorim
2, Ángel Espías
3, Sofia Capelo
1,4, João Fernandes
5, Luís Proença
1,2,
Luis Sanchez3
, Inês Fonseca1,*
1 Centro de Ciências Moleculares e Materiais (CCMM), Departamento de Química e Bioquímica,
Faculdade de Ciências da Universidade de Lisboa, Campo Grande, C8, 1749-016 Lisboa, Portugal. 2 Centro de Investigação Interdisciplinar Egas Moniz, Instituto Superior de Ciências da Saúde Egas
Moniz, Caparica, Portugal. 3Facultad de Odontología, Universidad de Barcelona, Spain
4 Escola de Ciências e Tecnologia, Universidade de Évora, Portugal
5 DEQ/ICEMS, Instituto Superior Técnico, Universidade Técnica de Lisboa, Lisboa,
*E-mail: [email protected].
Received: 3 October 2012 / Accepted: 28 November 2012 / Published: 1 January 2013
This study aims to evaluate the electrochemical corrosion behaviour of titanium and Ti6Al4V alloy
coupled to the following noble dental alloys: Pontor® 2, Cerapall® 2, V-Gnathos® Plus and Pagalin®
2. The study was conducted in artificial saliva, pH 7.1, at 37 , by linear sweep voltammetry,
electrochemical impedance spectroscopy and chronoamperometry.The Rp values of the noble dental
alloys varied from 104 to 10
5 Ω cm
2. Data from Eocp curves, linear polarization resistance, Tafel plots
and electrochemical impedance spectroscopy lead to the same order for the resistance against corrosion
of the four noble alloys in artificial saliva. The order from the less to the more reactive alloy is:
Cerapall® 2 → Pontor
® 2 → V-Gnathos
® Plus → Pagalin
® 2. Values of the icouple, varying between 0.2
and 0.7 μA cm-2
, were obtained for the four noble alloys when coupled to pure titanium or to the
titanium alloy, respectively. Among the couples studied the Pontor® 2 | Ti was found to be the more
resistant galvanic couple, while the Cerapall® 2 | Ti6Al4V presents the lowest corrosion resistance.
Keywords: Titanium, Ti6Al4V alloy, noble dental alloys, corrosion resistance, electrochemical
techniques, galvanic couples.
1. INTRODUCTION
Commercially pure titanium (CP Ti) and titanium based alloys have been widely used in
restorative surgery, such as dental and orthopedic prostheses, due to their excellent mechanical

Int. J. Electrochem. Sci., Vol. 8, 2013
407
properties, good corrosion resistance, biocompatibility and biofunctionality in biological fluids, as it
has been well reported in the literature [1-28]. Ti6Al4V alloy can coexist with different metallic dental
superstructures and other dental restorations in a patient mouth. Under these conditions, galvanic
corrosion phenomena can occur and that possibility cannot be discarded when determining the
appropriate treatment for a specific patient [4, 6-8, 14, 17, 23, 27]. The Ti6Al4V alloy became popular
due its chemical resistance, mechanical strength, low toxicity, lightness and excellent biocompatibility.
It was the first Ti alloy to be registered as implant material [29].
Accordingly to Hsu et al. [13] until 2004 only a few articles on the corrosion behaviour of
Ti6Al4V implant alloy in human body fluid could be found in the literature [20-23], but the number
has increased in the last years [14-19, 24-28]. When producing a crown over a Ti or Ti6Al4V dental
implant, it is very common to use high noble alloys as intermediate layer between the implant and the
external porcelain layer. High noble alloys have a minimum of 60% content on noble metals (any
combination of gold, palladium and silver) have been tested [30-31 and references therein] They
usually contain a small amount of tin, indium and/or iron, which promote the formation of an oxide
layer, facilitating a chemical bond for the porcelain. They have relatively high strength, durability,
hardness and ductility. The presence of palladium imparts a white colour, even in small amounts, and
this element also imparts a high melting temperature and contributes to reducing the price of the alloy.
As mentioned in the literature many studies have proven the biocompatibility and suitability of
titanium, however it is also important to evaluate the galvanic corrosion process that may occur
particularly in vivo (see the review by Adya et al. [6]. As stated by Adya et al. [6], under certain
circunstances, the oral cavity can simulate an electrochemical cell with the less noble metal alloy
acting as anode and the more noble as cathode. A potential difference of a few or various mV may be
established as well as galvanic currents flowing through the saliva and the metallic contacts.
It is therefore very important to consider the possible galvanic couples and its electrochemical
behaviour. Ti like may others non-noble metallic materials is covered by a protective oxide layer, [10-
11, 14, 27, 32] although, termodinamically stable, however ions may be released through the passive
layer. Cortada et al. [7-8] have determined the metallic ions released in oral implants with
superstructures of different metals and alloys used in clinical dentistry.
The aim of this study was to evaluate and compare the electrochemical corrosion behaviour of
commercially pure titanium (CP Ti) and Ti6Al4V when coupled to the following commercially
available noble dental alloys: V-Gnathos® Plus, Pontor
®, Pagalin
® and Cerapall
® 2.
2. MATERIAL AND METHODS
2.1. Specimens
2.1.1. Composition of alloys
The composition of the four alloys is listed in Table 1. They are commonly used in prosthetic
dentistry, with V-Gnathos® Plus and Cerapall
® 2 being used as bonding alloys and Pontor
® 2 and
Pagalin® 2 as casting alloys.

Int. J. Electrochem. Sci., Vol. 8, 2013
408
Table 1 Composition of dental alloys (wt %).
Noble dental alloys Code Au Pt Pd Ag Cu In
Cerapall®
2 (C) 2.0 - 78.5 - 6.9 4.5
Pontor® 2
(PO)
72.0 3.6 - 13.7 9.8 -
V-Gnathos® Plus (VG) 85.9 11.7 - - - -
Pagalin® 2 (PG) 3.0 - 23.0 65.0 6.5 2.0
2.1.2. Preparation of specimens
Coupons of the alloys with an area of about 0.9 cm2 were soldered to a copper wire and
inserted into a mould of epoxy resin and then glued into a glass tube. The electric contacts were
insulated with Araldite®. The electrodes were successively polished with alumina pastes (ALPHA
Micropolish II, agglomerated, Buehler) of different grain sizes, 1.0, 0.3 and 0.05 m. A platinum grid
counter electrode and a commercial Ag|AgCl, 3M KCl, reference electrode completed the
configuration of a three-electrode electrochemical cell.
2.2. Test solution
The test solution used was artificial saliva with the composition given in Table 2, according to
Duffó et al. [33]. The test solution was prepared with reagent grade compounds and ultrapure water
(Milli-Q from Millipore®
. The pH was measured with a pH meter from Metrohm, model 620. A value
of 7.1 was obtained. All the experiments were conducted with the electrochemical cell in a
thermostatic bath at 37 .
Table 2. Composition of the artificial saliva [33]
Compounds NaCl KCl CaCl2
. 2H2O
KH2PO4 Na2HPO4
.12H2O
KCN citric
acid
(g L-1
) 0.600 0.720 0.220 0.680 0.856 0.060 0.030
2.3. Electrochemical methods
For each alloy, the open circuit potential (OCP) was acquired and recorded, over a period of 24
h, using a computer-controlled digital HP / Agilent multimeter, via the IntuiLink software.
Linear sweep voltammetry (LSV) and electrochemical impedance spectroscopy (EIS) were
performed via a potentiostat/galvanostat Autolab PGSTAT12 equipped with a Frequency Response
Analyzer (FRA2) from Metrohm Autolab B.V. Polarization curves recorded at 0.5 mV s-1
were used to
obtain the electrochemical parameters, relevant for the evaluation of the resistance against corrosion,
Int. J. Electrochem. Sci., Vol. 8, 2013
409
namely: E(i=0), Rp, corrosion current density, icorr, and corrosion potential, Ecorr. Polarization curves
covering a wider potential range were recorded at 1 mV s-1
.
Electrochemical impedance spectra were obtained by applying a 10 mV rms sinusoidal
potential wave around the open circuit potential, after keeping the electrode in the solution, at 37 ºC,
during a period of 10 minutes, at OCP. Frequencies ranging from 104 to 0.1 Hz were used.
The galvanic voltage and the galvanic current density of the various galvanic pairs were
measured in a two-compartment cell, at open and short circuit, respectively. The galvanic voltage was
measured over a period of 10 minutes by using a high-impedance digital multimeter, while the current
time transients were recorded during a period of 24 h. The chronoamperometric experiment was
performed using a potentiostat/galvanostat (Autolab PGSTAT12). For the various pairs under study the
charges under the current time transients were integrated over the studied time period (Qcouple from 0 to
24 h).
3. RESULTS AND DISCUSSION
3.1. Open circuit potential curves
Eocp curves for the four alloys in the test solution, at 37 ºC, recorded over a period of 24 h of
immersion, are given in Fig.1.
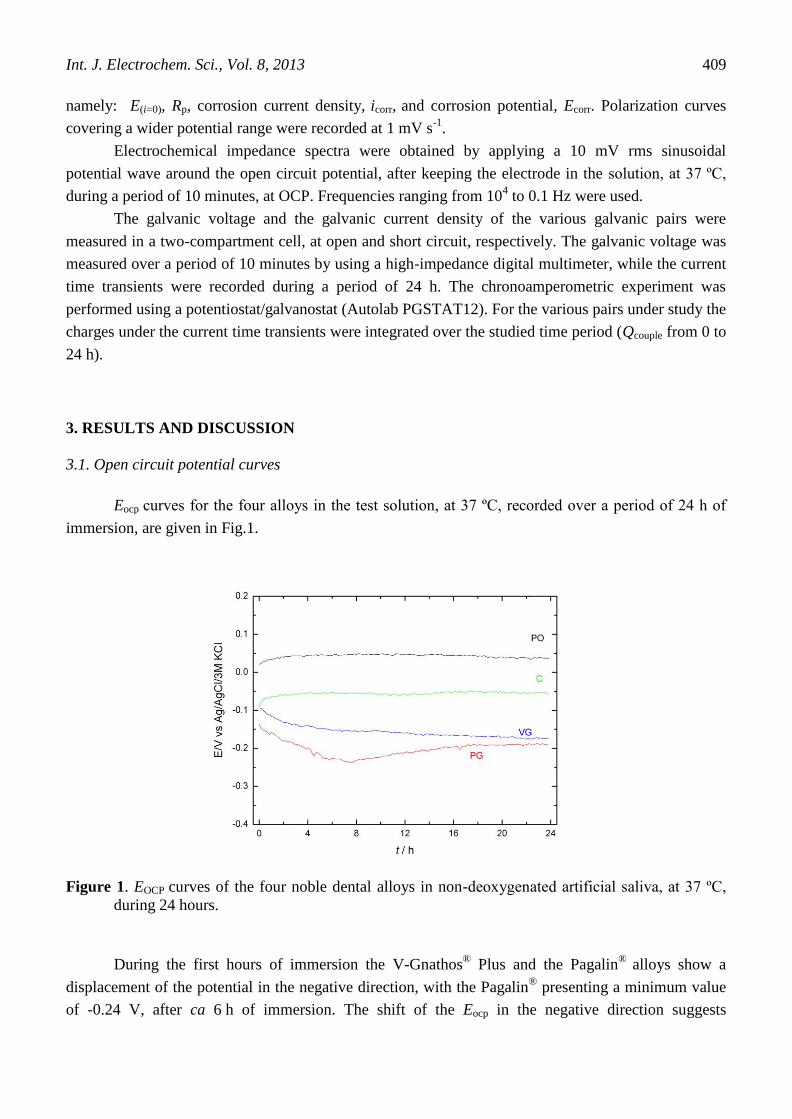
Figure 1. EOCP curves of the four noble dental alloys in non-deoxygenated artificial saliva, at 37 ºC,
during 24 hours.
During the first hours of immersion the V-Gnathos® Plus and the Pagalin
® alloys show a
displacement of the potential in the negative direction, with the Pagalin® presenting a minimum value
of -0.24 V, after ca 6 h of immersion. The shift of the Eocp in the negative direction suggests

Int. J. Electrochem. Sci., Vol. 8, 2013
410
dissolution of the air formed oxide film till the formation of a new oxide layer, which gives a quite
stable potential during the last 8 h of immersion. A similar behaviour has been reported by Bhola et al.
[6] for Ti immersed in normal saliva. The Pontor® 2 and the Cerapall
® 2 alloys have shown only a very
slightly displacement of the EOCP in the positive direction during the 1st hour of immersion. Then a
very stable and more positive potential was maintained for both alloys during the next 22 hours.
The average values of the EOCP corresponding to the last 6 hours of immersion were: +0.038
0.002 V; -0.054 0.002 V; -0.170 0.002 V and -0.190 0.002 V (vs Ag|AgCl), for the Pontor® 2,
Cerapall®
2, V-Gnathos®
Plus and Pagalin®
2, respectively. Since the more negative potentials values
mean less resistance against corrosion, then the order of resistance from the more to the less resistant is
the following: Pontor®
2> Cerapall®
2> V-Gnathos® Plus > Pagalin
® 2. Accordingly to the
thermodynamics, the high percentages of the high noble metals on the Pontor®
2´compositon may
justify its behaviour, however the V-Gnathos®
Plus contains also Au and Pt (high noble metals) even in
higher percentages and its resistance is lower than that of the Cerapall® 2 which contains mainly Pd.
This behaviour is most probably due not only to the percentages of Au and Pt on the alloy composition
(high noble alloys) but also to the presence of Cu, even when present in a small percentage. The lower
corrosion resistance of Pagalin® 2 is certainly explained by the high percentage of Ag in the alloy´s
composition. According to the Pourbaix´s diagrams [32] the stability region of Au, Pt and Pd occurs at
more positive potentials than that of Ag. As reported by Sastri et al. [34] on a study of silver-palladium
alloys the Ag rich composition shows little resistance.
3.2. Linear Polarization Curves
Fig. 2 presents a set of polarization curves recorded at 1 mV s-1
for the four noble alloys
immersed in artificial saliva, pH 7.1, at 37 ºC.
Figure 2. Linear polarization curves for the four noble dental alloys in non-deoxygenated artificial
saliva, at 37 ºC, recorded at 1 mV s-1
, after 20 minutes of immersion.

Int. J. Electrochem. Sci., Vol. 8, 2013
411
Data shows clearly, that under anodic potentiodynamic polarization, the Pontor® 2, V-Gnathos
®
Plus and Cerapall®
2 all present current plateaus, without any peak, and the current starting to rise
steeply at values ranging between +0.55 and +0.65 V. On the other hand, the LSV of the Pagalin®
2
shows a very well defined anodic peak at +0.24 V. This anodic peak is most probably related with the
high percentage of Ag in the respective alloy composition (65% Ag). During the anodic polarization
the formation of AgCl may occur, leading to the observed anodic peak. A similar peak has been found
by Sastri et al.[34] during the polarization of the one Ag-Pd alloy in chloride medium and, also, by
Hassan et al. [35] during the polarization of pure silver in chloride aqueous solutions.
The breakdown potentials, Eb, calculated from the polarization curves, are the followings:
+0.50, +0.55, +0.63 and +0.70 V, for the PG, VG, PO and C alloys, respectively. When comparing the
current densities, at the same polarization potential, for example at + 0.50 V, the kinetics of the
corrosion process are faster for the PG (24.5 μA cm-2
), followed by C (2.9 μA cm-2
), then PO (1.7 μA
cm-2
) and finally the VG (0.44 μA cm-2
).
Linear polarization curves, recorded at 0.5 mV s-1
, for the four alloys immersed in the artificial
saliva, pH 7.1, at 37 ºC, in the non-logarithmic and logarithmic forms, are given in Fig. 3. Data shows
clearly that, among the four noble alloys, the Pagalin®
2 is the more active alloy: its corrosion starts at
much more negative potentials and for the same potential it presents much higher current densities than
the others. Pagalin® 2 and V-Gnathos
® Plus are the most reactive followed by Pontor
® 2 and Cerapall
®
2.
A

Int. J. Electrochem. Sci., Vol. 8, 2013
412
B
Figure 3. Polarization curves for the four noble dental alloys in non -deoxygenated artificial saliva, at
37 ºC, recorded at 0.5 mV s-1
, after 20 minutes of immersion: (a) i vs. E; ( b) log i vs. E.
The polarization resistance (Rp = ΔE/Δi) at E(i=0) as well as the E(i=0) values obtained from the
analysis of the linear sweep polarization curves of Fig. 3a are summarized in Table 3.
Data shows clearly that the corrosion resistance decreases from the Pontor® 2 to the Pagalin
® 2.
The higher resistance of the PO alloy is most probably due to the high percentage of gold in the alloy´s
composition, while the lower resistance of PG can be attributed to its high contents of silver. The
corrosion parameters obtained from the Tafel analysis of the curves presented in Fig. 3b are given in
Table 4.
Table 3. Electrochemical data from the analysis of the EOCP versus time curves and from the linear
polarization curves recorded at 0.5 mV s-1
Noble dental alloys E(OCP, 24h)
(V vs. Ag|AgCl)
E(i=0)
(V vs. Ag|AgCl)
Rp
(kΩ cm2)
Pontor® 2 +0.038 ( 0.002) -0.010 (0.009) 520 (50)
Cerapall®
2
-0.054 (0.002) +0.020 (0.006) 190 (10)
V-Gnathos® Plus -0.170 0.002) -0.170 (0.007) 67 (4)
Pagalin®
2 -0.190 ( 0.002) -0.190 (0.004) 18 (2)
The high corrosion resistance obtained for the Pontor® 2 is in agreement with data by Cortada et al. [8]
who have concluded about the excellent corrosion resistance of alloys with high contents of gold.

Int. J. Electrochem. Sci., Vol. 8, 2013
413
Table 4. Data from Tafel analysis of the curves of Fig. 3b.
Noble dental alloys Cerapall®
2 Pontor® 2 V-Gnathos
® Pagalin
® 2
Ecorr (V vs. Ag|AgCl) +0.020 -0.040 -0.150 -0.200
icorr (μA cm-2
) 0.35 0.75 1.1 2.4
Values of icorr varying from 0.35 to 2.40 μA cm-2
were obtained. Corrosion current densities
and corrosion potentials are in agreement for the classification of the reactivity of the four noble alloys.
They can be ordered from the less to the more reactive as: C → PO → V-G → PG. In general all the
results are in full agreement leading to the conclusion that Pagalin® 2 presents the higher reactivity,
due to its high contents of silver.
3.4. Electrochemical Impedance Spectroscopy (EIS)
Electrochemical Impedance Spectroscopy has been widely used to evaluate the corrosion
resistance of dental alloys [36, 11, 14, 16, 18, 25 ]
A
B
Figure 4. (a) Nyquist diagrams for the four noble dental alloys in non-deoxygenated artificial saliva, at
37 ºC (pH=7.1; E = 10 mV; f = 0.1 to 104 Hz. E(i=0) (C) = +0.020; E(i=0) (PG) = -0.190; E(i=0)
(VG) = -0.170; E(i=0) (PO) = -0.010 V vs. Ag|AgCl); (b) Equivalent circuit used in the
electrochemical impedance data simulation.

Int. J. Electrochem. Sci., Vol. 8, 2013
414
Nyquist plots, obtained from the EIS data, for the four noble alloys in non-deoxygenated
artificial saliva, at 37 ºC, are given Fig. 4.
The electrochemical impedance data was fitted to the equivalent circuit of Fig. 4b by the use of ZView
software. This equivalent circuit accounts for the presence of a duplex oxide layer, with an inner
barrier film represented by film resistance R3 and film capacitance C, whereas the porous outer layer
accounts for the presence of a wall capacitance, represented by the constant phase element Q (where
the element impedance is related with its characteristic parameters, Yo and n, by )
and an additional solution resistance inside the pores, R2. The overall solution resistance is represented
by R1. This circuit is normally associated to duplex oxide films where the outer porous region is much
thicker than the inner barrier layer. Thus, the resistance of the pore wall has not been included, as it
would be so high that its contribution to the circuit may be discarded. All the data sets were
successfully fitted to this circuit, as documented by the low ² values, in the range of 10-4
, and the
fitted parameters for the different electrical components of equivalent circuit are shown in Table 5.
Table 5. Values of the electrical components of the equivalent circuit of Fig. 4a.
Noble dental
alloy
Cerapall®
2 Pontor® 2 V-Gnathos
®
Plus
Pagalin® 2
R1/(Ω cm2) 119 129 121 140
R2/(kΩ cm2) 58.6 81.2 45.0 10.7
Y0/(S cm-2
sn) 2.76 x 10
-5 1.87 x 10
-5 2.96 x 10
-5 6.91 x 10
-5
n 0.83 0.85 0.83 0.78
R3/(kΩ cm2) 88.0 83.7 8.5 6.1
C /(μF cm-2
) 20.2 15.0 23.3 152
χ2 2.6x10
-4 2.9x10
-4 1.2x10
-4 1.5x10
-4
The Cerapall®
2 and the Pontor® 2 alloys present quite high values for the inner barrier film
resistance R3 (ca. 80 kΩ cm2), while the V-Gnathos
® Plus and the Pagalin
® 2 present values one order
magnitude lower (6-8 kΩ cm2). For the corresponding film capacitance, the Pagalin
® 2 shows the
highest value (152 μF cm-2
), while all the others present much lower values, ranging between 15 and
20 μF cm-2
. Assuming the model of a parallel plate capacitor, the capacitance of an insulating oxide
film is given by C=o/d, where o is the vacuum permittivity (8.85 pF/m), the dielectric constant of
the oxide film and d its thickness. Thus, the higher capacitance obtained for Pagalin® 2 may indicate a
thinner film, which is in agreement with its lower resistance.
As mentioned above, the pores wall capacitance is represented in the circuit by a constant
phase element, Q. It is normally assumed that a CPE showing n values above 0.75 represents a
distributed capacitance and in that case the value of Yo may be taken as an estimate of the capacitance
value. Thus, again taking into account the C=o/d relationship, the higher Yo values obtained for the
Pagalin® 2 pores wall (in comparison with the other alloys) may indicate the presence of a thinner and,
in principle, less protective porous oxide film. This is also confirmed by the lower value obtained in
this case for the additional solution resistance R2, which might be due to a lower thickness of the pores.

Int. J. Electrochem. Sci., Vol. 8, 2013
415
Thus, from both the inner barrier oxide and porous oxide parameters, the Pagalin®
2 may be
considered the alloy that shows the lowest resistance to corrosion.
Assuming that the Rp value corresponds to the real component of the impedance at very low
frequencies (Rp=R1+ R2+ R3), then the behaviour of the four alloys according to the analysis of the EIS
data is in agreement with the order given by the analysis of the polarization curves, where the alloys
may be ranked according to their increased reactivity as Cerapall® (C) → Pontor® 2 (PO) → V-
Gnathos® Plus (VG) → Pagalin® 2 (PG).”
3.5. Galvanic corrosion analysis
Figure 5 gives the log i versus E plots of the polarization curves (ν= 0.5 mV s-1
) of the
commercially pure titanium, Ti6Al4V alloy and V-Gnathos® Plus alloy. From the intersection point of
the anodic sides of the pure Ti (CP Ti) and Ti6Al4V alloy and the cathodic branch of the V- Gnathos®
Plus alloy, all recorded under the same experimental conditions, it was possible to obtain an estimated
value of the galvanic current density (icouple) and the galvanic corrosion potential (Ecouple) of the
corresponding galvanic couples.
Figure 5. log i (i/ A cm
-2) vs. E plots for the galvanic couples: Cerapall
® 2 | Ti6Al4V and Cerapall
® 2
| CP Ti.
The same analysis procedure was carried out for the others noble dental alloy | CP Ti and noble
dental alloy | Ti6Al4V couples being the correspondent data displayed in Table 6.
Values of the icouple, varying between 0.2 and 0.7 μA cm-2
, were obtained for the four noble
alloys coupled to pure titanium or to the titanium alloy. For all the couples slight lower values were
obtained when the alloy was coupled to the pure titanium.
Arslan [14] has found for the Ti6Al4V/Au couple in Ringer´solution at 37 ºC, values of Ecouple
and icouple the order of -0.020 V vs Ag/AgCl and 5.6 μA cm-2
, respectively. Then one may conclude

Int. J. Electrochem. Sci., Vol. 8, 2013
416
that the materials under study, alloys containing high noble (Au and Pt) and noble metals (Ag and Pd)
when coupled to the titanium alloy give values only slightly lower than those reported by Arlsan et al.
[14] for the AuTi6Al4V couple.
Table 6. Electrochemical parameters, obtained from the mixed potential theory, for the galvanic
couples: noble dental alloy | Ti6Al4V and noble dental alloy | CP Ti.
Galvanic couples Ecouple
(V vs. Ag|AgCl)
icouple
(μA cm-2
)
Cerapall® 2 | CP Ti -0.051 0.6
Cerapall® 2 | Ti6Al4V -0.064 0.7
Pontor® 2 | CP Ti -0.104 0.4
Pontor® 2 | Ti6Al4V -0.116 0.5
V-Gnathos® Plus | CP Ti -0.166 0.2
V-Gnathos® Plus | Ti6Al4V -0.173 0.2
Pagalin® 2 | CP Ti * *
Pagalin® 2 | Ti6Al4V * *
*it is not possible to apply the method
3.6. Galvanic cell voltage
Under certain circunstances, the oral cavity can simulate an electrochemical cell with the less
noble metal alloy acting as anode and the more noble as cathode. Therefore a potential difference of a
few or various mV may be established as well as galvanic currents flowing through the saliva and the
etallic contacts.
Figure 6. Cell potential vs. time for the galvanic couples: Pontor® 2 | Ti6Al4V; Pontor
® 2 | CP Ti;
Pagalin® 2 | Ti6Al4V and Pagalin
® 2 | CP Ti.

Int. J. Electrochem. Sci., Vol. 8, 2013
417
The galvanic cell voltage (potential difference) of the noble dental alloys when coupled to CP
Ti and Ti6Al4V alloy was recorded, over a 10 minute period. Figure 6 gives the variation of the
galvanic cell potential for the Pagalin® 2 and Pontor
® 2 alloys coupled to CP Ti and Ti6Al4V. The data
obtained for all galvanic cells represented by noble dental alloy | CP Ti and noble dental alloy
Ti6Al4V couples is displayed in Table 7.
The Pontor® 2 | Ti and Pontor
® 2 | Ti6Al4V couples present the more negative galvanic
voltages, starting with values of -0.143 and -0.129 V and then keeping an almost constant value, over
a period of 10 minutes, -0.120 and -0.104 V, respectively. The galvanic voltage for the of Pagalin | Ti
couple starts with a value of -0.175 V and changes abruptly to +0.050 V, during the first 5 min, then
varies less abruptly reaching +0.100 V, after the 10 minutes. The higher and more positive values of
the galvanic cell potential for the Pagalin | Ti couple is in agreement with previous data. Effectively,
the Pagalin corrodes easily due to the high percentage of Ag.
3.7. Galvanic current vs. time
Ti like many others non-noble metallic materials is covered by a protective oxide layer,
although termodinamically stable, however ions may be released through the passive layer. Cortada et
al. [8] have obtained for the titanium oral implant coupled with chromium-nickel alloy a high quantity
of ions released, while for the implant coupled with titanium superstructure a very low value of ions
released have been obtained. This behaviour is indicative of high corrosion resistance.
Fig. 7 presents the galvanic current vs. time curves, recorded at OCP for the Pagalin®
2 | Ti and
Pontor® 2 | Ti couples immersed in the artificial saliva solution, at 37 ºC. The galvanic current density
of the various galvanic pairs was also evaluated and integrated over a 24 h time period.
Figure 7. Current vs. time curves over an immersion period of 24 h for the galvanic couples Pontor
® 2
| CP Ti and Pagalin® 2 | CP Ti.
Table 7 gives the electrochemical parameters obtained from the analysis of the data of Figs. 6
and 7, for all the studied galvanic couples. The transients show a steep decrease during the first instants

Int. J. Electrochem. Sci., Vol. 8, 2013
418
leading to very low and steady currents, over periods of 24 h. The steady values are of the order of 5
μA cm-2
for the Pagalin® 2 | Ti couple and almost zero for the Pontor
® 2 | Ti couple.
Table 7. Cell potential (E), integrated galvanic current density (Qgcouple) over 24 h and maximum
galvanic current density (imax) for the galvanic couples: noble dental alloy | Ti6Al4V and noble
dental alloy | CP Ti couples.
Galvanic couples E(0 min)
(mV)
E(10 min)
(mV)
Qcouple
(mC cm-2
)
imax
(μA cm-2
)
Pontor® 2 | Ti6Al4V -129 -104 2 7
Pontor® 2 | CP Ti -143 -120 2 4
V-Gnathos® Plus | Ti6Al4V -13 27 135 29
V-Gnathos® Plus | CP Ti 42 72 126 22
Cerapall®
2 | Ti6Al4V 79 -29 90 36
Cerapall®
2 | CP Ti 31 -10 113 28
Pagalin®
2 | Ti6Al4V 55 104 * *
Pagalin®
2 | CP Ti -144 98 367 44
The analysis of the data in Table 7, considering the maximum currents gives the following
order for the reactivity of the dental alloys coupled to pure titanium from the less to the more reactive:
PO (4 μA cm-2
) → VG (22 μA cm-2
) → C (28 μA cm-2
) → PG (44 μA cm-2
). When coupled to the
titanium alloy the order is the same, but the values of the icouple are slightly higher: PO (7 μA cm-2
) →
VG (29 μA cm-2
) → C (36 μA cm-2
). Considering the charges, Qcouple, the couple Pagalin® 2 | CP Ti
shows the most high values: 367 mC cm-2
against 2 mC cm-2
for the Pontor® 2 | CP Ti couple.
It should be stated that among the commercially high noble alloys studied in this work, V-
Gnathos® Plus (VG) contains the highest percentage of gold (ca 86%) and a relative small percentage
of platinum (ca 10%); Pontor®
(PO) is a gold-platinum-silver-copper alloy, with 72% of gold;
Cerapall®
2 (C) is a palladium (78%) based alloy with a small percentage of gold, copper and indium
and, finally, Pagalin® (PG) is a silver- palladium-copper-gold alloy with a quite high percentage of
silver (65 %).
4. CONCLUSIONS
Concerning to the corrosion resistance of the four noble dental alloys studied, when immersed
in artificial saliva, pH 7.1, at 37 , the order from the less to the more reactive is: Cerapall® 2 →
Pontor® 2 → V-Gnathos
® Plus → Pagalin
® 2. The electrochemical corrosion behaviour exhibited when
coupling the different noble dental alloys with pure titanium or Ti6Al4V alloy depends not only from
the noble dental alloy composition but also on the nature of the used Ti-based dental material. Among
the alloys studied and according to the electrochemical data obtained the Pontor® 2 | CP Ti was the

Int. J. Electrochem. Sci., Vol. 8, 2013
419
couple that delivers the lowest galvanic currents (4 μA cm-2
), while the Pagalin® 2 | CP Ti galvanic
couple delivers currents ten times higher (44 μA cm-2
).
ACKNOWLEDGMENTS
This investigation has received the financial support of “Fundação para a Ciência e Tecnologia’”
(FCT) to “Centro de Ciências Moleculares e Materiais” (CCMM) and to “ Instituto de Ciência e
Engenharia de Materiais e Superficies” (ICEMS). “Instituto Superior de Ciências da Saúde Egas
Moniz” has contributed with the dental materials.
References
1. R. W. Schutz and D. E. Thomas, Corrosion of titanium and titanium alloys, in Metals Handbook,
9th ed, vol. 13, Metals Park, OH, ASM International, 1987
2. R. Van Noort, J. of Mater. Sci. 22 (1987) 3801
3. E. P. Lautenschlage and P. Monogham, Int. Dent. J., 43 (1993) 245
4. S. H. Tuna, N. Pekmez, F. Keyf and F. Canli, J. Appl. Oral Sci., 17 (2009) 467
5. R. Bhola, S. M. Bhola, B. Mishra and D. L. Olson, Trends Biomater. Artif. Organs, 25 (2011) 34
6. N. Adya, M. Alan, T. Ravindranath and B. Saluja, The J of Indian Prosthodont. Soc., 3 (2005) 126
7. M. Cortada, L. Giner, S. Costa, F. J. Gil, D. Rodriguez and J. A. Planell, Biomed. Mater. Eng., 7
(1997) 213
8. M. Cortada, L. L. Giner, S. Costa and F. J. Gil, J. Mater. Med., 11 (2000) 287
9. M. V. Popa, E. Vasilescu, P. Drob, C. Vasilescu and I. Demetrescu, J. Mater. Sci.: Mater. Med., 19
(2008) 1
10. T. Hanawa, K. Asami and K. Asaoka, J. Biomed. Mat. Res., 40 (1998) 530
11. H-H. Huang, Electrochim. Acta, 47 (2002) 231
12. G. T. Burstein, C. Liu and R. M. Souto, Biomater., 26 (2005) 245
13. R. W-Wei Hsu, C-C Hsu Yang, C-An Huang and Yi-Sui Chen, Mater. Sci. Eng. A, 380 (2004) 100
14. H. Arslan, H. Çelikkan, N. Örnek, O. Ozan, A. E. Ersoy and M. L. Aksu, J. Appl. Electrochem.,
38 (2008) 853
15. T. P. Chaturvedi, Indian J. Dent. Res., 20 (2009) 91
16. S. L. Assis, S. Wolynec and I. Costa, Electrochim. Acta, 51 (2006) 1815
17. M. Yamazoe, Dent. Mater. J., 29 (2010) 542
18. R. Bhola, S. M. Bhola, B. Mishra and D. Olson, Int. J. Electrochem. Sci., 5 (2010) 917 19. M. Atapour, A. L. Pilchak, M. Shamanian and M. H. Fathi, Mater. & Des., 32 (2011) 1692
20. M. A. Khan, R. L Williams, D.F. Williams, Biomater., 17 (1996) 2117.
21. J. E. Gonzalez and J. C. Mirza-Rosca, J. Electroanal. Chem., 471 (1999) 109
22. N. Schiff, B. Grosgogeat, M. Lissac and F. Dalard, Biomater., 23 (2002) 1995
23. R. Venegopalan and L. C. Lucas, Dent. Mater., 14 (1998) 165
24. M. V. Popa, I. Demetrescu, D. Iordachescu, A. Cimpean, E. Vasilescu, P. Drob, C. Vasilescu and
M. Istratescu, Mater. and Corros., 58 (2007) 687
25. N. A. Al-Mobarak, A. A. Al-Swayih and F. A. Al-Rashoud, Int. J. Electrochem. Sci., 6 (2011)
2031
26. M. Sharma, A. V. R. Kumar and N. Singh, J. Mater. Sci.: Mater. Med., 19 (2008) 2647
27. T. Hanawa, S. Hiromoto, K. Asami, O. Okuno and K. Azaoka, Mater. Trans., 43 (2002) 3000
28. G. Ciurescu, J. Izquierdo1, J.J. Santana1, D. Mareci, D. Sutiman, S. González and R.M. Souto, Int.
J. Electrochem. Sci., 7 (2012) 7404
29. T. Kitamura, M. Yoshinari and Y. Oda, Shikwa Gakuho, 102 (2002) 665
30. J. M. Meyer and L. Reclaru, J. Mater Sci.: Mater. Med., 6 (1995) 534

Int. J. Electrochem. Sci., Vol. 8, 2013
420
31. F. Rosablino, S. Delsante, G. Borzone and G. Scavino, J. Mater. Sci.: Mater. Med., 23 (2012) 1129
32. M. Pourbaix, Biomater., 5 (1984) 122
33. G. S. Duffó and E. Q. Castillo, Corros., 60 (2004) 594
34. S. Sastri, T. K. Vaidyanathan and K. Mukherjee, Metall. Trans. A, 13A (1982) 313
35. H. H. Hassan, M. A. M. Ibrahim, S. S. El Rehim, M. A. Amin, Int. J. Electrochem. Sci., 5 (2010)
294
36. F. Mansfeld, C.C. Lee and P. Kovacs. Application of electrochemical impedance spectroscopy
(EIS) to the evaluation of the corrosion behavior of implant materials, in P. Kovacs, N. S.
Istephanous (Editors), Compatibility of biomedical implants, The Electrochemical Society,
Pennington, New Jersey, 1994
© 2013 by ESG (www.electrochemsci.org)