Gait Analysis Using a Shoe-Integrated Wireless...
25
> PAPER IDENTIFICATION NUMBER: TITB-00066-2004 < 1 Abstract—We describe a wireless wearable system capable of measuring many parameters relevant to gait analysis. The system was developed to provide quantitative gait analysis outside the confines of the traditional motion laboratory. The extensive sensor suite includes three orthogonal accelerometers, three orthogonal gyroscopes, four force sensors, two bi-directional bend sensors, two dynamic pressure sensors, as well as electric field height sensors. The “GaitShoe” was built to be worn on any shoe, without interfering with gait, and was designed to collect data unobtrusively, in any environment, and over long periods. The calibrated sensor outputs were analyzed and validated with results obtained simultaneously from The Massachusetts General Hospital Biomotion Lab. The GaitShoe proved highly capable of detecting heel-strike and toe-off, as well as estimating foot orientation and position, inter alia. Index Terms—Biomedical measurements, legged locomotion, multisensor systems, telemetry. I. INTRODUCTION LINICAL gait analysis is the investigation of the pattern of walking. At present, gait analysis is primarily carried out in one of two ways: in a motion laboratory, with full analysis of the motion of body segments using highly accurate computer-based force and optical tracking sensors, or in an office with the clinician making visual observations. The first method is expensive, requires the maintenance of a dedicated Manuscript received May 31, 2004. This work was supported in part by CIMIT under Grant X, by the Whitaker Foundation, and by the Things That Think Consortium at the MIT Media Lab. Manuscript received May 31, 2004. This work was supported in part by CIMIT under Grant X, by the Whitaker Foundation, and by the Things That Think Consortium at the MIT Media Lab. S.J.M. Bamberg was a graduate student with Harvard / Massachusetts Institute of Technology Division of Health Sciences & Technology, Cambridge, MA 02139 USA. She is now an assistant professor with the Department of Mechanical Engineering, University of Utah, Salt Lake City, 84112 USA (phone: 801-585-9081; fax: 270-512-4297; e-mail: [email protected]). A.Y. Benbasat is a graduate student with the MIT Media Lab, Cambridge, MA 02139, USA (e-mail: [email protected]). D.M. Scarborough is Assistant/Clinical Director of the Massachusetts General Hospital Biomotion Laboratory, Boston, MA 02114, USA (e-mail: [email protected]). D.E. Krebs is professor, MGH Institute of Health Professionals and director of the Massachusetts General Hospital Biomotion Laboratory, Boston, MA 02114, USA (e-mail: [email protected]). J.A. Paradiso, is an associate professor with the MIT Media Lab, Cambridge, MA 02139, USA (e-mail: joep@media. mit.edu). motion lab, and uses cumbersome equipment attached to the patient, but produces well-quantified and accurate results for short distance ambulation. The second method is inexpensive and does not require special equipment, but requires additional time from the clinician, and the results are qualitative, unreliable, and difficult to compare across multiple visits. There is a need for an alternative analysis method that is capable of providing quantitative and repeatable results over extended time periods. The ability to perform long term gait monitoring will facilitate diagnosis of chronic walking problems. In addition, a system which can quantitatively analyze gait for patients who do not have access to motion analysis labs, either due to living in economically disadvantaged, rural, or underdeveloped settings, offers clinicians and patients new opportunities for diagnosis and treatment. As such, there has been considerable previous work in both research and commercial spheres focused on the development of more mobile methods of analyzing gait. The obvious advantage of directly measuring the pressure distribution beneath the foot has driven many of the early shoe-based systems. The shrinking size of data storage has further encouraged the development of untethered systems. In 1990, Wertsch et al [1] developed a system for measuring the pressure distribution beneath the foot, using seven force sensitive resistors (FSRs), located under seven high pressure points corresponding to the five metatarsal heads, the big toe, and the heel center. This tethered system gave detailed information about the pressure distribution beneath the foot, and provided those results in real-time. Data collected with their device were used to quantify the differences between shuffling and walking [2], and between sensate and insensate (no or little sensation in the foot) subjects [3]. In the latter study, the results led to a caution against drawing conclusions from a short segment of gait analysis in patients with sensory impairment, as a large step- to-step variation was found, emphasizing the need for a device capable of collecting data over a long time period. In 1994, Hausdorff et al [4] developed a system capable of detecting several of the temporal gait parameters. Their system consisted of an insole with two FSRs positioned under the heel and in the general area under the toes and metatarsals, ultimately connected to a circuit board and battery pack worn on the ankle [5], [6]. Validation of the data by comparison to Gait Analysis Using a Shoe-Integrated Wireless Sensor System Stacy J. Morris Bamberg, Member, IEEE, Ari Y. Benbasat, Student Member, IEEE, Donna Moxley Scarborough, David E. Krebs, and Joseph A. Paradiso, Member, IEEE C
Transcript of Gait Analysis Using a Shoe-Integrated Wireless...

> PAPER IDENTIFICATION NUMBER: TITB-00066-2004 <
1
Abstract—We describe a wireless wearable system capable of
measuring many parameters relevant to gait analysis. The system was developed to provide quantitative gait analysis outside the confines of the traditional motion laboratory. The extensive sensor suite includes three orthogonal accelerometers, three orthogonal gyroscopes, four force sensors, two bi-directional bend sensors, two dynamic pressure sensors, as well as electric field height sensors. The “GaitShoe” was built to be worn on any shoe, without interfering with gait, and was designed to collect data unobtrusively, in any environment, and over long periods. The calibrated sensor outputs were analyzed and validated with results obtained simultaneously from The Massachusetts General Hospital Biomotion Lab. The GaitShoe proved highly capable of detecting heel-strike and toe-off, as well as estimating foot orientation and position, inter alia.
Index Terms—Biomedical measurements, legged locomotion, multisensor systems, telemetry.
I. INTRODUCTION LINICAL gait analysis is the investigation of the pattern of walking. At present, gait analysis is primarily carried out
in one of two ways: in a motion laboratory, with full analysis of the motion of body segments using highly accurate computer-based force and optical tracking sensors, or in an office with the clinician making visual observations. The first method is expensive, requires the maintenance of a dedicated
Manuscript received May 31, 2004. This work was supported in part by
CIMIT under Grant X, by the Whitaker Foundation, and by the Things That Think Consortium at the MIT Media Lab.
Manuscript received May 31, 2004. This work was supported in part by CIMIT under Grant X, by the Whitaker Foundation, and by the Things That Think Consortium at the MIT Media Lab.
S.J.M. Bamberg was a graduate student with Harvard / Massachusetts Institute of Technology Division of Health Sciences & Technology, Cambridge, MA 02139 USA. She is now an assistant professor with the Department of Mechanical Engineering, University of Utah, Salt Lake City, 84112 USA (phone: 801-585-9081; fax: 270-512-4297; e-mail: [email protected]).
A.Y. Benbasat is a graduate student with the MIT Media Lab, Cambridge, MA 02139, USA (e-mail: [email protected]).
D.M. Scarborough is Assistant/Clinical Director of the Massachusetts General Hospital Biomotion Laboratory, Boston, MA 02114, USA (e-mail: [email protected]).
D.E. Krebs is professor, MGH Institute of Health Professionals and director of the Massachusetts General Hospital Biomotion Laboratory, Boston, MA 02114, USA (e-mail: [email protected]).
J.A. Paradiso, is an associate professor with the MIT Media Lab, Cambridge, MA 02139, USA (e-mail: joep@media. mit.edu).
motion lab, and uses cumbersome equipment attached to the patient, but produces well-quantified and accurate results for short distance ambulation. The second method is inexpensive and does not require special equipment, but requires additional time from the clinician, and the results are qualitative, unreliable, and difficult to compare across multiple visits.
There is a need for an alternative analysis method that is capable of providing quantitative and repeatable results over extended time periods. The ability to perform long term gait monitoring will facilitate diagnosis of chronic walking problems. In addition, a system which can quantitatively analyze gait for patients who do not have access to motion analysis labs, either due to living in economically disadvantaged, rural, or underdeveloped settings, offers clinicians and patients new opportunities for diagnosis and treatment.
As such, there has been considerable previous work in both research and commercial spheres focused on the development of more mobile methods of analyzing gait. The obvious advantage of directly measuring the pressure distribution beneath the foot has driven many of the early shoe-based systems. The shrinking size of data storage has further encouraged the development of untethered systems.
In 1990, Wertsch et al [1] developed a system for measuring the pressure distribution beneath the foot, using seven force sensitive resistors (FSRs), located under seven high pressure points corresponding to the five metatarsal heads, the big toe, and the heel center. This tethered system gave detailed information about the pressure distribution beneath the foot, and provided those results in real-time. Data collected with their device were used to quantify the differences between shuffling and walking [2], and between sensate and insensate (no or little sensation in the foot) subjects [3]. In the latter study, the results led to a caution against drawing conclusions from a short segment of gait analysis in patients with sensory impairment, as a large step-to-step variation was found, emphasizing the need for a device capable of collecting data over a long time period.
In 1994, Hausdorff et al [4] developed a system capable of detecting several of the temporal gait parameters. Their system consisted of an insole with two FSRs positioned under the heel and in the general area under the toes and metatarsals, ultimately connected to a circuit board and battery pack worn on the ankle [5], [6]. Validation of the data by comparison to
Gait Analysis Using a Shoe-Integrated Wireless Sensor System
Stacy J. Morris Bamberg, Member, IEEE, Ari Y. Benbasat, Student Member, IEEE, Donna Moxley Scarborough, David E. Krebs, and Joseph A. Paradiso, Member, IEEE
C

> PAPER IDENTIFICATION NUMBER: TITB-00066-2004 <
2
data collected simultaneously from commercial force plates indicated their device measured stance duration to within 3% and swing and stride duration within 5% as compared to the results from the force plate. Their insole has been used to find patterns in gait [7], which they have been able to use to predict the maturation of gait in children [5], and the likelihood of falling in the elderly [6], demonstrating that only two FSRs are necessary to distinguish some types of abnormalities in gait from healthy gait.
More recent work resulting in shoe-based sensor systems with increasingly sophisticated measurement capabilities have been driven by subspecialty interests in gait analysis. For diabetics, Morley et al [8] developed an insole-based system to quantify the conditions inside the shoe, with the goal of being able to predict progression of skin breakdown and ulceration in diabetic patients with peripheral neuropathy. Their laminated insole had pressure, temperature and humidity sensors designed to investigate the conditions at the foot interface, and was connected to an electronics module and batteries located in a plastic enclosure strapped to the calf of the subject. In initial work with their device, they detected quantitatively distinct variations in pressure patterns that corresponded to different activities, and were able to correlate their results with previous studies [9].
Another area of research driving the development of devices capable of capturing information about gait is neuroprosthetics for assisted walking. Neuroprosthetics require inputs to trigger, e.g., functional electrical stimulation (FES) used to stimulate muscles that assist walking. Pappas et al first developed a device consisting of three FSRs located on an insole (one under the heel, and two at the first and fourth metatarsal heads), and a gyroscope attached to the back of the shoe, placed such that the sensing axis was perpendicular to the sagittal plane [10]. With this system, they implemented a pattern recognition algorithm that used data from the FSRs and the gyroscope to define the transitions between two distinct phases (stance, swing) and two distinct events (heel-off, heel-strike). Their algorithm was validated by comparison to results from a commercial motion analysis system using optical motion analysis (a Vicon 370 from Oxford Metrics Ltd.). As compared with the commercial system, their algorithm achieved a 99% detection rate for normal subjects and a 96% detection rate for subjects with impaired gait, with a latency under 90 ms; these results demonstrated that on-shoe systems with gyroscopes and FSRs are able to achieve comparable results to commercial optical systems. More recent work by Pappas et al has resulted in an insole-only system where the gyroscope and a microcontroller have been embedded in the insole [11]. Using the results from their previous work, the system was tested on two subjects with incomplete spinal injury resulting in drop-foot. The system was used to trigger functional electrical stimulation (FES), and demonstrated a functional benefit of using it for both subjects, while walking horizontally, uphill, downhill, and while sitting and standing.
Other research platforms include instrumented walkways [12], “piezo-dyanomometric” platforms [13], or instrumented
floors [14], [15]. Such systems can determine parameters relating to the pressure distribution, as well as about stance and swing duration, but cannot provide information about the motion of the foot above the platform. In addition, research platforms have been developed to recognize gait without instrumenting the subject (generally motivated for use as a biometric identifier), primarily by videotape analysis [16]-[19], but also through the use of radar [20].
Commercial systems are numerous, and cover a wide range of applications, from tap-dance [21] to golf-swing analysis [22]. A very popular application is the use of inertial sensors to provide athletes with information, particularly for runners, such as the products available from Acceleron [23], Reebok (the Traxtar) [24], FitSense [25], Vectrasense [26], and Adidas [27], [28]. NCSA’s Cyberboots use a pressure sensor array in an overshoe to provide walking interaction in a virtual reality environment [29]. For medical applications, Tekscan and Clevemed, among others, have developed insoles which measure pressure distribution [30], [31]. In addition, MiniSun markets “The IDEEA LifeGait System”, which uses the outputs of accelerometers placed on various parts of the body with “artificial intelligence” algorithms to determine a number of parameters relating to gait and motion [32].
Finally, the research presented in this paper grew out the Expressive Footware project developed by Dr. Paradiso and students in the Responsive Environments Group at the MIT Media Lab [33]. The Expressive Footware project resulted in a pair of running shoes that were each equipped with a wireless sensor board and an instrumented insole. Each insole measured dynamic pressure at the heel, bidirectional bend of the insole, the height of each foot above a conducting mat on the floor, and had three FSRs (two placed roughly at the medial and lateral metatarsal heads, and one outside the shoe, mounted at the toe). Each sensor board was permanently attached to the lateral side of the shoe, and contained a gyroscope for the angular rate of the foot about the vertical axis, a three-axis compass to determine the orientation of the foot relative to the Earth's local magnetic field, two axes of acceleration (the two axes in the plane of the sensor card), and three axes of shock acceleration. An integrated sonar receiver on each sensor board, in conjunction with four sonar transmitters on the floor, provided the position of each foot in the plane of the floor. This system was built for control, not for measurement; the sensor outputs were used to directly control real-time musical outputs, generated by a computer that interpreted the base-station data stream with an elaborate rule base. Dancers wore this highly instrumented shoe and the outputs of the sensors generated interactive music. It reached high acclaim in the dance community, and was recognized with the Discover Award for Technical Innovation in 2000 [34].
The research described in this paper sought to create a system to provide instrumented wireless gait analysis outside of traditional, expensive motion labs. Such a system has the potential to be highly informative by allowing data collection throughout the day in a variety of environments, thus providing a vast quantity of long-term data not obtainable with

> PAPER IDENTIFICATION NUMBER: TITB-00066-2004 <
3
current gait analysis systems. The “GaitShoe” system has been designed with components configured to minimally affect gait, and is readily fixed on typical athletic shoes. The GaitShoe was replete with sensors, with the goal of measuring more parameters than would otherwise be necessary for any one application, essentially providing a wearable podiatric laboratory. The power source was contained on-shoe, and wireless protocols were used to communicate between shoes and to transmit the data to a base-station; no cables of any sort were attached to either shoe.
This research evaluated the system both in persons with normal gait, and in elders with Parkinson’s disease (PD). The results were validated by comparison with data collected simultaneously by the system in use at the Massachusetts General Hospital Biomotion Laboratory.
II. HARDWARE / SENSORS
A. Sensor Selection The sensors used in the GaitShoe were selected with the
goal of creating a highly instrumented system capable of sensing many parameters which characterize gait. The sensors are summarized in Table I; reference [35] contains details of the implementations. A block diagram of the GaitShoe components is shown in Figure I, and a schematic is shown in Figure II, with labels indicating relevant anatomical markers.
For analysis of the dynamic motion of the foot, two dual-axis accelerometers and three gyroscopes were placed at the back of the shoe, oriented such that the individual sensing axes were aligned along three perpendicular axes, allowing measurement of linear acceleration and angular velocity in three dimensions; a device capable of all six measurements is called an “inertial measurement unit” (IMU). The dual axis accelerometer used was the ADXL202E, from Analog Devices [36]. The ADXL202E is a small, low-power, micro-electro-mechanical system (MEMS) accelerometer, with full-scale range of ±2g. This type of accelerometer measures both dynamic and static acceleration, thus, the orientation of the accelerometer must be determined so that the static gravity contribution can be subtracted from the total output. The relative orientations between the accelerometers and between the accelerometers and the shoe were determined using the gravitational vector. This application used two types of gyroscopes: the Analog Devices MEMS-based ADXRS150 gyroscope [37] (an early demo version of the ADXRS150 was used; it has the same specifications as the version now available), and the Murata vibrating-reed-based ENC-03J gyroscope [38]. The relative orientations between the gyroscopes were not determined.
To assess the timing parameters and pressure distribution, force sensitive resistors (FSRs) and polyvinylidene fluoride (PVDF) strips were placed under the foot. An FSR is a sensor whose electrical resistance decreases as the applied load increases. Two sizes of FSRs manufactured by Interlink Electronics were used [39]: two sensors with a diameter of 5 mm were placed underneath the heel pad, one medially and the other laterally, and two sensors with a diameter of 12.7
mm were placed under the first and fifth metatarsal heads (each subject’s foot was palpated and inked, and the ink was transferred to paper; these markings were used to orient the location of the FSRs, and the PVDF strips, in the insole). The PVDF strips are piezoelectric sensors, and were configured to provide an output corresponding to dynamic pressure. Two PVDF strips, part LDT0 made by Measurement Specialties [40], were used to measure the dynamic force applied across the sensor, and were placed under the heel and the great toe.
A bi-directional bend sensor was used to analyze flexion during gait. Two FLX-01 sensors, a uni-directional bend sensor manufactured by The Images Company [41], were placed back to back, and a differential amplifier was implemented to combine the individual outputs into a bi-directional bend output. One of the bend sensors was located at the back of the heel, and held next to the shin by an anklet to provide information about plantar flexion and dorsiflexion. The second bend sensor was located in the insole to measure the flexion at the metatarsal-phalangeal joint.
An electric field sensor was developed during the latter part of the project, using an electric field imaging device (MC33794DH) manufactured by Motorola for occupant detection in automotive seat applications [42]. This sensor was added to investigate the utility of using a more direct method of measuring the height of the foot above the floor, via capacitive loading used in testing to measure the height of the heel above floor.
B. Physical Implementation The hardware was designed to accommodate the sensors
located beneath the foot, all of the electronics, including the sensors located at the back of the shoe, an antenna for the wireless transmission, and the power supply. These requirements resulted in the design of the GaitShoe system, as shown in Figure II.
The GaitShoe system was comprised of two shoe modules and a base-station. Each shoe module consisted of an instrumented insole placed beneath the foot, and an attachment that mounted to the back of the shoe. The instrumented insoles contained the force sensitive resistors, the polyvinylidene fluoride strips, one bend sensor, and part of the electric field sensor; the other bend sensor was connected to the insole, but placed behind the shin and held in place with an ankle strap, and an additional part of the electric field sensor was placed underneath the shoe. A sample insole is shown in Figure III.
The shoe attachments contained the IMU sensors, microcontroller (Silicon Labs C8051F206 [43]), wireless transceiver (RF Monolithics DR3000-1 [44]), and antenna, power supply, and all of the required conditioning electronics; these were implemented on a “stack” of printed circuit boards attached at a right angle to the Power board, which contained voltage regulators and connections to a 9V battery [45]. The shoe attachments were designed such that the bulk of the volume was located behind the heel, so as to have a minimum effect on foot motion. The attachment was made from 0.125 inch sheets of polyethylene terephthalate glycol (PTG), a thermoformable, machinable, and shatter-resistant material. A
> PAPER IDENTIFICATION NUMBER: TITB-00066-2004 <
4
photo of the attachments and insoles on a pair of shoes are shown in Figure IV.
The base-station consisted of a metal box, with an antenna mounted externally, containing the circuit board with the microcontroller and the power board, plus an additional board with a MAX233 serial line level converter chip. A BNC connector provided a method of input from the Massachusetts General Hospital (MGH) Biomotion Laboratory's (BML) equipment via an opto-isolated trigger connected to an input pin on the microcontroller to align the time-scales of the two individual systems.
The microcontroller in the base-station looped through a simple time-division multiplexing routine:
1. Transit mode: Send hex byte 6C. 2. Receive mode: Listen for 1.7 ms. 3. Transit mode: Send hex byte E8. 4. Receive mode: Listen for 1.7 ms.
The left shoe microcontroller looped through the following routine:
1. Sample data from all sensors. 2. Receive mode: Listen until hex byte 6C received. 3. Transit mode: Send data.
The right shoe microcontroller followed the same overall routine as the left, but listened until hex byte E8 was received in step 2. Thus, each shoe collected analog data from the sensors while the other was sending, then waited for its personal code to transmit the data to the base-station. The outputs of the sensors were all normalized to a scale of 0 to 1 by the maximum 12-bit analog-to-digital converter (ADC) value (i.e. the uncalibrated outputs were divided by 4095). The receive line on the base-station was connected directly to the serial converter, resulting in immediate transmission of the data to the computer. Each shoe sent a full update every 13.4 ms, corresponding to a data transmission rate of approximately 75 Hz.
III. SUBJECT TESTING OVERVIEW
A. Testing Systems Volunteers were recruited for subject testing to collect data
for the validation of the GaitShoe sensor data. The subject testing involved placing the GaitShoe instrumentation on the subjects' own walking shoes, with the insole inside the shoe and the shoe attachment mounted to the posterior aspect of each shoe. Every subject underwent simultaneous gait evaluation using the MGH BML Selspot II (Selective Electronics, Partille, Sweden) data acquisition system.
The Selspot II serially sampled up to 64 infrared LEDs, arranged in arrays, at a rate of 152 Hz. The LED arrays were placed on eleven body segments (bilaterally: feet, shanks, thighs, arms; and, the pelvis, trunk, and head). The TRACK kinematic data analysis software package was used to generate photostereogrammetric reconstruction of the 3-D positions of the LEDs and to define the six degree of freedom kinematics of the arrays [46]. Within the 2 m x 2 m x 2 m viewing volume, this system is capable of accurately defining the 3D positions of each body segment to within 1 mm, and the three
orientations to within 1 degree. In addition, two Kistler piezoelectric force plates (Kistler
Instruments Type 9281A, Winterthur, Switzerland) were used to acquire ground reaction forces; this system has an accuracy of ±1% of full scale; as set in the MGH BML, this corresponds to ±10 N of vertical force, and ±5 N of shear force, for forces and frequencies encountered during gait (the unloaded force plate was recalibrated to a load of 0 N after each gait trial) [47], [48].
B. Subject Recruitment and Consent Each subject was asked to perform a series of locomotor
tasks, while both gait evaluation systems simultaneously collected data. The gait parameters collected from the two systems were analyzed and compared to validate the analysis of gait parameters from the data acquired by the GaitShoe. The subjects with healthy gait were recruited by word of mouth comprised of a mixture of colleagues and students from the MIT and MGH communities. Subjects with Parkinson’s disease were recruited by collaborating physicians of the MGH Department of Neurology, who performed initial screening of PD patients within their practice and described the research project to prospective subjects. Subjects who expressed interest and agreed to be contacted by the study coordinator were reached by phone at a later date.
Subjects with PD were included for the purpose of acquiring data in a population with known fluctuating pathological gait dysfunction. As indicated in recent research, persons often perform gait at their “best” when being tested in a formal laboratory setting yet they and their family members report poor gait ability throughout their day when at home. This is particularly common among persons with PD. Persons with PD exhibited changes in muscle tone which influence (gait ability) throughout the day, not only as a result of the underlying disease but also from the medications that control the symptoms of Parkinsonian movement disorders. Therefore, this patient population should benefit from home gait evaluation, which can provide information about gait abnormalities present in everyday life that have not traditionally been captured in analyses carried out in motion laboratories [49]. For example, the GaitShoe could provide clinicians insight about changes in gait performance after titrating medication doses based on each individual patient’s need.
All subjects were adults who could understand and follow basic directions. Persons were excluded if they reported acute pain that prevented performance of their comfortable, typical movement. All persons with a unstable medical condition such as uncontrolled hypertension or diabetes mellitus were excluded from participation.
Both the MGH Institutional Review Board (IRB) and the MIT Committee On the Use of Humans as Experimental Subjects (COUHES) approved the protocols for this study. The subjects all provided written consent in accordance with the MGH IRB and the MIT COUHES. Subject testing took place from the March 25, 2003 through June 6, 2003; the final eleven subjects (tested after April 15, 2003) additionally
> PAPER IDENTIFICATION NUMBER: TITB-00066-2004 <
5
signed the Health Insurance Portability and Accountability Act of 1996 (HIPAA) paperwork.
C. Testing Protocol The subjects performed a series of locomotor tasks. Each
subject first walked at his or her own self-selected natural pace for 2-4 trials, termed “free gait.” Next, a number of calibration routines were carried out, including a chair rise trial, wherein the subject stood from a seated position. Following the calibrations, another 2-4 trials of “free gait” were collected followed by 8 other trials of various walking activities not included in the presented analyses. A series of “paced gait” trials were then performed using a metronome set at 120 beats per minute. Collection from the BML system also included a “static standing” trial, with the subject standing still with the feet 30 cm apart.
D. Participants’ Overview A total of sixteen subjects were recruited for the validation
of the GaitShoe. For each group (subjects with healthy gait, or subjects with Parkinson’s disease), gender, age, height, and weight are detailed in Table II. Data for individual gait trials were excluded in the event of wireless transmission problems resulting in a data collection rate from the GaitShoe lower than 50 Hz for each foot, rather than the usual 75 Hz.
IV. SENSOR ANALYSIS AND CALIBRATION The full output from the bilaterally mounted GaitShoe
sensors is shown in Figure V. The calibration and the analysis of the accelerometers, gyroscopes, and force sensitive resistors (FSRs) are presented in this paper; information on the bend sensors, polyvinylidene fluoride strips, electric field sensors, as well as a recently developed ultrasound sensor for determining the distance and orientation between the feet, are available in [35]. The gait cycle is illustrated in Figure VI. The FSRs were analyzed to determine initial estimates of heel-strike and toe-off timing, the z-gyroscope was analyzed to determine pitch, the x- and y-accelerometers were analyzed to determine stride length, and information from the gyroscopes and accelerometers were used to finalize the heel-strike and toe-off timing results.
As compared to the existing systems described above the GaitShoe, with its fifteen continuous outputs per foot, is closest in scope to the Expressive Footware, which had sixteen continuous (uncalibrated) outputs. Indeed, one of the main contributions of the GaitShoe is the congregation of so many calibrated sensors. The system described by Pappas et al [10], [11] also measures multiple parameters, using one gyroscope in conjunction with three FSRs to determine gait phase. At this time, the commercial systems described are not able to measure a broad variety of parameters, but instead fall exclusively into force-sensing or motion-sensing, and have only limited real-time wireless data analysis capability.
A. Analysis Model The two coordinate systems used for analysis of the data are
shown in Figure VII. The first coordinate system corresponds
to the global reference frame of the room, and the second corresponds to the local body frame, where the sensors are located and collect their measurements. Determination of room-based parameters such as orientation or position requires a transformation to the global reference frame. For very simple motions, this transformation is straightforward. For example, a simple rotation about a single gyroscope axis is transformed to an angle of orientation within the fixed reference frame by integrating the corresponding gyroscope signal. Similarly a simple translation consisting only of motion along a single acceleration axis is transformed to a displacement within the fixed reference frame by double integration of the corresponding accelerometer signal.
The initial analysis of the GaitShoe sensor output presented here was simplified by assuming that the data collected involved linear motion in the XGS-YGS plane only (no translation in ZGS), and rotation about the ZGS axis only (the XGS-YGS plane remained parallel to the Xroom-Yroom plane). In other words, it was assumed that motion involved only changes in a single plane, as drawn in Figure VI. The subject testing involved collecting data during walking, with the subject walking in a straight line only.
Figure VIII shows the outputs of the three gyroscopes and three accelerometers from one of the gait trials during subject testing. Though there is acceleration in ZGS, the magnitude is smaller than the accelerations measured in XGS and YGS. In this sample, the standard deviation of the acceleration in ZGS is 2.2 m/s2, compared to greater than 5 m/s2 in XGS and YGS, and the spread between the largest positive and largest negative acceleration in ZGS is 20 m/s2, compared to greater than 45 m/s2 in XGS and YGS; thus, the accelerations in XGS and YGS are at least double those in ZGS. Similarly, the angular velocity about ZGS, is larger in magnitude than the angular velocities measured about XGS and YGS. In this sample, the standard deviation of the angular velocity about ZGS is 164.5°/s, compared to less than 35°/s about XGS and YGS, and the spread between the largest positive and largest negative angular velocity about ZGS is 781.2°/s, compared to less than 270°/s in XGS and YGS; thus, the angular velocities about XGS and YGS are less than a third of the angular velocity about ZGS.
Thus, these were reasonable assumptions for an initial analysis of the GaitShoe system, without requiring the complex mathematics necessary to represent true 3D motion. The motion analysis consisted of integrating the output of the z-gyroscope to obtain the pitch of the foot about Zroom, and transformation of the single and double integration of the output of the x- and y-accelerometers to obtain the velocity and displacement along the Xroom direction.
B. Force Sensitive Resistors The force sensitive resistors (FSRs) were calibrated, the
calibrated outputs for all four FSRs in each shoe were added together, and the sum, “FSRsum” was used in determining heel-strike and toe-off timing. 1) Calibration
The output of the FSRs is non-linear, due in part to the choice of conditioning electronics. Also, over time and with
> PAPER IDENTIFICATION NUMBER: TITB-00066-2004 <
6
use, the adhesive layer in the FSRs may break down and contribute to an increased non-linearity. The FSRs were characterized through the application of a series of forces to several devices. The tests were carried out using a TA-XT Texture Analyser from Stable Micro Systems, with both a 5 kg and a 30 kg load cell, and a curve was fit to the calibration data (a third-order polynomial in an exponential was empirically found to provide a good fit to the data). The relationship between the scaled FSR-402 output, VF402, and the applied force in N, F, is described by:
{ }4.26.102.147.8 4022
4023
4028.9 +⋅−⋅+⋅−⋅= FFF VVVeF , (1) and the relationship between the FSR-400 output, V F400, and the applied force in N, F, is described by:
{ }8.66.219.215.10 4022
4023
4028.9 +⋅−⋅+⋅−⋅= FFF VVVeF . (2) The 95% confidence interval of the curve-fit for the FSR-
402 was 14.95 N and for the FSR-400 was 14.64 N. This error is rather large, and is likely due at least in part to the non-linearity of the FSR response. Different conditioning electronics that would result in a more linear FSR response, such as using the FSR at the input to a current-to-voltage converter, should be implemented before using the FSRs for numerical analysis of the force distribution. In the analysis for this work, the FSRs were calibrated and summed together for use in determining heel-strike and toe-off timing. 2) Analysis
The primary use of the calibrated FSR data was to determine initial values of heel-strike and toe-off timing. These initial values were then used to set the integration bounds used to calculate the pitch and stride length. The four FSRs were coarsely distributed underneath the foot, with two underneath the heel, medially and laterally, one underneath the first metatarsal head, and one underneath the fifth metatarsal head. Though this cannot provide a complete picture of the force distribution underneath the foot, the information provided is sufficient to estimate heel strike and toe off times.
The individual calibrated FSR outputs (with units of force [N]), the sum of the four calibrated FSR outputs, and the BML force plate output (normalized by the subject’s bodyweight) are shown in Figure IX. The FSRs only cover a small percentage of the total weight-bearing area underneath the foot; as such, they only measure a portion of the total force. Thus the shape of the summed FSR output in the middle graph is different than the bottom graph of the force plate measurement, because the summed FSR output is subsumed by the total force output. This does not render the FSR measurements useless: on the contrary, the shape of the FSRsum is similar across the three steps shown, however, there were substantial differences in the weight distribution between the first and fifth metatarsal heads. In the first step shown, more weight is on the fifth metatarsal, while in the second step, more weight is on the first metatarsal, and in the third step, the weight is distributed fairly evenly across the first and fifth metatarsal heads. This information cannot be obtained from a standard force plate, and the use of conditioning electronics that provide a more linear output and improved calibration should provide better quality FSR
measurements capable of providing valuable information about the insole force distribution during gait.
In the BML, timing of heel-strike and toe-off are determined by examining the force plate output; when it first crosses a certain threshold, that time point is identified as heel-strike, and when it re-crosses that threshold, that time point is identified as toe-off. This general approach was adopted for deriving the heel-strike and toe-off times from the FSRsum, as demonstrated in Figure X. A spline was fit to the FSRsum with time points every 1 msec to improve the time resolution (using spline.m, a standard MATLAB function), and the first difference of the spline-fit to FSRsum, DFSRsum_splinefit, was calculated. The local maximum and minimum extrema of DFSRsum_splinefit, corresponding to rapid loading and unloading occurring at heel-strike and toe-off, respectively, were determined. The time for heel-strike was set at the first DFSRsum_splinefit time point before the local maximum greater than 0.005 kg was met, and the time for toe-off was set at the first DFSRsum_splinefit time point after the local minimum, respectively less than 0.005 kg; these conditions were set after inspection of many gait trials. Future work with the GaitShoe will more fully investigate the loading profile of the FSRs.
C. Gyroscopes 1) Calibration
For the gyroscopes, two types of information were required: the zero offset, which corresponds to 0°/s; and, the sensitivity, to convert the normalized output to units of °/s (IMU output units were normalized to between 0 and 1). The zero offset of the gyroscopes was simply the output of the gyro when the hardware was at rest. The sensitivity of the gyroscopes was determined by rotating each gyroscope about its sensitive axis, through a range of constant angular velocities. Data were collected for 20 to 30 seconds each at several discrete angular velocities, and the clipped means (the mean of the data with the top and bottom 10% of data removed) were calculated for each set of data. A line was fit to the clipped mean data points and the zero offset value; the sensitivity of the sensor is the slope of the fit line. The results for the gyroscopes on the two IMU boards used in testing are summarized in Table III, including the coefficient of correlation for the line-fit. 2) Analysis
The pitch of the foot, Θ(t), was determined by integrating the z-gyroscope output. The sign of the pitch follows the convention used at the MGH Biomotion Lab (BML), where a positive rotation about the z-axis corresponds to a rotation from the y-axis to the x-axis. The z-gyroscope output was integrated over single strides, with the integration bounds determined from the initial estimates of heel-strike and toe-off. The midpoints between the heel-strike and toe-off times were calculated and used as the bounds of integration; these midpoints occurred during the stance phase when the subject’s foot was flat on the floor, so the initial value of the pitch was set to 0°.
To compensate for drift in the gyroscope output, an iterative method of integrating the z-gyroscope output was developed. The z-gyroscope data were integrated using trapezoidal
> PAPER IDENTIFICATION NUMBER: TITB-00066-2004 <
7
integration, and the final value after each integration over a single step was compared to an “end-limit” value, defined as 0.1% of the full-scale across all initial integrations. For a given step, if the final value had a magnitude greater than the end-limit, a small “nudge” value was added to the calibrated z-gyroscope data between these integration bounds. The magnitude of the nudge value was equal to the difference between the end-limit and the final value after integration, and the sign of the nudge value was opposite from the sign of the final value after integration. This process was repeated until the final value was within the end-limit, and the results are shown in Figure XI, for data collected from a left foot (here, the full-scale is approximately -50° to +60°, so the end-limit value would be 0.1% of 110°, or approximately 0.11°).
The pitch data collected by the BML for this trial are also plotted in Figure XI. To validate the GaitShoe pitch data, two methods were used: direct comparison of the maximum and minimum values (and the corresponding time-points) for each stride, and the root mean square error (RMS error) between the two curves. For comparison of the extremum values, each minimum and maximum of the calculated pitch were located, and a spline was fit to the pitch data over nine points, with the measured extrema at the center (this corresponds to approximately 0.1 sec of data; again using spline.m in MATLAB). The spline was fit with time points every 3.34 msec, and the new extrema and corresponding time point were determined. The values for the GaitShoe extremum and the BML extremum shown in Figure XI are summarized in Table IV, along with the results from the data collected from the corresponding right foot in the same trial.
To calculate the RMS error between the GaitShoe pitch and the BML pitch, a spline was fit to the GaitShoe pitch at time points corresponding to the time points of the BML data (the BML data rate is 152 Hz). The RMS error calculated between the two curves shown in Figure XI was 3.4°.
D. Accelerometers 1) Calibration
Three types of information about the accelerometers were required: the zero offset, which corresponds to 0 m/s2; the sensitivity, to convert the normalized output to units of m/s2 (IMU output units were normalized to between 0 and 1); and the orientation of the accelerometers relative to the foot, to interpret the sensor output accurately.
Determining the sensitivity of the accelerometers was very straightforward, by using gravity. Naturally, the gravitational acceleration vector, g, is stable, accurate, and readily available. By rotating the sensor such that the axis of interest was orthogonal to the earth’s surface, and then rotating the sensor 180°, measurements of +1g and –1g were easily obtained. The positioning of the accelerometers with respect to the gravity vector was done by hand. The hardware was slowly rotated about each of the three axes; this allowed each accelerometer to sweep through the gravitational acceleration vector, g, twice.
The rotations were carried out at seven different times throughout subject testing, and the resulting data were low-
pass filtered, with second-order Butterworth coefficients and a low-pass cutoff frequency of 2 Hz (the sampling frequency was 75 Hz). The rotation by hand was performed slowly (to minimize centripetal acceleration), with the goal of keeping the rotation at a constant speed, as the goal was to measure only gravitational acceleration. The filtering was used to remove any small acceleration changes resulting from hand jitter. The outputs corresponding to +1g and –1g for each calibration were determined by finding the maximum and minimum values of each output. The sensitivity was set to the slope of the line between the mean of all +1g outputs and the mean of all –1g outputs, and the zero offset was set as the midpoint between the means of the +1g and the –1g outputs; the results are summarized in Table V, including the standard deviations of the +1g and the –1g outputs.
Determining the orientation of each accelerometer in space was critical because the acceleration due to gravity must be correctly subtracted from the total acceleration signal during the analysis of gait data. This type of accelerometer measures both dynamic acceleration (resulting from shock, vibration, linear motion, or other types of motion), and static acceleration (resulting from gravity). Thus, the gravity contribution must be subtracted from the total output.
As described above, the pitch orientation of the foot was determined by integrating the angular velocity about the z-axis. The pitch orientation of the accelerometer was determined by the sum of the pitch and the angle of inclination of the accelerometer with respect to the foot. The angle of inclination of the accelerometer with respect to the foot is different for each subject, as the size and shape of shoe influence the orientation of the GaitShoe attachment on the shoe. When a subject stands still, with both feet flat on the floor (corresponding to a pitch of 0°), each accelerometer measures only the fraction of gravitational acceleration along its sensitive axis. The angle of inclination of the x-accelerometer, αx, can be determined as described by:
gAx
x v
v
arcsin=α , (3)
where Ax is the acceleration measured by the x-accelerometer with the foot flat on the floor. The angle of inclination of the y-accelerometer, αy, can be similarly determined; the difference between these two angles provides the relative orientation between the x- and y-accelerometers in the x-y plane. 2) Analysis
Velocity and stride length were determined by single- and double-integration, respectively, of the dynamic acceleration along the Xroom axis, using the output of the x- and y-accelerometers. The accelerometers were fixed to the back of the shoe via the GaitShoe hardware, and their orientation with respect to the room and the gravity vector changed as the subject walked.
The acceleration measured by each accelerometer can be resolved into two components, corresponding to the dynamic acceleration from foot motion, and the static acceleration due to gravity, i.e. AX-GSdynamic, and AX-GSstatic. To calculate the contribution of AX-GSstatic component, the orientation of the x-

> PAPER IDENTIFICATION NUMBER: TITB-00066-2004 <
8
accelerometer with respect to the room, Φx, must be determined. At time point ti, Φx(ti) was calculated from the sum of the pitch of the foot at the same time point, Θ(ti), and the angle of inclination of the x-accelerometer, αx, as follows:
)()( ixix tt Θ+=Φ α . (4) The linear acceleration measured by the x-accelerometer at
time point ti, AX-GSdynamic(ti), was calculated by subtracting the contribution of gravity from the total acceleration:
)(sin)()( ixixiGSX tgtAtAdynamic
Φ⋅−=−vvv
. (5)
The dynamic acceleration measured by the y-accelerometer is determined using the same method, but substituting the appropriate y-variables.
The total acceleration vector experienced by the foot, AFOOT, can be resolved into two components corresponding the reference frame of the room, AX-ROOMdynamic and AY-ROOMdynamic, which contribute the dynamic components measured by the x- and y-accelerometers, as described above, and as shown in Figure XII. To determine the actual dynamic acceleration along Xroom, the axis of interest for the velocity and the displacement calculations, the outputs of the x-accelerometer and the y-accelerometer were combined as follows:
xyyx
xGSYyGSXROOMX
dynamicdynamic
dynamic
AAA
Φ⋅Φ−Φ⋅Φ
Φ⋅−Φ⋅=
−−
− sincossincos
sinsinvv
v . (6)
AX-ROOMdynamic was integrated twice: a single trapezoidal integration determined the stride velocity, and a subsequent trapezoidal integration determined the stride length. To determine the integration bounds the z-gyroscope integration bounds were used as starting points, with the the characteristics of AX-GSdynamic used to finalize the bounds. The lower integration bound was determined by starting at the first quarter-point between a pair of z-gyroscope integration bounds, and stepping back in time toward the first z-gyroscope integration bound until the magnitude of AX-GSdynamic was less than 0.2 m/s2. If no value met this condition, the lower bound was set at the time point between the first z-gyroscope integration bound and the first quarter-point where the magnitude of AX-GSdynamic was a local minimum. Similarly, the upper integration bound was determined by stepping forward in time from the midpoint between two subsequent z-gyroscope integration bounds toward the second z-gyroscope integration bound until AX-GSdynamic had either a magnitude less than 0.2 m/s2 or a value greater than 0 m/s2. The latter condition was for the instances where a large positive acceleration was detected. This condition, most likely corresponds to a strong heel-strike, so it is appropriate to cease integration, since the stride is completed upon heel-strike. If neither of these conditions were met, the upper bound was set at the time point between the second z-gyroscope integration bound and ten points prior where the magnitude of AX-GSdynamic was a local minimum.
The results of the integrations are shown in Figure XIII, with the lower and upper integration bounds indicated on the AX-ROOMdynamic plot. The displacement data collected by the BML for this trial is also plotted. The BML displacement has
a different 0 m origin than the GaitShoe, so it was shifted to align with the GaitShoe results at a time point during stance (here, at approximately 0.8 sec).
To validate the GaitShoe stride length data, two methods were used: direct comparison of the stride lengths for each stride, and the root mean square error (RMS error) between the two curves. In the example shown in Figure XIII, the stride length from the BML displacement data was 1.33 m, and from the GaitShoe was 1.31 m. A spline was fit to the GaitShoe displacement at time points corresponding to the time points of the BML data to calculate the RMS error between the GaitShoe displacement and the BML displacement. The RMS error calculated between the two curves shown in Figure XIII was 10.3 cm.
E. Heel-Strike and Toe-Off Timing Timing of heel-strike and toe-off were determined using
several of the GaitShoe sensors. Initial values for each were estimated using the sum of the four FSRs, “FSRsum,” as described above. These initial values were used to determine the integration bounds for the z-gyroscope. The heel-strike times were reevaluated using the accelerometer integration bounds, and the toe-off times were determined from the pitch.
As described above, the upper integration bound for the x-accelerometer was set when the magnitude of AX-GSdynamic was either less than 0.2 m/s2 or greater than 0 m/s2. This second condition was expected to correspond to an especially strong heel-strike. Each of the upper integration bounds were investigated, and if the bound corresponded to a positive spike in the AX-GSdynamic output, the time point replaced the heel-strike time as initially determined using FSRsum; otherwise, the FSRsum heel-strike time was used. These heel-strike times were validated by comparison to the times of heel-strike obtained from the BML analysis of the force plate data.
The final toe-off times were determined by the maximum pitch, which occurs at toe-off: normally, as the foot rolls off the floor, the pitch increases, and once the toe is off the ground, a rapid acceleration at the start of leg-swing occurs, and results in a decrease in the pitch. The local maximums of the pitch, and the corresponding times, were determined as described above. These toe-off times were validated by comparison to the times of toe-off obtained from the BML analysis of the force plate data.
Figure XIV shows the AX-GSdynamic and pitch curves (for the same gait trial as shown in Figure X), along with the GaitShoe identified heel-strike and toe-off times and the BML identified heel-strike and toe-off times.
V. RESULTS The pitch, displacement, and heel-strike and toe-off timing
as analyzed by the GaitShoe system were compared to data collected simultaneously by the Massachusetts General Hospital Biomotion Laboratory (BML). Testing of the fifteen subjects resulted in 270 total trials of gait. The RMS error between the pitch and displacement curves was calculated, and the local maximums and minimums of the pitch, the stride length, the heel-strike time, and the toe-off time for individual

> PAPER IDENTIFICATION NUMBER: TITB-00066-2004 <
9
strides were compared directly. The GaitShoe pitch, stride length, and vertical displacement results for all of these trials were compared to the data collected simultaneously from the BML (some trials had multiple strides available for comparison). The BML heel-strike and toe-off times were determined by a physical therapist by computer-aided inspection of the BML force plate data; for each subject, approximately three heel-strike times and three toe-off times of each times were determined for each foot, for a total of 86 comparisons.
The GaitShoe and BML data were analyzed for outlier data, and the BML data were checked for errors due to array slippage, and these data points were removed; in addition, the GaitShoe wireless protocol occasionally failed to receive a packet because of interference (see [35]). These causes resulted in small gaps in the data from both systems. Comparisons were excluded if there were more than 10 individual gaps in the compared BML or GaitShoe data. All direct comparisons are the value of the GaitShoe parameter minus the value of the BML parameter.
Finally, the GaitShoe results used in this validation study were sorted into healthy gait and Parkinsonian gait groups. The means and standard deviations of the pitch extrema, stride length, and heel strike and toe off timing results were calculated for each group.
A. RMS Comparison of Curves The mean RMS error between the GaitShoe pitch and the
BML pitch was 5.2 ± 2.0º, calculated over 195 samples; a histogram of the results is shown in Figure XV.
The mean RMS error between the GaitShoe displacement and the BML displacement, calculated over 303 samples, was 8.5 ± 5.5 cm; a histogram of the results is shown in Figure XVI.
B. Direct Comparison of Peak Changes The mean difference between the GaitShoe pitch extrema
and the BML pitch extrema was -0.7 ± 6.6º, and the mean percentage change was 15.6 ± 18.4%, calculated over 1132 samples. The corresponding mean difference between the time points of the extrema was -26.0 ± 24.2 ms. Histograms of the results are shown in Figure XVII. The Pearson’s correlation between the pitch extrema was 0.992, and the Pearson’s correlation between the time points of the extrema was 1.000.
The mean difference between the GaitShoe stride length and the BML stride length was 7.4 ± 13.6 cm, and the mean percent change was 6.5 ± 11.7%, calculated over 315 samples. Histograms of the results are shown in Figure XVIII. The Pearson’s correlation between the stride lengths was 0.841.
The mean difference between the GaitShoe heel-strike and the BML heel-strike times was -6.7 ± 22.9 ms, over 77 samples. The mean difference between the GaitShoe toe-off and the BML toe-off times was -2.9 ± 16.9 ms, over 75 samples. Histograms of the results are shown in Figure XIX. The Pearson’s correlation between the heel-strike times was 0.999, and the Pearson’s correlation between the toe-off times
was 1.000.
C. Comparison of Healthy Gait and Parkinsonian Gait The means and standard deviation across the health gait and
Parkinsonian gait groups for each of the validation results are summarized in Table VI.
For pitch extrema, the normal range is much larger than that of the Parkinsonian range, with a mean 14.5° beyond for maximum pitch, and a mean 7.5° beyond for minimum pitch. Correspondingly, the normal stride length is a mean 0.26 m longer than the Parkinsonian stride length.
Though the stride time of the normal subjects is shorter by 0.15 s, the percentage of the stride spent in stance (see Figure VI) is nearly equivalent, with the normal subjects spending only 2.2% less time in stance.
VI. DISCUSSION The development of the GaitShoe has resulted in a wireless
wearable system with an unprecedented number of sensors designed to capture information that can characterize gait of both feet. The system costs under $500 per foot in prototype quantities and the hardware for a single shoe weighs under 300 g. The hardware is readily fixed to a variety of typical walking shoes, and data can be collected continuously over a few hours. Linear velocity and stride length were obtained respectively from single- and double-integration, with respect to time, of the acceleration component corresponding to forward motion of the foot, and displacements and velocities in the other two axes can be similarly acquired. The gyroscopes provide information about the rotational velocity of the foot, which can similarly be integrated once with respect to time to provide the angle. While use of only four force sensitive resistors does not provide a full picture of the force distribution beneath the foot, the number is sufficient to provide a general picture of medial vs. lateral force, and heel vs. metatarsal force. The comparison of heel force vs. metatarsal force was used in determining stance time, as well as heel-strike and toe-off timing.
The validation results indicate that the GaitShoe can be further developed into a true wearable podiatric laboratory, which could be of great use in evaluating gait over longer periods of time than are available in motion laboratories, as well as allowing the evaluation to be carried out in a natural environment, such as the subject’s home. It would also allow the evaluation of subjects who are without access to a motion laboratory.
The simplified kinematic analysis of the foot motion, using only the x- and y- accelerometers and the z-gyroscope, resulted in reasonable estimations of the pitch and stride length. The GaitShoe pitch had an RMS error of 5.2º, and the GaitShoe pitch extrema had a standard deviation from the BML of 6.6º, and was well-correlated, with a Pearson’s correlation of 0.992. The GaitShoe stride length had a standard deviation from the BML of 13.6 cm, and a Pearson’s correlation of 0.841, with an RMS error of 8.5 cm.
The most significant contribution to these errors is likely to be from the z-gyroscope. The pitch, which is determined by

> PAPER IDENTIFICATION NUMBER: TITB-00066-2004 <
10
integrating the z-gyroscope output, is used to both subtract the gravitational component of the acceleration, as well as to determine the dynamic component of the acceleration along the XROOM coordinate from the x- and y- accelerometers. Thus, small errors in pitch have a compounded effect on the calculations of stride length, and reducing the standard deviation of the GaitShoe pitch measurement is likely result in improved GaitShoe stride length calculations. In addition, the standard deviation between the time points of the GaitShoe extrema and the BML extrema was 24.2 ms, with a Pearson’s correlation of 1.000. Thus, decreasing the time deviation in the pitch will likely also improve the stride length results.
An additional contribution to these errors is likely due to the simplified kinematic model, which assumed all the motion of the foot was in a single plane, and that the x- and y- accelerometers were positioned entirely within that single plane. Foot motion during gait is a complex motion, and certainly has accelerations and rotations outside of a single plane. In addition, it is unlikely that the orientation of the x- and y- accelerometers were positioned entirely in a plane orthogonal to Xroom and Yroom. Thus, acceleration along the Zroom axis would have been measured by the x- and y-accelerometers, but not accounted for, and, the true orientation of the accelerometers with respect to the horizontal would be slightly different, resulting in a slightly incorrect calculation of the gravitational acceleration.
To account for these errors, future work will involve three areas of further research. First, all six IMU measurements will be incorporated to cover the three perpendicular axes of angular velocity and acceleration. This will eliminate errors introduced by the simplified kinematic model used in this initial work. Second, a hardware change will implement the Analog Devices gyroscope to measure rotation about the z-axis (and y-axis), rather than the Murata gyroscope. The Analog Devices gyroscope has two vibrating structures operating in anti-phase to reduce common mode signals unrelated to angular velocity (such as external shocks or vibrations); this alone will likely improve the pitch calculation. Finally, additional FSRs will be added to the insole to improve determination of heel strike and toe off times, and the conditioning electronics for the FSRs will be changed. Though the inherent drift of the accelerometers and gyroscopes induce additional errors, gait analysis has the advantage that the integration is only carried out over a short time scale (under 0.5 s, typically). The accuracy of the integration limits can be improved by better force sensing underneath the foot to better determine when the foot transitions in and out of the phase where it is flat on the floor. The conditioning electronics used had a highly non-linear response; different methods of conditioning the FSR output will be investigated to find a response with improved linearity.
Even with only four FSRs, the multi-sensor GaitShoe determination of heel-strike and toe-off was highly successful, as compared to the BML heel-strike and toe-off time. Though the standard deviation of the heel-strike time was 22.9 ms, the Pearson’s correlation was 0.999, and, similarly, though the standard deviation of the toe-off time was 16.9 ms, the
Pearson’s correlation was 1.000. The determination of the GaitShoe toe-off time used the calculated pitch, so, again, improvement of the pitch will likely propagate through to improve the standard deviation of the toe-off time. The heel-strike time used either the presence of a spike in the x-accelerometer, or, if no spike was present, used a threshold of the first difference of a spline fit to the FSRsum. Better calibration of the FSRsum, resulting in an objectively determined threshold, would likely improve this component of determining heel-strike; if so, placing FSRs underneath the great toe may be able to contribute to the determination of the toe-off time. Finally, increasing the data transfer rate of the GaitShoe from 75 Hz would eliminate the need to fit a spline to the FSRsum data, and may also improve the accelerometer and gyroscope data as well. Placement of additional IMU boards on the shins of the subject could provide useful information about the relative orientation between the foot and the shin, as well as providing information about the orientation of the shin.
The validation results were also investigated for differences between the group of subjects with normal gait and the group of subjects with Parkinson’s disease. The mean pitch extrema
Additional work with the GaitShoe sensor outputs has involved application of standard pattern recognition techniques to discriminate between healthy gait and Parkinsonian gait, as well as to discriminate between individuals [35], [50] and real-time analysis of the data to provide therapeutic musical feedback to investigate interactive applications in physical therapy [35], [51].
VII. CONCLUSIONS AND FUTURE WORK These initial results demonstrate that the GaitShoe may be
an important research tool, capable of enabling the analysis of gait in untraditional ways, such as over long periods of time and in the home environment or through use of pattern recognition, and can provide real-time feedback for use in applications such as sports medicine, electro-stimulation, or physical therapy.
Future work to improve the GaitShoe will focus on extending the IMU analysis to utilize the full 6 DOF, and on improving the wireless transmission. For the IMU analysis, calibration routines to determine the actual orientation of each of the axes of the accelerometers and gyroscopes will be implemented, and a routine such as Kalman filtering will be used to analyze the data. In addition, a redesign using three ADXRS150 gyroscopes may be considered, to improve the accuracy of the angular velocity measurements. New strategies for wireless transmission will be investigated, both new devices (such as Bluetooth chips) that have become recently available, as well as alternate locations for the antennae, to reduce interference from the human body. For experiments that do not require real-time data analysis, on-board data storage will be considered.
The research involving therapeutic musical feedback is ongoing, particularly for patients with Parkinsonian gait. Other future applications include placing IMUs on additional body locations, such as the shin and thigh, as well as the upper

> PAPER IDENTIFICATION NUMBER: TITB-00066-2004 <
11
body, to generate more information about the motion of the subject. In addition, the equipment developed for the GaitShoe has a potential benefit for areas of research, such as ergonomics, that would benefit from real-time analysis of motion but do not have ready access to traditional motion analysis equipment.
ACKNOWLEDGMENTS The authors thank their colleagues the MGH Biomotion Laboratory and the MIT Media Lab, and thank John Memishian at Analog Devices for generously providing samples of the demo version of the ADXRS150 gyroscope. We are grateful to the volunteers for the subject testing, and thank them for their generous contribution.
REFERENCES [1] Zhu HS, Maalej N, Webster JG, Tompkins WJ, Bach-Y-Rita P, Wertsch
JJ, “An umbilical data-acquisition system for measuring pressures between the foot and shoe,” IEEE Trans Biomed Eng, 37(9): 908-11, Sept 1990.
[2] Zhu HS, Wertsch JJ, Harris GF, Loftsgaarden JD, Price MB, “Foot pressure distribution during walking and shuffling,” Arch Phys Med Rehabil, 72(6): 390-7, May 1991.
[3] Zhu HS, Wertsch JJ, Harris GF, Alba HM, Price MB, “Sensate and insensate in-shoe plantar pressures,” Arch Phys Med Rehabil, 74(12): 1362-8, Dec 1993.
[4] Hausdorff JM, Ladin Z, Wei JY, “Footswitch system for measurement of the temporal parameters of gait,” J Biomech, 28(3): 347-51, Mar 1995.
[5] Hausdorff JM, Zemany L, Peng C.-K., Goldberger AL, “Maturation of gait dynamics: stride-to-stride variability and its temporal organization in children,” J Appl Physiol, 86(3): 1040-7, Mar 1999.
[6] Hausdorff JM, Rios DA, Edelberg HK, “Gait variability and fall risk in community-living older adults: a 1-year prospective study,” Arch Phys Med Rehabil, 82(8): 1050-6, Aug 2001.
[7] Hausdorff, JM, Purdon PL, Peng C.-K, Ladin Z, Wei J-Y, Goldberger AL, “Fractal dynamics of human gait: stability of long-range correlations in stride interval fluctuations,” J. Appl. Physiol, 80: 1448–1457, 1996.
[8] Morley RE Jr, Richter EJ, Klaesner JW, Maluf KS, Mueller MJ, “In-shoe multisensory data acquisition system,” IEEE Trans Biomed Eng, 48(7): 815-20, Jul 2001.
[9] Maluf KS, Morley RE Jr, Richter EJ, Klaesner JW, Mueller MJ, “Monitoring in-shoe plantar pressures, temperature, and humidity: reliability and validity of measures from a portable device,” Arch Phys Med Rehabil, 82(8): 1119-27, Aug 2001.
[10] Pappas IP, Popovic MR, Keller T, Dietz, Morari M, “A reliable gait phase detection system,” IEEE Trans Neural Syst Rehabil Eng, 9(2): 113-25, Jun 2001.
[11] Pappas IP, Keller T, Mangold S, “A Reliable, Gyroscope based Gait Phase Detection Sensor Embedded in a Shoe Insole,” presented at the 2002 IEEE International Conference on Sensors, Orlando, FL.
[12] Cutlip RG, Mancinelli C, Huber F, DiPasquale J, “Evaluation of an instrumented walkway for measurement of the kinematic parameters of gait,” Gait Posture, 12(2): 134-8, Oct 2000.
[13] Giacomozzi C, Macellari V, “Piezo-dynamometric platform for a more complete analysis of foot-to-floor interaction,” IEEE Trans Rehabil Eng, 5(4): 322-30, Dec 1997.
[14] Kidd CD, Orr R, Abowd GD, Atkeson CG, Essa IA, MacIntyre B, Mynatt E, Starner TE, Newstetter W, “The Aware Home: A living laboratory for ubiquitous computing research,” in Proceedings of CoBuild '99: Second International Conference on Cooperative Buildings: 191-198.
[15] Suutala J, Pirttikangas S, Riekki J, Röning J, “Reject-optional LVQ-based two-level classifier to improve reliability in footstep identification,” 2004 Conference on Pervasive Computing.
[16] See http://www.cse.ohio-state.edu/~jwdavis/publications.html
[17] Yam CY, Nixon MS, Carter JN, “Automated person recognition by walking and running via model-based approaches,” Pattern recognition, 37(Part 5): 1057-1072, 2004.
[18] MIT AI Human ID Results [Online]. Available: http://www.ai.mit.edu/people/llee/HID/mitai_data_avg_spec.htm
[19] Johnson AY, Sun J, Bobick AF, “Predicting large population data cumulative match characteristic performance from small population data,” in the 4th International Conference on Audio- and Video-Based Biometric Person Authentication, Guildford, UK, June 9-11, 2003.
[20] “Walk the Walk: Gait Recognition Technology Could Identify Humans at a Distance,” Georgia Tech Research News [Online]. Available: http://gtresearchnews.gatech.edu/newsrelease/GAIT.htm
[21] “The Miburi performance system,” Yamaha Corporation, 1996 [Online]. Available: http://www.yamaha.co.jp/news/96041001.html
[22] See http://www.probalance.com [23] “The Leader in Smart Technologies for Health, Fitness and Beyond:
Technology FAQ’s,” Acceleron Technologies [Online]. Available: http://www.xlrn.com/faq.html
[24] See http://www.traxtar.com/ [25] See http://www.fitsense.com/ [26] See http://www.vectrasense.com/ [27] Marriott M, “The Bionic Running Shoe.” The New York Times, May 6,
2004. [28] See http://www.adidas.com/ [29] Choi I, Ricci C, “Foot-mounted gesture detection and its application in
virtual environments,” IEEE International Conference on Systems, Man, and Cybernetics, Computational Cybernetics and Simulation, 5(12-15):4248-53, Oct. 1997.
[30] “F-Scan System Features,” Tekscan, Inc., 2004 [Online]. Available: http://www.tekscan.com/medical/specs_fscan1.html
[31] See http://www.clevemed.com/ [32] See http://www.portablegaitlab.com/ [33] Paradiso JA, Hsiao K, Benbasat AY, Teegarden Z, “Design and
implementation of expressive footware,” IBM systems journal, 39 (3): 511-519, 2000.
[34] D’Agnese J, “The 11th annual Discover awards,” Discover, 21(7):89-112, 2000.
[35] Morris SJ, “A Shoe-Integrated Sensor System for Wireless Gait Analysis and Real-Time Therapeutic Feedback,” Sc.D. dissertation, Harvard/MIT Division of Health Sciences and Technology, Cambridge, MA, June 2004.
[36] ADXL202E Data Sheet, Rev A, Analog Devices, Inc., 2000 [Online]. Available: http://www.analog.com/UploadedFiles/Data_Sheets/70885338ADXL202_10_b.pdf
[37] ADXRS150 Data Sheet, Rev A, Analog Devices, Inc., 2003 [Online]. Available: http://www.analog.com/UploadedFiles/Data_Sheets/778386516ADXRS150_B.pdf
[38] “ENC-03J Specifications,” Murata [Online]. Available: http://search.murata.co.jp/Ceramy/owa/CATALOG.showcatalog?sHinnmTmp=ENC-03J&sLang=2&sNhnm=ENC-03J&sHnTyp=OLD
[39] “FSR integration guide and evaluation parts catalog, with suggested electrical interfaces,” Interlink Electronics [Online]. Available: http://www.interlinkelec.com
[40] “Piezo Film Sensors Technical Manual,” Measurement Specialties [Online]. Available: http://www.msiusa.com/piezo_download_listing.htm
[41] “FLX-01 Specifications,” Images Co. [Online]. Available: http://www.imagesco.com/catalog/flex/FlexSensors.html
[42] “MC33794 ata sheet, Rev 6.0,” Motorola, Inc., Feb 2003 [Online]. Available: http://e-www.motorola.com/files/analog/doc/data_sheet/MC33794.pdf
[43] “C8051F* Data Sheet,” Silicon Laboratories [Online]. Available: http://www.silabs.com/products/pdf/C8051F2xxRev1_4.pdf
[44] “DR3000-1 Data Sheet,” RF Monolithics, Inc., [Online]. Available http://www.rfm.com/products/data/dr3000-1.pdf
[45] Benbasat AY, Morris SJ, Paradiso JA, “A wireless modular sensor architecture and its application in on-shoe gait analysis,” proc. of the IEEE International Conference on Sensors, p 1086-1091, Oct. 21-24 2003.
[46] Antonnson EK, “A three-dimensional kinematic acquisition and intersegmental dynamic analysis system for human motion,” Ph.D. dissertion, Department of Mechanical Engineering, MIT, 1982.
> PAPER IDENTIFICATION NUMBER: TITB-00066-2004 <
12
[47] Riley PO, Mann RW, Hodge WA, “Modelling of the biomechanics of posture and balance,” J. Biomech, 23(5): 503-6, 1990.
[48] Riley PO, Schenkman ML, Mann RW, Hodge WA, “Mechanics of a constrained chair-rise,” J Biomech, 24(1): 77-85, 1991.
[49] Morris ME, Huxham F, McGinley J, Dodd K, Iansek R, “The biomechanics and motor control of gait in Parkinson disease,” Clin Biomech, 16(6): 459-70, Jul 2001.
[50] Bamberg, SJM, Picard R, Paradiso JA, “Pattern recognition of normal and healthy gait using an on-shoe measurement system”. To be submitted to Gait & Posture.
[51] Paradiso JA, Morris SJ, Benbasat AY, Asmussen E. Interactive Therapy with Instru-mented Footwear. Proceedings of CHI 2004, April 24-29, 2004, Vienna, Austria.
Stacy J. Morris Bamberg (S’02) received her S.B. in mechanical engineering from the Massachusetts Institute of Technology (Cambridge, USA) in 1996, her S.M. in mechanical engineering from MIT in 1999, and her Sc.D. from the Harvard/MIT Division of Health Sciences and Technology (Cambridge, USA) in 2004. She did her doctoral research in the Responsive Environments Group at the MIT Media Lab. She is currently an Assistant Professor in the Mechanical Engineering Department at the University of Utah in Salt Lake City, UT. In addition to the development of gait analysis instrumentation, her research interests include sensors and instrumentation for biomedical applications. Prof. Bamberg was awarded the Ida Green fellowship from MIT in 1996 and a four-year graduate fellowship from the Whitaker Foundation in 1997. She was also a recipient of Whitaker Stipend to attend the IEEE-EMBS Summer School on Medical Devices and Biosensors in the summer of 2002, and is a member of Sigma Xi, Tau Beta Pi, and Pi Tau Sigma. Ari Y. Benbasat (S'00) was born in Vancouver, BC, Canada in 1975. He received a B.A.Sc. in engineering physics from the University of British Columbia (Vancouver, Canada) in 1998 and a S.M. in media arts and sciences from the Massachusetts Institute of Technology (Cambridge, USA) in 2000. In 1993, he was a candidate for the mayoralty of Vancouver and received over 0.1% of the popular vote. He is currently a Ph.D. candidate in the Responsive Environments Group at the MIT Media Lab in Cambridge, USA. His research concentrates on design methodologies for the creation of real-time power optimal wearable sensors, with the goal of making such devices efficient enough that they can be embedded into everyday life. Mr. Benbasat was awarded a post-graduate scholarship by the Natural Sciences and Engineering Research Council of Canada in 1998. Donna Moxley Scarborough received her bachelor’s of science degree in physical therapy from Northeastern University (Boston, MA) in 1988 and earned her Masters of Science degree from the MGH Institute of Health professions (Boston, MA) in 1997. She worked previously at New England Medical Center hospital as a physical therapist treating persons with Neurologic and Orthopedic conditions. Ms. Scarborough is currently the Assistant Clinical Director of the MGH Biomotion Laboratory in Boston, MA. Her general research interests include gait, movement and balance disorders. Her more focused research is in elders’ balance and motor control. She also holds an adjunct Assistant Professor faculty position at MGH Institute of Health professions. She has received 2 research grant awards from CIMIT, The Center for the Integration of Medicine and Innovative Technology, for research collaborations of the GaitShoe. David E. Krebs received his BS in physical therapy in 1977 and MA in applied physiology in 1979 from Columbia University (New York City, NY), his PhD in pathokinesiology and physical therapy in 1986 from New York University (New York City, NY),, and his DPT in 2002 from the MGH Institute of Health Professions (Boston, MA),. He has been the director of the MGH Biomotion Laboratory since 1992. Dr. Krebs has been a professor at the MGH Institute of Health Professions since 1987, now in the Programs in Physical Therapy and in Clinical Investigation. He maintains a clinical appointment at the Massachusetts General Hospital in physical therapy and orthopaedics. He also holds academic appointments in Orthopaedics at Harvard Medical School and in Mechanical Engineering at the Massachusetts Institute of Technology. His general research interests include the biomechanical and neural control of human locomotion. Dr. Krebs has received numerous federal and private research grants and has over 200 publications. He is a member of several professional and scientific societies, from which he has received many awards. He is an editor for several
scientific journals, and has been on numerous scientific review panels for NIH, the VA and other granting agencies. Joseph A. Paradiso received a BS in Electrical Engineering and Physics summa cum laude from Tufts University (Medford, MA) in 1977. He then became a K.T. Compton fellow at the Lab of Nuclear Science at MIT, and receiving his PhD in physics from MIT (Cambridge, MA) in 1981 for research on muon pair production at the Intersecting Storage Rings at CERN in Geneva. After two years of developing precision drift chambers at the Lab for High Energy Physics at ETH in Zurich, he joined the Draper Laboratory in Cambridge, MA in 1984, where his research encompassed spacecraft control systems, image processing algorithms, underwater sonar, and precision alignment sensors for large high-energy physics detectors. He joined the Media Lab in 1994, where he is now the Sony Career Development Associate Professor of Media Arts and Sciences at the MIT Media Laboratory. In addition, \he directs the Responsive Environments group, and co-directs the Things That Think Consortium, a group of industry sponsors and Media Lab researchers who explore the extreme fringe of embedded computation, communication, and sensing. His current research interests include sensor systems for human-computer interfaces and ubiquitous computing. Prof. Paradiso’s honors include the 2000 Discover Magazine Award for Technological Innovation, and he has authored over 100 articles and technical reports on topics ranging from computer music to energy harvesting. He is a member of the IEEE, ACM, AIAA, APS, OSA, Sigma Xi, Tau Beta Pi, and Eta Kappa Nu.
> PAPER IDENTIFICATION NUMBER: TITB-00066-2004 <
13
List of Figures Figure I. High level block diagram of the GaitShoe system Figure II. Schematic of the GaitShoe system Figure III. A sample GaitShoe insole Figure IV. GaitShoe hardware mounted on shoes Figure V. Normalized outputs of all GaitShoe sensors Figure VI. The gait cycle Figure VII. Reference frames Figure VIII. Comparison of IMU outputs during walking gait Figure IX. Comparison of the calibrated FSR outputs to the force plate output Figure X. Initial determination of heel-strike and toe-off times Figure XI. Sample results of z-gyroscope integration Figure XII. Dynamic acceleration with XROOM and YROOM components Figure XIII. Sample results of the accelerometer integration Figure XIV. Final determination of heel-strike and toe-off times Figure XV. Histogram of the RMS error between the GaitShoe and BML pitch Figure XVI. Histogram of the RMS error between the GaitShoe and BML displacement Figure XVII. Histogram of the differences between the GaitShoe and BML pitch extrema and corresponding times Figure XVIII. Histogram of the differences between the GaitShoe and BML stride lengths Figure XIX. Histogram of the differences between the GaitShoe and BML heel-strike times and toe-off times List of Tables Table I. Sensors selected for the GaitShoe Table II. Summary of subject characteristics Table III. Gyroscope sensitivities and zero offsets Table IV. Sample pitch extrema of data in Figure X Table V. Accelerometer sensitivities and zero offsets

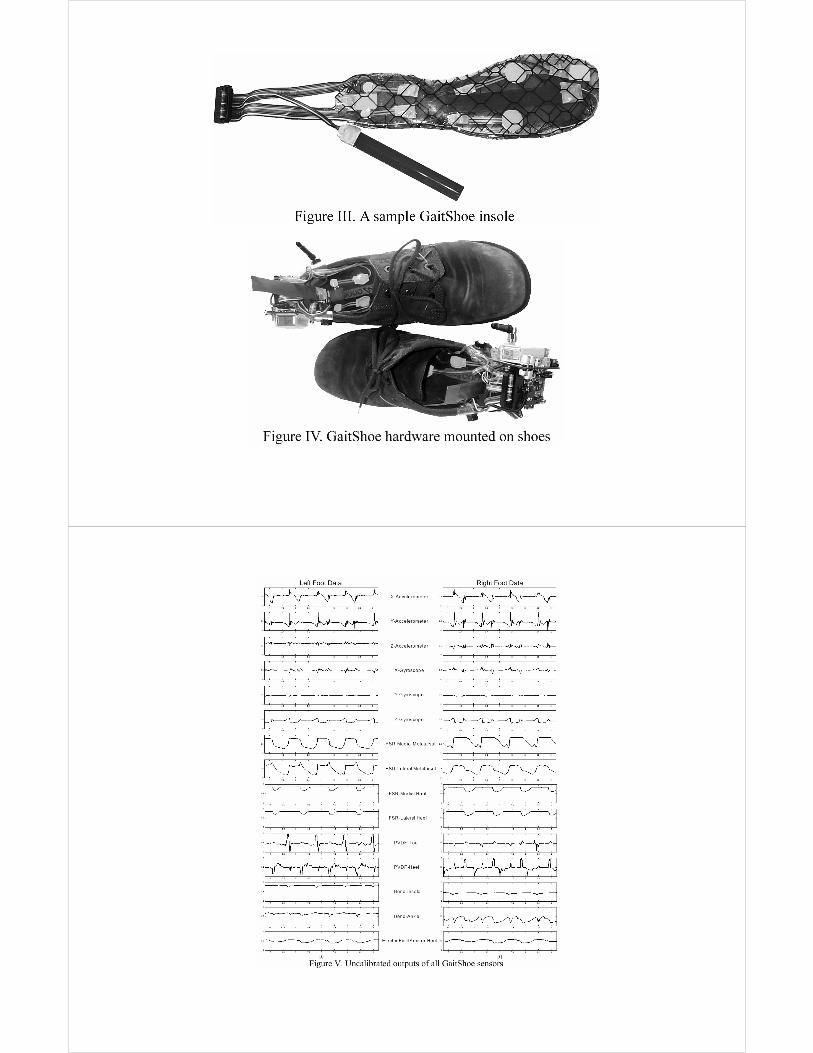
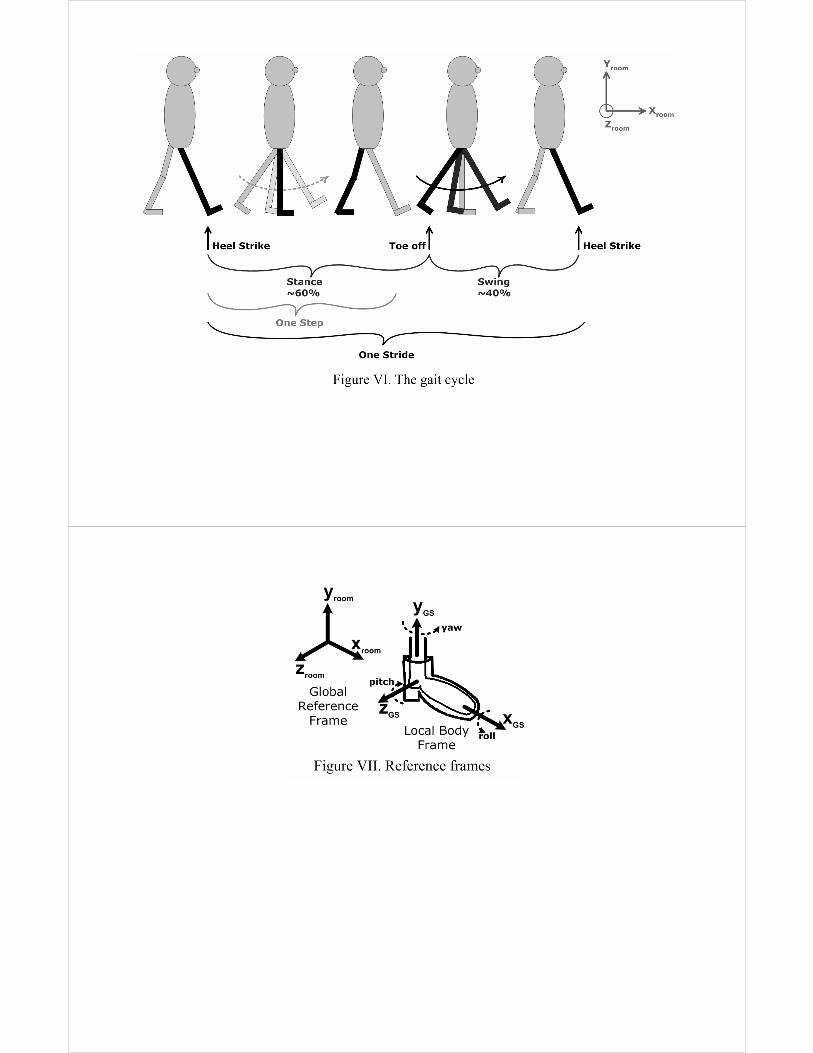


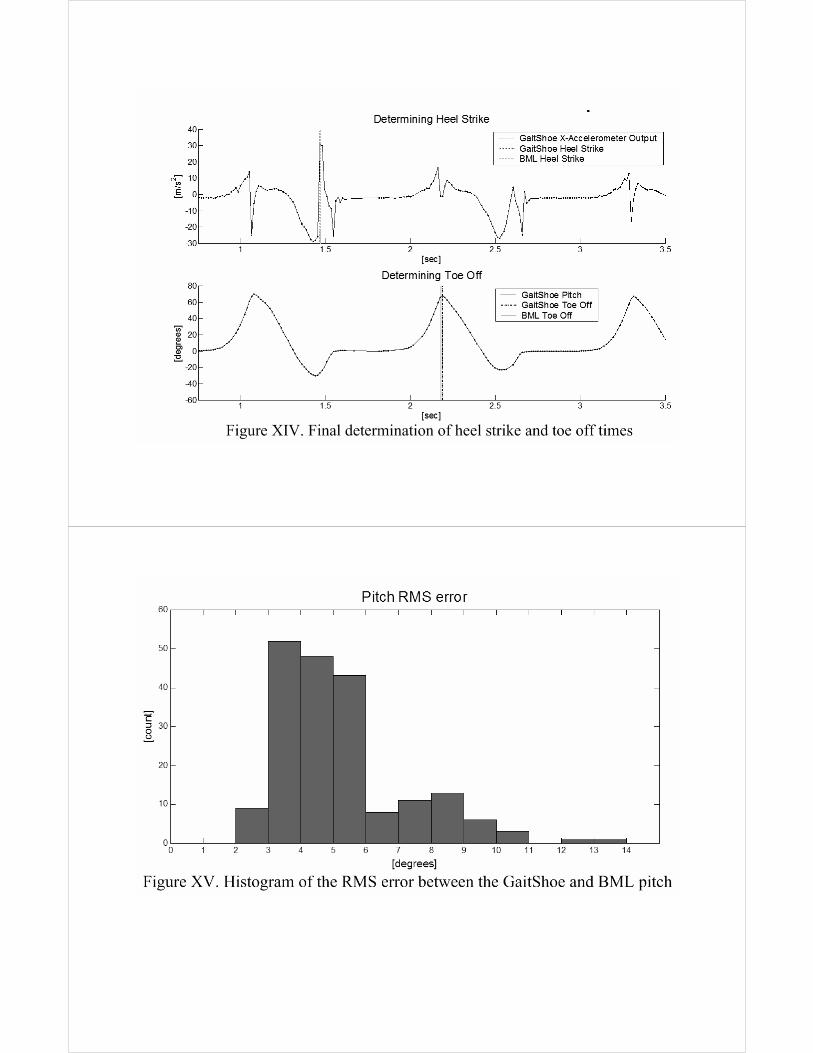
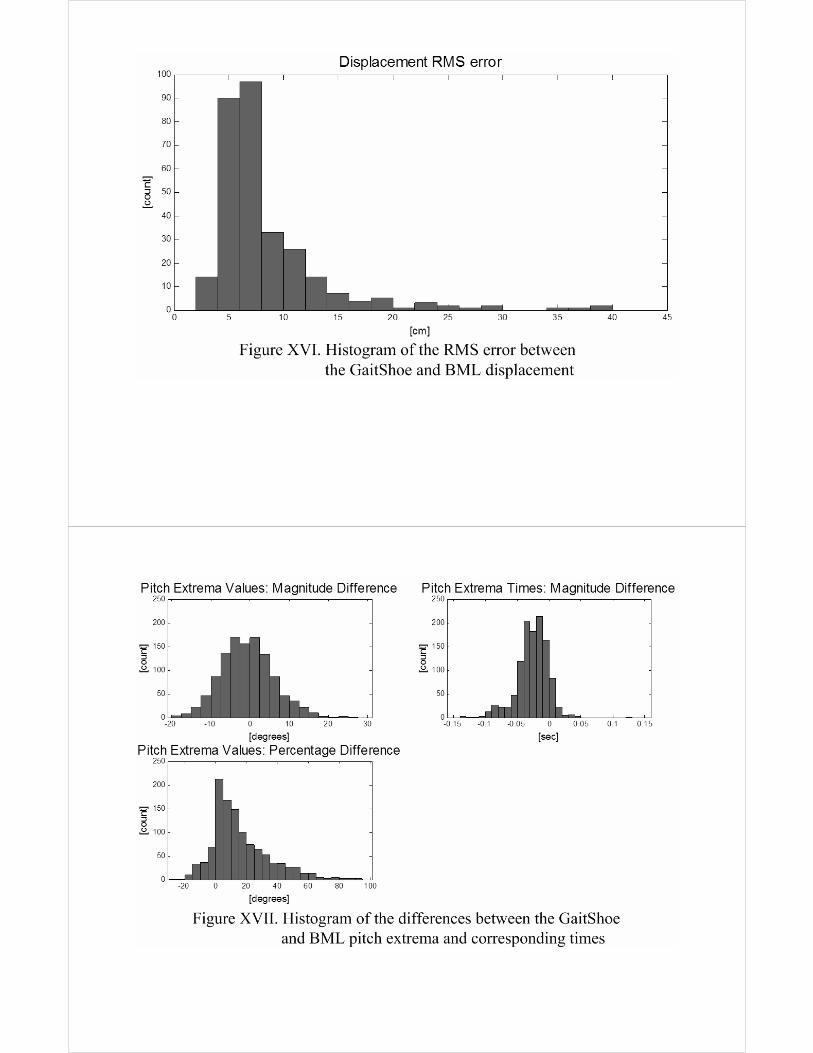


Table ISensors selected for the GaitShoe
Sensor Type Parameters Sensor Output Part Number(s) [Manufacturer]
Accelerometers Stride length and stride velocity, and Voltage change corresponding to acceleration; ADXL202E [Analog Devices]other velocities and displacements single integration of acceleration yields velocity,
double integration yields distance (integrationdone after correcting for gravitational component).
Gyroscopes Orientation Voltage change corresponding to angular velocity; ADXRS150 [Analog Devices]single integration yields angle of rotation. ENC-03J [Murata]
Force sensitive resistors Force distribuition under foot, and Resistance change corresponding to applied force FSR-400 [Interlink Electronics]heel-strike timing and toe-off timing across the sensor, resulting from change in FSR-402 [Interlink Electronics]
compression of the sensor.
Polyvinylidene fluoride strips Heel-strike timing and toe-off timing Voltage change corresponding to dynamic pressure LDT0 [Measurement Specialties]across the sensor.
Bend sensors Plantar flexion/ dorsi- flexion Resistance change corresponding to flexion angle, FLX-01 [The Images Co.]Flexion at metatarsals resulting from strain of the sensor.
Electric Field Sensor Height of foot above floor Capacitance corresponding to distance. MC33794DH [Motorola]
Table IISummary of subject characteristics
Group Gender Breakdown Age [years] Height [m] Weight [kg]Mean Range Mean Range Mean Range
Healthy gait 3 males, 7 females 32.1 24.9-54.0 1.7 1.6-1.8 66.7 48.2-115.0Parkinsonian gait 2 males, 3 females 65.3 53.8-76.4 1.7 1.6-1.8 71.3 52.3-94.5
Table IIIGyroscope sensitivities and zero offsets
Gyroscope Sensitivity Zero OffsetSlope Coeff. of Corr.
IMU-1 X 9.25 x 10-4 1 0.492IMU-1 Y 3.21 x 10⁻⁴ 0.999 0.462IMU-1 Z 3.30 x 10⁻⁴ 1 0.423IMU-2 X 9.33 x 10-4 1 0.508IMU-2 Y 3.32 x 10⁻⁴ 1 0.446IMU-2 Z 3.23 x 10⁻⁴ 1 0.432
Table IVSample pitch extrema of data in Figure IX
MGH BML GaitShoeExtrema [º] Time [s] Extrema [º] Time [s]
Left Foot -26.3 0.45 -25.8 0.4261.7 1.30 63.9 1.25
-26.2 1.68 -28.9 1.6562.3 2.51 60.7 2.47
Right Foot -26.7 1.05 -26.0 1.0459.6 1.91 61.8 1.86

Table VAccelerometer sensitivities and zero offsets
Accelerometer +1g Output -1g Output Sensitivity Zero OffsetMean Std Dev Mean Std Dev
IMU-1 X 0.676 0.001 0.425 0.001 0.13 0.551IMU-1 Y 0.694 0.002 0.442 0.002 0.13 0.568IMU-1 Z 0.619 0.005 0.375 0.002 0.12 0.497IMU-2 X 0.716 0.002 0.467 0.002 0.13 0.591IMU-2 Y 0.684 0.002 0.433 0.004 0.13 0.558IMU-2 Z 0.750 0.003 0.507 0.003 0.12 0.628
Table VIGait Parameters by Subject Group
Healthy Gait Parkinsonian GaitParameter Mean Std Dev Samples Mean Std Dev Samples
Maximum Pitch 70.1° 6.6° 282 56.6° 10.4° 290Minimum Pitch -29.3° 5.3° 331 -21.8° 6.3° 229Stride Length 1.39 m 0.16 m 151 1.13 m 0.26 m 164Stride Time 1.07 s 0.09 s 48 1.22 s 0.21 s 26Percent Stance Time 65.6% 2.5% 48 67.8% 3.5% 26