Ga 68 EDTA PET/CT imaging and plasma filtration rate (GFR...
23
Ga‐68 EDTA PET/CT imaging and plasma clearance for glomerular filtration rate (GFR) quantification: comparison to conventional Cr‐51 EDTA Short title: Ga‐68 EDTA GFR Authors: Michael Hofman 1,2 , David Binns 1 , Val Johnston 1 , Shankar Siva 3 , Mick Thompson 1 , Peter Eu 1 , Marnie Collins 4 , Rodney J. Hicks 1,2 Affiliation: 1 – Centre for Cancer Imaging, Peter MacCallum Cancer Centre, Melbourne, Australia 2 – Department of Medicine, The University of Melbourne, Australia 3 – Radiation Oncology, Peter MacCallum Cancer Centre, Melbourne, Australia 4 – Department of Biostatistics & Clinical Trials, Peter MacCallum Cancer Centre, Melbourne, Australia Corresponding Author: Associate Professor Michael S. Hofman, MBBS, FRACP, FAANMS Physician in Nuclear Medicine and Molecular Imaging Email: [email protected] Centre for Cancer Imaging, Peter MacCallum Cancer Center, 12 St Andrews Place, Melbourne, Australia 3002. Phone: +61 3 9656 1852 Fax: +61 3 9656 1826 Preliminary data from this study was presented as an oral presentation at the Society of Nuclear Medicine and Molecular Imaging (SNMMI) 2013 Annual Meeting, Vancouver, BC, Canada. Final data was presented as an oral presentation at the World Federation in Nuclear Medicine and Biology (WFNMB) 2014 Annual Meeting, Cancun, Mexico DISCLOSURE STATEMENT: The authors have no conflicts of interest to disclose. Word counts: Abstract: 293 words | Manuscript: 2831 words Journal of Nuclear Medicine, published on February 12, 2015 as doi:10.2967/jnumed.114.147843 by on June 28, 2018. For personal use only. jnm.snmjournals.org Downloaded from
Transcript of Ga 68 EDTA PET/CT imaging and plasma filtration rate (GFR...

Ga‐68 EDTA PET/CT imaging and plasma clearance for glomerular filtration rate
(GFR) quantification: comparison to conventional Cr‐51 EDTA
Short title: Ga‐68 EDTA GFR
Authors: Michael Hofman1,2, David Binns1, Val Johnston1, Shankar Siva3, Mick Thompson1, Peter Eu1, Marnie Collins4, Rodney J. Hicks1,2 Affiliation: 1 – Centre for Cancer Imaging, Peter MacCallum Cancer Centre, Melbourne, Australia 2 – Department of Medicine, The University of Melbourne, Australia 3 – Radiation Oncology, Peter MacCallum Cancer Centre, Melbourne, Australia 4 – Department of Biostatistics & Clinical Trials, Peter MacCallum Cancer Centre, Melbourne, Australia Corresponding Author: Associate Professor Michael S. Hofman, MBBS, FRACP, FAANMS Physician in Nuclear Medicine and Molecular Imaging Email: [email protected] Centre for Cancer Imaging, Peter MacCallum Cancer Center, 12 St Andrews Place, Melbourne, Australia 3002. Phone: +61 3 9656 1852 Fax: +61 3 9656 1826 Preliminary data from this study was presented as an oral presentation at the Society of Nuclear Medicine and Molecular Imaging (SNMMI) 2013 Annual Meeting, Vancouver, BC, Canada. Final data was presented as an oral presentation at the World Federation in Nuclear Medicine and Biology (WFNMB) 2014 Annual Meeting, Cancun, Mexico
DISCLOSURE STATEMENT: The authors have no conflicts of interest to disclose.
Word counts:
Abstract: 293 words | Manuscript: 2831 words
Journal of Nuclear Medicine, published on February 12, 2015 as doi:10.2967/jnumed.114.147843by on June 28, 2018. For personal use only. jnm.snmjournals.org Downloaded from

Page | 2
Abstract
Glomerular filtration rate (GFR) can be accurately determined using 51Cr‐
ethylenediaminetetraacetic acid (EDTA) plasma clearance counting, but this is time
consuming and requires technical skills and equipment not always available in imaging
departments. 68Ga‐EDTA can be readily available using an onsite generator while PET/CT
enables both imaging of renal function and accurate camera‐based quantitation of
clearance of activity from blood and its appearance in the urine. This study aims to
assess agreement between 68Ga‐EDTA GFR (68Ga‐GFR) and 51Cr‐EDTA GFR (51Cr‐GFR),
using serial plasma sampling and PET imaging.
Methods: 68Ga‐EDTA and 51Cr‐EDTA were injected concurrently in 31 patients. Dynamic
PET/CT encompassing the kidneys was acquired for 10 minutes followed by three
sequential 3‐minute multi‐bed step acquisitions from kidneys to bladder. PET
quantification was performed using renal activity at 1‐2 minutes (PETinitial), renal
excretion at 2‐10 mins (PETearly) and, subsequently, urinary excretion into the collecting
system and bladder (PETlate). Plasma sampling at 2, 3 and 4 hours were performed, with
68Ga followed by 51Cr counting after positron decay. Level of agreement for GFR
determination was calculated using a Bland‐Altman plot and Pearson correlation
coefficient (PCC).
Results: 51Cr‐GFR ranged from 10 ‐ 220mls/min (mean 85). There was good agreement
between 68Ga‐GFR and 51Cr‐GFR using serial plasma sampling with Bland‐Altman bias of
‐14 ± 20mls/min, PCC of 0.94 (95% CI 0.88‐0.97). Of the three methods used for camera
based quantification, there was highest correlation of plasma sampling derived GFR with
PETlate (PCC of 0.90, 95% CI 0.80‐0.95).
Conclusion: 68Ga‐GFR has good agreement to 51Cr‐GFR for estimation of GFR using serial
plasma counting. PET dynamic imaging provides a method to estimate GFR without
by on June 28, 2018. For personal use only. jnm.snmjournals.org Downloaded from

Page | 3
plasma sampling, with the additional advantage of enabling renal imaging in a single
study. Additional validation in a larger cohort is warranted to further assess utility.
Key terms: Ga‐68, EDTA, Cr‐51 EDTA, glomerular filtration rate, GFR
by on June 28, 2018. For personal use only. jnm.snmjournals.org Downloaded from

Page | 4
INTRODUCTION
The determination of renal function as measured by glomerular filtration rate (GFR),
expressed as the volume of fluid filtered by the renal glomeruli per minute, is utilised for
a wide range of clinical decision making. The “gold standard” method for determining
GFR is inulin clearance but this is expensive, time‐consuming, highly dependent on
collection accuracy and not commonly available. 51Cr‐ethylenediaminetetraacetic acid
(EDTA) blood clearance counting is the most commonly implemented method for
accurate estimation of GFR. Disadvantages includes requirement for multiple plasma
samples, a significant number of manual laboratory processes and a well counter which
is not available in many imaging facilities. It is also not possible to image 51Cr‐EDTA
negating its use for determining split or regional renal function or possible causes of
renal impairment.
A method of estimating renal function is using the Cockroft and Gault formula, which is
based on serum creatinine, weight and age. Whilst useful for identifying patients with
renal impairment, it is too inaccurate across the full range of GFR for purposes such as
determining chemotherapy dosing (1‐3). More recently, the Modification of Diet in
Renal Disease (MDRD) (4) and the CKD‐EPI (Chronic Kidney Disease Epidemiology
Collaboration) (5) formulae have been shown to provide more accurate estimation.
Radiolabelled 99mTc diethylenetriaminepentaacetic acid (DTPA), a small organic
molecular which is excreted solely by the glomerulus, can also be used for estimation of
GFR. This is commonly performed by imaging on a gamma camera but is prone to
several sources of error including attenuation of the activity by soft tissue, inaccuracy of
using a geometric mean when renal geometry is asymmetric, extracellular localisation of
DTPA and variable degree of protein binding of DTPA.
PET/CT offers accurate camera‐based quantification, superior to current gamma camera
technology(6). Although quantitative SPECT/CT is becoming more widely available, the
by on June 28, 2018. For personal use only. jnm.snmjournals.org Downloaded from

Page | 5
long acquisition time renders this technology of limited utility for dynamic imaging. The
three‐dimensional dynamic capability of PET/CT offers a key benefit over SPECT/CT for
applications such as GFR estimation. EDTA can be labelled with 68Ga, a positron‐emitting
isotope, which can be imaged as first described in 1960(7, 8). In this era authors
described that 68Ga‐EDTA had a “low radiation hazard to patient, ease of preparation,
constant availability and low cost making this an excellent tracer for clinical imaging” (9).
More recently, 55Co‐EDTA has been described in an animal study but this technique has
not been translated to human use and is limited by requirement for a cyclotron (10).
Our group demonstrated the excellent imaging characteristics of 68Ga‐EDTA as part a
high throughout dynamic small animal imaging study (11).
Although 68Ga EDTA imaging has been performed using standalone PET(12), there are
no data on the utility of PET/CT imaging for GFR estimation. This study aims to compare
agreement of GFR estimated from 68Ga‐EDTA dynamic PET/CT and plasma sampling to
51Cr‐EDTA plasma sampling. As an exploratory endpoint, we also assessed utility of
PET/CT to determine split renal function.
MATERIALS AND METHODS
Patients. This prospective study aimed to recruit a total of 30 patients scheduled to
undergo a GFR estimation study with 51Cr‐EDTA plasma sampling. The study schema
(Figure 1) was approved by the institutional clinical governance and ethics committee
(Australian New Zealand Clinical Trial Registry Trial ID 12613000845730). The study
included patients of age greater than 18 years, and excluded patients who were
pregnant or breast‐feeding. Patients were instructed to eat and drink normally prior to
the study.
Radiotracer Production and PET/CT Imaging. 68Ga was eluted from a 68Ge/68Ga
generator (IDB Holland BV, Netherlands), purified using a method previously described
(13). This eluate was transferred to a SepPak alumina N column (Waters Corp), washed
by on June 28, 2018. For personal use only. jnm.snmjournals.org Downloaded from

Page | 6
with 10 mL of distilled water and eluted with 10 ml of a solution of 0.05 M EDTA in 0.1
M sodium acetate pH 6. Radiochemical purity was determined with thin layer
chromatography using TLC‐SG plates developed in a solvent system of ammonium
acetate (1 M) : methanol (50:50).
A peripheral intravenous line was inserted in each arm and blood taken to measure
serum creatinine. One cannula was utilised for dose administration and the second for
taking blood samples. The patient was positioned on the PET/CT camera (Biograph 64
with TrueV, Siemen’s Medical Systems) with arms raised. The extended axial field‐of‐
view of 21.6cm available on this scanner enables simultaneous imaging of both kidneys
and inclusion of cardiac blood pool in approximately half the patients. A scout and low‐
dose CT scan were obtained encompassing the diaphragm to the base of the pelvis, and
used to locate the kidneys for the PET acquisition. A median of 56 MBq of 68Ga‐EDTA
(range 46‐95 MBq) and 2‐4 MBq of 51Cr‐EDTA were injected intravenously, followed by
20mL normal saline flush. PET imaging over the kidneys was acquired for 10 minutes
(dynamic 3D list‐mode) and reframed into 20 x 30 second frames. Subsequently, images
were acquired from kidneys to bladder (3 bed steps, 1 minute per bed step) and
repeated a total of three times in short succession (supplementary Movie 1). The low‐
dose CT was utilised for attenuation correction.
GFR Estimation by Plasma Sampling. Injected dose was calculated by assaying the pre‐
and post‐injection syringe in a dose calibrator. Blood samples were taken at 2, 3 and 4
hours post injection. Blood was centrifuged at 2000rpm for 10‐15 minutes to separate
plasma. 2mL plasma was obtained using a pipette. 68Ga counting was performed within
6 hours post injection (Biodex 950 Well Counter, Biodex Medical Systems). 51Cr counting
was performed between 8‐72 hours post injection (Wallac Wizard 1470 Gamma
Counter, PerkinElmer Life and Analytical Sciences). All counts were decay corrected.
51Cr‐EDTA GFR (51Cr‐GFR) was calculated with 3 plasma samples using the slope‐
intercept method as detailed in the British Nuclear Medicine Society guidelines(14). The
by on June 28, 2018. For personal use only. jnm.snmjournals.org Downloaded from

Page | 7
results were not corrected for body surface area, and Brochner‐Mortensen (BM)
correction was not applied.
GFR Estimation by PET/CT Imaging
For each kidney a region of interest (ROI) within an isocontour of SUV greater than 4
was calculated to determine activity in the whole of the kidney including cortex and the
renal pelvis (ROIkidney) (MARVn version 2.35 software, Peter MacCallum Cancer Centre).
A second ROI within isocontour of SUV greater than 12‐20 was determined to delineate
excreted urine (ROIurine), with operator discretion permitted within this range to adapt
the SUV to obtain optimal delineation of the structures. These ROIs were calculated for
each kidney in each frame and time‐activity‐curves (TAC) produced, with the percentage
of the injected dose (%ID) calculated and plotted against time (see Figure 2).
Three methods were used to analyse clearance of 68Ga‐EDTA. Firstly, renal activity at 1‐2
minutes (PETinitial). Secondly, the rate of renal excretion at 2‐10 minutes (PETearly) defined
by subtracting ROIurine from whole kidney activity with the result representing
parenchymal activity, expressed as a %ID. The slope of an initial linear increase phase of
the %ID for each kidney ROIurine was used to represent accumulated excreted urinary
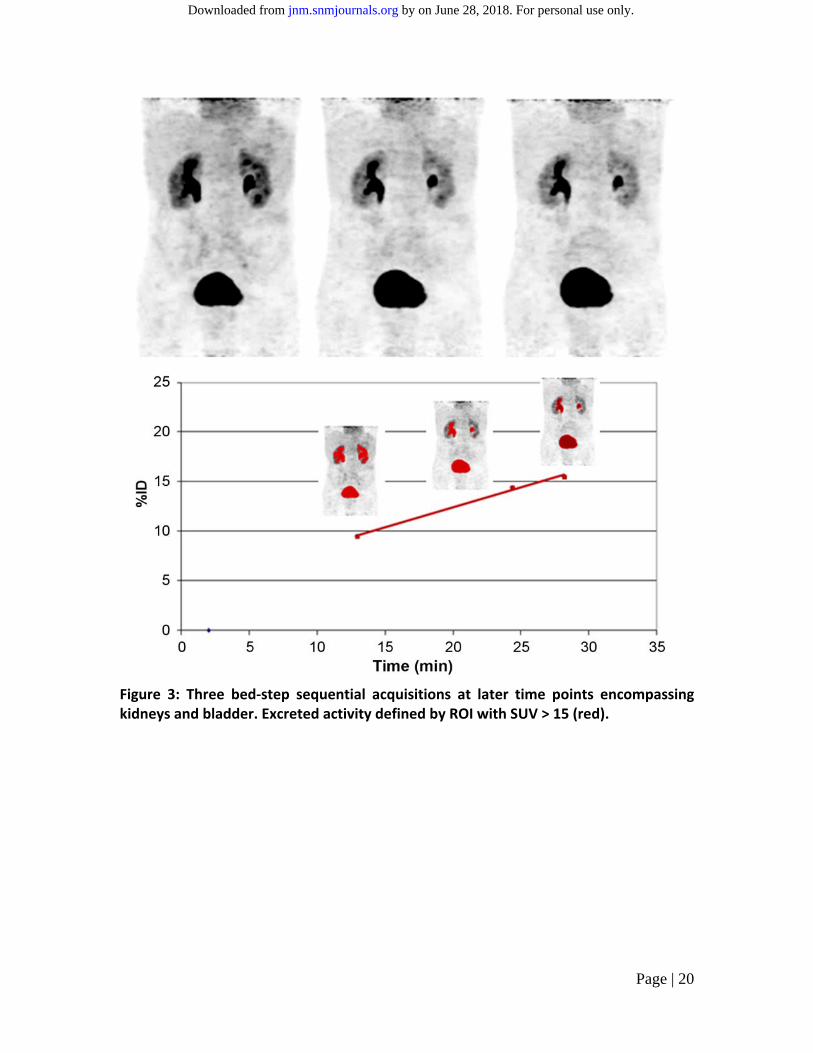
activity, usually 3‐5 minutes after administration. Finally, the rate of excretion into
bladder, ureters and kidneys during imaging acquired at later time period was calculated
(PETlate). %ID accumulated excreted urinary activity during the three later time‐point
images encompassing the kidneys, ureter and bladder were determined and plotted
against time (see Figure 3). %ID at 20 minutes using line of best fit of the 3 time points
defined PETlate.
GFR Estimation by Serum Creatinine and Slit Function Calculation. Estimated GFR
(eGFR) was calculated using serum creatinine taken just prior to 68Ga/51Cr‐EDTA
administration, using the Modification of Diet in Renal Disease (MDRD) (4) and the CKD‐
by on June 28, 2018. For personal use only. jnm.snmjournals.org Downloaded from

Page | 8
EPI (Chronic Kidney Disease Epidemiology Collaboration) (5) Formulae. Body surface
area (BSA) normalisation was removed by multiplying the eGFR by calculated BSA/1.73.
A subset of patients also underwent imaging with 99mTc‐dimercaptosuccinic acid (DMSA)
planar and SPECT/CT performed on a Symbia TruePoint 6 hybrid device (Siemen’s
Medical Solutions). Split function was determined using a manually drawn ROI around of
each kidney and geometric mean for planar imaging, and a three‐dimensional
automated contour using a threshold of 20% of maximum counts for SPECT/CT. For
PET/CT, %ID using methods (a) and (b) above were used to determine split function.
Statistics. A Bland‐Altman plot(15) was used to determine the level of agreement for
68Ga‐EDTA to 51Cr‐EDTA plasma sampling, both of these to eGFR and also split function
derived from DMSA SPECT/CT to planar and PET/CT. Pearson’s correlation coefficient
(PCC) was also used to correlate these measures in addition to 68Ga‐EDTA PET based
image measures of GFR with 68Ga‐EDTA. Analysis was performed with PRISM GraphPad
version 6 (GraphPad Software Inc.).
RESULTS
31 GFR studies were performed in 25 patients. In one episode, imaging failed to include
the entire bladder resulting in inability to perform camera‐based GFR estimation. Thus,
comparative 68Ga‐EDTA and 51Cr‐EDTA plasma sampling results were available in 31
patients, whereas PET/CT‐based GFR estimation was available in 30 patients. Patient
age ranged from 47 – 91 (median 75). 51Cr‐EDTA plasma GFR ranged from 10 – 220
ml/min (mean 85 ± 48). Two patients had severe renal impairment, 8 moderate, 8 mild
and 13 had normal renal function using 51Cr‐GFR less than 30, 60 and 90 mls/min as cut‐
offs to define abnormal groups, respectively. Seventeen studies were performed in
patients with neuroendocrine tumours (NET) being planned or followed for peptide
receptor radionuclide therapy (PRRT) and 14 in patients with renal cell carcinomas (RCC)
being evaluated for surgery or sterotactic radiotherapy to the kidney. The latter group
by on June 28, 2018. For personal use only. jnm.snmjournals.org Downloaded from
Page | 9
also had split renal function estimation prior to treatment. Four patients had two
studies, and 1 patient had three studies to assess effects of intervening therapy, either
PRRT for the NET patients, or stereotactic radiotherapy for the RCC patients. In these
patients, the time between studies ranged between 27 and 338 days (median 55 days).
Plasma Sampling. There was near perfect exponential fit of the 3 plasma samples with
r2 of 0.98 and 0.99 for 51Cr‐GFR and 68Ga‐GFR, respectively. There was high correlation
of 68Ga‐GFR and 51Cr‐GFR plasma sampling with PCC of 0.94 (95% CI 0.88‐0.97) (Figure
4A). There was good agreement between 68Ga‐GFR and 51Cr‐GFR plasma sampling,
Bland Altman bias for GaEDTA of ‐14 ± 20 (Figure 4B). In patients with GFR over 150mL,
however, there was significant under‐estimation of 68Ga‐GFR compared to 51Cr‐GFR. The
high PCC indicates a proportional bias increasing with GFR.
Camera Based Measurement. There was highest correlation between PETlate and 68Ga‐
GFR with PCC of 0.90 (95% CI 0.80 – 0.95). For PETearly and PETinitial there was lower
correlation with PCC of 0.81 (95% CI 0.62‐0.90, p=0.1) and 0.77 (95% CI 0.56‐0.89,
p=0.02), respectively. In one patient, imaging was delayed enabling calculation of PETlate,
but not PETearly or PETinitial. Using PETlate, GFR can be derived with the following formula:
GFR (mls/min) = 7.7 x PETlate – 3.9 (Eq. 1)
Correlation of camera based measurement and 51Cr‐GFR was also performed
demonstrating a PCC of 0.88 (95% CI 0.76‐0.94), 0.76 (95% CI 0.54‐0.88) and 0.72 (0.49‐
0.86) for PETlate, PETearly and PETinitial.
Agreement with eGFR. There was good agreement of 68Ga‐EDTA and 51Cr‐EDTA GFR
derived from plasma sampling to eGFR, with Bland‐Altman bias of 7 ± 24 and 4 ± 30 for
51Cr‐GFR agreement to MDRD eGFR and CKD‐EPI, compared with ‐6 ± 14 and 18 ± 20 for
68Ga‐GFR, respectively.
by on June 28, 2018. For personal use only. jnm.snmjournals.org Downloaded from

Page | 10
Split Function. In 11 studies, a planar and SPECT/CT DMSA was also performed for
evaluation of split renal function. These were performed in patients prior to stereotactic
radiotherapy for known renal cell carcinomas. There was good agreement between
planar and SPECT/CT DMSA with a Bland‐Altman bias for left‐to‐right split function of ‐
1% ± 5 (95% CI ‐9 to 12%) but in two patients, planar DMSA differed by more than 10%.
Both had severe renal dysfunction with overlying hepatic activity contributing counts to
the right kidney on planar imaging. Bland‐Altman bias for agreement of GaEDTA PET/CT
compared to DMSA SPECT/CT was 3% ± 7 (95% CI ‐11 to 17%). In five patients there was
more than 10% difference between PET/CT and SPECT/CT.
DISCUSSION
51Cr‐EDTA has been considered the radionuclide agent of choice for measuring GFR
owing to its clearance being similar to that of inulin, with the first published use in
humans in 1967 (16, 17). This can be performed with a single‐sample technique (18),
although use of two or three blood samples increases accuracy and is recommended for
patients with significant renal dysfunction (19, 20). 51Cr‐EDTA is not available in many
countries and need for simplification has led to some adopting gamma camera GFR
estimation with 99mTc‐DTPA planar imaging which is prone to error(21). In particular,
calculation of renal activity for imaging‐based approaches necessitates calculation of an
estimate of renal depth to correct for tissue attenuation but has limited accuracy.
PET/CT offers numerous advantages including rapid and accurate three‐dimensional
quantitative capability. 68Ga is increasingly available owing to its use for somatostatin‐
receptor imaging (22) and is becoming more widely available through an on‐site
generator, which has a shelf life of up to 9‐12 months. 68Ga‐EDTA preparation is
straightforward and potentially provides a cost‐effective alternative to plasma sampling.
In this study, there is good but not perfect agreement between 68Ga‐ and 51Cr‐EDTA GFR
calculated using plasma sampling, despite both radiotracers being injected
simultaneously and the same samples being used for positron and gamma counting. In
by on June 28, 2018. For personal use only. jnm.snmjournals.org Downloaded from

Page | 11
particular, in patients with a 51Cr‐EDTA GFR > 150mL ml/min, the 68Ga‐GFR was
significantly lower. Within the high normal range, however, agreement is less important
as management is unlikely to be altered. The reason for this discordance is unclear but
may be due to differences in plasma binding, tubular secretion or dissociation in vivo. A
recent study confirms high labelling efficacy and low red blood cell or protein binding of
68Ga‐EDTA(23).
Studies have demonstrated that 51Cr‐EDTA systemically over‐estimates GFR by
approximately 10% using the single‐exponential method more marked at high GFR (24,
25). A post‐hoc analysis after Brochner‐Mortensen correction(26) of the 51Cr‐GFR,
demonstrated higher agreement and correlation with 68Ga‐GFR with Bland‐Altman Bias
of ‐1.3 (SD 11, 95% CI ‐23 to 20) and PCC of 0.95. Our current study demonstrates good
agreement of both 68Ga‐GFR and 51Cr‐GFR to MDRD or CKD‐EPI eGFR.
Whilst plasma clearance provides a reliable estimate of renal clearance, measuring urine
clearance is more direct and therefore less subject to non‐renal variations or the
limitations posed by low activity in blood at late time‐points. PET provides the ability to
non‐invasively quantify regional activity in MBq/mL with near perfect agreement to
known concentrations of activities in phantom experiments (27). The accurate and
dynamic ability of PET to quantify activity in three‐dimensions makes it ideal for
applications such as GFR estimation. Current camera‐based quantification of GFR largely
rely on using early renal cortical uptake as described by Gates(28). In this study, we have
found that measurement of activity actually filtered into the collecting system can be
readily quantified, providing a more direct means of estimating GFR. In this study, this
was limited by estimating GFR at an early time point when the radiopharmaceutical is
more subject to non‐renal variations. Nevertheless, our results show good agreement to
plasma‐based sampling at 2‐4 hours, particularly in patients with impaired GFR.
by on June 28, 2018. For personal use only. jnm.snmjournals.org Downloaded from

Page | 12
In our facility, a tertiary cancer centre, common clinical indications for measuring GFR
include dose adjustment for renal‐excreted chemotherapy agents such as carboplatin
(1), determination of overall and split renal function prior to abdominal
radiotherapy(29) and monitoring of renal function during radionuclide therapy if the
agent is excreted by the kidneys (30). Many patients undergo both a 51Cr‐EDTA and
99mTc‐DTPA or 99mTc‐DMSA study to determine split renal function. This study also
demonstrates the potential of 68Ga‐EDTA PET/CT to assess both overall and differential
or regional renal function, although further research is needed to validate this. It also
has the potential to replace 99mTc‐DTPA renography including evaluation of renal tract
obstruction given its three‐dimensional dynamic capability, although MAG‐3 remains
the agent of choice as it is predominantly secreted(31). The short half‐life of 68Ga also
make it ideal for renography prior to and following ACE inhibition to assess for
hemodynamically significant renal artery stenosis (32).
This study is limited by a relatively small cohort of patients with elderly age and
concomitant malignancy. The field‐of‐view of a PET camera does not enable the kidneys,
ureters and bladder to be encompassed in a single of view. As urine excretion and
transit occurs, some of the activity passing from kidneys to bladder during the 3‐minute
imaging time may therefore be double counted; resultant error is considered small and
minimised as the same methodology is used at all three delayed time‐points. The study
is strengthened by including patients with a broad range of GFR including normal, mild,
moderate and severe renal dysfunction. Further optimisation, including both image
acquisition and processing technique, may improve results. The effective radiation dose
from the 68Ga‐EDTA study is approximately 1.2 mSv from the PET component (33) and
0.25 mSv from an ultra‐low dose CT used for attenuation correction.
CONCLUSION
Assessment of GFR with 68Ga‐EDTA is feasible with good agreement of plasma sampling
compared to conventional 51Cr‐EDTA. Camera based GFR estimation correlates highly
by on June 28, 2018. For personal use only. jnm.snmjournals.org Downloaded from

Page | 13
with the plasma sampling technique enabling non‐invasive and rapid GFR estimation.
The ability to image EDTA with PET/CT also provides additional information and may
improve diagnostic algorithms in a range of renal diseases. Additional validation in a
larger cohort is warranted to further assess utility.
by on June 28, 2018. For personal use only. jnm.snmjournals.org Downloaded from

Page | 14
REFERENCES
1. Millward MJ, Webster LK, Toner GC, et al. Carboplatin dosing based on
measurement of renal function--experience at the Peter MacCallum Cancer Institute. Aust
N Z J Med. 1996;26:372-379.
2. Shepherd ST, Gillen G, Morrison P, et al. Performance of formulae based
estimates of glomerular filtration rate for carboplatin dosing in stage 1 seminoma. Eur J
Cancer. 2014;50:944-952.
3. Craig AJ, Samol J, Heenan SD, Irwin AG, Britten A. Overestimation of
carboplatin doses is avoided by radionuclide GFR measurement. Br J Cancer.
2012;107:1310-1316.
4. Levey AS, Bosch JP, Lewis JB, Greene T, Rogers N, Roth D. A more accurate
method to estimate glomerular filtration rate from serum creatinine: a new prediction
equation. Modification of Diet in Renal Disease Study Group. Ann Intern Med.
1999;130:461-470.
5. Levey AS, Stevens LA, Schmid CH, et al. A new equation to estimate glomerular
filtration rate. Ann Intern Med. 2009;150:604-612.
6. Hicks RJ, Hofman MS. Is there still a role for SPECT-CT in oncology in the PET-
CT era? Nat Rev Clin Oncol. 2012;9:712-720.
7. Yano Y, Anger HO. A Gallium-68 positron cow for medical use. J Nucl Med.
1964;5:484-487.
8. Gleason GI. A positron cow. Int J Appl Radiat Isot. 1960;8:90-94.
9. Schaer LR, Anger HO, Gottschalk A. Gallium edetate 68Ga experiences in brain-
lesion detection with the positron camera. JAMA. 1966;198:811-813.
by on June 28, 2018. For personal use only. jnm.snmjournals.org Downloaded from

Page | 15
10. Goethals P, Volkaert A, Vandewielle C, Dierckx R, Lameire N. 55Co-EDTA for
renal imaging using positron emission tomography (PET): a feasibility study. Nucl Med
Biol. 2000;27:77-81.
11. Aide N, Desmonts C, Beauregard JM, et al. High throughput static and dynamic
small animal imaging using clinical PET/CT: potential preclinical applications. Eur J
Nucl Med Mol Imaging. 2010;37:991-1001.
12. Yamashita M, Inaba T, Kawase Y, et al. Quantitative measurement of renal
function using Ga-68-EDTA. Tohoku J Exp Med. 1988;155:207-208.
13. Zhernosekov KP, Filosofov DV, Baum RP, et al. Processing of generator-
produced 68Ga for medical application. J Nucl Med. 2007;48:1741-1748.
14. Fleming JS, Zivanovic MA, Blake GM, Burniston M, Cosgriff PS, British
Nuclear Medicine Society Guidelines for the measurement of glomerular filtration rate
using plasma sampling. Nucl Med Commun. 2004;25:759-769.
15. Bland JM, Altman DG. Statistical methods for assessing agreement between two
methods of clinical measurement. Lancet. 1986;327:307-310.
16. Garnett ES, Parsons V, Veall N. Measurement of glomerular filtration-rate in man
using a 51Cr-edetic-acid complex. Lancet. 1967;289:818-819.
17. Favre HR, Wing AJ. Simultaneous 51Cr edetic acid, inulin, and endogenous
creatinine clearances in 20 patients with renal disease. Br Med J. 1968;1:84-86.
18. Groth S, Aasted M. 51Cr-EDTA clearance determined by one plasma sample.
Clin Physiol. 1981;4:417-425.
by on June 28, 2018. For personal use only. jnm.snmjournals.org Downloaded from

Page | 16
19. Blaufox MD, Aurell M, Bubeck B, et al. Report of the Radionuclides in
Nephrourology Committee on Renal Clearance. J Nucl Med. 1996;37:1883-1890.
20. Goates JJ, Morton KA, Whooten WW, et al. Comparison of methods for
calculating glomerular filtration rate: technetium-99m-DTPA scintigraphic analysis,
protein-free and whole-plasma clearance of technetium-99m-DTPA and iodine-125-
iothalamate clearance. J Nucl Med. 1990;31:424-429.
21. Mulligan JS, Blue PW, Hasbargen JA. Methods for measuring GFR with
technetium-99m-DTPA: an analysis of several common methods. J Nucl Med.
1990;31:1211-1219.
22. Hofman MS, Kong G, Neels OC, Eu P, Hong E, Hicks RJ. High management
impact of Ga-68 DOTATATE (GaTate) PET/CT for imaging neuroendocrine and other
somatostatin expressing tumours. J Med Imaging Radiat Oncol. 2012;56:40-47.
23. Lee JY, Jeong JM, Kim YJ, et al. Preparation of Ga-68-NOTA as a renal PET
agent and feasibility tests in mice. Nucl Med Biol. 2014;41:210-215.
24. Hilson AJ. Overestimation of true renal clearance by conventional measurements
of GFR using 51Cr-EDTA. Eur J Nucl Med Mol Imaging. 2003;30:934; author reply 935.
25. Moore AE, Park-Holohan SJ, Blake GM, Fogelman I. Conventional
measurements of GFR using 51Cr-EDTA overestimate true renal clearance by 10
percent. Eur J Nucl Med Mol Imaging. 2003;30:4-8.
26. Brochner-Mortensen J, Jodal L. Reassessment of a classical single injection 51Cr-
EDTA clearance method for determination of renal function in children and adults. Part
II: Empirically determined relationships between total and one-pool clearance. Scand J
Clin Lab Invest. 2009;69:314-322.
by on June 28, 2018. For personal use only. jnm.snmjournals.org Downloaded from

Page | 17
27. Seo Y, Teo BK, Hadi M, Schreck C, Bacharach SL, Hasegawa BH. Quantitative
accuracy of PET/CT for image-based kinetic analysis. Med Phys. 2008;35:3086-3089.
28. Gates GF. Computation of glomerular filtration rate with Tc-99m DTPA: an in-
house computer program. J Nucl Med. 1984;25:613-618.
29. Lopez-Gaitan J, Ebert MA, Robins P, et al. Radiotherapy of abdomen with precise
renal assessment with SPECT/CT imaging (RAPRASI): design and methodology of a
prospective trial to improve the understanding of kidney radiation dose response. BMC
Cancer. 2013;13:381.
30. Kashyap R, Jackson P, Hofman MS, et al. Rapid blood clearance and lack of
long-term renal toxicity of 177Lu-DOTATATE enables shortening of renoprotective
amino acid infusion. Eur J Nucl Med Mol Imaging. 2013;40:1853-1860.
31. O'Reilly P, Aurell M, Britton K, Kletter K, Rosenthal L, Testa T. Consensus on
diuresis renography for investigating the dilated upper urinary tract. Radionuclides in
Nephrourology Group. Consensus Committee on Diuresis Renography. J Nucl Med.
1996;37:1872-1876.
32. Szabo Z, Xia J, Mathews WB, Brown PR. Future direction of renal positron
emission tomography. Semin Nucl Med. 2006;36:36-50.
33. Radiation dose to patients from radiopharmaceuticals (addendum 2 to ICRP
publication 53). Ann ICRP. 1998;28:1-126.
by on June 28, 2018. For personal use only. jnm.snmjournals.org Downloaded from

Page | 18
Figure 1: Study schema
by on June 28, 2018. For personal use only. jnm.snmjournals.org Downloaded from

Page | 19
Figure 2: Dynamic PET/CT acquisition between 0 to 10 minutes showing maximum
intensity projection overlayed with renal (green) and excreted activity (red) defined by
SUV >4 and >15, respectively. Time activity curves were generated.
by on June 28, 2018. For personal use only. jnm.snmjournals.org Downloaded from
Page | 20
Figure 3: Three bed‐step sequential acquisitions at later time points encompassing kidneys and bladder. Excreted activity defined by ROI with SUV > 15 (red).
by on June 28, 2018. For personal use only. jnm.snmjournals.org Downloaded from

Page | 21
Figure 4: 68Ga‐EDTA GFR (68Ga‐GFR) versus 51Cr‐EDTA GFR (51Cr‐GFR) by plasma
sampling. A: Correlation of 68Ga‐GFR and 51Cr‐GFR with Pearsons Correlation
Coefficient (PCC). B: Bland‐Altman plot illustrating agreement of 68Ga‐GFR to 51Cr‐GFR,
mean bias (dashed line), 95% confidence interval (dotted line).
by on June 28, 2018. For personal use only. jnm.snmjournals.org Downloaded from

Page | 22
Figure 5: Correlation of PET imaging derived GFR and 68Ga‐EDTA by plasma sampling.
by on June 28, 2018. For personal use only. jnm.snmjournals.org Downloaded from

Doi: 10.2967/jnumed.114.147843Published online: February 12, 2015.J Nucl Med. HicksMichael S. Hofman, David Binns, Val Johnston, Shankar Siva, Mich Thompson, Peter Eu, Marnie Collins and Rodney J. quantification: comparison to conventional Cr-51 EDTAGa-68 EDTA PET/CT imaging and plasma clearance for glomerular filtration rate (GFR)
http://jnm.snmjournals.org/content/early/2015/02/11/jnumed.114.147843This article and updated information are available at:
http://jnm.snmjournals.org/site/subscriptions/online.xhtml
Information about subscriptions to JNM can be found at:
http://jnm.snmjournals.org/site/misc/permission.xhtmlInformation about reproducing figures, tables, or other portions of this article can be found online at:
and the final, published version.proofreading, and author review. This process may lead to differences between the accepted version of the manuscript
ahead of print area, they will be prepared for print and online publication, which includes copyediting, typesetting,JNMcopyedited, nor have they appeared in a print or online issue of the journal. Once the accepted manuscripts appear in the
. They have not beenJNM ahead of print articles have been peer reviewed and accepted for publication in JNM
(Print ISSN: 0161-5505, Online ISSN: 2159-662X)1850 Samuel Morse Drive, Reston, VA 20190.SNMMI | Society of Nuclear Medicine and Molecular Imaging
is published monthly.The Journal of Nuclear Medicine
© Copyright 2015 SNMMI; all rights reserved.
by on June 28, 2018. For personal use only. jnm.snmjournals.org Downloaded from