Journal of Nuclear Medicine, published on October 8,...
30
Automated Differential Diagnosis of Early Parkinsonism using Metabolic Brain Networks: A Validation Study Madhavi Tripathi 1* , Chris C. Tang 2* , Andrew Feigin 2 , Ivana De Lucia 2 , Amir Nazem 2 , Vijay Dhawan 2 , and David Eidelberg 2 1 Department of Nuclear Medicine & PET, All India Institute of Medical Sciences, New Delhi 110029, India; 2 Center for Neurosciences, The Feinstein Institute for Medical Research, Manhasset, New York, 11030, USA *These authors contributed equally to this work. For correspondence or reprints contact: David Eidelberg, MD Center for Neurosciences, The Feinstein Institute for Medical Research 350 Community Drive, Manhasset, NY 11030, USA Phone: (516) 562-2498; Fax: (516) 562-1008; E-mail: [email protected] Co-First Authors: Madhavi Tripathi, MD Department of Nuclear Medicine & PET, All India Institute of Medical Sciences Chris C. Tang, MD, PhD Center for Neurosciences, The Feinstein Institute for Medical Research Running Title: Differential Diagnosis of Parkinsonism Word Counts: Title: 105 chars; Running Title: 38 chars; Abstract: 317 wds; Text: 6,072 wds; References: 36; Tables: 2; Figures: 4 Supplemental Data: Tables: 1 Financial Support: This work was funded by a fellowship grant to M.T. from the Indo-US Science and Technology Form and an intramural grant from Director, INMAS. This work was also supported in part by the National Institute of Neurological Disorders and Stroke Morris K. Udall Center of Excellence for Parkinson’s Disease Research at The Feinstein Institute for Medical Research (P50 NS071675 to D.E.). The content is solely the responsibility of the authors and does not necessarily represent the official views of the National Institute of Neurological Disorders and Stroke or the National Institutes of Health. The sponsor did not play a role in study design, collection, analysis and interpretation of data, writing of the report or in the decision to submit the paper for publication. Journal of Nuclear Medicine, published on October 8, 2015 as doi:10.2967/jnumed.115.161992 by on June 15, 2018. For personal use only. jnm.snmjournals.org Downloaded from
Transcript of Journal of Nuclear Medicine, published on October 8,...

Automated Differential Diagnosis of Early Parkinsonism using Metabolic Brain Networks: A Validation Study
Madhavi Tripathi1*, Chris C. Tang2*, Andrew Feigin2, Ivana De Lucia2, Amir Nazem2, Vijay Dhawan2, and David Eidelberg2
1 Department of Nuclear Medicine & PET, All India Institute of Medical Sciences, New Delhi 110029, India; 2 Center for Neurosciences, The Feinstein Institute for Medical Research, Manhasset, New York, 11030, USA *These authors contributed equally to this work. For correspondence or reprints contact: David Eidelberg, MD Center for Neurosciences, The Feinstein Institute for Medical Research 350 Community Drive, Manhasset, NY 11030, USA Phone: (516) 562-2498; Fax: (516) 562-1008; E-mail: [email protected] Co-First Authors: Madhavi Tripathi, MD Department of Nuclear Medicine & PET, All India Institute of Medical Sciences Chris C. Tang, MD, PhD Center for Neurosciences, The Feinstein Institute for Medical Research Running Title: Differential Diagnosis of Parkinsonism Word Counts: Title: 105 chars; Running Title: 38 chars; Abstract: 317 wds; Text: 6,072 wds; References: 36; Tables: 2; Figures: 4 Supplemental Data: Tables: 1 Financial Support: This work was funded by a fellowship grant to M.T. from the Indo-US Science and Technology Form and an intramural grant from Director, INMAS. This work was also supported in part by the National Institute of Neurological Disorders and Stroke Morris K. Udall Center of Excellence for Parkinson’s Disease Research at The Feinstein Institute for Medical Research (P50 NS071675 to D.E.). The content is solely the responsibility of the authors and does not necessarily represent the official views of the National Institute of Neurological Disorders and Stroke or the National Institutes of Health. The sponsor did not play a role in study design, collection, analysis and interpretation of data, writing of the report or in the decision to submit the paper for publication.
Journal of Nuclear Medicine, published on October 8, 2015 as doi:10.2967/jnumed.115.161992by on June 15, 2018. For personal use only. jnm.snmjournals.org Downloaded from

Tripathi et al. 1
ABSTRACT
The differentiation of idiopathic Parkinson’s disease (IPD) from multiple system atrophy (MSA)
and progressive supranuclear palsy (PSP), the most common atypical parkinsonian “look-alike”
syndromes (APS), can be clinically challenging. In these disorders, diagnostic inaccuracy is
more frequent early in the clinical course when signs and symptoms are mild. Diagnostic
inaccuracy may be particularly relevant in trials of potential disease-modifying agents, which
typically involve participants with early clinical manifestations. In an initial study (Tang et al.,
Lancet Neurol 2010), we developed a probabilistic algorithm to classify subjects with clinical
parkinsonism but uncertain diagnosis based upon the expression of metabolic covariance patterns
for IPD, MSA, and PSP. Classifications based on this algorithm agreed closely with final clinical
diagnosis. Nonetheless, blinded prospective validation is required before routine use of the
algorithm can be considered. Methods: We used metabolic imaging to study an independent
cohort of 129 parkinsonian subjects with uncertain diagnosis; 77 (60%) had symptoms for 2
years or less at the time of imaging. After imaging, subjects were followed by a blinded
movement disorders specialist for an average of 2.2 years before a final diagnosis was made. By
applying the algorithm to the individual scan data, the probabilities of IPD, MSA and PSP were
computed and used to classify each of the subjects. The resulting image-based classifications
were then compared to the final clinical diagnosis. Results: Using the original two-level
logistical classification algorithm, IPD subjects were distinguished from APS with 94%
specificity and 96% positive predictive value (PPV). The algorithm achieved 90% specificity and
85% PPV for MSA, and 94% specificity and 94% PPV for PSP. Diagnostic accuracy was
similarly high (specificity and PPV > 90%) for parkinsonian subjects with short symptom
duration. In addition, 25 subjects were classified as Level-I Indeterminate Parkinsonism and four
by on June 15, 2018. For personal use only. jnm.snmjournals.org Downloaded from

Tripathi et al. 2
more subjects as Level-II Indeterminate APS. Conclusion: Automated pattern-based image
classification can improve diagnostic accuracy in patients with parkinsonism, even at early
disease stages.
Keywords: Parkinson’s disease, differential diagnosis, brain networks, glucose metabolism,
automated classification algorithm
by on June 15, 2018. For personal use only. jnm.snmjournals.org Downloaded from

Tripathi et al. 3
INTRODUCTION
Accurate early diagnosis of Parkinson’s disease (IPD) remains a clinical challenge. Motor signs
of parkinsonism, particularly akinesia and rigidity, feature prominently in the presentation of IPD
as well as atypical parkinsonian “look-alike” syndromes (APS), including multiple system
atrophy (MSA) and progressive supranuclear palsy (PSP). As a result, up to 35% of patients with
parkinsonism are initially misdiagnosed (1) and an even lower accuracy (53%) is found in
clinical diagnosis of early IPD patients responsive to medication (2). Accurate differential
diagnosis of individual subjects in this population is critical for a number of reasons. IPD and
APS differ with respect to the natural history of the illness and the response to antiparkinsonian
treatment (3). Misdiagnosis can, therefore, be a relevant consideration in the design of clinical
trials to assess new therapies, particularly those directed at early, untreated patients (4).
A number of structural magnetic resonance imaging (MRI) techniques have been used to
discriminate individuals with IPD from APS based upon differences in tissue signal and/or
regional volume loss (5,6). Radionuclide imaging with positron emission tomography (PET) and
single photon emission computed tomography (SPECT) in conjunction with dopaminergic
tracers have also been proposed for this purpose (7,8). Differential diagnosis of parkinsonian
disorders based on these methods has generally relied upon the analysis of imaging signal from
single brain regions, most notably the basal ganglia. Given that the basal ganglia are involved in
both IPD and APS, measurements of anatomical and/or functional change in these regions may
not be specific enough for accurate differential diagnosis at the individual case level.
An alternative imaging approach for the differential diagnosis of parkinsonian movement
disorders involves spatial covariance mapping, a form of pattern analysis (9-11).
Neurodegenerative disorders such as IPD, MSA, and PSP are characterized by stereotyped
by on June 15, 2018. For personal use only. jnm.snmjournals.org Downloaded from
Tripathi et al. 4
patterns of regional change on postmortem examination. Analogously, in living patients, these
illnesses are associated with characteristic disease-related patterns of abnormal cerebral function
identified in the resting state (9,12,13). Given the high reproducibility of disease-related
topographies across individual subjects and populations (9,12,14,15), quantitative indices of
pattern expression can be used as a functional descriptor of disease progression at the network
level in individual subjects (11,16,17).
Along these lines, we explored the possibility of using subject expression value for
multiple disease-related patterns in concert to categorize individual patients based upon their
scans. As a proof-of-principle, we developed a logistical regression algorithm based on
computed subject scores for previously validated metabolic covariance patterns for IPD (PDRP:
9,14,18,19), MSA (MSARP: 20,21), and PSP (PSPRP: 20,22) to classify a North American
training cohort of 167 individuals with parkinsonism with an inconclusive clinical diagnosis.
These subjects underwent metabolic brain imaging an average of 2.6 years before a final clinical
diagnosis was made. The pattern-based probabilistic algorithm provided high specificity (94-
97%) in discriminating IPD from APS as well as MSA from PSP. Leave-one-out cross validation
was applied to these data revealing high level replicability for this diagnostic algorithm (11).
Even so, the clinical utility of this approach could not be considered further without validation in
an independent testing cohort. In the current study, we applied the original logistic algorithm to
metabolic scans from an Indian testing cohort of 129 parkinsonian subjects with uncertain
clinical diagnosis who were followed by movement disorders experts blind to the imaging
results. The primary objective of this study was to prospectively validate the original logistic
classification algorithm, previously developed from the North American cohort (11), in the new
Indian cohort. In addition, because the greatest clinical challenge exists in patients with relatively
by on June 15, 2018. For personal use only. jnm.snmjournals.org Downloaded from

Tripathi et al. 5
recent symptom onset, subjects with relatively short disease duration (≤ 2 years) were
preferentially chosen as participants and separately analyzed in this validation cohort.
MATERIALS AND METHODS
Patients
165 parkinsonian subjects with uncertain clinical diagnoses were referred for diagnostic 18F-
fluorodeoxyglucose (18F-FDG) PET between November 2008 to January 2011 (Figure 1). Of
these, 36 subjects were excluded because of structural abnormalities on routine MRI (n=10: basal
ganglia ischemia (n=3), hydrocephalus (n=2), and severe brain atrophy (n=5)), alternative final
clinical diagnosis (n=4: dementia with Lewy bodies (n=1), normal pressure hydrocephalus (n=1),
and frontotemporal dementia /progressive non-fluent aphasia (n=2)), and lack of final clinical
diagnosis due to inadequate follow-up (n=22).
The remaining 129 subjects (gender: 90M/39F; age: 56.2±10.6 years [mean±SD]; motor
Unified Parkinson’s Disease Rating Scale [UPDRS]: 25.1±9.4; symptom duration: 2.7±1.5
years) underwent 18F-FDG PET at the Institute of Nuclear Medicine and Allied Sciences
(INMAS), New Delhi, India. Of these, 77 (60%) subjects (gender: 54M/23F; age: 56.8±9.7
years) had symptom duration of 2 years or less and comprised a short-duration subgroup that was
separately analyzed. In each of the subjects, the final clinical diagnosis was made by a movement
disorders specialist after at least two office visits. The mean time interval between imaging and
final diagnosis was 2.2±0.4 years after imaging. In all cases, the diagnosis was based upon
consensus criteria for the diagnosis of IPD (United Kingdom Brain Bank Criteria (23)), MSA
(24) and PSP (25), and was confirmed by a second movement disorders specialist. Both clinical
experts were blinded to the imaging findings at the time of final clinical diagnosis. Because of
by on June 15, 2018. For personal use only. jnm.snmjournals.org Downloaded from

Tripathi et al. 6
the excellent diagnostic agreement between the two specialists (Kappa =0.91, 95% confidence
interval=[0.84, 0.98]), as well as the close concordance with postmortem reported for movement
disorders experts after two years of clinical follow-up (26), we chose the final clinical diagnosis
as the endpoint for the current study.
The study was approved by the ethical committee at INMAS and written informed
consent was obtained from each patient after a detailed explanation of the procedure.
Imaging and Preprocessing
18F-FDG PET was performed on patients after a 12-hour fast. Antiparkinsonian medications
were withheld for at least 12 hours before imaging. Subjects received 185-296 MBq (5-8 mCi) of
18F-FDG by intravenous injections with eyes open in a silent, dimly lit room. Scanning was
performed on the Discovery STE16 PET tomograph (General Electric Medical Systems,
Milwaukee, WI, USA) at INMAS. This camera has a transaxial resolution of 5.12 mm full width
at half maximum (FWHM) in 3-dimensional (3D) mode at an offset of 1 cm from the center of
the field of view. An initial scout film of the head was performed, followed by low dose
computed tomography (CT) for attenuation correction and co-registration. PET imaging was
begun 60 minutes post-injection; a single bed 3D emission scan was acquired for 20 minutes for
each subject.
To ensure the compatibility in this validation study, we used the same protocols as
employed in our proof-of-principle study for all procedures of image preprocessing and network
computations (11). Specifically, image preprocessing was performed using statistical parametric
mapping (SPM) software (Wellcome Department of Cognitive Neurology, University College,
London, UK), running on Matlab (Mathworks Inc., Natick, MA). 18F-FDG PET images were
by on June 15, 2018. For personal use only. jnm.snmjournals.org Downloaded from
Tripathi et al. 7
spatially normalized into a standard brain space of the International Consortium for Brain
Mapping (ICBM) (27) and smoothed with a 10 mm Gaussian filter to increase the signal to noise
ratio, as described previously (28).
Network Computations
Expression values (subject scores) for each of the three relevant previously validated disease-
related metabolic covariance patterns (PDRP, MSARP, and PSPRP) were computed on a
prospective individual scan basis as described elsewhere (10,13) using existing software
(ScAnVp, freely available at http://www.feinsteinneuroscience.org/). Subject scores for each
disease pattern were standardized (z-scored) with respect to corresponding values from the same
group of 42 healthy volunteer subjects (age: 51.6±14.6 years) used for reference in the original
proof-of-principle study (11). As before, subject scores for each pattern were standardized such
that the mean expression value for the reference sample was zero, with a standard deviation of
one.
Differential Diagnosis
We applied the previously developed logistic classification algorithm (11) to the PDRP,
MSARP, and PSPRP subject scores from each of the participants of the Indian testing cohort.
The original logistic models for classification of IPD, MSA and PSP derived from the North
American training cohort (11) are described in Supplemental Table 1. Prospective application of
these models allowed us to calculate the probability of each disease for individual subjects of the
current cohort. Based on these probabilities, we classified each of the subjects according to a
two-level procedure, as previously reported (11). At Level I, each subject was classified as IPD
or APS, or as Indeterminate Parkinsonism, by comparing the subject’s probabilities to the cut-off
by on June 15, 2018. For personal use only. jnm.snmjournals.org Downloaded from

Tripathi et al. 8
probabilities for IPD (PIPD=0.81) and APS (PAPS=0.79) determined in the original study (11).
Patients who had a higher probability than the cut-off value for IPD were classified as IPD, while
those with a higher probability than the cut-off value for APS were classified as APS. Subjects
with probabilities lower than the cut-off values of both IPD and APS were classified as
Indeterminate Parkinsonism. At Level II, subjects classified at Level I as APS were further
subclassified as MSA or PSP, or as Indeterminate APS, using the previously reported cut-off
probabilities for MSA (PMSA=0.74) and PSP (PPSP=0.55) (11). Likewise, subjects with a higher
probability than cut-off for either of the two major APS subtypes were classified as MSA or PSP.
Subjects with probabilities lower than the cut-off values for the two conditions were classified as
Indeterminate APS.
Image-based classification was performed in each subject without knowledge of the final
clinical diagnosis. Based on the classification results of individual subjects, discriminative
measures (sensitivity, specificity, positive predictive value [PPV], and negative predictive value
[NPV]) for the analysis at each level (Level I: PD and APS; Level II: MSA and PSP) were
computed separately for the whole group (n=129) and for the short duration sample (n=77). At
each level, Indeterminate cases were included as misclassified subjects in the calculation of
discriminative measures. Because Level-I Indeterminate cases had a similar likelihood
(approximately 50%) of having IPD or APS, these subjects were not further classified as MSA or
PSP at Level II (11). Thus, as implemented in the original logistic algorithm, Level-I
Indeterminate cases in the present cohort were excluded from the Level II analysis as well as the
calculation of discriminative measures at this level. Moreover, because the proportion of APS
patients in this Indian cohort (37%) was substantially higher than the expected prevalence in the
general population (29), the PPVs reported in this study were features of the current sample,
by on June 15, 2018. For personal use only. jnm.snmjournals.org Downloaded from

Tripathi et al. 9
which was representative of the patients in the referring tertiary movement disorders clinics. In
addition, receiver-operating characteristic (ROC) analysis was conducted for each disease
condition using the entire dataset and was then limited to the subgroup of short-duration (≤ 2
years) cases.
Logistic regression analysis was performed in SAS 9.3 (SAS Institute Inc., Cary, NC)
and other statistical tests were performed in SPSS 14.0 (SPSS Inc., Chicago, IL). All tests were
considered significant for p<0.05.
RESULTS
Analysis of the Whole Group
The demographic features of the subjects are summarized in Table 1. Among the 129 subjects
with uncertain parkinsonism that were included, 81 were subsequently diagnosed clinically as
having IPD and all of them were responsive to levodopa treatment. Of the remaining subjects, 20
were diagnosed with MSA and 28 with PSP. The average disease duration was 2.7±1.5 years at
the time of imaging; a final diagnosis was made an average of 2.2±0.4 years following the
imaging procedure.
PDRP, MSARP, and PSPRP expression values for the subjects, grouped by final clinical
diagnosis, are displayed in Figure 2. The resulting subject scores were used in conjunction with
the previously reported logistic algorithm to compute the probabilities of IPD and APS in each of
the subjects. We then compared the image-based classification with their final clinical diagnosis.
Of the 129 patients, 70 (67 were diagnosed clinically as IPD, 1 as MSA and 2 as PSP) were
classified as having IPD, while 34 (4 were subsequently diagnosed clinically as IPD, 14 as MSA
and 16 as PSP) were classified as having APS. The remaining 25 subjects (10 IPD, 5 MSA and
by on June 15, 2018. For personal use only. jnm.snmjournals.org Downloaded from

Tripathi et al. 10
10 PSP), accounting for 19% of the total, did not satisfy the pre-specified cutpoint criteria for
classification as either IPD or APS (Figure 3A, left), and were therefore categorized as
Indeterminate Parkinsonism. Overall, the first-level analysis (Table 2) resulted in 83%
sensitivity, 94% specificity, 96% PPV and 76% NPV for the classification of IPD, and 63%
sensitivity, 95% specificity, 88% PPV and 81% NPV for the classification of APS (Table 2). The
area-under-the-curve (AUC) for the ROC analyses of the whole sample (Figure 3A, right) was
0.95 (p<0.0001) for both IPD and APS.
The 34 subjects classified as APS at Level I underwent second-level analysis (Figure 3B,
C, left) to further differentiate between MSA and PSP. This analysis (Table 2) resulted in 79%
sensitivity, 90% specificity, 85% PPV and 86% NPV for the classification of MSA, and 100%
sensitivity, 94% specificity, 94% PPV and 100% NPV for the classification of PSP. ROC
analysis (Figure 3B, C, right) revealed a significant AUC of 0.93 for MSA (p<0.0001) and 0.99
for PSP (p<0.0001). In addition, four (12%; 1 IPD and 3 MSA) of the 34 subjects did not satisfy
the pre-specified classification criteria for either MSA or PSP and were categorized as
Indeterminate APS at the second level.
Analysis of the Short Duration Subgroup
77 subjects (40 IPD, 16 MSA and 21 PSP), accounting for 60% of the total, had symptoms of
short duration (≤ 2 years). For this subgroup, the average duration of symptoms at the time of
imaging was 1.7±0.4 years. The final clinical diagnosis in these subjects was made 2.2±0.5 years
after imaging. Based on the classification algorithm, 38 of these early stage subjects were
categorized as IPD (36 were subsequently diagnosed clinically as IPD, 1 as MSA and 1 as PSP),
while 24 were classified as APS (1 clinically diagnosed as IPD, 11 as MSA and 12 as PSP). The
by on June 15, 2018. For personal use only. jnm.snmjournals.org Downloaded from

Tripathi et al. 11
remaining 15 (19%) subjects (3 subsequently classified clinically as IPD, 4 as MSA and 8 as
PSP) were categorized by the algorithm (Figure 4A, left) as Indeterminate Parkinsonism. Thus,
for this early subgroup, the first-level analysis (Table 2) resulted in 90% sensitivity, 95%
specificity, 95% PPV and 90% NPV for IPD, and 62% sensitivity, 98% specificity, 96% PPV
and 74% NPV for APS. ROC analysis (Figure 4A, right) revealed AUC=0.96 (p<0.0001) for
both IPD and APS at the first level.
Second-level analysis for the 24 subjects (Figure 4B, C, left) who were classified as APS
(Table 2) resulted in 73% sensitivity, 92% specificity, 89% PPV and 80% NPV for MSA, and
100 % sensitivity, 100% specificity, 100% PPV and 100% NPV for PSP. ROC analysis (Figure
4B, C, right) showed AUC=0.94 (p<0.0001) for MSA and AUC=1.00 for PSP (p<0.0001) at the
second level. Three (13%; 3 MSA) of the 24 subjects were categorized as Indeterminate APS.
Analysis of the Cases with Atrophy
To examine potential confounding effect of brain atrophy on the classification of individual
subjects, we additionally applied the algorithm to PET data from the five subjects who were
excluded from the primary analysis because of atrophy. These individuals were all subsequently
diagnosed with APS on clinical grounds: two with MSA and three with PSP. Of those with
MSA, one subject was classified by the algorithm as Indeterminate Parkinsonism at Level I and
the other as Indeterminate APS at Level II. Of the PSP cases, all were classified as Level-I
Indeterminate Parkinsonism.
DISCUSSION
In this study, we used the original network-based logistic algorithm (11) to classify individuals in
by on June 15, 2018. For personal use only. jnm.snmjournals.org Downloaded from

Tripathi et al. 12
an independent testing sample based on their metabolic scans. In accordance with the earlier
findings (11), this automated image classification approach resulted in accurate differential
diagnosis, with excellent discrimination of IPD from APS (Level I), and MSA from PSP (Level
II) at the individual subject level. The data overall demonstrate the potential utilities of the
algorithm in improving the recruitment of participants for clinical trials, as well as assisting
clinicians to make more accurate diagnosis for patients with early-stage disease.
Specifically, we applied the published classification algorithm to scan data from the
Indian population using the identical disease-related covariance patterns and the criteria for
probabilistic classification that were employed in the previously published North American
training cohort (11). Single case classification according to this approach resulted in comparably
high diagnostic accuracy for IPD in the two populations (Training: 97% specificity, 98% PPV;
Testing: 94% specificity, 96% PPV). Likewise, image-based classification of APS was also
diagnostically accurate in both the North American and Indian samples (Training: 98%
specificity, 97% PPV; Testing: 95% specificity, 88% PPV). In addition, there was no significant
difference in the percentage of indeterminate cases in the Indian and the North American
samples at the two levels of classification analyses (Level I: 19% vs. 14%, p=0.25; Level II: 12%
vs. 12%, p=0.99; χ2 tests). In both samples, we have found that at final diagnosis, Indeterminate
cases have similar likelihoods of approximately 50% of being classified clinically as IPD or APS
(Level I), and MSA or PSP (Level II) (11). Thus, Indeterminate cases may represent the clinically
more challenging patients who can benefit greatly from continued clinical follow-up and repeat
imaging as the underlying disease progresses. Moreover, such cases, if identified, may be
excluded from recruitment to help improve the efficiency and reduce the cost of clinical trials.
by on June 15, 2018. For personal use only. jnm.snmjournals.org Downloaded from

Tripathi et al. 13
An important feature of the current study was the greater percentage of subjects in the
Indian testing cohort with short (≤ 2 years) symptom duration compared to the original North
American training sample (77/129=60% vs. 55/167=33%, respectively). Indeed, for the whole
group, symptom duration at the time of imaging was substantially shorter for the current testing
sample relative to the original training data set (New Delhi: 2.7±1.5 years; Manhasset: 5.0±3.8
years, p<0.0001; Student’s t-test). We note that the specificity and PPV for pattern-based
classification of individual subjects at Level I (IPD vs. APS) was high (≥ 95%) even for the short
duration cases (with ≤ 2 years of symptoms). Thus, the imaging-based classifications accorded
well with the clinical “gold standard” diagnosis reached independently by the expert clinicians
approximately 2 years after the imaging procedure. Interestingly, sensitivity at Level I was
higher for IPD than for APS (90% vs. 62%), suggesting a greater rate of false negatives for
classifying APS patients with short symptom duration. We note that, among the 15 short duration
subjects (19%) categorized as Indeterminate Parkinsonism at Level I, 12 were later clinically
diagnosed as MSA or PSP and were the majority of the false negatives for APS, resulting in a
lower sensitivity. Therefore, while a subject with Indeterminate Parkinsonism (Level I) drawn at
random from the whole sample has similar odds of developing APS or IPD, a comparable subject
with short disease duration is four times more likely to develop APS as opposed to IPD. Level II
analysis of the early APS subjects revealed that the specificity and PPV were high for both MSA
(92% and 89%, respectively) and PSP (100% and 100%, respectively), and the sensitivity of
MSA and PSP (73% and 100%) was higher than that reported (< 60%) for the initial clinical
diagnosis of each of these conditions (30,31). Moreover, the percentage of indeterminate cases at
both Level I and Level II were similar for Indian and North American short duration cases (Level
by on June 15, 2018. For personal use only. jnm.snmjournals.org Downloaded from

Tripathi et al. 14
I: 19% vs. 20%, p=0.94; Level II: 13% vs. 11%, p=0.84; χ2 tests). Overall, these results
substantiate the findings of the early patients in the original training sample (11).
The presence of substantial volume loss in early parkinsonism is suggestive of an atypical
syndrome (32,33). To mitigate this potential confound, evidence of atrophy on structural imaging
was adopted as an exclusion criterion in our study. In addition to confirming the accuracy of the
classification algorithm in parkinsonian patients with minimal or no atrophy (11), the current
findings provide information on the impact of severe volume loss on pattern-based
categorization. We found that all five APS patients with severe atrophy at the time of imaging
were categorized as Indeterminate by the PET-based logistical algorithm. This degree of volume
loss was encountered in fewer than 3% of the referred cases. That said, the inclusion of such
subjects may lead to systematic underestimation of the accuracy of this approach. It is not
currently known whether diagnostic specificity can be enhanced appreciably by combining MRI
volume loss measurements with metabolic pattern analysis.
We additionally note that MSA and PSP account for the majority (> 90%) of patients
with atypical forms of progressive parkinsonism referred to movement disorders specialty clinics
(26,34). Nonetheless, the APS category also includes corticobasal degeneration (CBD). This
disorder is less common than the other APS subtypes, with an incidence of 0.6-0.9/100,000, as
compared to 3.0/100,000 and 5.3/100,000 for MSA and PSP, respectively (35,36). In a recent
study, we used spatial covariance mapping to identify and validate a unique CBD-related
metabolic covariance pattern, termed CBDRP (22). Moreover, prospectively computed
expression values for this pattern in conjunction with PSPRP accurately discriminated CBD from
PSP in clinically uncertain cases (22). The goal of the present study was to validate the
previously reported logistic algorithm for the same diagnostic categories used in its original
by on June 15, 2018. For personal use only. jnm.snmjournals.org Downloaded from

Tripathi et al. 15
formulation (11). For that reason, we limited the current APS analysis to MSARP and PSPRP,
the two disease-related patterns that were used originally to differentiate among the most
common progressive forms of parkinsonism. Additional studies will be needed to determine the
added value of CBDRP subject scores in discriminating IPD from APS at Level I, and in
differentiating CBD from the other forms of APS at Level II.
DISCLOSURE
D.E. serves on the scientific advisory board and has received honoraria from the Michael J. Fox
Foundation for Parkinson’s Research; is listed as coinventor of patents re: Markers for use in
screening patients for nervous system dysfunction and a method and apparatus for using same,
without financial gain; and has received research support from the NIH (NINDS, NIDCD,
NIAID) and the Dana Foundation. All other authors declare no potential conflicts of interest.
ACKNOWLEDGMENTS
This work was funded by a fellowship grant to M.T. from the Indo-US Science and Technology
Form and an intramural grant from Director, INMAS. This work was also supported in part by
the National Institute of Neurological Disorders and Stroke Morris K. Udall Center of Excellence
for Parkinson’s Disease Research at The Feinstein Institute for Medical Research (P50
NS071675 to D.E.). The content is solely the responsibility of the authors and does not
necessarily represent the official views of the National Institute of Neurological Disorders and
Stroke or the National Institutes of Health. The sponsor did not play a role in study design,
collection, analysis and interpretation of data, writing of the report or in the decision to submit
the paper for publication. The authors wish to thank Dr. Deepak Gupta for his initial contribution
by on June 15, 2018. For personal use only. jnm.snmjournals.org Downloaded from

Tripathi et al. 16
to this study. The authors also wish to thank Ms. Patricia J. Allen for data management and Ms.
Yoon Young Choi for editorial assistance. There are no conflicts of interest to disclose.
by on June 15, 2018. For personal use only. jnm.snmjournals.org Downloaded from

Tripathi et al. 17
REFERENCES
1. Tolosa E, Wenning G, Poewe W. The diagnosis of Parkinson's disease. Lancet neurology.
2006;5:75-86.
2. Adler CH, Beach TG, Hentz JG, et al. Low clinical diagnostic accuracy of early vs
advanced Parkinson disease: clinicopathologic study. Neurology. 2014;83:406-412.
3. Poston KL, Eidelberg D. Functional brain networks and abnormal connectivity in the
movement disorders. Neuroimage. 2012;62:2261-2270.
4. Litvan I, Bhatia KP, Burn DJ, et al. Movement Disorders Society Scientific Issues
Committee report: SIC Task Force appraisal of clinical diagnostic criteria for Parkinsonian
disorders. Mov Disord. 2003;18:467-486.
5. Marquand AF, Filippone M, Ashburner J, et al. Automated, high accuracy classification
of Parkinsonian disorders: a pattern recognition approach. PLoS One. 2013;8:e69237.
6. Meijer FJ, van Rumund A, Tuladhar AM, et al. Conventional 3T brain MRI and diffusion
tensor imaging in the diagnostic workup of early stage parkinsonism. Neuroradiology.
2015;57:655-669.
7. Park E, Hwang YM, Lee CN, et al. Differential Diagnosis of Patients with Inconclusive
Parkinsonian Features Using [(18)F]FP-CIT PET/CT. Nucl Med Mol Imaging. 2014;48:106-113.
8. Suwijn SR, van Boheemen CJ, de Haan RJ, Tissingh G, Booij J, de Bie RM. The
diagnostic accuracy of dopamine transporter SPECT imaging to detect nigrostriatal cell loss in
patients with Parkinson's disease or clinically uncertain parkinsonism: a systematic review.
EJNMMI Res. 2015;5:12.
9. Niethammer M, Eidelberg D. Metabolic brain networks in translational neurology:
concepts and applications. Ann Neurol. 2012;72:635-647.
by on June 15, 2018. For personal use only. jnm.snmjournals.org Downloaded from

Tripathi et al. 18
10. Spetsieris P, Ma Y, Peng S, et al. Identification of disease-related spatial covariance
patterns using neuroimaging data. J Vis Exp. 2013;76:e50319.
11. Tang C, Poston K, Eckert T, et al. Differential diagnosis of parkinsonism: a metabolic
imaging study using pattern analysis. Lancet Neurol. 2010;9:149-158.
12. Eidelberg D. Metabolic brain networks in neurodegenerative disorders: a functional
imaging approach. Trends Neurosci. 2009;32:548-557.
13. Spetsieris PG, Eidelberg D. Scaled subprofile modeling of resting state imaging data in
Parkinson's disease: methodological issues. Neuroimage. 2011;54:2899-2914.
14. Ma Y, Tang C, Spetsieris P, Dhawan V, Eidelberg D. Abnormal metabolic network
activity in Parkinson's disease: test-retest reproducibility. J Cereb Blood Flow Metab.
2007;27:597-605.
15. Peng S, Ma Y, Spetsieris PG, et al. Characterization of disease-related covariance
topographies with SSMPCA toolbox: effects of spatial normalization and PET scanners. Hum
Brain Mapp. 2014;35:1801-1814.
16. Holtbernd F, Gagnon JF, Postuma RB, et al. Abnormal metabolic network activity in
REM sleep behavior disorder. Neurology. 2014;82:620-627.
17. Wu P, Yu H, Peng S, et al. Consistent abnormalities in metabolic network activity in
idiopathic rapid eye movement sleep behaviour disorder. Brain. 2014;137:3122-3128.
18. Teune LK, Renken RJ, Mudali D, et al. Validation of parkinsonian disease-related
metabolic brain patterns. Mov Disord. 2013;28:547-551.
19. Wu P, Wang J, Peng S, et al. Metabolic brain network in the Chinese patients with
Parkinson's disease based on 18F-FDG PET imaging. Parkinsonism Relat Disord. 2013;19:622-
627.
by on June 15, 2018. For personal use only. jnm.snmjournals.org Downloaded from

Tripathi et al. 19
20. Eckert T, Tang C, Ma Y, et al. Abnormal metabolic networks in atypical parkinsonism.
Mov Disord. 2008;23:727-733.
21. Poston K, Tang C, Eckert T, et al. Network correlates of disease severity in multiple
system atrophy. Neurology. 2012;78:1237-1244.
22. Niethammer M, Tang CC, Feigin A, et al. A disease-specific metabolic brain network
associated with corticobasal degeneration. Brain. 2014;137:3036-3046.
23. Hughes AJ, Ben-Shlomo Y, Daniel SE, Lees AJ. What features improve the accuracy of
clinical diagnosis in Parkinson's disease: a clinicopathologic study. Neurology. 1992;42:1142-
1146.
24. Gilman S, Wenning G, Low P, et al. Second consensus statement on the diagnosis of
multiple system atrophy. Neurology. 2008;71:670-676.
25. Hauw JJ, Daniel SE, Dickson D, et al. Preliminary NINDS neuropathologic criteria for
Steele-Richardson-Olszewski syndrome (progressive supranuclear palsy). Neurology.
1994;44:2015-2019.
26. Hughes A, Daniel S, Ben-Shlomo Y, Lees A. The accuracy of diagnosis of parkinsonian
syndromes in a specialist movement disorder service. Brain. 2002;125:861-870.
27. Mazziotta J, Toga A, Evans A, et al. A probabilistic atlas and reference system for the
human brain: International Consortium for Brain Mapping (ICBM). Philos Trans R Soc Lond B
Biol Sci. 2001;356:1293-1322.
28. Spetsieris P, Ma Y, Dhawan V, Eidelberg D. Differential diagnosis of parkinsonian
syndromes using PCA-based functional imaging features. Neuroimage. 2009;45:1241-1252.
29. Schrag A, Ben-Shlomo Y, Quinn NP. Prevalence of progressive supranuclear palsy and
multiple system atrophy: a cross-sectional study. Lancet. 1999;354:1771-1775.
by on June 15, 2018. For personal use only. jnm.snmjournals.org Downloaded from
Tripathi et al. 20
30. Osaki Y, Ben-Shlomo Y, Lees AJ, et al. Accuracy of clinical diagnosis of progressive
supranuclear palsy. Mov Disord. 2004;19:181-189.
31. Osaki Y, Wenning GK, Daniel SE, et al. Do published criteria improve clinical
diagnostic accuracy in multiple system atrophy? Neurology. 2002;59:1486-1491.
32. Paviour DC, Price SL, Jahanshahi M, Lees AJ, Fox NC. Longitudinal MRI in progressive
supranuclear palsy and multiple system atrophy: rates and regions of atrophy. Brain.
2006;129:1040-1049.
33. Reginold W, Lang AE, Marras C, Heyn C, Alharbi M, Mikulis DJ. Longitudinal
quantitative MRI in multiple system atrophy and progressive supranuclear palsy. Parkinsonism
Relat Disord. 2014;20:222-225.
34. Hughes AJ, Ben-Shlomo Y, Daniel SE, Lees AJ. What features improve the accuracy of
clinical diagnosis in Parkinson's disease: a clinicopathologic study. 1992. Neurology.
2001;57:S34-38.
35. Josephs KA, Petersen RC, Knopman DS, et al. Clinicopathologic analysis of
frontotemporal and corticobasal degenerations and PSP. Neurology. 2006;66:41-48.
36. Mahapatra RK, Edwards MJ, Schott JM, Bhatia KP. Corticobasal degeneration. Lancet
Neurol. 2004;3:736-743.
by on June 15, 2018. For personal use only. jnm.snmjournals.org Downloaded from

Tripathi et al. 21
FIGURE 1. Study Design and Pattern-based Classification Procedure
by on June 15, 2018. For personal use only. jnm.snmjournals.org Downloaded from

Tripathi et al. 22
FIGURE 2. Three-Dimensional Plot of Pattern Expression
Expression values for the PDRP (x-axis), MSARP (y-axis) and PSPRP (z-axis) topographies (see
text) are shown for the Indian validation cohort. This group was comprised of 129 parkinsonian
patients with an uncertain clinical diagnosis. Based on serial clinical examinations by a
movement disorders specialist blind to the scan data, 81 of these subjects were subsequently
diagnosed with IPD (green circles), 20 with MSA (red triangles) and 28 with PSP (blue
squares). [Pattern expression values were computed in 18F-FDG PET scans from these subjects
acquired 2.2±0.4 (mean±SD) years before a final clinical diagnosis.]
by on June 15, 2018. For personal use only. jnm.snmjournals.org Downloaded from

Tripathi et al. 23
by on June 15, 2018. For personal use only. jnm.snmjournals.org Downloaded from

Tripathi et al. 24
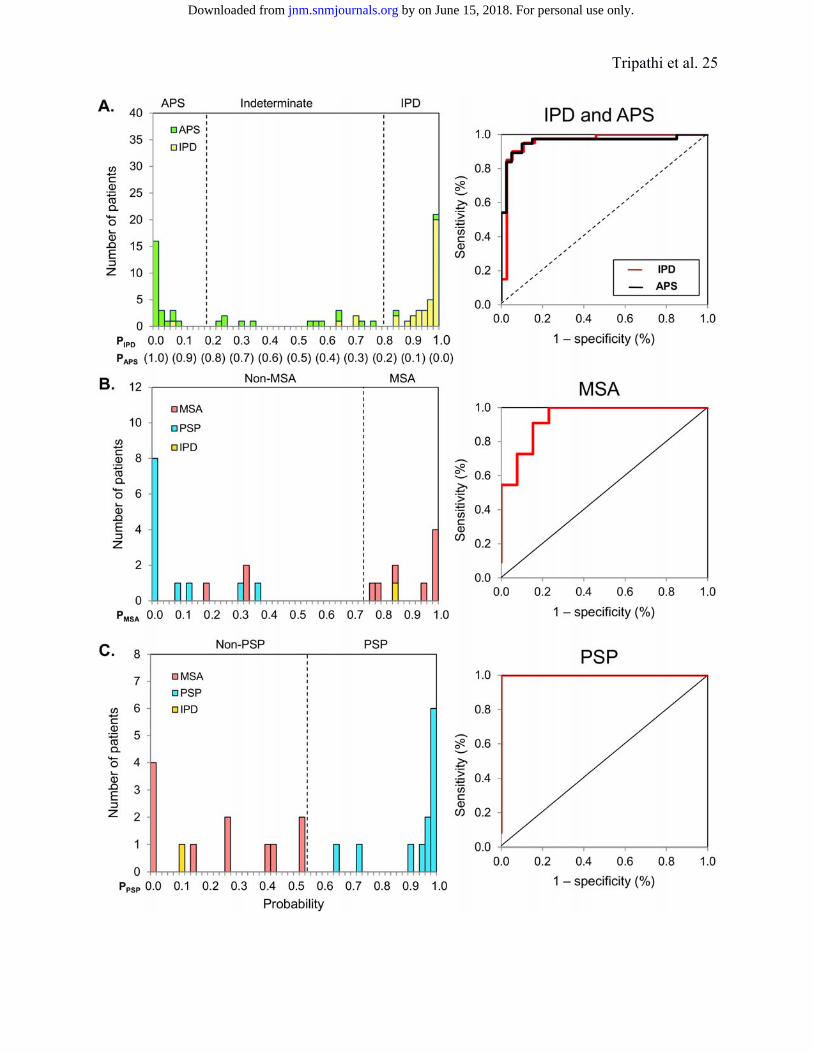
FIGURE 3. Predicted Disease Probabilities for Differential Diagnosis of Patients with
Uncertain Parkinsonism: Whole Sample
A. Left, Frequency distribution of the predicted probabilities for IPD (PIPD, top row of x-axis) and
APS (PAPS, bottom row of x-axis) for the current parkinsonian patient sample (n=129). This
group was comprised of 81 subjects who were diagnosed clinically with IPD (yellow bars) and
48 subjects who were diagnosed with APS (green bars). Right and left dashed lines,
respectively, denote the cut-off probabilities for IPD (PIPD=0.81) and APS (PAPS=0.79)
determined in our previous study (11). Subjects falling between the two dashed lines were
categorized as Indeterminate. Right, Display of the receiver-operating-characteristic (ROC)
curves for IPD (red) and APS (black). The area-under-the-curve (AUC) was high (≥ 0.95,
p<0.0001), denoting excellent diagnostic accuracy for the two conditions based upon the logistic
discrimination function indentified in the North American training set (11).
B., C. Left, Frequency distributions of the predicted probabilities for MSA (PMSA, x-axis in B)
and PSP (PPSP, x-axis in C) in the 34 subjects who were classified as APS in the first-level
analysis (see text). This group included 14 patients clinically diagnosed as having MSA (pink
bars), 16 with PSP (blue bars), and 4 with IPD (orange bars). Right, ROC curves for (B) MSA
(AUC=0.93, p<0.0001) and (C) PSP (AUC=0.99, p<0.0001) were consistent with excellent
diagnostic accuracy for the two atypical parkinsonian variant conditions based upon the original
logistic discrimination function (11).
by on June 15, 2018. For personal use only. jnm.snmjournals.org Downloaded from
Tripathi et al. 25
by on June 15, 2018. For personal use only. jnm.snmjournals.org Downloaded from

Tripathi et al. 26
FIGURE 4. Predicted Disease Probabilities for Differential Diagnosis of Patients with
Uncertain Parkinsonism: Subset of Early Patients
Frequency distribution of the predicted probabilities for IPD vs. (A) APS, (B) MSA, and (C) PSP
in the 77 members of the Indian patient sample (40 IPD, 16 MSA, 21 PSP) with symptoms of
short duration (≤ 2 years) at the time of imaging. ROC analysis (IPD and APS: AUC=0.96,
p<0.0001; MSA: AUC=0.94, p<0.0001; PSP: AUC=1.00, p<0.0001) disclosed excellent
diagnostic accuracy based upon the logistical discriminant functions identified in the original
training set (11).
by on June 15, 2018. For personal use only. jnm.snmjournals.org Downloaded from

Tripathi et al. 27
TABLE 1. Demographic Characteristic
Values are shown as mean (SD). UPDRS = Unified Parkinson’s Disease Rating Scale. *Denotes differences (p<0.05) across the three disease groups by one-way ANOVA.
All patients Symptom duration (years) (n=129) ≤ 2 (n=77) > 2 (n=52) Idiopathic Parkinson’s disease Number of patients 81 40 41 Sex (male, female) 59, 22 31, 9 28, 13 Age at FDG PET (years) 53.5 (10.8)* 53.7 (9.9)* 53.4 (11.7) Symptom duration at FDG PET (years) 2.9 (1.8)* 1.6 (0.5) 4.2 (1.6) Hoehn and Yahr stage 2.5 (2.8) 1.7 (0.5)* 3.3 (3.7) UPDRS 23.7 (10.5)* 19.5 (7.1)* 27.8 (11.7) Clinical follow-up (years) 2.3 (0.5)* 2.4 (0.6)* 2.1 (0.3)
Multiple system atrophy Number of patients 20 16 4 Sex (male, female) 15, 5 11, 5 4, 0 Age at FDG PET (years) 58.0 (9.4) 57.4 (8.8) 60.5 (12.5) Symptom duration at FDG PET (years) 2.2 (0.8) 1.8 (0.3) 3.5 (0.6) Hoehn and Yahr stage 2.7 (0.6) 2.6 (0.5) 3.1 (0.6) UPDRS 24.9 (6.7) 23.6 (5.5) 30.3 (9.5) Clinical follow-up (years) 1.9 (0.1) 2.0 (0.1) 1.8 (0.2)
Progessive supranuclear palsy Number of patients 28 21 7 Sex (male, female) 16, 12 12, 9 4, 3 Age at FDG PET (years) 62.5 (7.6) 62.2 (7.8) 63.6 (7.3) Symptom duration at FDG PET (years) 2.3 (1.1) 1.8 (0.4) 3.9 (1.1) Hoehn and Yahr stage 2.8 (0.6) 2.6 (0.6) 3.1 (0.4) UPDRS 29.3 (5.8) 27.8 (5.7) 33.7 (3.7) Clinical follow-up (years) 2.0 (0.2) 2.0 (0.1) 2.1 (0.4)
by on June 15, 2018. For personal use only. jnm.snmjournals.org Downloaded from

Tripathi et al. 28
TABLE 2. Discriminative Measures: Pattern-based Classification vs. Final Clinical Diagnosis
Data are shown as % (number of subjects). PPV = positive predictive value; NPV = negative predictive value.
All patients Symptom duration (years) (n=129) ≤ 2 (n=77) > 2 (n=52) Idiopathic Parkinson’s disease Sensitivity 83% (67/81) 90% (36/40) 76% (31/41) Specificity 94% (45/48) 95% (35/37) 91% (10/11) PPV 96% (67/70) 95% (36/38) 97% (31/32) NPV 76% (45/59) 90% (35/39) 50% (10/20)
Atypical parkinsonian syndrome Sensitivity 63% (30/48) 62% (23/37) 64% (7/11) Specificity 95% (77/81) 98% (39/40) 93% (38/41) PPV 88% (30/34) 96% (23/24) 70% (7/10) NPV 81% (77/95) 74% (39/53) 91% (38/42)
Multiple system atrophy Sensitivity 79% (11/14) 73% (8/11) - Specificity 90% (18/20) 92% (12/13) - PPV 85% (11/13) 89% (8/9) - NPV 86% (18/21) 80% (12/15) -
Progessive supranuclear palsy Sensitivity 100% (16/16) 100% (12/12) - Specificity 94% (17/18) 100% (12/12) - PPV 94% (16/17) 100% (12/12) - NPV 100% (17/17) 100% (12/12) -
by on June 15, 2018. For personal use only. jnm.snmjournals.org Downloaded from

Doi: 10.2967/jnumed.115.161992Published online: October 8, 2015.J Nucl Med. Madhavi Tripathi, Chris C Tang, Andrew Feigin, Ivana De Lucia, Amir Nazem, Vijay Dhawan and David Eidelberg Networks: A Validation StudyAutomated Differential Diagnosis of Early Parkinsonism using Metabolic Brain
http://jnm.snmjournals.org/content/early/2015/10/07/jnumed.115.161992This article and updated information are available at:
http://jnm.snmjournals.org/site/subscriptions/online.xhtml
Information about subscriptions to JNM can be found at:
http://jnm.snmjournals.org/site/misc/permission.xhtmlInformation about reproducing figures, tables, or other portions of this article can be found online at:
and the final, published version.proofreading, and author review. This process may lead to differences between the accepted version of the manuscript
ahead of print area, they will be prepared for print and online publication, which includes copyediting, typesetting,JNMcopyedited, nor have they appeared in a print or online issue of the journal. Once the accepted manuscripts appear in the
. They have not beenJNM ahead of print articles have been peer reviewed and accepted for publication in JNM
(Print ISSN: 0161-5505, Online ISSN: 2159-662X)1850 Samuel Morse Drive, Reston, VA 20190.SNMMI | Society of Nuclear Medicine and Molecular Imaging
is published monthly.The Journal of Nuclear Medicine
© Copyright 2015 SNMMI; all rights reserved.
by on June 15, 2018. For personal use only. jnm.snmjournals.org Downloaded from