G ravity Anomalies and Flexure of th e L ith osp h ere along ... the gyroscope. T he A lidade...
23
Geophys. J. R. nstr. SOC. (1974) 38, 119-141. Gravity Anomalies and Flexure of the Lithosphere along the Hawaiian-Emperor Seamount Chain* A. B. Watts and J. R. Cochran (Received 1973 December 7)t Summary Simple models for the flexure of the lithosphere caused by the load of the Hawaiian-Emperor Seamount Chain have been determined for different values of the effective flexural rigidity of the lithosphere. The gravity effect of the models have been computed and compared to observed free-air gravity anomaly profiles in the vicinity of the seamount chain. The values of the effective flexural rigidity which most satisfactorily explain both the amplitude and wavelength of the observed profiles have been determined. Computations show that if the lithosphere is modelled as a continuous elastic sheet, a single effective flexural rigidity of about 5 x loz9dyne-cm can explain profiles along the Hawaiian-Emperor Seamount Chain. If the lithosphere is modelled as a discontinuous elastic sheet an effective flexural rigidity of about 2 x lo3' dyne-cm is required. Since the age of the seamount chain increases from about 3My near Hawaii to about 70 My near the northernmost Emperor seamount these results suggest there is apparently little decrease in the effective flexural rigidity of the lithosphere with increase in the age of loading. This suggests the litho- sphere is rigid enough to support the load of the seamount chain for periods of time of at least several tens of millions of years. Thus the subsidence of atolls and guyots along the chain is most likely to be regional in extent and is unlikely to be caused by an inelastic behaviour of the lithosphere beneath individual seamounts. Introduction The widespread occurence of isostasy suggests a relatively strong outer layer of the Earth about 50-100 km thick (lithosphere) which overlies a relatively weak layer (asthenosphere). The evidence that the lithosphere has a finite strength has come mainly from studies of the manner in which it supports applied loads. The problem is usually approached quantitatively by assuming that the lithosphere can be modelled as an elastic solid overlying a weak fluid (Gunn 1943; Heiskanen & Veniiig Meinesz 1958; Jeffreys 1959; Walcott 1970a). The deformation of the lithosphere due to an applied load can be computed using elastic beam or thin plate theory (Hetdnyi 1946; Timoshenko 1955) for different assumed elastic parameters of the lithosphere. The elastic parameters of the lithosphere which most satisfactorily explain geological or geophysical evidence in the vicinity of the load can then be determined. Thus, studies * Lamont-Doherty Geological Observatory Contribution No. 2093. 7 Received in original form 1973 September 19. 119
-
Upload
phungduong -
Category
Documents
-
view
213 -
download
1
Transcript of G ravity Anomalies and Flexure of th e L ith osp h ere along ... the gyroscope. T he A lidade...

Geophys. J . R . nstr. SOC. (1974) 38, 119-141.
Gravity Anomalies and Flexure of the Lithosphere along the Hawaiian-Emperor Seamount Chain*
A. B. Watts and J. R. Cochran
(Received 1973 December 7)t
Summary
Simple models for the flexure of the lithosphere caused by the load of the Hawaiian-Emperor Seamount Chain have been determined for different values of the effective flexural rigidity of the lithosphere. The gravity effect of the models have been computed and compared to observed free-air gravity anomaly profiles in the vicinity of the seamount chain. The values of the effective flexural rigidity which most satisfactorily explain both the amplitude and wavelength of the observed profiles have been determined. Computations show that if the lithosphere is modelled as a continuous elastic sheet, a single effective flexural rigidity of about 5 x loz9 dyne-cm can explain profiles along the Hawaiian-Emperor Seamount Chain. If the lithosphere is modelled as a discontinuous elastic sheet an effective flexural rigidity of about 2 x lo3' dyne-cm is required. Since the age of the seamount chain increases from about 3My near Hawaii to about 70 My near the northernmost Emperor seamount these results suggest there is apparently little decrease in the effective flexural rigidity of the lithosphere with increase in the age of loading. This suggests the litho- sphere is rigid enough to support the load of the seamount chain for periods of time of at least several tens of millions of years. Thus the subsidence of atolls and guyots along the chain is most likely to be regional in extent and is unlikely to be caused by an inelastic behaviour of the lithosphere beneath individual seamounts.
Introduction
The widespread occurence of isostasy suggests a relatively strong outer layer of the Earth about 50-100 km thick (lithosphere) which overlies a relatively weak layer (asthenosphere). The evidence that the lithosphere has a finite strength has come mainly from studies of the manner in which it supports applied loads. The problem is usually approached quantitatively by assuming that the lithosphere can be modelled as an elastic solid overlying a weak fluid (Gunn 1943; Heiskanen & Veniiig Meinesz 1958; Jeffreys 1959; Walcott 1970a). The deformation of the lithosphere due to an applied load can be computed using elastic beam or thin plate theory (Hetdnyi 1946; Timoshenko 1955) for different assumed elastic parameters of the lithosphere. The elastic parameters of the lithosphere which most satisfactorily explain geological or geophysical evidence in the vicinity of the load can then be determined. Thus, studies
* Lamont-Doherty Geological Observatory Contribution No. 2093.
7 Received in original form 1973 September 19.
119

120 A. B. Watts and J. R. Cochran
of the deformation of the lithosphere due to applied loads provides important data on the elastic properties of the lithosphere.
Studies have been made of the deformation of the lithosphere due to ice sheets (Walcott 1970b), sediments (Walcott 1972; Cochran 1973) and an oceanic plate approaching an island arc (Hanks 1971; Watts & Talwani 1974). In addition, a number of studies have been made in the vicinity of seamounts (Vening Meinesz 1941 ; Gunn 1943; Walcott 1970~). Seamounts are particularly satisfactory loads in deformation studies because they form during relatively short periods of geological time (a few million years) and occur in a wide variety of geological environments, including the relatively undeformed interiors of oceanic plates.
Vening Meinesz (1941) suggested that gravity anomalies in the vicinity of Hawaii could be most satisfactorily explained if the Hawaiian Ridge was regionally, rather than locally, compensated. He computed the regional compensation assuming the lithosphere responded to the load of the seamount as an elastic solid overlying a weak fluid. Gunn (1943) used a similar approach to obtain the maximum deformation of the lithosphere due to the load of a seamount by utilizing the present configuration of the seamount. The combined gravity effect of the load and the deformation was computed for different values of the elastic parameters of the lithosphere and the best fitting parameter obtained. Walcott (1970~) compared the deformation of the lithosphere to observed topography profiles in the vicinity of Hawaii. In particular, he matched the computed deflection to the amplitude and wavelength of the Hawaiian Arch which borders the south-eastern end of the Hawaiian Ridge. The best-fitting elastic parameters of the lithosphere were expressed in terms of a ' flexural parameter '. The deflection curve for this parameter was consistent, in a general way, with available seismic refraction and gravity data.
In this paper we determine the deformation of the lithosphere along the entire Hawaiian-Emperor seamount chain. There are two main reasons for this study. First, since the age of the seamount chain changes by about 70 My between Hawaii and the northern-most Emperor seamount (Clague & Jarrard 1973), the change with time, if any, of the elastic parameters of the lithosphere can be studied. Second, since the Hawaiian-Emperor seamount chain is located in the interior of a single litho- spheric plate the results may be used to provide general constraints for proposed models for the rheology of the lithosphere.
We base this study on topography and gravity anomaly profiles obtained mainly on Lamont-Doherty vessels in the vicinity of the seamount chain.
Gravity measurements
There have been a number of previous gravity measurements in the vicinity of the Hawaiian-Emperor seamount chain. The main islands of the Hawaiian Ridge (Fig. 1) have been surveyed by Woollard (1951), Furumoto (1965), Kroenke & Woollard (1965) and others. In sea areas adjacent to the Hawaiian Ridge early measurements were obtained with the Vening Meinesz pendulum apparatus pioneered by Vening Meinesz (1929) and continued by Lamont-Doherty until 1954 (Worzel 1965). Since 1961, measurements in sea areas adjacent to the Hawaiian Ridge have mainly been obtained on gyro-stabilized platforms (Rose & Belch6 1965; Strange, Woollard & Rose 1965; Khan, Woollard & Daugherty 1971). There have, however, been few gravity measurements in the vicinity of the Emperor Seamounts. Single profiles across the Kcko seamount and the Tenchi seamount have been presented by Caputo et al. (1964) and Watts & Talwani (1974) and a detailed gravity survey of the Suiko seamount has been published by Segawa (1970).
This study utilizes surface-ship gravity measurements obtained on cruises of the vessels Vema, Robert D. Conrad, Eltanin and Argo (Lusiad expedition) in the vicinity

Shi
p
Vem
a
Vem
a
Vem
u
Con
rad
Con
rad
Con
rad
Elta
nin
Arg
o
Yea
r
1964
1967
1965
1968
1967
1969
1967
1962
Cru
ise
& le
g
2006
2405
2105
1207
1108
1220
EL
30
LU
Ol
Tab
le 1
N
avig
atio
n an
d in
stru
tnen
tatio
ri
Pro
file
G
ravi
met
er
Sta
ble
num
bers
N
avig
atio
n id
enti
fica
tion
pl
atfo
rm
1, 5
C
eles
tial
5 S
atel
lite
7 C
eles
tial
2 S
atel
lite
3 S
atel
lite
7 S
atel
lite
6 S
atel
lite
4 C
eles
tial
Gss
2 # 1
2 A
lida
de w
ith
Mar
k IV
Mod
. 0
as v
erti
cal
refe
renc
e
Mar
k 1V
Mod
. 0
as v
erti
cal
refe
renc
e
Mar
k IV
Mod
. 0
as v
erti
cal
refe
renc
e G
ss2 f
31
Ans
chut
z el
ectr
ic
erec
tion
oil e
rect
ion
elec
tric
er
ecti
on
oil e
rect
ion
Gss
2 # 1
2 A
lida
de w
ith
Gss
2 Lf
12
Ali
dade
wit
h
Gss
2 # 6
hn
schu
tz
Gss
2 +
31
Ans
chut
z
Gss
2 f 2
5 A
nsch
utz
Lac
oste
-Rom
berg
Gim
bal
mou
nted
ai
r-se
a gr
avit
y m
eter
S-3
Cro
ss
coup
ling
co
rrec
tion
ap
plie
d?
Com
men
ts
No
Yes
No
Yes
Yes
L
eg c
orre
cted
Yes
by
16
mga
l
Yes
No
C
aput
o et
ul.
(196
4)
I c
LE. s s (D

122 A. B. Watts and J. R. Cochran
FIG. 1 . Location of topography and free-air gravity anomaly profiles across the Hawaiian-Emperor seamount chain utilized in this study. Bathymetry is at
1000-fm intervals and is based on Chase et al. (1970).
of the Hawaiian-Emperor seamount chain (Fig. 1). The instruments and navigation used during these cruises are summarized in Table 1.
The surface-ship gravimeters in Table 1 are the improved versions of the Graf- Askania Gss2 sea gravimeters (Graf & Shulze 1961). Different stable platforms have been utilized with the meter. The Anschutz platform utilizes an ‘ oil erection ’ or a more accurate ‘ electrical erection ’ (Hayes, Worzel & Karnick 1964) system for erecting the gyroscope. The Alidade platform uses a US Navy Mark IV Mod. 0 stable element as its vertical reference. The gravimeter used on Argo is the LaCoste- Romberg gimbal mounted meter (LaCoste & Harrison 1961).
The main sources of errors in the gravity measurements, apart from errors in the measuring instruments, arise from horizontal and vertical accelerations acting on the ship and from irregularities in the ship’s tracks. We estimate that cruises which utilize both cross-coupling corrections and satellite navigation have an accuracy of about 2-5 mgal. Cruises which, however, are without cross-coupling corrections and utilize celestial navigation may have an accuracy in the range 5-22 mgal.
The gravity data are presented as profiles projected approximately normal to the trend of the Hawaiian-Emperor seamount chain (Fig. 2). The free-air anomaly profiles have been reduced to the equilibrium figure of the Earth (flattening 1/299.8)

Free
-air
grav
ity a
nom
aly
m I- 2-
3-
+ I50
+I001
- -53
10
0
100
200 300
km
FIG
. 2.
Top
ogra
phy
and
free
-air
gra
vity
ano
mal
y pr
ofile
s ac
ross
the
Haw
aiia
n-E
mpe
ror
seam
ount
cha
in.
The
das
hed
lines
on
the
topo
grap
hy
prof
iles
indi
cate
the
conf
igur
atio
n of
the
loa
ds a
ssum
ed in
the
com
puta
tion
s.
The
sha
ded
area
rep
rese
nts
sea
wat
er.
The
gra
vity
ano
mal
ies
have
be
en r
educ
ed t
o th
e eq
uilib
rium
figu
re o
f th
e E
arth
(fla
tten
ing
1 /29
9.8)
.

124
rather than the international ellipsoid (flattening 1/297.0). The equilibrium figure has been chosen because departures from it are indicative of stresses existing in the Earth, particularly in the lithosphere.
The Hawaiian Ridge and Emperor Seamounts are associated with large amplitude positive and negative free-air anomalies (Fig. 2). The positive anomalies reach a maximum of about +225mgal on profiles 3 and 4 (Fig. 2 ) over the crest of the seamount. The positive anomalies are bordered by a broad belt of negative anomalies. The negative anomalies reach a minimum of about - 105 mgal and a width of about 200km on profiles 2 and 4 (Fig. 2). A striking feature of the negative anomalies is their continuity for hundreds of kilometres aiong both the Emperor Seamounts and the Hawaiian Ridge. In the vicinity of the southeastern end of the Hawaiian Ridge, the negative anomalies are bordered by a broad belt of positive anomalies (Profiles 6 & 7, Fig. 2). The positive anomalies reach maximum values of about + 50 mgal and generally correlate with a broad regional rise in the topography of a few hundred metres. The positive anomalies cannot, however be distinguished on profile 5 across the Hawaiian Ridge or profiles 1-4 across the Emperor Seamounts. Rather, the gravity anomalies in this region are about zero.
A. B. Watts and J. R. Cochran
Theory of method
A number of workers have studied the deformation of the lithosphere due to applied loads (Gum 1943; Heiskanen & Vening Meinesz 1958; Jeffreys 1959; Walcott 1970a, b, c; Hanks 1971; Cochran 1973; Watts & Talwani 1974). In these studies the lithosphere and asthenosphere are modelled as an elastic beam overlying a weak fluid substratum. Since these studies consider ages of loads greater than a few tens of thousands of years, the viscosity of the asthenosphere is neglected in the computations.
The response to applied loads of elastic beams overlying weak fluids is a well- known engineering problem (Hetdnyi 1946; Timoshenko 1955; Nadai 1963). We now give a brief outline of the method since it is important to the conclusions of this study and has not been clearly outlined previously in the geophysical literature.
The problem is usually approached (for example, Timoshenko 1955) by con- sidering the bending moment acting at a cross-section of the elastic beam due to an applied force or couple. The shearing force V acting at the cross-section is defined as the algebraic sum of all external forces applied to one side of the cross-section, and the bending moment M acting at the cross-section as the algebraic sum of all external couples applied to one side of the cross-section. It can simply be shown that
dM V = - .
d X
Consider the case of a load q per unit length of the elastic beam applied to a small element of the beam. If the element width is dx, the total load acting on the element is -q .dx (q is negative if it acts downward). To maintain equilibrium the shearing force at a cross-section changes by an amount dV given by -4. dx. Thus
-dV -d2 M q=-=---
d X dx2 . This is an important relation since q is the applied load, which is usually known.
The bending moment, M, at a cross-section in the beam can be simply related to the elastic properties of the beam and the radius of curvature of the deflection. Consider two cross-sections of a beam, mm' and pp' (Fig. 3) which are assumed to be normal to the longitudinal axis of the beam. In addition, it is assumed that on loading the cross-sections remain normal to the axis of the beam. Thus, on loading, the two cross-sections are rotated toward each other so that longitudinal fibres on

Gravity anomalies and flexure of the lithosphere 125
M
Radius of Curvature
i
FIG. 3. Deflection of an elastic beam due to an applied couple, M . The parameters indicated in the diagram are discussed in the text.
the concave side undergo compression while fibres on the convex side undergo ex- tension. There is, therefore, a surface which undergoes no longitudinal strain. This surface is represented by nn’ (Fig. 3) and is known as the neutral surface. Further, if the radius of curvature is p, the distance to a longitudinal fibre from the neutral surface yb and the longitudinal strain on the fibre E,,, we have (Fig. 3)
The longitudinal strain on the fibre is thus proportional to the distance from the neutral surface and inversely proportional to the radius of curvature. For a linearly elastic beam the stress, b,,, is proportional to the strain so
where E is Young’s modulus of elasticity. The force distributed over an area element dA of the cross-section is E . ( yb /p ) .dA
and the bending moment is E.(y,/p).dA.y,. If all moments on the cross-section are added algebraically and equated to the total external couple, M , we have
which becomes
EI M = - P
where I = Syb2 .dA is the moment of inertia with respect to the neutral axis (the intersection of the neutral surface with a cross-section). The product EI is defined as D, the flexural rigidity of the beam.

126 A. B. Watts and J. R. Cochran
We can now derive a general equation for the deflection, JJ, of the elastic beam. The radius of curvature p is simply expressed by
1 d 2 Y _ - - * -- P dx2 (7)
providing (dy/dx)’ 6 1. If the deflection is negative downward we have from (6) and (7)
Taking derivatives of (8) and applying (1) and (2) we have
d 4 y -dV E l - = - - - -4. dx4 d x (9)
Equation (9) expresses the applied load, q, in terms of the deflection, y , and the flexural rigidity of the beam, E l . This is the general equation for the deflection of an elastic beam.
The development of the theory has been in terms of elastic beams rather than thin plates, which might seem more applicable to the lithosphere. There are two reasons for this. First, the formulation of the theory is greatly simplified. Second, the load in this study is assumed to be two-dimensional and in this case beam theory is directly applicable. In fact, thin plate theory leads to the same results as beam theory (with the operator (d’/dx’) becoming (d’/dx’)+ (d’/dy’) = V’). The only change necessary is that the flexural rigidity is defined as [El/(l -02)] rather than E l , where o is Poisson’s ratio.
In the application to the Earth, the lithosphere is modelled as an elastic beam overlying a weak fluid. In this case the applied load is equal to the restoring stress acting on the beam. This is made up of an upward pressure exerted on the beam by the fluid substratum and a downward pressure exerted on the beam by the material infilling the deflection. If the density of the fluid is p m and that of the material in- filling the deflection is pw we have
Equation (9) thus becomes 4 = ( P m - P w ) . s . Y * (10)
(1 1) d4 Y E l - + ( p m - p w ) . g . y = 0. dx4
The solution of (11) is in the form of damped sinusoids and is given by
y = ( A cos Ax+ B sin Ax) exp (Ax) + (C cos Ax+ D sin Ax) exp (-Ax) (12)
where
Consider, for example, a line force for P, per unit width of the beam applied along the x = 0 axis. If the boundary conditions are: (1) y + 0, x -+ co and (2) dy/dx = 0, x = 0, the deflection curve is given by
. exp (- Ax). (cos Ax + sin Ax). APb 2(Pm-Pw) g
Y =
Gravity anomalies and flexure of the lithosphere 127
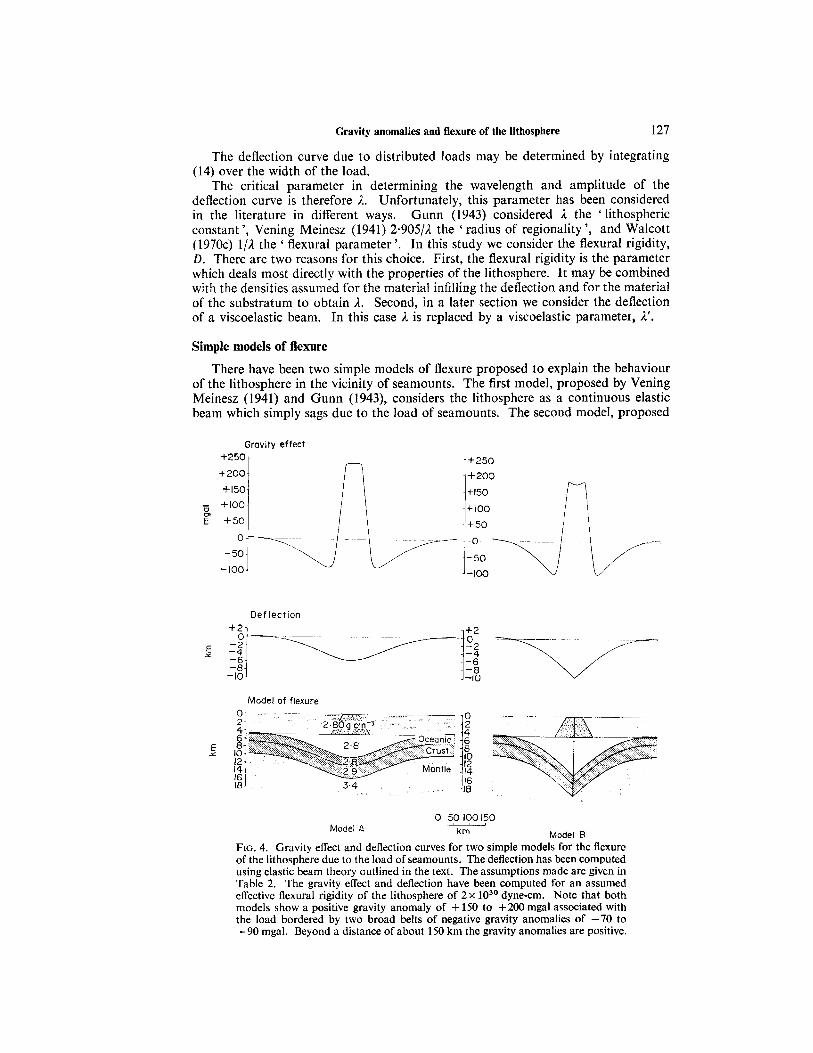
The deflection curve due to distributed loads may be determined by integrating (14) over the width of the load.
The critical parameter in determining the wavelength and amplitude of the deflection curve is therefore A. Unfortunately, this parameter has been considered in the literature in different ways. Gunn (1943) considered 1 the ‘lithospheric constant ’, Vening Meinesz (1941) 2.905/1 the ‘ radius of regionality ’, and Walcott (1970~) l / A the ‘ flexural parameter ’. In this study we consider the flexural rigidity, D. There are two reasons for this choice. First, the flexural rigidity is the parameter which deals most directly with the properties of the lithosphere. It may be combined with the densities assumed for the material infilling the deflection and for the material of the substratum to obtain 1. Second, in a later section we consider the deflection of a viscoelastic beam. In this case 1 is replaced by a viscoelastic parameter, 1’.
Simple models of flexure
There have been two simple models of flexure proposed to explain the behaviour of the lithosphere in the vicinity of seamounts. The first model, proposed by Vening Meinesz (1941) and Gunn (1943), considers the lithosphere as a continuous elastic beam which simply sags due to the load of seamounts. The second model, proposed
Gravity effect +250,
Deflection
1 + 250
\ I
Model of flexure
0 50 ’00 yo Model R Model A krn
FIG. 4. Gravity effect and deflection curves for two simple models for the flexure of the lithosphere due to the load of seamounts. The deflection has been computed using elastic beam theory autlined in the text. The assumptions made are given in Table 2. The gravity effect and deflection have been computed for an assumed effective flexural rigidity of the lithosphere of 2 x lo3’ dynecm. Note that both models show a positive gravity anomaly of + 150 to +200 mgal associated with the load bordered by two broad belts of negative gravity anomalies of -70 to -90 mgal. Beyond a distance of about 150 km the gravity anomalies are positive.

128 A. B. Watts and J. R. Cochran
Table 2 Assumed parameters for simple models A and B (Fig. 4)
E = loL2 dyne cm-*
D = 2 x lo3' dyne-cm
g = 980cms-'
pm = 3 . 4 g cm-3
pv = 2.8 g cm-j
by Walcott (1970~)~ considers the lithosphere to be fractured beneath the seamount forming two semi-infinite beams with a free surface between them. The elastic beam equivalent to this model is two cantilever beams with a free surface between them so that no shear stress can be transmitted from one beam to the other.
We have computed the deflection curves associated with the two simple models of flexure for assumed elastic properties of the lithosphere and an assumed load (Fig. 4). The load represents a two-dimensional seamount 5 km high, 120 km wide at the base and 50 km wide at the upper surface.
The deflection curves have been computed using elastic beam theory outlined in the previous section and the assumed parameters listed in Table 2.
The assumed density for the load of 2.8 g cm-3 is similar to the value used by Walcott (1970a) in a deformation study in the vicinity of Hawaii. This value differs somewhat from the value of 2-3 g cm-3 used by Woollard (1951) and Harrison & Brisbin (1959) for seamounts in the Pacific. However, relatively dense rocks with densities of up to 2.9 g cm-3 crop out on Oahu (Woollard 1951). In addition, rocks with densities of up to 3.0 g cm-3 have been inferred in the cores of seamounts of the Cook Island Group (Robertson 1967, 1970).
The assumed density of 2.8 g cm-3 for the material infilling the deflection is equal to the density assumed for the load. Thus in the computations it is assumed: (1) the density infilling the deflection beneath the load is 2-8 g ~ m - ~ , (2) the material infilling the deflection between the load and the peripheral bulge is 2.8 g ~ m - ~ and (3) the peripheral bulge is made up of material with a density of 2.8 g ~ m - ~ . These assumptions are, necessarily, only approximations to the relatively complex geology of individual seamounts. For example, seismic reflection profiles in the vicinity of Hawaii (Kroenke 1965) show that at least part of the material infilling the deflection between the load and the peripheral bulge is made up of relatively low density un- consolidated sediments.
Thus we may have overestimated the density of the material which is added and subtracted in the region beyond the load in the computations. The effect of over- estimating the density would be to change the downward pressure on the lithosphere and to modify somewhat the shape of the deflection curve.
The assumed density for the substratum of 3 ~ 4 g c m - ~ is similar to the value used by Vening Meinesz (1941) and Walcott (1970~) in deformation studies. This value is generally accepted as the upper mantle density in 'normal' oceanic or continental regions.
The deflection curves for both simple models reach a maximum depression beneath the load (Fig. 4). In addition, the depression extends for some distance beyond the load and is a maximum for Model B. The depression is also generally narrGwer for Model B than Model A. The deflection curves beyond the depression are positive for both Models A and B.
Gravity effect of simple models
The gravity effect of the simple flexure models can be simply computed from the load and computed deflection curves. The principal term in the gravity effect is

Gravity anomalies and flexure of the lithosphere 129
Table 3 Assumed crustal structure for gravity eflect of simple models A and B (Fig. 4)
Assumed Assumed thickness density
(km) (g ~ m - ~ ) Upper Layer 2 2.8
Crust Lower Layer 3 2.9
3.4 Mantle - Oceanic {
obtained from the sum of the gravity effect of the load and the gravity effect of the deflection. The gravity effect of the load is obtained assuming a uniform density of 2.8 g cm-3 for the load and a density of 1.03 g cmV3 for sea water.
In this study we assume that the principal term in the gravity effect of the deflection is due to displacement of individual crustal layers and the crust-mantle boundary. Implicit in this assumption is that no density contrasts exist between the base of the lithosphere and the fluid substratum. The crustal structure assumed is given inTable 3. Note that the assumed thickness of the oceanic crust is 5 km which is in the range of crustal thickness determined from seismic refraction studies in the Pacific (Shor, Menard & Raitt 1970).
The gravity effect of simple flexure Models A and B is shown in Fig. 4. The principal density contrasts of -0.1 g ~ m - ~ and - 0 * 5 g ~ r n - ~ are assumed to occur at depths of 2 km and 5 km beneath the estimated ‘ undisturbed ’ depth of the sea- floor adjacent to the seamount. Note that since the density of the load and the upper layer are equal, no density contrast occurs at the upper surface of the upper layer. The gravity effect of the flexure models (Fig. 4) shows that the seamount is associated with a positive anomaly in the range + 150 to +200 mgal. The positive anomalies are bordered by belts of negative anomalies in the range - 70 to - 90 mgal. There is a striking similarity in general character between the computed gravity effects and observed free-air anomaly profiles in the vicinity of the Hawaiian-Emperor seamounts (Figs 2 and 4).
Determination of the effective flexural rigidity of the lithosphere along the Hawaiian- Emperor Seamount chain
The study of the deformation of the lithosphere due to applied loads provides important data on the elastic properties of the lithosphere. The parameter most closely related to these properties is the effective flexural rigidity of the lithosphere. The term effective ’ flexural rigidity is used because the lithosphere is treated as a linear elastic beam with uniform physical properties while in reality the lithosphere is inhomogeneous. Thus the effective flexural rigidity is that of a beam of uniform properties which deforms in the same manner as the real lithosphere.
The usual approach is to compute the deformation of the lithosphere for assumed values of the effective flexural rigidity and to determine the value which most satis- factorily explains geological or geophysical evidence of the deformation. This evidence is usually in the form of topography, seismic, gravity or a combination of these data. In sea-covered regions sea-floor processes, sediments and fracture zones may obscure regional changes in topography. However, studies have been made of the peripheral bulges adjacent to Hawaii (Walcott 1970c) and seaward of deep-sea trenches (Hanks 1971; Watts & Talwani 1974). The peripheral bulge is well developed in the vicinity of Hawaii (Chase, Menard & Mammerickx 1970) but cannot be identi- fied beyond Midway Atoll or adjacent to the Emperor Seamounts.

130 A. B. Watts and J. R. Cochran
We use gravity anomalies to determine the ' best-fitting ' effective flexural rigidity rather than regional changes in topography which may be modified by sea-floor processes or tectonic events. In addition, gravity anomalies indicate buried structure which cannot be deduced from topography profiles. The gravity anomalies associated with the deformation of the lithosphere due to seamounts (Fig. 4) can easily be distinguished in surface ship free-air anomaly profiles across the Hawaiian Ridge and Emperor Seamounts (Fig. 2). In contrast, regional changes in topography associated with the deformation of the lithosphere can only be distinguished adjacent to the south-eastern end of the Hawaiian Ridge.
In this section we outline the method of determining the effective flexural rigidity of the lithosphere along the Hawaiian-Emperor seamount chain and discuss the results.
The load of the seamount chain has been estimated from topography profiles which have been projected normal to the trend of the chain (Fig. 2). The load is approximated by a polygonal outline extending above an estimated mean ' un- disturbed ' depth of adjacent ocean floor. This undisturbed depth is the ' baseline ' for computations.
In the computations the load is divided into a number of rectangles and triangles. The deflection of the lithosphere is then computed for each loading element using a modification of (14) given in Hettnyi (1946). The total deflection is obtained as the sum of the deflection due to all elements utilizing the principal of superposition (Hettnyi 1946).
As stated earlier the load in the computations is assumed to be two-dimensional. We studied the effect of a three-dimensional approach by considering profile 2. This profile was chosen because it crosses close to the northern edge of a seamount. The load in the vicinity of profile 2 was determined as averages of the topography over 10' x 1 0 ' squares' obtained from bathymetry maps of Chase et al. (1970). The deflection was then computed using three-dimensional thin-plate theory developed by Hertz (1884). The gravity effect of the three-dimensional load and deflection was computed using the method of Talwani & Ewing (1960). The three-dimensional model resulted in a maximum deflection of 5.4 km as compared with a value of 5-5km for the two-dimensional model. The wavelength and magnitude of thc flanking gravity lows were nearly identical for both models. The positive peak over the seamount was somewhat smaller for the three-dimensional model. Thus the assumption of a two-dimensional load appears to be a valid model along the chain.
The deformation of the lithosphere and its gravity effect was computed for different values of the effective flexural rigidity of the lithosphere for each profile across the chain using densities given in Table 2. The values of the effective flexural rigidity which most satisfactorily explained both the wavelength and amplitude of observed gravity anomaly profiles were then determined. A ' best-fitting ' effective flexural rigidity of the lithosphere was defined as the value which minimized the sums of squares of residuals of observed and computed gravity anomalies.
The computed gravity effect of the ' best-fitting ' flexure models is compared to observed gravity anomaly profiles in Fig. 5. Fig. 5 shows that the computed gravity effect explains in a general way both the amplitude and wavelength of the observed gravity anomaly profiles. In fact, considering the simplicity of the flexure models, the fit is remarkably good.
Some differences do, however, exist between observed and computed gravity anomalies for some profiles. First, discrepancies occur in regions of short-wavelength variations in observed gravity anomalies. These variations correlate with irregularities in topography at the foot of the seamount or beyond it (Profiles 3 and 4, Figs 2 and 5). Second, discrepancies occur in regions of the minimum of the negative anomalies bordering the seamount. Profiles 1, 2 and 3 (Fig. 5) show that the computed curves are generally more positive than the observed. This is most likely due to a relatively

Gravity anomalies and flexure of the lithosphere 131
3 A-d.b 4 7J-L .... - - -~ ....
I.... -.- ~ 7LI ................ ." ... "" ....... .,~: ..... 5
-Observed
qw: ~~ .......... ..... - . ~~~~~ ~ .... . ........................... -... ..... i
Model 8 0 100 200 390 km
11 ' Computed Model A
FIG. 5. Comparison of observed free-air gravity anomalies across the Hawaiian- Emperor seamount chain with the computed gravity effect of simple flexure models A and B. The computed gravity effect has been obtained for each profile for the effective flexural rigidity of the lithosphere listed in Table 4. Note the computed effect explains in a general way both the amplitude and wavelength of the observed profiles. The fit is particularly good for profiles 1, 4, 6 and 7. The age of the
seamounts in these profiles is in the range 3.5-65 My.
thick sequence of sediments at the foot of these seamounts. Third, discrepancies occur in the region of the broad belt of the positive anomalies which correlate with the Hawaiian Arch in profiles 6 and 7 (Fig. 5). This could be due in part to a high regional background gravity field in the vicinity of Hawaii as suggested from a broad satellite derived gravity anomaly high of about +25 mgal in the vicinity of Hawaii (Gaposchkin & Lambeck 1971).
It is interesting to note that the maximum deflections obtained along the chain are also in general agreement with available seismic refraction data. The maximum deflections are in the range 8-1 1 km for profile 7 (Table 4). These deflections are in general agreement with seismic refraction evidence near Oahu (Shor & Pollard 1964) that the depth of the ' Moho ' increases from about 10 km beneath the Hawaiian Arch to about 23 km beneath the Hawaiian Ridge. However, the comparison is complicated by the relatively complex crustal structure beneath Oahu. For example, the lower crustal layer with seismic velocities in the range 6-5 to 6.9 km s-l is not depressed by an equivalent amount as the ' Moho '. The maximum deflections are in the range 1.7 to 4.4 km for profiles 5 and 6 (Table 4) in the vicinity of Midway and Nihoa. Shor (1960) described a crustal section between Midway and Nihoa in which he obtained a maximum difference of about 8 km in the depth of the ' Moho ' beneath the ridge and the arch.
The question which arises, of course, is how sensitive the deduced values of the ' best-fitting ' flexural rigidity are to changes in the assumed parameters used in the simple models. We found that, in general, changes in the assumed density of the load produced only small changes in the ' best-fitting ' flexural rigidity. For profile 2

Prof
ile
num
ber
1
2 3 4 5 6 7
Tab
le 4
Su
mm
ary
of p
aram
eter
s ob
tain
ed in
com
puta
tions
Bes
t-fi
tting
effe
ctiv
e fl
exur
al ri
gidi
ty, D
M
odel
A
Mod
el B
1.5
6.0
2.0
10.0
8.0
40
.0
10.0
75
.0
0.9
10
.0
4.0
10.0
5.0
9
.0
x l
oz9
dyne
-cni
x l
oz9 d
ynec
m
Max
imum
de
flec
tion
Mod
el A
M
odel
B
5.7
7.5
5.4
5
.5
4.7
5
-5
5.4
7.
6 1
.7
4.4
1.8
2
.6
8.5
10
.9
. (W
(W
Dis
tanc
e fr
om K
ilau
ea,
Haw
aii
(W
5288
50
21
4643
38
20
2478
71
6 37
7
Est
imat
ed
Age
(Cla
gue
&
Jarr
ard
1973
)
(MY
) 58
.5
56.0
52
.0
45.0
18.0
7
.5
3-0
?
B 8
z G: D 1- TJ
e.

Gravity anomalies and flexure of the lithosphere 133
a range in density of 2.5-3-1 g cm-3 caused a maximum change of 10 per cent in the ' best-fit '. Furthermore, it was found that the ' best-fitting ' effective flexural rigidity was generally insensitive to changes in assumed crustal structure which are within the limits found in oceanic regions.
The results summarized in Table 4 show that the ' best-fitting ' flexural rigidities of the lithosphere for profiles 1 and 2 across the Emperor Seamounts are similar in magnitude to values for profiles 5, 6 and 7 across the Hawaiian Ridge. The values for profiles 3 and 4, on the other hand, are somewhat higher.
The results can be most satisfactorily explained by scatter about a single value. The mean value is 4.5 x loz9 dyne-cm for Model A and 23 x lOZ9dyne-cm for Model B. The standard deviation is 3 x loz9 for Model A and 23.9 x loz9 for Model B. The large standard deviation for Model B is due to the extremely high values obtained in Profiles 3 and 4 over the Emperor Seamounts. The most important point is that there is apparently no evidence of a marked decrease in the effective flexural rigidity along the seamount chain.
Change in the effective flexural rigidity of the lithosphere with time
Recent studies of rock deformation (Pratt 1967; Murrell 1967; Weertman 1970) suggest that a number of creep processes may occur in the Earth. Although inelastic behaviour in the Earth cannot be simply modelled, the behaviour of materials in some regions of the Earth may be approximated by a dominant type of creep process. Walcott (1970a) considered that the lithosphere responded to applied loads as a viscoelastic substance with a time constant of lo5 years using equations fur the deflection of a viscoelastic beam given by Nadai (1963). Implicit in these equations is that inelastic behaviour of the materials of the beam occurs by diffusion creep. Thus, Walcott (1970a) suggests the lithosphere responds to constant loads, such as seamounts, by a continual downsagging beneath the load and a continual uplift in peripheral regions.
There are, however, a number of problems with the hypothesis of Walcott (1970a). His conclusions concerning the effect of time of loading are based on effective flexural rigidity determinations for surface loads in widely different geological provinces and on both continental and oceanic lithospheric plates. The deduced differences in the effective flexural rigidity could be caused, at least in part, by changes in plate thickness between oceanic and continental regions. In addition, there is some doubt that diffusion creep is the dominant form of deformation in the upper mantle (McKenzie 1968; Weertman 1970).
We now compare the effective flexural rigidity determinations along the Hawaiian- Emperor seamount chain to the simple model for the inelastic behaviour of the lithosphere proposed by Walcott (1970a). The Hawaiian-Emperor seamount chain is particularly suited for this comparison because the ages of the seamounts are relatively well documented and the seamount chain is located in the interior of a single lithospheric plate. Thus, any evidence of inelastic behaviour along the sea- mount chain will provide constraints on proposed models for the rheology of the lithosphere.
Age of the seamount chain
The age data along the Hawaiian-Emperor seamount chain has recently been reviewed by Jackson, Silver & Dalrymple (1972) and Clague & Jarrard (1973). Jackson et al. (1972) obtained an age of the bend in the Hawaiian-Emperor seamount chain of about 25 My. However, Clague & Jarrard (1973) obtained a well-determined age of 46 My for Koko seamount (Fig. 1) suggesting the age of the bend was about 42My. In this study we use the age determinations of Clague & Jarrard (1973).

134 A. B. Watts and J. R. Cochran
The ages of the seamounts in the vicinity of the profiles were obtained by linear interpolation of data plotted in Fig. 5 of Clague & Jarrard (1973).
Viscoelastic efSect
An important property of non-Newtonian fluids is that they have a differential viscosity which depends on the applied stress and which decreases with increasing stress. Some materials respond by an initial elastic strain followed by a viscous flow when subject to a constant load and are termed Maxwell fluids. The hypothesis that the lithosphere responds to surface loads as a Maxwell viscoelastic substance has recently been proposed by Walcott (1970a). We now examine briefly the deflection of a viscoelastic beam overlying a weak fluid.
The problem is approached by considering the stresses acting on a cross-section of the beam as in the elastic case. The main difference in the computations is that the total strain is now made up of an elastic and an inelastic part. For the case where inelastic flow of materials of the beam occurs by diffusion creep, the strain rate due to the inelastic part is linearly dependent on the applied stress. The differential equation for the deflection of a viscoelastic beam is given by Nadai (1963) as
(1 5 ) d4 j dx4 E I p = (Pm-Pw).g. [Y + (j/r)l
where E, I, pm, pw, y and g have been previously defined for the elastic case. The dot indicates the first derivative with respect to time and z is defined as 3ylE where y is the effective viscosity of the beam. z has units of time and is referred to as the relaxation time.
The general solution of (15) has been obtained by Nadai as
y = C.exp ( t l t ’ ) . exp (-1’ x). (cos 1’ x+sin 1’ x) (16)
where A’ is a parameter arising out of the separation of variables and
t ’ = (. x4 -1) z.
The parameter 1‘ has a similar role in (16) as does A in (14) which is the solution of the linearly elastic case.
The solution of (16) of interest in this study is the progressive change with time in the deflection of the viscoelastic beam under a constant load. Nadai (1963) has given the required expressions for a line load. After a time increment, 2, given by
t = . ( ( 3 4 -1-log ( ( 3 4 ) )
the total deflection is
. (exp (- Ax). cos Ax) i P y = c,+
2 (Pm - P w ) . g
(exp(-l’x) cosirx)-l.exp(-Ax).(coslx+sinlx).log(~)) (18)
where C, is the initial elastic deflection. Thus, for assumed increments of the ratio 1’11, the corresponding change in time and the total deflection can be obtained.
We show three cases for the deflection of a viscoelastic beam due to a point load, P, in Fig. 6. The deflections correspond to the cases A’l1 = 1, 1‘/1 = 2.4 and XI1 = 3-7. Since z, the relaxation time, can also be varied in the equations, the change in time is expressed as a ratio tlz.

Gravity anomalies and flexure of the lithosphere 135
krn
Viscoelostic flexure Elastic flexure which best
wovelength of viscoelastic flexure
- --- explains amplitude and
krn
FIG. 6. Change with time of the deflection of a viscoelastic sheet under a constant point load, Pb. The initial deflection ( t i . = 0) is an elastic deflection computed for P b = 0 . 7 2 ~ 10" dyne-cm-' and Do = 3.5 x lo3' dyne-cm. Do is the instant- aneous effective flexural rigidity of the lithosphere. Subsequent viscoelastic deflections have been computed for ti. = 8.2 and t / r = 45.0 where I is the relaxation time. Also shown are the elastic deflections which most satisfactorily
explain the amplitude and wavelength of the viscoelastic deflections.
f4 FIG. 7. Change with time in the effective flexural rigidity if the Iithosphere responds to applied loads as a Maxwell material. The actual change depends on whether the amplitude or wavelength of the flexure is fitted (Walcott 1970a).
Although the effective flexural rigidity is the parameter which most directly expresses the response of a purely elastic beam, the change with time of the deflection of a viscoelastic beam cannot be simply expressed in terms of a change in this para- meter. The effective flexural rigidity corresponding to a particular time depends on whether the amplitude or wavelength of the deflection is matched. However, it is possible to find a range of the effective flexural rigidity which most satisfactorily explains both the wavelength and amplitude of the viscoelastic deflections due to the load P as a function of the ratio t / z (Fig. 7).
There are two main problems with the comparison of the change in the effective flexural rigidity of the lithosphere predicted for the viscoelastic case with deduced values of the effective flexural rigidity along the seamount chain. First, the initial

136 A. B. Watts and J. R. Cochran
effective flexural rigidity of the lithosphere, Do, is unknown, and second, the value of z, which depends on the effective viscosity assumed for the lithosphere, is also unknown.
The procedure adopted in this study is to consider a number of values for these parameters and then compare the predicted effective flexural rigidity to the deduced values of the effective flexural rigidity along the chain. We will consider two cases here: (1) Do = 3.5 x lo3' dyne-cm which corresponds to an ' instantaneous ' effective thickness of the oceanic lithosphere of To = 75 km and (2) Do = 6.2 x lo3' dyne-cm which corresponds to an effective thickness of To = 50 km. These values are within the range suggested by Press & Kanamori (1970) for the seismological thickness of the oceanic lithosphere. In both cases a relaxation time constant of lo5 years was assumed. This is the value suggested by Walcott (1970a) and with E = 10" dyne-cm-' corresponds to an effective viscosity of the lithosphere of about loz4 poise.
320
I
0
32.0
___ 31.0
I 3
I 1
Age of loading (My) F= 75 km ::A': ...... F=50km ......
FIG. 8. Plot of the effective flexural rigidity of the lithosphere against age of loading for the Hawaiian-Emperor seamount chain. We also show two cases for the predicted change in effective flexural rigidity of the lithosphere if the lithosphere responded to the loads as a Maxwell material. The first case is for an initial elastic deflection with Do = 3 . 5 ~ lo3' dyne-cm which corresponds to an effective thickness To = 75 krn and the second case for Do = 6 . 2 ~ lo3' dyne-cm which corresponds to an effective thickness To = 50 km. In both cases we assumed a relaxation time T = lo5 years which corresponds to an effective viscosity of about 7 = loz4 poise. Note that the deduced values for the seamounts cannot be simply explained by changing the instantaneous effective flexural rigidity or the relaxation time. Rather, the effective flexural rigidity for profiles at the beginning and the end
of the chain appear to have similar values.

Gravity anomalies and flexure of the lithosphere 137
The predicted change in the effective flexural rigidity of the lithosphere for both cases is compared to deduced values of the effective flexural rigidity along the seamount chain in Fig. 8. This comparison shows that the two cases considered do not explain the deduced values along the chain. For case (1) with To = 75 km and 7 = 10’ years, the predicted values for profiles 1 to 4 are generally lower than the deduced values. In addition the predicted value for profile 7 is higher. The fit for case (1) cannot be improved simply by changing z. Increasing z improves the fit for profiles 1-4 but does not improve the fit for profiles 5-7. Decreasing z makes the fits for both profiles 1-4 and 5-7 worse. For case (2) with To = 50 km and z = lo5 years, the predicted values for profiles 1-7 are generally lower than the deduced values. The fit for case (2) also cannot be improved simply by changing ‘t.
This comparison suggests that the effective flexural rigidity determinations along the seamount chain cannot be simply explained if the lithosphere responds to surface loads as a Maxwell substance with a relaxation time of 10’ years. We have satisfied ourselves, in the previous section, that assumptions in the computations do not give rise to serious errors in the distribution of the effective flexural rigidity determinations along the chain.
This comparison cannot determine the creep laws which most satisfactorily explain the response of the lithosphere to surface loads. However, we can suggest simple models for the lithosphere which would be consistent with the effective flexural rigidities deduced in this study. The lithosphere could be modelled either as a Maxwell substance with an extremely long decay constant of the order of lo8 to lo9 years (which implies an effective viscosity of lo2’ to 10’’ poise) or as a material in which the creep process is dominated by a strain rate which is either proportional to the logarithm of time or to some power of time.
In summary, we suggest that after a few million years of loading the effective flexural rigidity of the lithosphere approaches a minimum, nearly constant value. Thus the lithosphere in oceanic regions appears to be rigid enough to support large stress-differences for at least several tens of million years.
Implications for the origin of subsidence of atolls and guyots
We have not, in the above discussion, explained geological evidence that atolls and guyots in the Pacific may have subsided at constant rates of about 1 cm/500 years during the last 100My (Menard & Ladd 1963). The subsidence of Midway Atoll (about 16 My) is about 400 m and at the northern-most Emperor Seamount (about 65 My) is predicted to be about 900m. If this subsidence was accompanied by an increase in the deformation of 400 m beneath Midway Atoll and 900 m beneath the northern-most Emperor seamount there would be a significant change in the effective flexural rigidity along the seamount chain. If the instantaneous effective flexural rigidity is assumed to be Do = 3.5 x lo3’ dyne-cm at Hawaii, then the effective flexural rigidity would be about D = 1 x lo3’ dyne-cm at the northern-most Emperor seamount. The results of this study suggest however, there has been little change in the effective flexural rigidity along the seamount chain. Thus, in order to explain these results, the subsidence must be a form of regional subsidence which extends beyond the depression and peripheral bulge associated with the deformation of the lithosphere due to the load of the seamounts.
There are currently two hypotheses which could explain in a general way regional subsidence of lithospheric plates. These are (1) thermal contraction of the lithosphere due to cooling of newly-formed oceanic lithosphere at mid-ocean ridges (Sclater & Francheteau 1970) and (2) the motion of passive lithospheric plates over regions of broad upwarps and/or downwarps in the asthenosphere (Menard 1973). The upwarps and/or downwarps are believed to be maintained by some form of thermal con- vection over a comparable area of the asthenosphere.
138 A. B. Watts and J. R. Cochran
The first hypothesis is not a likely origin of the regional subsidence. The subsidence due to thermal contraction would be negligible for the difference in the age of the oceanic crust between Hawaii and the northern-most Emperor seamount (between 80 and l20My). The second hypothesis is the most likely origin of the regional subsidence. In this hypothesis, areas of recent volcanic activity such as Hawaii are associated with broad regions of upwarp in the asthenosphere. This upwarp is associated with a regional rise of several hundred metres of the overlying passive lithospheric plate. In the case of Hawaii, as the Pacific plate moves westward away from the region of upwarp, the lithosphere and the newly-formed volcanic islands subside.
There is good general evidence of a broad regional rise in topography in the vicinity of Hawaii. Profiles 6 and 7 (Fig. 2) show a regional rise in topography of a few hundred metres associated with the south-eastern end of the Hawaiian Ridge. The regional rise extends for a distance of at least 1000 km and is clearly superimposed on local changes in topography of the ridge, moat and bordering arch. In addition, the extent of the regional rise on profiles 6 and 7 correlates in a general way with a gravity anomaly high of about + 25 mgal outlined on maps derived from the obser- vations of satellites (Gaposchkin & Lambeck 1970). These maps contain information about features of the Earth's gravity field with wavelengths greater than about 1000 km.
Clearly, the correlation of the regional rise in topography with long-wavelength gravity anomalies derived from observations of satellites needs to be examined more fully before causes of the correlation can be understood. However, the hypothesis of Menard (1973) explains in a general way the subsidence of atolls and guyots along the Hawaiian-Emperor seamount chain. In addition, since the subsidence occurs over broad regions of the lithosphere, this hypothesis is consistent with the conclusion of this study that there is little change in the elastic properties of the lithosphere along the seamount chain. The subsidence of atolls and guyots along the seamount chain can be explained by a broad subsidence of the lithosphere and need not, there- fore, be attributed to the inelastic behaviour of the materials of the lithosphere beneath individual seamounts.
Conclusions
The Emperor seamounts are associated with large amplitude positive free-air gravity anomalies which reach +225 mgal and negative anomalies which reach - 105 mgal. The negative anomalies form two belts which border the positive anomaly belt and are continuous for the entire length of the seamount chain.
The amplitude and wavelength of free-air gravity anomaly profiles along the Hawaiian-Emperor seamount chain can be explained in a general way by simple models for the flexure of the lithosphere. There is little change in the deduced effective flexural rigidity for profiles along the seamount chain. This suggests there is little change in the effective flexural rigidity with time. The mean effective flexural rigidity along the chain is about 5 x dyne-cm if the lithosphere is modelled as a continuous plate or 2 x lo3' dyne-cm for a discontinuous plate.
The deduced values of the effective flexural rigidity along the chain cannot be simply explained if the lithosphere responds to applied loads as a Maxwell body with a time constant of lo5 years as suggested by Walcott (1970a). The deduced values can be best explained either if the lithosphere responds to constant loads as a Maxwell body with a large time constant or as a substance in which the creep rate approaches zero after a few million years of loading. The oceanic lithosphere therefore appears to be rigid enough to support the load of the Hawaiian-Emperor seamount chain for at least several tens of millions of years.
The subsidence of seamounts along the chain is more likely to be caused by a

Gravity anomalies and flexure of the lithosphere 139
regional subsidence of the Pacific plate as it moves westward off a broad rise in the vicinity of Hawaii than by the inelastic behaviour of the materials of the plate beneath individual seamounts.
Acknowledgments
We would like to thank Dick Bischke, Dave Campbell, Chris Scholz and Manik Talwani for critically reading the manuscript and offering suggestions for its improve- ment. Gary Selzer provided valuable assistance in the computations involved in the problem of three-dimensionality. This research was funded by Office of Naval Research Contracts NOOO14-67-A-0108-0004, NONR 266 (79) and NONR 226 (48) and National Science Foundation Grants GA3 12, GA894, GA1434, GA5392, CAI7761 and GA27281.
Lamont-Doherty Geological Observatory of Columbia University, Palisades, New York 10964
References Caputo, M., Masada, R., Helfer, M. D. & Hager, C . L., 1964. Gravity measurements
in the Atlantic, Pacific and Indian Oceans, May 1962-August 1963 (R/V ARGO), Interim Report, University of California, Institute of Geophysics and Planetary Physics (Unpublished manuscript).
Chase, T. E., Menard, H. W. & Mammerickx, J., 1970. Bathymetry of the North Pacific, Scripps Institution of Oceanography and Institute of Marine Resources, Chart numbers 1, 2, 3, 5, 6 and 7.
Clague, D. A. & Jarrard, R. D., 1973. Tertiary Pacific Plate motion deduced from the Hawaiian-Emperor Chain, Geol. SOC. Am. Bull., 84, 1135.
Cochran, J. R., 1973. Gravity and magnetic investigations in the Guiana Basin, Western Equatorial Atlantic, Geol. SOC. Am. Bull., 84, 3249.
Furumoto, A. S., 1965. A gravity survey of the island of Kahoolawe, Hawaii, Pacijc Sci., 19, 349.
Gaposchkin, E. M. & Lambeck, K., 1971. Earth‘s gravity field to the sixteenth degree and station coordinates from satellite and terrestrial data, J. geophys. Res., 76, 4855.
Graf, A. & Schulze, R., 1961. Improvements on the Sea Gravimeter Gss2, J. geophys. Res., 66, 1813.
Gunn, R., 1943. A quantitative evaluation of the influence of the lithosphere on the anomalies of gravity, J. Franklin Inst., 236, 373.
Hanks, T. C., 1971. The Kuril trench-Hokkaido rise system: Large shallow earth- quakes and simple models of deformation, Geophys. J. R. astr. SOC., 23, 173.
Harrison, J. C. & Brisbin, W. C., 1959. Gravity anomalies off the west coast of North America, Am. geol. SOC. Bull., 70, 929.
Hayes, D. E., Worzel, J. L. & Karnick, H., 1964. Tests on the 1962 model of the Anschutz gyrotable, J. geophys. Res., 69, 749.
Heiskanen, W. A, & Vening Meinesz, F. A., 1958. The Earth and its gravityfield, McGraw-Hill, 470 pp.
Hertz, H., 1884. On the equilibrium of floating elastic plates, Wiedemann’s Annalen,
HetCnyi, M., 1946. Beams on elastic foundation, Ann Arbor: The University of Michigan Press, 255 pp.
Jackson, E. D., Silver, E. A. & Dalrymple, G. B., 1972. Hawaiian-Emperor Chain and its relation to Cenozoic circum-Pacific Tectonics, Geol. SOC. Am. Bull., 83, 601.
The Earth, Cambridge University Press, 438 pp.
22, 449.
Jeffreys, H., 1959.

140
Khan, M. A., Woollard, G. P. & Daugherty, K. I., 1971.
A. B. Watts and J. R. Cochran
Statistical analysis of the relation of marine gravity anomalies to bathymetry, Hawaii Institute of Geo- physics, University of Hawaii (Unpublished manuscript).
Kroenke, L. W. & Woollard, G. P., 1965. Gravity investigations on the Leeward Islands of the Hawaiian Ridge and Johnston Island, Pacific Sci., 19, 361.
Kroenke, L. W., 1965. Seismic reflection studies of sediment thickness around the Hawaiian Ridge, Pacijic Sci., 19, 335.
LaCoste, L. J. B. & Harrison, J. C., 1961. Some theoretical considerations in the measurement of gravity at sea, Geophys. J . R . astr. SOC., 5, 89.
McKenzie, D. P., 1968. The geophysical importance of high-temperature creep, in The history of the Earth’s crust, Proceedings of N.A.S.A. Conference, Princeton University Press.
Menard, H. W. & Ladd, H. S., 1963. Oceanic islands, seamounts, guyots and atolls, The Sea, 3, p. 365, Interscience, New York.
Menard, H. W., 1973. Depth anomalies and the bobbing motion of drifting islands, J. geophys. Res., 78, 5128.
Murrell, S. A. F., 1967. An experimental study of the effect of temperature and stress on the creep of rocks, with a discussion of earth tide damping, isostasy and mantle convection, Geophys. J . R . astr. Soc., 14, 51.
Nadai, A., 1963. Theory of$ow and fracture of solids, 2, McGraw-Hill, 705 pp. Pratt, P. L., 1967. Strength and deformation of ionic solids, Geophys. J. R. astr. SOC.,
14, 5 . Press, F. & Kanamori, H., 1970. How thick is the lithosphere? Nature, Lond., 226,
330. Robertson, E. I., 1967. Gravity effects of volcanic islands, New Zealand J . Geophys.,
10, 1466. Robertson, E. I., 1970. Additional gravity surveys in the Cook Islands, New Zealund
J. Geophys., 13, 184. Rose, J. C. & Belch&, J. C., 1965. Gravity and magnetic fields over the proposed
Moho Hole site north of Maui, Pacijic Sci., 19, 374. Sclater, J. & Francheteau, J., 1970. The implications of terrestrial heat flow
observations on current tectonic and geochemical models of the crust and upper mantle, Geophys. J . R . astr. SOC., 20, 509.
Segawa, J., 1970. Gravity measurements at sea by use of the T.S.S.G., Part 2, Results of the measurements, J. Phys. Earth, 18,203.
Shor, G. G., 1960. Crustal structure of the Hawaiian Ridge near Gardner Pinnacles, Bull. seism. SOC. Am., 50, 563.
Shor, G. G. & Pollard, D. D., 1964. Mohole site selection studies north of Maui, J. geophys. Res., 69, 1627.
Shor, G. G., Menard, H. W. & Raitt, R. W., 1970. Structure of the Pacific basin, in The Sea, 4, Part 11, 3, Interscience, New York.
Strange, W. E., Woollard, G. P. & Rose, J. C., 1965. An analysis of the gravity field over the Hawaiian Islands in terms of crustal structure, Pacijic Sci., 19, 381.
Talwani, M. & Ewing, M., 1960. Rapid computation of gravitational attraction of three-dimensional bodies of arbitrary shape, Geophysics, 25, 203.
Timoshenko, S. , 1955. Strength of materials, Third Edition, D. Van Nostrand Co., Princeton, N.J., 442 pp.
Vening Meinesz, F. A., 1929. Theory and practice of pendulum observations at sea, Waltman, Delft.
Vening Meinesz, F. A., 1941. Gravity over the Hawaiian Archipelago and over the Maderia area, Proc. Netherlands Acad., Wetensia, 44 pp.
Walcott, R. I., 1970a. Flexural rigidity, thickness, and viscosity of the lithosphere, J. geophys. Res., 75 , 3941.

Gravity anomalies and flexure of the lithosphere 141
Walcott, R. I., 1970b. Isostatic response to loading of the crust in Canada, Can. J. earth Science, 7, 716.
Walcott, R. I., 1970c. Flexure of the lithosphere at Hawaii, Tectonophysics, 9, 435.
Walcott, R. I., 1972. Gravity, flexure and the growth of sedimentary basins at a continental edge, Geol. SOC. Am. Bull., 83, 1845.
Watts, A. B. & Talwani, M., 1973. Gravity anomalies seaward of deep-sea trenches and their tectonic implications, Geophys. J. R. astr. Soc., 36, 57.
Weertman, J., 1970. The creep strength of the Earth’s mantle, Rev. geophys. Space Phys., 8, 145.
Woollard, G. P., 1951. A gravity reconnaissance of the island of Oahu, Trans. Am. geophys. Union, 32, 358.
Worzel, J. L., 1965. Pendulum gravity measurements at sea 1936-1959, John Wiley, New York, 422 pp.