FY2021 Third Quarter Consolidated Financial Results
22
November 11, 2021 Rakuten Group, Inc. FY2021 Third Quarter Consolidated Financial Results
Transcript of FY2021 Third Quarter Consolidated Financial Results

November 11, 2021Rakuten Group, Inc.
FY2021 Third QuarterConsolidated Financial Results

A Unique EcosystemDiversified and Resilient
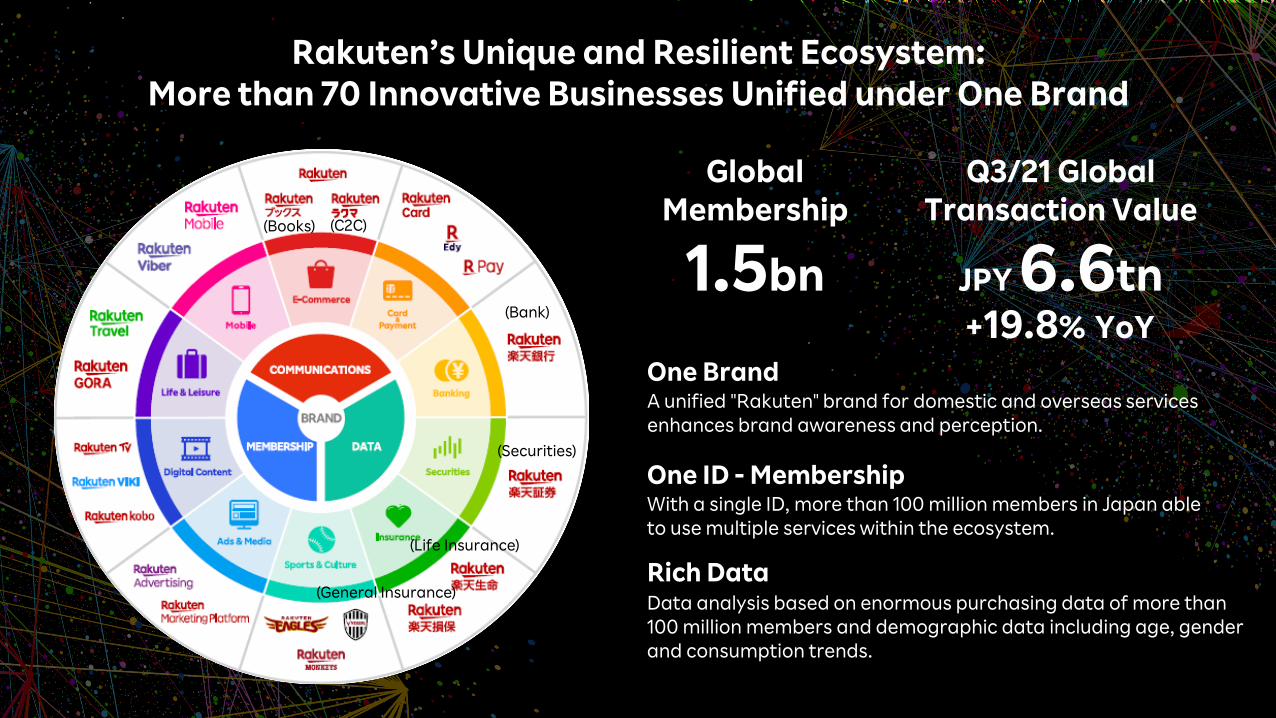
Rakuten’s Unique and Resilient Ecosystem: More than 70 Innovative Businesses Unified under One Brand
(Bank)
(Securities)
(Life Insurance)
(General Insurance)
(Books) (C2C)
One ID - Membership
One Brand
With a single ID, more than 100 million members in Japan ableto use multiple services within the ecosystem.
A unified "Rakuten" brand for domestic and overseas services enhances brand awareness and perception.
Rich DataData analysis based on enormous purchasing data of more than 100 million members and demographic data including age, gender and consumption trends.
+19.8% YoY
GlobalMembership
1.5bn
Q3/21 GlobalTransaction Value
JPY 6.6tn

Fintech Rakuten’s FinTech Ecosystem
Money Bridge
Rakuten Card
charge
Direct payments from Rakuten Bank
SPU + 1x with Rakuten Card payment for
insurance premiums (certain products)
Accumulation-type investment trust paid with a Rakuten Card
SPU + 1x with Rakuten Card
direct debittransactions
Expansion of
Ecosystem27.2%クロス
6mmaccounts
Number of cards issued*
24mm
11mmaccounts
Rakuten Bank
charge(Bank)
(Securities)
(Life Insurance)
(GeneralInsurance)
* Includes the issuance of a second Rakuten card per cardholder, which started in earnest in June 2021

Growth Outpacing Industries through Disruption
Industry average
2-year CAGR
*Ministry of Economy, Trade and Industry, “Commercial Sales Value by Type of Business.”
+16%-1%
Industry average2-year CAGR
-14%-56%
Industryaverage2-year CAGR
+16% -9%
*Ad expenditure of newspapers, magazines, radio, TV.*Dentsu: “2020 Advertising Expenditures in Japan.”
* Japan Tourism Agency, “Travel Agency Transaction Amounts.”
Rakuten Domestic EC GMS Rakuten Travel GTV Rakuten Ad Business Revenue
* Japanese Bankers Association, National bank deposits.*Ministry of Economy, Trade and Industry, “Statistical Survey on Dynamics of Specified Service Industries: Credit Card.”
Industryaverage2-year CAGR
+25%+4%
Rakuten Card Shopping GTV
Industryaverage2-year CAGR
+38%+6%
Rakuten Bank Deposits
FY2021Target JPY 5trillion

Digital MomentumAccelerating Growth

US
7.0
4.9
-3.5
2020 2021 2022
Latin America/Caribbean Countries
5.8
3.2
-7.0
2020 2021 2022
Sub-Saharan Africa
3.44.1
-1.82020 2021 2022
Eurozone
4.6 4.3
-6.5
2020 2021 2022
China
8.1
5.7
2.3
2020 2021 2022
Japan
2.8 3.0
-4.7
2020 2021 2022
The World Economy Shows Signs of Recovery: Actual GDP Growth
Actual GDP growth rate (% YoY).Source: International Monetary Fund, “World Economic Outlook (WEO) Revised Outlook,” July, 2021.※Each regional graph shows actual data for FY2020, forecast for FY2021 and FY2022.
Source: International Monetary Fund’s “World Economic Outlook (WEO) Revised Outlook”

Tokyo: Rakuten Crimson House
342K
Workplace vaccination
Sendai: Rakuten Seimei Park Miyagi
121K
Workplace vaccination
Kobe: Noevir Stadium Kobe
361K
Mass vaccination center
hosted by local government
Fukuoka: Marine Messe Fukuoka
40K
Workplace vaccination
5K-10K vaccines distributed daily
• Planning / Design / Operation
• Time required per person*: 3.5 minutes
• Rakuten provides employee support
864KTotalAs of November 1
Rakuten Leads on Workplace Vaccination EffortsContributing to Large-scale Nationwide Rollout
* Time measured from intake at reception to vaccination.
(Number of vaccinations)

Entering the Post-Covid Era
Sustainability
Green/Renewable Energy
Diversity & Inclusion
F2F Communication
Reducing Energy Costs Work Style Reform
Deregulation
Risk Money Supply
Further Private Sector Utilization5G/6G
AI/Data
Blockchain
Creating the FutureThrough Innovation

JPY 47.5bn
+44.8%YoY
Strong Non-GAAP OI Growth excluding Mobile
E-commerce
Logistics
Overseas businesses
Bank, Insurance
Increased
Improved
Improved
Increased
Q3/21

Internet Profitability Improves Significantly in Overseas and Sports Businesses
“Non-GAAP OI of other Internet Services(excluding profits/losses from minority investments
JPY
+5.7bnYoY

Fintech Rakuten Card Triple 3 Goals
Rakuten Card Mid Term Goals
Number of cards issued
Shopping GTV
GTV market share
30million
JPY30trillion
24 million
JPY11.6 trillion
21.4% 30%
(October 2021)
(FY2020)
(August 2021)

Mobile Rakuten Mobile Area Coverage Expansion
October 1, 2021:
KDDI roaming began switching to Rakuten network in 39 prefectures
* Remaining Roaming Prefectures: Iwate, Yamagata, Yamanashi, Wakayama, Shimane, Kochi, Nagasaki, Kagoshima
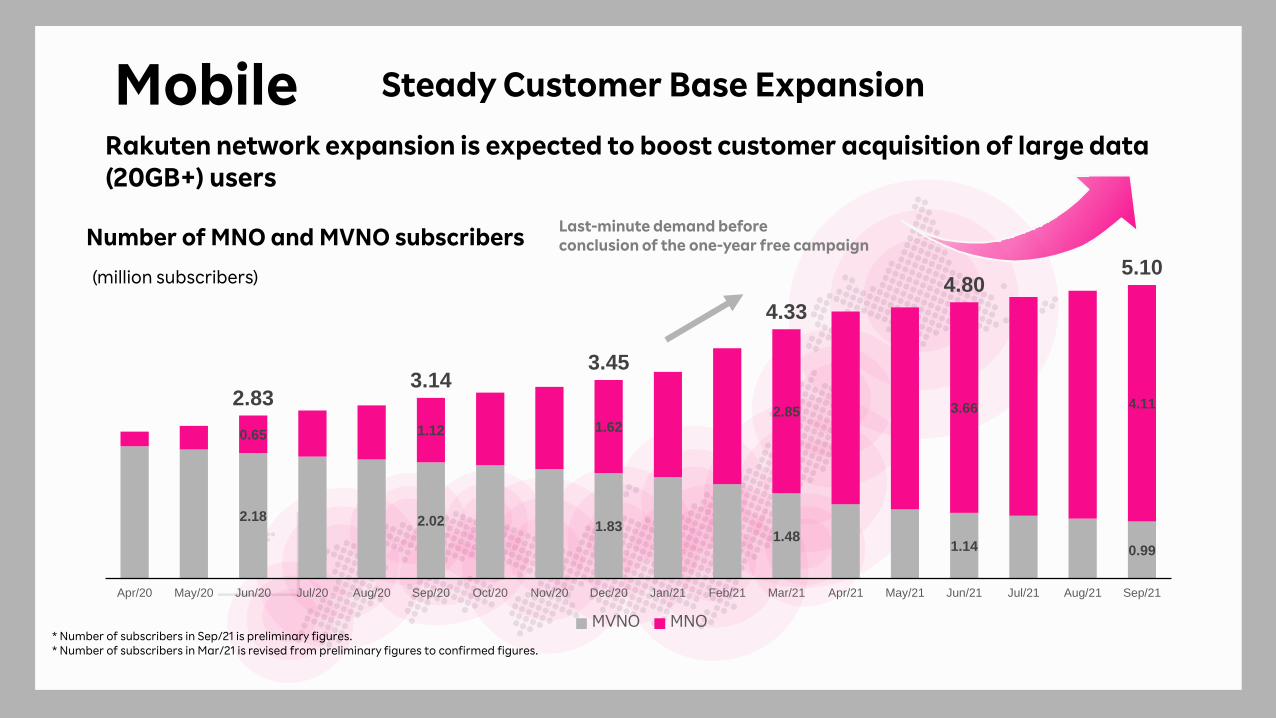
Mobile Steady Customer Base Expansion
Rakuten network expansion is expected to boost customer acquisition of large data (20GB+) users
2.18 2.02 1.831.48
1.14 0.99
0.65 1.12 1.622.85 3.66 4.112.83
3.143.45
4.33
4.805.10
Apr/20 May/20 Jun/20 Jul/20 Aug/20 Sep/20 Oct/20 Nov/20 Dec/20 Jan/21 Feb/21 Mar/21 Apr/21 May/21 Jun/21 Jul/21 Aug/21 Sep/21
MVNO MNO
(million subscribers)
Number of MNO and MVNO subscribersLast-minute demand before conclusion of the one-year free campaign
* Number of subscribers in Sep/21 is preliminary figures.* Number of subscribers in Mar/21 is revised from preliminary figures to confirmed figures.

Rakuten Ecosystem Expansion
Through Partnerships

Internet Promoting Digital Transformation Platform for Logistics through JV with Japan Post, launched in July 2021
JP Rakuten Logistics, Inc
Creation of seamless delivery network using existing centers
Creation of shared logistics centers
Creation of new digital transformation platform for logistics

Fintech
Deposit Growth
Preparing for Rakuten Bank IPO.Enhancing competitiveness and capital flexibility
Money BridgeSweep accounts
Rakuten BankDeposits
Card Payment
Securitization
Aiming for IPO
Deposit GrowthDeposit Growth Rakuten BankLoans
Rakuten Card
Rakuten SecuritiesInvestment
Trusts
Revolving balanceCash advances

MobileTaking Cloud-Native, Open RAN-Based Mobile Infrastructure to the world from Japan
Expansion of Potential Market
130-150Total market size
80-100 (Bn USD)
1.5X
(Bn USD)
2021 2025+
No. of existing customers Total: 14
No. of prospective clients Total: 113 German MNO 1&1 to utilize
full stack of solutions
Americas
40 6
US Office
Europe
25 4
Russia & CIS
4
Middle East & Africa
17
APAC
27 4
Singapore
IT cloud & software
Digital / cloud infrastructure
Digital IT (OSS/BSS)
Core (Virtual)
RAN (physical)
RAN (Virtual)
Incorporating Rakuten Symphony to consider capital and business alliance
* Based on internal calculation
Network and service operations
Maintenance, support & field services
Network automation & orchestration

19
Empowering Stakeholders Towards a Sustainable Future
SocialEnvironmental Governance
100% renewable electricity target by 2025 for Rakuten Group, Inc.
2020 renewable electricity usage ratio 64.8%
Number of employees and nationalities
Over 7025,000+% of independent board directors
Ratio of non-Japanese directors
Rakuten helped expedite rollout of vaccines across Japan
Kobe PoCFast
RakutenModel
Nationwide Rollout
“2020 Modern Slavery Statement”
55.6%
33.3%
Rakuten ESG Indices and Recognition

20
YoY YoY
Revenue Operating income
Consolidated Revenue
JPY 406.9 bn
+12.6% YoY
Global GTV
JPY 6.6 tn
+19.8% YoY
Rakuten Card Shopping GTV
JPY 3.6 tn
+23.3% YoY
Rakuten Bank AccountsRakuten Securities Accounts
6.67 mm*
Rakuten CardHolders
23.90 mm*
*As of September 30, 2021 *As of September 30, 2021 *As of September 30, 2021
11.38 mm*
Domestic EC GMS
(Excluding Travel)
Non-GAAP Operating Income
(Excluding Mobile, Logistics and Investment Business)
+16.5% YoY
JPY 48.0 bn
Q3/21 Highlights
2Year CAGR
+17.7%
21
2222
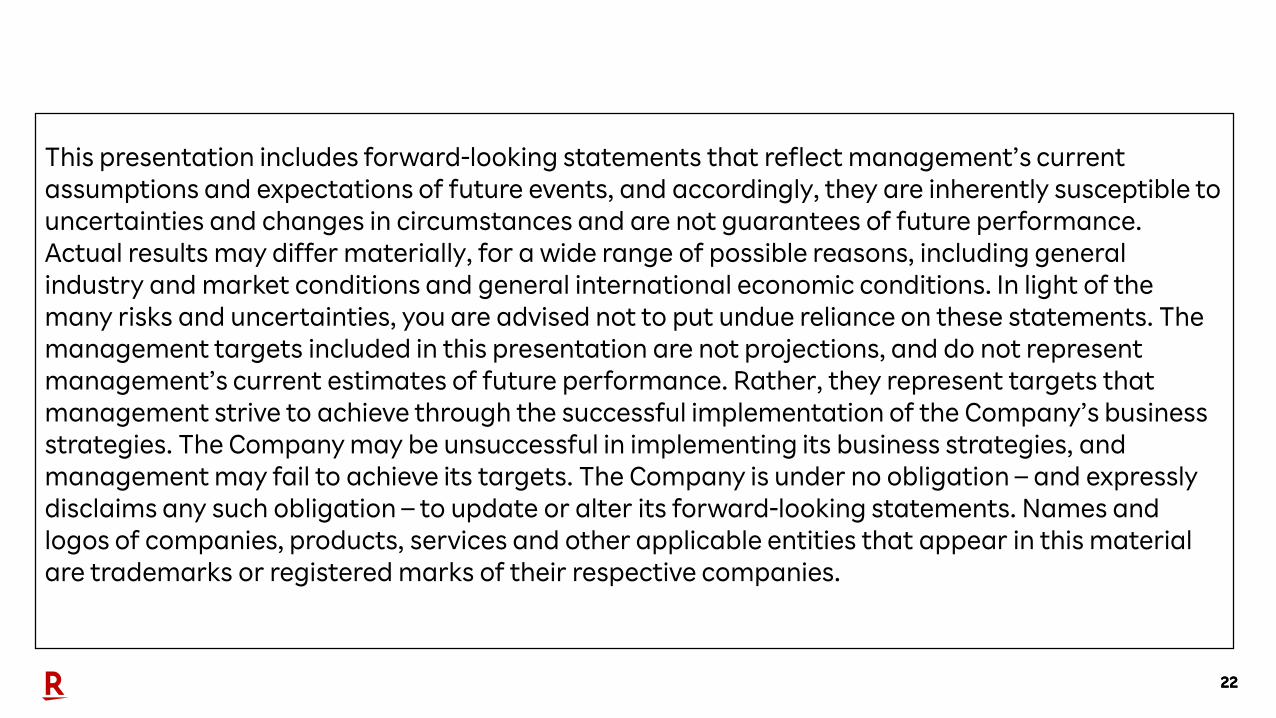
This presentation includes forward-looking statements that reflect management’s current assumptions and expectations of future events, and accordingly, they are inherently susceptible to uncertainties and changes in circumstances and are not guarantees of future performance. Actual results may differ materially, for a wide range of possible reasons, including general industry and market conditions and general international economic conditions. In light of the many risks and uncertainties, you are advised not to put undue reliance on these statements. The management targets included in this presentation are not projections, and do not represent management’s current estimates of future performance. Rather, they represent targets that management strive to achieve through the successful implementation of the Company’s business strategies. The Company may be unsuccessful in implementing its business strategies, and management may fail to achieve its targets. The Company is under no obligation – and expressly disclaims any such obligation – to update or alter its forward-looking statements. Names and logos of companies, products, services and other applicable entities that appear in this material are trademarks or registered marks of their respective companies.