FY2020 Third Quarter Financial Results Briefing
9
FY2020 Third Quarter Financial Results Briefing February 8 , 2021 (Securities Identification Code: 6787)
Transcript of FY2020 Third Quarter Financial Results Briefing
FY2020 Third QuarterFinancial Results Briefing
February 8, 2021
(Securities Identification Code: 6787)

This presentation contains forward-looking statements concerning Meiko Group’s future plans, strategies and performance. However, Meiko does not publish this presentation as a disclosure document based on the Financial Instruments and Exchange Act of Japan.
These forward-looking statements are not historical facts, rather they represent assumptions and beliefs based on comprehensive data currently available.
Furthermore, the Printed Circuit Board business is subject to a number of risks and uncertainties that relate to raw material price, conditions of customers’ market, technological trends, change of foreign exchange , change of tax rules and regulations, disasters, international conflicts and other factors. Meiko therefore wishes to caution that actual results may differ materially from our expectations.

3
FY19 3rd
quarter results
FY20 3rd
quarter results
Year-on-year
Diff. %
Net sales 898 857 -41 -4.6%
Operating income
50 41 -9 -16.5%5.5% 4.8%
Ordinary income 49 19 -30 -61.1%5.4% 2.2%
Net income 40 13 -27 -68.6%4.5% 1.5%
Average FX rate (JPY/USD) 108.88 105.53
Third Quarter Results FY2020- Consolidated(100 million yen)
4
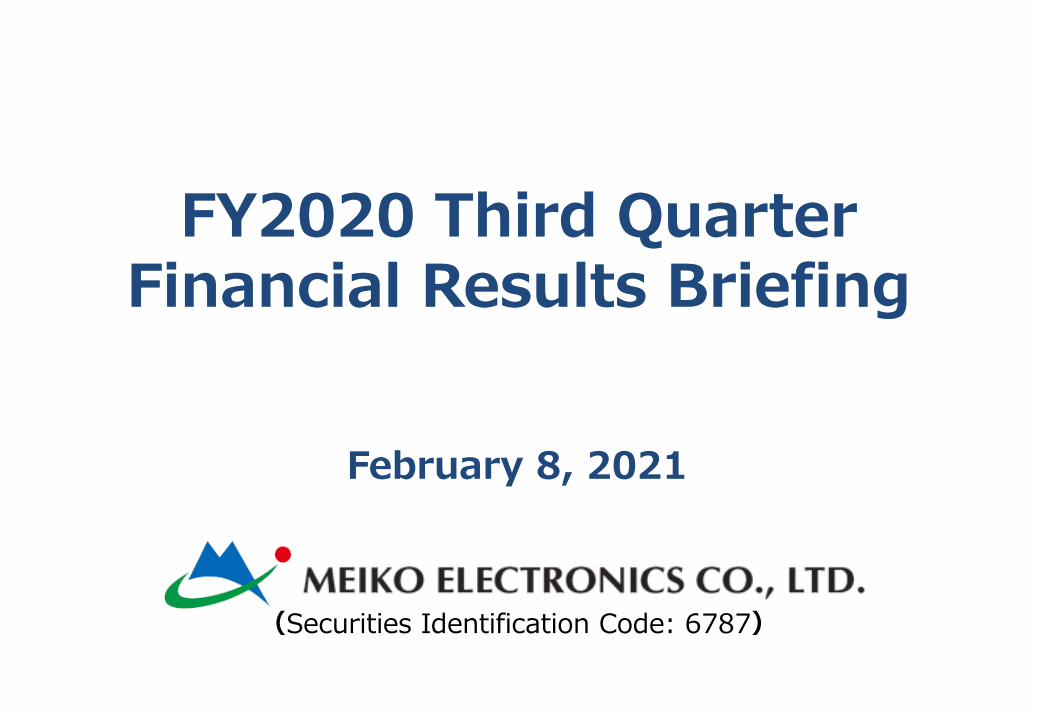
Quarterly Net Sales and Operating IncomeNet Sales Operating
incomeNet sales Operatingincome
OperatingMargin(Total)
(100 million yen)
255277 280 274
303315
298
273292 299 307
257243
289
325
15
24
19 17
25
32
26
7
17 17 16
2
5
13
23
0
10
20
30
40
0
100
200
300
17Q1 17Q2 17Q3 17Q4 18Q1 18Q2 18Q3 18Q4 19Q1 19Q2 19Q3 19Q4 20Q1 20Q2 20Q3
5.9%
8.5%
6.8% 6.2%8.2%
10.1%
8.7%
2.5%
5.9% 5.7%5.1%
0.8% 2.0%
4.6%
7.2%

5
FY2019 FY2020 Difference
SalesOperatingi n c o m e
(%)Sales
Operatingi n c o m e
(%)Sales
Operatingi n c o m e
(%)
Automotive 410 24 368 21 -42 -35.9% 5.7% -10.2% -12.5%
SmartphoneTablet 208 19 206 14 -2 -5
9.1% 6.8% -1.0% -26.3%
IoT・AI・Amusement 70 7 77 5 7 -2
10.0% 6.5% 10.0% -28.6%
Other substrates(R & D expenses included) 149 1 120 2 -29 1
0.7% 1.7% -19.5% 100.0%
EMS 61 -1 86 -1 25 0-1.6% -1.2% 41.0% 0.0%
Total 898 50 857 41 -41 -95.5% 4.8% -4.6% -18.0%
Third Quarter Results FY2020 by Product Application(100 million yen)

6
Analysis of Operating Income Change FY2019 3rd quarter → FY2020 3rd quarter
Decrease in Sales
Increase in
variable cost
Decrease in fixed
cost
Decrease in sellingexpenses
Impact of FX rates
Operating IncomeFY2019 3rd quarter resultsFX rate 108.88yen/US$
Operating IncomeFY2020 3rd quarter resultsFX rate 105.53yen/US$
(100 million yen)

7
422 379
208 206
51 52
19 25
49 37
149 158
898 857
0
100
200
300
400
500
600
700
800
900
1000
FY2019 Q3 FY2020 Q3
Net Sales
Automotive Smartphone/Tablet AI/IoT Amusement Storage Other products
23 18
19 19
6
2
50
41
0
10
20
30
40
50
60
FY2019 Q3 FY2020 Q3
Operating Income
Quarterly Net Sales and Operating Income (PCB + EMS)(100 million yen)

8
410
368
208
206
51
52
19
25
43
30
33
21
12
9
61
60
61
86
0 200 400 600 800
FY2019
Q3
FY2020
Q3
Automotive Smartphones・Tablet IoT・AIAmusement Storage Office equipmentDigital home appliances Other substrates EMS
(4.8%)
(42.9%) (24.0%)
(3.5%)
(2.9%) (1.1%)
(45.6%) (23.2%)
(5.7%)
(2.1%)
(3.7%)
(6.1%)
857
898
Sales by Product Application
(2.5%)
(1.3%)
(7.0%)
(6.8%)
(6.8%)
(10.0%)
-41(-4.6%)
+25(+41.0%)
-42(-10.2%)
-2(-1.0%)
-29(-19.5%)
+7(+10.0%)
(100 million yen )

9
51
37
204
159
170
160
366
365
11
11
13
19
22
20
61
86
0 200 400 600 800
FY2019
Q3
FY2020
Q3
Double-sided PCB Four-layer PCB Six layers or more HDI PCB
High Dissipation PCB Flexible PCB Other substrates EMS
(4.3%) (18.6%) (18.7%)
(2.3%)
(5.7%) (22.7%) (18.9%)
(42.6%) (2.2%)
(40.9%)
(2.4%)
(1.4%)
Sales by Product Specification
857
898(1.2%)
(1.3%)
-1(-0.3%)
+25(+41.0%)
-10(-5.9%)
-45(-22.1%)
-41(-4.6%)
(6.8%)
(10.0%)
(100 million yen)