FY2013-14 Budget - Central Marin Sanitation Agency
86
ADOPTED OperaƟng & Capital Budget Fiscal Year 2013 ‐ 2014 CENTRAL MARIN SANITATION AGENCY 1301 Andersen Drive ▪ San Rafael, CA 94901 Phone 415.459.1455 www.cmsa.us A NACWA PlaƟnum Peak Performance Agency View of CMSA faciliƟes looking north. Rehabilitated Digester with new cover. New FOG and Food‐to‐Energy Facility CMSA Staff with CWEA Plant of the Year Award 1 of 86
Transcript of FY2013-14 Budget - Central Marin Sanitation Agency

ADOPTED Opera ng & Capital Budget
Fiscal Year 2013 ‐ 2014
CENTRAL MARIN SANITATION AGENCY
1301 Andersen Drive ▪ San Rafael, CA 94901
Phone 415.459.1455
www.cmsa.us
A NACWA Pla num Peak Performance Agency
View of CMSA facili es looking north.
Rehabilitated Digester with new cover.
New FOG and Food‐to‐Energy Facility
CMSA Staff with CWEA Plant of the Year Award 1 of 86
TABLE OF CONTENTS
Budget Transmittal Memorandum and FY 2013-14 Budget Overview
3
Summary of Funding Sources Summary of Funding Sources and Fund Requirements by Designations………. 6 Member Agencies and San Quentin Equivalent Dwelling Units (EDU’s)……….. 8 Operating Budget Account Information Revenues by Source...………………………………………………………………………….………. 10 Allocation of Service Charges using Flow and Strength………………………………… 12 Summary of Expenditures by Department and Category…...………………………… 13 Administration……………………………………………………………………………………………… 14 Environmental Services………………………………………………………………………………… 21 Maintenance………………………………………………………………...……………………..……… 26 Operations…………………………………………………………………………………………...……… 31 Engineering………………………………………………………………………………………..………… 37 Non-Agency Expenses: Services Provided under Contract to other Local Agencies….. 40 Capital Improvement Program Capital Improvement Program – Summary of Changes……………………………….. 44 10 Year CIP & Revenue Bond Program.………………………………………………………… 46 Capital Improvement Project Descriptions by Budget Account…..……………….. 50 Detailed Project Descriptions for Selected Capital Projects …..…….................. 69 Ten-Year Financial Forecast 10-Year Financial Forecast…………………………………………………………………………… 82 Annual Update to 10-Year Forecast Summary Adopted FY 2013-14 Budget…. 85
2 of 86

Central Marin Sanitation Agency
MEMORANDUM
To: CMSA Board of Commissioners July 2, 2013 CMSA Staff JPA District Managers and Administrators From: Jason Dow, General Manager Hank Jen, Finance Manager Subject: Adopted Fiscal Year 2013-14 Budget The CMSA Budget for Fiscal Year 2013-14 (FY 14) was adopted by the CMSA Board on June 11, 2013. The FY 14 Budget presented in this document represents the revenue and expenditure plan for the Agency which consists of:
Allocation of $8,901,932 in Regional/Sewer Service Charges to each JPA Member based on each member’s wastewater volume (36 months, April 1, 2010 to March 31, 2013) and strength (12 months, April 1, 2012 to March 31, 2013) to CMSA. Included in the Regional Charges is $230,000 for the Unrestricted Capital Reserve to fund future capital projects in the 10-Year Capital Improvement Program.
An EDU rate of $111.69 for Debt Service on CMSA Revenue Bonds based on 48,106 units reported by JPA Members plus 4,005 units for San Quentin Prison
Authorized staffing of 42 positions which includes a shared safety director position that is jointly funded by the participating wastewater treatment agencies in Marin County and one temporary position which is only funded for 6 months in the maintenance department to support succession plans
Total Operating Revenues of $ 10,442,459
Total Revenues for Debt Service and the Capital Improvement Program of $5,820,449
Total Operating Expenditures of $10,082,029
Total Capital Improvement Program Expenditures of $4,498,486
Concurrently, the Agency is completing a comprehensive budget document that will present the FY 14 Budget in a format that follows the guidelines recommended by the Government Finance Officers Association (GFOA). The GFOA encourages public entities to produce high quality financial reports that are readily accessible and easily understandable to the general public and other interested parties without a background in public finance. This document will highlight the FY14 Budget’s importance as 1) a policy document that reflects the Agency’s priorities, 2) a financial plan that appropriates agency revenues for expenditures, 3) an operations guide that specifies department and staff responsibilities by budget accounts and projects and 4) a communications device that describes the Agency’s services, responsibilities and priorities to stakeholders and constituents. We plan to have a comprehensive FY 14 GFOA Budget document ready for distribution in August 2013.
3 of 86

FY 2013-14 Budget Overview
Operating
Capital
Improvement
Program (CIP)
Debt
Service Total
Revenues 10,212,459 1,394,090 4,656,359 16,262,908
Expenditures 10,082,029 4,498,486 4,656,359 19,236,874
Surplus (Deficit) 130,430 Not Applicable -
Sources of Funding for FY 13-14 CIP
Remaining Proceeds from Revenue Bond Program 991,016
Restricted Capital Reserves 3,507,470
Total Funding for CIP 4,498,486
Agency Reserves
Total Beginning Reserves on July 1, 2013 15,512,308
A. Restricted: Capacity Charges -
B. Restricted: Capital Improvement Program, Beginning Balance 5,087,765
Addition to Reserves - Debt Service Coverage 1,164,090
Use of Reserves - Capital Projects (3,507,470)
Ending Balance 2,744,385
1. Unrestricted: CSRMA Insurance Deductible 100,000
2. Unrestricted: Operating Reserves, Beginning Balance 2,380,829
Addition to Reserves - Operational Surpluses 130,430
Use of Reserves - General Operations -
Ending Balance 2,511,259
3. Unrestricted: Capital Improvement Program 7,693,714
Addition to Reserves - Operational Surpluses -
Addition to Reserves - Future Capital 230,000
Use of Reserves - Capital Projects -
Ending Balance 7,923,714
4. Unrestricted: Emergency 250,000
Total Ending Reserves on June 30, 2014 13,529,358
Change in Beginning and Ending Reserves (1,982,950)
Comments FY 14 Revenues for CIP Program is not available for FY 14 CIP use. ($230k for future capital and $1.164m from debt service coverage which cannot be used in the same FY that it is received.)
4 of 86

Summary of Funding Sources
5 of 86

CENTRAL MARIN SANITATION AGENCY
Adopted FY 2013-14 Budget
SUMMARY OF FUNDING SOURCES AND FUND REQUIREMENTS BY DESIGNATIONS
Adopted Adopted Projected AdoptedBudget Actuals Budget Rev/Exp Budget
FY 11-12 FY 11-12 FY 12-13 FY 12-13 FY 13-14
Section I. EDU Factors1 Total Number of EDUs 54,864 50,525 47,278 48,106 48,106 2 EDU Rate (Operating) 169.74$ 169.74$ 175.01$ 3 % EDU Rate change 3.1% 3.1% 3.1%
4 EDU Rate (Debt Service) 106.08$ 115.19$ 113.51$ 111.70$ 111.69$
5 Combined EDU Rate 275.82$ 284.93$ 288.52$ 111.70$ 111.69$
6 % Combined EDU Rate Change 2.7% 6.1% 4.6%
Funding Sources (general purpose)7 Service Charges 9,312,826 8,576,114 8,274,123 8,274,123 8,671,932 8 All other Operational Revenues 707,447 839,125 1,475,409 1,566,882 1,540,527 9 Total Funding Sources 10,020,273 9,415,239 9,749,532 9,841,005 10,212,459
10 Operational Expenses 9,426,423 9,038,794 9,523,315 9,234,309 10,082,02911 Funding Surplus/(Deficit): 593,850 376,445 226,217 606,696 130,430 12 Transfer to/(from) Unrestricted Operating Reserve 93,851 93,851 24,223 24,223 130,430 13 Transfer to/(from) Unrestricted Capital Improvement Reserve 499,999 282,594 201,994 582,473 -
All Funding Sources14 Surplus from General Operations: 499,999 282,594 201,994 582,473 - 15 Capacity Charges - 93,920 - 894,316 - 16 Debt Service (Principal & Interest) 4,655,914 4,655,914 4,656,751 4,656,751 4,656,35917 Debt Service Coverage 1,163,978 1,163,978 1,164,188 1,164,188 1,164,090
18 Total Funding Sources 6,319,892 6,196,406 6,022,933 7,297,727 5,820,449
All Funding Requirements19 Debt Service Expenses (Principal & Interest) 4,655,914 4,655,914 4,656,751 4,655,914 4,656,359
CIP Projects (new in FY 12, net of Rev Bond) Rev Bond Rev Bond 1,705,876 Rev Bond 3,507,470 Use of Capacity Charges for CIP Projects - 93,920 - 894,316 -
21 Total Funding Requirements 4,655,914 4,749,833 6,362,627 5,550,229 8,163,829
22 Net Funding To/(From) Capital Reserves: 1,663,978 1,446,572 (339,694) 1,747,498 (2,343,380)
Section IV. Net Cash flow to/(from) Reserves23 Transfer to/(from) Unrestricted Operating Reserve 93,851 93,851 24,223 24,223 130,430
24 Transfer to Restricted Capital Reserve - CY Debt Svcs Coverage 1,163,978 1,163,978 1,164,188 1,164,188 1,164,090 25 Transfer (from) Restricted Capital Reserve - CY AM Program - - - - - 26 Transfer (from) Restricted Capital Reserve - Capital Projects - - (1,705,876) - (3,507,470) 27 Use of Retiree Health Reserve - - - - - 28 Transfer (from) Unrestricted Capital Reserve - Capital Projects 499,999 282,594 201,994 582,473 230,000 29 Use of Emergency Reserves - - - - - 30 Total Transfers 1,757,829 1,540,423 (315,471) 1,770,884 (1,982,950)
Section II. General OperationsFunding sources are considered to be general purpose and can be used to fund general operations. Surpluses can be used for capital improvement program
funding, or held in Agency reserves in accordance with established policies.
Section III. Debt Service and Capital Improvement ProgramFunding sources are considered to be restricted and can only be used for the purpose stated.
6 of 86

CENTRAL MARIN SANITATION AGENCY
Adopted FY 2013-14 Budget
SUMMARY OF FUNDING SOURCES AND FUND REQUIREMENTS BY DESIGNATIONS
Adopted Adopted Projected AdoptedBudget Actuals Budget Rev/Exp Budget
FY 11-12 FY 11-12 FY 12-13 FY 12-13 FY 13-14
Section V-A. Adjustments to Cash & Investments/Reserves
Total Beginning Reserves on July 1 12,201,001 12,201,001 13,741,424 13,741,424 15,512,308
Reserve Designations, Ending Balance on June 3031 A. Restricted: Capacity Charges - - - - - 32 B. Restricted: Capital Improvement Program (Debt Coverage) 3,923,577 3,923,577 3,381,889 5,087,765 2,744,385 33 C. Restricted: Retiree Health Benefits - - - - - 34 Subtotal Restricted Reserves 3,923,577 3,923,577 3,381,889 5,087,765 2,744,385
35 1. Unrestricted: CSRMA Insurance Deductible 100,000 100,000 100,000 100,000 100,000 36 2. Unrestricted: Operating Reserves 2,356,606 2,356,606 2,380,829 2,380,829 2,511,259 37 3. Unrestricted: Capital Improvement Program 7,328,647 7,111,241 7,313,235 7,693,714 7,923,714 38 4. Unrestricted: Emergency 250,000 250,000 250,000 250,000 250,000 39 Subtotal Unrestricted Reserves 10,035,253 9,817,847 10,044,064 10,424,543 10,784,973
Total Ending Reserves on June 30 13,958,830 13,741,424 13,425,953 15,512,308 13,529,358 40 Change in Beginning and Ending Reserves 1,757,829 1,540,423 (315,471) 1,770,884 (1,982,950)
Section V-B. Reconciliation of cash flow by Reserve Designations
Total Beginning Reserves on July 1 12,201,001 12,201,001 13,741,424 13,741,424 15,512,308
31 A. Restricted: Capacity Charges - - - - -
32 B. Restricted: Capital Improvement Program, Beginning Balance 2,759,599 2,759,599 3,923,577 3,923,577 5,087,765
Addition to Reserves - Debt Coverage 1,163,978 1,163,978 1,164,188 1,164,188 1,164,090
Use of Reserves - Capital Projects - - (1,705,876) - (3,507,470)
Ending Balance 3,923,577 3,923,577 3,381,889 5,087,765 2,744,385
33 C. Restricted: Retiree Health Benefits, Beginning Balance - - - - -
Use of Reserves for Retiree Benefits - - - - -
Ending Balance - - - - -
35 1. Unrestricted: CSRMA Insurance Deductible 100,000 100,000 100,000 100,000 100,000
36 2. Unrestricted: Operating Reserves, Beginning Balance 2,262,755 2,262,755 2,356,606 2,356,606 2,380,829
Addition to Reserves - Operational Surpluses 93,851 93,851 24,223 24,223 130,430
Use of Reserves - General Operations - - - - -
Ending Balance 2,356,606 2,356,606 2,380,829 2,380,829 2,511,259
37 3. Unrestricted: Capital Improvement Program 6,828,648 6,828,648 7,111,241 7,111,241 7,693,714
Addition to Reserves - Operational Surpluses 499,999 282,594 201,994 582,473 -
Addition to Reserves - Future Capital - - - - 230,000
Use of Reserves - Capital Projects - - - - -
Ending Balance 7,328,647 7,111,241 7,313,235 7,693,714 7,923,714
38 4. Unrestricted: Emergency 250,000 250,000 250,000 250,000 250,000
Total Ending Reserves on June 30 13,958,830 13,741,424 13,425,953 15,512,308 13,529,358
7 of 86

Status Fiscal Year
San Rafael
Sanitation
District
(SRSD)
Sanitary
District #1
(SD #1)
City of
Larkspur
San Quentin
State Prison
Sanitary
District #2
(SD #2)
Total EDU
Count Change
%
Change
Actual 1985-86 17,089 17,913 2,774 3,569 4,757 46,102
Actual 1986-87 17,704 18,059 2,774 3,489 4,842 46,868 766 1.7%
Actual 1987-88 18,040 18,447 2,773 3,489 5,267 48,016 1,148 2.4%
Actual 1988-89 18,200 18,335 2,768 2,892 5,267 47,462 (554) -1.2%
Actual 1989-90 19,140 18,947 2,974 3,630 5,304 49,995 2,533 5.3%
Actual 1990-91 18,933 18,852 2,998 3,227 5,201 49,211 (784) -1.6%
Actual 1991-92 18,437 19,620 3,042 3,785 5,709 50,593 1,382 2.8%
Actual 1992-93 18,455 19,480 3,078 3,960 5,695 50,668 75 0.1%
Actual 1993-94 18,362 18,958 3,015 4,148 5,358 49,841 (827) -1.6%
Actual 1994-95 17,897 18,881 3,041 3,926 5,273 49,018 (823) -1.7%
Actual 1995-96 18,201 18,892 3,081 4,371 5,290 49,835 817 1.7%
Actual 1996-97 18,290 18,820 3,132 5,513 5,412 51,167 1,332 2.7%
Actual 1997-98 18,431 18,827 3,042 5,800 5,454 51,554 387 0.8%
Actual 1998-99 18,518 19,538 3,157 3,500 5,524 50,237 (1,317) -2.6%
Actual 1999-00 18,663 19,424 3,157 4,143 5,524 50,911 674 1.3%
Actual 2000-01 19,314 19,324 3,123 4,421 5,532 51,714 803 1.6%
Actual 2001-02 19,531 19,524 3,123 4,422 5,665 52,265 551 1.1%
Actual 2002-03 19,879 18,859 3,005 4,752 5,693 52,188 (77) -0.1%
Actual 2003-04 19,515 19,022 3,116 4,609 5,883 52,145 (43) -0.1%
Actual 2004-05 19,603 19,029 3,111 5,090 5,840 52,673 528 1.0%
Actual 2005-06 19,856 18,842 3,085 8,215 6,094 56,092 3,419 6.5%
Actual 2006-07 19,382 19,074 3,057 8,215 6,091 55,819 (273) -0.5%
Actual 2007-08 19,617 19,112 3,107 8,227 6,195 56,258 439 0.8%
Actual 2008-09 19,685 19,295 3,116 7,936 6,196 56,228 (30) -0.1%
Actual 2009-10 19,575 19,709 3,050 7,529 6,078 55,941 (287) -0.5%
Actual 2010-11 19,401 19,261 3,021 7,209 5,975 54,867 (1,074) -1.9%
Actual 2011-12 19,409 18,835 3,079 3,247 5,955 50,525 (4,342) -7.9%
Actual 2012-13 19,482 19,511 2,997 4,005 6,116 52,111 1,586 3.1%
SRSD SD#1 Larkspur SD#2 SQP TOTALFY 2013-14 19,482 19,511 2,997 6,116 4,005 52,111% of Total 37.39% 37.44% 5.75% 11.74% 7.69% 100.00%
Total EDU's for FY 2013-14
CENTRAL MARIN SANITATION AGENCYMember Agencies and San Quentin Prison Equivalent Dwelling Units (EDU's)
EDU's by Member Agencies and San Quentin Prison as a Percentage of
The actual EDU count for San Quentin State Prison (SQSP) decreased significantly in FY 2011-12 due to SD #1 implementing a change in formula methodology to calculate the EDU. Effective FY 2012-13, the State of California contracted directly with CMSA for the provision of wastewater treatment services SQSP. SQSP has been assigned an EDU count of 4,005 units for the purpose of calculating its share of debt service charges.
San Rafael Sanitation District 37.39%
Sanitary District #1 37.44%
Larkspur 5.75%
Sanitary District #2 11.74%
San Quentin State Prison 7.69%
8 of 86

Operating Budget Account Information
9 of 86

Acct No. Account Description
FY 11-12
Adopted
Budget
FY 12-13
Adopted
Budget
FY 13-14
Adopted
Adjustments
FY 13-14
Adopted
Budget
% Change
FY14 Adopted
Budget from
FY13
Section I: General Purpose Revenues
Service charges
4010-000-00 SRSD 3,293,126 3,244,162 785,743 4,029,905 24.2%
4010-000-00 SD #1 5,005,293 4,195,610 (196,863) 3,998,748 -4.7%
4010-000-00 SD #2 1,014,197 834,351 38,929 873,280 4.7%
Subtotal 9,312,615 8,274,123 627,809 8,901,932 7.6%
The FY 13-14 Revenue from Services Charges includes $230,000 for Unrestricted Capital Reserves to fund
future capital projects.
EDU 12 month Flow 36 mo Flow/12 mo Strength
% Total % Total % Total
SRSD 35.36% 39.21% 45.27%
SD #1 53.75% 50.71% 44.92%
SD #2 10.89% 10.08% 9.81%
100.00% 100.00% 100.00%
Contract Service Revenues
4601-000-00 San Quentin State Prison Wastewater Services 745,408 59,501 804,909 8.0%
4602-000-00 San Quentin Village Wastewater Services 24,000 3,976 27,976 16.6%
4600-000-00 SD#2 Pump Stations 341,532 368,446 16,408 384,854 4.5%
4031-000-00 LGVSD - FOG & pollution prevention 20,000 20,000 - 20,000 0.0%
4033-000-00 SD #1 - FOG 10,000 - 17,400 17,400 -
4034-000-00 SRSD - FOG 17,000 18,000 2,000 20,000 11.1%
4035-000-00 TCSD - FOG 2,600 2,400 (1,200) 1,200 -50.0%
4036-000-00 SD #2 - FOG 12,500 9,000 (1,000) 8,000 -11.1%
4037-000-00 Novato SD - Dental Amalgam (new) - - 7,000 7,000 -
Subtotal 403,632 1,187,254 104,085 1,291,339 8.8%
Program Revenues
4070-000-00 Safety Director Program 138,031 129,182 (40,284) 88,898 -31.2%
4080-001-00 County-wide Education Program 41,160 44,100 2,940 47,040 6.7%
4080-002-00 Outside Safety Training - - - -
Subtotal 179,191 173,282 (37,344) 135,938 -21.6%
Interest Income
4910-002-00 Interest Income - L.A.I.F. 15,000 36,000 (6,000) 30,000 -16.7%
4910-011-00 Investment Interest - C.A.M.P. 40,000 9,000 (6,000) 3,000 -66.7%
Subtotal 55,000 45,000 (12,000) 33,000 -26.7%
Haulers, Permits & Inspection
4030-000-00 Permit and Inspection Fees 20,000 20,000 20,000 0.0%
4050-010-00 Revenue from Haulers - Septic 29,623 29,623 10,377 40,000 35.0%
4050-020-00 Revenue from Haulers - RV - 250 250 0.0%
4050-030-00 Revenue from Haulers - FOG (New) - -
4050-040-00 Revenue from Foodwaste Disposal (New) - -
Subtotal 49,623 49,873 10,377 60,250 20.8%
Other Operating Revenues
4990-000-00 Other non-operating revenue 20,000 20,000 - 20,000 0.0%
4990-011-00 C.A.M.P. non-operating revenue - - - - -
Subtotal 20,000 20,000 - 20,000 0.0%
Total General Purpose Revenues 10,020,062 9,749,532 692,927 10,442,459 7.1%
Central Marin Sanitation Agency
Adopted FY 2013-14 Operating Budget
Revenues by Source
10 of 86

Acct No. Account Description
FY 11-12
Adopted
Budget
FY 12-13
Adopted
Budget
FY 13-14
Adopted
Adjustments
FY 13-14
Adopted
Budget
% Change
FY14 Adopted
Budget from
FY13 Adopted
Central Marin Sanitation Agency
Adopted FY 2013-14 Operating Budget
Revenues by Source
Section II: Revenue for Debt Service and Capital Improvement Program
4011-000-00 Service charges-debt service principal 1,880,000 1,955,000 85,000 2,040,000 4.3%
Service charges-debt service interest 2,775,914 2,701,751 (85,392) 2,616,359 -3.2%
Service charges-debt service coverage 1,163,978 1,164,188 (98) 1,164,090 0.0%
Subtotal 5,819,892 5,820,939 (490) 5,820,449 0.0%
Debt Service by Member Agencies & San Quentin State Prison (SQSP)
SRSD 2,058,029 2,203,042 (27,033) 2,176,009 -1.2%
SD #1* 3,128,044 2,487,375 26,617 2,513,992 1.1%
SQSP - 454,592 (7,261) 447,332 -1.6%
SD #2 633,819 675,929 7,187 683,116 1.1%
Total 5,819,892 5,820,939 (490) 5,820,449 0.0%
EDU Rate for Debt Service 106.08$ 113.51$ 111.69$ -1.6%
Number of Budgeted EDU
SRSD 19,401 19,409 73 19,482 0.4%
SD #1 (reported by district)* 29,488 21,914 594 22,508 2.7%
SD #1 - Ross Valley* 19,261 18,835 676 19,511
City of Larkspur* 3,021 3,079 (82) 2,997
SQ State Prison** 7,209 - -
SQ State Prison (EDU used for debt service calculations only)**/*** 4,005 4,005
SD #2 5,975 5,955 161 6,116 2.7%
Total*** 54,864 51,283 828 52,111 1.6%
Connection fees
4020-010-00 Connection fees - SRSD - - - -
4020-020-00 Connection fees - SD #1 - - - -
4020-020-00 Connection fees - City of Larkspur - - - -
4020-030-00 Connection fees - SD # 2 - - - -
Total - - - - -
* Prior to FY 2012-13 SD #1 was responsible for the debt service charges for SD #1, City of Larkspur and San Quentin State Prison. ** Starting in FY 2012-13, SQSP is contracting directly with CMSA for wastewater services. ** * SQSP EDU is used to calculate debt service payments.
Service charges $8.9M 54.7%
Debt Service $5.82M 35.8%
Contract Service Revenues $1.29M 7.9%
Program Revenues $136K 0.8%
Haulers, Permits & Inspection $60K 0.4%
Interest Income $33K 0.2%
Other Operating Revenues $20K 0.1%
FY 2013-14 Budget Revenues by Source
11 of 86

FY 2013-14 Budget - Allocation of Service Charges using Flow and Strength
I. Allocation of treatment costs by Flow and Strength
A. Flow volume 50.6%
B. Biological Oxygen Demand mass (BOD, Strength) 24.7%
C. Total Suspended Solids mass (TSS, Strength) 24.7%
Total Distribution 100.0%
A. Annual (April to March) Flows volume into CMSA in million gallons
SRSD
SD #1
SD #2
Total CMSA
Plant Influent
Flow
April 1, 2010 to March 31, 2011 1,814.70 2,389.80 471.20 4,675.70
April 1, 2011 to March 31, 2012 1,482.20 1,916.90 381.20 3,780.30
April 1, 2012 to March 31, 2013 1,528.91 1,993.15 422.70 3,944.76
Total 36 month Flow 4,825.81 6,299.85 1,275.10 12,400.76
% of Flow 38.9% 50.8% 10.3% 100.0%
B. Annual (April to March) Mass of Biological Oxygen Demand (BOD) in pounds
SRSD
SD #1
SD #2
Total CMSA
Plant Influent
BOD
April 1, 2012 to March 31, 2013 4,242,574 3,532,865 748,430 8,523,870
% of Total BOD 49.8% 41.4% 8.8% 100.0%
C. Annual (April to March) Mass of Total Suspended Solids (TSS) in pounds
SRSD
SD #1
SD #2
Total CMSA
Plant Influent
TSS
April 1, 2012 to March 31, 2013 6,396,936 4,325,587 1,171,099 11,893,621
% of Total TSS 53.8% 36.4% 9.8% 100.0%
II. Allocation of Sewer Service Charges to JPA Members
This is determined by multiplying the allocation of treatment costs by volume and
and strength (Section I) by each member's share of the flow (Section A), BOD (B) and TSS (C)
SRSD SD #1 SD #2 Total Allocation
FY 2013-14 Budget 45.27% 44.92% 9.81% 100.00%
12 of 86

Central Marin Sanitation AgencyAdopted FY 2013-14 Operating BudgetSummary of Expenditures by Departments and Category
Operating Expenditures by Department
FY 11-12
Adopted
Budget
FY 11-12
Audited
Actuals
FY 12-13
Adopted
Budget
FY 12-13
Projected Year
End
Expenditures
FY 13-14
Adopted
Budget
% Change
FY14
Adopted
Budget
from FY13
Administration 3,890,071 3,705,133 3,906,835 3,856,231 4,193,278 7.3%
Environmental Services 1,033,407 944,619 1,069,368 1,047,961 1,114,518 4.2%
Maintenance 1,338,371 1,320,318 1,389,010 1,336,175 1,488,581 7.2%
Operations 2,978,018 2,649,912 2,952,099 2,778,156 2,917,824 -1.2%
Engineering 186,554 227,734 206,004 215,786 367,827 78.6%
TOTAL 9,426,423$ 8,847,716$ 9,523,315$ 9,234,309$ 10,082,029$ 5.9%
Operating Expenditures by Category
FY 11-12
Adopted
Budget
FY 11-12
Audited
Actuals
FY 12-13
Adopted
Budget
FY 12-13
Projected Year
End
Expenditures
FY 13-14
Adopted
Budget
% Change
FY14
Adopted
Budget
from FY13
SALARIES 3,882,118 3,770,023 3,894,460 3,950,016 4,268,916 9.6%
BENEFITS 2,485,365 2,392,355 2,572,038 2,571,433 2,789,872 8.5%
SUB-TOTAL 6,367,483 6,162,378 6,466,498 6,521,449 7,058,787 9.2%
CHEMICALS & FUELS 1,289,063 1,037,615 1,274,028 1,027,941 1,098,787 -13.8%
BIOSOLIDS DISPOSAL 240,936 261,700 258,436 257,114 266,086 3.0%
MAINTENANCE & REPAIRS 176,000 159,345 203,800 176,814 191,800 -5.9%
PERMIT TESTING & MONITORING 133,161 90,889 138,230 134,486 140,869 1.9%
INSURANCE 179,153 157,543 179,153 168,422 185,915 3.8%
UTILITIES 378,885 358,549 402,200 431,296 416,200 3.5%
GENERAL & ADMINISTRATIVE 661,743 619,697 600,972 516,787 723,585 20.4%
SUB-TOTAL 3,058,940 2,685,338 3,056,818 2,712,860 3,023,241 -1.1%
TOTAL 9,426,423 8,847,716 9,523,315 9,234,309 10,082,029 5.9%
13 of 86

Administration The Administration Department serves as the administrative arm for the Agency and the Board of Commissioners. The Board of Commissioners appoints the General Manager who is the chief of staff to the Board and is responsible for the overall management and operations of the Agency. The Department is responsible for the following functions:
Provides clerk support to the Board of Commissioners
Represents the Agency on regulatory matters
Maintains intergovernmental relations with the four Joint Powers Member Agencies, local governments in the service area and in Marin County
Communicates Agency initiatives to stakeholders and the public
Develops, implements and manages the Agency’s annual budget
Manages Agency’s finances
Provides human resources services to departments and employees
Ensures the safety of agency employees and assets through insurance protection and risk management programs received from the California Sanitation Risk Management Authority (CSRMA)
Provides program oversight for the Safety Director Program
Expenditures by Category
FY 11-12 Adopted
Budget
FY 12-13 Adopted Budget
FY 13-14 Adopted Budget
SALARIES $ 736,934 $ 786,508 $ 854,107 BENEFITS 2,485,365 2,572,038 2,789,872
SUB-TOTAL 3,222,299 3,358,545 3,643,978
INSURANCE 179,153 179,153 185,915 UTILITIES 44,886 - - GENERAL & ADMINISTRATIVE 443,734 369,137 363,385
SUB-TOTAL 667,772 548,289 549,300
TOTAL $3,890,071 $3,906,835 $4,193,278
Authorized Positions FY 11-12 FY 12-13 FY 13-14
General Manager 1 1 1 Administrative Assistant 1 1 1 Treatment Plant Manager 1 1 1 Administrative Services Manager - - 1 Finance Manager 1 1 - Financial Analyst 1 1 1 Personnel and Accounting Technician 1 1 1 Safety Director 1 1 1
TOTAL 7 7 7
14 of 86
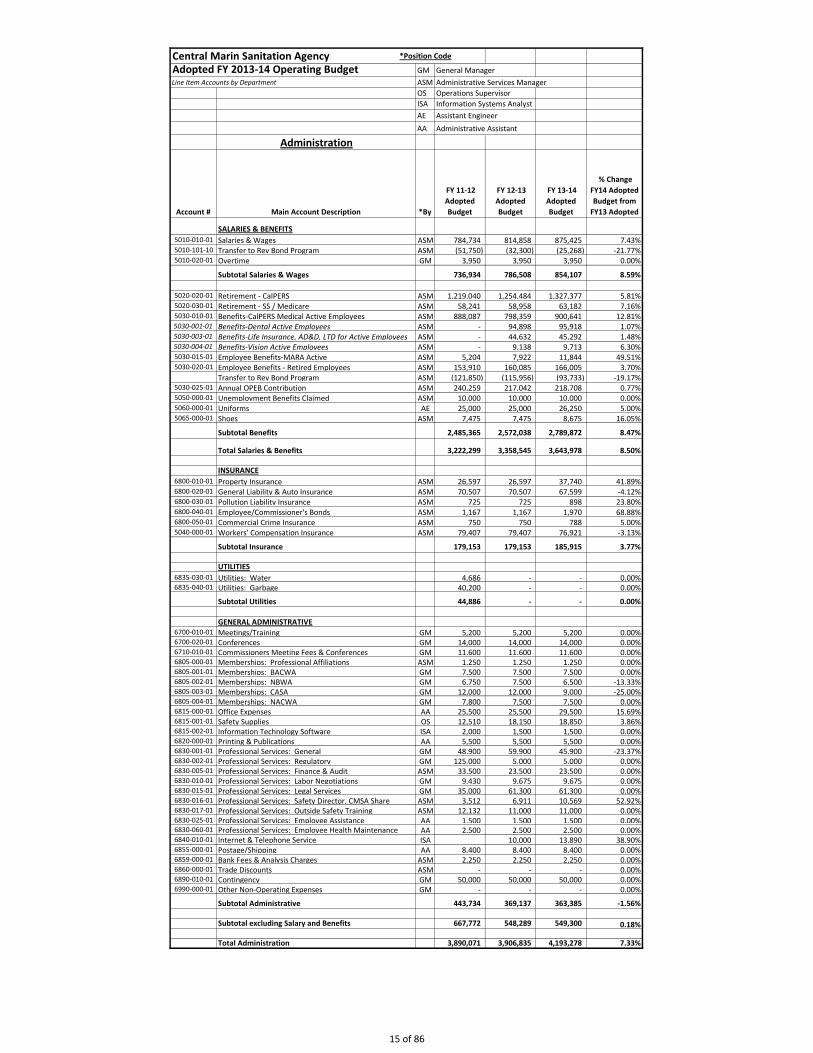
Central Marin Sanitation Agency *Position Code
Adopted FY 2013-14 Operating Budget GM General Manager
Line Item Accounts by Department ASM Administrative Services Manager
OS Operations Supervisor
ISA Information Systems Analyst
AE Assistant Engineer
AA Administrative Assistant
Administration
Account # Main Account Description *By
FY 11-12
Adopted
Budget
FY 12-13
Adopted
Budget
FY 13-14
Adopted
Budget
% Change
FY14 Adopted
Budget from
FY13 Adopted
SALARIES & BENEFITS
5010-010-01 Salaries & Wages ASM 784,734 814,858 875,425 7.43%5010-101-10 Transfer to Rev Bond Program ASM (51,750) (32,300) (25,268) -21.77%5010-020-01 Overtime GM 3,950 3,950 3,950 0.00%
Subtotal Salaries & Wages 736,934 786,508 854,107 8.59%
5020-020-01 Retirement - CalPERS ASM 1,219,040 1,254,484 1,327,377 5.81%5020-030-01 Retirement - SS / Medicare ASM 58,241 58,958 63,182 7.16%5030-010-01 Benefits-CalPERS Medical Active Employees ASM 888,087 798,359 900,641 12.81%5030-001-01 Benefits-Dental Active Employees ASM - 94,898 95,918 1.07%5030-003-01 Benefits-Life Insurance, AD&D, LTD for Active Employees ASM - 44,632 45,292 1.48%5030-004-01 Benefits-Vision Active Employees ASM - 9,138 9,713 6.30%5030-015-01 Employee Benefits-MARA Active ASM 5,204 7,922 11,844 49.51%5030-020-01 Employee Benefits - Retired Employees ASM 153,910 160,085 166,005 3.70%
Transfer to Rev Bond Program ASM (121,850) (115,956) (93,733) -19.17%5030-025-01 Annual OPEB Contribution ASM 240,259 217,042 218,708 0.77%5050-000-01 Unemployment Benefits Claimed ASM 10,000 10,000 10,000 0.00%5060-000-01 Uniforms AE 25,000 25,000 26,250 5.00%5065-000-01 Shoes ASM 7,475 7,475 8,675 16.05%
Subtotal Benefits 2,485,365 2,572,038 2,789,872 8.47%
Total Salaries & Benefits 3,222,299 3,358,545 3,643,978 8.50%
INSURANCE
6800-010-01 Property Insurance ASM 26,597 26,597 37,740 41.89%6800-020-01 General Liability & Auto Insurance ASM 70,507 70,507 67,599 -4.12%6800-030-01 Pollution Liability Insurance ASM 725 725 898 23.80%6800-040-01 Employee/Commissioner's Bonds ASM 1,167 1,167 1,970 68.88%6800-050-01 Commercial Crime Insurance ASM 750 750 788 5.00%5040-000-01 Workers' Compensation Insurance ASM 79,407 79,407 76,921 -3.13%
Subtotal Insurance 179,153 179,153 185,915 3.77%
UTILITIES
6835-030-01 Utilities: Water TPM 4,686 - - 0.00%6835-040-01 Utilities: Garbage TPM 40,200 - - 0.00%
Subtotal Utilities 44,886 - - 0.00%
GENERAL ADMINISTRATIVE6700-010-01 Meetings/Training GM 5,200 5,200 5,200 0.00%6700-020-01 Conferences GM 14,000 14,000 14,000 0.00%6710-010-01 Commissioners Meeting Fees & Conferences GM 11,600 11,600 11,600 0.00%6805-000-01 Memberships: Professional Affiliations ASM 1,250 1,250 1,250 0.00%6805-001-01 Memberships: BACWA GM 7,500 7,500 7,500 0.00%6805-002-01 Memberships: NBWA GM 6,750 7,500 6,500 -13.33%6805-003-01 Memberships: CASA GM 12,000 12,000 9,000 -25.00%6805-004-01 Memberships: NACWA GM 7,800 7,500 7,500 0.00%6815-000-01 Office Expenses AA 25,500 25,500 29,500 15.69%6815-001-01 Safety Supplies OS 12,510 18,150 18,850 3.86%6815-002-01 Information Technology Software ISA 2,000 1,500 1,500 0.00%6820-000-01 Printing & Publications AA 5,500 5,500 5,500 0.00%6830-001-01 Professional Services: General GM 48,900 59,900 45,900 -23.37%6830-002-01 Professional Services: Regulatory GM 125,000 5,000 5,000 0.00%6830-005-01 Professional Services: Finance & Audit ASM 33,500 23,500 23,500 0.00%6830-010-01 Professional Services: Labor Negotiations GM 9,430 9,675 9,675 0.00%6830-015-01 Professional Services: Legal Services GM 35,000 61,300 61,300 0.00%6830-016-01 Professional Services: Safety Director, CMSA Share ASM 3,512 6,911 10,569 52.92%6830-017-01 Professional Services: Outside Safety Training ASM 12,132 11,000 11,000 0.00%6830-025-01 Professional Services: Employee Assistance AA 1,500 1,500 1,500 0.00%6830-060-01 Professional Services: Employee Health Maintenance AA 2,500 2,500 2,500 0.00%6840-010-01 Internet & Telephone Service ISA 10,000 13,890 38.90%6855-000-01 Postage/Shipping AA 8,400 8,400 8,400 0.00%6859-000-01 Bank Fees & Analysis Charges ASM 2,250 2,250 2,250 0.00%6860-000-01 Trade Discounts ASM - - - 0.00%6890-010-01 Contingency GM 50,000 50,000 50,000 0.00%6990-000-01 Other Non-Operating Expenses GM - - - 0.00%
Subtotal Administrative 443,734 369,137 363,385 -1.56%
Subtotal excluding Salary and Benefits 667,772 548,289 549,300 0.18%
Total Administration 3,890,071 3,906,835 4,193,278 7.33%
15 of 86

CENTRAL MARIN SANITATION AGENCY FY 2013-14 Adopted Budget Explanation
Administration
Account Number Account Description
FY 11-12 Adopted Budget
FY 12-13 Adopted Budget
FY 13-14 Adopted Budget Administration Budget Explanation
5010-010-01 Salaries & Wages 784,733 814,858 875,425 Salaries, step adjustments and merit pay for 6 regular full-time employees and 61.7% for the Safety Director. Budget increase is due to 2.7% contractual cost-of-living adjustment (COLA) effective July 1, 2013 and an increased share of expense for the safety director compensation due to withdrawal of SASM and SMCSD from the program.
Transfer to Rev Bond Program 5010-101-10
(51,750) (32,300) (25,268) Transfer of salary expenses for staff assigned to selected Capital Improvement projects (.125 FTE).
5010-020-01 Overtime 3,950 3,950 3,950 Authorized overtime to complete extraordinary assignments that require strict deadlines and employee compensated time cashed out.
5020-020-01 Retirement - CalPERS 1,219,040 1,254,484 1,327,377 Employer and employer-paid employee contributions for CalPERS 2.7% @ 55 retirement program for CMSA employees. The employer rate for FY14 is 23.139% a 2.5% increase compared to 22.568% in FY13. Budget increase is also a function of COLA and other salary adjustments.
5020-030-01 Retirement - SS / Medicare 58,241 58,958 63,182 Employer’s 1.45% share of Medicare for all employees.
5030-010-01 Benefits-CalPERS Medical Active Employees
888,087 798,359 900,641 Budget includes an estimated increase of 10% for CalPERS Kaiser rates effective January 2014 (January 2013 Kaiser increase was 9.53%). CalPERS does not provide estimates to contracting agencies.
5030-001-01 Benefits-Dental Active Employees
94,898 95,918 Employer paid dental benefits. Budget includes 10% estimated increase for dental insurance premiums effective December 2013. (The last increase was 15% in December 2011)
5030-003-01 Benefits-Life Insurance, AD&D and LTD, Active Employees
44,632 45,292 Employer paid life, accidental death & dismemberment, and long-term disability insurances.
5030-004-01 Benefits-Vision Active Employees
9,138 9,713 Employer paid vision benefits. Budget includes a 5.1% premium increase for vision insurance premiums offset by savings from changes in employee & dependent enrollment.
5030-015-01 Employee Benefits-MARA Active
5,204 7,922 11,844 MARA: Medical-After-Retirement-Account. Employer contribution and administrative fee totaling 1.6% of base salary for 9 employees (FY13 budgeted 8 employees). Budget increase is also a function of salary adjustment.
16 of 86

Account Number Account Description
FY 11-12 Adopted Budget
FY 12-13 Adopted Budget
FY 13-14 Adopted Budget Administration Budget Explanation
5030-020-01 Employee Benefits - Retired Employees
153,910 160,085 166,005 Medical benefits for retired employees at the SF-Bay Area PERS Kaiser single rate. Former SRSD employees who transferred to CMSA also receive medical benefits for their spouse. Budget increase due to a 10% Kaiser premium increase offset by 16 retirees over age 65 during FY14.
Transfer to Rev Bond Program
(121,850) (115,956) (93,733) Transfer of benefits expenses for staff assigned to selected Capital Improvement projects (.125 FTE)
5030-025-01 Annual OPEB Contribution 240,259 217,042 218,708 Prefunding of the Agency’s post-employment health benefit obligations for employees hired prior to January 1, 2010 and retirees. The prefunding amount is the gross contribution from the Agency GASB 45 actuarial report as of June 30, 2011 less the actual premiums paid for current retirees (5030-020-01).
5050-000-01 Unemployment Benefits Claimed
10,000 10,000 10,000 Unemployment benefits paid to State Employment Development Department (EDD) for claims filed by separated employees.
5060-000-01 Uniforms 25,000 25,000 26,250 Contracted service to provide uniforms, jackets, fire resistant clothing, rain gear and miscellaneous work clothing for staff, and also includes towel and floor mat cleaning services.
5065-000-01 Shoes 7,475 7,475 8,675 Safety shoes are part of the safety clothing provided for employees per CMSA safety policies.
6800-010-01 Property Insurance 26,597 26,597 37,740 Annual property insurance coverage from the California Sanitation Risk Management Authority (CSRMA) for all CMSA-owned structures. The increase is based on actual premiums paid plus 10% per CSRMA’s recommendation. In the past, CSRMA dividend payments offset insurance expense. Dividends are now recognized as Other Revenue.
6800-020-01 General Liability & Auto Insurance
70,507 70,507 67,599 CSRMA pooled insurance coverage for general, automobile, and error and omission liability premiums. Budget decrease due to anticipated premium reduction adjustments for prior fiscal periods.
6800-030-01 Pollution Liability Insurance 725 725 898 CSRMA pollution liability insurance for cleanup costs as a result of releases from underground fuel storage tank systems and other pollution caused loss. Budget increase per CSRMA’s recommendation.
6800-040-01 Employee/Commissioner's Bonds
1,167 1,167 1,970 Public official bonds for Agency employees and commissioners who are authorized to sign Agency checks, and includes employees who handle agency funds such as petty cash. Bonding, a JPA requirement, is through CSRMA. Three employees and three commissioners are covered under separate policies with different durations and premiums.
17 of 86

Account Number Account Description
FY 11-12 Adopted Budget
FY 12-13 Adopted Budget
FY 13-14 Adopted Budget Administration Budget Explanation
6800-050-01 Commercial Crime Insurance 750 750 788 This insurance covers instances of public employee dishonesty. It is intended to cover all employees not covered under the employee/public official bonds.
5040-000-01 Workers' Compensation Insurance
79,407 79,407 76,921 CSRMA workers’ compensation insurance decrease is based on FY13 actual premium plus CSRMA’s recommended 10% increase .
6835-030-01 Utilities: Water 4,686 - - The responsibility transferred to the Operations department in FY13.
6835-040-01 Utilities: Garbage 40,200 - - The responsibility transferred to the Operations department in FY13.
6700-010-01 Meetings/Training 5,200 5,200 5,200 Expenses associated with staff travel, training, and attendance at single-day professional meetings and seminars. Expenses include registration, mileage, meal allowance, bridge tolls, and other allowed expenses pursuant to the Agency’s travel expense reimbursement policy.
6700-020-01 Conferences 14,000 14,000 14,000 Expenses associated with staff attendance at multi-day professional conferences, seminars, and training events outlined in the Agency’s travel expense reimbursement policy.
6710-010-01 Commissioners Meeting Fees & Conferences
11,600 11,600 11,600 Pursuant to Commission compensation policy, CMSA Commissioners receive $100 per day of service which includes attendance at North Bay Watershed Association Meetings.
6805-000-01 Memberships: Professional Affiliations
1,250 1,250 1,250 Professional memberships and registration requirements for General Manager, Treatment Plant Manager, finance and administrative staff.
6805-001-01 Memberships: BACWA 7,500 7,500 7,500 Annual membership dues to the Bay Area Clean Water Agencies (BACWA). BACWA is comprised of 5 members and over 25 associate members, such as CMSA.
6805-002-01 Memberships: NBWA 6,750 7,500 6,500 Annual membership dues to the North Bay Watershed Association (NBWA), which is comprised of 16 governmental agencies in the North San Pablo Bay watershed.
6805-003-01 Memberships: CASA 12,000 12,000 9,000 Annual membership dues to the California Association of Sanitation Agencies (CASA).
6805-004-01 Memberships: NACWA 7,800 7,500 7,500 Annual membership dues to the National Association of Clean Water Agencies (NACWA). NACWA represents the wastewater industry nationwide and collaborates with US Environmental Protection Agency (EPA) and Water Environment Federation (WEF) on regulatory and legislative issues.
18 of 86

Account Number Account Description
FY 11-12 Adopted Budget
FY 12-13 Adopted Budget
FY 13-14 Adopted Budget Administration Budget Explanation
6815-000-01 Office Expenses 25,500 25,500 29,500 Costs associated with the Agency's administrative operations, including office supplies, copier lease, office furniture, office equipment service and repairs, and other related expenses.
6815-001-01 Safety Supplies 12,510 18,150 18,850 Annual expenses for safety training, first aid and emergency supplies, defibrillators and fire extinguishers tests, various one time purchases and safety assessment expenses to correct workplace hazards. FY14 Budget increase is due to adding funding for safety assessment required improvements.
6815-002-01 Information Systems Software
2,000 1,500 1,500 Expenses related to software licenses and upgrades.
6820-000-01 Printing & Publications 5,500 5,500 5,500 Printing expenses associated with brochures, newspaper subscriptions, monthly periodicals, publication of notices in local newspaper and copy services at local print shops.
6830-001-01 Professional Services: General
48,900 59,900 45,900 Expenses for general governmental and human resource services such as recruitment, background reference checks, staff training and development, mandatory training for manager and supervisors on ethics, mandatory training for all employees on unlawful harassment and workplace violence. Includes $12,000 for Agency sponsorship of the Bay Area Coalition for Water/Wastewater Education through Solano Community College.
6830-002-01 Professional Services: Regulatory
125,000 5,000 5,000 CMSA contracts with consulting firms on regulatory compliance and permit issues, including NPDES permit matters. FY14 Budget remains flat.
6830-005-01 Professional Services: Finance & Audit
33,500 23,500 23,500 Expenses for professional services related to the financial operations of the Agency: annual audit of financial statements performed by a licensed CPA as required by State law; annual maintenance fee for financial software license renewal and financial software support; actuarial, financial and operational analysis services.
6830-010-01 Professional Services: Labor Negotiations
9,430 9,675 9,675 IEDA annual fee for labor relations and negotiations services. This budget includes a subscription to the IEDA online compensation & benefit document warehouse.
6830-015-01 Professional Services: Legal Services
35,000 61,300 61,300 Expenses for general, employment, and public contract legal counsels. FY14 Budget remains flat to reflect the continued estimated costs of legal representation fees for litigation between CMSA and SD 1.
19 of 86

Account Number Account Description
FY 11-12 Adopted Budget
FY 12-13 Adopted Budget
FY 13-14 Adopted Budget Administration Budget Explanation
6830-016-01 Professional Services: Safety Director, CMSA Share
3,512 6,911 10,569 This account represents the Agency’s share (61.7%) of the Safety Director program non-salary costs. The remaining 38.3% of the Safety Director program budget is included in Non-Agency Expenses: Services to Other Districts cost center. FY14 Budget increase is due to SASM and SMCSD withdrawing from the program.
6830-017-01 Professional Services: Outside Safety Training
12,132 11,000 11,000 Training expenses for planned safety training such as hearing and respiratory tests, incident command system, defensive driver, hazardous material, ARC flash, utility locator and refresher training, and many other Cal/OSHA programs that facilitate a safe work environment.
6830-025-01 Professional Services: Employee Assistance
1,500 1,500 1,500 Confidential professional counseling benefit provided to employees and their families per MOU with represented employees.
6830-060-01 Professional Services: Employee Health Maintenance
2,500 2,500 2,500 Expense for safety related physicals, pre-employment exams, and urgent care at Kentfield Medical Clinic.
6840-010-01 Internet & Telephone Service 10,000 13,890 Service costs for telephone, internet and Google Gmail accounts are included in this budget account.
6855-000-01 Postage/Shipping 8,400 8,400 8,400 Postage, postage meter rental, and overnight shipping expense.
6859-000-01 Bank Fees & Analysis Charges 2,250 2,250 2,250 Bank fees and investment expenses for California Asset Management Program and Westamerica Bank accounts.
6860-000-01 Trade Discounts - - - Account used to record vendor payment discounts received and taken for paying bills within payment terms.
6890-010-01 Contingency 50,000 50,000 50,000 Funds available for transfer to other operating budget accounts for unplanned and unanticipated activities. Transfers from this account require GM approval.
6990-000-01 Other Non-Operating Expenses
- - - No budget. Account used for accounting adjustments such as general ledger account reconciliations, prior year audit adjustments, end expenditures associated with prior year activities such as service charge refunds.
Total 3,890,071 3,906,835 4,193,278
Percent Change 7.58% 0.43% 7.33%
20 of 86

Environmental Services The Environmental Services Department is responsible for monitoring, reporting and performing other regulatory compliance activities associated with the Agency’s federal National Pollutant Discharge Elimination System (NPDES) permit. The NPDES permit requires the Agency to manage and maintain pretreatment, pollution prevention, mercury reduction and public education programs. Another important function of the department is regulating commercial and industrial disposal of wastewater into the collection and treatment systems to prevent pollutants from disrupting the treatment plant operations and to prevent discharge into the San Francisco Bay. The Department operates an accredited laboratory which performs the majority of routine testing required in the Agency’s NPDES permit. The laboratory performs process control and analytical testing for local collection systems, and oversees outside analytical testing services for specialized analyses that cannot be performed in the CMSA laboratory. The Department provides technical, regulatory enforcement, and program administration services under contract to wastewater and local agencies in Marin County for Pollution Prevention, Fats Oils and Grease program administration, stormwater enforcement, regulatory and technical assistance, and leads the countywide Public Education Outreach Program.
Expenditures by Category
FY 11-12 Adopted
Budget
FY 12-13 Adopted Budget
FY 13-14 Adopted Budget
SALARIES $ 532,471 $ 535,152 $ 557,224
SUB-TOTAL 532,471 535,152 557,224
BIOSOLIDS DISPOSAL 240,936 258,436 266,086 PERMIT TESTING & MONITORING 133,161 138,230 140,869 GENERAL & ADMINISTRATIVE 126,840 137,550 150,340
SUB-TOTAL 500,936 534,215 557,294
TOTAL $1,033,407 $1,069,368 $ 1,114,518
Authorized Positions FY 11-12 FY 12-13 FY 13-14
Environmental Services Manager 1 1 1 Environmental Laboratory Administrator 1 1 1 Environmental Services Analyst (I-II) 3 3 3
TOTAL 5 5 5
21 of 86

Central Marin Sanitation Agency *Position Code
Adopted FY 2013-14 Operating Budget ASM Administrative Services Manager
Line Item Accounts by Department ESM Environmental Services Manager
Environmental Services
Account # Main Account Description *By
FY 11-12
Adopted
Budget
FY 12-13
Adopted
Budget
FY 13-14
Adopted
Budget
% Change
FY14 Adopted
Budget from
FY13 Adopted
SALARIES & WAGES
5010-010-02 Salaries & Wages ASM 513,464 515,218 537,183 4.26%5010-020-02 Overtime ESM 9,085 9,085 9,085 0.00%5010-022-02 ES Wet Weather On-call Services ESM 9,922 10,849 10,956 0.98%
Subtotal Salaries & Wages 532,471 535,152 557,224 4.12%
BIOSOLIDS DISPOSAL6200-010-02 Biosolid Disposal Fees ESM 190,837 195,799 201,086 2.70%6200-050-02 Biosolids Hauling ESM 50,099 62,637 65,000 3.77%
Subtotal Biosolids Disposal 240,936 258,436 266,086 2.96%
PERMIT TESTING & MONITORING6300-000-02 Lab Supplies ESM 39,800 40,835 41,937 2.70%6310-030-02 Biosolids Monitoring: Contract Lab Services ESM 8,854 8,987 9,122 1.50%6320-010-02 NPDES Permit Sampling ESM 58,747 70,079 71,481 2.00%6320-020-02 Pretreatment Sampling ESM 15,624 15,624 15,624 0.00%6330-010-02 Underground Tank Testing: Overfill ESM 2,636 2,705 2,705 0.00%6330-020-02 Underground Tank Testing: Secondary ESM 7,500 - - 0.00%
Subtotal Permit Testing & Monitoring 133,161 138,230 140,869 1.91%
ADMINISTRATIVE6700-010-02 Meetings/Training ESM 2,000 2,000 2,000 0.00%6700-020-02 Conferences ESM 7,500 7,500 7,500 0.00%6805-000-02 Memberships: Professional Affiliations ESM 2,000 2,000 2,000 0.00%6810-000-02 Permits & Licenses: Annual NPDES Permit ESM 40,000 50,710 55,000 8.46%6810-040-02 Permits & Licenses: ELAP ESM 3,000 3,000 3,000 0.00%6810-050-02 Permits & Licenses: Regional Monitoring Plan ESM 24,840 24,840 24,840 0.00%6810-051-02 Permits & Licenses: Water Quality Attainment
Strategy (WQAS)
ESM 7,000 7,000 10,500 50.00%
6810-060-02 Permits & Licenses: CUPA ESM 5,500 5,500 5,500 0.00%6810-070-02 Permits & Licenses: Stormwater Annual Permit ESM 1,500 1,500 1,500 0.00%6810-080-02 Permits & Licenses: BAPPG ESM 1,500 1,500 1,500 0.00%6810 -090-02 Permits & Licenses : eNPDES ESM 1,000 0.00%6821-000-02 Public Education Program: CMSA portion ESM 32,000 32,000 36,000 12.50%
Subtotal Administrative 126,840 137,550 150,340 9.30%
Subtotal excluding Salary and Benefits 500,936 534,215 557,294 4.32%
Total Environmental Services 1,033,407 1,069,368 1,114,518 4.22%
22 of 86

CENTRAL MARIN SANITATION AGENCY FY 2013-14 Adopted Operating Budget Explanation
Environmental Services
Account Number Account Description
FY 11-12 Adopted Budget
FY 12-13 Adopted Budget
FY 13-14 Adopted Budget Environmental Services Budget Explanation
5010-010-02 Salaries & Wages 513,464 515,218 537,183 Salaries, 1 step adjustment, merit pay for 5 regular full-time employees. Effective July 1, 2013 2.7% contractual COLA (cost-of-living adjustment).
5010-020-02 Overtime 9,085 9,085 9,085 Authorized overtime for evening and weekend public outreach events, assignments that require strict deadlines, and overtime worked when called in for wet weather on-call Services.
5010-022-02 ES Wet Weather On-call Services
9,922 10,849 10,956 Pursuant to MOU and personnel policies, on-call staff is paid to remain fit for duty and to respond within 1 hour when called in to collect samples and conduct analysis during wet weather blending events. Program begins at the onset of the wet weather season, November 1-April 30.
6200-010-02 Biosolids Disposal Fees 190,837 195,799 201,086 Redwood Landfill fees and Synagro land application fees for biosolids disposal (3,500 at landfill, 2,500 for land application). Budget includes scheduled 2.7% CPI contract increase.
6200-050-02 Biosolids Hauling 50,099 62,637 65,000 Hauling of biosolids to landfill and land application sites (3,500 at landfill, 2,500 for land application). Budget includes 2.7% CPI scheduled contract increase and 1% estimated increase for cost of service for diesel fuel.
6300-000-02 Lab Supplies 39,800 40,835 41,937 Laboratory and source control program supplies including all chemicals, glassware, reagents, containers, filters, bioassay, and de-ionized water system, sampling, and inspection equipment. Budget includes an anticipated 2.7% CPI price increase.
6310-030-02 Biosolids Monitoring: Contract Lab Services
8,854 8,987 9,122 Contracts for laboratory analysis of biosolids to meet Regional Water Board requirements, EPA 503 regulations, land application and Redwood Landfill disposal requirements. Budget includes increase of 1.5% for subcontracted samples to laboratories other than Caltest.
6320-010-02 NPDES Permit Sampling 58,747 70,079 71,481 Contract for laboratory analysis of effluent and influent for NPDES permit compliance and water code Section 13267 monitoring requirements. Budget includes 2% contract increase for subcontracting samples to Caltest, Pacific Ecorisk, EBMUD laboratory, and Frontier Analytical.
23 of 86

Account Number Account Description
FY 11-12 Adopted Budget
FY 12-13 Adopted Budget
FY 13-14 Adopted Budget Environmental Services Budget Explanation
6320-020-02 Pretreatment Sampling 15,624 15,624 15,624 Contract for lab analysis of pretreatment samples and monitoring industrial waste. No price increase due to the close of a local manufacturing plant in 2011 which resulted in a decrease for monitoring and sampling requirements.
6330-010-02 Underground Tank Testing: Overfill Containment
2,636 2,705 2,705 Annual testing of underground gasoline and diesel tank over-fill and secondary containment monitoring system testing required by state regulation CCR 2637(a).
6330-020-02 Underground Tank Testing: Secondary Containment
7,500 - - Testing of underground tank secondary containment every three years as required by state regulation CCR 2637(a). Last test was in FY12. Next test is scheduled for FY15.
6700-010-02 Meetings/Training 2,000 2,000 2,000 Expenses associated with professional development, training and seminars that include registration, mileage, meal allowance, bridge tolls, and other expenses allowed pursuant to the Agency’s travel policy.
6700-020-02 Conferences 7,500 7,500 7,500 Expenses associated with staff attendance at multi-day professional development conferences, seminars, and training events outlined in the Agency’s travel/expense reimbursement policy.
6805-000-02 Memberships: Professional Affiliations
2,000 2,000 2,000 Professional memberships and certification requirements for environmental services staff including reimbursement of the examination fee to employees upon passing certification testing.
6810-000-02 Permits & Licenses: Annual NPDES Permit Fee
40,000 50,710 55,000 Annual renewal fee for SWRCB administration of the NPDES permit and the Pre-treatment program fee. FY 14 Budget increase reflects a proposed State Water Board increase to the FY14 NPDES permit fee structure.
6810-040-02 Permits & Licenses: ELAP 3,000 3,000 3,000 Annual renewal fee to maintain laboratory certification. The fee covers the costs of inspections, certificates, ELAP operating costs, and enterrococcus testing required in the NPDES permit.
6810-050-02 Permits & Licenses: Regional Monitoring Plan (AHI)/SFEI
24,840 24,840 24,840 SFEI is a required program under the Agency’s NPDES permit. SFEI performs ambient monitoring including sample collection and analysis of the San Francisco Bay and its tributaries.
24 of 86

Account Number Account Description
FY 11-12 Adopted Budget
FY 12-13 Adopted Budget
FY 13-14 Adopted Budget Environmental Services Budget Explanation
6810-051-02 Permits & Licenses: Water Quality Attainment Strategy (WQAS)
7,000 7,000 10,500 BACWA established the Clean Bay Collaborative (CBC), a water quality attainment strategy testing program, administered in conjunction with the Regional Water Board (RWB). SF Bay NPDES dischargers are required to perform bay and regional monitoring tests and perform studies to determine impacts to the bay and to help predict the effects of upcoming regulations proposed by the RWB and the EPA. The 50% increase is to pay for SF Bay nutrient monitoring.
6810-060-02 Permits & Licenses: CUPA 5,500 5,500 5,500 Certified Unified Program Agency fees paid to the County of Marin for the Agency’s underground storage tanks and hazardous materials.
6810-070-02 Permits & Licenses: Stormwater Annual Permit
1,500 1,500 1,500 SWRCB fee for the Agency’s industrial site stormwater permit.
6810-080-02 Permits & Licenses: BAPPG
1,500 1,500 1,500 Bay Area Pollution Prevention Group Sponsorship. The Agency’s NPDES Permit requires the Agency support a portion of BACWA’s pollution prevention and public education programs.
6810-090-02 Permits & Licenses: eNPDES
1,000 Annual electronic reporting software maintenance fee that includes support and filing updates required by the State Water Board and EPA.
6821-000-02 Public Education Program: CMSA portion
32,000 32,000 36,000 Expenses associated with all public outreach events, including registration, supplies, and promotional items for school programs, Marin County Fair, BAEER Fair, Pollution Prevention Week, Earth Day; joint school outreach programs; participation in the County’s pharmaceutical Take-Back Program; and programs undertaken solely by CMSA. Budget is for the Agency’s share of the Countywide Public Education Program. The non-Agency portion is reflected in Non-Agency Expenses: Services to other Districts department.
Total 1,033,407 1,069,368 1,114,518
Percent Change 5.62% 3.48% 4.22%
25 of 86

Maintenance The Maintenance Department is responsible for maintaining the Agency’s infrastructure and assets including buildings, grounds, treatment facility, vehicles and equipment. The certified mechanics, maintenance technicians and utility workers perform a wide variety of corrective and preventive maintenance and repairs on all fixed assets and equipment in the wastewater treatment plant and related facilities. The department utilizes a computerized asset management system to manage its fixed assets, develop preventive maintenance schedules, and to track repairs and maintenance activities. The Electrical and Instrumentation group within the Department is responsible for maintaining the Agency’s process control systems, electrical and instrumentation controls on various electro-mechanical systems, communications, and technology infrastructure. The Department also operates and maintains pump stations for Sanitary District No. 2 of Marin County (Town of Corte Madera), and collection system assets for San Quentin State Prison, and County of Marin at San Quentin Village under contractual agreements.
Expenditures by Category
FY 11-12 Adopted Budget
FY 12-13 Adopted Budget
FY 13-14 Adopted Budget
SALARIES $1,118,071 $1,157,710 $ 1,267,131
SUB-TOTAL 1,118,071 1,157,710 1,267,131
CHEMICALS & FUELS - 6,800 6,800 MAINTENANCE & REPAIRS 176,000 197,000 185,000 GENERAL & ADMINISTRATIVE 37,500 27,500 29,650
SUB-TOTAL 213,500 231,300 221,450
TOTAL $1,331,571 $1,389,010 $ 1,488,581
Authorized Positions FY 11-12 FY 12-13 FY 13-14
Maintenance Supervisor 1 - - Asset Manager-Maintenance Supervisor 1 1 1 Maintenance Lead 1 1 1 Maintenance Repair (Trainee to Step III) 2 2 2 Mechanical Technician (Steps I-III) 3 3 4* Maintenance Painter 1 1 1 Utility Worker 2 2 2 Electrical/Instrumentation Supervisor 1 1 1 Electrical/Instrumentation Tech (Steps I-III) 2 2 2
TOTAL 14 13 14 * Temporary addition of one position during FY 13-14 to support department succession
planning efforts.
26 of 86

Central Marin Sanitation Agency *Position Code
Adopted FY 2013-14 Operating Budget ASM Administrative Services Manager
Line Item Accounts by Department TPM Treatment Plant Manager
MS Maintenance Supervisor
ISA Information Systems Analyst
Maintenance
Account # Main Account Description *By
FY 11-12
Adopted
Budget
FY 12-13
Adopted
Budget
FY 13-14
Adopted
Budget
% Change
FY14 Adopted
Budget from
FY13 Adopted
SALARIES & WAGES
5010-010-03 Salaries & Wages ASM 1,077,460 1,120,385 1,238,186 10.51%5010-103-10 Transfer to Rev Bond Program ASM (27,600) (32,300) (41,882) 29.67%5010-020-03 Overtime TPM 25,125 25,125 25,125 0.00%5010-021-03 On-call Services TPM 43,087 44,500 45,702 2.70%
Subtotal Salaries & Wages 1,118,071 1,157,710 1,267,131 9.45%
REPAIRS & MAINTENANCE (R&M)6400-030-03 Lubricants, Propane, Other MS 6,800 6,800 6,800 0.00%6500-000-03 Utility Supplies MS 13,000 13,000 10,000 -23.08%6510-001-03 Outside Services & Parts TPM 66,300 66,300 57,000 -14.03%6510-004-03 Fleet Maintenance MS 12,700 12,700 11,000 -13.39%6510-007-03 Hazardous Waste Disposal Service MS 3,000 13,000 18,000 38.46%6510-008-03 Facilities Maintenance MS 15,000 15,000 15,000 0.00%6510-020-03 Cogen/Emergency Generator Maintenance MS 25,000 36,000 32,000 -11.11%6520-000-03 Groundskeeping MS 30,000 30,000 32,000 6.67%6530-000-03 Small Tools & Equipment MS 11,000 11,000 10,000 -9.09%
Subtotal Repairs & Maintenance 182,800 203,800 191,800 -5.89%
ADMINISTRATIVE6700-010-03 Meetings/Training TPM 3,900 2,000 5,000 150.00%6700-020-03 Conferences TPM 4,500 6,400 7,000 9.38%6805-000-03 Memberships: Professional Affliations TPM 3,000 3,000 3,200 6.67%6830-030-03 Professional Services: USA MS 200 200 200 0.00%6840-020-03 Telephone: Pump Station Telemetry Data ISA 9,000 9,000 6,250 -30.56%6840-030-03 Telephone: Cell Phones & Portable Radios ISA 6,900 6,900 8,000 15.94%
Subtotal Administrative 37,500 27,500 29,650 7.82%
Subtotal excluding Salary and Benefits 220,300 231,300 221,450 -4.26%
Total Maintenance 1,338,371 1,389,010 1,488,581 7.17%
27 of 86

CENTRAL MARIN SANITATION AGENCY FY 2013-14 Adopted Operating Budget Explanation
Maintenance
Account Number Account Description
FY 11-12 Adopted Budget
FY 12-13 Adopted Budget
FY 13-14 Adopted Budget Maintenance Budget Explanation
5010-010-03 Salaries & Wages 1,077,460 1,120,385 1,238,186 Salaries, 3 step adjustments, merit pay for 14 regular full-time employees (temporary increase of 1 MT I position funded for 6 months to support department succession planning and final vacation payout for 1 retiree). Effective July 1, 2013 2.7% contractual COLA (cost-of-living adjustment).
Transfer to Rev Bond Program 5010-101-10
(27,600) (32,300) (41,882) Transfer of salary expenses for staff assigned to Capital Improvement Project work (.395 FTE).
5010-020-03 Overtime 25,125 25,125 25,125 Authorized overtime to complete unexpected maintenance activities or assignments that require work after the employee’s regular shift. Includes maintenance of process equipment scheduled for evenings and weekends.
5010-021-03 On-call Services 43,087 44,500 45,702 24/7 on-call services for qualified maintenance staff. Pursuant to MOU and personnel policies, employees are paid to remain fit for duty and to respond within 1 hour when called in for duty. Sanitary District #2 of Marin (Corte Madera) funds one third of this expense.
6400-030-03 Lubricants, Propane, Other
6,800 6,800 6,800 Lubricants used for plant equipment (excluding oil changes for engine generator), propane gas for forklift, and welding gas.
6500-000-03 Utility Supplies 13,000 13,000 10,000 Janitorial and utility supplies: cleaners, paper products, wax, brooms, and shop consumables (batteries, blades, grinding wheels). Decrease due to standardizing cleaning products.
6510-001-03 Outside Services & Parts 66,300 66,300 57,000 Cost of repairs for motors, pumps, electrical and mechanical equipment. Includes costs for services and repairs performed by outside contractors (machine work, vacuum services, etc.). Decrease due to negotiated pricing discounts with local vendors.
6510-004-03 Fleet Maintenance 12,700 12,700 11,000 Preventive and corrective maintenance for CMSA’s vehicles, fork lift, skip steer loader, electric carts, and bicycles. Decrease due to fleet maintenance cost reductions realized in FY13.
6510-007-03 Hazardous Waste Disposal Service
3,000 13,000 18,000 Disposal costs for energy generation systems engine, oil, filters, coolants, paint, fluorescent bulbs, batteries, siloxane media, hydrogen sulfide, and other solvents by licensed contractors. Budget increase for crane and vacuum truck needed to replace biogas purification system media.
28 of 86

Account Number Account Description
FY 11-12 Adopted Budget
FY 12-13 Adopted Budget
FY 13-14 Adopted Budget Maintenance Budget Explanation
6510-008-03 Facilities Maintenance 15,000 15,000 15,000 Building maintenance costs include repairs for roofs, doors, windows, floors, elevators, and painting supplies for buildings and equipment.
6510-020-03 Energy Generation Systems
25,000 36,000 32,000 Equipment purchases for minor repairs, parts and materials for oil and filter changes. Costs for routine and corrective maintenance on the emergency standby diesel engine that powers the plant during utility power outages. Major replacement and repairs are funded through the Capital Improvements Program.
6520-000-03 Groundskeeping 30,000 30,000 32,000 Landscaping services, tools and materials to maintain fire-defensible space and weed control around the holding pond and outside the plant perimeter fence. Budget increase is to expand fire-defensible space around the perimeter of the facility.
6530-000-03 Small Tools & Equipment 11,000 11,000 10,000 Purchase of hand and power tools such as electric or air tools, utility locator, gas generator, welders, and conduit benders. Larger tools and equipment are funded through the Capital Improvements Program.
6700-010-03 Meetings/Training 3,900 2,000 5,000 Expenses associated with attendance at single-day professional meetings and seminars. Includes registration, mileage, meal allowance, bridge tolls, and other allowed expenses pursuant to the Agency’s expense reimbursement policy. Increase due to focusing training on new equipment, new technologies, business skills development, and CWEA technical certification training for newly hired mechanics.
6700-020-03 Conferences 4,500 6,400 7,000 Expenses for multi-day professional conferences, seminars, and training events outlined in the Agency’s travel/expense reimbursement policy. Increase is to fund participation in CWEA functions.
6805-000-03 Memberships: Professional Affiliations
3,000 3,000 3,200 Professional membership dues and certification fees for maintenance and electrical/ instrumentation personnel.
6830-030-03 Professional Services: USA
200 200 200 Annual fee for underground alerts required by California government code prior to excavation work.
6840-010-03 Telephone Service 10,000 - This budget has been transferred to the Administration department.
6840-020-03 Telephone: Pump Station Telemetry Data
9,000 9,000 6,250 Cost of dedicated land lines that transmit equipment status from the pump stations (PS) to the SCADA System. This line will decrease over the next several years as the Agency relies more on data radios and less on traditional telephone lines to transmit PS information back to CMSA.
29 of 86

Account Number Account Description
FY 11-12 Adopted Budget
FY 12-13 Adopted Budget
FY 13-14 Adopted Budget Maintenance Budget Explanation
6840-030-03 Telephone: Cell Phones & Portable Radios
6,900 6,900 8,000 Cell phone, portable radio, and data plan expenses for field crews, on-call staff and managers. This line includes expenditures for data plans on computer tablets used for remote reporting and monitoring of the treatment plant, on-call services, and managed programs. Covers the increased costs of utilizing cell phones.
Total 1,338,371 1,389,010 1,488,581
Percent Change -1.05% 3.78% 7.17%
30 of 86

Operations The Operations Department performs various activities essential to the operation of a regional wastewater facility and the treatment and disposal of wastewater that is in full compliance with State and Federal water pollution control laws and regulations.
The Department is responsible for the following functions:
Monitor and adjust treatment process
Ensure facilities are operated to achieve permit compliance
Monitor local agency pump stations and related assets
Order treatment chemicals and maintain inventories
Conduct pilot testing to improve and/or optimize treatment
Monitor and operate systems to control wastewater odors
Track the performance of all treatment and energy generation systems
Expenditures by Category
FY 11-12 Adopted Budget
FY 12-13 Adopted Budget
FY 13-14 Adopted Budget
SALARIES $1,316,886 $1,221,472 $1,343,638
SUB-TOTAL 1,316,886 1,221,472 1,343,638
CHEMICALS & FUELS 1,289,063 1,274,028 1,098,787 UTILITIES 334,000 402,200 416,200 GENERAL & ADMINISTRATIVE 44,870 54,400 59,200
SUB-TOTAL 1,667,932 1,730,627 1,574,186
TOTAL $2,984,818 $2,952,099 $2,917,824
Authorized Positions FY 11-12 FY 12-13 FY 13-14
Operations Supervisor(s) 1 1 2 Assistant Operations Supervisor 1 1 - Lead Operators 4 4 4 Operators (Trainee, I-III) 7 7 7
TOTAL 13 13 13
31 of 86

Central Marin Sanitation Agency *Position Code
Adopted FY 2013-14 Operating Budget ASM Administrative Services Manager
Line Item Accounts by Department TPM Treatment Plant Manager
OS Operations Supervisor
Operations
Account # Main Account Description *By
FY 11-12
Adopted
Budget
FY 12-13
Adopted
Budget
FY 13-14
Adopted
Budget
% Change
FY14 Adopted
Budget from
FY13 Adopted
SALARIES & WAGES5010-010-04 Salaries & Wages ASM 1,257,268 1,156,128 1,280,474 10.76%
5010-104-10 Transfer to Rev Bond Program ASM (23,623) (18,240) (20,602) 12.95%5010-020-04 Overtime OS 70,000 70,000 70,000 0.00%5010-022-04 OPS Wet Weather On-call Services TPM 13,242 13,584 13,767 1.34%
Subtotal Salaries & Wages 1,316,886 1,221,472 1,343,638 10.00%
CHEMICALS & FUEL6100-010-04 Chemicals: Ferric Chloride OS 75,769 82,853 96,138 16.03%
6100-020-04 Chemicals: Polymer-Cationic OS 153,765 165,735 165,735 0.00%6100-030-04 Chemicals: Odor Control OS 22,174 20,000 20,000 0.00%6100-040-04 Chemicals: Nitrate OS 306,384 330,690 292,864 -11.44%6100-050-04 Chemicals: Hydrogen Peroxide OS 242,588 259,200 205,110 -20.87%
6100-060-04 Chemicals: Sodium Hypochlorite OS 292,398 247,250 146,440 -40.77%
6100-070-04 Chemicals: Sodium Bisulfite OS 169,385 145,800 150,000 2.88%
6400-020-04 Gasoline, Oil, & Fuel OS 19,800 22,500 22,500 0.00%
Subtotal Chemicals & Fuel 1,282,263 1,274,028 1,098,787 -13.75%
Utilities6835-010-04 Utilities: Natural Gas OS 193,000 180,000 187,200 4.00%6835-020-04 Utilities: Electricity OS 141,000 171,000 175,000 2.34%6835-030-04 Utilities: Water OS - 4,000 4,000 0.00%
6835-040-04 Utilities: Garbage OS - 47,200 50,000 5.93%
Subtotal Salaries & Wages 334,000 402,200 416,200 3.48%
MISCELLANEOUS & ADMINISTRATIVE6210-000-04 Operations - General TPM 6,000 6,000 7,000 16.67%
6700-010-04 Meetings/Training TPM 4,300 5,300 6,000 13.21%
6700-020-04 Conferences TPM 4,500 3,500 3,500 0.00%6805-000-04 Memberships: Professional Affliations TPM 4,070 4,200 5,000 19.05%6810-010-04 Permit & Licenses: BAAQMD Permit TPM 11,000 11,400 13,700 20.18%
6830-001-04 Professional Services: Process Control TPM 15,000 24,000 24,000 0.00%
Subtotal Miscellaneous & Administrative 44,870 54,400 59,200 8.82%
Subtotal excluding Salary and Benefits 1,327,133 1,730,627 1,574,186 -9.04%
Total Operations 2,978,018 2,952,099 2,917,824 -1.16%
32 of 86

CENTRAL MARIN SANITATION AGENCY FY 2013-14 Adopted Operating Budget Explanation
Operations
Account Number Account Description
FY 11-12 Adopted Budget
FY 12-13 Adopted Budget
FY 13-14 Adopted Budget Operations Budget Explanation
5010-010-04 Salaries & Wages 1,257,268 1,156,128 1,280,474 Salaries, 4 step adjustments, merit pay for 13 regular full-time employees. Effective July 1, 2013 2.7% contractual COLA (cost-of-living adjustment).
Transfer to Rev Bond Program 5010-101-10
(23,623) (18,240) (20,602) Transfer of salary expenses for staff assigned to Capital Improvement Projects (.175 FTE).
5010-020-04 Overtime 70,000 70,000 70,000 Authorized overtime to ensure plant is staffed 24 hours/day and to complete unexpected process control activities or assignments under strict deadlines.
5010-022-04 OPS Wet Weather On-call Services
13,242 13,584 13,767 24/7 on-call services provided by operations staff during wet weather season. Pursuant to MOU and personnel policies, employees are paid to remain fit for duty and to respond within 1 hour when called in for duty.
6100-010-04 Chemicals: Ferric Chloride 75,769 82,853 96,138 Ferric chloride is mixed with plant influent flow to improve settling of suspended material in the primary clarifiers during storm related flow events. Use of this compound reduces hydrogen sulfide levels in digester gas (gas is used to fuel the engine generator) and eliminates struvite formation in centrifuge feed lines. Annual usage over the past three years averaged approximately 110 dry tons. The budget is based on projected use of 120 dry tons and Bay Area Chemical Consortium unit costs.
6100-020-04 Chemicals: Polymer-Cationic
153,765 165,735 165,735 Polymer is added to the centrifuge feed sludge to enhance efficiency of solids removal in the centrifuges and is injected into the flow stream for sludge thickening units to increase solids capture which reduces hydraulic loading in the digesters. Polymer is also used for chemically enhanced primary treatment (CEPT). Annual usage ranges between 12 – 16 thousand gallons per year. Polymer use has remained steady at approximately 15,000 gallons per year over the past three years. The budget is based on the existing contract that expires in June 2014.
6100-030-04 Chemicals: Odor Control 22,174 20,000 20,000 Odor masking agents are used to minimize odors produced from daily operations and maintenance of the facility. Odorants are delivered in 55 gallon barrels. The FY14 budget is based on use of 15 barrels or 1.25 barrels per month.
33 of 86

Account Number Account Description
FY 11-12 Adopted Budget
FY 12-13 Adopted Budget
FY 13-14 Adopted Budget Operations Budget Explanation
6100-040-04 Chemicals: Nitrate 306,384 330,690 292,864 Nitrate salts are the first of a two phase odor control system used in the collection system upstream of the wastewater treatment plant. Nitrate inhibits hydrogen sulfide formation (odorous generation) in the collection system and increases the life of the collection system infrastructure by reducing the formation of corrosive sulfuric acid. The budget is based on the average projected use of 150,000 gallons. Budget decrease due to vendor agreeing to provide chemical at the Bay Area Chemical Consortium unit costs.
6100-050-04 Chemicals: Hydrogen Peroxide
242,588 259,200 205,110 Hydrogen peroxide is the second phase of CMSA’s odor control system. It is injected into the 54” and 45” collection system interceptors. Peroxide reacts with the influent flow by oxidizing sulfur compounds which reduces odors and decreases the potential for corrosion in the Headworks building. Annual usage ranges between 85 – 105 thousand gallons. The budget is based on projected use of 90,000 gallons. Budget decrease due to a 21% decrease in commodity pricing.
6100-060-04 Chemicals: Sodium Hypochlorite
292,398 247,250 146,440 Sodium hypochlorite is high strength bleach used for effluent disinfection and control of filamentous organisms in the activated sludge (biological) process. It is also used for three plant odor control scrubbers and enhances disinfection levels in the reclaimed water added to the Remillard Pond during the dry season. Annual usage ranges between 240 - 325 thousand gallons per year. The budget is based upon the three year average use of 280,000 gallons. Budget decrease due to a 47% decrease in commodity pricing.
6100-070-04 Chemicals: Sodium Bisulfite
169,385 145,800 150,000 Sodium bisulfite is used in the effluent and reclaimed water flows to neutralize chlorine residual after the disinfection process. Annual usage ranges between 120 – 109 thousand gallons per year. The FY14 Budget is based upon three year average use of 144,000 gallons. The budget increase is due to the increased sales tax rate.
6400-020-04 Gasoline, Oil, & Fuel 19,800 22,500 22,500 Gasoline for vehicles, landscaping machinery, and portable equipment. Diesel for standby engine generators and the effluent pump station pumps. Budget is based on 5000 gallons at @ $4.14/gallon.
34 of 86

Account Number Account Description
FY 11-12 Adopted Budget
FY 12-13 Adopted Budget
FY 13-14 Adopted Budget Operations Budget Explanation
6835-010-04 Utilities: Natural Gas 193,000 180,000 187,200 Supplemental fuel for the cogeneration system that produces electricity for the Agency and fuel for the boilers when the engines are off line. CMSA purchases natural gas from the not-for-profit School Project for Utility Rate Reduction (SPURR) which purchases gas in bulk for public agency facilities at wholesale costs. The budget was increased to $.60/therm based on current natural gas costs.
6835-020-04 Utilities: Electricity
141,000 171,000 175,000 Electricity is purchased from PG&E to supplement cogeneration and to supply power when the co-generator is offline for maintenance. The 2.34% increase is due to monthly stand-by demand charges of approximately $2,500.
6835-030-04 Utilities: Water 4,000 4,000 Potable water from MMWD for CMSA facilities and the San Quentin junction box odor control facility.
6835-040-04 Utilities: Garbage 47,200 50,000 Solid waste disposal provided by Marin Sanitary Service(MSS), for commercial garbage, green waste, household recycling, and debris box disposal of Headworks screenings, grit removal, and non-recyclable wastes. Budget increased by 6% based on the estimated amount of solid waste production for FY14.
6210-000-04 Operations - General 6,000 6,000 7,000 Supplies, small tools, equipment, parts, and other miscellaneous supplies.
6700-010-04 Meetings/Training 4,300 5,300 6,000 Expenses associated with attendance at single-day professional meetings and seminars. Includes registration, mileage, meal allowance, bridge tolls, and other allowed expenses pursuant to the Agency’s expense reimbursement policy.
6700-020-04 Conferences 4,500 3,500 3,500 Expenses associated with multi-day professional conferences, seminars, and training events outlined in the Agency’s travel and expense reimbursement policy.
6805-000-04 Memberships: Professional Affiliations
4,070 4,200 5,000 Professional memberships and certification renewal requirements for operators.
6810-010-04 Permit & Licenses: BAAQMD Permit
11,000 11,400 13,700 Bay Area Air Quality Management District (BAAQMD) permit fees for cogeneration engine, emergency power generator, five effluent pump station engines and fuel dispensers. Budget includes a 20% increase for all BAAQMD fees for FY 14.
35 of 86

Account Number Account Description
FY 11-12 Adopted Budget
FY 12-13 Adopted Budget
FY 13-14 Adopted Budget Operations Budget Explanation
6830-001-04 Professional Services: Process Control
15,000 24,000 24,000 Professional wastewater consulting service that evaluates process control options for reliability, efficiency and improvements. Provides assessment and advice on process control issues, trains staff on process analysis, and conducts other special studies.
Total 2,978,018 2,952,099 2,917,824
Percent Change 0.26% 0.87% -1.16%
36 of 86

Engineering The Engineering Department provides full engineering support for the Agency and is responsible for the following functions:
Designing small construction projects and overseeing the design of larger projects by outside consultants
Managing construction contracts and projects
Maintaining record documents on completed projects
Assisting with conducting operational studies and energy efficiency evaluations
Negotiating and administering Agency’s service and commodity contracts for staff uniforms, biosolids hauling and disposal, natural gas (cogeneration engine fuel), and chemicals used in the wastewater and biosolids treatment processes
Chairing the Agency’s Capital Improvement Planning Committee which develops, implements, and manages the Agency’s 10-year Capital Improvement Program and prepares the annual CIP budget with 10 year forecast.
Operating Expenditures by Category
FY 11-12 Adopted
Budget
FY 12-13 Adopted Budget
FY 13-14 Adopted Budget
SALARIES $ 177,755 $ 193,618 $ 246,816
SUB-TOTAL 177,755 193,618 246,816
GENERAL & ADMINISTRATIVE 8,799 12,386 121,011
SUB-TOTAL 8,799 12,386 121,011
TOTAL $ 186,554 $ 206,004 $ 367,827
Authorized Positions FY 11-12 FY 12-13 FY 13-14
Engineering Manager - 1 1 Senior Engineer 1 Assistant Engineer 1 1 1 Information Systems Analyst 1 1 1
TOTAL 3 3 3
37 of 86

Central Marin Sanitation Agency *Position Code
Adopted FY 2013-14 Operating Budget GM General Manager
Line Item Accounts by Department ASM Administrative Services Manager
EM Engineering Manager
Engineering
Account # Main Account Description *By
FY 11-12
Adopted
Budget
FY 12-13
Adopted
Budget
FY 13-14
Adopted
Budget
% Change FY14
Adopted
Budget from
FY13 Adopted
SALARY & WAGES
5010-010-05 Salary & Wages ASM 317,455 334,198 339,686 1.64%5010-105-10 Transfer to Rev Bond Program ASM (139,700) (140,580) (92,870) -33.94%5010-020-05 Overtime EM - - - 0.00%
Subtotal Salary & Wages 177,755 193,618 246,816 27.48%
ADMINISTRATIVE6700-010-05 Meetings/Training EM 1,000 1,500 3,000 100.00%6700-020-05 Conferences EM 4,500 7,000 8,000 14.29%6805-000-05 Memberships: Professional Affliations EM 1,174 1,761 1,761 0.00%6815-000-05 Office Expenses EM 500 500 1,000 100.00%6815-002-05 Information Systems EM 625 625 1,250 100.00%6820-000-05 Printing & Publications EM 1,000 1,000 1,000 0.00%6830-001-05 Professional Svcs - Special Studies GM 65,000 100.00%6830-019-05 Professional Svcs - Engineering Support 40,000 100.00%
Subtotal Administrative 8,799 12,386 121,011 877.00%
Subtotal excluding Salary and Benefits 8,799 12,386 121,011 877.00%
Total Engineering 186,554 206,004 367,827 78.55%
38 of 86

CENTRAL MARIN SANITATION AGENCY FY 2013-14 Adopted Operating Budget Explanation
Engineering
Account Number Account Description
FY 11-12 Adopted Budget
FY 12-13 Adopted Budget
FY 13-14 Adopted Budget Engineering Budget Explanation
5010-010-05 Salary & Wages 317,455 334,198 339,686 Salaries, 2 step adjustments and merit pay for 3 regular full-time employees. Effective July 1, 2013 2.7% contractual COLA (cost-of-living adjustment).
Transfer to Rev Bond Program 5010-101-10
(139,700) (140,580) (92,870) Transfer of salary expenses for staff assigned to Digester-FOG Facility and other Bond-funded projects (.8 FTE for Department staff capitalizations).
6700-010-05 Meetings/Training 1,000 1,500 3,000 Expenses associated with single-day professional meetings and training seminars and includes registration, mileage, meal allowance, bridge tolls, and other allowed expenses pursuant to the MOU and the Agency's expense reimbursement policy.
6700-020-05 Conferences 4,500 7,000 8,000 Expenses associated with multi-day professional conferences, seminars, and training events. Expenses include registration, travel, accommodations, per diem, and other allowed expenses pursuant to the Agency's expense reimbursement policy.
6805-000-05 Memberships: Professional Affiliations
1,174 1,761 1,761 Professional society memberships and registration fees for Engineering Department staff.
6815-000-05 Office Expenses 500 500 1,000 Engineering office supplies: ink cartridges, paper for large-format printer/plotter, and other miscellaneous office expense.
6815-002-05 Information Systems 625 625 1,250 Annual subscription fees for AutoCAD and other engineering productivity and project management software.
6820-000-05 Printing & Publications 1,000 1,000 1,000 Allowance for printing/shipping/advertising expenses for documents not assigned to specific CIP project contracts, and for copy services at local print shops for copying, scanning, and converting large-format record drawings into electronic formats.
6830-001-05 Professional Svcs – Special Studies
65,000 Professional Services for Board approved studies for 1) Greenhouse Gas Emissions ($25,000) and 2) Recycled Water Feasibility ($40,000) studies.
6830-019-05 Professional Svcs - Engineering Support
40,000 Allowance for general engineering support services not related to specific CIP projects or studies.
Total 186,554 206,004 367,827
Percent Change 39.75% 10.43% 78.55%
39 of 86

Non-Agency: CMSA Services Provided Under Contract to Other Local Agencies The Agency provides services under contract to other local agencies for wastewater treatment services, pump station and collection system maintenance, administration of Fats, Oils and Grease (FOG) Programs and beginning FY 13-14 a Dental Amalgam Program. The Agency also serves as the lead agency in the administration of the Cooperative Safety Director and the County-wide Education Programs. With the exception of the Safety Director Program, the Budget in this cost center is to track the non-employee compensation portion of the contract expenses incurred on behalf of the contracting agencies. Each contracting agency has agreed to reimburse CMSA for the costs of CMSA services rendered in accordance with the terms of their respective contracts. The tables below illustrates the relationship between the amount of projected revenues received from each contracting agency in FY 13-14 and the total amount of estimated expenses incurred by CMSA for its services.
Non-Agency Services
FY 11-12 Adopted Budget
FY 12-13 Adopted Budget
FY 13-14 Adopted Budget
Contract Service Revenues
San Quentin State Prison Wastewater Services - $745,408 $804,909 San Quentin Village Wastewater Services - 24,000 27,976 SD #2 Pump Stations 341,532 368,446 384,854 Safety Director Program 138,031 129,182 88,898 County-wide Education Program 41,160 44,100 47,040 LGVSD - FOG & Pollution Prevention 20,000 20,000 20,000
SD #1 - FOG 10,000 - 17,400
SRSD – FOG 17,000 18,000 20,000 TCSD – FOG 2,600 2,400 1,200 SD #2 – FOG 12,500 9,000 8,000 Novato SD - Dental Amalgam (new) - - 7,000
Total Contract Service Revenues $582,823 $1,360,536 $1,427,277
Contract Service Expenditures (excluding administrative overhead charges)
San Quentin State Prison Wastewater Services - $ 745,408 $ 804,909 San Quentin Village Wastewater Services - 21,700 24,270
SD #2 Pump Stations 293,345 318,615 335,166
County-wide Education Program 41,660 44,100 47,040 Safety Director Program Expenditures 122,990 112,215 64,267 LGVSD - FOG & Pollution Prevention 15,600 15,600 16,393
SD #1 - FOG 9,000 - 13,636 SRSD – FOG 15,300 16,200 18,182 TCSD – FOG 2,028 1,872 984 SD #2 – FOG 9,750 7,020 7,273 Novato SD - Dental Amalgam (new) - 5,738 5,738
Total Contract Service Expenditures $509,673 $1,282,730 $1,337,858
40 of 86

Central Marin Sanitation Agency *Position Code
Adopted FY 2013-14 Operating Budget ASM Administrative Services Manager
Line Item Accounts by Department ESM Environmental Services Manager
SD Safety Director
TPM Treatment Plant Manager
MS Maintenance Supervisor
Non-Agency Expenses: CMSA Services Provided Under Contract to Other Local Agencies
Account # Main Account Description *By
FY 11-12
Adopted
Budget
FY 12-13
Adopted
Budget
FY 13-14
Adopted
Budget
% Change FY14
Adopted
Budget from
FY13 Adopted
ADMINISTRATION
5010-010-06 Salaries & Wages - Safety Director ASM 62,761 62,144 43,341 -30.26%5020-020-06 CalPERS Retirement - Safety Director ASM 18,873 19,308 13,607 -29.52%5020-030-06 SS / Medicare - Safety Director ASM 910 911 630 -30.88%5030-010-06 Employee Health Benefits - Safety Director ASM 15,519 14,550 10,179 -30.04%5030-015-06 Employee Benefits-MARA ASM 922 638 -30.83%5030-020-06 Retiree Health Benefits - Safety Director ASM 6,727 4,062 2,514 -38.11%5065-000-06 Shoes - Safety Director ASM - 200 77 -61.70%6830-016-06 Safety Director Program Expenses SD 18,201 10,119 6,561 -35.16%
6830-017-06 Prof'l Service: Outside Safety SD - - - 0.00%6830-019-06 Professional Services: Safety Consultant - - - 0.00%
Subtotal Administration 122,990 112,215 77,546 -30.90%
ENVIRONMENTAL SERVICES
6821-000-06 Countywide Public Education Program ESM 41,660 44,100 47,040 6.67%
Subtotal Environmental Services 41,660 44,100 47,040 6.67%
MAINTENANCE (excludes labor)
5010-023-03 Overtime SD#2 Contract 8,000 - - 0.00%
6600-000-06 SD-2 Pump Stations MS 52,635 71,935 88,635 23.22%
6600-001-06 SQP Pump Station Maintenance TPM - - 20,000 0.00%
6600-002-06 SQ Village WW System Maintenance TPM - - 6,000 0.00%
Subtotal Maintenance 60,635 71,935 114,635 59.36%
TOTAL Non-Agency Expenses 225,285 228,250 239,221 4.81%
This budget center is for accounting use only. The Agency is reimbursed
(revenues) for costs that are incurred. Does not include CMSA labor
expense for contract services provided.
41 of 86
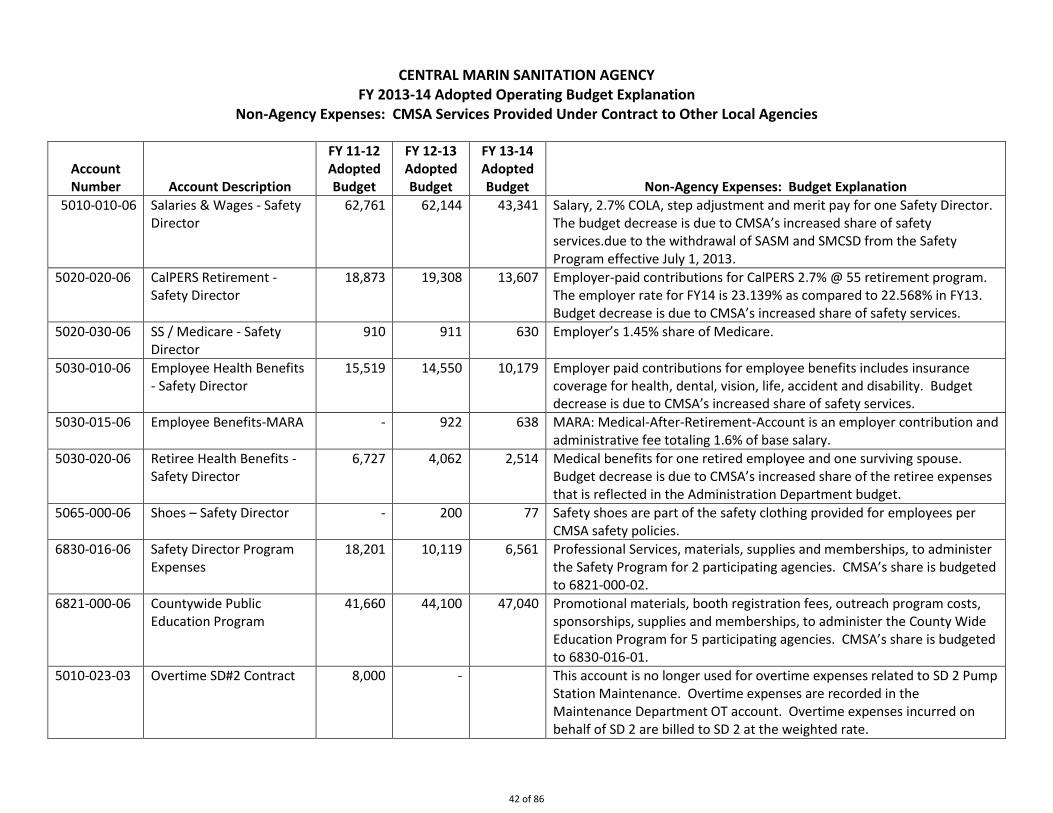
CENTRAL MARIN SANITATION AGENCY FY 2013-14 Adopted Operating Budget Explanation
Non-Agency Expenses: CMSA Services Provided Under Contract to Other Local Agencies
Account Number Account Description
FY 11-12 Adopted Budget
FY 12-13 Adopted Budget
FY 13-14 Adopted Budget Non-Agency Expenses: Budget Explanation
5010-010-06 Salaries & Wages - Safety Director
62,761 62,144 43,341 Salary, 2.7% COLA, step adjustment and merit pay for one Safety Director. The budget decrease is due to CMSA’s increased share of safety services.due to the withdrawal of SASM and SMCSD from the Safety Program effective July 1, 2013.
5020-020-06 CalPERS Retirement - Safety Director
18,873 19,308 13,607 Employer-paid contributions for CalPERS 2.7% @ 55 retirement program. The employer rate for FY14 is 23.139% as compared to 22.568% in FY13. Budget decrease is due to CMSA’s increased share of safety services.
5020-030-06 SS / Medicare - Safety Director
910 911 630 Employer’s 1.45% share of Medicare.
5030-010-06 Employee Health Benefits - Safety Director
15,519 14,550 10,179 Employer paid contributions for employee benefits includes insurance coverage for health, dental, vision, life, accident and disability. Budget decrease is due to CMSA’s increased share of safety services.
5030-015-06 Employee Benefits-MARA - 922 638 MARA: Medical-After-Retirement-Account is an employer contribution and administrative fee totaling 1.6% of base salary.
5030-020-06 Retiree Health Benefits - Safety Director
6,727 4,062 2,514 Medical benefits for one retired employee and one surviving spouse. Budget decrease is due to CMSA’s increased share of the retiree expenses that is reflected in the Administration Department budget.
5065-000-06 Shoes – Safety Director - 200 77 Safety shoes are part of the safety clothing provided for employees per CMSA safety policies.
6830-016-06 Safety Director Program Expenses
18,201 10,119 6,561 Professional Services, materials, supplies and memberships, to administer the Safety Program for 2 participating agencies. CMSA’s share is budgeted to 6821-000-02.
6821-000-06 Countywide Public Education Program
41,660 44,100 47,040 Promotional materials, booth registration fees, outreach program costs, sponsorships, supplies and memberships, to administer the County Wide Education Program for 5 participating agencies. CMSA’s share is budgeted to 6830-016-01.
5010-023-03 Overtime SD#2 Contract 8,000 - This account is no longer used for overtime expenses related to SD 2 Pump Station Maintenance. Overtime expenses are recorded in the Maintenance Department OT account. Overtime expenses incurred on behalf of SD 2 are billed to SD 2 at the weighted rate.
42 of 86

Account Number Account Description
FY 11-12 Adopted Budget
FY 12-13 Adopted Budget
FY 13-14 Adopted Budget Non-Agency Expenses: Budget Explanation
6600-000-06 SD 2 Pump Stations 52,635 71,935 88,635 Non-labor expenses. This account is for all expenses incurred to maintain the SD 2’s pump stations such as equipment, maintenance parts, materials, repairs, and supplies and excludes labor expenses. SD 2 reimburses the Agency for these expenditures.
6600-001-06 San Quentin State Prison Pump Station Maintenance
- - 20,000 Non-labor expenses. The State reimburses the Agency for all expenses incurred to maintain the Prison’s pump station such as equipment, maintenance parts, materials, repairs, and supplies and excludes labor expenses.
6600-002-06 SQ Village Wastewater System Maintenance
- - 6,000 Non-labor expenses. The County reimburses the Agency for all expenses incurred to maintain the Village’s wastewater system such as equipment, maintenance parts, materials, repairs, and supplies and excludes labor expenses.
Total 225,285 228,250 236,181
Percent Change -9.92% 1.32% 3.47%
43 of 86

Capital Improvement Program 10 Year Capital Improvement Program – Summary of Changes
10 Year CIP & Revenue Bond Program Capital Improvement Project Descriptions by Budget Account
Detailed Project Descriptions for Selected Capital Projects
44 of 86
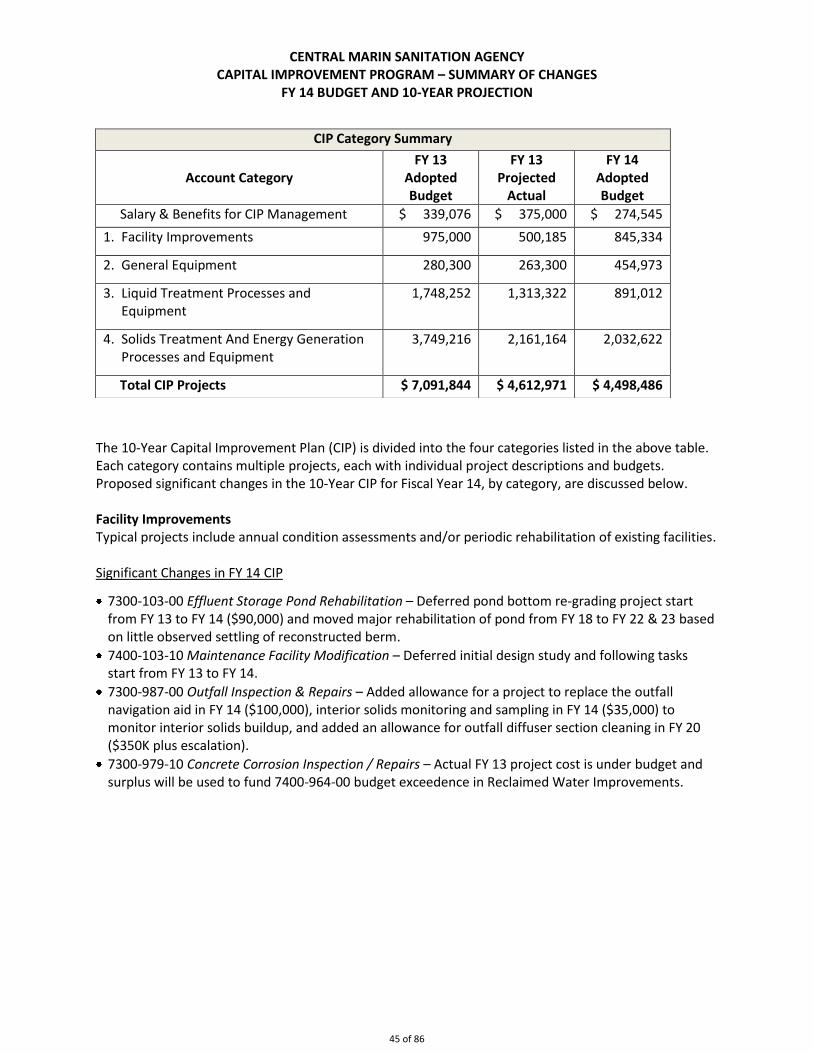
CENTRAL MARIN SANITATION AGENCY CAPITAL IMPROVEMENT PROGRAM – SUMMARY OF CHANGES
FY 14 BUDGET AND 10-YEAR PROJECTION
The 10-Year Capital Improvement Plan (CIP) is divided into the four categories listed in the above table. Each category contains multiple projects, each with individual project descriptions and budgets. Proposed significant changes in the 10-Year CIP for Fiscal Year 14, by category, are discussed below. Facility Improvements Typical projects include annual condition assessments and/or periodic rehabilitation of existing facilities. Significant Changes in FY 14 CIP
7300-103-00 Effluent Storage Pond Rehabilitation – Deferred pond bottom re-grading project start from FY 13 to FY 14 ($90,000) and moved major rehabilitation of pond from FY 18 to FY 22 & 23 based on little observed settling of reconstructed berm.
7400-103-10 Maintenance Facility Modification – Deferred initial design study and following tasks start from FY 13 to FY 14.
7300-987-00 Outfall Inspection & Repairs – Added allowance for a project to replace the outfall navigation aid in FY 14 ($100,000), interior solids monitoring and sampling in FY 14 ($35,000) to monitor interior solids buildup, and added an allowance for outfall diffuser section cleaning in FY 20 ($350K plus escalation).
7300-979-10 Concrete Corrosion Inspection / Repairs – Actual FY 13 project cost is under budget and surplus will be used to fund 7400-964-00 budget exceedence in Reclaimed Water Improvements.
CIP Category Summary
Account Category
FY 13 Adopted Budget
FY 13 Projected
Actual
FY 14 Adopted Budget
Salary & Benefits for CIP Management $ 339,076 $ 375,000 $ 274,545
1. Facility Improvements 975,000 500,185 845,334
2. General Equipment 280,300 263,300 454,973
3. Liquid Treatment Processes and Equipment
1,748,252 1,313,322 891,012
4. Solids Treatment And Energy Generation Processes and Equipment
3,749,216
2,161,164 2,032,622
Total CIP Projects $ 7,091,844 $ 4,612,971 $ 4,498,486
45 of 86

CENTRAL MARIN SANITATION AGENCY CAPITAL IMPROVEMENT PROGRAM – SUMMARY OF CHANGES
FY 14 BUDGET AND 10-YEAR PROJECTION
General Equipment This category contains vehicles and electrical, process control, laboratory, and other equipment that supports operations throughout the treatment plant.
Significant Changes in FY 14 CIP
7300-672-00 Process Control and Security – The SCADA replacement project was initiated in FY 13 and will complete in FY 15.
7410-603-00 Telephone System – This account is consolidated into 7410-851-00 IT Hardware and Communications Equipment due to minor equipment costs for new telephone system.
7450-105-00 Electrical Distribution System Rehabilitation – In FY 14 this account includes a condition assessment of the original Treatment Plant wiring and motor control centers and having an outside
consultant collate several existing Arc Flash/Short Circuit studies into one coordinated plant-wide
study.
Liquid Treatment Processes and Equipment This category includes projects supporting liquid treatment processes (headworks, grit removal, primary treatment, secondary treatment, disinfection and dechlorination) and their supporting equipment. Significant Changes in FY 14 CIP
7300-680-00 Grit Dewatering System – This account has been combined with 7300-727-00 Headworks Equipment and will be removed from the FY 15 CIP.
7300-981-00 Odor Control System Improvements – Deferred project start from FY 14 to FY 15 based on condition assessment results and unexpected delays in other priority projects.
7300-982-10 Aeration Blower Replacement – Added allowance in FY 14 to complete optimization of blower capacity ($55,000).
Solids Treatment and Energy Generation Processes and Equipment This category includes projects supporting solids treatment processes (sludge thickening, anaerobic digestion, biosolids dewatering, biogas handling, and cogeneration) and their supporting equipment. Significant Changes in FY 14 CIP
7300-691-00 Digester Inspection and Cleaning – Allowances added in FY 14 and 15 for one-year warrantee inspection ($308,337 Total), and added allowance to clean and inspect one digester and replace membrane cover if necessary in FY 23.
7300-800-00 FOG/F2E Facility Maintenance – Added an annual allowance ($20,000) beginning in FY 14 to provide preventive maintenance on equipment in this facility.
7300-810-00 Media Replacement and Disposal – This is a new account to provide for media replacement for gas treatment systems (differing amounts reflect alternating years for media types).
7300-715-00 Centrifuge Maintenance – Add an allowance in FY 23 ($1,572,079) to replace existing centrifuges which may be moved out based on a future condition assessment in FY 22.
7300-964-10 Sludge Thickening Improvements – Deferred implementing this project until FY 14 due to delays in other high priority projects.
46 of 86

Central Marin Sanitation Agency
Capital Improvement Program
FY 14 Budget and 10-Year Forecast
Proposed Prior Adopted Projected 10-year CIP
GL Account
Number Delivery FYs' Budget FY 13
1
Adopted 2 3 4 5 6 7 8 9 10 Total Project
PM* Method Costs For FY 13 Actuals FY 14 FY 15 FY 16 FY 17 FY 18 FY 19 FY 20 FY 21 FY 22 FY 23 FY 14 - FY 23 Totals
Facility Improvements
7300-103-10 EM Effluent Storage Pond Rehabilitation (1) (3) IB/FB 4,564 85,000 4,296 90,000 - - - - - - - 36,781 1,174,059 1,300,839 1,309,699
7300-674-00 TPM CMMS and AM Systems PO - 20,000 11,047 20,294 10,409 5,339 5,476 5,618 5,763 5,911 6,064 6,220 6,381 77,474 -
7300-690-00 EIS Elevator Repairs PO - 15,000 12,500 12,800 13,130 13,469 13,817 14,173 14,539 14,914 15,298 15,693 16,098 143,931 -
7300-956-00 EM General Industrial Coating/Sealing IB - 130,000 90,598 101,470 104,088 133,467 136,910 140,442 144,066 177,339 90,957 124,405 127,615 1,280,760 -
7300-979-10 EM Concrete Corrosion Inspection/Repairs (1) (3) FB 61,961 396,000 170,591 244,543 192,563 - - - - - - - - 437,105 669,657
7300-987-00 EM Outfall Inspection & Repairs M/IB - 27,000 16,920 135,000 340,368 28,829 29,573 30,336 31,118 386,600 32,745 33,589 34,456 1,082,613 -
7300-988-00 EM Cathodic Protection M 5,400 2,000 5,250 3,349 4,164 12,279 2,191 6,067 1,268 4,020 13,947 2,488 6,891 56,662 -
7400-103-10 EM Maintenance Facility Modifications (1) (3) FB 6,884 125,000 - 80,600 312,264 - - - - - - - - 392,864 399,748
7400-956-00 EM Facility Paving/Site work PO/IB - 35,000 20,869 35,515 36,431 37,371 38,335 39,324 40,338 41,379 42,447 43,542 44,665 399,346 -
7400-960-00 EM Facility Roofs Rehabiliation (1) FB - - - - 20,818 747,414 - - - - - - - 768,231 768,231
7400-965-00 TPM Primary Clarifier Improvement (1) (3) M/IB 90,550 140,000 168,114 121,764 124,906 - - - - - - - - 246,670 505,334
Subtotal - Facility Improvements Subtotal - Facility Improvements 975,000 500,185 845,334 1,159,138 978,167 226,301 235,960 237,092 630,163 201,458 262,719 1,410,165 6,186,496
General Equipment
7300-672-00 ISA Process Control & Security Systems M - 77,000 76,500 140,000 61,548 50,717 38,335 39,324 40,338 41,379 42,447 43,542 - 497,630 -
7300-683-00 MS Above Ground Fuel Storage Tanks IB - - 157 - 102,580 - - - - - - - - 102,580 - 7410-603-00 ISA Telephone System M - 2,000 382 - - - - - - - - - - - - 7410-851-00 ISA IT Hardware and Communication Equip M - 13,800 11,012 16,032 16,446 22,209 17,305 17,752 18,210 18,680 25,226 19,656 20,163 191,679 -
7420-701-00 MS Agency Vehicle Replacement FB - 47,000 30,176 55,000 41,635 42,709 51,478 33,706 23,051 43,744 36,383 37,322 38,285 403,312 -
7430-958-00 ESM Laboratory Equipment PO - 14,500 17,635 27,397 8,327 6,940 4,381 6,741 10,949 4,729 7,277 7,464 7,657 91,862 -
7450-002-00 EIS Electrical Equipment M/IB - 100,000 101,064 106,544 109,292 112,112 54,764 56,177 57,626 29,557 30,319 31,101 31,904 619,396 -
7450-102-00 EIS Process Instrumentation M - 26,000 26,374 45,000 36,431 37,371 38,335 39,324 40,338 41,379 42,447 43,542 44,665 408,832 -
7450-105-00 EIS Electrical Distribution System Rehabilitation PSA/IB - - - 65,000 26,022 26,693 60,240 61,795 63,389 65,024 66,702 68,423 70,188 573,478 -
Subtotal - General Equipment 280,300 263,300 454,973 402,282 298,752 264,839 254,819 253,902 244,492 250,800 251,050 212,862 2,888,769
Liquids Treatment Equipment and Systems
7300-641-00 MS Effluent Pump Station Maintenance M - 7,000 8,280 7,103 7,286 7,474 7,667 7,865 8,068 8,276 8,489 8,708 8,933 79,869 -
7300-680-00 MS Grit Dewatering System M/IB - 40,000 36,200 - - - - - - - - - - - -
7300-685-00 MS Bio-Tower Rotary Distributor Replacement (1) IB - - - - - 115,749 - - - - - - - 115,749 115,749
7300-700-00 MS Plant Pumps M - 70,000 96,840 120,000 72,862 74,741 76,670 78,648 80,677 82,758 84,894 87,084 89,331 847,664 -
7300-709-00 MS Odor Control Equipment Maintenance M - - - - - 21,045 - - - - - - - 21,045 -
7300-719-00 MS Chemical Pumps M - 50,000 54,745 50,735 52,044 53,387 54,764 56,177 57,626 59,113 60,638 62,203 63,808 570,495 -
7300-720-00 MS Gates Rehabilitation M/IB - 100,000 87,026 101,470 104,088 106,773 109,528 112,354 115,253 118,226 121,276 124,405 127,615 1,140,989 -
7300-727-00 MS Headworks Equipment M - 50,000 109,190 50,735 52,044 53,387 71,193 73,030 74,914 59,113 60,638 62,203 63,808 621,065 - 7300-981-00 EM Odor Control System Improvements (1) FB - - - 50,000 114,890 942,830 - - - - - - - 1,107,720 1,107,720 7300-982-10 EM Aeration Blower Replacement (1) (3) FB 562,728 571,252 132,020 55,000 - - - - - - - - - 55,000 749,748 7300-983-00 MS Process Tank Maintenance M/IB - 90,000 101,952 91,323 93,679 96,096 98,575 101,119 103,727 106,404 109,149 111,965 114,854 1,026,890 -
7300-990-00 MS SecondaryClarifiers Turntable Drives IB - - - - 93,679 96,096 98,575 - - - - - - 288,351 -
7400-964-00 TPM Reclaimed Water System Improvements (1) (3) FB 2,517 435,000 565,856 20,419 - - - - - - - - - 20,419 588,792
7400-966-00 EM Critical Buried Pipe Inspection/Repairs (1) (3) IB - 225,000 - 225,000 104,088 - - - - - - - - 329,088 329,088
7430-855-00 MS Chemical Tanks M/IB - 35,000 46,213 35,515 36,431 37,371 43,811 78,648 63,389 65,024 66,702 49,762 - 476,653 - 7430-857-00 MS Piping, Valves & Operators M - 75,000 75,000 83,713 85,873 88,088 90,361 92,692 95,083 97,537 100,053 102,634 105,282 941,316 - 7450-104-10 EIS Influent Flow Meter Improvement PSA - - - - - 21,355 - - - 23,645 - - - 45,000
Subtotal - Liquids Treatment Equipment and Systems 1,748,252 1,313,322 891,012 816,963 1,714,392 651,145 600,532 598,738 620,097 611,840 608,964 573,630 7,687,312
47 of 86

Central Marin Sanitation Agency
Capital Improvement Program
FY 14 Budget and 10-Year Forecast
Proposed Prior Adopted Projected 10-year CIP
GL Account
Number Delivery FYs' Budget FY 13
1
Adopted 2 3 4 5 6 7 8 9 10 Total Project
PM* Method Costs For FY 13 Actuals FY 14 FY 15 FY 16 FY 17 FY 18 FY 19 FY 20 FY 21 FY 22 FY 23 FY 14 - FY 23 Totals
Solids Treatment and Energy Generation Equipment and Systems
7300-678-00 EM Emergency Generator Assessment &
Improvement (1) PSA - - - 10,000 52,044 266,933 - 1,685,310 - - - - - 2,014,287 2,014,287
7300-691-00 OS Digester Inspection, Cleaning & Cover
Replacement FB - - - 152,205 156,132 - - - - - - - 584,813 893,150 -
7300-800-00 MS FOG-F2E Facility Maintenance (placeholder) M - - - 20,000 20,516 21,045 21,588 22,145 22,717 23,303 23,904 24,521 25,153 224,892 - 7300-810-00 MS Media Replacement/Disposal M - - 32,500 28,210 34,199 29,684 35,986 31,235 37,867 32,868 39,846 34,586 336,980
7300-715-00 MS Centrifuge Maintenance M - 40,000 40,038 53,037 37,992 38,972 39,978 41,009 28,813 29,557 44,266 61,302 1,572,079 1,947,004 -
7300-721-00 MS Plant Heat Exchangers M - 1,000 1,214 1,015 16,654 1,068 1,095 1,124 1,153 340,492 1,213 1,244 1,276 366,332 - 7300-722-00 MS Cogeneration Maintenance (3) M/FB - 575,000 550,792 300,000 187,358 44,311 306,679 51,402 207,455 427,980 1,702,819 1,617,506 229,707 5,075,218 -
7300-724-00 MS Hot Water Systems M/IB - 20,000 14,038 42,617 104,088 12,813 13,143 13,482 13,830 14,187 14,553 14,929 127,615 371,258 -
7300-725-00 MS Boilers Rehabilitation or Replacement FB - - - - - 64,064 - 238,190 - - - - - 302,254 -
7300-726-00 MS Sludge Heat Exchanger M - - - - - - - - - - - - - - -
7300-957-00 MS Waste Gas Burners M - - - - 20,516 - - - - - - - - 20,516 - 7300-977-00 MS Sludge Recirculating Pump Grinders M/SP - 10,000 - 24,353 15,613 16,016 16,429 16,853 17,288 17,734 18,191 18,661 19,142 180,281 - 7300-978-00 MS Biosolids Hoppers Maintenance M/SP - - - - 7,694 - 8,096 - 8,519 - 8,964 - 9,432 42,704 -
7300-964-10 GM/ EM Sludge Thickening System Replacement (1) (3) FB - 400,000 - 405,880 3,330,814 - - - - - - - - 3,736,694 3,736,694
7430-957-10 GM Digester Improvements - FOG Facility (1) (3) FB 5,112,510 2,703,216 1,555,082 991,016 - - - - - - - - - 991,016 7,658,608
Subtotal - Solids Treatment and Energy Generation Equipment and Systems 3,749,216 2,161,164 2,032,622 3,977,630 499,421 436,692 2,105,502 331,009 891,119 1,846,779 1,778,007 2,603,804 16,502,586
Revenue Bond Coverage to AM
CMSA Staff Costs for CIP(2) 339,076 375,000 274,545 180,044 185,445 191,009 196,739 202,641 208,720 214,982 221,431 228,074 2,103,632
Annual CIP Totals 7,091,844 4,612,971 4,498,486 6,536,057 3,676,178 1,769,986 3,393,551 1,623,382 2,594,591 3,125,858 3,122,173 5,028,535 35,368,795
35,368,795
* PM indicates the project manager for the account.
(1) BOLD items are individual Capital Improvement Projects, or larger, nonrecurring maintenance projects.
(2) CMSA Staffing costs (compensation and benefits) for identified CIP projects.
(3) CIP Projects in FY 14 that will have staff time charged to the CIP.
Delivery Methods Projected Annual Escalation Rate: 2.58% (Based on rolling 5-year average of ENR San Francisco CCI Cost Index annual changes 12/2008-12/2012.).
M Maintenance project, self performed Escalation Factors 1.0258 1.0523 1.0794 1.1073 1.1358 1.1651 1.1952 1.2260 1.2577
PSA Professional Services Agreement PO Purchase Order IB Informally Bid FB Formally Bid
48 of 86

CENTRAL MARIN SANITATION AGENCY
Revenue Bond Program
Prepared on June 7, 2013 for the FY 2013-14 Adopted Budget
Actual Actual Actual Actual Actual Actual Estimated EstimatedGL Account Expenditures Expenditures Expenditures Expenditures Expenditures Expenditures Expenditures Expenditures Project
Number PM Bond Program Description FY 06-07 FY 07-08 FY 08-09 FY 09-10 FY 10-11 FY 11-12 FY 12-13 FY 13-14 Total
I. Wet Weather Improvement Project (WWIP)
5010-101-10 FM Staff Salary & Benefits 170,373 155,170 261,269 270,046 856,859 7300-100-10 GM Pre Design & Reimb to CMSA 901,708 - - - 901,708 7300-100-10 GM Final Design 3,822,120 61,116 - - 3,883,236 7300-100-10 GM Peer Review 168,956 4,559 - - 173,515 7300-100-10 GM Construction - Contract - 12,568,048 13,413,323 9,568,634 35,550,004 7300-100-10 GM Construction - Contract Change Orders - 41,446 707,050 761,258 1,509,754 7300-100-10 GM Construction Management 83,291 569,274 1,102,452 1,128,587 4,713 2,888,316 7300-100-10 GM ESDC & SCADA Programming - 700,341 805,428 605,213 33,153 2,144,136 7300-100-10 GM Construction Permits, Legal, Administration 321,821 245,742 54,756 87,880 10,070 720,268
Subtotal WWIP 5,468,269 14,345,696 16,344,278 12,421,618 47,935 - - - 48,627,796 FY 2006-07 figures include reimbursements from the Revenue Bond for expenses incurred in FY 2005 and 2006
II. Outfall Projects7300-102-10 EM Outfall Improvements 512 215,284 598,159 813,955 7300-102-10 EM Outfall Solids Removal 8,727 382,431 391,158 7300-102-10 EM Outfall Improvements Phase II - Investigations 6,825 97,481 104,306
Subtotal Outfall 512 215,284 613,711 479,912 - - - - 1,309,419
IIIA. Digester Improvements - FOG Facility Project7430-957-10 GM Studies, Predesign, Design 64,473 232,385 328,076 624,934 7430-957-10 EM Construction - GSE 3,805,396 1,290,188 691,416 5,787,000 7430-957-10 EM Construction Change Order (Allowance) 211,476 86,124 134,000 431,600 7430-957-10 EM Eng Svcs During Construction - K/J 72,548 263,561 44,761 42,600 423,470 7430-957-10 EM Construction Mgmt - Harris 11,735 73,962 67,453 80,000 233,150
7430-957-10EM
All Other Digester & FOG: Chemicals, Biosolids
hauling 368 48,530 66,557 43,000 158,455
Subtotal Digester-FOG - - 64,473 232,385 412,728 4,402,925 1,555,082 991,016 7,658,608
IIIB. High Priority Capital Projects
5010-101-10 FM Staff Salary & Benefits - - - 280,133 337,978 375,000 993,111
6830-015-10 GM Prof'l Services: Legal-Bond Counsel - 8,330 - 8,330
6859-000-10 FM Bank Fees - Revenue Bond 1,700 1,400 1,300 4,400
7300-103-10 EM Effluent Storage Pond Imprvmnt 4,578 4,282 8,860
7400-103-10 EM Maintenance Building Modification Project - 6,885 - 6,885
7300-979-10 EM Concrete Corrosion Inspection/Repairs 18,075 30,999 170,591 219,665
7300-982-10 EM Aeration Blower Replacement 69,798 492,924 132,020 694,742
7300-964-10 GM Sludge Thickening Improvements - - - - - - - various EM Projects from Capital Improvement Schedule - - 748,235 761,037 1,475,996 2,985,268
Subtotal Other Revenue Bond Projects - - - - 1,117,940 1,644,131 2,159,189 - 4,921,261
49 of 86

CENTRAL MARIN SANITATION AGENCY
Revenue Bond Program
Prepared on June 7, 2013 for the FY 2013-14 Adopted Budget
Actual Actual Actual Actual Actual Actual Estimated EstimatedGL Account Expenditures Expenditures Expenditures Expenditures Expenditures Expenditures Expenditures Expenditures Project
Number PM Bond Program Description FY 06-07 FY 07-08 FY 08-09 FY 09-10 FY 10-11 FY 11-12 FY 12-13 FY 13-14 Total
IV. Completed Projects7300-960-10 Dewater improvement phase 4: polymer system 852,044 852,044 7430-858-10 Headworks: Vactor Station 673,896 673,896
7450-100-10 &
7450-101-10Process Flow Meters 16,383 79 16,462
N/A Cost of Bond Issuance 816,442 816,442 7300-101-10 Pond Drain Pump Replacement 4,726 186,246 190,972 7300-103-10 Effluent Storage Pond Imprvmnt 15,572 1,580,642 26,902 1,623,116 7300-725-10 Boilers Rehabilitation 81,848 81,848 7450-103-10 Switchgear Rehabilitation 124,806 24,062 148,868 7300-989-10 Air Compressor In Gallery A 6,102 2,249 8,351 7430-855-10 Chemical Tanks 18,091 2,449 30,270 50,810 7450-102-10 Process Instrumentation 11,278 11,278 7300-201-10 Secondary Solids Control 8,422 1,653 10,075 7300-958-10 Variable Frequency Drives 14,429 23,117 8,119 45,666 7300-708-10 Waste Activated Sludge Pumps 41,638 19,769 36,114 97,522
7300-202-10 Barscreen and Washer Compactor 6,627 16,307 243,052 1,271,933 1,537,920
7300-250-10 Emergency Generator & Dechlorination - 29 118,459 89,095 207,583
7450-104-10 Influent Flow Meter Replacement - - - - 61,410 - 61,410
7300-968-10 Biosolids to Energy - - 9,262 37,050 27,787 - 74,099
7400-102-10 Agency Capital Master Plan - - - 54,199 125,359 - 179,558
7400-101-10 Admin Building Modifications - 6,857 63,957 1,077,749 69,142 1,217,705
Subtotal Completed Projects 2,426,631 1,982,992 582,205 1,552,349 1,292,305 69,142 - - 7,905,624
TOTAL Expenditures 7,895,412 16,543,972 17,604,667 14,686,264 2,870,908 6,116,198 3,714,271 991,016 70,422,707
Actual (Est ) Interest Earnings * 2,196,028 2,363,092 618,561 55,686 25,959 16,174 7,100 2,000 5,284,600 Int earnings on Project Funds @4.3% (Est) 1,812,354 2,333,403 1,313,535 750,609
Arbitrage - Refund of excess int earnings to IRS 383,674 29,689 (694,974) (694,924)
REVENUE BOND PROGRAM SUMMARY
Total Bond Proceeds-Initial 65,123,108 Projected interest earnings 5,284,600
Total Financing 70,407,708
Total Revenue Bond Expenditures 70,422,707
Remaining Balance (est) (14,999)
no longer applicable
no longer applicable
50 of 86

CENTRAL MARIN SANITATION AGENCY CAPITAL IMPROVEMENT PROGRAM - ACCOUNT / PROJECT DESCRIPTIONS
ADOPTED FY 14 BUDGET AND 10-YEAR PROJECTION
Facility Improvements ACCOUNT NUMBER
ACCOUNT / PROJECT TITLE
ACCOUNT / PROJECT DESCRIPTION
7300-103-10 Effluent Storage Pond Rehabilitation
See Full Page Description
7300-674-00 CMMS and AM Systems
Over the past several years the Agency has implemented a Strategic Asset Management Plan using a subscription based software package (Nexgen™) to incorporate key Plan elements: condition assessment of critical assets, inventory control, procurement management, and time and budget tracking by asset, process, or project.
This account includes licensing fees, allowance for professional support services, and purchasing two data tablets annually. Full implementation will realize overall cost savings for the Agency by facilitating the identification and application of needed preventive maintenance, reducing the number of failure - driven repair tasks, and improving time and inventory tracking.
FY 14 Nexgen™ License Fees $5,000 and two additional data tablets. FY 15 – 23 Nexgen License Fees and replace two tablets per year.
7300-690-00 Elevator Repairs The elevator in solids handling building is inspected regularly. This account includes annual inspections and preventive maintenance of the hoist-way plus a rolling one-year allowance of $10,000 should repairs be needed to meet OSHA requirements.
FY 14 Annual Preventive Maintenance and System Inspection FY 15 – 23 Annual Preventive Maintenance and System Inspection.
7300-956-00 General Industrial Coating/Sealing
Scheduled industrial coating repair program for process structures and metal equipment, and Treatment Plant deck traffic coatings. Projects aligned with other equipment upgrades (see Primary Clarifier Improvement and Secondary Clarifier Turntable Drive projects), with actual schedule subject to annual coating condition assessments.
FY 14 Primary Clarifier #2 FY 15 Primary Clarifier #4 FY 16 Secondary Clarifier #4 FY 17 Secondary Clarifier #1 FY 18 Secondary Clarifier #3 FY 19 Secondary Clarifier #2 FY 20 Headworks equipment FY 21 Repair wear coats on Headworks and Secondary Clarifier decks FY 22 Primary Clarifier #5 FY 23 Primary Clarifier #1
51 of 86

CENTRAL MARIN SANITATION AGENCY CAPITAL IMPROVEMENT PROGRAM - ACCOUNT / PROJECT DESCRIPTIONS
ADOPTED FY 14 BUDGET AND 10-YEAR PROJECTION
Facility Improvements ACCOUNT NUMBER
ACCOUNT / PROJECT TITLE
ACCOUNT / PROJECT DESCRIPTION
7300-979-10 Concrete Corrosion Inspection/Repairs
See Full Page Description
7300-987-00 Outfall Inspection & Repairs
Ongoing underwater inspection and maintenance of the marine outfall diffuser section. Activities include diver inspections of diffusers and risers, survey of diffuser risers’ levels above shifting bay floor sediments, extending or replacing risers and diffusers as needed, and monitoring - and periodically removing - solids deposition inside diffuser section. This account also includes a one-time allowance in FY 14 replace the outfall diffuser section navigational light that was found to have collapsed in early 2013.
FY 14 Routine mudline inspection, interior solids inspection, and riser extension or replacement, as needed. $100,000 allowance to design and replacement of Rawl’s Light (diffuser section navigational aid).
FY 15 Allowance for cleaning outfall diffuser section based on apparent rate of solids buildup since duckbill check valve retrofit in 2002, to be confirmed by interior solids inspection in FY 14. Cost estimate based on escalating the $300,000 costs from FY 09. If the annual interior solids monitoring indicates the solids accumulation is minor, cleaning will be deferred until a future year based on the solids accumulation rate since last cleaning.
FY 16 – FY 19 Routine inspection and riser extension or replacement, as needed. FY 20 Allowance for outfall diffuser section cleaning. If the annual interior solids monitoring indicates the solids
accumulation is minor, it will be deferred until a future year based on the solids accumulation rate from FY 15to FY 19.
FY 21 – FY 23 Routine inspection and riser extension or replacement, as needed.
7300-988-00 Cathodic Protection
Periodic cathodic protection monitoring of the land portion of the Marine Outfall, sections of the Ross Valley Interceptor (including the tunnel section), the San Rafael interceptor, various buried pipelines at the Treatment Plant. CMSA also performs offsite monitoring of San Rafael Sanitation District (SRSD) Simms Force Main and the South Francisco casing; San Rafael reimburses CMSA’s costs for these, and that amount is not shown in the CIP.
This line also includes routine adjustment of, and minor repairs to, impressed-current cathodic protection systems. Costs vary from year to year due to varying monitoring and testing frequencies for different facilities, and costs are higher in FY 16 and FY 21 to perform the close-interval survey over the land section of the Outfall pipeline.
7400-103-10 Maintenance Facility Modifications
See Full Page Description
7400-956-00 Facility Paving/Site work
This account is an allowance for minor paving repairs and associated site work on internal plant roads, walkways, parking lots, other pavement, and re-grading, cleaning, and replacing gravel in drainage ditches
52 of 86

CENTRAL MARIN SANITATION AGENCY CAPITAL IMPROVEMENT PROGRAM - ACCOUNT / PROJECT DESCRIPTIONS
ADOPTED FY 14 BUDGET AND 10-YEAR PROJECTION
Facility Improvements ACCOUNT NUMBER
ACCOUNT / PROJECT TITLE
ACCOUNT / PROJECT DESCRIPTION
7400-960-00 Facility Roofs Rehabilitation
See Full Page Description
7400-965-00 Primary Clarifier Improvements
See Full Page Description
General Equipment
ACCOUNT NUMBER
ACCOUNT / PROJECT TITLE
ACCOUNT / PROJECT DESCRIPTION
7300-672-00 Process Control & Security Systems
This account includes allowances for completion of the SCADA software upgrade begun in FY 13, purchasing critical spare PLCs (Process Logic Controllers) in FY 14, and ongoing replacement, upgrades, and improvements to the plant’s process control system (new instruments, plant-wide servers and computers, and PLC and HMI hardware and software).
This account also includes regular maintenance and upgrades of security systems at the Treatment Plant, including access cards, readers and controllers, alarms, security cameras, and data storage hardware and software. This account also includes an allowance for hillside maintenance designed to enhance homeless encampment eradication. Identify and purchase critical spares.
FY 14 Complete SCADA software upgrade project begun in FY 13, including an allowance for outside consultant assistance for integration; purchase needed replacement PLCs ,HMI’s, and other hardware as needed; purchase critical spare PLCs; and upgrade one Centrifuge control panel to current PLC/HMI equipment. Purchase Gas Membrane Cover System PLC-HMI critical spares
FY15 Routine PLC and HMI hardware replacement. Upgrade two Centrifuge control panels to current PLC/HMI equipment. Identify and purchase critical spares
FY 16 Routine PLC and HMI hardware replacement and replace servers. Replace master dewatering PLC in the Solids Handling Building. Identify and purchase critical spares
FY 17 – 21 Routine PLC and HMI hardware replacement. Identify and purchase critical spares FY 22 Routine PLC and HMI hardware replacement and replace servers. Identify and purchase critical spares FY 23 Routine PLC and HMI hardware replacement. Identify and purchase critical spares
7300-683-00 Above Ground Fuel Storage Tanks
This account includes a rolling one-year allowance to replace one of the existing underground fuel storage tanks with an above ground storage tank. This replacement would be mandated either by one of the relatively new underground tanks failing or by a change in regulatory requirements. Should regulatory requirements change to require replacement, this line will be augmented to accommodate both tanks’ replacement.
53 of 86

CENTRAL MARIN SANITATION AGENCY CAPITAL IMPROVEMENT PROGRAM - ACCOUNT / PROJECT DESCRIPTIONS
ADOPTED FY 14 BUDGET AND 10-YEAR PROJECTION
General Equipment
ACCOUNT NUMBER
ACCOUNT / PROJECT TITLE
ACCOUNT / PROJECT DESCRIPTION
7410-603-00 Telephone System This account has been combined with 7410-851-00 (IT Hardware and Communications Equipment) and will be removed from the FY 15 CIP.
7410-851-00 IT Hardware and Communication Equip
Routine maintenance repairs, and regular replacement of Information Technology hardware and software (office computers, printers, scanners, digital telephone equipment and its supporting servers) and voice radio equipment used by Agency staff. This line includes funds formerly contained in GL 7410-603-00 (Telephone System).
FY14 Replace six office computers, purchase new audio/visual equipment for CMSA Boardroom. FY 15 Replace six office computers, upgrade Operations Control room SCADA monitors, scheduled server replacement,
and RFQ for consultant to assist with Treatment Plant voice radio equipment. FY 16 Replace plant voice radio equipment, replace six office computers and/or plant SCADA Monitors. FY 17 – 20 Annual computer replacements at six office computers per year. FY 21 Scheduled replacement of servers. FY 22 – 23 Digital telephone system upgrade or replacement.
7420-701-00 Vehicle Equipment Replacement
Purchase new equipment or vehicles as required - passenger vehicles, trucks, forklift, bicycles and electric carts as they reach or exceed their expected useful lives – and perform scheduled repairs of this equipment as needed. This account formerly included allowances for hybrid vehicle battery replacement, but an extended warranty was purchased for them in FY 13.
FY 14 Replace natural gas F150 pickup and Toyota Highlander , and five bicycles. FY 15 Replace one carpool Honda and one electric cart. FY 16 Replace one carpool Honda, one electric cart, and five bicycles. FY 17 Replace Pump Station Ford Ranger and replace one electric cart FY 18 Replace Environmental Services Ford Explorer FY 19 Replace Maintenance Department Ford Ranger and replace one cart FY 20 Replace the Electrical and Instrumentation Ford E250 and replace one cart FY 21 Replace Environmental Services Ford F150 pickup. FY 22 Replace F450 Flatbed FY 23 Replace Bobcat front end loader
7430-958-00 Laboratory Equipment
This account includes allowances for scheduled replacement of laboratory equipment (autoclaves, pumps, collection/sampler systems, washers, incubators, bioassay system, etc.).
FY 14 Replace three influent samplers and one portable sampler. FY 15 – 23 Replace various laboratory equipment based on projected laboratory needs.
54 of 86

CENTRAL MARIN SANITATION AGENCY CAPITAL IMPROVEMENT PROGRAM - ACCOUNT / PROJECT DESCRIPTIONS
ADOPTED FY 14 BUDGET AND 10-YEAR PROJECTION
General Equipment
ACCOUNT NUMBER
ACCOUNT / PROJECT TITLE
ACCOUNT / PROJECT DESCRIPTION
7450-002-00 Electrical Equipment
This account includes allowances for planned maintenance, upgrading, and replacement of Agency electrical components: individual motor controls and equipment panels, dry transformers (which are nearing the end of their useful lives),lighting equipment with more energy-efficient equipment (5 – 10% per year),variable frequency drives for process equipment, and electrical equipment to support the centrifuges.
FY 14 Phased replacement of facility lighting, rebuild/replace two plant sump pump panels, one irrigation water pump motor and motor control equipment. Upgrade electric motor variable frequency drives(VFDs) for four ferric chloride feed pumps in Digester basement, replace one centrifuge feed pump’s hydrostatic drive with a VFD.
FY15 Phased replacement of facility lighting, replace two centrifuge feed pumps’ hydrostatic pump drives with VFDs; rebuild or replace process waste sump pump panels , replace three dry transformers and three electric sluice gate actuators.
FY16 Phased replacement of facility lighting, rebuild/replace two plant sump pump panels, replace one wasting pump’s hydrostatic drive with VFD, phased replacement of electrical control panel equipment , replace three dry transformers and three electric sluice gate actuators.
FY17 Phased replacement of facility lighting, rebuild/replace two plant sump pump panels and electrical control panel equipment, replace three dry transformers and three electric sluice gate actuators.
FY 18 Phased replacement of facility lighting, rebuild / replace two plant sump pump panels, phased replacement of outdoor lighting, replace three dry transformers, and replace three electronic sluice gate actuators.
FY 19 Phased replacement of facility lighting, rebuild / replace two plant sump pump panels, phased replacement of outdoor lighting, replace three dry transformers and three electric sluice gate actuators
FY 20 Phased replacement of outdoor lighting, replace three dry transformers and three electric sluice gate actuators FY 21 Phased replacement of outdoor lighting, replace three dry transformers and three electric sluice gate actuators. FY 22 Replace Control Room uninterruptible power source, replacement of one reclaimed water or carrier water pump
motor and motor controls; replace three dry transformers and three electric sluice gate actuators FY 23 Condition assessment of Effluent Pump Station electric motors and controls; replace three dry transformers and
three electric sluice gate actuators.
55 of 86

CENTRAL MARIN SANITATION AGENCY CAPITAL IMPROVEMENT PROGRAM - ACCOUNT / PROJECT DESCRIPTIONS
ADOPTED FY 14 BUDGET AND 10-YEAR PROJECTION
General Equipment
ACCOUNT NUMBER
ACCOUNT / PROJECT TITLE
ACCOUNT / PROJECT DESCRIPTION
7450-102-00 Process Instrumentation
This account includes an allowance (3 yr. average cost) for ongoing repair, replacement or upgrading of 4-6 obsolete meters, sensors, and transmitters per year, and to provide local process status information and transmit it to the Treatment Plant’s SCADA system. Also included are allowances for condition assessment and possible repair or replacement of the permanently mounted gas detection equipment in the Headworks and Solids Handling Building.
FY 14 Above allowances, plus replace two chlorine analyzers, and replace the existing bubble Level Indicating Transmitters at the original Chlorine Contact Tanks (CCTs 1- 4) with new pressure transducers and supporting equipment.
FY 15 Above allowances, plus replace two pressure transmitters on CCT 5 and 6, replace two chlorine analyzers. FY16 Above allowances, plus replace two chlorine analyzers, conduct condition assessment of Headworks and Solids
Handling Building permanent gas detection equipment. FY17 Above allowances, plus refurbish/replace Headworks fixed gas detection equipment. FY 18 Above allowances, plus refurbish/replace Solids Handling Building fixed gas detection equipment. FY 19 – 23 Above allowances.
7450-105-00 Electrical Distribution System Rehabilitation
This account includes an allowance to perform condition assessment and testing in FY 14 of the original Treatment Plant wiring, breakers, and motor control centers (MCCs). The MCCs are 28 years old and while still functioning properly, they are approaching the end of the useful life of various components and wiring in them.
Kennedy/Jenks Engineers’ February 2011 Capital Master Planning Assistance Report recommends that CMSA develop a program to systematically monitor their condition within the next 5 to 10 years. Based on the results of the monitoring, CMSA may need to increase their budget to fund repairs and replacement of the MCCs.
Also, various construction and improvement projects in recent years have generated several arc-flash studies, which need to be reconciled into a single Treatment Plant-wide reference document.
FY14 Engage consultant to reconcile various arc flash studies and perform condition assessment of Area 14 switchgear. FY 15 – 23 Based on assessment performed in FY14, conduct refurbishment or replacement of identified MCCs or
components, based on refurbishing smaller MCCs in FY 15 and 16, larger MCCs in following years.
56 of 86

CENTRAL MARIN SANITATION AGENCY CAPITAL IMPROVEMENT PROGRAM - ACCOUNT / PROJECT DESCRIPTIONS
ADOPTED FY 14 BUDGET AND 10-YEAR PROJECTION
Liquid Treatment Processes and Equipment
ACCOUNT NUMBER
ACCOUNT / PROJECT TITLE
ACCOUNT / PROJECT DESCRIPTION
7300-641-00 Effluent Pump Station Maintenance
This account includes allowances for routine equipment maintenance and repair costs at the Effluent Pump Station and its associated fuel system.
7300-680-00 Grit Dewatering System
This account has been combined with 7300-727-00 (Headworks Equipment) and will be removed from the FY 15 CIP.
7300-685-00 Bio-Tower Rotary Distributor Replacement
See Full Page Description
57 of 86

CENTRAL MARIN SANITATION AGENCY CAPITAL IMPROVEMENT PROGRAM - ACCOUNT / PROJECT DESCRIPTIONS
ADOPTED FY 14 BUDGET AND 10-YEAR PROJECTION
Liquid Treatment Processes and Equipment
ACCOUNT NUMBER
ACCOUNT / PROJECT TITLE
ACCOUNT / PROJECT DESCRIPTION
7300-700-00
Plant Pumps
This account includes scheduled replacement of plant pumps including sludge pumps (used for primary sludge, waste activated sludge and contact tank scum), and sump pumps (some of which are large pumps) throughout the Treatment Plant. These lines have increased since FY 12 due to unanticipated increases in the cost of sludge pumps, the addition of the new digester mixing pumps and FOG/F2E Station pumps.
FY 14 Refurbish one biotower pump, one scum pump, one carrier water pump, one RAS pump. Replace three primary sludge pumps, one primary scum pump, one site sump pump, three plant sump pumps, and one centrifuge feed pump.
FY 15 Refurbish one tank drain pump, one plant carrier water pump, one primary scum pump, and one RAS pump. Replace three primary sludge pumps, one Headworks sample pump, two process waste pumps and one plant sump pump, one Centrifuge feed pump (electric drive unit upgrades are provided for in the GL 7450-002-00 – Electrical Equipment).
FY 16 Refurbish one RAS pump. Replace three primary sludge pumps, one plant carrier water pump, one headworks sample pump, and two plant sump pumps..
FY 17 Refurbish one RAS pump. Replace three primary sludge pumps, one WAS pump, two plant sump pumps, 1 FY 18 Refurbish or replace one digester basement chopper pump and one WAS pump. Replace one Headworks sample
pump, three primary sludge pumps. FY 19 Replace or refurbish one digester basement chopper pump. Replace three primary sludge pumps, one secondary
system pump. FY 20 Refurbish one Biotower pump, one centrifuge feed pump, one RAS pump. Replace one secondary system scum
pump, three primary sludge pumps, and two hot water pumps. FY 21 Refurbish one Biotower pump, one centrifuge feed pump, one RAS pump. Replace three sludge pumps, replace or
refurbish three hot water pump and two plant sump pumps. FY 22 Refurbish one tank drain pump, one plant water pump, one scum pump, one plant water pump, one carrier water
pump, and one RAS pump. Replace three sludge pumps, one Headworks sample pump and two sump pumps. FY 23 Repair or refurbish one digester mixing pump, and three primary scum pumps. Replace hoses on FOG/F2E
recirculation pumps.ne Vaughn™ chopper pump.
58 of 86

CENTRAL MARIN SANITATION AGENCY CAPITAL IMPROVEMENT PROGRAM - ACCOUNT / PROJECT DESCRIPTIONS
ADOPTED FY 14 BUDGET AND 10-YEAR PROJECTION
Liquid Treatment Processes and Equipment
ACCOUNT NUMBER
ACCOUNT / PROJECT TITLE
ACCOUNT / PROJECT DESCRIPTION
7300-719-00 Chemical Pumps Regular repair or replacement, based on condition assessment of polymer pumps, chemical mixing, metering, and pumping equipment controlling the injection of specific chemicals (e.g. Ferric Chloride, Hydrogen Peroxide, Calcium Nitrate, Sodium Hypochlorite, Emulsion Polymer, and Sodium Bisulfite) at various treatment unit processes.
FY 14 Refurbish one sodium bisulfite (SBS) pump and two chemical induction mixers. Replace three ferric chloride metering pumps.
FY 15 Replace/refurbish one Hydrogen Peroxide metering pump, one sodium hypochlorite metering pump, and two chemical induction mixers.
FY 16 Refurbish one polymer feed pump and one hydrogen peroxide pump. Replace or refurbish two chemical induction mixers.
FY 17 Refurbish one polymer activation units and one polymer feed pump. Replace two chemical induction mixers. FY 18 Refurbish one polymer activation unit and one Sodium Hypochlorite metering pumps. Replace one ferric chloride
metering pumps and two chemical induction mixers. FY 19 Refurbish one sodium hypochlorite and one sodium bisulfite pumps. Replace two chemical induction mixers. FY 20 Refurbish one sodium bisulfite metering pumps and replace two chemical induction mixers. FY 21 Refurbish one hydrogen peroxide metering pumps and two chemical induction mixers. FY 22 Refurbish one polymer feed pumps and two chemical induction mixers. FY 23 Refurbish or replace one sodium hypochlorite and one sodium bisulfite transfer pump and two chemical induction
mixers.
7300-720-00 Gates Rehabilitation This account includes maintenance and replacement, as needed, of large gates and operators, including procurement and outside specialized labor to install them. These gates control flow into, through and between processes, and isolate processes for repair or maintenance. Many of them will be replaced with stainless steel gates, which are expected to have a longer service life due to being more corrosion resistant and having sealing surfaces that can be refurbished. Scheduled work may change in future years based on condition assessment and ongoing inspection results.
FY 14 Replace up to one medium Aeration Basin effluent gate, up to two large primary clarifier influent gates, and up to seven small Primary channel isolation gates.
FY 15 – 16 Replace up to three medium Aeration Basin gates (influent or effluent) and up to two large Primary Clarifier influent gates.
FY 17 – 21 Replace up to two medium Aeration Basin gates (influent or effluent), replace two large Primary Clarifier influent gate, refurbish up to two Primary Clarifier influent gate operators per year.
FY 22 Refurbish two Plant Influent gate operators. Condition assessment on large 84”and 72” outfall isolation gates. FY 23 Replace or refurbish medium triangle pit / pond isolation gates, refurbish three large inlet gates for CCTs 1 – 4.
59 of 86

CENTRAL MARIN SANITATION AGENCY CAPITAL IMPROVEMENT PROGRAM - ACCOUNT / PROJECT DESCRIPTIONS
ADOPTED FY 14 BUDGET AND 10-YEAR PROJECTION
Liquid Treatment Processes and Equipment
ACCOUNT NUMBER
ACCOUNT / PROJECT TITLE
ACCOUNT / PROJECT DESCRIPTION
7300-727-00 Headworks Equipment
This account contains funds formerly included in GL 7300-680-00 (Grit Handling System) which have been combined into this account. Includes the ongoing repair and replacement of smaller pieces of Headworks and grit handling equipment. This equipment collects, transports, dewaters, and stores screenings and grit for disposal from raw plant influent as it passes to the Primary Clarifiers, and operates in a very corrosive and erosive environment. Contains an allowance of $30, 000 for replacing smaller pipes and valves and scheduled refurbishment of larger items (hydraulic system, hoppers, gates, classifier troughs, grit pumps and augers) as described in the individual line items.
FY 14 – 15 Annual allowance, including refurbish two Grit Tank gate operators per year and purchase of critical spares. FY 16 Annual allowance, plus perform five-year preventive maintenance on Headworks filter screens and washer-
compactors. FY 17 Annual allowance, plus refurbish one grit classifier and one grit pump. Replace one grit classifier auger. FY 18 –19 Annual allowances, plus replace two grit classifier augers. FY 20 Annual allowance, plus refurbish one grit classifier and one grit pump. Replace one grit classifier auger. FY 21 Annual allowance, plus refurbish one grit classifier and one grit pump and perform five-year preventive
maintenance on Headworks filter screens and washer-compactors. Replace one grit classifier auger. FY 22 Annual allowance, plus perform complete condition assessment of Headworks hydraulic system. FY 23 Annual allowance, plus allowance to begin implementing work arising from hydraulic system condition
assessment.
7300-800-00 FOG/F2E Station Maintenance
This account includes a yearly allowance to perform routine mechanical maintenance on the equipment at the FOG/F2E station, including the rock trap grinders, the FOG metering pumps, the FOG mixing system, the paddle finisher, and their various valves, operators, and other appurtenances.
7300-981-00 Odor Control System Improvements
See Full Page Description
7300-982-10 Aeration Blower Capacity Optimization (Formerly Aeration Blower Replacement)
See Full Page Description
60 of 86

CENTRAL MARIN SANITATION AGENCY CAPITAL IMPROVEMENT PROGRAM - ACCOUNT / PROJECT DESCRIPTIONS
ADOPTED FY 14 BUDGET AND 10-YEAR PROJECTION
Liquid Treatment Processes and Equipment
ACCOUNT NUMBER
ACCOUNT / PROJECT TITLE
ACCOUNT / PROJECT DESCRIPTION
7300-983-00 Process Tank Maintenance
This account includes maintenance of mechanical equipment in all process tanks and systems throughout the Treatment Plant, including primary scum collectors, channel air blowers, secondary clarifier launders (weir brushes to improve algae reduction), and sludge collector mechanisms (except turntable drive replacements, in GL 7300-990-00 Secondary Clarifiers Turntable Drives). Periodic recoating of metal equipment in tanks is contained in GL 7300-956-00 General Industrial Coating/Sealing.
FY 14 General tank related maintenance, plus refurbish three grit air blowers and replace/upgrade one hydrostatic drives.
FY 15 General tank related maintenance, plus replace guide rails in site sump, replace/replace two hydrostatic drives, and replace five check valves in Gallery A
FY 16 General tank related maintenance, plus replace Aeration socks and five check valves in Gallery A. FY 17 General tank related maintenance, plus refurbish two channel air blowers, and replace five check valves in Gallery
A. FY 18 General tank related maintenance, plus refurbish two channel air blowers, and replace five check valves in RAS
basement FY 19 General tank related maintenance, plus refurbish two channel air blowers, and replace five check valves in RAS
basement FY 20 General tank related maintenance, plus refurbish or repair tank wash down equipment, and replace three check
valves in Digester basement FY 21 General tank related maintenance, plus replace five Plant water check valves, and have secondary clarifier rake
arms’ condition assessed by outside specialists. FY 22 General tank related maintenance, plus replace guide rails in site sump, replace/upgrade two hydrostatic drives,
and replace five check valves in Gallery A. FY 23 General tank related maintenance, plus perform a condition assessment on mechanical equipment in Primary
Clarifier’s 6 and 7 and Chlorine Contact Tanks 5 and 6.
7300-990-00 Secondary Clarifiers Turntable Drives
This account includes replacement of three secondary clarifiers’ sludge collector mechanisms large drive turntables that are nearing the end of their expected life. Condition assessments indicate the three turntables needing replacement can be expected to last until the scheduled metal coating projects for their clarifiers. The fourth unit was purchased in FY 10 and installed in FY 11, and the costs shown are based on the FY 10 costs, plus escalation.
FY 15 Replace main drive assembly, Secondary Clarifier No. 4. FY 16 Replace main drive assembly, Secondary Clarifier No. 1. FY 17 Replace main drive assembly, Secondary Clarifier No. 3.
61 of 86

CENTRAL MARIN SANITATION AGENCY CAPITAL IMPROVEMENT PROGRAM - ACCOUNT / PROJECT DESCRIPTIONS
ADOPTED FY 14 BUDGET AND 10-YEAR PROJECTION
Liquid Treatment Processes and Equipment
ACCOUNT NUMBER
ACCOUNT / PROJECT TITLE
ACCOUNT / PROJECT DESCRIPTION
7400-964-00 Reclaimed Water System Improvements
See Full Page Description
7400-966-00 Critical Buried Pipe Inspection / Repairs
See Full Page Description
7430-855-00 Chemical Tanks Replacement of chemical storage tanks used throughout the plant and in the collection system as they exceed their service life. Tanks are of various materials and complexity of their installations, and include five sodium hypochlorite, two sodium bisulfite, two hydrogen peroxide, two polymer, four calcium nitrate and three ferric chloride tanks. The replacement schedule is subject to change based on during annual inspection results.
FY 14 Replace one sodium bisulfite tank, assess hydrogen peroxide tanks. FY 15 Replace one sodium bisulfite tank. FY 16 Assess two bulk polymer storage tanks. FY 17 Replace one hydrogen peroxide tank and assess condition of headworks bulk ferric chloride storage tanks. FY 18 Replace nitrate tank and one hydrogen peroxide tank, replace/refurbish headworks bulk ferric chloride storage
tank based on FY17 assessment. FY 19 Replace one calcium nitrate tank. FY 20 Replace one sodium hypochlorite tank, one calcium nitrate tank. FY 21 Replace one sodium hypochlorite tank and one calcium nitrate tank. FY 22 Replace one sodium hypochlorite tank Headworks bulk ferric chloride storage tanks. FY 23 Assess condition of hydrogen sulfide and siloxane media filter vessels and Nitrate Station bulk chemical storage
tanks, replace one sodium bisulfite tank.
7430-857-00 Piping, Valves & Operators
There are over 750 plug valves in the Treatment Plant’s process systems, ranging from less than 6” up to 12” in diameter. This account item includes annual allowances for routine maintenance and periodic replacement of these valves, their operators, and associated piping. The most current condition assessment indicates at least 50 valves are not functioning properly, and this allowance may change as ongoing condition assessments are completed.
7450-104-10 Influent Flow Meter Improvement
Both the 45” San Rafael Interceptor and the 54” Ross Valley Interceptor were fitted with insertion- magnetic-type meters in FY 11. Having both the original ultrasonic meters plus the magnetic meters is expected to improve their accuracy in measuring large flow variations. The allowance in FY 16 is for a study to survey available technologies for possible improved meter accuracy in light of the Treatment Plant’s large seasonal flow variations.
62 of 86

CENTRAL MARIN SANITATION AGENCY CAPITAL IMPROVEMENT PROGRAM - ACCOUNT / PROJECT DESCRIPTIONS
ADOPTED FY 14 BUDGET AND 10-YEAR PROJECTION
Solids Treatment And Energy Generation Processes and Equipment
ACCOUNT NUMBER
ACCOUNT / PROJECT TITLE
ACCOUNT / PROJECT DESCRIPTION
7300-678-00 Emergency Generator Assessment & Improvement
This account includes allowances for condition assessment of the emergency generator and its diesel engine, a rolling one-time allowance for incremental improvements (e.g., particulate filter with monitoring) for the engine if needed to comply with evolving air quality standards, and allowances at its 30-year installation anniversary to determine if replacement is needed, and to design, procure, and install a potential replacement.
FY 14 Condition assessment of emergency diesel generator and control system(s). FY15 Rolling allowance for modifications needed if regulatory requirements change to require minor emission
system upgrades, such as particulate filters, and / or enhanced engine emissions monitoring. FY 16 Allowance to survey then-current air quality regulatory environment and available technologies to identify
either needed major emissions equipment upgrades or need for a complete engine replacement. If replacement is needed, balance of this funding would be used for design of the replacement.
FY 18 Allowance to fund installation of a replacement emergency generator based on findings of survey and possible design effort in FY 16. The lag between survey and installation considers that there will be significant time needed to design a replacement and long lead time for its procurement.
7300-691-00 Digester Inspection, Cleaning and Cover Replacement
This account includes allowance for periodic cleaning and inspection each of the Anaerobic Digesters, including a one-year warranty inspection as part of the Digester Improvements – FOG/F2E Station Project, and every 10 years thereafter, based on conservative estimates of the membrane covers’ service life. The Agency CIP Team will determine whether the warranty inspections will be carried out, considering the costs and possible disbenefits of performing them versus the limited amount of information to be gained by them.
Costs shown are for contractor-performed work to complete dewatering (after CMSA’ initial dewatering): purging, cleaning, and staging each digester for inspection. These costs are based on the 2011 construction project’s Schedule of Values, plus escalation in FY 15. Agency staff costs to take each digester out of service, drain each digester as far as possible and refill it and return it to service after the inspection, and any needed repairs are not included in this account.
FY14 Allowance to dewater and inspect both digesters (No 1 in January 2014 and No. 2 in August 2014) for construction one-year warranty purposes
FY23 Clean and inspect Digester No. 1, and an allowance to replace dual membrane cover (may be deferred based on condition of dual membrane cover).
63 of 86

CENTRAL MARIN SANITATION AGENCY CAPITAL IMPROVEMENT PROGRAM - ACCOUNT / PROJECT DESCRIPTIONS
ADOPTED FY 14 BUDGET AND 10-YEAR PROJECTION
Solids Treatment And Energy Generation Processes and Equipment
ACCOUNT NUMBER
ACCOUNT / PROJECT TITLE
ACCOUNT / PROJECT DESCRIPTION
7300-715-00 Centrifuge Maintenance
This account includes costs for maintenance and repairs of the high speed centrifuges and their supporting equipment. This highly utilized equipment operates in an especially harsh and corrosive environment. Previous years’ conversion of back drive controls and installation of weld-on tiles on scrolls have eliminated the need to periodically dismantle the centrifuges entirely for offsite rebuilding, but there is still a need for regular preventive and routine maintenance tasks. The annual and 5-year preventive maintenance has extended the centrifuges’ expected service life from 15 to 20 years. The augmented costs in FY 22 and 23 are for potential design and procurement of replacement centrifuges as the current equipment reaches the end of its extended service life.
FY 14 Standard maintenance and 5-year preventive maintenance (repair / balance bowl and scroll assembly) of one centrifuge including the rebuild of one backdrive.
FY 15 Refurbish one centrifuge hydraulic system, rebuild one backdrive. FY 16 Refurbish two centrifuge hydraulic systems . FY 17 5-year preventive maintenance of one centrifuge. FY 18 5-year preventive maintenance of one centrifuge (repair / balance bowl and scroll assembly) and rebuild
one Roto-DIF™. FY 19 5-year preventive maintenance of one centrifuge and rebuild one backdrive. FY 20 Refurbish one centrifuge hydraulic system, rebuild one backdrive. FY 21 Refurbish two centrifuge hydraulic systems. Perform major condition assessment and prospective study of
three centrifuges to determine residual life and research potential replacement technologies. FY 22 5-year preventive maintenance, plus allowance for design of centrifuge replacement FY 23 Allowance to replace existing centrifuges.
64 of 86

CENTRAL MARIN SANITATION AGENCY CAPITAL IMPROVEMENT PROGRAM - ACCOUNT / PROJECT DESCRIPTIONS
ADOPTED FY 14 BUDGET AND 10-YEAR PROJECTION
Solids Treatment And Energy Generation Processes and Equipment
ACCOUNT NUMBER
ACCOUNT / PROJECT TITLE
ACCOUNT / PROJECT DESCRIPTION
7300-721-00 Heat Exchangers (Formerly Cogeneration Heat Exchangers)
This account now contains costs associated with all the heat exchangers located throughout the CMSA Treatment Plant, including the main plate-and-frame heat exchanger that uses cogeneration engine coolant to heat the Plant’s hot water loop, two tube-and-fin type waste heat exchangers to cool the engine’s oil and to dispose of excess heat left in the coolant, several other remote exchangers in the Boiler room, Digester Basement, and Administration Building to transfer heat from the plant hot water loop into other water lines. This account includes allowances to inspect and repair the various types of heat exchangers in alternating years (main plate-and frame and oil cooling heat exchangers in odd numbered years, other heat exchangers in even numbered years). Amounts have been reduced since FY 12 CIP due to favorable results from condition assessments.
FY 14 Allowance to assess condition of all exchangers and to clean and inspect the remote heat exchangers, and develop a plan for refurbishment or replacement of exchangers based on assessment results.
FY15 Clean and inspect plate and frame exchanger, and inspect the oil cooling loop exchangers. FY16 Assess new technologies for more efficient ways to transfer heat at the Digester heat exchangers (these
sludge heat exchangers will be 31 years old and at the end of their service life) and assess possibility and desirability of establishing thermophilic conditions within the digesters; inspect and clean Administration Building domestic hot water and boiler room tube-and-and-fin waste heat exchangers.
FY17 Clean and Inspect the plate and frame and oil cooling loop exchangers. FY18 Clean and inspect Administration Building and boiler room tube-and-and-fin waste heat exchangers. FY19 Inspect and repair main plate and frame cooling loop heat exchanger and oil cooling loop waste heat
exchanger. FY20 Clean and inspect Administration Building and boiler room tube-and-and-fin waste heat exchangers, assess
condition of Digester heat exchangers. FY21 Inspect and repair main plate and frame cooling loop heat exchanger and oil cooling loop waste heat
exchanger. FY22 Clean and inspect Administration Building and boiler room tube-and-and-fin waste heat exchanger. FY23 Inspect and repair main plate and frame cooling loop heat exchanger and oil cooling loop waste heat
exchanger.
65 of 86
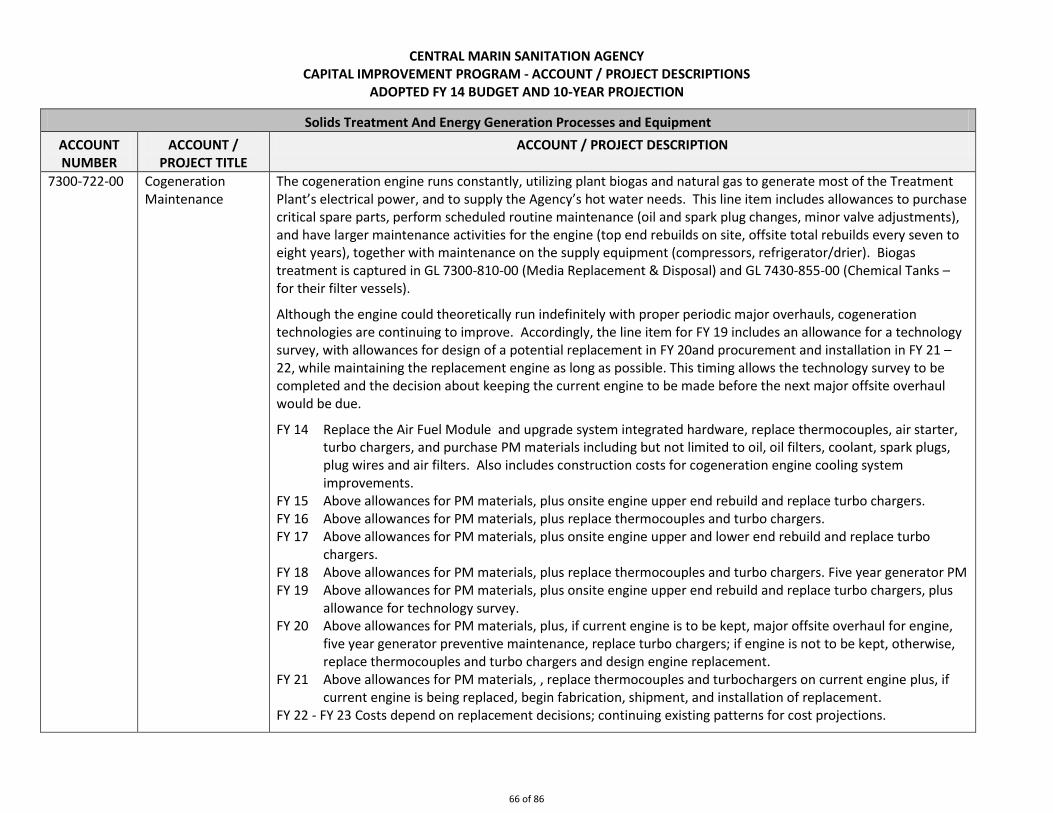
CENTRAL MARIN SANITATION AGENCY CAPITAL IMPROVEMENT PROGRAM - ACCOUNT / PROJECT DESCRIPTIONS
ADOPTED FY 14 BUDGET AND 10-YEAR PROJECTION
Solids Treatment And Energy Generation Processes and Equipment
ACCOUNT NUMBER
ACCOUNT / PROJECT TITLE
ACCOUNT / PROJECT DESCRIPTION
7300-722-00 Cogeneration Maintenance
The cogeneration engine runs constantly, utilizing plant biogas and natural gas to generate most of the Treatment Plant’s electrical power, and to supply the Agency’s hot water needs. This line item includes allowances to purchase critical spare parts, perform scheduled routine maintenance (oil and spark plug changes, minor valve adjustments), and have larger maintenance activities for the engine (top end rebuilds on site, offsite total rebuilds every seven to eight years), together with maintenance on the supply equipment (compressors, refrigerator/drier). Biogas treatment is captured in GL 7300-810-00 (Media Replacement & Disposal) and GL 7430-855-00 (Chemical Tanks – for their filter vessels).
Although the engine could theoretically run indefinitely with proper periodic major overhauls, cogeneration technologies are continuing to improve. Accordingly, the line item for FY 19 includes an allowance for a technology survey, with allowances for design of a potential replacement in FY 20and procurement and installation in FY 21 – 22, while maintaining the replacement engine as long as possible. This timing allows the technology survey to be completed and the decision about keeping the current engine to be made before the next major offsite overhaul would be due.
FY 14 Replace the Air Fuel Module and upgrade system integrated hardware, replace thermocouples, air starter, turbo chargers, and purchase PM materials including but not limited to oil, oil filters, coolant, spark plugs, plug wires and air filters. Also includes construction costs for cogeneration engine cooling system improvements.
FY 15 Above allowances for PM materials, plus onsite engine upper end rebuild and replace turbo chargers. FY 16 Above allowances for PM materials, plus replace thermocouples and turbo chargers. FY 17 Above allowances for PM materials, plus onsite engine upper and lower end rebuild and replace turbo
chargers. FY 18 Above allowances for PM materials, plus replace thermocouples and turbo chargers. Five year generator PM FY 19 Above allowances for PM materials, plus onsite engine upper end rebuild and replace turbo chargers, plus
allowance for technology survey. FY 20 Above allowances for PM materials, plus, if current engine is to be kept, major offsite overhaul for engine,
five year generator preventive maintenance, replace turbo chargers; if engine is not to be kept, otherwise, replace thermocouples and turbo chargers and design engine replacement.
FY 21 Above allowances for PM materials, , replace thermocouples and turbochargers on current engine plus, if current engine is being replaced, begin fabrication, shipment, and installation of replacement.
FY 22 - FY 23 Costs depend on replacement decisions; continuing existing patterns for cost projections.
66 of 86

CENTRAL MARIN SANITATION AGENCY CAPITAL IMPROVEMENT PROGRAM - ACCOUNT / PROJECT DESCRIPTIONS
ADOPTED FY 14 BUDGET AND 10-YEAR PROJECTION
Solids Treatment And Energy Generation Processes and Equipment
ACCOUNT NUMBER
ACCOUNT / PROJECT TITLE
ACCOUNT / PROJECT DESCRIPTION
7300-724-00 Hot Water Systems Routine inspections, repairs to and replacement of hot water system pumps, valves, flex fittings and piping as needed to maintain the hot water system that supplies hot water (from the cogeneration unit and/or the boilers) to the digesters and Administration Building, including:
FY 14 Replace four flex joints, and have comprehensive condition assessment of the plant heating loop/system performed.
FY 15 Allowance for large scale replacement of hot water piping system if indicated by extensive condition assessment. Replace softened water system for Hot water loop (boilers / upstairs Administration Bldg.)
FY 16 - FY 23 Ongoing preventive maintenance and repairs on system.
7300-725-00 Boilers Rehabilitation or Replacement
Scheduled inspection, repair and / or replacement of boiler tubes that produce heat for the Plant hot water systems when the cogeneration engine is offline (last completely overhauled in FY 09)
FY 16 Inspect boilers and perform maintenance or minor upgrades as needed (deferred from FY 15 based on condition assessment in FY 12.
FY 18 Allowance for major maintenance (inspection, repair and replacement of boiler tubes as needed), and contingency planning for upgrade or replacement to meet anticipated new, more stringent emissions regulations.
7300-726-00 Sludge Heat Exchangers
Consolidated with GL 7300-721-00, Heat Exchangers.
7300-800-00 FOG/F2E Station Maintenance
This account includes a yearly allowance to perform routine mechanical maintenance on the equipment at the FOG/F2E station, including the rock trap grinders, the FOG metering pumps, the FOG mixing system, the paddle finisher, and their various valves, operators, and other appurtenances.
67 of 86

CENTRAL MARIN SANITATION AGENCY CAPITAL IMPROVEMENT PROGRAM - ACCOUNT / PROJECT DESCRIPTIONS
ADOPTED FY 14 BUDGET AND 10-YEAR PROJECTION
Solids Treatment And Energy Generation Processes and Equipment
ACCOUNT NUMBER
ACCOUNT / PROJECT TITLE
ACCOUNT / PROJECT DESCRIPTION
7300-810-00 Media Disposal & Replacement
This account includes routine third-party analysis, removal/disposal, and installation of replacement media for various gas treatment systems: biogas hydrogen sulfide and siloxane removal and F2E/FOG Station odor control. Frequencies are based on projected service life of each media. Lab analysis will determine actual frequency of changes. One vessel’s worth of hydrogen sulfide and siloxane media will be kept on hand as spare. At each change, the spare media will be put into service and replenished with a fresh batch put into inventory.
FY 14 Purchase one vessel’s worth of hydrogen sulfide media as spare/replacement. FY 15 Replace siloxane filter media. FY 16 Replace hydrogen sulfide scrubber media. FY 17 Replace siloxane media, and replace FOG/F2E station media. FY 18 Replace hydrogen sulfide scrubber media . FY 19 Replace siloxane filter media. FY 20 Replace hydrogen sulfide scrubber media. FY 21 Replace siloxane media, replenish spares, and replace FOG/F2E station media. FY 22 Replace hydrogen sulfide scrubber media. FY 23 Replace siloxane filter media.
7300-957-00 Waste Gas Burners Condition assessment and repair or replacement of underground biogas piping serving the waste gas burners from the Solids Handling Building – deferred one year based on preliminary condition assessment.
7300-977-00 Sludge Recirculating Pump Grinders
This account includes allowances for service agreements for annual factory inspection and repair to the sludge grinders’ high-wear cutter cassettes (one for centrifuges, two for digester recirculation systems) and periodic refurbishment of cutter cartridges as indicated by condition assessments. Based on experience with the first digester taken out of service in 2011, FY 14 contains additional costs to replace one additional grinder cartridge for use in the Digester Improvement project.
7300-978-00 Biosolids Hoppers - Maintenance
This account includes an allowance for monitoring and smaller touchup repairs to biosolids hoppers, gates, and hydraulic actuators (following extensive repairs in 2010 - hopper gates and hydraulic actuators replaced, corrosion repaired and coating touched up).
7300-964-10 Sludge Thickening Improvements
See Full Page Description
7430-957-10 Digester Improvements / FOG Facility
See Full Page Description
68 of 86
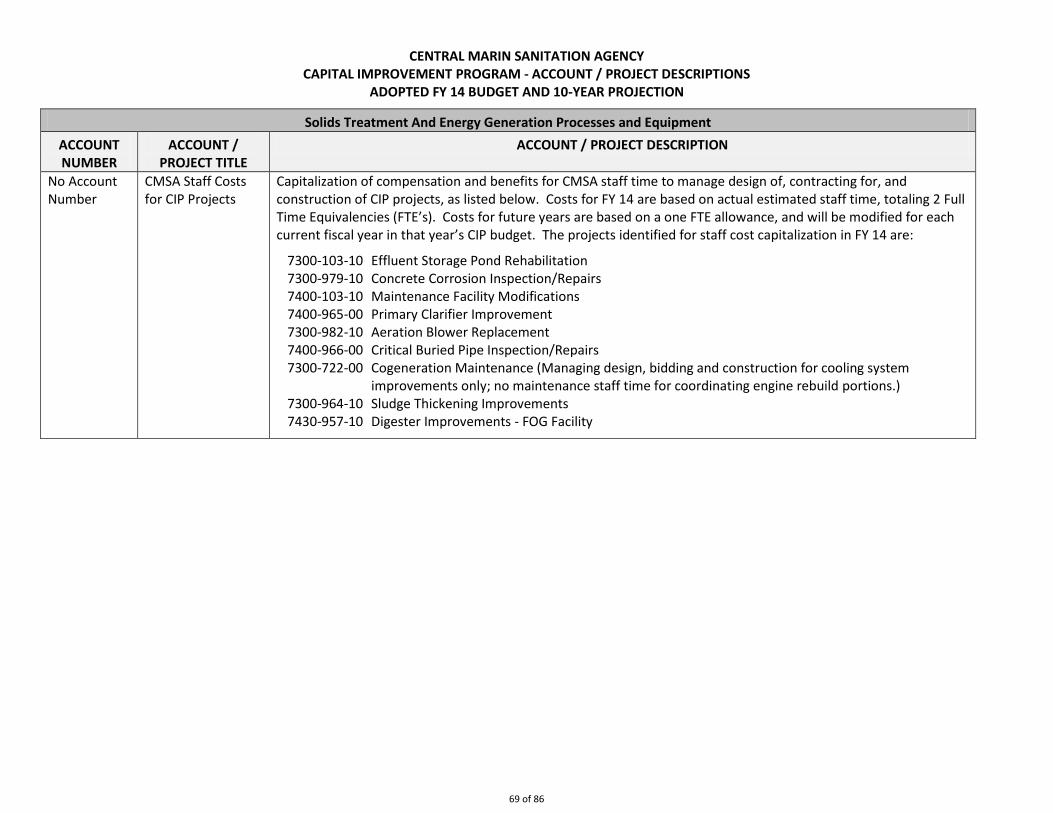
CENTRAL MARIN SANITATION AGENCY CAPITAL IMPROVEMENT PROGRAM - ACCOUNT / PROJECT DESCRIPTIONS
ADOPTED FY 14 BUDGET AND 10-YEAR PROJECTION
Solids Treatment And Energy Generation Processes and Equipment
ACCOUNT NUMBER
ACCOUNT / PROJECT TITLE
ACCOUNT / PROJECT DESCRIPTION
No Account Number
CMSA Staff Costs for CIP Projects
Capitalization of compensation and benefits for CMSA staff time to manage design of, contracting for, and construction of CIP projects, as listed below. Costs for FY 14 are based on actual estimated staff time, totaling 2 Full Time Equivalencies (FTE’s). Costs for future years are based on a one FTE allowance, and will be modified for each current fiscal year in that year’s CIP budget. The projects identified for staff cost capitalization in FY 14 are:
7300-103-10 Effluent Storage Pond Rehabilitation 7300-979-10 Concrete Corrosion Inspection/Repairs 7400-103-10 Maintenance Facility Modifications 7400-965-00 Primary Clarifier Improvement 7300-982-10 Aeration Blower Replacement 7400-966-00 Critical Buried Pipe Inspection/Repairs 7300-722-00 Cogeneration Maintenance (Managing design, bidding and construction for cooling system
improvements only; no maintenance staff time for coordinating engine rebuild portions.) 7300-964-10 Sludge Thickening Improvements 7430-957-10 Digester Improvements - FOG Facility
69 of 86
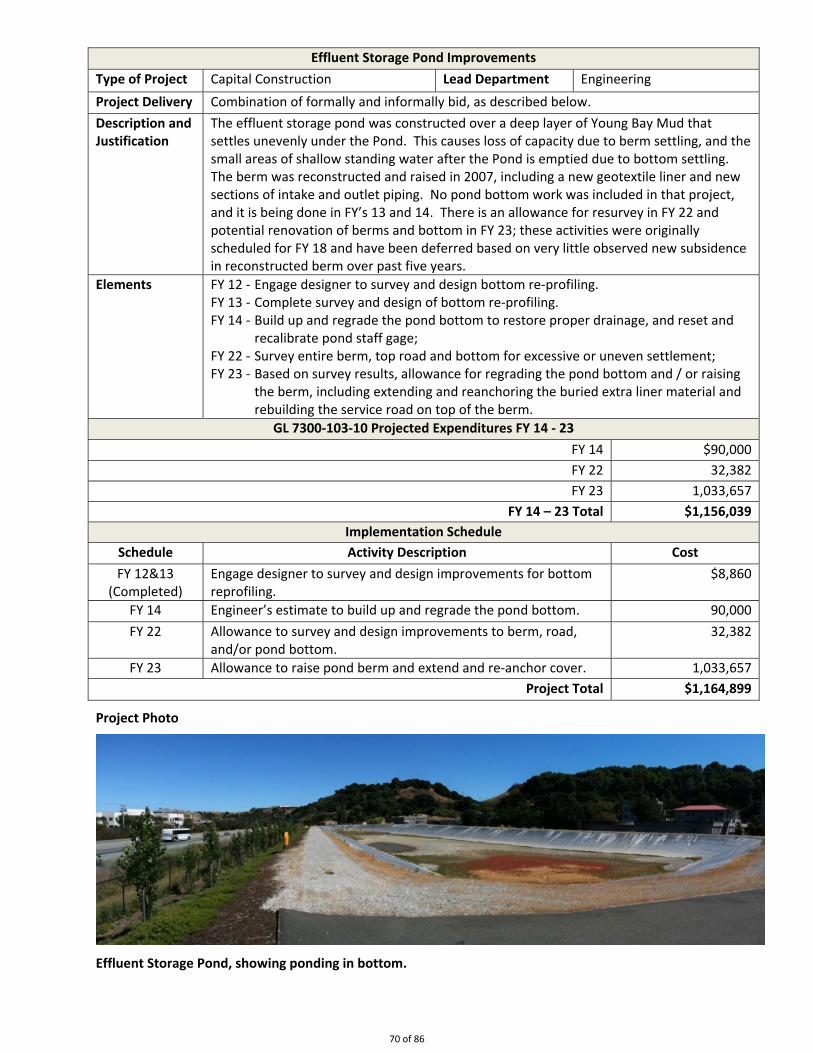
Effluent Storage Pond Improvements
Type of Project Capital Construction Lead Department Engineering
Project Delivery Combination of formally and informally bid, as described below.
Description and Justification
The effluent storage pond was constructed over a deep layer of Young Bay Mud that settles unevenly under the Pond. This causes loss of capacity due to berm settling, and the small areas of shallow standing water after the Pond is emptied due to bottom settling. The berm was reconstructed and raised in 2007, including a new geotextile liner and new sections of intake and outlet piping. No pond bottom work was included in that project, and it is being done in FY’s 13 and 14. There is an allowance for resurvey in FY 22 and potential renovation of berms and bottom in FY 23; these activities were originally scheduled for FY 18 and have been deferred based on very little observed new subsidence in reconstructed berm over past five years.
Elements FY 12 ‐ Engage designer to survey and design bottom re‐profiling. FY 13 ‐ Complete survey and design of bottom re‐profiling. FY 14 ‐ Build up and regrade the pond bottom to restore proper drainage, and reset and
recalibrate pond staff gage; FY 22 ‐ Survey entire berm, top road and bottom for excessive or uneven settlement; FY 23 ‐ Based on survey results, allowance for regrading the pond bottom and / or raising
the berm, including extending and reanchoring the buried extra liner material and rebuilding the service road on top of the berm.
GL 7300‐103‐10 Projected Expenditures FY 14 ‐ 23
FY 14 $90,000
FY 22 32,382
FY 23 1,033,657
FY 14 – 23 Total $1,156,039
Implementation Schedule
Schedule Activity Description Cost
FY 12&13 (Completed)
Engage designer to survey and design improvements for bottom reprofiling.
$8,860
FY 14 Engineer’s estimate to build up and regrade the pond bottom. 90,000
FY 22 Allowance to survey and design improvements to berm, road, and/or pond bottom.
32,382
FY 23 Allowance to raise pond berm and extend and re‐anchor cover. 1,033,657
Project Total $1,164,899
Project Photo
Effluent Storage Pond, showing ponding in bottom.
70 of 86
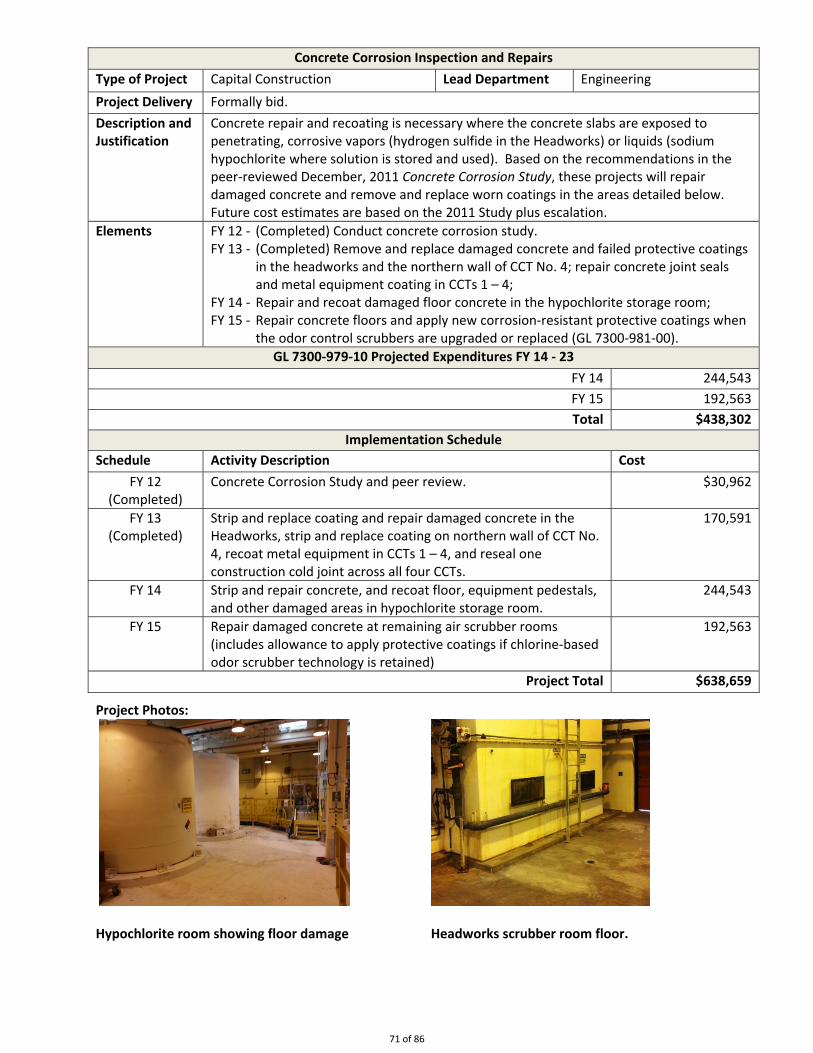
Concrete Corrosion Inspection and Repairs
Type of Project Capital Construction Lead Department Engineering
Project Delivery Formally bid.
Description and Justification
Concrete repair and recoating is necessary where the concrete slabs are exposed to penetrating, corrosive vapors (hydrogen sulfide in the Headworks) or liquids (sodium hypochlorite where solution is stored and used). Based on the recommendations in the peer‐reviewed December, 2011 Concrete Corrosion Study, these projects will repair damaged concrete and remove and replace worn coatings in the areas detailed below. Future cost estimates are based on the 2011 Study plus escalation.
Elements FY 12 ‐ (Completed) Conduct concrete corrosion study. FY 13 ‐ (Completed) Remove and replace damaged concrete and failed protective coatings
in the headworks and the northern wall of CCT No. 4; repair concrete joint seals and metal equipment coating in CCTs 1 – 4;
FY 14 ‐ Repair and recoat damaged floor concrete in the hypochlorite storage room; FY 15 ‐ Repair concrete floors and apply new corrosion‐resistant protective coatings when
the odor control scrubbers are upgraded or replaced (GL 7300‐981‐00).
GL 7300‐979‐10 Projected Expenditures FY 14 ‐ 23
FY 14 244,543
FY 15 192,563
Total $438,302
Implementation Schedule
Schedule Activity Description Cost
FY 12 (Completed)
Concrete Corrosion Study and peer review. $30,962
FY 13 (Completed)
Strip and replace coating and repair damaged concrete in the Headworks, strip and replace coating on northern wall of CCT No. 4, recoat metal equipment in CCTs 1 – 4, and reseal one construction cold joint across all four CCTs.
170,591
FY 14 Strip and repair concrete, and recoat floor, equipment pedestals, and other damaged areas in hypochlorite storage room.
244,543
FY 15 Repair damaged concrete at remaining air scrubber rooms (includes allowance to apply protective coatings if chlorine‐based odor scrubber technology is retained)
192,563
Project Total $638,659
Project Photos:
Hypochlorite room showing floor damage Headworks scrubber room floor.
71 of 86

Maintenance Facility Modifications
Type of Project Capital Construction Lead Department Engineering
Project Delivery Formally bid
Description and Justification
Since the Maintenance Building and Maintenance Annex were constructed (1985 and 1995, respectively), the Agency’s inventory and work space needs have changed. Also, soil has subsided under the asphalt floors in two bays of the covered portico, which need to be replaced with structural concrete slabs. This project includes expansion and remodeling of the 1985 Maintenance Building and 1995 Maintenance Annex to better meet current Agency needs, replacement of failing asphalt floors in two equipment bays with engineered concrete slabs, and seismic retrofit of the portico’s cantilevered columns.
Elements FY 12 ‐ (completed) Structural assessment of the grade beams surrounding the slabs; FY 14 ‐ Perform geotechnical investigations at both buildings to facilitate design; conduct
an internal needs assessment to identify the scope of needed modifications, issue a Request for Proposals, select a designer for the needed modifications, and complete design phase;
FY 15 ‐ (formally bid) Allowance for construction of needed improvements – details will be included in the FY 14 CIP after design has been completed.
GL 7400‐103‐10 Projected Expenditures FY 14 ‐ 23
FY 14 $80,600
FY 15 312,264
Total $377,264
Implementation Schedule
Schedule Activity Description Cost
FY 12 Structural assessment (Completed) $6,884
FY 14 Geotechnical investigation at Maintenance Building and Annex 15,600
Focus groups to identify needs, develop scope of design work 0
Allowance to complete design services 65,000
FY 15 Allowance for construction contract and change orders 312,264
Project Total $399,748
Project Photos
Maintenance Building and Covered Portico Column/beam attachments, seismic assessment needed.
72 of 86

Facility Roofs Rehabilitation
Type of Project Capital Construction Lead Department Engineering
Project Delivery Formally bid
Description and Justification
In FY 2007 the Agency had a roofing expert survey all its building roofs. The built‐up composite roofs needed immediate replacement, and that was done in FY 07. The assessment also indicated that the standing seam metal roofs, while still serviceable, had an expected service life of 30 years, and might need replacement then. Also, the roof systems were designed and built under the seismic codes in force in 1980, and needed repairs could trigger a requirement for seismic upgrading. This item contains allowances to rehabilitate the standing seam metal roofs on the Administration, Maintenance, Aeration and Secondary Clarifier control buildings and the Maintenance Annex, and to perform minor repairs on their supporting structures, if required.
Elements FY 15 ‐ Have specialty inspector and / or structural engineer inspect the standing seam metal roofs, gutters, and their supporting wooden structures.
FY 16 ‐ Develop, bid and perform a contract for roof system replacement, structural repairs, and/or seismic upgrades (scope and actual year of contract dependent on inspection findings).
GL 7400‐960‐00 Projected Expenditures FY 14 ‐ 23
FY 15 20,818
FY 16 747,414
Total $768,232
Implementation Schedule
Schedule Activity Description Cost
FY 14
Develop RFP for roof system inspection, including structural / seismic assessment and select inspector(s)
0
FY 15 Have third‐party inspector perform roof system inspection(s) $20,818
FY 16
Develop and bid roof system upgrade/replacement contract, if needed
0
Planned construction for roof replacement and structural / seismic upgrades or repairs, may be deferred, depending on inspection results
747,414
Project Total $768,232
Project Photo
Maintenance Building with standing seam metal roofs.
73 of 86

Primary Clarifier Equipment Improvements
Type of Project Maintenance Lead Departments Maintenance/Engineering
Project Delivery Combination of self‐performed, prepurchased equipment and informally bid installation
Description and Justification
The primary clarifiers separate floating and settleable solids from t he influent wastewater. The original 1995 Treatment Plant construction included five primary clarifiers, and two more were added as part of the WWIP. The project will refurbish or replace sludge handling equipment in the original five clarifiers that is is at or near the end of its useful life. Recent improvements in materials allow use of noncorroding materials for much of the moving metal equipment originally used when the Treatment Plant was built, and these materials were used in the two new clarifiers. A pilot replacement was successfully performed on one clarifier in FY 12, and two more were converted in FY 13, with installation by an outside mechanical contractor, which was found to be more efficient. This replacement work is coordinated with recoating the remaining stationary metal parts (under GL 7300‐956‐00, General Industrial Coating/Sealing).
Elements (Each year)
‐ Refurbish the scum and sludge drive units (by CMSA staff); ‐ Dismantle the sludge collector flights (by CMSA staff); ‐ Procure replacement, noncorroding flights, tracks, and chains; ‐ Engage an outside mechanical contractor to install the new sludge handling
mechanisms.
GL 7400‐965‐00 Projected Expenditures FY 14 ‐ 23
FY 14 $ 121,764
FY 15 124,906
Total $246,670
Implementation Schedule
Schedule Activity Description Cost
FY 13 (Completed)
Replace equipment for Primary Clarifiers No. 1 and 3. Included contractor costs to replace influent gates in Primary Clarifier No. 1 (purchased under GL 7300 720 00).
$168,066
FY 14 Perform activities listed above for one Primary Clarifier, selection to be based on condition assessment to be performed in FY 14.
121,764
FY 15 Perform activities listed above in remaining Primary Clarifier. 124,906
Project Total $414,736
Project Photos:
Aerial View of Primary Clarifiers Primary Clarifier No. 1 being retrofitted.
74 of 86

Bio‐Tower Rotary Distributor Replacement
Type of Project Maintenance Lead Department Maintenance/Engineering
Project Delivery Informally bid.
Description and Justification
The biotowers are the first of two secondary treatment processes, and remove some of the biochemical oxygen demand (BOD) from the primary effluent before treatment in the aeration tanks. The rotary distributor is the critical moving part, spreading wastewater evenly on the filter media. These critical components operate in a harsh environment and they have about a 25‐year life expectancy. The rotary distributor in Biotower No. 1 was replaced in 2010, and a followup condition assessment of Biotower No. 2 in 2013 indicated at least two more years of useful life. This account includes costs to replace the rotary distributor and an allowance to replace the top layers of filter media if it is found to be unexpectedly degraded.
Elements ‐ Replace galvanized‐steel distributor mechanism and plastic spreader nozzles; ‐ Replace of the distributor bearing; ‐ Replace or recoat the cast iron turntable on which the mechanism turns; and ‐ Optionally, replace the top tier of media that is subject to weather damage.
GL 7300‐685‐00 Projected Expenditures FY 14 – 23
FY 15 $115,749
Total $115,749
Implementation Schedule
Schedule Activity Description Cost
FY15
Develop and execute contract for rotary distributor and bearing replacement and replacement of Agency‐supplied media
$94,704
Allowance for media replacement 21,045
Project Total $115,749
Project Photos:
Original base & turntable, Biotower No. 2 New rotary distributor, Biotower No. 2
75 of 86

Odor Control System Improvements
Type of Project Capital Construction Lead Department Engineering
Project Delivery Formally bid
Description and Justification
Some wastewater treatment processes give off odorous, corrosive gasses, and odor control both protects plant processes and serves as one component of the Agency’s overall environmental stewardship and green business program. The existing odor control scrubbers in the Headworks, Biotower basement and Solids Handling Building are approaching the end of their useful service lives. The peer‐reviewed 2011 Capital Master Planning –Phase II Report, indicated that replacing the existing scrubbers with a new technology would be cost prohibitive because of the likelihood of needing to fabricate new equipment onsite due to access constraints to the existing scrubber rooms. This project includes an equipment assessment of the four aging original scrubbers, identification of possible alternative technologies, assessment of options to rehabilitate/rebuild them, and implementation of the chosen alternative. These activities were originally planned for FY12 and 13, but condition assessment indicated they could be deferred to FY 14 ‐ 16. This will also align with the concrete floor repairs in the scrubber rooms (GL 7300‐979‐10).
Elements ‐ Condition assessment, survey of current state of alternative technologies, and recommendations by outside consultant;
‐ Design and implement rehabilitation of the existing scrubbers, using either replacement in kind or new technology in existing housings.
GL 7300‐981‐00 Projected Expenditures FY 14 – 23
FY 14 $ 50,000
FY 15 114,890
FY 16 942,830
Total $1,107,720
Implementation Schedule
Schedule Activity Description Cost
FY 14
Consultant performs high‐level odor control and equipment analysis and prepares report with recommendations.
$50,000
FY 15
Consultant design of scrubber rehabilitation (based on 12% of allocated construction costs).
114,890
FY 16 Bid, award, and execute construction contracts for rehabilitation (based on estimate of $200,000 per unit).
942,830
Project Total $1,107,720
Project Photos:
Odor control scrubbers, with air handlers, two views.
76 of 86

Aeration Blower Replacement Optimization
Type of Project Capital Construction Lead Department Engineering
Project Delivery To Be Determined
Description and Justification
The Activated Sludge secondary treatment process uses compressed air, supplied by blowers, as the oxygen source for the activated sludge. The original aeration blowers were constant‐speed multistage blowers, and their flow often needed to be restricted (throttled) to maintain proper oxygen levels in the activated sludge at subpeak demand, which wastes energy. This project originally budgeted $1,313,000 in FY15 and 16, and it was implemented in FY 12 for an estimated total cost of $693,117. That implementation replaced two of the four original fixed‐output, multistage aeration blowers with two new variable speed, high‐efficiency blowers and other related work. Construction was completed in early FY 13, blower capacity optimization is still ongoing, and is expected to be completed in FY 14.
Elements ‐ Consultant predesign, design, construction support and startup services; ‐ Replacing fine‐bubble diffusers and bands in the tanks (completed by CMSA staff); ‐ Construction to replace two blowers, associated piping, controls, and electrical
modifications; ‐ Blower capacity optimization air flow verification, blower capacity design
optimization, modifications to blowers/controls to implement optimization.
GL 7300‐982‐10 Projected Expenditures FY 14 – 23
FY 14 (Allowance) $55,000
Total $55,000
Implementation Schedule
Schedule Activity Description Cost
FY 11 Design services 58,198
Parts and supplies 11,607
FY 12 Develop, bid, and award contract (completed) 0
Engineering Services During Construction 73,550
Parts and supplies 5,785
Construction costs 413,588
FY 13 Construction costs, including change order 56,779
Engineering Services During Construction/Blower Optimization 75,241
FY 14 Capacity optimization (allowance) 55,000
Project Total $749,748
Project Photos:
Aeration Basins Original single speed (left) and new turbine blowers (right)
77 of 86

Reclaimed Water System Improvements
Type of Project Capital Construction Lead Department Engineering
Project Delivery Formally bid
Description and Justification
Reclaimed treated effluent is used in processes around the facility, reducing potable water usage. The water passes through a small barscreen, is pressurized by pumps, passes through strainers and a pressure equalization tank that acts as a shock absorber, and is sent throughout the Treatment Plant and Agency facilities. The reclaimed water pumps, strainers, and pressure tank are at or nearing the end of their service lives and need to be replaced. Also, new technologies have changed the need for reclaimed water at various locations, potentially requiring minor piping or equipment modifications. This project was originally in the FY 10 budget, scheduled for construction in FY 15, with an allowance of $320,000 for tank, pumps and piping improvements only. Condition assessments in 2012 indicated that the hydropneumatic tank and strainers needed replacement in the near future. The FY 13 budget increased the allowance to $435,000, to include strainer replacement and design and ESDC costs, and accelerated it to FY 13. The Engineer’s Estimate for construction, received after adoption of the FY 13 CIP, was $680,000. This was reduced by prepurchasing the equipment, and the current projected project total is $575,000. This has been accommodated by budget transfers from under expended CIP accounts. FY 14 costs include an allowance to modify the pump impellers and a potential construction contract change order to account for piping modifications.
Elements ‐ Condition assessment and recommendations, evaluate available options. ‐ Select preferred alternative and design replacement equipment. ‐ Develop, bid, and execute contract(s) to implement recommended improvements. ‐ Replace plant and carrier water strainers, hydropneumatic tank and three plant
reclaimed water pumps.
GL 7400‐964‐00 Projected Expenditures FY 14 – 23
FY 14 $20,419
Total $20,419
Implementation Schedule
Schedule Activity Description Cost
FY 12 Inspection services, miscellaneous expenses $2,517
FY 13 Design and Engineering Services During Construction 93,000
Equipment prepurchase to expedite delivery 284,556
Construction contract, with CCO’s, including large deduct CCO. 188,300
FY 14 Pump modification and construction contract CCO (allowance) 15,000
Project closeout including record drawings 5,419
Project Total $588,792
Project Photos:
Original hydropneumatic tank. New tanks in place.
78 of 86

Critical Buried Pipe Inspection and Repairs
Type of Project Capital Construction Lead Department Engineering
Project Delivery Inspection – informally bid; repairs formally bid.
Description and Justification
There are several large diameter buried pipelines that are the only connection to convey wastewater into the Treatment Plant (the San Rafael and Ross Valley Interceptors) and to transfer water between major Plant treatment processes (the Primary effluent line between the Primary Clarifiers and the Biotowers and the Return Activated Sludge lines back from the Secondary Clarifiers to the Biotowers and Aeration Basins). The Treatment Plant pipelines contain elastomeric joints that are at or near the end of their expected service lives. The 2010 Capital Master Planning Assistance Report recommended that they be inspected and, if necessary, repaired. This project was designed to include diver inspections of the critical buried pipe flex joints, where possible, diver inspection of several large sumps in the Treatment Plant that would are difficult to keep dewatered, and inspecting those portions of the Interceptors that CMSA is responsible to maintain. The inspection work, originally planned for FY 12 and 13, was deferred to FY 14 due to unexpected delays in completing other priority projects.
Elements FY 14 ‐ (informally bid) Interior inspection of the pipelines, elastomeric joints, and selected sumps, with possible uncovering of the exterior of some buried joints
FY 14 ‐ (formally bid) Allowance for possible internal sealing of some or all of the elastomeric joints and external pipe repairs, based on inspection results.
FY 15 ‐ (informally bid) Allowance to inspect the portions of the San Rafael Interceptor and the Ross Valley Interceptor which CMSA is responsible for maintaining.
GL 7400‐966‐00 Projected Expenditures FY 14 – 23
FY 14 $225,000
FY 15 104,088
Total $329,088
Implementation Schedule
Schedule Activity Description Cost
FY 14
Allowance to perform diver inspections of critical pipelines and to have repairs performed based on results of inspection and scope of needed repairs
$225,000
FY 15 Allowance to inspect sections of the San Rafaela and Ross Valley Interceptors that CMSA is responsible to maintain.
104,088
Project Total $329,088
Project Photos:
Primary Effluent Pipe emerging into gallery RAS pipe manifold
79 of 86

Sludge Thickening System Replacement
Type of Project Capital Construction Lead Department Engineering
Project Delivery Formally bid
Description and Justification
Waste Activated Sludge (WAS) must be thickened before it is fed into the Agency’s anaerobic digesters. WAS is currently thickened in two Dissolved Air Flotation thickeners (DAFs) prior to feeding into the anaerobic digesters. The dissolved air flotation thickeners are 27 years old, are energy intensive and odorous, and are at the end of their useful lives. The Kennedy/Jenks Engineers’ 2010 Capital Master Planning Report identified Rotary Drum Thickeners (RTDs) as the preferred replacement. This project was originally scheduled for design in FY 13 and construction in FY 14; due to delays in the Digester Improvements Project, these activities have been scheduled for FY 14 and FY 15. This project includes identifying candidate replacement technologies (with an optional pilot test), with final design and construction of the selected alternative technology to replace the two aging dissolved air flotation thickeners, and supporting equipment.
Elements ‐ Issue a Request for Proposals and select a design consultant to perform predesign, possibly assist with pilot testing, perform final design, and provide engineering services during construction;
‐ Based on results of predesign, possible pilot testing, and final design, develop, bid, and execute a formally‐bid construction contract for DAF replacement.
GL 7300‐964‐10 Projected Expenditures FY 14 ‐ 23
FY 14 $405,880
FY 15 3,330,814
Total $3,736,694
Implementation Schedule
Schedule Activity Description Cost
FY 13 Develop RFP, select consultant
FY 14 Allowance for design, optional pilot testing, and various support costs through predesign, design, and contract development, advertising, and bidding.
$405,880
FY 15 Construction (including 10% change order allowance) 3,164,274
Engineering Services During Construction (estimated at 5%) 166,540
Project Total $3,736,694
Project Photos:
Existing DAF’s DAF Equipment Room
80 of 86

Digester Improvements/FOG‐F2E Facility
Type of Project Capital Construction Lead Department Engineering
Project Delivery Formally bid
Description and Justification
The anaerobic digesters' mixing system and floating steel covers are at the end of their useful lives and are being replaced with better technology. A FOG and food waste to energy receiving facility at CMSA provides a local disposal option, enhances biogas production at CMSA's anaerobic digesters and reduces fossil fuel reliance. This project includes digester mixing improvements, cover replacement, and a Fats, Oils and Grease (FOG) / and commercial food waste receiving station. This project was scheduled for completion during FY 13 and unforeseen difficulties with the first dual‐membrane digester cover delayed completion to early FY 14.
Elements ‐ Installing a more effective and energy‐efficient pumped mixing system (commonly used where FOG digestion is utilized);
‐ Replacing the digesters’ 25‐yr old floating steel covers with membrane covers; ‐ Constructing FOG and preprocessed commercial food waste receiving and mixing
station, to feed into the digesters to enhance biogas production; ‐ Replacing the biogas hydrogen sulfide removal system with newer, safer technology
and relocating it out of the pump equipment room; and ‐ Other mechanical, electrical, and process improvements to support the system.
GL 7430‐957‐10 Projected Expenditures FY 14 ‐ 23
FY 14 (Estimated) $991,016
Total $991,016
Implementation Schedule
Schedule Activity Description Cost
FY 09 ‐ 11 Studies, Predesign, Design, CEQA, Contract Development $709,585
FY 12
Aggregated Construction Costs (includes contract change orders, Engineering Services During Construction, third‐party construction management assistance, specialty tests, and added biosolids hauling, chemical and natural gas procurement costs).
4,402,925
FY 13 Aggregated Construction Costs 1,555,082
FY 14 Projected Contract Construction Costs 691,416
Change Orders Allowance ( 5% of remainder + concrete repairs) 134,000
Engineering Services During Construction (allowance) 42,600
Third Party CM Support (allowance) 80,000
Legal Services 6,000
Miscellaneous Parts and Supplies 35,000
Concrete and other specialty tests (allowance for 20 events) 2,000
Project Total $ 7,658,608
Project Photos:
Digesters: one new Dystor and original floating cover New FOG/F2E Facility.
81 of 86

Ten-Year Financial Forecast
82 of 86

FY 2013-14 Adopted Budget: 10-Year Financial Forecast The Agency updates a 10-year financial forecast each fiscal year to accompany the annual budget. The 10-Year Financial Forecast is a long-term budgetary examination of Agency operations and shows revenues, operating expenses, capital expenses and reserve balances. It provides a strategic perspective to guide the Board in making decisions on the direction for future budgets and sewer service rates. The 10-Year Financial Forecast is presented following this narrative. The starting point of the 10-year forecast is the FY 2012-13 (FY 13) Budgeted and Projected Summary of Funding Sources and Fund Requirements by Designation. At this time, preliminary estimates for year-end FY 13 reflect two unexpected events:
A year-end operating surplus of $380k in addition to the initial budgeted surplus of $226k. This additional surplus consists of additional revenues totaling $91k and reduced expenditures totaling $289k less budgeted.
A one-time new sewer connection fee from SD 2 residential development of $900k. The 10-year model for FY 2013-14 (FY 14) indicates that, consistent with the Board’s five year funding decision in February 2013, the Agency will have sufficient revenues to support operations over the next five fiscal years (FY 13-14 to FY 17-18). The 10-year forecast includes the following factors (line item references to forecast worksheet): EXPENDITURES Line #1: Operational Expenses:
Salaries: Increase in FY 14 as the Agency absorbs 0.5 FTE from the Revenue Bond program into operating budget and another 0.5 FTE in FY 15. Contractual COLA of 2.7% in FY 14 and estimated COLA of 3% thereafter.
Benefits: Increases in FY 14 & 15 as the Agency absorbs FTE (see Salaries) from the Revenue Bond program into operating budget.
CalPERS has indicated that starting in FY 14, special district employers can anticipate an additional contribution of 1-2% of salary due to the change in the Rate of Return assumption from 7.75% to 7.5% used by CalPERS. The forecast assumes an additional 1% starting in FY 15. CalPERS has also adopted new smoothing policy from 15 years to 5 years (Circular 200-19-13). This would increase the contribution by 1.1% per year starting in FY 15 to 5.5% at by the end of the five-year period in FY 20. Annual health benefit increases from the FY 11 GASB 45 actuary report reflect increase starting at 7.5% in FY 15 and declining by 0.3% per year thereafter. No forecast for the impact of Pension Reform at this time. The Agency has not experienced sufficient numbers of new hires to determine if future hires have prior public service which would not be impacted by pension reform.
83 of 86

Chemicals: Budget increase of 3.5% per year in the unit cost of chemicals combined with changes in the volume of chemicals used and the significant decrease in the unit price for ferric chloride, hydrogen peroxide and sodium hypochlorite.
FOG & Foodwaste to Energy: Incremental reduction in purchase of natural gas in FY 15 as the Agency begins to accept foodwaste and FOG. By FY 18, the Agency should no longer need to procure natural gas. No other revenue increases or expense reductions associated with electricity export or reduced electricity consumption are in the model at this time.
Increase in electricity costs associated with purchases from Marin Clean Energy. Agency still has to pay PG&E for the costs of transmission and distribution.
NPDES Permit Renewal: Planned costs of NPDES renewal in 2017 and 2022 starting in FY 16 and FY 21, respectively.
All other categories of expenditures: Increase 3.5% per year. REVENUES Line #2: Revenues - Regional Service Charge
FY 13-14 to FY 17-18. Five year revenues based on February 2013 Board approved funding plan (Line 6B).
FY 18-19 to FY 22-23. Use FY 18 Regional Service Charges as the baseline revenue as the Board has not made any decision to adjustment this item beyond FY 18.
Line #3: Revenues - All other Operational Revenues
SQSP revenues fixed at FY 13-14 levels of $1,252,248 until mediation with State, SD-1 and CMSA is settled.
No forecast of revenues for FOG and foodwaste disposal at this time.
Revised revenues from the Safety Director Program to reflect the withdrawal of two participating agencies.
Very modest increase in interest income given low interest rate environment. Line #5: Funding Surplus/(Deficit)
Slight deficit of $92k over the five year period (FY 13-14 to FY 17-18) due to the adjustment for one-time FY 14 expenses and the reduction in Safety Director Revenue
Deficits starting in FY 19-20 to FY 22-23 without adjustments to the Regional Service Charges beyond FY 17-18.
Line #6: Revenues – Allocation of Regional Service Charge Forecast allocation based on 36 month flow (April 2010 to March 2013) and 12 month strength (April 2012 to March 2013). Line #6B: Revenues – Five-Year Regional Service Charge Board approved (Feb 2013) funding plan. This figure does not include Board approved funding for future Capital.
84 of 86

Lines #7-10: Revenues – Debt Service Allocation of Debt Service based on FY 12-13 Actual EDU Count of 48,126 for JPA members and 4,005 for SQSP. CAPITAL IMPROVEMENT PROGRAM: Lines #12: 10-Year Capital Improvement Program Summary from 10-Year CIP schedule. Total FY 14 to FY 23 cost is $35.4 million. Lines #13: Funding Sources for 10-Year CIP
Revenue Bond: Assumes that there is a minimum of $1 million remaining to fund FY 13-14 CIP.
Restricted Capital Reserves: Due to the delays associated with the Digester Cover Replacement and unexpected connection fee revenues, the Agency did not need to use $1.7 million from this reserve in FY 13.
Unrestricted Capital Reserves: Includes February 2013 Board approved plan to begin collection of revenue to fund future CIP. Future Capital Funding will begin at $230k in FY 14 and increase by $100k each year until it reaches $630k in FY 18. The allocation of this funding to JPA members will also be based on flow and strength.
Line #14: CIP Funding Shortfall The Agency will not have sufficient funds in its two capital reserves to fully fund the CIP starting in FY 21. The total shortfall in FY 21 to FY 23 is expected to be $5.8 million. FUNDING FOR AGENCY RESERVES Lines #15-17: Funding for various reserves
Funding to/from Operating Reserves: When there are anticipated surpluses, a portion of the surplus will be used to maintain the Operating Reserves at 25% of the Operating Budget.
Funding for Future Capital: Represents the February 2013 Board action to collect revenues to fund at least 60% of the 10-Year CIP.
AGENCY RESERVES Lines 18-28: Shows the Projected Ending Balances for each reserve.
85 of 86

CENTRAL MARIN SANITATION AGENCY
Annual Update to the 10-Year Forecast Summary
Adopted FY 2013-14 Budget
Year 1 Year 2 Year 3 Year 4 Year 5 Year 6 Year 7 Year 8 Year 9 Year 10
Adopted Projected Adopted Forecast Forecast Forecast Forecast Forecast Forecast Forecast Forecast Forecast
FY 12-13 FY 12-13 FY 13-14 FY 14-15 FY 15-16 FY 16-17 FY 17-18 FY 18-19 FY 19-20 FY 20-21 FY 21-22 FY 22-23 Comments
Section I - General Operations:
1 Operational Expenses 9,523,315$ 9,234,309$ 10,082,029$ 10,563,344$ 11,081,936$ 11,571,707$ 11,904,731$ 11,724,554$ 11,911,270$ 12,483,923$ 13,028,822$ 13,398,783$ FY 14 to 18 = $55.2m
2 Regional/Sewer Service Charges for Operations 8,274,123 8,274,123 8,671,932 9,069,740 9,467,549 9,865,358 10,263,166 10,263,166 10,263,166 10,263,166 10,263,166 10,263,166 Board Approved 5-yr funding, Feb 13
3 All other Operational Revenues 1,475,409 1,566,882 1,540,527 1,520,652 1,534,738 1,574,140 1,603,701 1,596,105 1,588,880 1,597,045 1,605,376 1,614,124
4 Total Funding Sources 9,749,532 9,841,005 10,212,459 10,590,393 11,002,287 11,439,498 11,866,867 11,859,271 11,852,046 11,860,211 11,868,542 11,877,290 FY 14 to 18 = $55.11m
5 Funding Surplus/(Deficit): 226,217$ 606,696$ 130,430 27,049 (79,649) (132,209) (37,864) 134,717 (59,223) (623,712) (1,160,280) (1,521,493) FY 14 to 18 = $92k deficit
6 Allocation of Regional/SSC (line 2)
SRSD (FY 14 % alloc, 45.27%) 3,243,982 3,206,884 3,925,783 4,105,871 4,285,959 4,466,047 4,646,135 4,646,135 4,646,135 4,646,135 4,646,135 4,646,135
SD 1 (FY 14 % alloc, 44.92%) 4,196,162 4,180,627 3,895,432 4,074,127 4,252,823 4,431,519 4,610,214 4,610,214 4,610,214 4,610,214 4,610,214 4,610,214
SD 2 (FY 14 % alloc, 9.81%) 833,979 886,612 850,716 889,742 928,767 967,792 1,006,817 1,006,817 1,006,817 1,006,817 1,006,817 1,006,817
Total 8,274,123 8,274,123 8,671,932 9,069,740 9,467,549 9,865,358 10,263,166 10,263,166 10,263,166 10,263,166 10,263,166 10,263,166
6A
Board Approved (Feb 2013) Five-Year Regional/SSC Funding
Model for Operations 8,274,123 8,274,123 8,671,932 9,069,740 9,467,549 9,865,358 10,263,166
Change in Regional Service Charges from prior year (does not include Op Res Funding) 397,809 397,809 397,809 397,809 397,809
% Change 4.8% 4.6% 4.4% 4.2% 4.0%
Section II - Debt Service on 2006 Revenue Bonds
Funding Requirements
7 Debt Service (Prin & Int) 4,656,751$ 4,656,751$ 4,656,359$ 4,652,501$ 4,654,176$ 4,657,189$ 4,653,851$ 4,653,589$ 4,656,664$ 4,656,129$ 4,656,270$ 4,652,395$ Debt Service Schedule
8 Debt Service Coverage 1,164,188 1,164,188 1,164,090 1,163,125 1,163,544 1,164,297 1,163,463 1,163,397 1,164,166 1,164,032 1,164,068 1,163,099 25% of Debt Service Schedule
9 Total Funding Sources 5,820,939 5,820,939 5,820,448 5,815,627 5,817,720 5,821,486 5,817,314 5,816,986 5,820,830 5,820,162 5,820,338 5,815,494
10 Allocation of Debt Service (FY 14=48106 units)
SRSD (FY 14 alloc, 19,482 EDU) 2,203,042 2,188,868 2,176,008 2,174,206 2,174,989 2,176,396 2,174,837 2,174,714 2,176,151 2,175,901 2,175,967 2,174,156
SD 1 (FY 14 alloc, 22,508 EDU) 2,487,375 2,508,502 2,513,992 2,511,910 2,512,814 2,514,440 2,512,639 2,512,497 2,514,157 2,513,868 2,513,944 2,511,852
SD 2 (FY 14 alloc, 6,116 EDU) 675,929 668,977 683,116 682,550 682,796 683,238 682,748 682,710 683,161 683,082 683,103 682,535
SQSP (FY 14 alloc, 4,005 EDU) 454,592 454,584 447,332 446,961 447,122 447,411 447,091 447,065 447,361 447,310 447,323 446,951
Total 5,820,939 5,820,931 5,820,448 5,815,627 5,817,720 5,821,486 5,817,314 5,816,986 5,820,830 5,820,162 5,820,338 5,815,494
11 EDU Rate for Debt Service 113.51$ 111.70$ 111.69$ 111.60$ 111.64$ 111.71$ 111.63$ 111.63$ 111.70$ 111.69$ 111.69$ 111.60$ 48,126 units
Section III - Capital Improvement Program
12 Ten-Year CIP Projects 7,091,844 4,612,971 4,498,486 6,536,057 3,676,178 1,769,986 3,393,551$ 1,623,382$ 2,594,591$ 3,125,858$ 3,122,173$ 5,028,535$ FY 13-23= $35.39m
13 CIP Funding Sources
1. Remaining Revenue Bond Proceeds 5,385,000 3,714,271 991,016 - - - - - - - - -
2. Restricted Capital Reserves 1,706,844 - 3,507,470 2,744,385 1,163,125 1,163,544 1,164,297 1,163,463 1,163,397 1,164,166 1,164,032 1,164,068
3. Unrestricted Capital Reserves - - - 3,791,672 2,513,052 606,442 2,229,254 459,919 1,431,194 702,182 630,000 630,000
Total Available Funding 7,091,844 3,714,271 4,498,486 6,536,057 3,676,178 1,769,986 3,393,551 1,623,382 2,594,591 1,866,348 1,794,032 1,794,068 FY 13-23= $29.55m
14 CIP Funding Shortfall - - - - - - - - - (1,259,510) (1,328,140) (3,234,467) FY 13-23= $5.8m shortfall
Section IV - Funding for Agency Reserves
15 Funding to/(from) Operating Res 24,223$ 24,223$ 130,430$ 27,049$ (79,649)$ (132,209)$ (37,864)$ 134,717$ (59,223)$ (623,712)$ (1,160,280)$ (1,521,493)$ not funded to maintain @ 25% of budget
16 Funding for Unrestricted Capital Reserves 201,994 582,473 - - - - - - - - - -
A. Board Approved (Feb 2013) Funding for Future Capital - - 230,000 330,000 430,000 530,000 630,000 630,000 630,000 630,000 630,000 630,000 FY 13-23= $5.3m
17 Total 226,217 606,696 360,430 357,049 350,351 397,791 592,136 764,717 570,777 6,288 (530,280) (891,493)
Section V: Adjustments to Cash & Investments/Reserves
18 Total Beginning Reserves on July 1 13,741,424 13,741,424 15,512,308 13,529,358 8,513,475 6,351,193 6,143,295 4,505,343 4,810,075 3,950,426 3,254,399 2,094,154
Reserve Designations, Ending Balance on June 30
19 A. Restricted: Capacity Charges - - - - - - - - - - - -
20 B. Restricted: Capital Improvement Program (Debt Coverage) 3,381,889 5,087,765 2,744,385 1,163,125 1,163,544 1,164,297 1,163,463 1,163,397 1,164,166 1,164,032 1,164,067 1,163,099
21 Subtotal Restricted Reserves 3,381,889 5,087,765 2,744,385 1,163,125 1,163,544 1,164,297 1,163,463 1,163,397 1,164,166 1,164,032 1,164,067 1,163,099
22 1. Unrestricted: CSRMA Insurance Deductible 100,000 100,000 100,000 100,000 100,000 100,000 100,000 100,000 100,000 100,000 100,000 100,000
23 2. Unrestricted: Operating Reserves 2,380,829 2,380,829 2,511,259 2,538,308 2,458,659 2,326,449 2,288,586 2,423,302 2,364,079 1,740,367 580,087 46 Depleted FY 22 % of Reserve to Operating Expenses (Line 1) 24.9% 24.0% 22.2% 20.1% 19.2% 20.7% 19.8% 13.9% 4.5% 0.0%
24 3. Unrestricted: Capital Improvement Program 7,313,235 7,693,714 7,923,714 4,462,042 2,378,990 2,302,548 703,294 873,375 72,182 (0) (0) (0) Insufficient FY 21
25 4. Unrestricted: Emergency 250,000 250,000 250,000 250,000 250,000 250,000 250,000 250,000 250,000 250,000 250,000 - Depleted FY 22
26 Subtotal Unrestricted Reserves 10,044,064 10,424,543 10,784,973 7,350,350 5,187,649 4,978,998 3,341,880 3,646,678 2,786,260 2,090,367 930,087 100,046
27 Total Ending Reserves on June 30 13,425,953 15,512,308 13,529,358 8,513,475 6,351,193 6,143,295 4,505,343 4,810,075 3,950,426 3,254,399 2,094,154 1,263,144
28 Change in Beginning and Ending Reserves (315,471) 1,770,884 (1,982,950) (5,015,882) (2,162,282) (207,898) (1,637,952) 304,732 (859,649) (696,027) (1,160,245) (831,010)
86 of 86