
FY 2010-2011 Operating Budget
164
FY 2010-2011 Operating Budget Alamo Community College District
Transcript of FY 2010-2011 Operating Budget

[Type text]
FY 2010-2011
Operating Budget
Alamo
Community
College
District

[Type text]
THE ALAMO COMMUNITY COLLEGE DISTRICT
FY 2010-2011 Instruction and General Operating Budget
BOARD OF TRUSTEES
Joe Alderete Jr., District 1
Denver McClendon, District 2
Anna U. Bustamante, Secretary, District 3
Marcelo Casillas, Assistant Secretary, District 4
Roberto Zárate, District 5
Gene Sprague, District 6
Blakely Latham Fernandez, District 7
Gary Beitzel, Chairman, District 8
James Rindfuss, Vice Chairman, District 9
Bruce H. Leslie, Ph.D., Chancellor
Diane E. Snyder, CPA, M.S., Vice Chancellor for Finance and Administration
Pamela K. Ansboury, CPA, M.Ed., Associate Vice Chancellor for Finance and Fiscal Services
Lily F. Tercero, Ph.D., Chief Budget Officer

FY 2010-2011 Operating Budget
Page 1
Table of Contents
INTRODUCTION ........................................................................................................................ 3
Message from the Chancellor ........................................................................................................... 4
Report from the Vice Chancellor for Finance and Administration ................................................ 5
FY2011 Budget Highlights ............................................................................................................. 5
Financial Impact of Projected Enrollment Growth........................................................................ 6
Funding Implications of State-Mandated Cuts ............................................................................. 6
Tax Base Valuation ......................................................................................................................... 7
Tuition and Fees ............................................................................................................................... 8
Other Income.................................................................................................................................... 8
Notes from the Chief Budget Officer .............................................................................................. 9
Budget Pressures – Overview ......................................................................................................... 11
Organizational Chart ...................................................................................................................... 12
Division Descriptions ......................................................................................................................... 13
History of the Alamo Community College District ........................................................................ 14
Strategic Plan 2009-2012 ............................................................................................................. 15
Key Performance Indicators ............................................................................................................ 18
Achieving the Dream ........................................................................................................................ 19
Integrated Planning ......................................................................................................................... 20
FINANCIAL INFORMATION ................................................................................................... 21
Revenue Summary ............................................................................................................................ 22
State Appropriations .................................................................................................................... 22
Tuition and Fees ............................................................................................................................. 22
Local Ad Valorem Taxes .............................................................................................................. 22
Other Revenue ............................................................................................................................... 23
Restricted Funds ................................................................................................................................ 23
Budget Strategies/Total All Funds Budget Summary .................................................................. 23
All Funds Financial Structure ........................................................................................................... 24
Three Year Comparison – I&G Operating Budget ...................................................................... 27
Revenue by Category ..................................................................................................................... 28
FY11 Revenue Summary ................................................................................................................. 29
FY11Formula Revenue Summary .................................................................................................... 30
FY11 Non-Formula Revenue Summary .......................................................................................... 31
FY11 Tuition Revenues by Semesters ............................................................................................. 32
FY11 Pledged Tuition Revenues by Semesters ............................................................................. 33
State Appropriations ....................................................................................................................... 34
State Appropriation Allocation Distribution (Estimated/Final).................................................... 35
Base Period Contact Hour Rates by Discipline ............................................................................. 36
Assessed Value and Tax Levy of Taxable Property ................................................................... 37
Ten Year Trend of Revenue Sources .............................................................................................. 38
Expenditure Summary...................................................................................................................... 39

FY 2010-2011 Operating Budget
Page 2
Budget Summary by Account Type ................................................................................................ 39
Budget Summary by Salary and Other Expense ......................................................................... 40
Budget Summary by Functional Category .................................................................................... 41
Functional Category Descriptions ................................................................................................... 42
Department Listing by Functional Categories ............................................................................... 45
Capital Budget ................................................................................................................................. 58
Debt Service Funds .......................................................................................................................... 58
Three Year Staffing Summary ........................................................................................................ 63
Three Year Staffing Summary – District Only .............................................................................. 64
Summary by Functional Category .................................................................................................. 65
Contact Hours ................................................................................................................................... 78
Unduplicated Headcount Enrollment .............................................................................................. 79
SUPPLEMENTAL INFORMATION ............................................................................................ 80
Budget Process and Budget Calendar .......................................................................................... 81
Workload-Driven Budgeting Model .............................................................................................. 83
FY11 Budget Model Summary ....................................................................................................... 84
Budget Model Funding Methodology and Formulas .................................................................... 85
District Operations Expense Budget - % of Total Budget ........................................................... 98
Salary Schedules .............................................................................................................................. 99
Financial Policies and Procedures ............................................................................................... 120
Tuition and Fee History ................................................................................................................. 124
Enrollment Reports ......................................................................................................................... 125
Campus Locations .......................................................................................................................... 126
FY11 Budget-Related Board Minute Orders/Approved Minutes ........................................... 127
Glossary ......................................................................................................................................... 156

FY 2010-2011 Operating Budget
Page 3
INTRODUCTION

FY 2010-2011 Operating Budget
Page 4
Alamo Community College District F Y 2 0 1 0 - 2 0 1 1 I N S T R U C T I O N A N D G E N E R A L O P E R A T I N G B U D G E T
Message from the Chancellor
Members of the Board of Trustees and Residents of the Alamo Community College District service area:
It is a pleasure to present the Alamo Community College District (ACCD; Alamo Colleges; District) FY 2010-
2011 Instruction and General (I&G) Operating Budget. It is a product of significant planning and input from
the entire college community. For the third year, it is based on a workload-driven budgeting model.
As in the past, the operating budget is designed to fulfill the District‘s mission of ―empowering our diverse
communities for success‖ and emanates from the strategic plan‘s goals and strategies approved by the Board
of Trustees.
While this budget document provides a comprehensive review of the operating budget, there are some key
actions taken by the Board of Trustees that deserve to be highlighted. These actions have been taken
primarily to address the unprecedented fiscal cuts in state aid and to compensate for the necessary expansion
of facilities, personnel and services to sustain the continuing enrollment growth at the Alamo Colleges.
The maintenance and operations tax rate was adjusted to the calendar year 2010 effective tax rate,
which will provide an additional $5 million in tax revenue.
The tuition rates were increased by 5 percent and the general fee was increased by $8.00, effective
Spring 2011, which will provide an additional $2.4 million in tuition and fee revenue.
A full-cost recovery pricing model for continuing education will be implemented, which will provide an
additional $500,000 in contract and tuition revenue.
Most importantly, I want to recognize the contributions that are made by our faculty and staff in support of
our amazing student body. While I am pleased to submit a budget that reflects these impressive
contributions, I recognize that this year‘s budget is constrained by external environmental factors. The severe
economic changes facing the nation and our state continue to negatively impact almost all private and public
sectors of the economy. The Alamo Colleges is no exception.
We will continue to work diligently to address the challenge of inadequate funding from the state. We will
continue to identify and implement necessary innovative practices and processes while simultaneously
maintaining the quality of our services and open access. To that end, I want to assure the taxpayers that the
Alamo Colleges will continue to provide affordable, accessible and quality learning experiences.
Sincerely,
Bruce H. Leslie, Ph.D.
Chancellor

FY 2010-2011 Operating Budget
Page 5
Repor t from the Vice Chancellor for Finance and Administration
FY2011 Budget Highlights
The FY11 Unrestricted Operating Budget has been prepared according to Generally Accepted Accounting
Principles, using an accrual basis of budgeting (comparable to the audited financial statements), Board policy
and the Texas Higher Education Coordinating Board guidelines as defined in the Budget Requirements and
Annual Financial Reporting Requirements for Texas Public Community and Junior Colleges. Additionally, notices
of the Budget Planning and Budget Adoption meetings were posted according to the Texas Government code,
Sections 551.00-551.146.
On August 19, 2010, the Board of Trustees approved the FY11Instruction and General (I&G) Operating
Budget (Unrestricted Funds) in the amount of $278,589,000 and a Capital expense budget of $4,500,000,
for a Total I&G Operating budget of $284,589,000. This budget is based on revenues of $279,589,000
and a fund balance transfer of $5,000,000.
Revenue Sources Amount % of Total
State Funds $ 67.4 million 24%
Local Taxes $ 92.4 million 32%
Tuition/Fees $111.1 million 39%
Other $ 8.7 million 3%
Fund Balance $ 5.0 million 2%
Total $284.6 million 100%
The FY11 I&G Operating Budget includes 25 strategies as summarized below to balance the budget and to
support a 5.5 percent growth in enrollment. These strategies are the result of an extensive review and
evaluation process conducted by each of the five colleges and the district office.
The FY11 I&G Operating Budget also includes a preventative maintenance budget at $5,000,000 and the
addition of four peace officers at a cost of approximately $200,000. During FY11, salaries remain at the
level approved in FY10.
In order to address state-mandated cuts, extensive analysis and assessment was undertaken at two separate
retreats held in June 2010. During these sessions, additional cost-cutting strategies were identified to address
the 5 percent reduction in state appropriation revenue for FY10 as well as the 10 percent state funding
reduction for FY12 and FY13 that was requested from the state. Retreat participants included faculty, staff,
administrators and members of the board of trustees. Below is a summary of the strategies that were
identified.
Strategy FY11Impact
Increase tuition by 5 percent $ 1.90 million
Authorize effective tax rate to support facilities costs of 24 new buildings $ 5.00 million
Implement other revenue generation initiatives $ 2.02 million
Implement Alamo workforce reduction through attrition initiatives $ 9.46 million
Reduce other expense $ 2.82 million
Total $ 21.20 million

FY 2010-2011 Operating Budget
Page 6
While some of these strategies are being implemented during FY11, others will be implemented in FY12 and
FY13. The Alamo Colleges must remain focused on implementing these strategies in order to stay within the
FY11 budget, be in a position to weather the additional reductions anticipated for the next fiscal year, and
simultaneously continue to provide access and services to our students and the communities we serve.
Financial Impact of Projected Enrollment Growth
The Alamo Colleges continues to experience growth in enrollment; FY10 unduplicated credit enrollment
reached 83,673. Contact hours, students time in the classroom, has increased 5 percent on average for the
last four years and are projected to increase 5.5 percent for FY11.
This level of growth, anticipated to continue for the foreseeable future, will also result in additional financial
needs for the Alamo Colleges. Although the costs associated with this growth have been absorbed within this
fiscal year‘s operating budget, the increases from the usual operations of the District have been funded with
additional tuition and property tax dollars. This is primarily due the continuing decline in state revenue. The
burden of maintaining the quality of existing programs is increasingly being placed on the students and the
local taxpayers.
Funding Implications of State-Mandated Cuts
The Alamo Colleges‘ budget has been particularly impacted this fiscal year due to unexpected state-
mandated cuts. In May 2010, the Texas Legislature reduced the 2010-11 General Revenue and General
Revenue-Dedicated appropriations for state agencies and institutions of higher education by 5 percent.
Additionally, in May 2010, all state agencies and institutions of higher learning were directed to submit, as
part of their FY12 and FY13 Legislative Appropriations Request, a plan on how they would reduce the
baseline request for General Revenue-related funding by an additional 10 percent. Unfunded growth adds
an additional $5 million cost pressure annually. As a result, the Alamo Colleges had to close a $21 million
budget gap in FY11 and projects additional $27 million budget pressures in the FY12 and FY13 biennium.
In order to address these anticipated cuts in current and future state revenues, Chancellor Bruce Leslie
appointed a team of approximately 50 leaders from all five colleges and the District office, including staff,
faculty, administrators, and trustees, to address this challenge. Two retreats were held in June to identify
strategies to address these mandatory cuts. The Leadership Team agreed upon 25 major strategies, focusing
primarily on student success. Additionally, this group reviewed hundreds of employee suggestions compiled
from participant surveys and ideas submitted to the Chancellor‘s Suggestion Box online. The difficult work of
implementing these strategies is underway and will continue for the foreseeable future.
During this first iteration, the Leadership Team did not recommend general layoffs of full-time employees.
However, several of the approved strategies will be examining staffing levels, compensation, workload and
other related working conditions. Unfortunately, the need to restructure operations has become a necessity
and some functions will need to be discontinued or outsourced. Every effort will be made, however, to
reassign individuals where and when this is possible.
Below is a listing of cost savings ideas recommended by the Leadership Team during the summer 2010
Leadership Retreats, which were incorporated in the FY11 operating budget.
FY 2010-2011 Operating Budget
Page 7
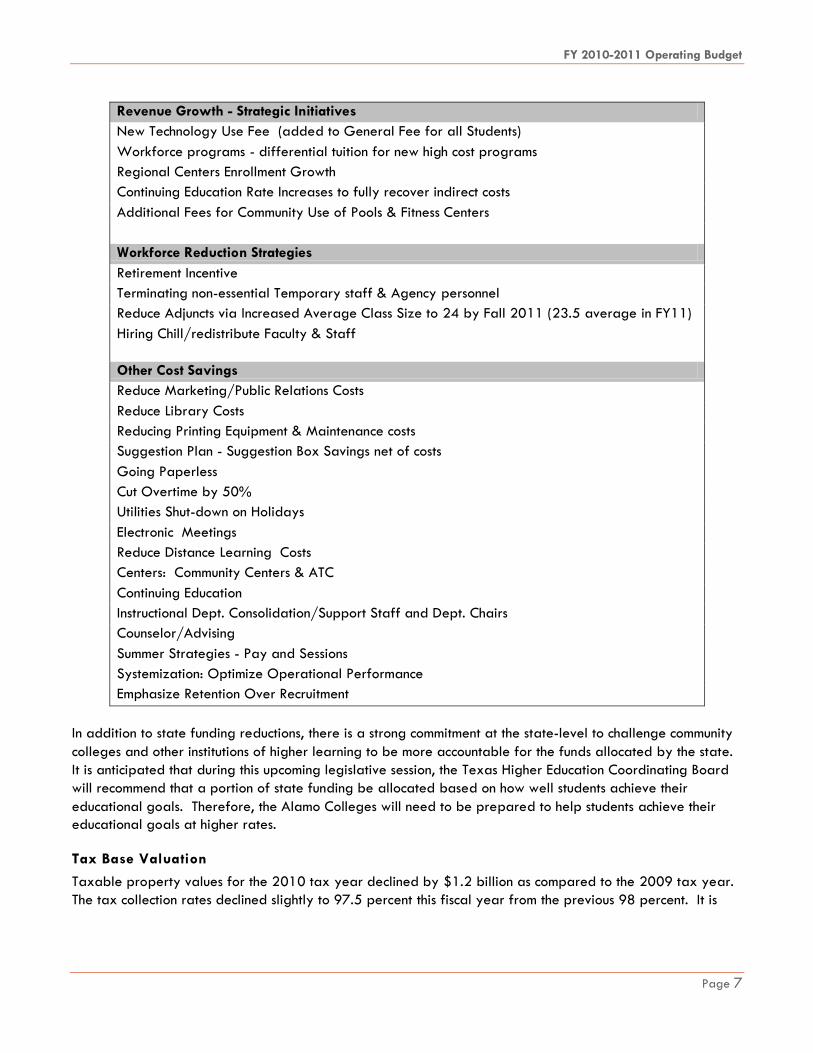
Revenue Growth - Strategic Initiatives
New Technology Use Fee (added to General Fee for all Students)
Workforce programs - differential tuition for new high cost programs
Regional Centers Enrollment Growth
Continuing Education Rate Increases to fully recover indirect costs
Additional Fees for Community Use of Pools & Fitness Centers
Workforce Reduction Strategies
Retirement Incentive
Terminating non-essential Temporary staff & Agency personnel
Reduce Adjuncts via Increased Average Class Size to 24 by Fall 2011 (23.5 average in FY11)
Hiring Chill/redistribute Faculty & Staff
Other Cost Savings
Reduce Marketing/Public Relations Costs
Reduce Library Costs
Reducing Printing Equipment & Maintenance costs
Suggestion Plan - Suggestion Box Savings net of costs
Going Paperless
Cut Overtime by 50%
Utilities Shut-down on Holidays
Electronic Meetings
Reduce Distance Learning Costs
Centers: Community Centers & ATC
Continuing Education
Instructional Dept. Consolidation/Support Staff and Dept. Chairs
Counselor/Advising
Summer Strategies - Pay and Sessions
Systemization: Optimize Operational Performance
Emphasize Retention Over Recruitment
In addition to state funding reductions, there is a strong commitment at the state-level to challenge community
colleges and other institutions of higher learning to be more accountable for the funds allocated by the state.
It is anticipated that during this upcoming legislative session, the Texas Higher Education Coordinating Board
will recommend that a portion of state funding be allocated based on how well students achieve their
educational goals. Therefore, the Alamo Colleges will need to be prepared to help students achieve their
educational goals at higher rates.
Tax Base Valuation
Taxable property values for the 2010 tax year declined by $1.2 billion as compared to the 2009 tax year.
The tax collection rates declined slightly to 97.5 percent this fiscal year from the previous 98 percent. It is

FY 2010-2011 Operating Budget
Page 8
anticipated that this trend will continue into the coming fiscal years and that even more dramatic reductions in
property values may transpire, if economic conditions do not improve.
Tuition and Fees
The Board of Trustees approved an increase to tuition rates, effective spring 2011, for in-district, out-of-
district, non-resident, and international students. The General Fee was increased by $8.00, effective Spring
2011. Additionally, the tuition/fee structure for Continuing Education will be reviewed and adjusted during
this coming fiscal year. These actions will provide an additional $2.4 million in revenue for FY11.
As a result, for fall 2010, in-district students taking 12 semester credit hours will pay a total of $642 in tuition
and $127 in general fees for a total of $769. Effective Spring 2011, in-district students taking 12 semester
hours will pay $672 in tuition and $135 in general fees for a total of $807. This is equates to an increase of
$30 or 3.9 percent in tuition costs and an increase of $8.00 or 6.3 percent in fees.
The Alamo Colleges, however, remains very affordable in comparison to other local institutions of higher
education. At the University of Texas at San Antonio, in-district students taking 12 semester credit hours in
Spring 2011 should expect to pay a total of $3,363.75 in tuition and fees. The cost to enroll for 12 semester
credit hours at St. Mary‘s University in Spring 2011 totals $8,178.
Given the continuing reductions in state revenue coupled with a declining tax base, this revenue source will
most likely become a more critical source of revenue in the coming years, for the Alamo Colleges and all
Texas public community colleges and universities.
Other Income
Given the current economic conditions, increases to this source of revenue are not anticipated. The FY11
operating budget reflects a decrease of $1.7 million due primarily to the continuing low interest rate on
investments.

FY 2010-2011 Operating Budget
Page 9
Notes from the Chief Budget Officer
The Budget as a Policy Document
As a policy document, the Budget Document provides a global view of the financial activity within The Alamo
Colleges. It includes a Report from the Vice Chancellor for Finance and Administration in the Introductory
Section, which summarizes the FY11 Instruction & General Operating Budget along with cost containment
actions and strategies developed as part of the budget-building process. An explanation of the workload-
driven budgeting process is included in the Supplemental Section to show the detailed components of the
Model. Minute Orders and Approved Minutes reflecting actions taken by the Board of Trustees for the FY11
budget, including changes made to the tuition and fee structure, are also provided. The document includes an
All Funds Report that incorporates both unrestricted and restricted activity. Budget-related policies, including
but not limited to the budget (adopting principles, adjustments, reallocations, & amendments), long-term
financial policies for our capital improvement plan and debt service are located in the Supplemental section
of the document. The Alamo Colleges‘ Strategic Plan, the Strategic Initiatives, the Key Performance Indicators
and the Integrated Planning Approach followed by the Alamo Colleges are also provided.
The Budget as an Operations Guide
The budget development process is comprised of two major components:
1. Workload Budget Allocation Model, which allocates the operating expense budgets for each of the
colleges and the district departments using a standard allocation methodology. Revenues are also
forecasted and budgeted in a district-level account except for certain non-formula revenue such as
non-credit contract and continuing education revenue, special program tuition, and student activity
fees. A detailed description of the workload budget distribution model, including a detailed listing of
the allocation methodology and key model cost drivers, is included in the Supplemental section of the
document. Key components include target class size by discipline; faculty contact hours per staffing
unit; district-wide average salary; cost per contact hour; fall enrollments; projected contact hours;
facilities cost per square footage, and other instruction salaries and operating expenses.
2. Budget Distributions are subsequently performed by the colleges and district budget officers at the
organizational and account level. Approved full-time employee positions are loaded into Banner
Human Resource system; and non-labor allocations are loaded into Banner Finance system, balancing
to the total authorized expense budget for each college and district department. Also included in the
Supplemental section of this document is summary data of the Budget by Functional Category and the
associated departments within those functional categories, summary staffing by functional category
and type, and detailed allocations for operational departments.
The Budget as a Financial Plan
The Financial Information section provides detailed information relating to both revenues and expenses. Each
section contains both summary and detailed information by revenue source and projected expenditures. The
revenue section includes information related to state appropriations and associated contact hour data; and
ad valorem taxes and tax rates. The Fund Balance information is also available in this section. The
expenditure section includes summaries by functional categories; summary and comparison data by type; and
mandatory and contractual services such as utilities and insurance. A preventive maintenance schedule by
campus along with the capital improvement projects (CIP) funded with maintenance tax notes and revenue
bonds can also be found in this section. The Debt Service section speaks to the status of the maintenance tax
notes and revenue bonds. The Supplemental Information section contains salary schedules.
FY 2010-2011 Operating Budget
Page 10
The Budget as a Communications Device
The budget document is designed to fully communicate the financial position of Alamo Colleges while serving
as the foundation for the Alamo College‘s allocation of resources toward fulfilling the mission of the institution.
This Budget Document includes summary information in text, tables, and graphs for easier interpretation of the
data. In addition to this guide, a table of contents provides a listing of the various topics in the budget
document and a glossary provides an explanation of key concepts and terminology.
FY 2010-2011 Operating Budget
Page 11
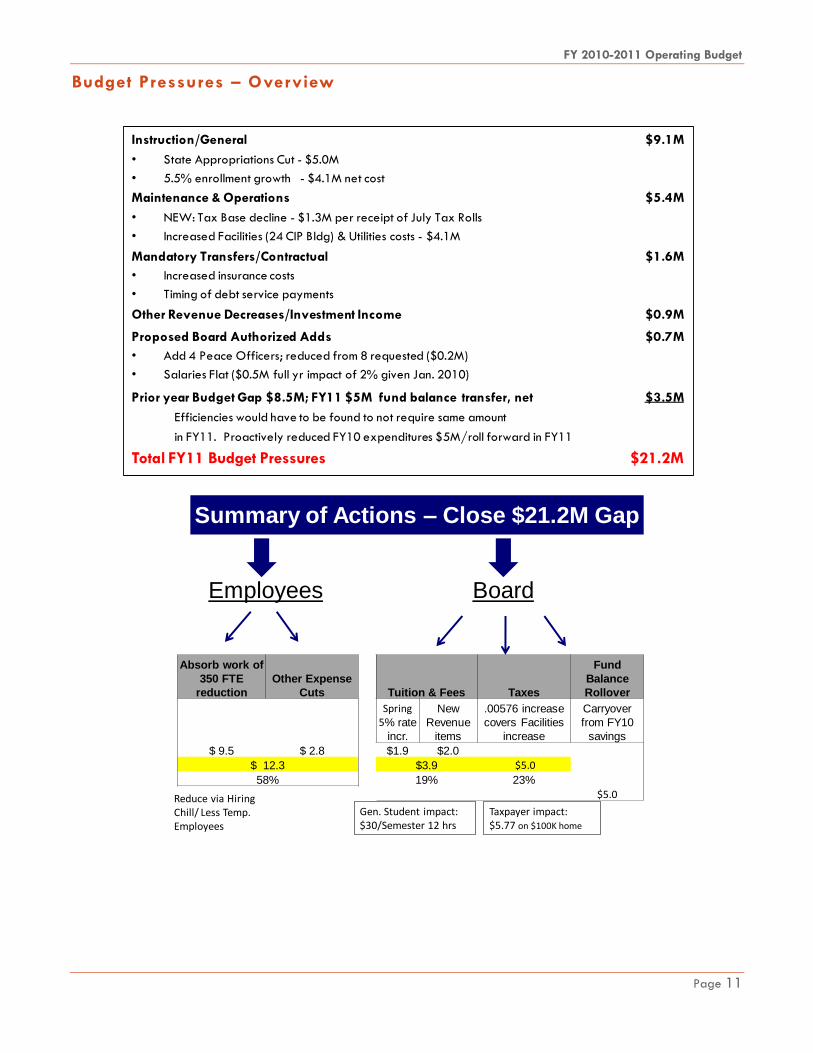
Budget Pressures – Overview
Instruction/General $9.1M
• State Appropriations Cut - $5.0M
• 5.5% enrollment growth - $4.1M net cost
Maintenance & Operations $5.4M
• NEW: Tax Base decline - $1.3M per receipt of July Tax Rolls
• Increased Facilities (24 CIP Bldg) & Utilities costs - $4.1M
Mandatory Transfers/Contractual $1.6M
• Increased insurance costs
• Timing of debt service payments
Other Revenue Decreases/Investment Income $0.9M
Proposed Board Authorized Adds $0.7M
• Add 4 Peace Officers; reduced from 8 requested ($0.2M)
• Salaries Flat ($0.5M full yr impact of 2% given Jan. 2010)
Prior year Budget Gap $8.5M; FY11 $5M fund balance transfer, net $3.5M
Efficiencies would have to be found to not require same amount
in FY11. Proactively reduced FY10 expenditures $5M/roll forward in FY11
Total FY11 Budget Pressures $21.2M
Employees Board
Summary of Actions – Close $21.2M Gap
Absorb work of
350 FTE
reduction
Other Expense
Cuts
$ 9.5 $ 2.8
$ 12.3
58%
Tuition & Fees Taxes
Fund
Balance
Rollover
Spring 5% rate
incr.
New
Revenue
items
.00576 increase
covers Facilities
increase
Carryover
from FY10
savings
$1.9 $2.0
$3.9 $5.0
19% 23%
$5.0Reduce via Hiring Chill/ Less Temp. Employees
Gen. Student impact: $30/Semester 12 hrs
Taxpayer impact: $5.77 on $100K home

FY 2010-2011 Operating Budget
Page 12
Organizational Char t
Deputy to the Chancellor
General Counsel
District Ethics &
Compliance Officer
Executive Director of
Inst’l Advancement
District Director of
Internal Audit
Board Liaison
Northeast Lakeview College
President
Northwest Vista College
President
Palo Alto College
President
San Antonio College
President
St. Philip’s College
President
Vice Chancellor for Economic &
Workforce Dev
Vice Chancellor for
Finance & Admin.
Vice Chancellor for Academic
Success
Vice Chancellor for
Student Success
Vice Chancellor for
Planning, Performance,
& Info Systems
Chancellor
BOARD OF TRUSTEES

FY 2010-2011 Operating Budget
Page 13
Division Descriptions
Office of the Chancellor
The Chancellor is the principal administrative official responsible for the direction of all operations of the
District. Specific responsibilities include, but are not limited to, serving as chief executive officer of the Alamo
Colleges, implementing the policies of the Board and assuming overall responsibility for District programs and
services, including administration, organization, personnel, education and instruction, student services, and
business affairs.
College Presidents
Each of the five college presidents serves as the chief executive officer of the college. The Presidents are
primarily responsible for the daily administration and operation of the college, and for interpreting policies
and procedures to ensure compliance with the Alamo Colleges and other legal requirements.
Vice Chancellor for Academic Success
The Vice Chancellor for Academic Success is primarily responsible for leading district-wide academic and
instructional efforts and for implementing Board policy and cross-college operational procedures for
academic success, including academic and instructional targets, benchmarks and outcomes. The Vice
Chancellor also establishes district-wide academic and instructional goals, objectives and priorities within the
Strategic Plan and guides the development and implementation of programs and services to accomplish these
goals and objectives.
Vice Chancellor for Finance and Administration
The Vice Chancellor for Finance and Administration is responsible for managing the operational and financial
areas of the institution, including the maintenance of facilities, financial services, purchasing, budgeting,
financial reporting, audit support, grants/contracts, mailing services, moving services, business services, safety,
risk management, police, and human resources. Master facility planning, including purchasing property,
renovation and new construction is also coordinated through this division.
Vice Chancellor for Planning, Performance and Information Systems
The Vice Chancellor for Planning, Performance and Information Systems is responsible for overseeing the
planning, institutional research, and information technology service functions of the institution. The Vice
Chancellor also manages the areas of information technology infrastructure and architecture, enterprise wide
applications and implementations, database management, data center operations, software development,
network services, information security, client support, applications support, telecommunications, and on-line
learning.

FY 2010-2011 Operating Budget
Page 14
Vice Chancellor for Student Success
The Vice Chancellor for Student Success coordinates with the five district colleges, Northeast Lakeview
College, Northwest Vista College, Palo Alto College, San Antonio College, and St. Philip's College, to ensure
the delivery of comprehensive student services district-wide including Financial Aid and back office admissions
support (via the newly formed Center for Student Information). Programs and services to assist students in
reaching their academic goals are coordinated by the following offices: Student Financial Services, Student
Leadership Institute, Military Education, and the Mobile GO Center.
Vice Chancellor for Economic and Workforce Development
The Vice Chancellor for Economic and Workforce Development is responsible for overseeing the planning,
development and implementation of programs relating to continuing professional education, workforce
training, basic skills instruction, and additional programs in response to the non-traditional educational needs
of the community.
History of the Alamo Community College District
Following passage of state legislation authorizing junior college districts, the San Antonio Union Junior College
District was formed in 1945. In 1946 it assumed control of San Antonio Junior College, which had been run
by the San Antonio Independent School District, and St. Philip's Junior College, a private school. District
offices were initially maintained at San Antonio College and later relocated to the current location at 201 W.
Sheridan St. In 1978, the name of the District was changed to San Antonio Community College District and
renamed the Alamo Community College District in 1982.
In April 2009, the Board of Trustees approved a new logo and name change to Alamo Colleges in an effort
to increase public awareness of institution‘s full scope of services and its diverse, high quality educational
programming. The legal name of the institution remains the Alamo Community College District.
The Alamo Colleges consists of five colleges strategically located throughout its service area. It is a two-year,
comprehensive public community college that provides programs toward an Associate of Arts, an Associate of
Science and an Associate of Applied Science. These degrees transfer to four-year colleges and universities.
In addition, the Alamo Colleges offers certificates of completion in a variety of technical and occupational
fields. Numerous services are available to students at each of the colleges, including but not limited to,
counseling, computer labs, tutoring, financial services, services for the disabled, developmental instruction,
veteran's services, and job placement.
The Alamo Colleges‘ service area includes Atascosa, Bandera, Bexar, Comal, Guadalupe, Kendall, Kerr and
Wilson counties. The Alamo Colleges is governed by a nine-member board of trustees elected for staggered
six-year terms in single member districts within Bexar County. The Chancellor, the district's chief executive
officer, guides and implements the programs and policies of the Alamo Colleges.
The Colleges
St. Philip‘s College (established 1898)
San Antonio College (established 1925)
Palo Alto College (established 1985)
Northwest Vista College (established 1995)
Northeast Lakeview College (established 2007)

FY 2010-2011 Operating Budget
Page 15
Off-Campus Sites
The Alamo Colleges also maintains several off-campus sites in an effort to better serve the residents of Bexar
County and those located within the surrounding service area.
St. Philip's College Southwest Campus
Advanced Technology Center
St. Philip's College Military Base Locations
Palo Alto College Off-Campus Locations
Northwest Vista College at Data Point
Central Texas Technology Center, New Braunfels, TX
Alamo Colleges Community Education Centers
Westside Workforce Education and Training Center
Greater Kerrville - Alamo Colleges Center
Northwest Vista College, Palo Alto College, St. Philip's College and San Antonio College are accredited by
the Commission on Colleges of the Southern Association of Colleges and Schools to award associate degree
programs. Contact the Commission on Colleges at 1866 Southern Lane, Decatur, Georgia 30033-4097 or
call 404-679-4500 for questions about the accreditation of the Alamo Colleges.
Strategic Plan 2009-2012
The strategic plan is the driver for accomplishing the District‘s institutional mission. The mission sets forth the
long-term direction for the Alamo Colleges. This direction and the strategic goals are determined
collaboratively by the Board of Trustees, the Chancellor, and the College Presidents. Annual operational
plans, based on the strategic plan, identify measurable performance objectives for accomplishment of the
strategic plan goals and strategies. The defined institutional goals are driven by the following strategic
priorities:
• Access to Higher Education
• Student Support
• Workforce Development
• Capacity to Serve
• Organizational Communication
Vision
The Alamo Colleges will be the best in the nation.
Mission
Empowering our diverse communities for success.

FY 2010-2011 Operating Budget
Page 16
Values
The members of Alamo Colleges are committed to building individual and collective character
through the following set of shared values in order to fulfill our vision and mission.
INTEGRITY: We have the courage to act ethically, building a culture of trust and respect.
COMMUNICATION: We engage in open and transparent communication, information sharing, and
collaboration.
COMMUNITY: We commit to a joyful culture of learning and service where unity in diversity occurs
through mutual respect, cooperation, and accessibility.
ACADEMIC FREEDOM: We value creativity, growth, and transformation through vigorous inquiry
and a free exchange of ideas for all.
ACCOUNTABILITY: We take responsibility for our actions and strive for continuous learning and
improvement.
Baldrige Criteria, Strategic Goals, and Four Drivers

FY 2010-2011 Operating Budget
Page 17
STRATEGIC PLAN GOALS AND STRATEGIES
Goal I. Access to Higher Education
Maintain and extend an open door and affordable access to quality higher education for citizens
of Bexar County and surrounding service area.
A. Recruit/Enroll to Reflect the Diversity of Our Communities
B. Recruit/Enroll from Low Educational Participation Areas
Goal II. Student Support
Increase academic support of all students.
A. Achieve High Completion Rates
B. Maximize P-16 Partnerships
C. Achieve the Dream
D. Measure and Increase Student Success
E. Maximize Employee Accountability for Student Success
F. Enable Students to Become Responsible Local and Global Citizens
G. Achieve Outstanding Student Learning and Support Programs
Goal III. Workforce Development
Build a world-class workforce education and training capacity in partnership with businesses and
community-based organizations.
A. Assert Regional Workforce Leadership
B. Offer Excellent Programs that Meet Employer Needs
Goal IV. Capacity to Serve
Develop the human capital and strengthen the financial, technological, and physical capacities of
the Alamo Colleges for first-rate student and community services.
A. Attract, Develop, and Retain Employee Talent
B. Ensure Sound Financial Management
C. Utilize Technology for Success
D. Maximize Facilities Stewardship
Goal V. Organizational Communication
Foster integrated organizational communication to consistently promote the positive impact and
value of the Alamo Colleges to the community of Bexar County and surrounding service area.
A. Cultivate Community Support and Loyalty
B. Ensure Effective Internal Communication

FY 2010-2011 Operating Budget
Page 18
Key Performance Indica tors
The Strategic Planning category of the Baldrige Criteria for Performance Excellence examines how an
organization develops strategies/goals/objectives and how the chosen objectives and action plans are
deployed and adapted, and how progress is measured.
At the Alamo Community Colleges, the Institutional Research and Effectiveness Services (IRES) department is
concerned with key performance indicators (KPIs) and measures as integral components of action plans and as
basic comparison elements when evaluating and projecting college performance.
Driver 1: Retention
Participation rate in service area (fall term)
Fiscal year contact hours by college of attendance
Fiscal year contact hours by college of registration
Total credit student headcount (fall term)
Total credit student headcount (fall term)
Fall credit contact hours by college of attendance (state funded only)
Fall credit contact hours by college of registration (state funded only)
Driver 2: Retention
Within term by college of registration (total population)
Fall to spring persistence of full-time first-time-in-college by college of registration
Fall to spring persistence of part-time first-time-in-college by college of registration
Fall to fall persistence of first-time-in-college by college of registration
Fall to fall persistence of part-time first-time-in-college by college of registration
2-Year fall to fall persistence of full-time first-time-in-college by college of registration
2-Year fall to fall persistence of part-time first-time-in-college by college of registration
Percentage of first-time-in-college students who were successful in Gatekeeper Math after completing their
Developmental Math sequence
Percentage of first-time-in-college students who were successful in Gatekeeper English after completing their
Developmental English sequence
Percentage of first-time-in-college students who were successful in History 1301 after completing their
Developmental Reading sequence
Percentage of first-time-in-college students who were successful in Biology 1408 after completing their
Developmental Reading sequence
Driver 3: Completion
Number of certificates and degree awards (associates and certificates)
Number of certificates and degree awards: Other completers
Full-time first-time-in-college 3-year graduation rate
Full-time first-time-in-college 4-year graduation rate
Full-time first-time-in-college 6-year graduation rate
Percent of first-time-in-college students who transfer to a Texas senior institution in six years with 30 hours prior to
transfer
Percent of first-time-in-college students who transfer to a Texas senior institution in six years (all FTIC transfers)
Driver 4: Clusters
Number of certificates and degree awards by Closing the Gaps Critical Area
o Computer Information Systems
o Engineering
o Math
o Physical Science
o Nursing / Allied Health
FY 2010-2011 Operating Budget
Page 19
Achieving the Dream
The Alamo Colleges has been recognized as a leader in the national student completion movement by
Achieving the Dream: Community Colleges Count (ATD). Alamo Colleges, one of seven colleges designated as a 2010 Leader College, was recognized for demonstrating sustained improvement and accomplishments on key student achievement indicators.
Conceived in 2004 as a national initiative by Lumina Foundation for Education and eight national partner
organizations, Achieving the Dream (ADT has evolved into an independent nonprofit working with 130
institutions in 24 states and the District of Columbia, reaching more than one million students. ATD is focused on
creating a ―culture of evidence‖ on community college campuses in which data collection and analysis drive
efforts to identify problems that prevent students from succeeding—particularly low-income students and
students of color—and develop programs to help them stay in school and receive a certificate or diploma or
transfer to a four-year institution.
The Leader Colleges include institutions large and small, rural and urban, single campus and multi-campus that
are working to address a variety of student success challenges. These colleges have identified workable
solutions to issues such as
Enhancing the experience of first-year students
Improving developmental education
Closing achievement gaps
Strengthening academic and personal advising for students in need of additional support
Strengthening links to high schools and four-year institutions to improve student
preparation
Increasing retention, persistence rates, and the number of certificate and degree recipients

FY 2010-2011 Operating Budget
Page 20
Integrated Planning
Integrated denotes that no part of the planning process takes place in isolation from the other parts. The
integrated planning process depicts an organization‘s complete planning and control system. The three
components of the integrated planning process are the strategic plan, the operational plan, and the results
management process.
The integrated planning model for the Alamo Colleges points all colleges and district units to strengthen the
connection between the strategic plan, the action plans, and the budget. The model requires the integration of
strategic and operational planning with a systematic results management process where performance outputs
and outcomes are evaluated, controlled, and reported. Taking corrective action involves improving actual
performance, adjusting the performance standard (target), or both. Performance reports, including scorecards
and dashboards, bring closure to action plans.
The alignment and integration of strategic planning, performance budgeting, and performance measurement
are critical to ensure student success at the Alamo Colleges.

FY 2010-2011 Operating Budget
Page 21
FINANCIAL INFORMATION

FY 2010-2011 Operating Budget
Page 22
Revenue Summary
The FY11 I&G Operating Budget reflects an overall revenue increase of approximately 1.6 percent or $3.2
million from the FY10 Adjusted I&G Operating Budget. Additional detail is provided below for each of the
four major sources of revenue.
State Appropriations
These funds are allocated on a biennium basis and may not be used for construction of facilities or for repairs
and renovations for those facilities. State funding for community colleges began in 1942 and was initially
based on headcount enrollment. In 1972, a formula approach to funding, based on contact hours, was
implemented to cover the instructional costs incurred by community colleges.
Currently, the formula is composed of the average cost of instruction per contact hour multiplied by the total
contact hours in the base period, which comprises the formula funding request that is submitted to the state
every two years. The key component of the formula, the average cost of instruction, is calculated statewide
for all academic and technical programs (26 disciplines). Since 2008, revenues have declined by $0.67 per
contact hour, resulting in a $16.6M annual impact. In FY10, these revenues covered only 58.9 percent of
instructional costs as compared to 60.4 percent in FY09. Additionally, this percentage is anticipated to
continue to decline over the next biennium funding period (FY12-13). The FY11 budget includes $67.4 million
in state appropriation revenue.
Tuition and Fees
These funds may be used for any legal classification of expenditures. Tuition is an amount paid per semester
hour and the amount of tuition depends on the number of courses taken by the student and the nature of those
classes. Most semester-length lecture courses count for three semester hours of credit. Fees can be either of a
general nature and paid by every student (building use, student services, etc.) or course specific.
The Board of Trustees approved a 5 percent increase to tuition rates and an $8.00 increase to the general
fee, effective spring 2011. This will generate an additional $2.4 million. The Board of Trustees also
approved the implementation of a full-cost recovery pricing model for continuing education, which is estimated
to provide an additional $500,000 in contract and tuition revenue. Based on these approvals, the FY11
budget includes $111.1 million in tuition and fee revenue.
Local Ad Valorem Taxes
These funds are divided into two categories: Maintenance and operations funding (M&O) and funding for
debt service of general obligation bonds (used only for payment of principal and interest on funds used for
construction and other capital outlay needs). Public community colleges are the only segment of higher
education in the United States that receives this form of revenue from local taxpayers.
For FY11, the Board of Trustees approved and adopted a maintenance and operations tax rate of
$0.096873 and a debt levy tax rate of $0.04475, for a combined tax rate of $0.141623 per $100 of
assessed valuation, which is equal to the ‗combined effective tax rate‘ of $0.141623 per $100 of assessed
valuation. This increase will generate an additional $5 million in revenue, less a revenue decrease of $1.3
million due to the decline in assessed valuation, for a net increase in ad valorem tax revenues of $3.7 million.
This results in a 4.25 percent increase to the tax rate (or 6.23 percent increase based on a comparison of the
maintenance and operations rate of $0.091105 to the effective maintenance and operations rate of
$0.096873). This increases the taxes for maintenance and operations on a $100,000 home by

FY 2010-2011 Operating Budget
Page 23
approximately $5.77. The FY11 operating budget includes total tax revenues of $92.4 million based on the
effective tax rate, as approved by the Board of Trustees.
Other Revenue
These funds include income generated primarily from investments and auxiliary enterprises. The FY11 budget
reflects $8.7 million in revenue from these sources.
Restricted Funds
These are funds restricted by donors or other outside agencies for specific purposes; gifts whose donors have
placed limitations on their use; grants from private or governmental sources; bond proceeds; debt levy tax
revenues; and other sponsored funds that are restricted for specific program use. These funds are not
reported in the FY11 I&G Operating Budget, but are reflected in the FY11 All Funds Budget Report.
Budget Strategies/Total All Funds Budget Summary
Rev Exp
FY10 Revised Budget 276.4 284.9 (8.5)
FY11 Requested Budget 279.6 284.6 (5.0)
Increase/(Decrease) 3.2 (0.3) * 3.5
Revenue & Cost Strategies included in the Requested Budget:Total Budget Pressure (including $3.5M reduced Fund Balance trsf): 21.2$
Gap Closure Strategies: % of Total Gap
Tuition (5% rate increase Spring 2011) 1.9$ 9% A)
M&O Tax Rate to Effective Rate (cover Increased Facilities) 5.0$ 23% A)
Impact of 25 Initiatives:
Other Revenue Retreat Initiatives 2.0$ 10%
Expense - Workforce Related (350 FTE) 9.5$ 45% Total Exp
Expense - Other Savings 2.8$ 13% 58%
21.2$ 100%
Fund
Bal Trsf

FY 2010-2011 Operating Budget
Page 24
All Funds Financial Structure
RESTRICTED PLANT FUNDS
UNRESTRICTED & AUXILIARY FUNDS(Operating Budget)
RESTRICTED ENDOWMENT
FUNDS
RESTRICTED LOAN FUNDS
OTHER RESTRICTED FUNDS
ALL FUNDS
FINANCIAL STRUCTURE
Funding Sources:
1.Revenue
Tuition & Fees
Taxes
State Appropriations
Other Revenues
Endowment Income
Investment Income
Miscellaneous Income
Auxiliary Revenue
2.Alternate Funding Source
Funding Uses:
Instructional Cost
Public Service
Academic Support
Student Services
Institutional Support
Plant Operations & Maint.
Scholarships & Exemptions
Transfers to Other Funds
Auxiliary Expenses
Funding Sources:
State Funding for Benefits
Teacher‘s Retirement System
Optional Retirement Plan
State Group Insurance
Federal, State, Local & Private
Grants
Private Gifts
Investment Income
Funding Uses:
Instructional Cost
Public Service
Academic Support
Student Services
Institutional Support
Plant Operations & Maint.
Scholarships & Exemptions
Funding Sources:
Bond Issues
Taxes for Debt Retirement
Federal, State, Local &
Private Grants
Investment Income
Private Gifts
Transfers from Unrestricted
Funds
Funding Uses:
Instructional Cost
Public Service
Academic Support
Student Services
Institutional Support
Plant Operations & Maint.
Scholarships & Exemptions
Funding Sources:
Federal, State, Local &
Private Grants
Undistributed Investment
Income
Private Gifts
Funding Uses:
Distribution of Income
to
Scholarship and Other
Funds
Funding Sources:
Investment Income
Transfers from Other
Funds
Funding Uses:
Collection Expenses

FY 2010-2011 Operating Budget
Page 25
FY11 All Funds Budget Repor t
ALAMO COMMUNITY COLLEGE DISTRICT
FY 2010 - 2011 ALL FUNDS BUDGET REPORT
FY 2010 - 2011
Unrestricted Restricted Total
REVENUES
Instruction and General 274,176,776 47,676,000 321,852,776
Public Service 245,000 245,000
Scholarships and Fellowships 80,567,604 80,567,604
Auxiliary Enterprises 4,030,640 4,030,640
Student Activity Fee 1,136,584 1,136,584
Other (Use of Fund Balance) -
Subtotal Current Funds 279,589,000 128,243,604 407,832,604
Capital Outlay -
Renewals & Replacements
Building 380,076 380,076
Furniture & Equipment -
Debt Services 45,994,032 45,994,032
Subtotal Plant Funds - 46,374,108 46,374,108
TOTAL REVENUES 279,589,000 174,617,712 454,206,712
BEGINNING FUND BALANCES
Instruction and General 58,285,755 996,651 59,282,406
Public Service - - -
Scholarships and Fellowships - 4,744,537 4,744,537
Auxiliary Enterprises 6,953,618 - 6,953,618
Student Activity Fee - - -
Other (Use of Fund Balance) -
Subtotal Current Funds 65,239,373 5,741,188 70,980,561
Capital Outlay 13,325,879 13,325,879
Renewals & Replacements -
Building 24,751,106 24,751,106
Furniture & Equipment 2,375,726 2,375,726
Debt Services 10,185,201 10,185,201
Subtotal Plant Funds - 50,637,912 50,637,912
TOTAL BEGINNING FUND BALANCES 65,239,373 56,379,100 121,618,473
TOTAL AVAILABLE
Instruction and General 332,462,531 48,672,651 381,135,182
Public Service 245,000 - 245,000
Scholarships and Fellowships - 85,312,141 85,312,141
Auxiliary Enterprises 10,984,258 - 10,984,258
Student Activity Fee 1,136,584 - 1,136,584
Other (Use of Fund Balance) - - -
Subtotal Current Funds 344,828,373 133,984,792 478,813,165
Capital Outlay - 13,325,879 13,325,879
Renewals & Replacements - - -
Building - 25,131,182 25,131,182
Furniture & Equipment - 2,375,726 2,375,726
Debt Services - 56,179,233 56,179,233
Subtotal Plant Funds - 97,012,020 97,012,020
TOTAL AVAILABLE 344,828,373 230,996,812 575,825,185
TOTAL AVAILABLE = Current Funds + Plant Funds
Note: Beg. fund balance includes Board mandated 15% (Report does not include endowment:
50, 60, loan funds: 41, 45, investment in plant fund 97, or agency funds: 31, 35; Include
operating, grants, construction, scholarships, & gifts funds)
Unspent bond proceeds from prior year are included as part of beginning capital outlay fund
balances.

FY 2010-2011 Operating Budget
Page 26
ALAMO COMMUNITY COLLEGE DISTRICT
FY 2010 - 2011 ALL FUNDS BUDGET REPORT
FY 2010 - 2011
Unrestricted Restricted Total
EXPENDITURES
Instruction and General 264,873,902 47,676,000 312,549,901
Public Service 201,531 201,531
Scholarships and Fellowships 859,658 84,697,020 85,556,678
Auxiliary Enterprises 2,223,096 2,223,096
Student Activity Fee 1,136,584 1,136,584
Other (Use of Fund Balance) -
Subtotal Current Funds 269,294,771 132,373,020 401,667,791
Capital Outlay 13,325,879 13,325,879
Renewals & Replacements -
Building 25,131,182 25,131,182
Furniture & Equipment 6,875,726 6,875,726
Debt Services 59,665,630 59,665,630
Subtotal Plant Funds - 104,998,417 104,998,417
TOTAL EXPENDITURES 269,294,771 237,371,437 506,666,208
TRANSFERS (IN) OUT
Instruction and General 15,294,229 15,294,229
Public Service -
Scholarships and Fellowships (4,129,416) (4,129,416)
Auxiliary Enterprises -
Student Activity Fee -
Other (Use of Fund Balance) -
Subtotal Current Funds 15,294,229 (4,129,416) 11,164,813
Capital Outlay
Renewals & Replacements
Building
Furniture & Equipment (4,500,000) (4,500,000)
Debt Services (6,664,813) (6,664,813)
Subtotal Plant Funds - (11,164,813) (11,164,813)
NET TRANSFERS 15,294,229 (15,294,229) -
TOTAL BUDGET 284,589,000 222,077,208 506,666,208
ENDING FUND BALANCES
Instruction and General 52,471,400 996,651 53,468,051
Public Service (133,531) - (133,531)
Scholarships and Fellowships (859,658) 4,744,537 3,884,879
Auxiliary Enterprises 8,761,162 - 8,761,162
Student Activity Fee - - -
Other (Use of Fund Balance) - - -
Subtotal Current Funds 60,239,373 5,741,188 65,980,561
Capital Outlay - - -
Renewals & Replacements - - -
Building - - -
Furniture & Equipment - - -
Debt Services - 3,178,416 3,178,416
Subtotal Plant Funds - 3,178,416 3,178,416
TOTAL ENDING FUND BALANCES 60,239,373 8,919,604 69,158,977
TOTAL EXP, TRANSF & BAL 344,828,373 230,996,812 575,825,185
TOTAL EXP, TRANSF & BAL = TOTAL
EXPENDITURES + NET TRANSFERS +
TOTAL ENDING BALANCES
Change in Fund Balance (5,000,000) (47,459,496) (52,459,496)
FY 2010-2011 Operating Budget
Page 27
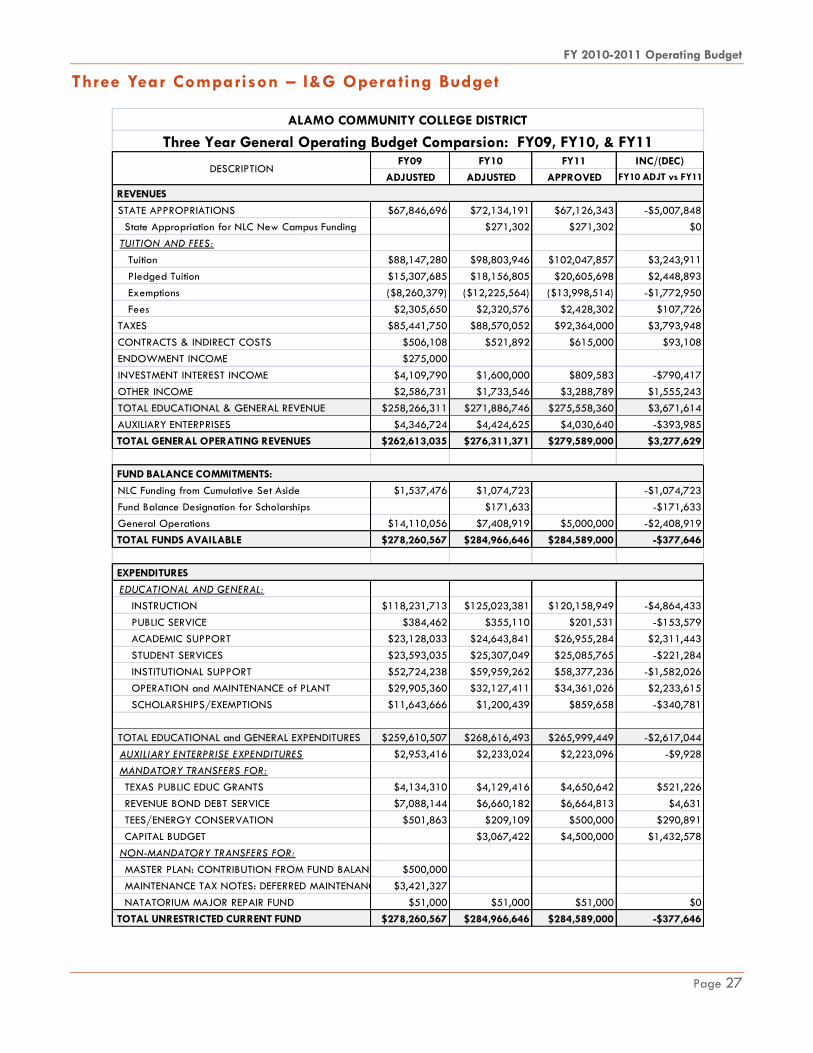
Three Year Comparison – I&G Operating Budget
ALAMO COMMUNITY COLLEGE DISTRICT
Three Year General Operating Budget Comparsion: FY09, FY10, & FY11FY09 FY10 FY11 INC/(DEC)
ADJUSTED ADJUSTED APPROVED FY10 ADJT vs FY11
REVENUES
STATE APPROPRIATIONS $67,846,696 $72,134,191 $67,126,343 -$5,007,848
State Appropriation for NLC New Campus Funding $271,302 $271,302 $0
TUITION AND FEES:
Tuition $88,147,280 $98,803,946 $102,047,857 $3,243,911
Pledged Tuition $15,307,685 $18,156,805 $20,605,698 $2,448,893
Exemptions ($8,260,379) ($12,225,564) ($13,998,514) -$1,772,950
Fees $2,305,650 $2,320,576 $2,428,302 $107,726
TAXES $85,441,750 $88,570,052 $92,364,000 $3,793,948
CONTRACTS & INDIRECT COSTS $506,108 $521,892 $615,000 $93,108
ENDOWMENT INCOME $275,000
INVESTMENT INTEREST INCOME $4,109,790 $1,600,000 $809,583 -$790,417
OTHER INCOME $2,586,731 $1,733,546 $3,288,789 $1,555,243
TOTAL EDUCATIONAL & GENERAL REVENUE $258,266,311 $271,886,746 $275,558,360 $3,671,614
AUXILIARY ENTERPRISES $4,346,724 $4,424,625 $4,030,640 -$393,985
TOTAL GENERAL OPERATING REVENUES $262,613,035 $276,311,371 $279,589,000 $3,277,629
FUND BALANCE COMMITMENTS:
NLC Funding from Cumulative Set Aside $1,537,476 $1,074,723 -$1,074,723
Fund Balance Designation for Scholarships $171,633 -$171,633
General Operations $14,110,056 $7,408,919 $5,000,000 -$2,408,919
TOTAL FUNDS AVAILABLE $278,260,567 $284,966,646 $284,589,000 -$377,646
EXPENDITURES
EDUCATIONAL AND GENERAL:
INSTRUCTION $118,231,713 $125,023,381 $120,158,949 -$4,864,433
PUBLIC SERVICE $384,462 $355,110 $201,531 -$153,579
ACADEMIC SUPPORT $23,128,033 $24,643,841 $26,955,284 $2,311,443
STUDENT SERVICES $23,593,035 $25,307,049 $25,085,765 -$221,284
INSTITUTIONAL SUPPORT $52,724,238 $59,959,262 $58,377,236 -$1,582,026
OPERATION and MAINTENANCE of PLANT $29,905,360 $32,127,411 $34,361,026 $2,233,615
SCHOLARSHIPS/EXEMPTIONS $11,643,666 $1,200,439 $859,658 -$340,781
TOTAL EDUCATIONAL and GENERAL EXPENDITURES $259,610,507 $268,616,493 $265,999,449 -$2,617,044
AUXILIARY ENTERPRISE EXPENDITURES $2,953,416 $2,233,024 $2,223,096 -$9,928
MANDATORY TRANSFERS FOR:
TEXAS PUBLIC EDUC GRANTS $4,134,310 $4,129,416 $4,650,642 $521,226
REVENUE BOND DEBT SERVICE $7,088,144 $6,660,182 $6,664,813 $4,631
TEES/ENERGY CONSERVATION $501,863 $209,109 $500,000 $290,891
CAPITAL BUDGET $3,067,422 $4,500,000 $1,432,578
NON-MANDATORY TRANSFERS FOR:
MASTER PLAN: CONTRIBUTION FROM FUND BALANCE $500,000
MAINTENANCE TAX NOTES: DEFERRED MAINTENANCE $3,421,327
NATATORIUM MAJOR REPAIR FUND $51,000 $51,000 $51,000 $0
TOTAL UNRESTRICTED CURRENT FUND $278,260,567 $284,966,646 $284,589,000 -$377,646
DESCRIPTION

FY 2010-2011 Operating Budget
Page 28
Revenue by Category
State Appropriations,
24%
Tuition, Pledged Tuition & Fees,
40%
Other/Non-Designated
Auxiliary, 3%
Taxes, 33%
By Revenue Category FY11 Approved I&G Operating Budget
State Appropriations,
26%
Tuition, Pledged Tuition & Fees,
39%
Other/Non-Designated
Auxiliary, 3%
Taxes, 32%
By Revenue Category FY10 Adjusted I&G Operating Budget

FY 2010-2011 Operating Budget
Page 29
FY11 Revenue Summary
ALAMO COMMUNITY COLLEGE DISTRICT
FY2011 REVENUE SUMMARY
FORMULA REVENUE FOR BUDGET MODELS
DIST SAC SPC PAC NVC NLC TOTAL
State Appropriations $67,397,645 $0 $0 $0 $0 $0 $67,397,645
Tuition and Pledged Tuition $2,021,387 $35,837,011 $15,459,261 $12,130,196 $21,605,157 $8,893,904 $95,946,916
Taxes $92,364,000 $0 $0 $0 $0 $0 $92,364,000
Other $1,725,083 $244,300 $89,800 $73,300 $119,500 $8,600 $2,260,583
Non Designated Auxiliary $2,661,000 $0 $0 $0 $0 $0 $2,661,000
Total Formula Revenue $166,169,115 $36,081,311 $15,549,061 $12,203,496 $21,724,657 $8,902,504 $260,630,144
NON-FORMULA REVENUE FOR ENTERPRISE ACTIVITIES
DIST SAC SPC PAC NVC NLC TOTAL
Instruction $72,500 $2,375,000 $672,800 $287,400 $335,000 $500 $3,743,200
Public Service $185,000 $58,000 $2,000 $0 $0 $0 $245,000
Academic Support $0 $10,000 $8,500 $10,800 $11,000 $3,000 $43,300
Student Services $46,000 $555,000 $360,780 $266,893 $481,190 $150,981 $1,860,844
Designated Auxiliary $478,440 $386,000 $202,800 $302,400 $0 $0 $1,369,640
Continuing Education $2,275,268 $2,583,659 $3,702,295 $1,338,857 $328,000 $1,461,464 $11,689,543
Unrestricted Scholarships Interest Income $0 $0 $0 $77 $0 $0 $77
Designated Unrestricted $0 $0 $5,000 $2,252 $0 $0 $7,252
Total Non-Formula Revenue $3,057,208 $5,967,659 $4,954,175 $2,208,679 $1,155,190 $1,615,945 $18,958,856
TOTAL REVENUES $169,226,323 $42,048,970 $20,503,236 $14,412,175 $22,879,847 $10,518,449 $279,589,000

FY 2010-2011 Operating Budget
Page 30
FY11Formula Revenue Summary
ALAMO COMMUNITY COLLEGE DISTRICT
FY2011 REVENUE BUDGET
FORMULA REVENUE FOR BUDGET MODELS
DIST SAC SPC PAC NVC NLC TOTAL
STATE APPROPRIATIONS
11X001 State Appropriations E & G 67,126,343 0 0 0 0 0 67,126,343
11X001 New Campus Funding - NLC 271,302 0 0 0 0 0 271,302
TOTAL STATE APPROPRIATIONS 67,397,645 0 0 0 0 0 67,397,645
TUITION AND PLEDGED TUITION
Tuition
11X001 Tuition - Non Exempt 0 21,062,938 9,046,126 6,900,638 12,781,206 5,372,570 55,163,478
11X001 Tuition - Exempt 0 3,641,969 2,562,916 2,431,110 2,422,936 141,556 11,200,487
11X001 Tuition - Exempt Discounts 0 (3,641,969) (2,562,916) (2,431,110) (2,422,936) (141,556) (11,200,487)
11X001 Tuition Pledged (25%) 0 6,838,359 2,934,183 2,240,444 4,145,543 1,742,631 17,901,160
Total Tuition and Tuition Pledged 0 27,901,297 11,980,309 9,141,082 16,926,749 7,115,201 73,064,638
Pledged Tuition (General Fee)
11X001 Pledged Tuition - Non Exempt 0 6,770,714 2,981,332 2,268,826 4,165,408 1,621,391 17,807,671
11X001 Pledged Tuition - Exempt 0 939,856 577,593 579,681 668,901 31,996 2,798,027
11X001 Pledged Tuition - Exempt Discounts 0 (939,856) (577,593) (579,681) (668,901) (31,996) (2,798,027)
Total Pledged Tuition (General Fee) 0 6,770,714 2,981,332 2,268,826 4,165,408 1,621,391 17,807,671
Sub-Total 0 34,672,011 14,961,641 11,409,908 21,092,157 8,736,592 90,872,309
11X001 Tuition - Third Time Around 0 0 0 0 0 0 0
11X001 CE Tuit Reimbursable 2,021,387 1,165,000 497,620 720,288 513,000 157,312 5,074,607
TOTAL TUITION AND PLEDGED TUITION 2,021,387 35,837,011 15,459,261 12,130,196 21,605,157 8,893,904 95,946,916
TAXES
11X001 M&O Current Tax Revenue 90,158,966 0 0 0 0 0 90,158,966
11X001 M&O Delinquent Tax Revenue 1,080,899 0 0 0 0 0 1,080,899
11X001 M&O Penalties & Interest 1,124,135 0 0 0 0 0 1,124,135
TOTAL TAXES 92,364,000 0 0 0 0 0 92,364,000
OTHER
11X001 Federal Revenue - IDC - SEOG 155,000 0 0 0 0 0 155,000
11X001 Federal Revenue - IDC - CWS 0 0 0 0 0 0 0
11X001 Federal Revenue - IDC - Pell 160,000 0 0 0 0 0 160,000
11X001 Federal Revenue - IDC - General 300,000 0 0 0 0 0 300,000
11X001 Returned Check Fee Revenue 500 7,300 3,800 3,300 4,500 600 20,000
11X001 Advertising Revenue 0 10,000 6,000 0 0 0 16,000
11X001 Sales & Services Revenue 300,000 0 0 0 0 0 300,000
11X001 Pledged Investment Income 809,583 0 0 0 0 0 809,583
11X001 Installment Payment Fee 0 227,000 80,000 70,000 115,000 8,000 500,000
TOTAL OTHERS 1,725,083 244,300 89,800 73,300 119,500 8,600 2,260,583
NON-DESIGNATED AUXILIARY
13X001 AUX - Bookstore Commission 1,200,000 0 0 0 0 0 1,200,000
13X001 AUX - Game Tables Revenue Pledged 9,200 0 0 0 0 0 9,200
13X001 AUX - Vending Rev - Drinks Pledged 457,000 0 0 0 0 0 457,000
13X001 AUX - Vending Rev - Foods Pledged 26,400 0 0 0 0 0 26,400
13X001 AUX - Copy Machine Rev Pledged 13,400 0 0 0 0 0 13,400
13X001 AUX - Parking Permit - Fall 835,000 0 0 0 0 0 835,000
13X001 AUX - Parking Fines 120,000 0 0 0 0 0 120,000
TOTAL NON-DESIGNATED AUX 2,661,000 0 0 0 0 0 2,661,000
TOTAL FORMULA REVENUES $166,169,115 $36,081,311 $15,549,061 $12,203,496 $21,724,657 $8,902,504 $260,630,144

FY 2010-2011 Operating Budget
Page 31
FY11 Non-Formula Revenue Summary
ALAMO COMMUNITY COLLEGE DISTRICT
FY2011 REVENUE BUDGET
NON-FORMULA REVENUE FOR ENTERPRISE ACTIVITIES
DIST SAC SPC PAC NVC NLC TOTAL
11X001 Special Prog Tuition - Nursing 0 775,000 657,300 0 0 0 1,432,300
11X001 Special Prog Tuition - * 0 80,000 0 201,000 150,000 0 431,000
11X001 VCT Fee Revenue 0 20,000 15,000 86,400 35,000 0 156,400
11X001 Miscellaneous Revenue 72,500 1,500,000 500 0 150,000 500 1,723,500
TOTAL INSTRUCTION 72,500 2,375,000 672,800 287,400 335,000 500 3,743,200
11X001 Gym Rental Revenue 0 55,000 0 0 0 0 55,000
11X001 Property Rentals Revenue 185,000 3,000 2,000 0 0 0 190,000
TOTAL PUBLIC SERVICE 185,000 58,000 2,000 0 0 0 245,000
11X001 Library Fines 10,000 8,500 10,800 1,000 3,000 33,300
11X001 Facilities Rental Revenue 0 0 0 0 10,000 0 10,000
TOTAL ACADEMIC SUPPORT 0 10,000 8,500 10,800 11,000 3,000 43,300
11X003 Student Activity Fee - w/o Exemptions 0 400,000 183,640 149,173 314,190 89,581 1,136,584
11X001 Other Test Fee 0 0 0 0 0 400 400
11X001 Prep Test Fee 0 0 0 0 0 2,500 2,500
11X001 CLEP Test Fee 0 0 0 0 0 1,500 1,500
11X001 GED Test Fee 0 0 9,804 0 0 0 9,804
11X001 GED Certificates Test Fee 0 0 19,836 0 0 0 19,836
11X001 Accuplacer Test Fee 46,000 100,000 50,000 66,960 120,000 30,000 412,960
11X001 Sales & Services Revenue 0 30,000 76,500 43,200 35,000 25,000 209,700
11X001 Event Booth Rental Revenue 0 0 0 0 0 2,000 2,000
11X001 Veterans Administration Revenue 0 25,000 21,000 7,560 12,000 0 65,560
TOTAL STUDENT SERVICES 46,000 555,000 360,780 266,893 481,190 150,981 1,860,844
13X001 AUX - Child Care Revenue 0 358,000 202,800 270,000 0 0 830,800
13X001 USDA Program Fee Revenue 0 28,000 0 32,400 0 0 60,400
1E+05 Local City Contrib NAT Renew/Replac 278,440 0 0 0 0 0 278,440
1E+05 NAT - Open Swim Revenue 18,000 0 0 0 0 0 18,000
1E+05 NAT - Ticket Sales-Taxable 10,000 0 0 0 0 0 10,000
1E+05 NAT - Special Program Revenue 165,000 0 0 0 0 0 165,000
1E+05 NAT - Vending Machine Revenue 7,000 0 0 0 0 0 7,000
TOTAL DESIGNATED AUXILIARY 478,440 386,000 202,800 302,400 0 0 1,369,640
C.E.
11X001 CE Tuit Non-Reimburseable 0 469,134 495,000 344,520 260,000 104,420 1,673,074
11X001 CE Tuit Non-Reimb Contracts 64,045 0 1,777,200 0 0 0 1,841,245
11X001 Non-CE Tuit Contract Training 2,168,223 75,000 1,430,095 0 0 1,357,044 5,030,362
11X001 Gateway to College (Spc Classes Rev) 0 1,500,000 0 800,144 0 0 2,300,144
Total CE Tuition 2,232,268 2,044,134 3,702,295 1,144,664 260,000 1,461,464 10,844,825
11X001 CE Special Fee 0 539,525 0 194,193 53,000 0 786,718
11X001 Other Test Fee 2,000 0 0 0 15,000 0 17,000
11X001 Administrative Fee Revenue 41,000 0 0 0 0 0 41,000
Total CE Fees 43,000 539,525 0 194,193 68,000 0 844,718
TOTAL C.E. 2,275,268 2,583,659 3,702,295 1,338,857 328,000 1,461,464 11,689,543
15XXX Unrestricted Scholarships Interest Income 0 0 0 77 0 0 77
17XXX Designated Unrestricted (Fund 19) 0 0 5,000 2,252 0 0 7,252
TOTAL Unrestrict Scholarships Interest Income 0 0 5,000 2,329 0 0 7,329
TOTAL NON-FORMULA REVENUES $3,057,208 $5,967,659 $4,954,175 $2,208,679 $1,155,190 $1,615,945 $18,958,856
NOTE: Special Prog Tuition - * : Include Fire Science, Dental Lab Tech(SAC), Aviation(PAC) and Water Treatment(NVC)
FY 2010-2011 Operating Budget
Page 32
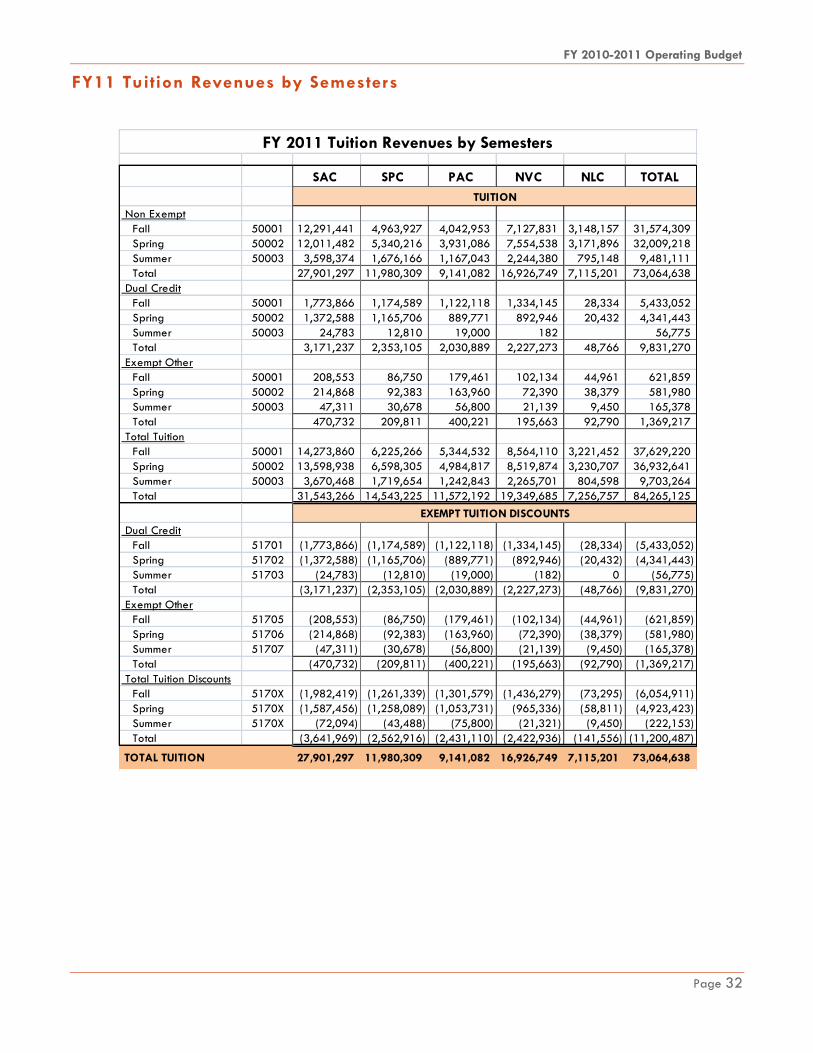
FY11 Tuition Revenues by Semesters
FY 2011 Tuition Revenues by Semesters
SAC SPC PAC NVC NLC TOTAL
TUITION
Non Exempt
Fall 50001 12,291,441 4,963,927 4,042,953 7,127,831 3,148,157 31,574,309
Spring 50002 12,011,482 5,340,216 3,931,086 7,554,538 3,171,896 32,009,218
Summer 50003 3,598,374 1,676,166 1,167,043 2,244,380 795,148 9,481,111
Total 27,901,297 11,980,309 9,141,082 16,926,749 7,115,201 73,064,638
Dual Credit
Fall 50001 1,773,866 1,174,589 1,122,118 1,334,145 28,334 5,433,052
Spring 50002 1,372,588 1,165,706 889,771 892,946 20,432 4,341,443
Summer 50003 24,783 12,810 19,000 182 56,775
Total 3,171,237 2,353,105 2,030,889 2,227,273 48,766 9,831,270
Exempt Other
Fall 50001 208,553 86,750 179,461 102,134 44,961 621,859
Spring 50002 214,868 92,383 163,960 72,390 38,379 581,980
Summer 50003 47,311 30,678 56,800 21,139 9,450 165,378
Total 470,732 209,811 400,221 195,663 92,790 1,369,217
Total Tuition
Fall 50001 14,273,860 6,225,266 5,344,532 8,564,110 3,221,452 37,629,220
Spring 50002 13,598,938 6,598,305 4,984,817 8,519,874 3,230,707 36,932,641
Summer 50003 3,670,468 1,719,654 1,242,843 2,265,701 804,598 9,703,264
Total 31,543,266 14,543,225 11,572,192 19,349,685 7,256,757 84,265,125
EXEMPT TUITION DISCOUNTS
Dual Credit
Fall 51701 (1,773,866) (1,174,589) (1,122,118) (1,334,145) (28,334) (5,433,052)
Spring 51702 (1,372,588) (1,165,706) (889,771) (892,946) (20,432) (4,341,443)
Summer 51703 (24,783) (12,810) (19,000) (182) 0 (56,775)
Total (3,171,237) (2,353,105) (2,030,889) (2,227,273) (48,766) (9,831,270)
Exempt Other
Fall 51705 (208,553) (86,750) (179,461) (102,134) (44,961) (621,859)
Spring 51706 (214,868) (92,383) (163,960) (72,390) (38,379) (581,980)
Summer 51707 (47,311) (30,678) (56,800) (21,139) (9,450) (165,378)
Total (470,732) (209,811) (400,221) (195,663) (92,790) (1,369,217)
Total Tuition Discounts
Fall 5170X (1,982,419) (1,261,339) (1,301,579) (1,436,279) (73,295) (6,054,911)
Spring 5170X (1,587,456) (1,258,089) (1,053,731) (965,336) (58,811) (4,923,423)
Summer 5170X (72,094) (43,488) (75,800) (21,321) (9,450) (222,153)
Total (3,641,969) (2,562,916) (2,431,110) (2,422,936) (141,556) (11,200,487)
TOTAL TUITION 27,901,297 11,980,309 9,141,082 16,926,749 7,115,201 73,064,638

FY 2010-2011 Operating Budget
Page 33
FY11 Pledged Tuition Revenues by Semesters
FY11 Pledged Tuition Revenues by Semester
SAC SPC PAC NVC NLC TOTAL
PLEDGED TUITION
Non Exempt
Fall 52001 2,562,634 1,102,574 851,755 1,549,657 646,527 6,713,147
Spring 52002 2,609,871 1,199,852 849,692 1,668,638 623,943 6,951,996
Summer 52003 1,598,209 678,906 567,379 947,113 350,921 4,142,528
Total 6,770,714 2,981,332 2,268,826 4,165,408 1,621,391 17,807,671
Dual Credit
Fall 52001 483,830 257,936 271,501 364,558 7,213 1,385,038
Spring 52002 342,061 260,524 225,048 253,348 4,986 1,085,967
Summer 52003 7,169 7,030 10,064 138 0 24,401
Total 833,060 525,490 506,613 618,044 12,199 2,495,406
Exempt Other
Fall 52001 42,824 18,688 27,491 25,920 8,267 123,190
Spring 52002 43,800 20,384 25,279 16,668 7,270 113,401
Summer 52003 20,172 13,031 20,298 8,269 4,260 66,030
Total 106,796 52,103 73,068 50,857 19,797 302,621
Total Pledged Tuition
Fall 52001 3,089,288 1,379,198 1,150,747 1,940,135 662,007 8,221,375
Spring 52002 2,995,732 1,480,760 1,100,019 1,938,654 636,199 8,151,364
Summer 52003 1,625,550 698,967 597,741 955,520 355,181 4,232,959
Total 7,710,570 3,558,925 2,848,507 4,834,309 1,653,387 20,605,698
EXEMPT PLEDGED TUITION DISCOUNTS
Dual Credit
Fall 52713 (483,830) (257,936) (271,501) (364,558) (7,213) (1,385,038)
Spring 52714 (342,061) (260,524) (225,048) (253,348) (4,986) (1,085,967)
Summer 52715 (7,169) (7,030) (10,064) (138) 0 (24,401)
Total (833,060) (525,490) (506,613) (618,044) (12,199) (2,495,406)
Exempt Other
Fall 52713 (42,824) (18,688) (27,491) (25,920) (8,267) (123,190)
Spring 52714 (43,800) (20,384) (25,279) (16,668) (7,270) (113,401)
Summer 52715 (20,172) (13,031) (20,298) (8,269) (4,260) (66,030)
Total (106,796) (52,103) (73,068) (50,857) (19,797) (302,621)
Total Pledged Tuition Discounts
Fall 52713 (526,654) (276,624) (298,992) (390,478) (15,480) (1,508,228)
Spring 52714 (385,861) (280,908) (250,327) (270,016) (12,256) (1,199,368)
Summer 52715 (27,341) (20,061) (30,362) (8,407) (4,260) (90,431)
Total (939,856) (577,593) (579,681) (668,901) (31,996) (2,798,027)
TOTAL PLEDGED TUITION 6,770,714 2,981,332 2,268,826 4,165,408 1,621,391 17,807,671

FY 2010-2011 Operating Budget
Page 34
State Appropriations
ALAMO COMMUNITY COLLEGE DISTRICT
STATE APPROPRIATIONS
State appropriations for both Academic and Vocational Education are administered by the Texas Higher Education Coordinating Board.
A base period (Summer 2008, Fall 2008 and Spring 2009) review of contact hours of instruction is utilizedto compute the appropriations for the Fiscal Year 2010-2011 period. Contact hours of instruction bycourse area are calculated according to an approved schedule to arrive at the amount of State appropriations.
Contact hours generated by each college during the base period (2008-2009) were as follows:
CONTACT HOURS (BASE PERIOD - SUMMER 2008, FALL 2008, AND SPRING 2009)
ACADEMIC VOC-TECH TOTAL
SAN ANTONIO COLLEGE 6,080,848 1,877,299 7,958,147
ST. PHILIP'S COLLEGE 2,296,064 1,916,777 4,212,841
PALO ALTO COLLEGE 2,714,304 422,388 3,136,692
NORTHWEST VISTA COLLEGE 3,967,888 280,327 4,248,215
NORTHEAST LAKEVIEW COLLEGE 1,226,368 1,226,368
TOTAL 16,285,472 4,496,791 20,782,263
STATE APPROPRIATIONS
TOTAL
EDUCATIONAL
AND GENERAL
SAN ANTONIO COLLEGE $25,860,476
ST. PHILIP'S COLLEGE $14,119,807
PALO ALTO COLLEGE $9,981,591
NORTHWEST VISTA COLLEGE $13,358,213
NORTHEAST LAKEVIEW COLLEGE $4,077,558
TOTAL $67,397,645
APPROPRIATIONS PER BASE YEAR CONTACT HOUR 3.24$
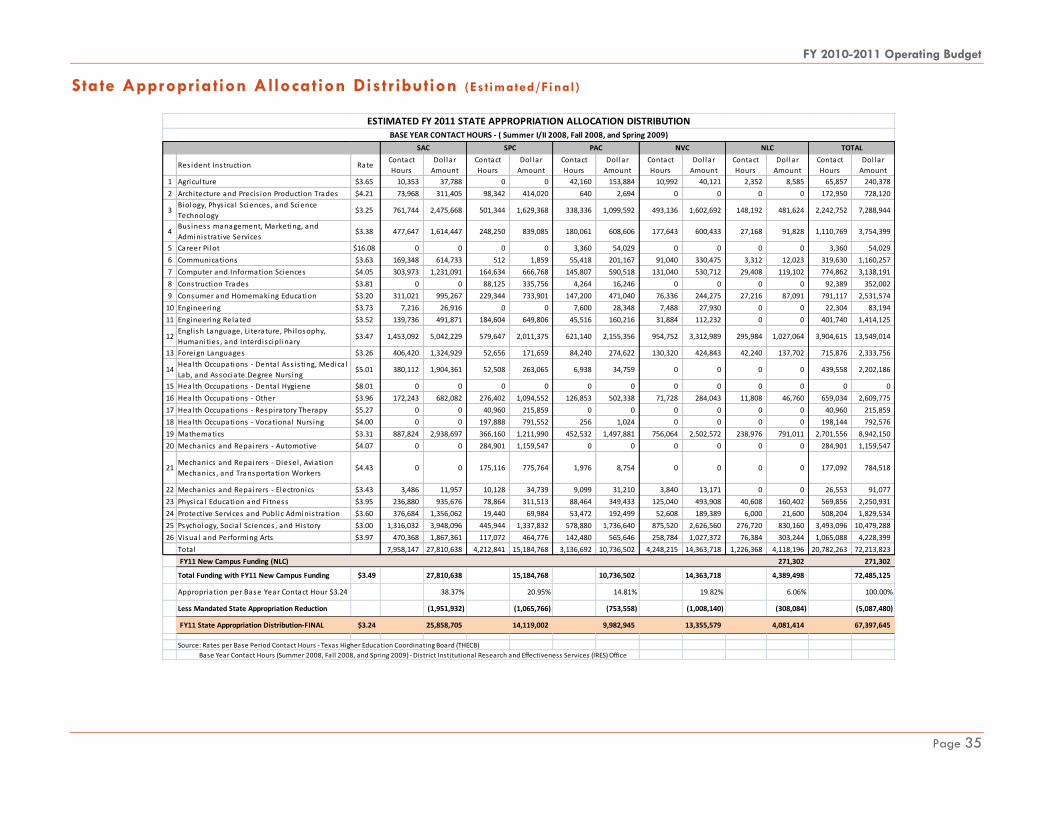
FY 2010-2011 Operating Budget
Page 35
State Appropriation Allocation Distribution (Est imated/Final)
ESTIMATED FY 2011 STATE APPROPRIATION ALLOCATION DISTRIBUTIONBASE YEAR CONTACT HOURS - ( Summer I/II 2008, Fall 2008, and Spring 2009)
SAC SPC PAC NVC NLC TOTAL
Res ident Instruction RateContact
Hours
Dol lar
Amount
Contact
Hours
Dol lar
Amount
Contact
Hours
Dol lar
Amount
Contact
Hours
Dol lar
Amount
Contact
Hours
Dol lar
Amount
Contact
Hours
Dol lar
Amount
1 Agricul ture $3.65 10,353 37,788 0 0 42,160 153,884 10,992 40,121 2,352 8,585 65,857 240,378
2 Architecture and Precis ion Production Trades $4.21 73,968 311,405 98,342 414,020 640 2,694 0 0 0 0 172,950 728,120
3Biology, Phys ica l Sciences , and Science
Technology$3.25 761,744 2,475,668 501,344 1,629,368 338,336 1,099,592 493,136 1,602,692 148,192 481,624 2,242,752 7,288,944
4Bus iness management, Marketing, and
Adminis trative Services$3.38 477,647 1,614,447 248,250 839,085 180,061 608,606 177,643 600,433 27,168 91,828 1,110,769 3,754,399
5 Career Pi lot $16.08 0 0 0 0 3,360 54,029 0 0 0 0 3,360 54,029
6 Communications $3.63 169,348 614,733 512 1,859 55,418 201,167 91,040 330,475 3,312 12,023 319,630 1,160,257
7 Computer and Information Sciences $4.05 303,973 1,231,091 164,634 666,768 145,807 590,518 131,040 530,712 29,408 119,102 774,862 3,138,191
8 Construction Trades $3.81 0 0 88,125 335,756 4,264 16,246 0 0 0 0 92,389 352,002
9 Consumer and Homemaking Education $3.20 311,021 995,267 229,344 733,901 147,200 471,040 76,336 244,275 27,216 87,091 791,117 2,531,574
10 Engineering $3.73 7,216 26,916 0 0 7,600 28,348 7,488 27,930 0 0 22,304 83,194
11 Engineering Related $3.52 139,736 491,871 184,604 649,806 45,516 160,216 31,884 112,232 0 0 401,740 1,414,125
12Engl ish Language, Li terature, Phi losophy,
Humanities , and Interdiscipl inary$3.47 1,453,092 5,042,229 579,647 2,011,375 621,140 2,155,356 954,752 3,312,989 295,984 1,027,064 3,904,615 13,549,014
13 Foreign Languages $3.26 406,420 1,324,929 52,656 171,659 84,240 274,622 130,320 424,843 42,240 137,702 715,876 2,333,756
14Health Occupations - Denta l Ass is ting, Medica l
Lab, and Associate Degree Nurs ing$5.01 380,112 1,904,361 52,508 263,065 6,938 34,759 0 0 0 0 439,558 2,202,186
15 Health Occupations - Denta l Hygiene $8.01 0 0 0 0 0 0 0 0 0 0 0 0
16 Health Occupations - Other $3.96 172,243 682,082 276,402 1,094,552 126,853 502,338 71,728 284,043 11,808 46,760 659,034 2,609,775
17 Health Occupations - Respiratory Therapy $5.27 0 0 40,960 215,859 0 0 0 0 0 0 40,960 215,859
18 Health Occupations - Vocational Nurs ing $4.00 0 0 197,888 791,552 256 1,024 0 0 0 0 198,144 792,576
19 Mathematics $3.31 887,824 2,938,697 366,160 1,211,990 452,532 1,497,881 756,064 2,502,572 238,976 791,011 2,701,556 8,942,150
20 Mechanics and Repairers - Automotive $4.07 0 0 284,901 1,159,547 0 0 0 0 0 0 284,901 1,159,547
21Mechanics and Repairers - Diesel , Aviation
Mechanics , and Transportation Workers$4.43 0 0 175,116 775,764 1,976 8,754 0 0 0 0 177,092 784,518
22 Mechanics and Repairers - Electronics $3.43 3,486 11,957 10,128 34,739 9,099 31,210 3,840 13,171 0 0 26,553 91,077
23 Phys ica l Education and Fi tness $3.95 236,880 935,676 78,864 311,513 88,464 349,433 125,040 493,908 40,608 160,402 569,856 2,250,931
24 Protective Services and Publ ic Adminis tration $3.60 376,684 1,356,062 19,440 69,984 53,472 192,499 52,608 189,389 6,000 21,600 508,204 1,829,534
25 Psychology, Socia l Sciences , and His tory $3.00 1,316,032 3,948,096 445,944 1,337,832 578,880 1,736,640 875,520 2,626,560 276,720 830,160 3,493,096 10,479,288
26 Visual and Performing Arts $3.97 470,368 1,867,361 117,072 464,776 142,480 565,646 258,784 1,027,372 76,384 303,244 1,065,088 4,228,399
Total 7,958,147 27,810,638 4,212,841 15,184,768 3,136,692 10,736,502 4,248,215 14,363,718 1,226,368 4,118,196 20,782,263 72,213,823
FY11 New Campus Funding (NLC) 271,302 271,302
Total Funding with FY11 New Campus Funding $3.49 27,810,638 15,184,768 10,736,502 14,363,718 4,389,498 72,485,125
Appropriation per Base Year Contact Hour $3.24 38.37% 20.95% 14.81% 19.82% 6.06% 100.00%
Less Mandated State Appropriation Reduction (1,951,932) (1,065,766) (753,558) (1,008,140) (308,084) (5,087,480)
FY11 State Appropriation Distribution-FINAL $3.24 25,858,705 14,119,002 9,982,945 13,355,579 4,081,414 67,397,645
Source: Rates per Base Period Contact Hours - Texas Higher Education Coordinating Board (THECB)
Base Year Contact Hours (Summer 2008, Fall 2008, and Spring 2009) - District Institutional Research and Effectiveness Services (IRES) Office
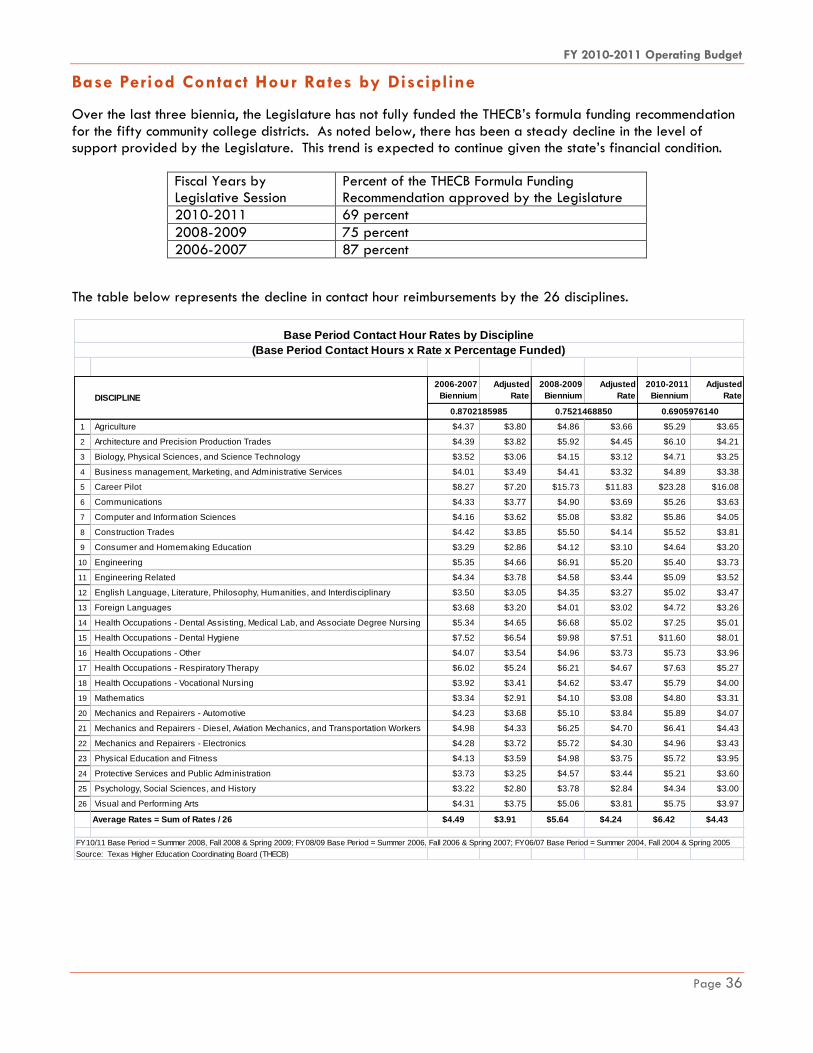
FY 2010-2011 Operating Budget
Page 36
Base Period Contact Hour Rates by Discipline
Over the last three biennia, the Legislature has not fully funded the THECB‘s formula funding recommendation
for the fifty community college districts. As noted below, there has been a steady decline in the level of support provided by the Legislature. This trend is expected to continue given the state‘s financial condition.
Fiscal Years by Legislative Session
Percent of the THECB Formula Funding Recommendation approved by the Legislature
2010-2011 69 percent
2008-2009 75 percent
2006-2007 87 percent
The table below represents the decline in contact hour reimbursements by the 26 disciplines.
Base Period Contact Hour Rates by Discipline
(Base Period Contact Hours x Rate x Percentage Funded)
2006-2007
Biennium
Adjusted
Rate
2008-2009
Biennium
Adjusted
Rate
2010-2011
Biennium
Adjusted
Rate
0.8702185985 0.7521468850 0.6905976140
1 Agriculture $4.37 $3.80 $4.86 $3.66 $5.29 $3.65
2 Architecture and Precision Production Trades $4.39 $3.82 $5.92 $4.45 $6.10 $4.21
3 Biology, Physical Sciences, and Science Technology $3.52 $3.06 $4.15 $3.12 $4.71 $3.25
4 Business management, Marketing, and Administrative Services $4.01 $3.49 $4.41 $3.32 $4.89 $3.38
5 Career Pilot $8.27 $7.20 $15.73 $11.83 $23.28 $16.08
6 Communications $4.33 $3.77 $4.90 $3.69 $5.26 $3.63
7 Computer and Information Sciences $4.16 $3.62 $5.08 $3.82 $5.86 $4.05
8 Construction Trades $4.42 $3.85 $5.50 $4.14 $5.52 $3.81
9 Consumer and Homemaking Education $3.29 $2.86 $4.12 $3.10 $4.64 $3.20
10 Engineering $5.35 $4.66 $6.91 $5.20 $5.40 $3.73
11 Engineering Related $4.34 $3.78 $4.58 $3.44 $5.09 $3.52
12 English Language, Literature, Philosophy, Humanities, and Interdisciplinary $3.50 $3.05 $4.35 $3.27 $5.02 $3.47
13 Foreign Languages $3.68 $3.20 $4.01 $3.02 $4.72 $3.26
14 Health Occupations - Dental Assisting, Medical Lab, and Associate Degree Nursing $5.34 $4.65 $6.68 $5.02 $7.25 $5.01
15 Health Occupations - Dental Hygiene $7.52 $6.54 $9.98 $7.51 $11.60 $8.01
16 Health Occupations - Other $4.07 $3.54 $4.96 $3.73 $5.73 $3.96
17 Health Occupations - Respiratory Therapy $6.02 $5.24 $6.21 $4.67 $7.63 $5.27
18 Health Occupations - Vocational Nursing $3.92 $3.41 $4.62 $3.47 $5.79 $4.00
19 Mathematics $3.34 $2.91 $4.10 $3.08 $4.80 $3.31
20 Mechanics and Repairers - Automotive $4.23 $3.68 $5.10 $3.84 $5.89 $4.07
21 Mechanics and Repairers - Diesel, Aviation Mechanics, and Transportation Workers $4.98 $4.33 $6.25 $4.70 $6.41 $4.43
22 Mechanics and Repairers - Electronics $4.28 $3.72 $5.72 $4.30 $4.96 $3.43
23 Physical Education and Fitness $4.13 $3.59 $4.98 $3.75 $5.72 $3.95
24 Protective Services and Public Administration $3.73 $3.25 $4.57 $3.44 $5.21 $3.60
25 Psychology, Social Sciences, and History $3.22 $2.80 $3.78 $2.84 $4.34 $3.00
26 Visual and Performing Arts $4.31 $3.75 $5.06 $3.81 $5.75 $3.97
Average Rates = Sum of Rates / 26 $4.49 $3.91 $5.64 $4.24 $6.42 $4.43
FY10/11 Base Period = Summer 2008, Fall 2008 & Spring 2009; FY08/09 Base Period = Summer 2006, Fall 2006 & Spring 2007; FY06/07 Base Period = Summer 2004, Fall 2004 & Spring 2005
Source: Texas Higher Education Coordinating Board (THECB)
DISCIPLINE

FY 2010-2011 Operating Budget
Page 37
Assessed Value and Tax Levy of Taxable Proper ty
ALAMO COMMUNITY COLLEGE DISTRICT
ESTIMATED TAXABLE VALUES AND RATES FOR 2010 AND
COMPARISON WITH INFORMATION REGARDING AD VALOREM TAXES 2009
Tax Year 2009 Tax Year 2010 Est.
(FY 10) (FY 11)
Market Value 111,368,411,472 110,222,240,785
Less Agricultural Exclusion (2,440,490,456) (2,356,611,749)
Less Homestead Cap (431,256,532) (211,728,751)
Market Value Net of Agricultural Exclusion 108,496,664,484 107,653,900,285
Over 65 (2,678,844,311) (2,789,316,900)
Disabled/ Veterans (600,974,143) (869,098,580)
Disabled Resident Homeowners & Other (5,965,630,157) (5,991,737,369)
Taxable Property Values 99,251,215,873 98,003,747,436
Less Freeze Taxable (9,249,279,338) (9,532,234,933)
Taxable Property Values Less Freeze 90,001,936,535 88,471,512,503
Taxable Property Values Used For Effective Tax Rate 88,088,261,730 88,064,494,004
Taxable Value of New Properties 3,452,331,695 2,199,066,627
TIF's (553,453,121) (487,246,675)
M&O Current Tax Levy * $90,089,139 $94,332,025
M&O Current Tax Estimated Collectable $88,287,356 $91,973,725
M&O Current Taxes Budgeted $88,540,701 $90,838,966
M&O Tax Rate 9.1105¢/$100 9.6873¢/$100
M&O Rollback Rate 10.0904¢/$100 10.2311¢/$100
Debt Service To Be Paid $42,454,687 $42,500,818
Debt Service Requirement Net of Transfer $0 $0
Debt Service Tax Levy $42,454,687 $42,500,818
Debt Service Tax Rate 4.475¢/$100 4.475¢/$100
Total Tax Rate 13.5855¢/100 14.1623¢/100
Total Effective Tax Rate 13.9285¢/100 14.1623¢/100
Total Tax Rollback Rate 14.8476¢/100 15.0450¢/100
Source: Bexar County Appraisal District Certified Totals
2009 dated 7-17-09
2010 dated 7-20-10
* FY 2009 M & O Tax Levy amount adjusted to actual

FY 2010-2011 Operating Budget
Page 38
Ten Year Trend of Revenue Sources
ALAMO COMMUNITY COLLEGE DISTRICT
10 YEAR COMPARISON OF REVENUES
FISCAL STATE LOCAL TUITION
YEAR FUNDING (1) % TAXES % & FEES (2) % OTHER (3) % TOTAL
2010-2011 (4) 67,397,645 24.11% 92,364,000 33.04% 111,083,343 39.73% 8,744,012 3.13% 279,589,000
2009-2010 (6) 69,233,873 25.55% 89,615,404 33.08% 103,371,926 38.15% 8,719,428 3.22% 270,940,631
2008-2009 (5) 67,846,696 27.26% 88,412,612 35.53% 83,452,604 33.54% 9,135,448 3.67% 248,847,360
2007-2008 (5) 67,846,696 28.69% 79,277,313 33.52% 78,265,201 33.09% 11,128,909 4.71% 236,518,119
2006-2007 (5) 65,409,379 33.47% 70,079,189 35.86% 49,198,458 25.18% 10,728,592 5.49% 195,415,618
2005-2006 (5) 65,746,811 35.75% 62,843,083 34.18% 45,343,961 24.66% 9,952,156 5.41% 183,886,011
2004-2005 (5) 58,069,378 34.58% 58,223,733 34.68% 43,234,582 25.75% 8,376,724 4.99% 167,904,417
2003-2004 (5) 58,070,337 36.85% 55,117,374 34.97% 37,482,976 23.78% 6,925,946 4.39% 157,596,633
2002-2003 (5) 55,994,039 38.55% 51,156,426 35.22% 31,581,289 21.74% 6,516,442 4.49% 145,248,196
2001-2002 (5) 60,208,645 42.71% 46,817,365 33.21% 29,298,112 20.78% 4,659,787 3.31% 140,983,909
(1) INCLUDES FUNDS FOR DEVELOPMENTAL EDUCATION (4) PER BUDGET
(2) NET TUITION AND FEES (5) ACTUAL REVENUES PER CONSOLIDATED ANNUAL FINANCIAL REPORT
(3) INCLUDES GROSS AUXILIARY REVENUES (6) PRELIMINARY FY10 ACTUAL REVENUES
Source: Annual Financial Reports - Schedules A and C

FY 2010-2011 Operating Budget
Page 39
Expenditure Summary
The FY11 I&G Operating Budget reflects the mandatory reductions in state appropriations and includes 25
strategies to balance the budget and support a 5.5% contact hour growth. Below is an expenditure summary
for current budgeted year and the prior year, based on allocation decisions made at the college levels.
Budget Summary by Account Type
SAC SPC PAC NVC NLC DISTRICT TOTAL %
FY 2011 APPROVED
FTE Salaries 35,480,103 19,383,219 13,543,231 13,459,368 6,802,245 34,745,519 123,413,685 46.0%
Other Salaries and Wages 10,653,569 11,454,558 4,421,856 11,592,353 3,907,865 5,033,044 47,063,245 17.5%
Fringe Benefits 5,009,323 2,966,676 1,656,639 2,514,814 1,107,838 7,416,347 20,671,637 7.7%
Total Personnel & Benefits 51,142,995 33,804,453 19,621,725 27,566,535 11,817,948 47,194,910 191,148,567 71.3%
Operating Expenses 15,860,741 7,433,172 5,188,066 8,266,846 2,412,649 37,912,505 77,073,978 28.7%
Sub-Total 67,003,736 41,237,625 24,809,791 35,833,381 14,230,597 85,107,415 268,222,545 100.0%
Transfers 1,631,656 1,268,904 561,693 798,190 239,557 11,866,455 16,366,455
68,635,392 42,506,529 25,371,484 36,631,571 14,470,154 96,973,870 284,589,000
FY 2010 ADJUSTED
FTE Salaries (1) 36,659,810 18,036,296 13,071,118 13,350,989 6,014,509 34,565,491 121,698,213 45.0%
Other Salaries and Wages 14,513,295 10,894,731 7,350,292 11,300,583 3,328,973 7,887,175 55,275,050 20.4%
Fringe Benefits 5,457,301 3,049,940 2,107,484 2,239,736 811,469 7,635,644 21,301,574 7.9%
Total Personnel & Benefits 56,630,405 31,980,968 22,528,894 26,891,309 10,154,951 50,088,311 198,274,837 73.3% (2)
Operating Expenses 14,064,769 9,314,969 5,258,448 7,176,465 2,377,985 34,147,678 72,340,313 26.7%
Sub-Total 70,695,174 41,295,936 27,787,342 34,067,773 12,532,936 84,235,989 270,615,150 100.0%
Transfers 888,152 994,904 310,535 934,723 173,474 11,049,707 14,351,496
71,583,326 42,290,840 28,097,877 35,002,497 12,706,410 95,285,696 284,966,646
VARIANCE
FTE Salaries (1,179,706) 1,346,923 472,113 108,379 787,736 180,027 1,715,472
Other Salaries and Wages (3,859,726) 559,827 (2,928,436) 291,770 578,892 (2,854,131) (8,211,805)
Fringe Benefits (447,978) (83,264) (450,845) 275,078 296,369 (219,297) (629,937)
Total Personnel & Benefits (5,487,410) 1,823,486 (2,907,169) 675,227 1,662,997 (2,893,401) (7,126,270)
Operating Expenses 1,795,972 (1,881,797) (70,382) 1,090,381 34,664 3,764,828 4,733,665
Sub-Total (3,691,438) (58,311) (2,977,551) 1,765,608 1,697,661 871,426 (2,392,605)
Transfers 743,504 274,000 251,158 (136,533) 66,083 816,748 2,014,959
(2,947,934) 215,689 (2,726,393) 1,629,074 1,763,744 1,688,174 (377,646)
(1) FY2010 adjusted budget includes lapsed salary amounts in FTE Salaries line
(2) To cover the FY10 state appropriation cuts, Alamo Colleges under spent their FY10 Budget by $5 million; thus Actual FY10 salary
and benefits were 75.97 percent of total expenditures.
NOTE: FTE is defined as Full-Time Employee in this table.
BUDGET SUMMARY COMPARISON BY ACCOUNT TYPE
FY 2010 Adjusted vs. FY 2011 Approved

FY 2010-2011 Operating Budget
Page 40
Budget Summary by Salary and Other Expense
FY 2011 Budget Summary by Functional CategoryFTE FTE SALARY BENEFITS OTHER EXPENSE TOTAL %
San Antonio College
Instruction 470.26 25,980,516.03 17,212,040.61 43,192,556.64 62.9%
Public Service 2.00 96,513.42 0.00 96,513.42 0.1%
Academic Support 85.00 4,155,484.66 3,486,452.00 7,641,936.66 11.1%
Student Services 90.00 3,719,548.67 3,532,790.00 7,252,338.67 10.6%
Institutional Support 23.00 1,166,667.75 1,598,597.00 2,765,264.75 4.0%
Scholarships 298,430.00 298,430.00 0.4%
Auxiliary Enterprises 10.00 361,372.86 386,000.00 747,372.86 1.1%
Transfers 1,631,656.00 1,631,656.00 2.4%
Benefits 5,009,323.00 5,009,323.00 7.3%
Total 680.26 $35,480,103.39 $5,009,323.00 $28,145,965.61 $68,635,392.00 100.0%
St. Philips' College
Instruction 244.94 12,509,464.89 14,286,269.00 26,795,733.89 63.0%
Public Service 91,558.00 91,558.00 0.2%
Academic Support 68.00 3,328,397.90 1,111,341.00 4,439,738.90 10.4%
Student Services 46.00 2,170,736.93 1,279,397.00 3,450,133.93 8.1%
Institutional Support 22.20 1,322,515.05 1,872,756.57 3,195,271.62 7.5%
Operations and Maintenance 7,500.00 7,500.00 0.0%
Scholarships 164,712.00 164,712.00 0.4%
Auxiliary Enterprises 2.00 52,104.66 74,196.00 126,300.66 0.3%
Transfers 1,268,904.00 1,268,904.00 3.0%
Benefits 2,966,676.00 2,966,676.00 7.0%
Total 383.14 $19,383,219.43 $2,966,676.00 $20,156,633.57 $42,506,529.00 100.0%
Palo Alto College
Instruction 153.20 7,853,338.39 6,230,205.00 14,083,543.39 55.5%
Academic Support 56.10 2,422,607.78 635,335.00 3,057,942.78 12.1%
Student Services 44.00 1,939,378.48 844,815.00 2,784,193.48 11.0%
Institutional Support 13.00 840,637.76 1,523,324.51 2,363,962.27 9.3%
Scholarships 133,219.00 133,219.00 0.5%
Auxiliary Enterprises 14.00 487,268.30 243,022.78 730,291.08 2.9%
Transfers 561,693.00 561,693.00 2.2%
Benefits 1,656,639.00 1,656,639.00 6.5%
Total 280.30 $13,543,230.71 $1,656,639.00 $10,171,614.29 $25,371,484.00 100.0%
Northwest Vista College
Instruction 147.00 6,953,465.66 12,283,013.00 19,236,478.66 52.5%
Academic Support 68.50 3,082,552.31 4,907,882.56 7,990,434.87 21.8%
Student Services 57.00 2,284,903.88 1,234,178.00 3,519,081.88 9.6%
Institutional Support 20.50 1,138,446.59 1,170,828.00 2,309,274.59 6.3%
Scholarships 263,297.00 263,297.00 0.7%
Transfers 798,190.00 798,190.00 2.2%
Benefits 2,514,814.00 2,514,814.00 6.9%
Total 293.00 $13,459,368.44 $2,514,814.00 $20,657,388.56 $36,631,571.00 100.0%
Northeast Lakeview College
Instruction 74.00 3,513,790.62 3,858,353.04 7,372,143.66 50.9%
Academic Support 28.00 1,304,381.10 934,213.00 2,238,594.10 15.5%
Student Services 24.00 1,046,218.86 619,077.00 1,665,295.86 11.5%
Institutional Support 14.00 937,854.10 908,871.28 1,846,725.38 12.8%
Transfers 239,557.00 239,557.00 1.7%
Benefits 1,107,838.00 1,107,838.00 7.7%
Total 140.00 $6,802,244.68 $1,107,838.00 $6,560,071.32 $14,470,154.00 100.0%
District and District Support
Instruction 268,674.00 268,674.00 0.3%
Public Service 3,393.00 3,393.00 0.0%
Student Services 85.00 3,853,965.35 597,948.60 4,451,913.95 4.6%
Institutional Support 417.23 22,201,181.56 19,032,654.74 41,233,836.30 42.5%
Operations and Maintenance 273.00 8,600,617.81 22,774,759.00 31,375,376.81 32.4%
Auxiliary Enterprises 3.48 89,754.03 268,120.00 357,874.03 0.4%
Transfers 11,866,455.00 11,866,455.00 12.2%
Benefits 7,416,346.91 7,416,346.91 7.6%
Total 778.71 $34,745,518.75 $7,416,346.91 $54,812,004.34 $96,973,870.00 100.0%
Total
Instruction 1,089.40 56,810,575.59 54,138,554.65 110,949,130.24 39.0%
Public Service 2.00 96,513.42 94,951.00 191,464.42 0.1%
Academic Support 305.60 14,293,423.75 11,075,223.56 25,368,647.31 8.9%
Student Services 346.00 15,014,752.17 8,108,205.60 23,122,957.77 8.1%
Institutional Support 509.93 27,607,302.81 26,107,032.10 53,714,334.91 18.9%
Operations and Maintenance 273.00 8,600,617.81 22,782,259.00 31,382,876.81 11.0%
Scholarships 859,658.00 859,658.00 0.3%
Auxiliary Enterprises 29.48 990,499.85 971,338.78 1,961,838.63 0.7%
Transfers 16,366,455.00 16,366,455.00 5.8%
Benefits 20,671,636.91 20,671,636.91 7.3%
Total 2,555.41 $123,413,685.40 $20,671,636.91 $140,503,677.69 $284,589,000.00 100.0%
Note: Other Expense includes operating expenses and other salaries/wages.
Note: FTE is defined as Full-Time Employee in this table.
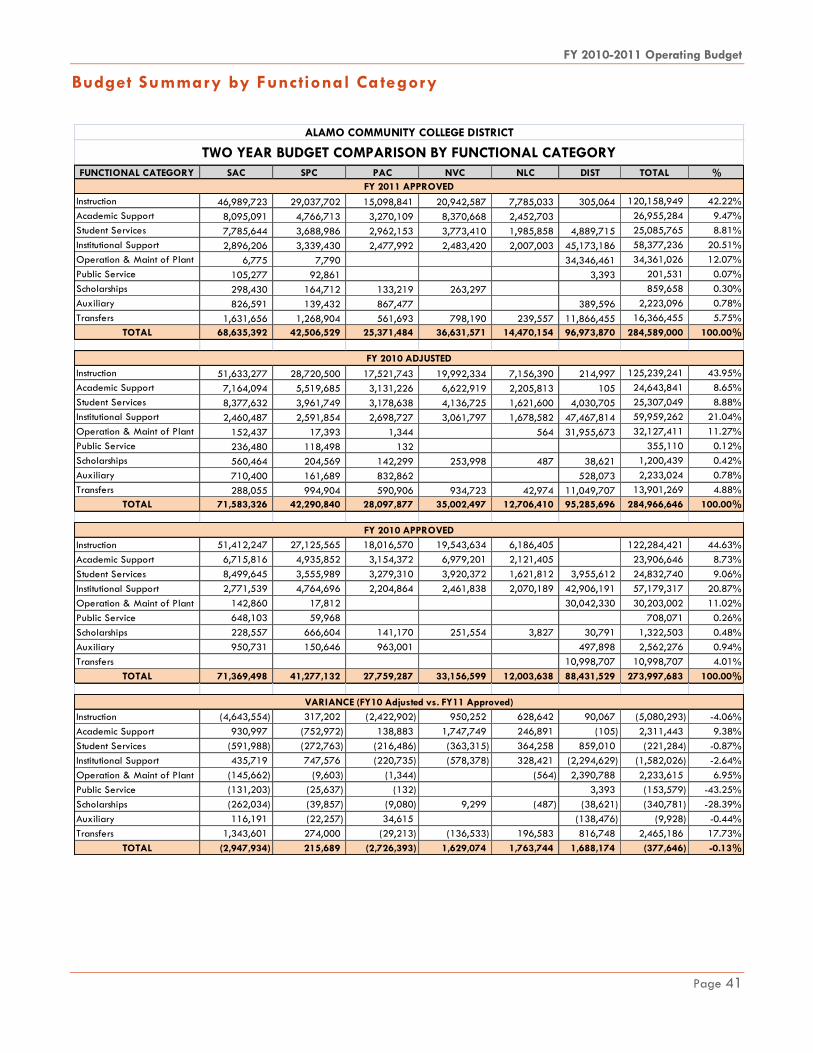
FY 2010-2011 Operating Budget
Page 41
Budget Summary by Functional Category
FUNCTIONAL CATEGORY SAC SPC PAC NVC NLC DIST TOTAL %
Instruction 46,989,723 29,037,702 15,098,841 20,942,587 7,785,033 305,064 120,158,949 42.22%
Academic Support 8,095,091 4,766,713 3,270,109 8,370,668 2,452,703 26,955,284 9.47%
Student Services 7,785,644 3,688,986 2,962,153 3,773,410 1,985,858 4,889,715 25,085,765 8.81%
Institutional Support 2,896,206 3,339,430 2,477,992 2,483,420 2,007,003 45,173,186 58,377,236 20.51%
Operation & Maint of Plant 6,775 7,790 34,346,461 34,361,026 12.07%
Public Service 105,277 92,861 3,393 201,531 0.07%
Scholarships 298,430 164,712 133,219 263,297 859,658 0.30%
Auxiliary 826,591 139,432 867,477 389,596 2,223,096 0.78%
Transfers 1,631,656 1,268,904 561,693 798,190 239,557 11,866,455 16,366,455 5.75%
TOTAL 68,635,392 42,506,529 25,371,484 36,631,571 14,470,154 96,973,870 284,589,000 100.00%
Instruction 51,633,277 28,720,500 17,521,743 19,992,334 7,156,390 214,997 125,239,241 43.95%
Academic Support 7,164,094 5,519,685 3,131,226 6,622,919 2,205,813 105 24,643,841 8.65%
Student Services 8,377,632 3,961,749 3,178,638 4,136,725 1,621,600 4,030,705 25,307,049 8.88%
Institutional Support 2,460,487 2,591,854 2,698,727 3,061,797 1,678,582 47,467,814 59,959,262 21.04%
Operation & Maint of Plant 152,437 17,393 1,344 564 31,955,673 32,127,411 11.27%
Public Service 236,480 118,498 132 355,110 0.12%
Scholarships 560,464 204,569 142,299 253,998 487 38,621 1,200,439 0.42%
Auxiliary 710,400 161,689 832,862 528,073 2,233,024 0.78%
Transfers 288,055 994,904 590,906 934,723 42,974 11,049,707 13,901,269 4.88%
TOTAL 71,583,326 42,290,840 28,097,877 35,002,497 12,706,410 95,285,696 284,966,646 100.00%
Instruction 51,412,247 27,125,565 18,016,570 19,543,634 6,186,405 122,284,421 44.63%
Academic Support 6,715,816 4,935,852 3,154,372 6,979,201 2,121,405 23,906,646 8.73%
Student Services 8,499,645 3,555,989 3,279,310 3,920,372 1,621,812 3,955,612 24,832,740 9.06%
Institutional Support 2,771,539 4,764,696 2,204,864 2,461,838 2,070,189 42,906,191 57,179,317 20.87%
Operation & Maint of Plant 142,860 17,812 30,042,330 30,203,002 11.02%
Public Service 648,103 59,968 708,071 0.26%
Scholarships 228,557 666,604 141,170 251,554 3,827 30,791 1,322,503 0.48%
Auxiliary 950,731 150,646 963,001 497,898 2,562,276 0.94%
Transfers 10,998,707 10,998,707 4.01%
TOTAL 71,369,498 41,277,132 27,759,287 33,156,599 12,003,638 88,431,529 273,997,683 100.00%
Instruction (4,643,554) 317,202 (2,422,902) 950,252 628,642 90,067 (5,080,293) -4.06%
Academic Support 930,997 (752,972) 138,883 1,747,749 246,891 (105) 2,311,443 9.38%
Student Services (591,988) (272,763) (216,486) (363,315) 364,258 859,010 (221,284) -0.87%
Institutional Support 435,719 747,576 (220,735) (578,378) 328,421 (2,294,629) (1,582,026) -2.64%
Operation & Maint of Plant (145,662) (9,603) (1,344) (564) 2,390,788 2,233,615 6.95%
Public Service (131,203) (25,637) (132) 3,393 (153,579) -43.25%
Scholarships (262,034) (39,857) (9,080) 9,299 (487) (38,621) (340,781) -28.39%
Auxiliary 116,191 (22,257) 34,615 (138,476) (9,928) -0.44%
Transfers 1,343,601 274,000 (29,213) (136,533) 196,583 816,748 2,465,186 17.73%
TOTAL (2,947,934) 215,689 (2,726,393) 1,629,074 1,763,744 1,688,174 (377,646) -0.13%
VARIANCE (FY10 Adjusted vs. FY11 Approved)
FY 2010 ADJUSTED
ALAMO COMMUNITY COLLEGE DISTRICT
TWO YEAR BUDGET COMPARISON BY FUNCTIONAL CATEGORY
FY 2011 APPROVED
FY 2010 APPROVED

FY 2010-2011 Operating Budget
Page 42
Functional Category Descriptions
1xxx Instruction
This category includes expenditures for all activities that are part of an institution's instruction
program.
It includes salary and operating expenditures for:
Academic, Vocational and Technical instruction (credit and non-credit courses)
Developmental and Tutorial instruction
Remedial
Regular, Special, and Extension sessions
Separately organized activities associated with instructional and training programs, such as
Child Development Program.
Expenditures for departmental research and public service that are not separately budgeted
Expenditures of department chairpersons, in which instruction is still the primary role of the administrator
Summer Programs for Children
Programs for Seniors
This category excludes expenditures for academic administration when the primary assignment is
administration -- for example, Academic Deans.
2xxx Public Service (Activities designed primarily to serve the general public)
This category includes funds expended for activities that are established primarily to provide non-
instructional services beneficial to individuals and groups external to the institution.
It includes salary and operating expenditures for:
Lectures
Seminars and Workshops
Planetarium operations.
3xxx Academic Support
This category should include funds expended primarily to provide support services for the institution's
primary missions -- instruction, research and public service.
It includes salary and operating expenditures for:
The retention, preservation and display of educational materials, i.e., Libraries/Learning
Resources, Museums and Galleries
Academic administration, i.e. Dean‘s salaries and office expenses
Technical support, i.e. Computer Services and Audio-Visual services
Separately budgeted support for course and curriculum development, and related items
Faculty development
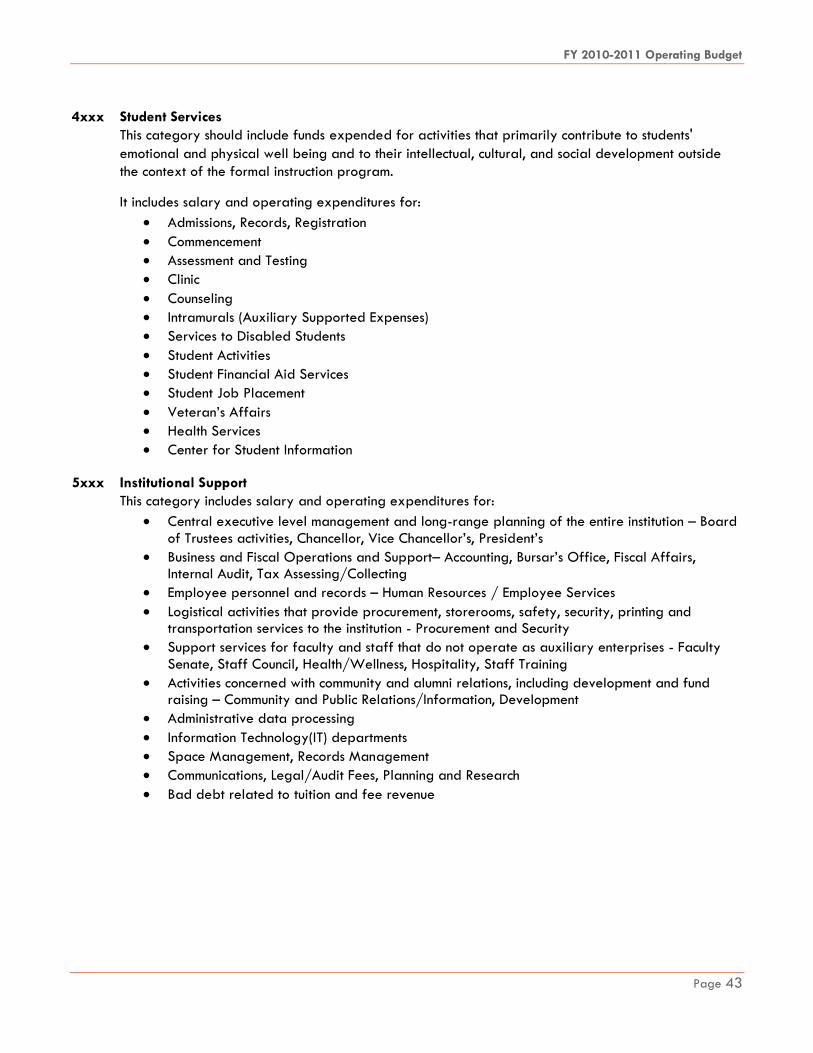
FY 2010-2011 Operating Budget
Page 43
4xxx Student Services
This category should include funds expended for activities that primarily contribute to students'
emotional and physical well being and to their intellectual, cultural, and social development outside
the context of the formal instruction program.
It includes salary and operating expenditures for:
Admissions, Records, Registration
Commencement
Assessment and Testing
Clinic
Counseling
Intramurals (Auxiliary Supported Expenses)
Services to Disabled Students
Student Activities
Student Financial Aid Services
Student Job Placement
Veteran‘s Affairs
Health Services
Center for Student Information
5xxx Institutional Support
This category includes salary and operating expenditures for:
Central executive level management and long-range planning of the entire institution – Board
of Trustees activities, Chancellor, Vice Chancellor‘s, President‘s
Business and Fiscal Operations and Support– Accounting, Bursar‘s Office, Fiscal Affairs, Internal Audit, Tax Assessing/Collecting
Employee personnel and records – Human Resources / Employee Services
Logistical activities that provide procurement, storerooms, safety, security, printing and transportation services to the institution - Procurement and Security
Support services for faculty and staff that do not operate as auxiliary enterprises - Faculty
Senate, Staff Council, Health/Wellness, Hospitality, Staff Training
Activities concerned with community and alumni relations, including development and fund raising – Community and Public Relations/Information, Development
Administrative data processing
Information Technology(IT) departments
Space Management, Records Management
Communications, Legal/Audit Fees, Planning and Research
Bad debt related to tuition and fee revenue

FY 2010-2011 Operating Budget
Page 44
6xxx Operations and Maintenance of Plant
This category should include all expenditures of current funds for the operation and maintenance of
physical plant, net of amounts charged to auxiliary enterprises, hospitals and independent operations.
It includes salary and operating expenditures for:
Building/Grounds Maintenance
Custodial Services
Preventive Maintenance
Utilities
Support – Contract Administration, Project Management
7xxx Scholarships and Fellowships
This category includes expenditures for scholarships and fellowships from restricted and unrestricted
funds in grants to students either from selection by the institution or from an entitlement program. If the
institution does not select the recipient of the award and is only custodian of the funds, as with ROTC
scholarships, the funds should be reported in the Agency Fund group.
This category includes Institutional, Trustee, District Endowed.
Certain Payments to Students are not Scholarships and Fellowships:
Recipients of grants are not required to perform service to the institution as consideration of the grant,
nor are they expected to repay the amount of the grant to the funding source. When services are
required in exchange for financial assistance, as in the federal College Work-Study Program, the
charges should be classified as expenditures of the department or organizational unit to which the
service is rendered.
8xxx Auxiliary Enterprises
This category includes all expenditures relating to the operation of auxiliary enterprises, including
expenditures for operation and maintenance of plant and institutional support.
It includes salary and operating expenditures for:
Child Care Center
Food Service
Natatorium Operation

FY 2010-2011 Operating Budget
Page 45
Depar tment Listing by Functional Categories
DEPARTMENTS BY FUNCTIONAL CATEGORIES
INSTRUCTION (1XXX)
Orgn Name Orgn Code Orgn Name Orgn Code
SAC Architecture 811241 SAC Fire Technology 812104
SAC Art 811281 SAC Foreign Languages 811162
SAC Astronomy 811131 SAC Gateway 811702
SAC Banking Technology 812041 SAC General Institutional 810002
SAC Basic Skills Academy 811114 SAC History 811171
SAC Biological Sciences 811121 SAC Interpreter Training 812031
SAC Business Administrati 812042 SAC Journalism 811182
SAC Business Occupations 812011 SAC KSYM 811186
SAC CE Allied Health 813002 SAC Law Enforcement 812205
SAC CE Basic Skills 813010 SAC Learning Institute 811004
SAC CE Law Enforcement 813004 SAC Legal Assistant 812014
SAC CE Medical Office and 813009 SAC Library 815301
SAC CE Nursing 813006 SAC Management 812043
SAC CE Occupational 813003 SAC Mathematics and Compu 811203
SAC CE Professional 813007 SAC Medical Assisting 812022
SAC CE Teacher Certificat 813008 SAC Mental Health 812202
SAC CE Vocational ESL 813005 SAC Mortuary Science 812081
SAC Chemistry 811132 SAC Music 811211
SAC Child Development Ins 812052 SAC Music Business Progra 811188
SAC Child Development Ope 812053 SAC Nursing Ed Associate 812091
SAC Computer Aided Design 812071 SAC Nursing Special Progr 812093
SAC Computer Information 812061 SAC Office of the Preside 810003
SAC Conf and Court Report 812013 SAC Philosophy 811221
SAC CounselingandStudent 816410 SAC Photography 811183
SAC Credit EMS 812024 SAC Physical Education 811192
SAC Dean of Arts and Scie 811101 SAC Physics 811243
SAC Dean Profess and Tech 812001 SAC Political Science 811231
SAC Dental Assistants 812021 SAC Psychology 811251
SAC Dental Lab Technology 812023 SAC Public Administration 812204
SAC Developmental English 811151 SAC Radio and Television 811187
SAC Distance Education VC 814002 SAC Reading and Education 811291
SAC Earth Sciences 811133 SAC Real Estate Program 812045
SAC Economics 811232 SAC Retention and Transit 816405
SAC Edge Program 811242 SAC Safety Engineering Te 812076
SAC Educational Televisio 815333 SAC Service Learning Proj 815002
SAC Electronic Graphics 811185 SAC Sociology 811261
SAC Electronics Program 812072 SAC Student Assistance Lr 815008
SAC Emergency Medical Ser 813016 SAC Student Development 816409
SAC Emergency Mgt and HL 812106 SAC Technology Center 817201
SAC Engineering 811244 SAC Theatre and Communica 811274
SAC Engineering Technolog 812075 SAC VP Academic Affairs O 811001
SAC English 811152 SAC Writing Center 811301
SAC English As A Second L 811161

FY 2010-2011 Operating Budget
Page 46
DEPARTMENTS BY FUNCTIONAL CATEGORIES
INSTRUCTION (1XXX)
Orgn Name Orgn Code Orgn Name Orgn Code
SPC Accounting Informatn 822042 SPC Theater and Fine Arts 821121
SPC ACE Instruction 823006 SPC Tourism Hospitality C 822061
SPC Administrative Comput 822041 SPC Truck Driving Program 823012
SPC Allied Health 822011 SPC Writing Center 821113
SPC Alternative Teacher C 823011 SWC Alamo Career Transiti 828546
SPC Automotive Technology 822021 SWC Allied Construction 828501
SPC Biological Sciences 821152 SWC Auto Body 828561
SPC Biology Software Sale 821154 SWC Aviation 828541
SPC Business Administrati 821133 SWC CE Instruction 828402
SPC Business Management 822043 SWC Continuing Ed Special 828006
SPC CE Contract Training 823009 SWC Diesel Technology 828543
SPC Chemistry 821153 SWC Electrician 828502
SPC Child Development Cen 826022 SWC Enrichment Program 828007
SPC Child Development Ope 826021 SWC Home Building 828503
SPC Community Svc and Tra 823008 SWC Industrial Drafting 828522
SPC Computer Science 821134 SWC Machine Technology 828562
SPC Dean Applied Science 822001 SWC Multi-Modal Transport 828544
SPC Developmental English 821111 SWC Plumbing 828505
SPC Developmental Math 821132 SWC Welding 828563
SPC Distance Learning 823053
SPC Early Childhood Studi 822004
SPC Electronic Systems Te 822031 PAC Admissions and Record 832201
SPC English 821112 PAC Adult CE Instruction 831403
SPC Ford Motors 822023 PAC Agriculture 831211
SPC Foreign Languages 821172 PAC Alternative Teacher C 831404
SPC General Institutional 820002 PAC Art 831111
SPC General Motors 822022 PAC Aviation Technology 831286
SPC Information Technolog 822044 PAC Biological Sciences 831231
SPC K-8 Academy 823010 PAC Business Administrati 831221
SPC Kinesiology 821141 PAC Business Occupations 831222
SPC Mathematics 821131 PAC CE Allied Health 831409
SPC Medical Technical Pro 823004 PAC CE Childrens Leadersh 831412
SPC Music 821122 PAC CE Green Initiatives 831406
SPC Nursing Associate Deg 822052 PAC CE Toyota 831282
SPC Nursing New Braunfels 822053 PAC CE-Industr TrngandSaf 831408
SPC Nursing Special Progr 822055 PAC CE-Information Tech 831413
SPC Nursing Vocational 822051 PAC CE-Office Education 831407
SPC Physics 821151 PAC Chemistry 831232
SPC Psychology 821161 PAC Computer Information 831252
SPC Reading and Education 821171 PAC Computer Science 831251
SPC School To Work Progra 828004 PAC Criminal Justice 831271
SPC SEC CE Contract Train 828403 PAC Dance 831118
SPC Social Sciences 821162 PAC Developmental English 831171

FY 2010-2011 Operating Budget
Page 47
DEPARTMENTS BY FUNCTIONAL CATEGORIES
INSTRUCTION (1XXX)
Orgn Name Orgn Code Orgn Name Orgn Code
PAC Developmental Math 831262 NVC Biological Sciences 842042
PAC Distance Learning 830201 NVC Biotechnology 842055
PAC Distribution Logistic 831223 NVC Business Administrati 842022
PAC Drama 831112 NVC CE ESL Program 842508
PAC Earth Sciences 831233 NVC CE Open Enrollment No 842509
PAC Economics 831151 NVC CE Open Enrollment Re 842507
PAC Electro-Mechanical Te 831281 NVC Chemistry 842043
PAC Engineering 831234 NVC Clinical Research Coo 842054
PAC English 831172 NVC Community Education 848003
PAC English As A Second L 831173 NVC Community Health 842056
PAC Foreign Languages 831174 NVC Computer Information 842062
PAC Gateway To College IS 830207 NVC Contract Training Non 842504
PAC GED 831405 NVC Contract Training Rei 842503
PAC General Institutional 830002 NVC Criminal Justice 842086
PAC Geography 831152 NVC Dance 842014
PAC Geology 831236 NVC Developmental English 842093
PAC Government 831153 NVC Developmental Math 842074
PAC History 831154 NVC Developmental Reading 842095
PAC Humanities 831131 NVC Digital Video & Cinem 842060
PAC Kinesiology 831266 NVC Drama 842013
PAC Landscape and Turfgra 831212 NVC Dual Credit Program 842302
PAC LIS 831303 NVC Economics 842024
PAC Mariachi Prog Designa 831116 NVC Education 842085
PAC Mass Communications 831175 NVC Educator Preparation 842502
PAC Mathematics 831261 NVC Engineering 842046
PAC Mid-Management 831224 NVC English 842092
PAC Music 831114 NVC English and Reading L 842094
PAC Philosophy 831133 NVC English As A Second L 842512
PAC Physics 831235 NVC Fine Arts 842012
PAC Psychology 831134 NVC Foreign Languages 842034
PAC Reading and Education 831176 NVC Gaming Development 842061
PAC Social Work 831272 NVC General Institutional 840002
PAC Sociology 831135 NVC Geography 842082
PAC Speech 831113 NVC Geology 842044
PAC Teacher Assistant and 831136 NVC Government 842025
PAC Technical Computer La 830004 NVC History 842035
PAC Veterinary Technology 831296 NVC Humanities 842033
NVC Kinesiology 842016
NVC Mass Communications 842083
NVC Accounting 842023 NVC Math Lab 842072
NVC Advanced Water Treatm 842053 NVC Mathematics 842073
NVC Anthropology 842089 NVC Mexican-American Stud 842036
NVC Arts and Kinesiology 842011 NVC Multimedia 842059

FY 2010-2011 Operating Budget
Page 48
DEPARTMENTS BY FUNCTIONAL CATEGORIES
INSTRUCTION (1XXX)
Orgn Name Orgn Code Orgn Name Orgn Code
NVC Music 842015 NLC Reading 852103
NVC Nanotechnology 842058 NLC Recreation Training N 853002
NVC Personal Interest 848001 NLC Social Sciences 852179
NVC Pharmacy Technology 842057 NLC Sociology 852184
NVC Philosophy 842032 NLC Speech 852116
NVC Physics 842045 NLC Student Services Inst 851022
NVC Psychology 842087 NLC Theatre and Communica 852135
NVC Sociology 842088 NLC Tutoring Services 852011
NVC Speech 842084
NVC Student Development 845303
NVC TIER Programs 842505
NVC Tutoring Service 842201
NVC WETC CE Programs 842510
NLC Accounting-Business-M 852121
NLC Anthropology 852181
NLC Art Department 852131
NLC Biological Sciences 852162
NLC Business Training Non 853004
NLC Career Readiness Cont 853003
NLC Chemistry 852163
NLC CIS Specialty 852206
NLC Computer Information 852154
NLC Developmental Math 852152
NLC Economics 852171
NLC Education 852182
NLC English 852102
NLC Foreign Languages 852111
NLC General Institutional 850002
NLC Geography 852173
NLC Geology 852165
NLC Health Training Non-r 853005
NLC History 852174
NLC Humanities 852112
NLC Instruction Pool Acad 852012
NLC Journalism 852113
NLC Kinesiology 852141
NLC Mathematics and COSC 852151
NLC Music 852134
NLC Philosophy 852114
NLC Political Science 852176
NLC Psychology 852183
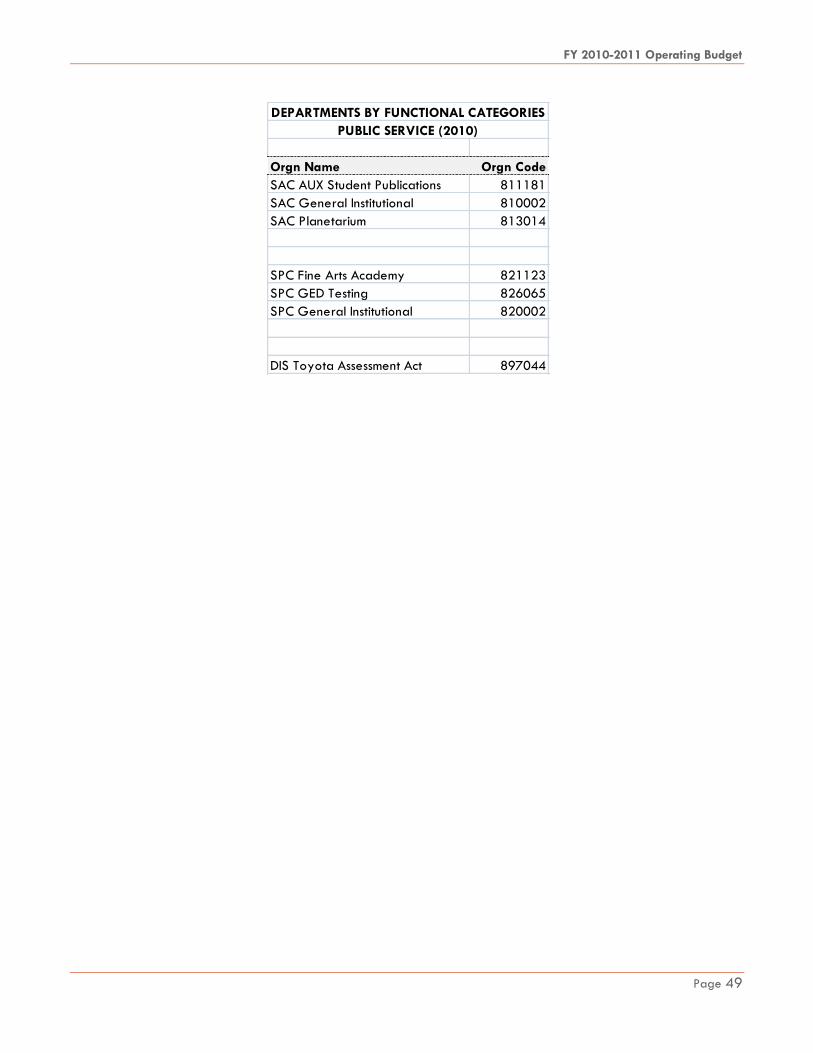
FY 2010-2011 Operating Budget
Page 49
Orgn Name Orgn Code
SAC AUX Student Publications 811181
SAC General Institutional 810002
SAC Planetarium 813014
SPC Fine Arts Academy 821123
SPC GED Testing 826065
SPC General Institutional 820002
DIS Toyota Assessment Act 897044
DEPARTMENTS BY FUNCTIONAL CATEGORIES
PUBLIC SERVICE (2010)

FY 2010-2011 Operating Budget
Page 50
DEPARTMENTS BY FUNCTIONAL CATEGORIES
ACADEMIC SUPPORT (3010)
Orgn Name Orgn Code Orgn Name Orgn Code
SAC Academic Development 811111 SPC Dean Interdisciplinar 825001
SAC Audio Visual Services 815332 SPC Dean of Health Scienc 821801
SAC CE Administration 813001 SPC Electronic Systems Te 822031
SAC CE Allied Health 813002 SPC Evening Operations 823003
SAC CE Basic Skills 813010 SPC Faculty Development 820013
SAC CE Law Enforcement 813004 SPC General Institutional 820002
SAC CE Medical Office and 813009 SPC Information&Communica 823051
SAC CE Occupational 813003 SPC Instructional Develop 823041
SAC CE Professional 813007 SPC Leadership and Learni 820301
SAC CE Teacher Certificat 813008 SPC Library Automation 824002
SAC CE Vocational ESL 813005 SPC Library Books and Mat 824003
SAC Computer Information 812061 SPC Library Services 824001
SAC Dean Even_Weeknd_Dist 814001 SPC Media Services 824004
SAC Dean Learning Resourc 815001 SPC SEC CE Contract Train 828403
SAC Dean of Arts and Scie 811101 SPC Telecourse Administra 823054
SAC Dean P-16 Initiatives 811701 SPC VP Academic Affairs O 821001
SAC Dean Profess and Tech 812001 SWC CE Administration 828401
SAC Disability Support Se 816507 SWC Dean Of Administratio 828003
SAC Educational Televisio 815333
SAC Emergency Medical Ser 813016
SAC Fines and Lost Materi 815303 PAC Adult CE Administrati 831401
SAC Fire Technology 812104 PAC Assessment 832204
SAC General Institutional 810002 PAC CE-Industr TrngandSaf 831408
SAC Instructional Technol 815101 PAC Counseling 832401
SAC Interpreting Services 812032 PAC Dean Of Arts and Huma 831101
SAC Learning Institute 811004 PAC Dean Of Learning Reso 831301
SAC Library 815301 PAC Dean Of Sciences and 831201
SAC Library Automation 815304 PAC Dean of Students 832051
SAC Library Books and Mat 815305 PAC Exit Center 830208
SAC LRC Copy Services 815302 PAC Gateway To College IS 830207
SAC Off-Campus Learning C 814004 PAC General Institutional 830002
SAC Physical Education 811192 PAC Information and Commu 830018
SAC Reading and Education 811291 PAC Inst Adv and Eff and 830206
SAC Technology Center 817201 PAC Journal 831178
SAC VP Academic Affairs O 811001 PAC Learning Resources 831302
SAC VP Student Affairs Of 816001 PAC Library Automation 831304
SAC Writing Center 811301 PAC Library Books and Mat 831305
PAC LIS 831303
PAC LRC Fines 831307
SPC ACE Administration 823005 PAC Office of the Preside 830003
SPC Dean Applied Science 822001 PAC Phoenix Institute 830202
SPC Dean Arts and Science 821101 PAC Teacher Assistant and 831136
SPC Dean Extended Service 823001 PAC Telecourse Administra 830204
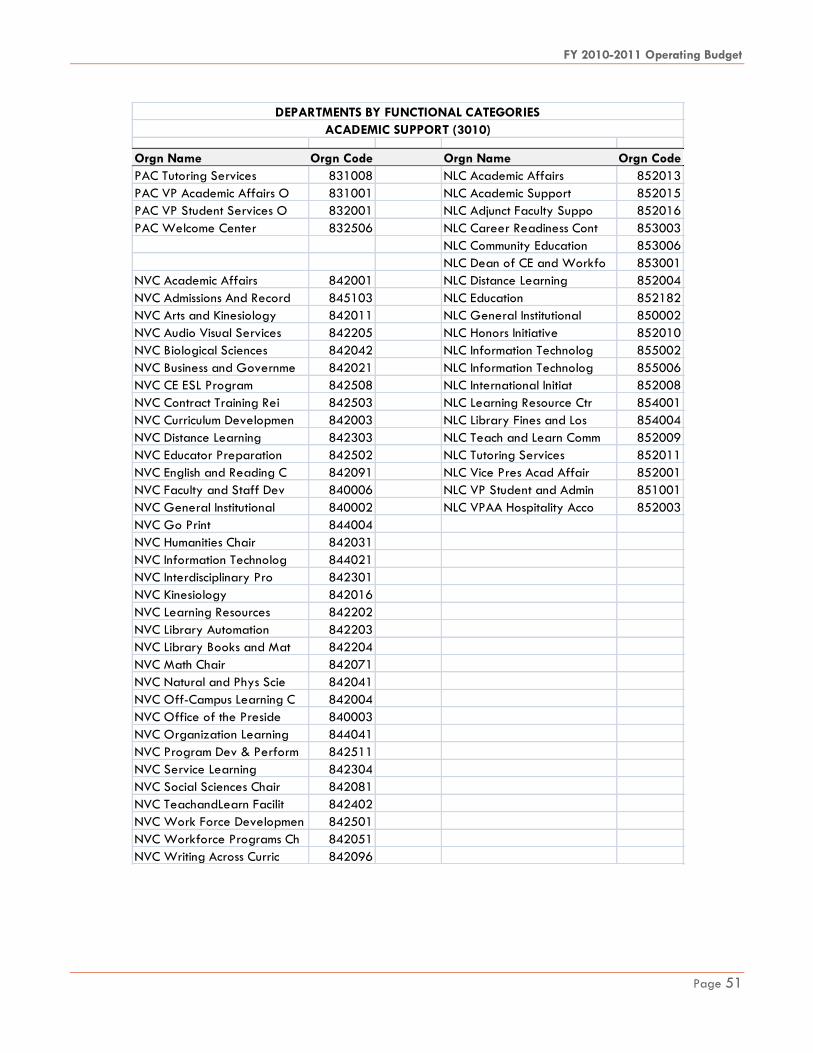
FY 2010-2011 Operating Budget
Page 51
DEPARTMENTS BY FUNCTIONAL CATEGORIES
ACADEMIC SUPPORT (3010)
Orgn Name Orgn Code Orgn Name Orgn Code
PAC Tutoring Services 831008 NLC Academic Affairs 852013
PAC VP Academic Affairs O 831001 NLC Academic Support 852015
PAC VP Student Services O 832001 NLC Adjunct Faculty Suppo 852016
PAC Welcome Center 832506 NLC Career Readiness Cont 853003
NLC Community Education 853006
NLC Dean of CE and Workfo 853001
NVC Academic Affairs 842001 NLC Distance Learning 852004
NVC Admissions And Record 845103 NLC Education 852182
NVC Arts and Kinesiology 842011 NLC General Institutional 850002
NVC Audio Visual Services 842205 NLC Honors Initiative 852010
NVC Biological Sciences 842042 NLC Information Technolog 855002
NVC Business and Governme 842021 NLC Information Technolog 855006
NVC CE ESL Program 842508 NLC International Initiat 852008
NVC Contract Training Rei 842503 NLC Learning Resource Ctr 854001
NVC Curriculum Developmen 842003 NLC Library Fines and Los 854004
NVC Distance Learning 842303 NLC Teach and Learn Comm 852009
NVC Educator Preparation 842502 NLC Tutoring Services 852011
NVC English and Reading C 842091 NLC Vice Pres Acad Affair 852001
NVC Faculty and Staff Dev 840006 NLC VP Student and Admin 851001
NVC General Institutional 840002 NLC VPAA Hospitality Acco 852003
NVC Go Print 844004
NVC Humanities Chair 842031
NVC Information Technolog 844021
NVC Interdisciplinary Pro 842301
NVC Kinesiology 842016
NVC Learning Resources 842202
NVC Library Automation 842203
NVC Library Books and Mat 842204
NVC Math Chair 842071
NVC Natural and Phys Scie 842041
NVC Off-Campus Learning C 842004
NVC Office of the Preside 840003
NVC Organization Learning 844041
NVC Program Dev & Perform 842511
NVC Service Learning 842304
NVC Social Sciences Chair 842081
NVC TeachandLearn Facilit 842402
NVC Work Force Developmen 842501
NVC Workforce Programs Ch 842051
NVC Writing Across Curric 842096
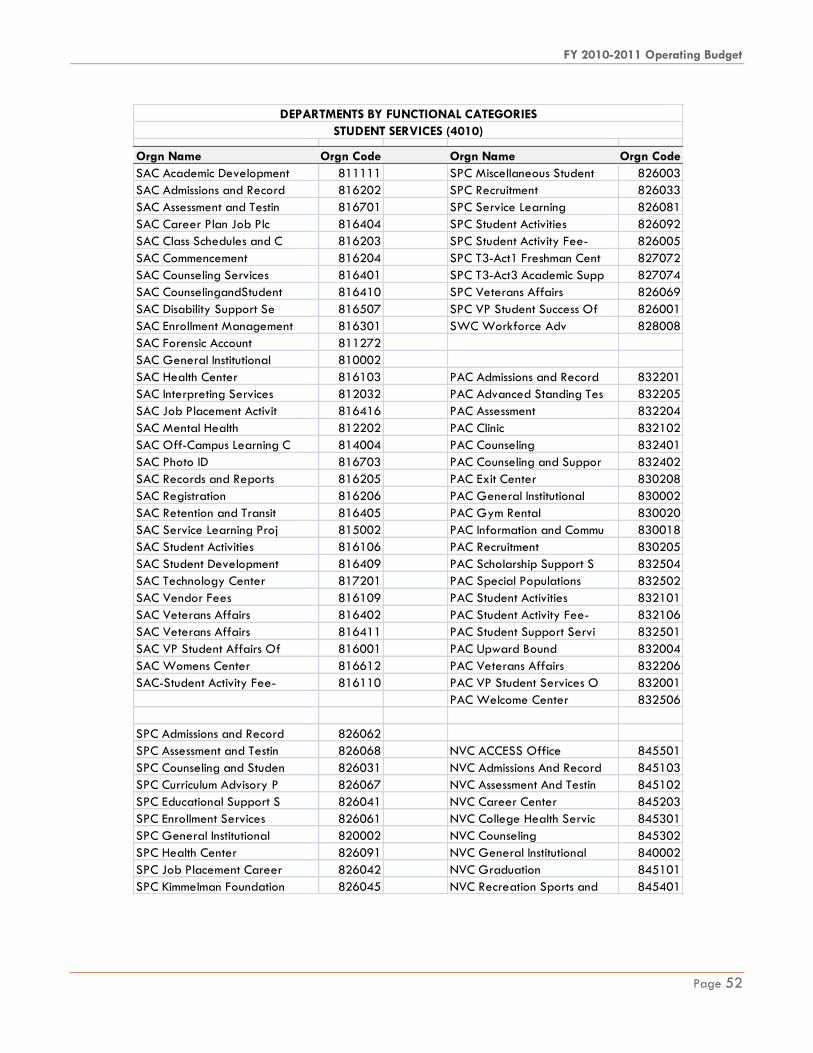
FY 2010-2011 Operating Budget
Page 52
DEPARTMENTS BY FUNCTIONAL CATEGORIES
STUDENT SERVICES (4010)
Orgn Name Orgn Code Orgn Name Orgn Code
SAC Academic Development 811111 SPC Miscellaneous Student 826003
SAC Admissions and Record 816202 SPC Recruitment 826033
SAC Assessment and Testin 816701 SPC Service Learning 826081
SAC Career Plan Job Plc 816404 SPC Student Activities 826092
SAC Class Schedules and C 816203 SPC Student Activity Fee- 826005
SAC Commencement 816204 SPC T3-Act1 Freshman Cent 827072
SAC Counseling Services 816401 SPC T3-Act3 Academic Supp 827074
SAC CounselingandStudent 816410 SPC Veterans Affairs 826069
SAC Disability Support Se 816507 SPC VP Student Success Of 826001
SAC Enrollment Management 816301 SWC Workforce Adv 828008
SAC Forensic Account 811272
SAC General Institutional 810002
SAC Health Center 816103 PAC Admissions and Record 832201
SAC Interpreting Services 812032 PAC Advanced Standing Tes 832205
SAC Job Placement Activit 816416 PAC Assessment 832204
SAC Mental Health 812202 PAC Clinic 832102
SAC Off-Campus Learning C 814004 PAC Counseling 832401
SAC Photo ID 816703 PAC Counseling and Suppor 832402
SAC Records and Reports 816205 PAC Exit Center 830208
SAC Registration 816206 PAC General Institutional 830002
SAC Retention and Transit 816405 PAC Gym Rental 830020
SAC Service Learning Proj 815002 PAC Information and Commu 830018
SAC Student Activities 816106 PAC Recruitment 830205
SAC Student Development 816409 PAC Scholarship Support S 832504
SAC Technology Center 817201 PAC Special Populations 832502
SAC Vendor Fees 816109 PAC Student Activities 832101
SAC Veterans Affairs 816402 PAC Student Activity Fee- 832106
SAC Veterans Affairs 816411 PAC Student Support Servi 832501
SAC VP Student Affairs Of 816001 PAC Upward Bound 832004
SAC Womens Center 816612 PAC Veterans Affairs 832206
SAC-Student Activity Fee- 816110 PAC VP Student Services O 832001
PAC Welcome Center 832506
SPC Admissions and Record 826062
SPC Assessment and Testin 826068 NVC ACCESS Office 845501
SPC Counseling and Studen 826031 NVC Admissions And Record 845103
SPC Curriculum Advisory P 826067 NVC Assessment And Testin 845102
SPC Educational Support S 826041 NVC Career Center 845203
SPC Enrollment Services 826061 NVC College Health Servic 845301
SPC General Institutional 820002 NVC Counseling 845302
SPC Health Center 826091 NVC General Institutional 840002
SPC Job Placement Career 826042 NVC Graduation 845101
SPC Kimmelman Foundation 826045 NVC Recreation Sports and 845401

FY 2010-2011 Operating Budget
Page 53
Orgn Name Orgn Code
NVC Recruitment 845002
NVC Stud Leadership and A 845403
NVC Student Activity Fee- 845404
NVC Student Advising 845201
NVC Student Affairs 845001
NVC Veterans Affairs 845202
NLC Admissions and Record 851005
NLC Advising 851020
NLC Assessment and Testin 851004
NLC Career ServicesandJob 851018
NLC Class Schedules and C 851021
NLC Counseling 851016
NLC Disability Services 851024
NLC General Institutional 850002
NLC Phi Theta Kappa Initi 852006
NLC Recrutment and Retent 851019
NLC Service Learning Init 852007
NLC Student Activities 851015
NLC Student Activity Fee- 851006
NLC Student Development 851017
NLC VP Student and Admin 851001
NLC VPSAS Hospitality Acc 851013
DIS Center for Student In 899031
DIS Community Based Asses 897002
DIS CWS Off Campus 899012
DIS General Institutional 893901
DIS Mobile Go Center-Recr 899022
DIS Off-Campus Military E 899002
DIS Student + Community P 899001
DIS Student Financial Ser 899011
DIS Student Leadership Pr 899003
STUDENT SERVICES (4010)
DEPARTMENTS BY FUNCTIONAL CATEGORIES

FY 2010-2011 Operating Budget
Page 54
DEPARTMENTS BY FUNCTIONAL CATEGORIES
INSTITUTIONAL SUPPORT (5010)
Orgn Name Orgn Code Orgn Name Orgn Code
SAC Audio Visual Services 815332 SPC Planning and Research 820201
SAC Banking Technology 812041 SPC Public Relations 820041
SAC CE Administration 813001 SPC Self Study 820007
SAC Commencement 816204 SPC Staff Council 820005
SAC Copy Center 893422
SAC Facilities Use Manage 814007
SAC General Institutional 810002 PAC Auditorium Rental 831117
SAC Go-Print 817202 PAC Business Services 830015
SAC Health Wellness Progr 810008 PAC Class Schedules and C 830103
SAC Hospitality Account 810005 PAC Commencement 830102
SAC Institutional Advance 810020 PAC Copy Center 893424
SAC Institutional Members 810004 PAC General Institutional 830002
SAC Office of the Preside 810003 PAC Hospitality Academic 831007
SAC Paper Recycling 810013 PAC Hospitality Account 830005
SAC Public Information 810501 PAC Hospitality Student A 832003
SAC Research 817002 PAC Institutional Advance 830209
SAC Resource College Deve 810103 PAC Office of the Preside 830003
SAC Staff Council Fund Ra 810012 PAC Paper Recycling Fund 830017
SAC Technology Center 817201 PAC Planning and Research 830203
SAC Vendor Fees 816109 PAC Public Information an 830101
SAC VP Academic Affairs O 811001 PAC Staff Council 830008
SAC VP College Services O 817001 PAC Staff Council Designa 830016
SAC Womens Center 816612
SPC Admissions and Record 826062
SPC Business Services 820008 NVC Alumni Connections 848014
SPC Class Schedules and C 826002 NVC Business Services 844001
SPC Commencement 826063 NVC Civic Engagement 848011
SPC Copy Center 893423 NVC College Initiatives 844002
SPC Dean Applied Science 822001 NVC Community Development 848013
SPC Dean Arts and Science 821101 NVC Evening and Weekend O 842401
SPC Dean Extended Service 823001 NVC Faculty and Staff Dev 840006
SPC Dean Interdisciplinar 825001 NVC Fundraising 848012
SPC Dean of Health Scienc 821801 NVC General Institutional 840002
SPC Faculty Senate 820012 NVC Hospitality Account 840004
SPC General Institutional 820002 NVC Information Technolog 844021
SPC Health Wellness Progr 820014 NVC Institutional Researc 844031
SPC Hospitality Account 820004 NVC Marketing and Adverti 840012
SPC Hospitality Operation 822062 NVC Office of the Preside 840003
SPC Information&Communica 823051 NVC Public Relations 840011
SPC Institutional Advance 820101 NVC Purchasing Services 844003
SPC Instructional Develop 823041 NVC Resource and College 844011
SPC LRC Fines 820018 NVC Staff Council 840008
SPC Office of the Preside 820003 NVC Student Affairs 845001

FY 2010-2011 Operating Budget
Page 55
DEPARTMENTS BY FUNCTIONAL CATEGORIES
INSTITUTIONAL SUPPORT (5010)
Orgn Name Orgn Code Orgn Name Orgn Code
NLC College Services 855001 DIS Director IT Services 895401
NLC Commencement 851023 DIS EAP Services 893914
NLC Disability Services 851024 DIS Economic + Workforce 897003
NLC Faculty Senate 850010 DIS EDW-Interlocal Admin 897046
NLC General Institutional 850002 DIS Ethics and Compliance 891051
NLC Green Team Recycling 850012 DIS EWD Revenue Holding A 897047
NLC Hospitality Account 850005 DIS Faculty Wkstation Rep 895403
NLC Institutional Advance 850006 DIS Finance and Fiscal Se 893502
NLC Institutional Support 855005 DIS General Institutional 893901
NLC Office of the Preside 850003 DIS Grants + Contracts De 897061
NLC Phi Theta Kappa Initi 852006 DIS Human Resources 893201
NLC Planning and Research 855004 DIS Institutional Advance 891021
NLC Professional Developm 850013 DIS Institutional Members 891002
NLC Public Relations 850009 DIS Institutional Researc 895301
NLC Safety Initiative 850015 DIS Institutional Reserve 893907
NLC Self Study 850007 DIS Insurance 893902
NLC Staff Council 850011 DIS Internal Audit 891031
NLC VPAA Hospitality Acco 852003 DIS Internal Upward Mobil 893204
NLC VPSAS Hospitality Acc 851013 DIS International Program 897101
NLC Wellness 850014 DIS Int'l Prog Student Abroad 897102
DIS Int'l Prog Student Abroad Ad 897103
DIS Loan Funds 893905
DIS Achieving the Dream 898002 DIS Mailroom 893441
DIS Acquisitions + Admin 893401 DIS Manufacturing Techn A 897022
DIS Advanced Technology C 897032 DIS MITC University Ctr 897006
DIS Alternative Teacher C 897008 DIS New Hire Expense 893202
DIS Banner Backfill Fundi 895102 DIS Office of Legal Servi 891011
DIS Banner Project Servic 895101 DIS Organization Dev & Ch 893209
DIS Benefits Other 893913 DIS Out of Dist Partner/C 897036
DIS Board Election 891012 DIS OutofDistPartner/Flor 897037
DIS Board Of Trustees 890001 DIS OutofDistPartnerKerrv 897038
DIS Bridge LAG Payroll Pa 893503 DIS Print Services 893421
DIS Budget 893022 DIS Professional Developm 893205
DIS Bursar 893511 DIS Professional Developm 897005
DIS Business Outreach 897009 DIS Redistricting Expense 891014
DIS Chancellors Office 891001 DIS Risk Management 893012
DIS Citizens Bond Oversig 893609 DIS Safety 893013
DIS Communications 895461 DIS Staff Council 893915
DIS Computer Replacement 895402 DIS Strategic Planning + 895201
DIS CTTC Contract 897041 DIS Surplus Property Sale 893432
DIS Department of Communi 897201 DIS VC Economic+Workforce 897001
DIS Department of Nursing 897051 DIS VC Student Success Of 899021
DIS Department of Public 893801 DIS Vice Chanc Acad Affai 898001

FY 2010-2011 Operating Budget
Page 56
Orgn Name Orgn Code
DIS Vice Chancellor Finan 893004
DIS Vice Chancellor PPIS 895001
DIS Workbased English Sol 897004
DWD Unified Staff Council 893917
INSTITUTIONAL SUPPORT (5010)
DEPARTMENTS BY FUNCTIONAL CATEGORIES
Orgn Name Orgn Code
SAC Auditorium 811271
SAC General Institutional 810002
SAC Gym Rental 811193
SPC CETC-BIS Contract Tra 822045
SPC General Institutional 820002
SPC Office of the Preside 820003
SPC Theater and Fine Arts 821121
DIS Building Maintenance 893601
DIS Building Maintenance LLDC 893641
DIS Construction Manageme 893614
DIS Construction Prkg Shu 893606
DIS Facilities 893610
DIS General Institutional 893901
DIS Grounds Maintenance 893602
DIS Housekeeping 893604
DIS Housekeeping LLDC 893643
DIS Insurance 893902
DIS International Program 897101
DIS Leased Parking 893607
DIS Minor Construction 893605
DIS Moving Expenses Const 893611
DIS Moving Services 893616
DIS Preventive Maintenanc 893619
DIS Project Management 893613
DIS Utilities 893603
DIS Utilities LLDC 893642
DIS Vehicle Replacement P 893612
DEPARTMENTS BY FUNCTIONAL CATEGORIES
OPERATIONS AND MAINTENANCE (6010)

FY 2010-2011 Operating Budget
Page 57
DEPARTMENTS BY FUNCTIONAL CATEGORIES
SCHOLARSHIPS & FELLOWSHIPS (7010)
Orgn Name Orgn Code Orgn Name Orgn Code
SAC Audio Visual Services 815332 NVC General Institutional 840002
SAC General Institutional 810002 NVC Information Technolog 844021
SAC Interpreter Training 812031
SAC Journalism 811182
SAC Office of the Preside 810003 NLC General Institutional 850002
SAC Technology Center 817201 NLC Office of the Preside 850003
SPC General Institutional 820002 DIS General Institutional 893901
PAC General Institutional 830002
PAC Jazz Band Designated 831115
PAC Office of the Preside 830003
AUXILIARY ENTERPRISES (8010)
Orgn Name Orgn Code Orgn Name Orgn Code
SAC Child Development Cen 812051 DIS Department of Public 893801
SAC General Institutional 810002 DIS Food Service 893618
DIS General Institutional 893901
DIS Natatorium Facilities 893608
SPC Child Development Cen 826022 DIS Preventive Maintenanc 893619
SPC General Institutional 820002 DIS Utilities 893603
SPC GoPrint 823055
SPC Intramurals 821142
PAC Auditorium Rental 831117
PAC AUX Ellison Family Ct 832902
PAC AUX Family Center 832901
PAC General Institutional 830002
PAC Natatorium Operation 830022
TRANSFERS (9425)
Orgn Name Orgn Code Orgn Name Orgn Code
DIS Transfers Mandatory + Non 893903
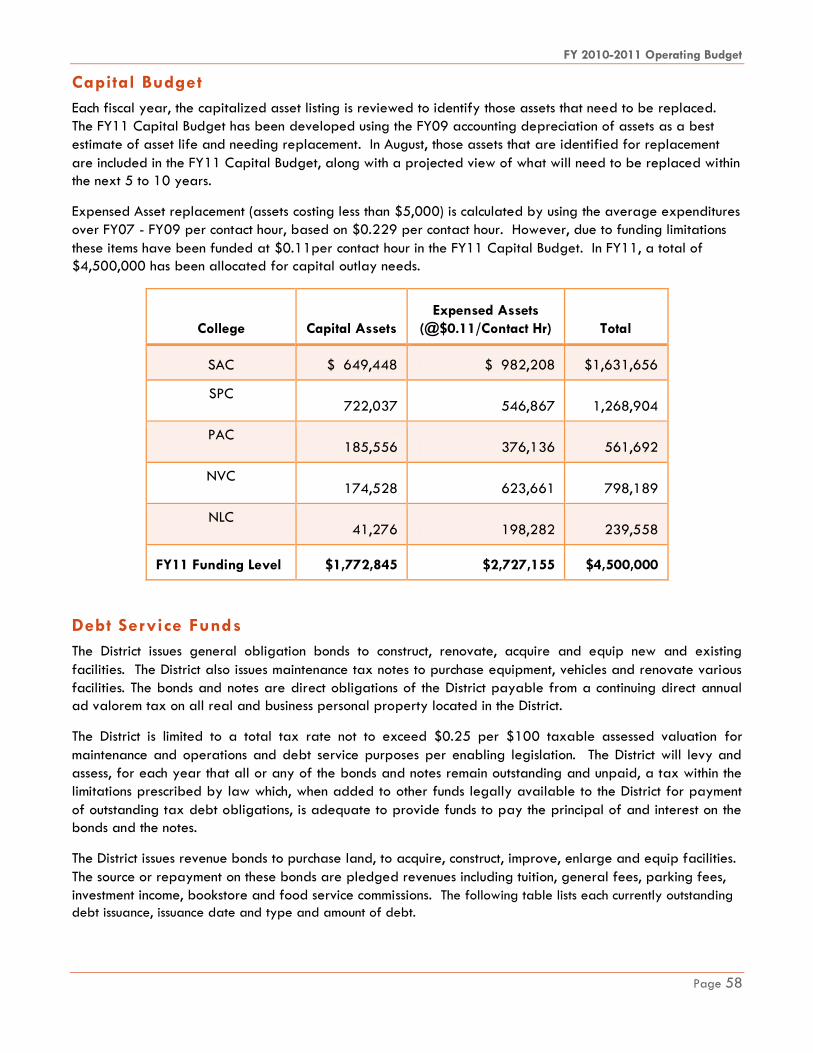
FY 2010-2011 Operating Budget
Page 58
Capital Budget
Each fiscal year, the capitalized asset listing is reviewed to identify those assets that need to be replaced.
The FY11 Capital Budget has been developed using the FY09 accounting depreciation of assets as a best
estimate of asset life and needing replacement. In August, those assets that are identified for replacement
are included in the FY11 Capital Budget, along with a projected view of what will need to be replaced within
the next 5 to 10 years.
Expensed Asset replacement (assets costing less than $5,000) is calculated by using the average expenditures
over FY07 - FY09 per contact hour, based on $0.229 per contact hour. However, due to funding limitations
these items have been funded at $0.11per contact hour in the FY11 Capital Budget. In FY11, a total of
$4,500,000 has been allocated for capital outlay needs.
College Capital Assets
Expensed Assets
(@$0.11/Contact Hr) Total
SAC $ 649,448 $ 982,208 $1,631,656
SPC 722,037 546,867 1,268,904
PAC 185,556 376,136 561,692
NVC 174,528 623,661 798,189
NLC 41,276 198,282 239,558
FY11 Funding Level $1,772,845 $2,727,155 $4,500,000
Debt Service Funds
The District issues general obligation bonds to construct, renovate, acquire and equip new and existing
facilities. The District also issues maintenance tax notes to purchase equipment, vehicles and renovate various
facilities. The bonds and notes are direct obligations of the District payable from a continuing direct annual
ad valorem tax on all real and business personal property located in the District.
The District is limited to a total tax rate not to exceed $0.25 per $100 taxable assessed valuation for
maintenance and operations and debt service purposes per enabling legislation. The District will levy and
assess, for each year that all or any of the bonds and notes remain outstanding and unpaid, a tax within the
limitations prescribed by law which, when added to other funds legally available to the District for payment
of outstanding tax debt obligations, is adequate to provide funds to pay the principal of and interest on the
bonds and the notes.
The District issues revenue bonds to purchase land, to acquire, construct, improve, enlarge and equip facilities.
The source or repayment on these bonds are pledged revenues including tuition, general fees, parking fees,
investment income, bookstore and food service commissions. The following table lists each currently outstanding
debt issuance, issuance date and type and amount of debt.
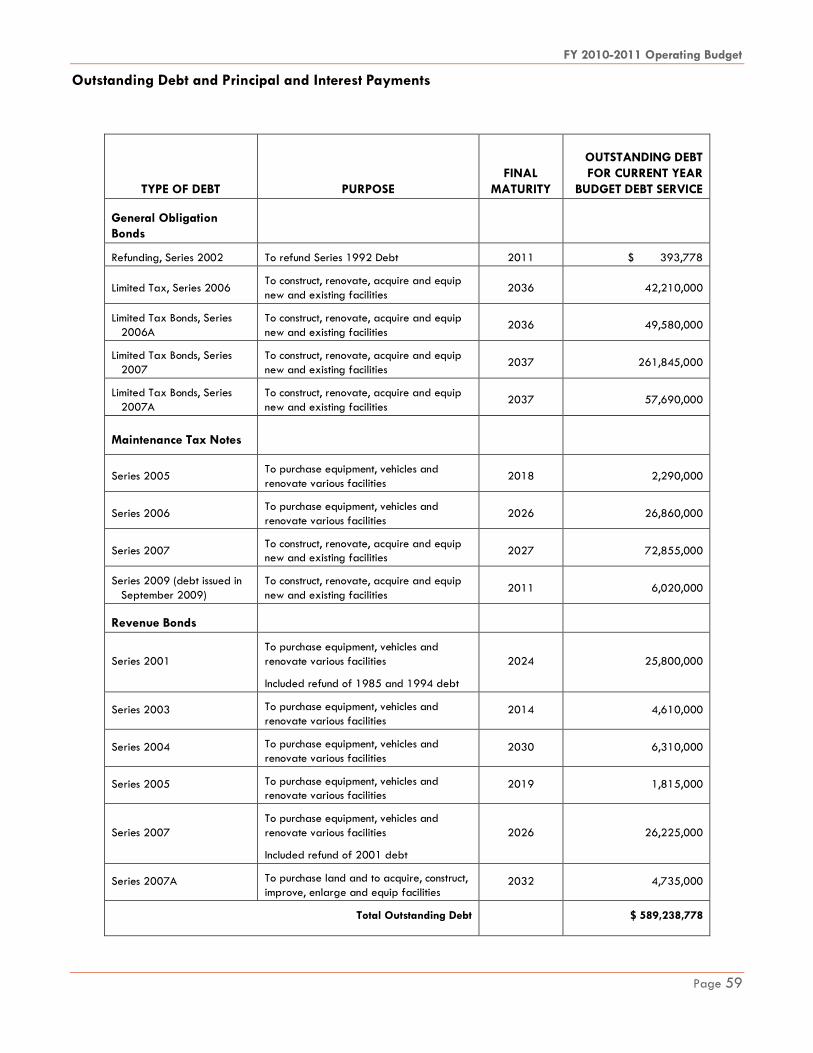
FY 2010-2011 Operating Budget
Page 59
Outstanding Debt and Principal and Interest Payments
TYPE OF DEBT
PURPOSE
FINAL
MATURITY
OUTSTANDING DEBT
FOR CURRENT YEAR
BUDGET DEBT SERVICE
General Obligation
Bonds
Refunding, Series 2002 To refund Series 1992 Debt 2011 $ 393,778
Limited Tax, Series 2006 To construct, renovate, acquire and equip
new and existing facilities 2036 42,210,000
Limited Tax Bonds, Series
2006A
To construct, renovate, acquire and equip
new and existing facilities 2036 49,580,000
Limited Tax Bonds, Series
2007
To construct, renovate, acquire and equip
new and existing facilities 2037 261,845,000
Limited Tax Bonds, Series
2007A
To construct, renovate, acquire and equip
new and existing facilities 2037 57,690,000
Maintenance Tax Notes
Series 2005 To purchase equipment, vehicles and
renovate various facilities 2018 2,290,000
Series 2006 To purchase equipment, vehicles and
renovate various facilities 2026 26,860,000
Series 2007 To construct, renovate, acquire and equip
new and existing facilities 2027 72,855,000
Series 2009 (debt issued in
September 2009)
To construct, renovate, acquire and equip
new and existing facilities 2011 6,020,000
Revenue Bonds
Series 2001
To purchase equipment, vehicles and
renovate various facilities
Included refund of 1985 and 1994 debt
2024 25,800,000
Series 2003 To purchase equipment, vehicles and
renovate various facilities 2014 4,610,000
Series 2004 To purchase equipment, vehicles and
renovate various facilities 2030 6,310,000
Series 2005 To purchase equipment, vehicles and
renovate various facilities 2019 1,815,000
Series 2007
To purchase equipment, vehicles and
renovate various facilities
Included refund of 2001 debt
2026 26,225,000
Series 2007A To purchase land and to acquire, construct,
improve, enlarge and equip facilities 2032 4,735,000
Total Outstanding Debt $ 589,238,778
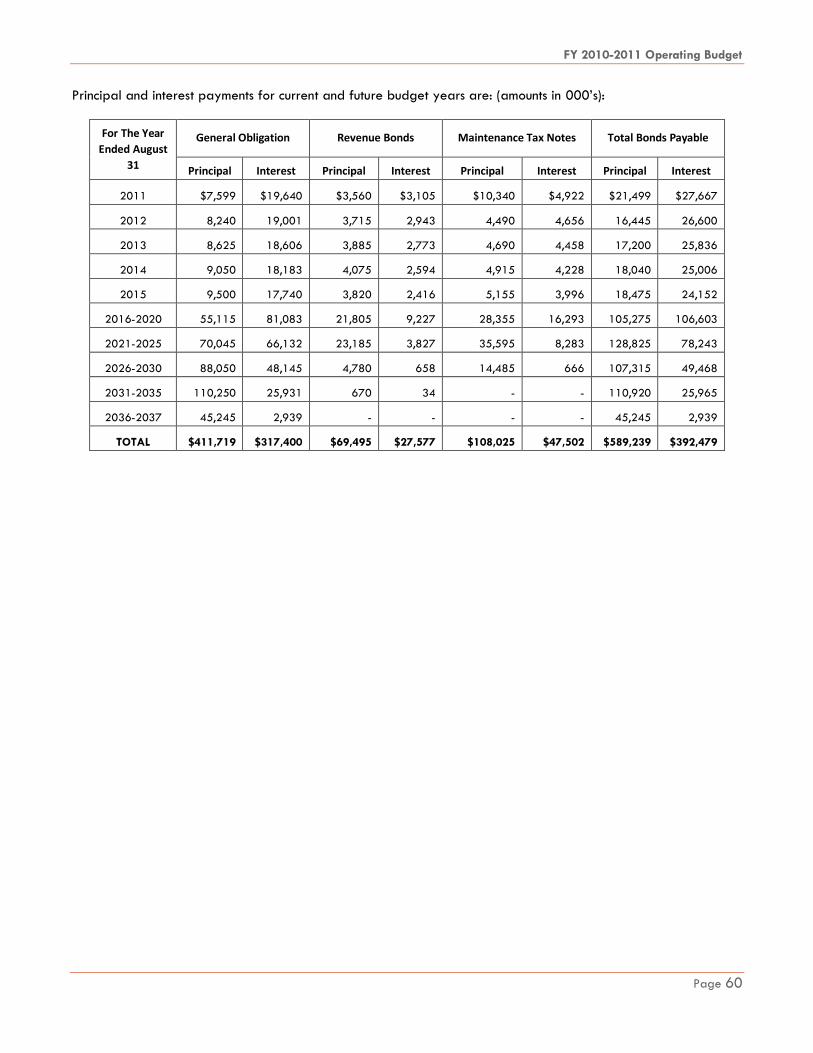
FY 2010-2011 Operating Budget
Page 60
Principal and interest payments for current and future budget years are: (amounts in 000‘s):
For The Year
Ended August
31
General Obligation Revenue Bonds Maintenance Tax Notes Total Bonds Payable
Principal Interest Principal Interest Principal Interest Principal Interest
2011 $7,599 $19,640 $3,560 $3,105 $10,340 $4,922 $21,499 $27,667
2012 8,240 19,001 3,715 2,943 4,490 4,656 16,445 26,600
2013 8,625 18,606 3,885 2,773 4,690 4,458 17,200 25,836
2014 9,050 18,183 4,075 2,594 4,915 4,228 18,040 25,006
2015 9,500 17,740 3,820 2,416 5,155 3,996 18,475 24,152
2016-2020 55,115 81,083 21,805 9,227 28,355 16,293 105,275 106,603
2021-2025 70,045 66,132 23,185 3,827 35,595 8,283 128,825 78,243
2026-2030 88,050 48,145 4,780 658 14,485 666 107,315 49,468
2031-2035 110,250 25,931 670 34 - - 110,920 25,965
2036-2037 45,245 2,939 - - - - 45,245 2,939
TOTAL $411,719 $317,400 $69,495 $27,577 $108,025 $47,502 $589,239 $392,479
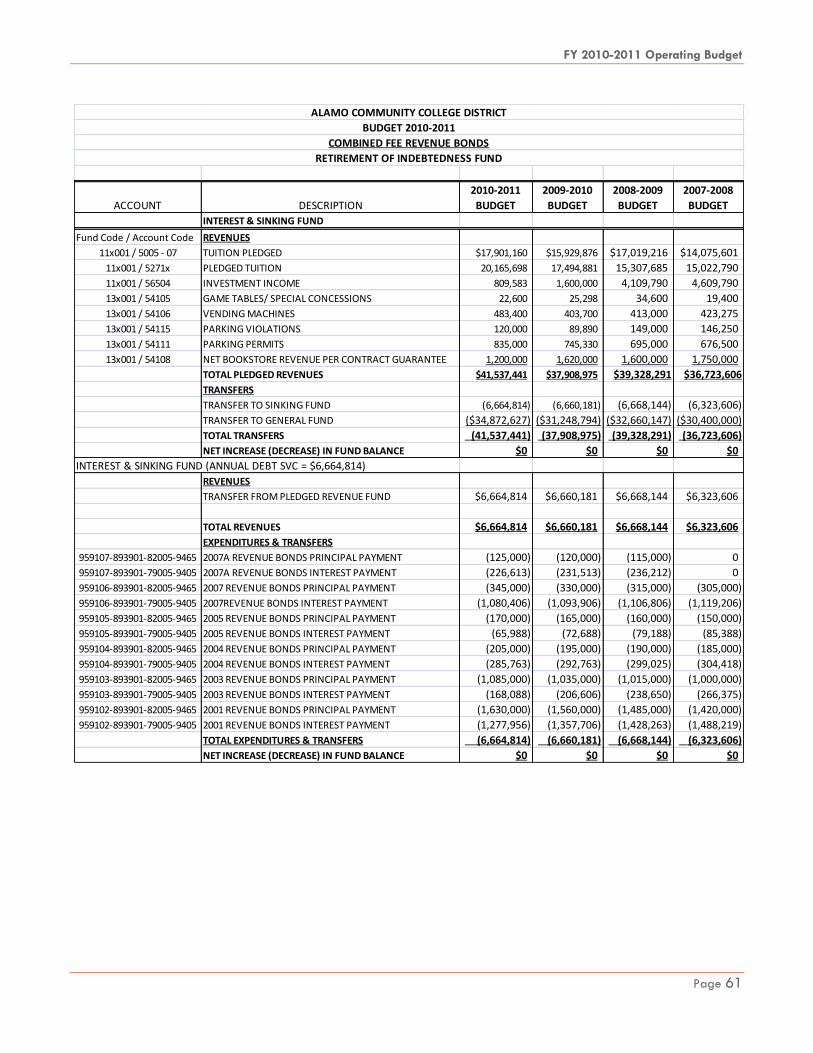
FY 2010-2011 Operating Budget
Page 61
ACCOUNT DESCRIPTION
2010-2011
BUDGET
2009-2010
BUDGET
2008-2009
BUDGET
2007-2008
BUDGET
INTEREST & SINKING FUND
Fund Code / Account Code REVENUES
11x001 / 5005 - 07 TUITION PLEDGED $17,901,160 $15,929,876 $17,019,216 $14,075,601
11x001 / 5271x PLEDGED TUITION 20,165,698 17,494,881 15,307,685 15,022,790
11x001 / 56504 INVESTMENT INCOME 809,583 1,600,000 4,109,790 4,609,790
13x001 / 54105 GAME TABLES/ SPECIAL CONCESSIONS 22,600 25,298 34,600 19,400
13x001 / 54106 VENDING MACHINES 483,400 403,700 413,000 423,275
13x001 / 54115 PARKING VIOLATIONS 120,000 89,890 149,000 146,250
13x001 / 54111 PARKING PERMITS 835,000 745,330 695,000 676,500
13x001 / 54108 NET BOOKSTORE REVENUE PER CONTRACT GUARANTEE 1,200,000 1,620,000 1,600,000 1,750,000
TOTAL PLEDGED REVENUES $41,537,441 $37,908,975 $39,328,291 $36,723,606
TRANSFERS
TRANSFER TO SINKING FUND (6,664,814) (6,660,181) (6,668,144) (6,323,606)
TRANSFER TO GENERAL FUND ($34,872,627) ($31,248,794) ($32,660,147) ($30,400,000)
TOTAL TRANSFERS (41,537,441) (37,908,975) (39,328,291) (36,723,606)
NET INCREASE (DECREASE) IN FUND BALANCE $0 $0 $0 $0
INTEREST & SINKING FUND (ANNUAL DEBT SVC = $6,664,814)
REVENUES
TRANSFER FROM PLEDGED REVENUE FUND $6,664,814 $6,660,181 $6,668,144 $6,323,606
TOTAL REVENUES $6,664,814 $6,660,181 $6,668,144 $6,323,606
EXPENDITURES & TRANSFERS
959107-893901-82005-9465 2007A REVENUE BONDS PRINCIPAL PAYMENT (125,000) (120,000) (115,000) 0
959107-893901-79005-9405 2007A REVENUE BONDS INTEREST PAYMENT (226,613) (231,513) (236,212) 0
959106-893901-82005-9465 2007 REVENUE BONDS PRINCIPAL PAYMENT (345,000) (330,000) (315,000) (305,000)
959106-893901-79005-9405 2007REVENUE BONDS INTEREST PAYMENT (1,080,406) (1,093,906) (1,106,806) (1,119,206)
959105-893901-82005-9465 2005 REVENUE BONDS PRINCIPAL PAYMENT (170,000) (165,000) (160,000) (150,000)
959105-893901-79005-9405 2005 REVENUE BONDS INTEREST PAYMENT (65,988) (72,688) (79,188) (85,388)
959104-893901-82005-9465 2004 REVENUE BONDS PRINCIPAL PAYMENT (205,000) (195,000) (190,000) (185,000)
959104-893901-79005-9405 2004 REVENUE BONDS INTEREST PAYMENT (285,763) (292,763) (299,025) (304,418)
959103-893901-82005-9465 2003 REVENUE BONDS PRINCIPAL PAYMENT (1,085,000) (1,035,000) (1,015,000) (1,000,000)
959103-893901-79005-9405 2003 REVENUE BONDS INTEREST PAYMENT (168,088) (206,606) (238,650) (266,375)
959102-893901-82005-9465 2001 REVENUE BONDS PRINCIPAL PAYMENT (1,630,000) (1,560,000) (1,485,000) (1,420,000)
959102-893901-79005-9405 2001 REVENUE BONDS INTEREST PAYMENT (1,277,956) (1,357,706) (1,428,263) (1,488,219)
TOTAL EXPENDITURES & TRANSFERS (6,664,814) (6,660,181) (6,668,144) (6,323,606)
NET INCREASE (DECREASE) IN FUND BALANCE $0 $0 $0 $0
ALAMO COMMUNITY COLLEGE DISTRICT
BUDGET 2010-2011
COMBINED FEE REVENUE BONDS
RETIREMENT OF INDEBTEDNESS FUND

FY 2010-2011 Operating Budget
Page 62
ACCOUNT DESCRIPTION
2010-2011
BUDGET
2009-2010
BUDGET
2008-2009
BUDGET
2007-2008
BUDGET
INTEREST & SINKING FUND
REVENUES
TAX REVENUE - TRANSFERRED IN $42,500,819 $42,492,087 $37,483,256 $37,762,372OPERATING REV TRANSFER IN FR PREVENTATIVE
MAINTENANCE BUDGET $0 $0 $3,421,326 $3,429,539
TOTAL REVENUES $42,500,819 $42,492,087 $40,904,583 $41,191,911
EXPENDITURES & TRANSFERS
PRINCIPAL PAYMENT - 2009 6,020,000 5,840,000
INTEREST PAYMENT - 2009 90,300 297,400
959202-893901-82005-9465 PRINCIPAL PAYMENT - 2007 2,860,000 2,745,000 2,640,000 2,430,000
959202-893901-79005-9405 INTEREST PAYMENT - 2007 3,522,200 3,634,300 3,742,000 4,236,892
959204-893901-82005-9465 PRINCIPAL PAYMENT - 2006 1,170,000 1,125,000 1,080,000 1,040,000
959204-893901-79005-9405 INTEREST PAYMENT - 2006 1,226,889 1,272,789 1,316,889 1,359,288
959203-893901-82005-9465 PRINCIPAL PAYMENT - 2005 290,000 280,000 270,000 260,000
959203-893901-79005-9405 INTEREST PAYMENT - 2005 82,381 92,713 148,775 157,387
959202-893901-82005-9465 PRINCIPAL PAYMENT - 2004 0 0 350,000 340,000
959202-893901-79005-9405 INTEREST PAYMENT - 2004 0 0 186,814 197,043
MAINTENANCE TAX NOTES - TOTAL 15,261,770 15,287,201 9,734,478 10,020,611
PRINCIPAL PAYMENT - 2007 A 2,280,000 955,000 4,355,000 490,000
959008-893901-79005-9405 INTEREST PAYMENT - 2007 A 2,838,363 2,878,950 3,064,037 3,341,934
959007-893901-82005-9465 PRINCIPAL PAYMENT - 2007 4,925,000 4,710,000 4,530,000 0
959007-893901-79005-9405 INTEREST PAYMENT - 2007 12,178,250 12,390,200 12,571,400 17,809,483
959005-893901-82005-9465 PRINCIPAL PAYMENT - 2006 A 0 0 0 0
959005-893901-79005-9405 INTEREST PAYMENT - 2006 A 2,361,706 2,361,706 2,361,706 2,361,706
959005-893901-82005-9465 PRINCIPAL PAYMENT - 2006 0 0 0 0
959005-893901-79005-9405 INTEREST PAYMENT - 2006 1,955,729 1,955,729 1,955,729 1,955,729
959004-893901-82005-9465 PRINCIPAL PAYMENT - 2002 A 393,778 1,175,000 1,255,000 3,965,000
959004-893901-79005-9405 INTEREST PAYMENT - 2002 A 306,222 23,500 72,100 186,413
PRINCIPAL PAYMENT - 2002 0 740,000 0 0
INTEREST PAYMENT - 2002 0 14,800 29,600 29,600
959002-893901-82005-9465 PRINCIPAL PAYMENT- 1998 0 0 955,000 970,000
959002-893901-79005-9405 INTEREST PAYMENT - 1998 0 0 20,533 61,435
GENERAL OBLIGATION BONDS - TOTAL 27,239,049 27,204,886 31,170,105 31,171,301
TOTAL EXPENDITURES & TRANSFERS $42,500,819 $42,492,087 $40,904,583 $41,191,911
NET INCREASE (DECREASE) IN FUND BALANCE $0 $0 $0 $0
NOTE: ANNUAL DEBT SERVICE PAYMENTS OF $42,500,819 WILL BE
COMPRISED OF :
(1) TAX REVENUES $42,500,819 $42,492,087 $37,483,256 $37,762,372
(2) OPERATING REVENUES 0 0 3,421,326 3,429,539
(3) INTEREST INCOME $0 $0 $0 $0
TOTAL $42,500,819 $42,492,087 $40,904,583 $41,191,911
Operating revenue transfer in from preventative maintenance budget not used in 2010-2011 budget
GENERAL OBLIGATION BONDS/MAINTENANCE TAX NOTES
RETIREMENT OF INDEBTEDNESS FUND
ALAMO COMMUNITY COLLEGE DISTRICT
BUDGET 2010-2011

FY 2010-2011 Operating Budget
Page 63
Three Year Staffing Summary
THREE YEAR STAFFING SUMMARY (Approved Budget)
Account
Code FY09 FTE FY09 Salary FY10 FTE FY10 Salary FY11 FTE FY11 Salary
San Antonio College
Adminis trators 6101/61011 12.00 1,176,014.04 12.00 1,243,811.76 10.63 1,190,988.07
Class i fied 6104/61021 212.00 6,369,262.25 208.00 6,142,926.62 182.63 5,673,210.31
Faculty 6301/61001 397.00 23,225,024.40 391.00 22,931,594.40 369.00 22,262,341.50
Faculty Profess ionals 6108/61001 3.00 153,162.00
Non-Instructional Faculty6106/61003 42.00 2,480,409.00 38.00 2,193,390.00 37.00 2,236,376.52
Profess ionals 6102/61012 94.00 4,674,781.80 88.50 4,439,276.52 81.00 4,117,186.99
Total 760.00 $38,078,653.49 737.50 $36,950,999.30 680.26 $35,480,103.39
St. Philip's College
Adminis trators 6101/61011 14.00 1,244,303.16 14.00 1,294,382.16 13.37 1,321,163.63
Class i fied 6104/61021 88.00 2,724,809.89 87.00 2,689,275.94 88.37 2,745,316.56
Faculty 6301/61001 203.00 10,445,364.00 205.00 10,454,365.20 208.40 11,221,130.59
Non-Instructional Faculty6106/61003 15.00 799,272.00 13.00 667,810.80 13.00 689,959.62
Profess ionals 6102/61012 60.75 3,308,277.72 61.75 3,300,748.02 60.00 3,405,649.03
Total 380.75 $18,522,026.77 380.75 $18,406,582.12 383.14 $19,383,219.43
Palo Alto College
Adminis trators 6101/61011 9.00 865,662.96 9.00 844,550.40 9.00 916,709.70
Class i fied 6104/61021 74.00 2,137,513.56 74.00 2,090,356.56 77.00 2,232,738.82
Faculty 6301/61001 125.00 6,809,928.00 123.00 6,685,329.00 128.20 7,240,334.09
Non-Instructional Faculty6106/61003 15.00 902,142.00 13.00 775,584.00 4.00 228,361.68
Profess ionals 6102/61012 53.50 2,644,009.44 56.50 2,744,409.84 62.10 2,925,086.42
Total 276.50 $13,359,255.96 275.50 $13,140,229.80 280.30 $13,543,230.71
Northwest Vista College
Adminis trators 6101/61011 7.00 747,997.44 9.00 926,359.44 9.00 925,585.92
Class i fied 6104/61021 60.00 1,700,099.04 61.00 1,736,689.44 57.00 1,694,597.41
Faculty 6301/61001 129.00 6,060,982.20 132.00 6,302,854.80 140.00 6,908,916.42
Non-Instructional Faculty6106/61003 4.00 185,004.00 4.00 185,004.00 4.00 188,704.08
Profess ionals 6102/61012 90.50 4,058,081.16 94.50 4,289,507.70 83.00 3,741,564.61
Total 290.50 $12,752,163.84 300.50 $13,440,415.38 293.00 $13,459,368.44
Northeast Lakeview College
Adminis trators 6101/61011 7.00 681,789.36 7.00 741,702.48 7.00 756,539.10
Class i fied 6104/61021 19.00 537,723.84 26.00 737,003.04 29.00 875,054.06
Faculty 6301/61001 42.00 2,120,820.00 57.00 2,743,032.00 68.00 3,375,304.92
Non-Instructional Faculty6106/61003 2.00 85,842.00 3.00 126,126.00
Profess ionals 6102/61012 28.00 1,480,250.64 36.00 1,787,041.20 36.00 1,795,346.60
Total 98.00 $4,906,425.84 129.00 $6,134,904.72 140.00 $6,802,244.68
District and District Support
Adminis trators 6101/61011 23.00 3,180,140.88 24.00 3,238,297.68 21.00 3,103,856.82
Class i fied 6104/61021 559.50 16,568,879.12 540.00 16,155,597.48 509.00 15,817,361.18
Profess ionals 6102/61012 239.00 14,706,440.40 242.00 14,718,222.54 248.71 15,824,300.75
Total 821.50 $34,455,460.40 806.00 $34,112,117.70 778.71 $34,745,518.75
Total
Adminis trators 6101/61011 72.00 7,895,907.84 75.00 8,289,103.92 70.00 8,214,843.24
Class i fied 6104/61021 1,012.50 30,038,287.70 996.00 29,551,849.08 943.00 29,038,278.34
Faculty 6301/61001 896.00 48,662,118.60 908.00 49,117,175.40 913.60 51,008,027.52
Faculty Profess ionals 6108/61001 3.00 153,162.00 0.00 0.00 0.00 0.00
Non-Instructional Faculty6106/61003 78.00 4,452,669.00 71.00 3,947,914.80 58.00 3,343,401.90
Profess ionals 6102/61012 565.75 30,871,841.16 579.25 31,279,205.82 570.81 31,809,134.40
Total 2,627.25 $122,073,986.30 2,629.25 $122,185,249.02 2,555.41 $123,413,685.40
NOTE: FTE is defined as Full-Time Employee in this table.

FY 2010-2011 Operating Budget
Page 64
Three Year Staffing Summary – District Only
Three Year District Staffing Summary (Approved Budget)
FY09 FTE FY09 Salary FY10 FTE FY10 Salary FY11 FTE FY11 Salary
Chancellor
61011 Administrator 3.00 580,255.44 3.00 591,349.68 3.00 603,177.00
61012 Professional 20.00 1,366,543.92 15.00 1,120,041.60 15.00 1,177,028.86
61021 Classified 5.00 198,242.16 9.00 377,122.80 8.00 351,611.34
Total 28.00 2,145,041.52$ 27.00 2,088,514.08$ 26.00 $2,131,817.20
VC for Academic Affairs
61011 Administrator 3.00 393,856.08 3.00 377,376.00 2.00 317,872.80
61012 Professional 1.00 52,605.12 1.00 57,864.96 1.00 59,022.30
61021 Classified 1.00 32,410.08 1.00 42,184.32 1.00 43,028.70
Total 5.00 478,871.28$ 5.00 477,425.28$ 4.00 $419,923.80
VC for Finance and Administration
61011 Administrator 8.00 1,006,815.84 10.00 1,184,191.44 7.00 949,513.27
61012 Professional 99.00 6,165,974.88 102.00 6,366,617.64 109.00 7,144,435.61
61021 Classified 487.00 14,104,646.12 458.00 13,399,335.60 422.00 12,831,986.73
Total 594.00 21,277,436.84$ 570.00 20,950,144.68$ 538.00 $20,925,935.61
VC for Planning Performance and Info Systems
61011 Administrator 3.00 387,168.96 2.00 279,480.00 3.00 398,234.52
61012 Professional 66.00 4,174,598.64 63.00 3,848,527.44 58.00 3,727,299.98
61021 Classified 28.00 1,107,657.12 29.00 1,134,043.44 26.00 1,011,569.20
Total 97.00 5,669,424.72$ 94.00 5,262,050.88$ 87.00 $5,137,103.70
VC for Economic and Workforce Development
61011 Administrator 3.00 371,795.04 3.00 380,795.04 2.00 295,371.60
61012 Professional 24.00 1,356,830.40 31.00 1,631,765.46 28.71 1,649,724.28
61021 Classified 8.50 271,183.56 14.50 387,657.60 15.00 466,798.95
Total 35.50 1,999,809.00$ 48.50 2,400,218.10$ 45.71 $2,411,894.83
VC for Student Success (A)
61011 Administrator 3.00 440,249.52 3.00 425,105.52 4.00 539,687.63
61012 Professional 29.00 1,589,887.44 30.00 1,693,405.44 37.00 2,066,789.72
61021 Classified 30.00 854,740.08 28.50 815,253.72 37.00 1,112,366.26
Total 62.00 2,884,877.04$ 61.50 2,933,764.68$ 78.00 $3,718,843.61
Total District and District Support
61011 Administrator 23.00 3,180,140.88 24.00 3,238,297.68 21.00 3,103,856.82
61012 Professional 239.00 14,706,440.40 242.00 14,718,222.54 248.71 15,824,300.75
61021 Classified 559.50 16,568,879.12 540.00 16,155,597.48 509.00 15,817,361.18
Total 821.50 34,455,460.40$ 806.00 34,112,117.70$ 778.71 $34,745,518.75
Decrease since FY09 (42.79)
Impact of CSI (19.00)
District FTE reduction, net of CSI (61.79)
(A) FY11 includes transfer of 19 employees from the Colleges to establish the new Center for Student Information.
NOTE: FTE is defined as Full-Time Employee in this table.

FY 2010-2011 Operating Budget
Page 65
Summary by Functional Category
FY 2011 Department FTE Summary by Functional Category
61001 61003 61011 61012 61021
FacultyNon Inst'l
FacultyAdministrator Professional Classified
INSTRUCTION
SAC Architecture 111001 811241 1020 6.00 6.00
SAC Astronomy 111001 811131 1030 3.00 3.00
SAC Biological Sciences 111001 811121 1030 14.00 3.00 17.00
SAC Chemistry 111001 811132 1030 7.00 2.00 9.00
SAC Earth Sciences 111001 811133 1030 4.00 4.00
SAC Mortuary Science 111001 812081 1030 5.00 1.00 6.00
SAC Physics 111001 811243 1030 3.00 2.00 5.00
SAC Banking Technology 111001 812041 1040 1.00 1.00
SAC Business Administrati 111001 812042 1040 4.00 4.00
SAC Business Occupations 111001 812011 1040 10.00 3.00 13.00
SAC Conf and Court Report 111001 812013 1040 3.00 3.00
SAC Legal Assistant 111001 812014 1040 1.00 1.00
SAC Management 111001 812043 1040 4.00 1.00 2.00 7.00
SAC Real Estate Program 111001 812045 1040 2.00 2.00
SAC Journalism 111001 811182 1060 4.00 2.00 6.00
SAC Radio and Television 111001 811187 1060 3.00 1.00 2.00 6.00
SAC Computer Aided Design 111001 812071 1070 3.00 2.00 5.00
SAC Computer Information 111001 812061 1070 14.00 6.00 20.00
SAC Child Development Ins 111001 812052 1090 2.00 2.00 4.00
SAC Child Development Ope 111001 812053 1090 6.00 1.00 7.00
SAC Engineering 111001 811244 1100 1.00 1.00 2.00
SAC Electronics Program 111001 812072 1110 2.00 1.00 3.00
SAC Engineering Technology 111001 812075 1110 1.00 1.00
SAC Safety Engineering Te 111001 812076 1110 1.00 1.00
SAC Developmental English 111001 811151 1120 4.37 1.26 5.63
SAC English 111001 811152 1120 34.63 3.74 38.37
SAC English As A Second L 111001 811161 1120 3.00 3.00
SAC Fire Technology 111001 812104 1120 1.00 1.00
SAC Philosophy 111001 811221 1120 8.00 1.00 9.00
SAC Reading and Education 111001 811291 1120 9.00 2.00 11.00
SAC Theatre and Communication 111001 811274 1120 9.00 3.00 12.00
SAC Foreign Languages 111001 811162 1130 6.00 2.00 8.00
TotalFUND ORGN PROGDEPARTMENT

FY 2010-2011 Operating Budget
Page 66
FY 2011 Department FTE Summary by Functional Category
61001 61003 61011 61012 61021
FacultyNon Inst'l
FacultyAdministrator Professional Classified
SAC Interpreter Training 111001 812031 1130 8.00 3.00 11.00
SAC Dental Assistants 111001 812021 1140 2.00 1.00 2.00 5.00
SAC Medical Assisting 111001 812022 1140 2.00 2.00
SAC Nursing Ed Associate 111001 812091 1140 45.00 2.00 5.00 52.00
SAC Nursing Special Progr 111001 812093 1140 0.63 0.63 1.26
SAC Service Learning Proj 111001 815002 1140 1.00 1.00 2.00
SAC Dental Lab Technology 111001 812023 1160 1.00 1.00
SAC Mental Health 111001 812202 1160 2.00 1.00 3.00
SAC Mathematics and Computer 111001 811203 1190 43.00 1.00 1.00 45.00
SAC Physical Education 111001 811192 1230 10.00 2.00 12.00
SAC Fire Technology 111001 812104 1240 3.00 1.00 4.00
SAC Law Enforcement 111001 812205 1240 4.00 1.00 5.00
SAC Public Administration 111001 812204 1240 1.00 1.00
SAC Economics 111001 811232 1250 6.00 6.00
SAC History 111001 811171 1250 13.00 1.00 14.00
SAC Political Science 111001 811231 1250 10.00 1.00 11.00
SAC Psychology 111001 811251 1250 12.00 1.00 13.00
SAC Sociology 111001 811261 1250 5.00 5.00
SAC Art 111001 811281 1260 7.00 1.00 8.00
SAC Electronic Graphics 111001 811185 1260 5.00 2.00 7.00
SAC Music 111001 811211 1260 8.00 1.00 9.00
SAC Photography 111001 811183 1260 1.00 1.00 2.00
SAC Retention and Transit 111001 816405 1270 1.00 3.00 4.00
SAC Student Assistance Lr 111001 815008 1270 1.00 2.00 1.00 4.00
SAC Technology Center 111001 817201 1270 11.00 8.00 19.00
PUBLIC SERVICE
SAC Planetarium 111001 813014 2010 1.00 1.00 2.00
DEPARTMENT FUND ORGN PROG Total

FY 2010-2011 Operating Budget
Page 67
FY 2011 Department FTE Summary by Functional Category
61001 61003 61011 61012 61021
FacultyNon Inst'l
FacultyAdministrator Professional Classified
ACADEMIC SUPPORT
SAC Audio Visual Services 111001 815332 3010 2.00 3.00 5.00
SAC CE Administration 111001 813001 3010 1.00 4.00 5.00
SAC CE Allied Health 111001 813002 3010 1.00 1.00 2.00
SAC CE Basic Skills 111001 813010 3010 1.00 1.00
SAC CE Law Enforcement 111001 813004 3010 1.00 1.00 2.00
SAC CE Medical Office and 111001 813009 3010 1.00 1.00 2.00
SAC CE Occupational 111001 813003 3010 1.00 1.00
SAC CE Professional 111001 813007 3010 1.00 1.00 2.00
SAC CE Teacher Certificat 111001 813008 3010 1.00 1.00
SAC CE Vocational ESL 111001 813005 3010 1.00 1.00
SAC Dean Even_Weeknd_Dist 111001 814001 3010 1.00 6.00 1.00 8.00
SAC Dean Learning Resources 111001 815001 3010 1.00 1.00 1.00 3.00
SAC Dean of Arts and Scie 111001 811101 3010 1.00 1.00 2.00 4.00
SAC Dean Profess and Tech 111001 812001 3010 1.00 2.00 1.00 4.00
SAC Educational Television 111001 815333 3010 2.00 3.00 5.00
SAC Instructional Technology 111001 815101 3010 4.00 1.00 5.00
SAC Library 111001 815301 3010 13.00 1.00 13.00 27.00
SAC Off-Campus Learning C 111001 814004 3010 1.00 1.00 2.00
SAC VP Academic Affairs O 111001 811001 3010 1.00 1.00 2.00
SAC VP Student Affairs Of 111001 816001 3010 1.00 1.00 1.00 3.00
DEPARTMENT FUND ORGN PROG Total
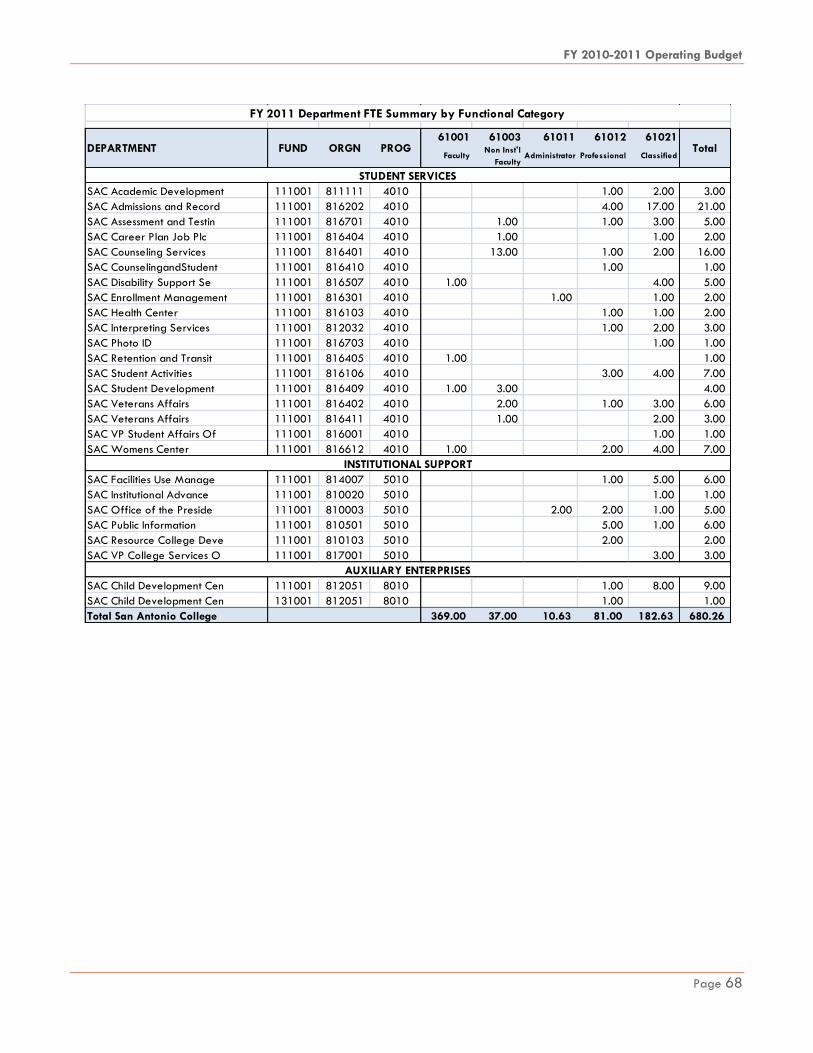
FY 2010-2011 Operating Budget
Page 68
FY 2011 Department FTE Summary by Functional Category
61001 61003 61011 61012 61021
FacultyNon Inst'l
FacultyAdministrator Professional Classified
STUDENT SERVICES
SAC Academic Development 111001 811111 4010 1.00 2.00 3.00
SAC Admissions and Record 111001 816202 4010 4.00 17.00 21.00
SAC Assessment and Testin 111001 816701 4010 1.00 1.00 3.00 5.00
SAC Career Plan Job Plc 111001 816404 4010 1.00 1.00 2.00
SAC Counseling Services 111001 816401 4010 13.00 1.00 2.00 16.00
SAC CounselingandStudent 111001 816410 4010 1.00 1.00
SAC Disability Support Se 111001 816507 4010 1.00 4.00 5.00
SAC Enrollment Management 111001 816301 4010 1.00 1.00 2.00
SAC Health Center 111001 816103 4010 1.00 1.00 2.00
SAC Interpreting Services 111001 812032 4010 1.00 2.00 3.00
SAC Photo ID 111001 816703 4010 1.00 1.00
SAC Retention and Transit 111001 816405 4010 1.00 1.00
SAC Student Activities 111001 816106 4010 3.00 4.00 7.00
SAC Student Development 111001 816409 4010 1.00 3.00 4.00
SAC Veterans Affairs 111001 816402 4010 2.00 1.00 3.00 6.00
SAC Veterans Affairs 111001 816411 4010 1.00 2.00 3.00
SAC VP Student Affairs Of 111001 816001 4010 1.00 1.00
SAC Womens Center 111001 816612 4010 1.00 2.00 4.00 7.00
INSTITUTIONAL SUPPORT
SAC Facilities Use Manage 111001 814007 5010 1.00 5.00 6.00
SAC Institutional Advance 111001 810020 5010 1.00 1.00
SAC Office of the Preside 111001 810003 5010 2.00 2.00 1.00 5.00
SAC Public Information 111001 810501 5010 5.00 1.00 6.00
SAC Resource College Deve 111001 810103 5010 2.00 2.00
SAC VP College Services O 111001 817001 5010 3.00 3.00
AUXILIARY ENTERPRISES
SAC Child Development Cen 111001 812051 8010 1.00 8.00 9.00
SAC Child Development Cen 131001 812051 8010 1.00 1.00
Total San Antonio College 369.00 37.00 10.63 81.00 182.63 680.26
DEPARTMENT FUND ORGN PROG Total

FY 2010-2011 Operating Budget
Page 69
FY 2011 Department FTE Summary by Functional Category
61001 61003 61011 61012 61021
FacultyNon Inst'l
FacultyAdministrator Professional Classified
INSTRUCTION
SWC Machine Technology 112001 828562 1020 1.00 1.00 2.00
SWC Welding 112001 828563 1020 1.00 1.00
SPC Biological Sciences 112001 821152 1030 9.00 3.00 12.00
SPC Chemistry 112001 821153 1030 4.20 4.20
SPC Physics 112001 821151 1030 1.00 1.00
SPC Accounting Informatn 112001 822042 1040 1.00 1.00
SPC Administrative Comput 112001 822041 1040 3.00 1.00 4.00
SPC Business Administrati 112001 821133 1040 2.00 2.00
SPC Business Management 112001 822043 1040 2.00 2.00
SPC Computer Science 112001 821134 1070 2.00 2.00
SPC Information Technolog 112001 822044 1070 3.00 3.00
SWC Electrician 112001 828502 1080 2.00 2.00
SWC Plumbing 112001 828505 1080 1.00 1.00
SPC Child Development Ope 112001 826021 1090 3.00 4.00 7.00
SPC Early Childhood Studi 112001 822004 1090 2.00 2.00
SPC Tourism Hospitality C 112001 822061 1090 8.00 3.00 11.00
SPC Electronic Systems Te 112001 822031 1110 6.00 1.00 7.00
SWC Allied Construction 112001 828501 1110 4.00 1.00 5.00
SWC Home Building 112001 828503 1110 2.00 2.00
SWC Industrial Drafting 112001 828522 1110 2.00 2.00
SPC Developmental English 112001 821111 1120 3.00 3.00
SPC English 112001 821112 1120 12.00 1.00 13.00
SPC Reading and Education 112001 821171 1120 6.00 1.00 1.00 8.00
SPC Foreign Languages 112001 821172 1130 1.00 1.00 2.00
SPC Nursing Associate Deg 112001 822052 1140 10.00 1.00 1.00 12.00
SPC Nursing Special Progr 112001 822055 1140 0.37 0.37 0.74
SPC Allied Health 112001 822011 1160 28.00 2.00 30.00
SPC Nursing New Braunfels 112001 822053 1180 2.00 1.00 3.00
SPC Nursing Vocational 112001 822051 1180 20.00 1.00 21.00
SPC Developmental Math 112001 821132 1190 7.00 1.00 8.00
SPC Mathematics 112001 821131 1190 9.00 9.00
SPC Automotive Technology 112001 822021 1200 11.00 1.00 12.00
SWC Auto Body 112001 828561 1200 2.00 2.00
SWC Aviation 112001 828541 1210 9.00 1.00 10.00
SWC Diesel Technology 112001 828543 1210 2.00 2.00
SPC Kinesiology 112001 821141 1230 3.00 1.00 4.00
SPC Psychology 112001 821161 1250 6.00 1.00 7.00
SPC Social Sciences 112001 821162 1250 15.00 15.00
SPC Music 112001 821122 1260 2.00 2.00
SPC Theater and Fine Arts 112001 821121 1260 4.00 1.00 2.00 7.00
SPC SEC CE Contract Train 112001 828403 1270 1.00 1.00
DEPARTMENT FUND ORGN PROG Total

FY 2010-2011 Operating Budget
Page 70
FY 2011 Department FTE Summary by Functional Category
61001 61003 61011 61012 61021
FacultyNon Inst'l
FacultyAdministrator Professional Classified
ACADEMIC SUPPORT
SPC ACE Administration 112001 823005 3010 1.00 2.00 3.00
SPC Dean Applied Science 112001 822001 3010 1.00 1.00 2.00
SPC Dean Arts and Science 112001 821101 3010 1.00 1.00 3.00 5.00
SPC Dean Extended Service 112001 823001 3010 1.00 3.00 4.00
SPC Dean of Health Scienc 112001 821801 3010 1.00 1.00 1.00 3.00
SPC Evening Operations 112001 823003 3010 1.00 1.00
SPC Information&Communica 112001 823051 3010 4.00 1.00 5.00
SPC Instructional Develop 112001 823041 3010 2.00 2.00 4.00
SPC Leadership and Learni 112001 820301 3010 1.00 1.00
SPC Library Services 112001 824001 3010 9.00 1.00 10.00 20.00
SPC Media Services 112001 824004 3010 2.00 2.00 4.00
SPC VP Academic Affairs O 112001 821001 3010 1.00 2.00 1.00 4.00
SWC CE Administration 112001 828401 3010 2.00 1.00 3.00
SWC Dean Of Administratio 112001 828003 3010 1.00 4.00 4.00 9.00
STUDENT SERVICES
SPC Admissions and Record 112001 826062 4010 1.00 3.00 9.00 13.00
SPC Counseling and Studen 112001 826031 4010 4.00 2.00 1.00 7.00
SPC Curriculum Advisory P 112001 826067 4010 2.00 2.00 4.00
SPC Educational Support S 112001 826041 4010 1.00 2.00 1.00 4.00
SPC Enrollment Services 112001 826061 4010 1.00 1.00
SPC Health Center 112001 826091 4010 1.00 3.00 4.00
SPC Miscellaneous Student 112001 826003 4010 1.00 1.00
SPC Recruitment 112001 826033 4010 3.00 3.00
SPC Service Learning 112001 826081 4010 1.00 1.00
SPC Student Activities 112001 826092 4010 1.00 1.00 1.00 3.00
SPC Veterans Affairs 112001 826069 4010 1.00 2.00 3.00
SPC VP Student Success Of 112001 826001 4010 1.00 1.00 2.00
INSTITUTIONAL SUPPORT
SPC Faculty Senate 112001 820012 5010 0.20 0.20
SPC Institutional Advance 112001 820101 5010 3.00 2.00 5.00
SPC Office of the Preside 112001 820003 5010 2.00 2.00 4.00 8.00
SPC Planning and Research 112001 820201 5010 2.00 2.00
SPC Public Relations 112001 820041 5010 4.00 1.00 5.00
SPC Self Study 112001 820007 5010 1.00 1.00 2.00
AUXILIARY ENTERPRISES
SPC Child Development Cen 132001 826022 8010 2.00 2.00
Total St. Philip's College 208.40 13.00 13.37 60.00 88.37 383.14
DEPARTMENT FUND ORGN PROG Total

FY 2010-2011 Operating Budget
Page 71
FY 2011 Department FTE Summary by Functional Category61001 61003 61011 61012 61021
FacultyNon Inst'l
FacultyAdministrator Professional Classified
INSTRUCTION
PAC Agriculture 113001 831211 1010 1.00 1.00
PAC Landscape and Turfgra 113001 831212 1010 1.00 1.00 2.00
PAC Biological Sciences 113001 831231 1030 10.00 4.00 14.00
PAC Chemistry 113001 831232 1030 2.40 2.40
PAC Geology 113001 831236 1030 1.00 1.00
PAC Business Administrati 113001 831221 1040 1.00 1.00
PAC Business Occupations 113001 831222 1040 1.00 1.00
PAC Mid-Management 113001 831224 1040 2.00 2.00
PAC Aviation Technology 113001 831286 1050 1.00 1.00
PAC Mass Communications 113001 831175 1060 2.00 2.00
PAC CE-Information Tech 113001 831413 1070 1.00 1.00
PAC Computer Information 113001 831252 1070 3.00 1.00 1.00 5.00
PAC Computer Science 113001 831251 1070 4.00 4.00
PAC Teacher Assistant and 113001 831136 1090 2.00 2.00
PAC Engineering 113001 831234 1100 1.00 1.00
PAC Electro-Mechanical Te 113001 831281 1110 2.00 2.00
PAC Toyota 113001 831282 1110 1.00 1.00
PAC Developmental English 113001 831171 1120 2.00 0.50 2.50
PAC English 113001 831172 1120 11.00 1.00 12.00
PAC English As A Second L 113001 831173 1120 2.00 0.50 2.50
PAC Humanities 113001 831131 1120 2.00 2.00
PAC LIS 113001 831303 1120 1.00 4.00 5.00
PAC Philosophy 113001 831133 1120 2.00 2.00
PAC Reading and Education 113001 831176 1120 3.00 0.50 3.50
PAC Speech 113001 831113 1120 3.00 2.00 5.00
PAC Foreign Languages 113001 831174 1130 2.00 1.00 3.00
PAC Allied Health 113001 831409 1160 0.80 0.80
PAC Veterinary Technology 113001 831296 1160 3.00 2.00 5.00
PAC Developmental Math 113001 831262 1190 4.80 0.50 5.30
PAC Mathematics 113001 831261 1190 12.00 1.00 13.00
PAC Kinesiology 113001 831266 1230 6.00 1.00 7.00
PAC Criminal Justice 113001 831271 1240 3.00 1.00 4.00
PAC Economics 113001 831151 1250 3.00 3.00
PAC Geography 113001 831152 1250 1.00 1.00
PAC Government 113001 831153 1250 5.00 5.00
PAC History 113001 831154 1250 6.00 1.00 7.00
PAC Psychology 113001 831134 1250 3.00 1.00 4.00
PAC Sociology 113001 831135 1250 1.00 1.00
PAC Art 113001 831111 1260 5.00 5.00
PAC Dance 113001 831118 1260 1.00 1.00
PAC Drama 113001 831112 1260 1.00 1.00
PAC Music 113001 831114 1260 3.00 3.00
PAC Gateway To College IS 113001 830207 1270 4.00 2.00 6.00
PAC GED 113001 831405 1270 0.20 0.20
DEPARTMENT FUND ORGN PROG Total
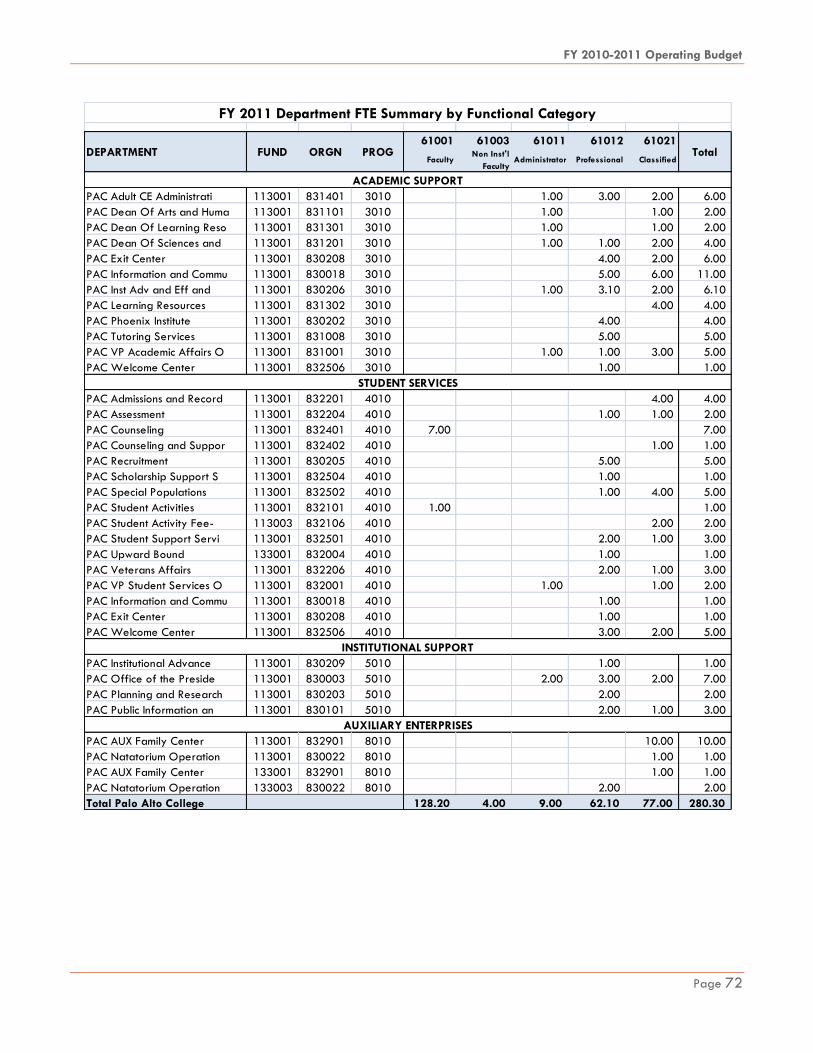
FY 2010-2011 Operating Budget
Page 72
FY 2011 Department FTE Summary by Functional Category
61001 61003 61011 61012 61021
FacultyNon Inst'l
FacultyAdministrator Professional Classified
ACADEMIC SUPPORT
PAC Adult CE Administrati 113001 831401 3010 1.00 3.00 2.00 6.00
PAC Dean Of Arts and Huma 113001 831101 3010 1.00 1.00 2.00
PAC Dean Of Learning Reso 113001 831301 3010 1.00 1.00 2.00
PAC Dean Of Sciences and 113001 831201 3010 1.00 1.00 2.00 4.00
PAC Exit Center 113001 830208 3010 4.00 2.00 6.00
PAC Information and Commu 113001 830018 3010 5.00 6.00 11.00
PAC Inst Adv and Eff and 113001 830206 3010 1.00 3.10 2.00 6.10
PAC Learning Resources 113001 831302 3010 4.00 4.00
PAC Phoenix Institute 113001 830202 3010 4.00 4.00
PAC Tutoring Services 113001 831008 3010 5.00 5.00
PAC VP Academic Affairs O 113001 831001 3010 1.00 1.00 3.00 5.00
PAC Welcome Center 113001 832506 3010 1.00 1.00
STUDENT SERVICES
PAC Admissions and Record 113001 832201 4010 4.00 4.00
PAC Assessment 113001 832204 4010 1.00 1.00 2.00
PAC Counseling 113001 832401 4010 7.00 7.00
PAC Counseling and Suppor 113001 832402 4010 1.00 1.00
PAC Recruitment 113001 830205 4010 5.00 5.00
PAC Scholarship Support S 113001 832504 4010 1.00 1.00
PAC Special Populations 113001 832502 4010 1.00 4.00 5.00
PAC Student Activities 113001 832101 4010 1.00 1.00
PAC Student Activity Fee- 113003 832106 4010 2.00 2.00
PAC Student Support Servi 113001 832501 4010 2.00 1.00 3.00
PAC Upward Bound 133001 832004 4010 1.00 1.00
PAC Veterans Affairs 113001 832206 4010 2.00 1.00 3.00
PAC VP Student Services O 113001 832001 4010 1.00 1.00 2.00
PAC Information and Commu 113001 830018 4010 1.00 1.00
PAC Exit Center 113001 830208 4010 1.00 1.00
PAC Welcome Center 113001 832506 4010 3.00 2.00 5.00
INSTITUTIONAL SUPPORT
PAC Institutional Advance 113001 830209 5010 1.00 1.00
PAC Office of the Preside 113001 830003 5010 2.00 3.00 2.00 7.00
PAC Planning and Research 113001 830203 5010 2.00 2.00
PAC Public Information an 113001 830101 5010 2.00 1.00 3.00
AUXILIARY ENTERPRISES
PAC AUX Family Center 113001 832901 8010 10.00 10.00
PAC Natatorium Operation 113001 830022 8010 1.00 1.00
PAC AUX Family Center 133001 832901 8010 1.00 1.00
PAC Natatorium Operation 133003 830022 8010 2.00 2.00
Total Palo Alto College 128.20 4.00 9.00 62.10 77.00 280.30
DEPARTMENT FUND ORGN PROG Total

FY 2010-2011 Operating Budget
Page 73
FY 2011 Department FTE Summary by Functional Category
61001 61003 61011 61012 61021
FacultyNon Inst'l
FacultyAdministrator Professional Classified
INSTRUCTION
NVC Biological Sciences 114001 842042 1030 12.00 2.00 1.00 15.00
NVC Chemistry 114001 842043 1030 5.00 5.00
NVC Clinical Research Coo 114001 842054 1030 1.00 1.00
NVC Geology 114001 842044 1030 2.00 2.00
NVC Nanotechnology 114001 842058 1030 1.00 1.00
NVC Physics 114001 842045 1030 2.00 2.00
NVC Accounting 114001 842023 1040 3.00 3.00
NVC Business Administrati 114001 842022 1040 1.00 1.00
NVC Mass Communications 114001 842083 1060 1.00 1.00
NVC Computer Information 114001 842062 1070 4.00 4.00
NVC Multimedia 114001 842059 1070 3.00 1.00 4.00
NVC Education 114001 842085 1090 1.00 1.00
NVC Engineering 114001 842046 1100 1.00 1.00
NVC Developmental English 114001 842093 1120 1.60 1.00 2.60
NVC Developmental Reading 114001 842095 1120 3.00 0.50 3.50
NVC English 114001 842092 1120 15.40 0.50 15.90
NVC English and Reading L 114001 842094 1120 1.00 1.00
NVC English As A Second L 114001 842512 1120 1.00 1.00
NVC Humanities 114001 842033 1120 2.50 2.50
NVC Philosophy 114001 842032 1120 2.00 2.00
NVC Speech 114001 842084 1120 3.00 3.00
NVC Student Development 114001 845303 1120 1.00 1.00 2.00
NVC Foreign Languages 114001 842034 1130 3.50 3.50
NVC Community Health 114001 842056 1160 1.00 1.00
NVC Pharmacy Technology 114001 842057 1160 1.00 1.00
NVC Developmental Math 114001 842074 1190 6.20 1.00 1.00 8.20
NVC Mathematics 114001 842073 1190 11.80 11.80
NVC Kinesiology 114001 842016 1230 5.00 5.00
NVC Criminal Justice 114001 842086 1240 1.00 1.00
NVC Anthropology 114001 842089 1250 1.00 1.00
NVC Economics 114001 842024 1250 5.00 5.00
NVC Geography 114001 842082 1250 2.60 2.60
NVC Government 114001 842025 1250 6.00 6.00
NVC History 114001 842035 1250 8.40 8.40
NVC Psychology 114001 842087 1250 4.00 4.00
NVC Sociology 114001 842088 1250 1.00 1.00
NVC Drama 114001 842013 1260 1.00 1.00 2.00
NVC Fine Arts 114001 842012 1260 5.00 5.00
NVC Music 114001 842015 1260 3.00 3.00
NVC Dual Credit Program 114001 842302 1999 1.00 1.00 2.00
DEPARTMENT FUND ORGN PROG Total
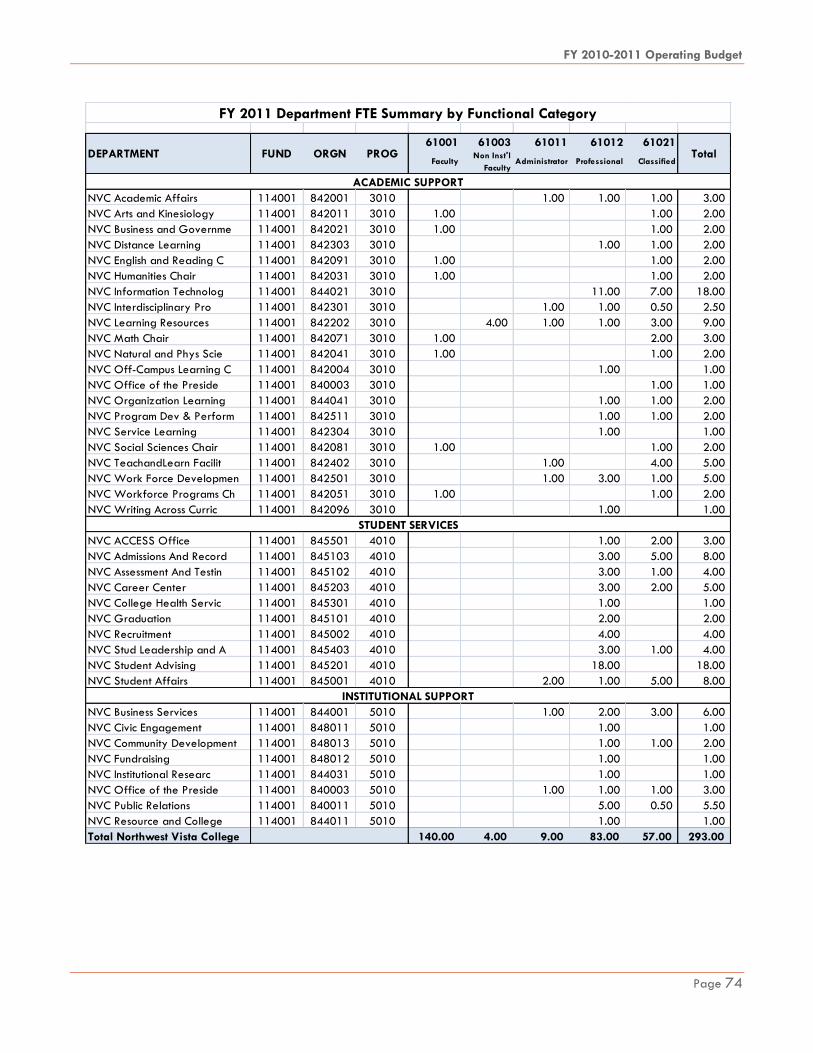
FY 2010-2011 Operating Budget
Page 74
FY 2011 Department FTE Summary by Functional Category
61001 61003 61011 61012 61021
FacultyNon Inst'l
FacultyAdministrator Professional Classified
ACADEMIC SUPPORT
NVC Academic Affairs 114001 842001 3010 1.00 1.00 1.00 3.00
NVC Arts and Kinesiology 114001 842011 3010 1.00 1.00 2.00
NVC Business and Governme 114001 842021 3010 1.00 1.00 2.00
NVC Distance Learning 114001 842303 3010 1.00 1.00 2.00
NVC English and Reading C 114001 842091 3010 1.00 1.00 2.00
NVC Humanities Chair 114001 842031 3010 1.00 1.00 2.00
NVC Information Technolog 114001 844021 3010 11.00 7.00 18.00
NVC Interdisciplinary Pro 114001 842301 3010 1.00 1.00 0.50 2.50
NVC Learning Resources 114001 842202 3010 4.00 1.00 1.00 3.00 9.00
NVC Math Chair 114001 842071 3010 1.00 2.00 3.00
NVC Natural and Phys Scie 114001 842041 3010 1.00 1.00 2.00
NVC Off-Campus Learning C 114001 842004 3010 1.00 1.00
NVC Office of the Preside 114001 840003 3010 1.00 1.00
NVC Organization Learning 114001 844041 3010 1.00 1.00 2.00
NVC Program Dev & Perform 114001 842511 3010 1.00 1.00 2.00
NVC Service Learning 114001 842304 3010 1.00 1.00
NVC Social Sciences Chair 114001 842081 3010 1.00 1.00 2.00
NVC TeachandLearn Facilit 114001 842402 3010 1.00 4.00 5.00
NVC Work Force Developmen 114001 842501 3010 1.00 3.00 1.00 5.00
NVC Workforce Programs Ch 114001 842051 3010 1.00 1.00 2.00
NVC Writing Across Curric 114001 842096 3010 1.00 1.00
STUDENT SERVICES
NVC ACCESS Office 114001 845501 4010 1.00 2.00 3.00
NVC Admissions And Record 114001 845103 4010 3.00 5.00 8.00
NVC Assessment And Testin 114001 845102 4010 3.00 1.00 4.00
NVC Career Center 114001 845203 4010 3.00 2.00 5.00
NVC College Health Servic 114001 845301 4010 1.00 1.00
NVC Graduation 114001 845101 4010 2.00 2.00
NVC Recruitment 114001 845002 4010 4.00 4.00
NVC Stud Leadership and A 114001 845403 4010 3.00 1.00 4.00
NVC Student Advising 114001 845201 4010 18.00 18.00
NVC Student Affairs 114001 845001 4010 2.00 1.00 5.00 8.00
INSTITUTIONAL SUPPORT
NVC Business Services 114001 844001 5010 1.00 2.00 3.00 6.00
NVC Civic Engagement 114001 848011 5010 1.00 1.00
NVC Community Development 114001 848013 5010 1.00 1.00 2.00
NVC Fundraising 114001 848012 5010 1.00 1.00
NVC Institutional Researc 114001 844031 5010 1.00 1.00
NVC Office of the Preside 114001 840003 5010 1.00 1.00 1.00 3.00
NVC Public Relations 114001 840011 5010 5.00 0.50 5.50
NVC Resource and College 114001 844011 5010 1.00 1.00
Total Northwest Vista College 140.00 4.00 9.00 83.00 57.00 293.00
DEPARTMENT FUND ORGN PROG Total

FY 2010-2011 Operating Budget
Page 75
FY 2011 Department FTE Summary by Functional Category
61001 61003 61011 61012 61021
FacultyNon Inst'l
FacultyAdministrator Professional Classified
INSTRUCTION
NLC Biological Sciences 115001 852162 1030 4.73 1.00 5.73
NLC Chemistry 115001 852163 1030 3.13 1.00 4.13
NLC Geology 115001 852165 1030 1.14 1.14
NLC Accounting-Business-M 115001 852121 1040 2.08 2.08
NLC Computer Information 115001 852154 1070 1.20 1.20
NLC Education 115001 852182 1090 1.00 1.00
NLC English 115001 852102 1120 9.80 9.80
NLC Humanities 115001 852112 1120 0.58 0.58
NLC Philosophy 115001 852114 1120 1.58 1.58
NLC Reading 115001 852103 1120 2.20 2.20
NLC Speech 115001 852116 1120 3.68 3.68
NLC Foreign Languages 115001 852111 1130 1.08 1.08
NLC Mathematics and COSC 115001 852151 1190 8.80 8.80
NLC Kinesiology 115001 852141 1230 3.73 1.00 4.73
NLC Economics 115001 852171 1250 1.10 1.10
NLC Education 115001 852182 1250 0.10 0.10
NLC Geography 115001 852173 1250 1.10 1.10
NLC History 115001 852174 1250 3.70 3.70
NLC Political Science 115001 852176 1250 3.10 3.10
NLC Psychology 115001 852183 1250 1.70 1.70
NLC Social Sciences 115001 852179 1250 0.10 0.10
NLC Sociology 115001 852184 1250 1.10 1.10
NLC Art Department 115001 852131 1260 4.13 4.13
NLC Instruction Pool Acad 115001 852012 1260 5.00 5.00
NLC Music 115001 852134 1260 2.14 2.14
NLC Theatre and Communica 115001 852135 1260 2.00 1.00 3.00
ACADEMIC SUPPORT
NLC Academic Support 115001 852015 3010 2.00 1.00 3.00
NLC Community Education 115001 853006 3010 2.00 2.00
NLC Dean of CE and Workfo 115001 853001 3010 1.00 1.00 2.00
NLC Distance Learning 115001 852004 3010 1.00 1.00
NLC Information Technolog 115001 855002 3010 6.00 3.00 9.00
NLC Learning Resource Ctr 115001 854001 3010 3.00 1.00 3.00 7.00
NLC Tutoring Services 115001 852011 3010 1.00 1.00 2.00
NLC Vice Pres Acad Affair 115001 852001 3010 1.00 1.00 2.00
STUDENT SERVICES
NLC Admissions and Record 115001 851005 4010 1.00 4.00 5.00
NLC Advising 115001 851020 4010 7.00 7.00
NLC Assessment and Testin 115001 851004 4010 2.00 2.00
NLC Career ServicesandJob 115001 851018 4010 1.00 1.00
NLC Counseling 115001 851016 4010 2.00 2.00
NLC Recrutment and Retent 115001 851019 4010 1.00 1.00
NLC Student Activities 115001 851015 4010 2.00 1.00 3.00
NLC Student Development 115001 851017 4010 1.00 1.00
NLC VP Student and Admin 115001 851001 4010 1.00 1.00 2.00
INSTITUTIONAL SUPPORT
NLC College Services 115001 855001 5010 1.00 3.00 4.00
NLC Institutional Advance 115001 850006 5010 1.00 1.00 0.50 2.50
NLC Office of the Preside 115001 850003 5010 1.00 1.00 1.00 3.00
NLC Planning and Research 115001 855004 5010 1.00 1.00
NLC Public Relations 115001 850009 5010 3.00 0.50 3.50
Total Northeast Lakeview College 68.00 0.00 7.00 36.00 29.00 140.00
DEPARTMENT FUND ORGN PROG Total

FY 2010-2011 Operating Budget
Page 76
FY 2011 Department FTE Summary by Functional Catergory
61011 61012 61021Administrator Professional Classified
DIS Chancellors Office 119001 891001 5010 1.00 4.00 2.00 7.00
DIS Office of Legal Service 119001 891011 5010 1.00 1.00 4.00 6.00
DIS Institutional Advance 119001 891021 5010 4.00 2.00 6.00
DIS Internal Audit 119001 891031 5010 1.00 5.00 6.00
DIS Ethics and Compliance 119001 891051 5010 1.00 1.00
Total Chancellor 3.00 15.00 8.00 26.00
DIS Vice Chanc Acad Affai 119001 898001 5010 2.00 1.00 1.00 4.00
Total VC for Academic Affairs 2.00 1.00 1.00 4.00
DIS Vice Chancellor Finan 119001 893004 5010 1.00 1.00 1.00 3.00
DIS Risk Management 119001 893012 5010 1.00 1.00 2.00
DIS Safety 119001 893013 5010 2.00 2.00
DIS Human Resources 119001 893201 5010 2.00 25.00 14.00 41.00
DIS Acquisitions + Admin 119001 893401 5010 1.00 8.00 11.00 20.00
DIS Print Services 119102 893421 5010 1.00 3.00 4.00
SAC Copy Center 119102 893422 5010 3.00 3.00
SPC Copy Center 119102 893423 5010 2.00 2.00
PAC Copy Center 119102 893424 5010 2.00 2.00
SWC Copy Center 119102 893425 5010 1.00 1.00
DIS Mailroom 119102 893441 5010 12.00 12.00
DIS Finance and Fiscal Svcs 119001 893502 5010 2.00 31.00 24.00 57.00
DIS Bursar 111001 893511 5010 3.00 3.00 6.00
DIS Bursar 112001 893511 5010 2.00 2.00 4.00
DIS Bursar 113001 893511 5010 2.00 2.00 4.00
DIS Bursar 114001 893511 5010 2.00 2.00 4.00
DIS Bursar 115001 893511 5010 1.00 1.00 2.00
DIS Building Maintenance 111001 893601 6010 1.00 26.00 27.00
DIS Building Maintenance 112001 893601 6010 1.00 20.00 21.00
DIS Building Maintenance 113001 893601 6010 1.00 16.00 17.00
DIS Building Maintenance 114001 893601 6010 1.00 12.00 13.00
DIS Building Maintenance 115001 893601 6010 1.00 8.00 9.00
DIS Building Maintenance 119001 893601 6010 3.00 3.00
DIS Grounds Maintenance 111001 893602 6010 9.00 9.00
DIS Grounds Maintenance 112001 893602 6010 6.00 6.00
DIS Grounds Maintenance 113001 893602 6010 7.00 7.00
DIS Grounds Maintenance 114001 893602 6010 4.00 4.00
DIS Grounds Maintenance 115001 893602 6010 1.00 1.00
DIS Grounds Maintenance 119001 893602 6010 1.00 1.00
DIS Housekeeping 111001 893604 6010 1.00 48.00 49.00
DIS Housekeeping 112001 893604 6010 1.00 38.00 39.00
DIS Housekeeping 113001 893604 6010 1.00 24.00 25.00
DIS Housekeeping 114001 893604 6010 1.00 1.00
DIS Housekeeping 115001 893604 6010 1.00 4.00 5.00
DIS Housekeeping 119001 893604 6010 4.00 4.00
DIS Natatorium Facilities 133003 893608 8010 3.00 3.00
DIS Facilities 119001 893610 6010 1.00 1.00 1.00 3.00
DIS Project Management 119001 893613 6010 13.00 14.00 27.00
DIS Moving Services 119001 893616 6010 2.00 2.00
DIS Department of Public 111001 893801 5010 3.00 32.00 35.00
DIS Department of Public 112001 893801 5010 1.00 20.00 21.00
DIS Department of Public 113001 893801 5010 8.40 8.40
DIS Department of Public 114001 893801 5010 10.00 10.00
DIS Department of Public 115001 893801 5010 13.00 13.00
DEPARTMENT FUND ORGN PROG Total

FY 2010-2011 Operating Budget
Page 77
FY 2011 Department FTE Summary by Functional Catergory
61011 61012 61021Administrator Professional Classified
DIS Department of Public 119201 893801 5010 3.00 3.00
DIS Department of Public 133003 893801 5010 0.12 0.12
DIS Department of Public 133003 893801 8010 0.48 0.48
DIS Grants + Contracts De 119001 897061 5010 2.00 2.00
Total VC for Finance and Administration 7.00 109.00 422.00 538.00
DIS Vice Chancellor PPIS 119001 895001 5010 1.00 1.00 2.00
DIS Banner Project Servic 119001 895101 5010 7.00 7.00
DIS Strategic Planning + 119001 895201 5010 1.00 1.00
DIS Institutional Researc 119001 895301 5010 1.00 7.00 2.00 10.00
DIS Director IT Services 119102 895401 5010 1.00 42.00 24.00 67.00
Total VC for Planning Perf. and Info Systems 3.00 58.00 26.00 87.00
DIS VC Economic+Workforce 119001 897001 5010 1.00 2.00 1.00 4.00
DIS Community Based Asses 119001 897002 4010 7.00 3.00 10.00
DIS Economic + Workforce 119001 897003 5010 6.00 3.00 9.00
DIS Advanced Technology C 119001 897032 5010 1.71 1.71
DIS Out of Dist Partner/C 119001 897036 5010 3.00 2.00 5.00
DIS OutofDistPartner/Flor 119001 897037 5010 1.00 1.00 2.00
DIS OutofDistPartnerKerrv 119001 897038 5010 1.00 1.00 2.00
DIS International Program 119001 897101 5010 3.00 2.00 5.00
DIS Department of Communi 119001 897201 5010 1.00 4.00 2.00 7.00
Total Economic and Workforce Development 2.00 28.71 15.00 45.71
DIS Student + Community P 119001 899001 4010 1.00 1.00
DIS Off-Campus Military E 119001 899002 4010 1.00 1.00
DIS Student Leadership Pr 119001 899003 4010 2.00 2.00
DIS Student Financial Ser 111001 899011 4010 8.00 6.00 14.00
DIS Student Financial Ser 112001 899011 4010 4.00 2.00 6.00
DIS Student Financial Ser 113001 899011 4010 3.00 3.00 6.00
DIS Student Financial Ser 114001 899011 4010 4.00 2.00 6.00
DIS Student Financial Ser 115001 899011 4010 2.00 2.00
DIS Student Financial Ser 119001 899011 4010 1.00 5.00 13.00 19.00
DIS VC Student Success Of 119001 899021 5010 1.00 1.00 1.00 3.00
DIS Mobile Go Center-Recr 119001 899022 4010 1.00 1.00
DIS Center for Student Info 119001 899031 4010 1.00 6.00 10.00 17.00
Total VC for Student Success 4.00 37.00 37.00 78.00
Total District and District Svcs 21.00 248.71 509.00 778.71
DEPARTMENT FUND ORGN PROG Total

FY 2010-2011 Operating Budget
Page 78
Contact Hours
ALAMO COMMUNITY COLLEGE DISTRICT
CONTACT HOURS
Fiscal Year Academic Voc Tech Total Inc / Dec
97 - 98 11,000,882 3,969,498 14,970,380 1.4%
98 - 99 10,690,658 4,095,296 14,785,954 -1.2%
99 - 00 11,074,104 4,153,995 15,228,099 3.0%
00 - 01 11,605,418 4,128,811 15,734,229 3.3%
01 - 02 12,898,748 4,406,206 17,304,954 10.0%
02 - 03 14,228,315 4,633,550 18,861,865 9.0%
03 - 04 14,986,560 4,788,453 19,775,013 4.8%
04 - 05 15,035,056 4,941,776 19,976,832 1.0%
05 - 06 14,771,648 4,760,436 19,532,084 -2.2%
06 - 07 15,057,632 4,567,944 19,625,576 0.5%
07 - 08 15,499,262 4,479,415 19,978,677 1.8%
08 - 09 16,578,880 4,690,834 21,269,714 6.5%
09 - 10 18,845,612 5,067,949 23,913,561 12.4%
Source: CBM004 / CBM00C Cettified Data -- District IRES Office
0
5,000,000
10,000,000
15,000,000
20,000,000
25,000,000
30,000,000
97 -
98
98 -
99
99 -
00
00 -
01
01 -
02
02 -
03
03 -
04
04 -
05
05 -
06
06 -
07
07 -
08
08 -
09
09 -
10
Fiscal Year
ALAMO COMMUNITY COLLEGE DISTRICT
Contact Hours
Voc Tech
Academic

FY 2010-2011 Operating Budget
Page 79
Unduplicated Headcount Enrollment
ALAMO COMMUNITY COLLEGE DISTRICT
UNDUPLICATED HEADCOUNT
Fiscal Year
Total
Inc / Dec
92 - 93
53,151 93 - 94
53,077
-0.1%
94 - 95
53,777
1.3%
95 - 96
55,206
2.7%
96 - 97
58,327
5.7%
97 - 98
58,909
1.0%
98 - 99
57,403
-2.6%
99 - 00
59,107
3.0%
00 - 01
60,435
2.2%
01 - 02
64,195
6.2%
02 - 03
66,215
3.1%
03 - 04
69,050
4.3%
04 - 05
69,909
1.2%
05 - 06
68,473
-2.1%
06 - 07
69,257
1.1%
07 - 08
71,074
2.6%
08 - 09
75,971
6.9%
09 - 10
83,673
10.1%
Source: CBM004 / CBM00C Certified Data -- District IRES Office
0
20,000
40,000
60,000
80,000
100,000
92 -
93
93 -
94
94 -
95
95 -
96
96 -
97
97 -
98
98 -
99
99 -
00
00 -
01
01 -
02
02 -
03
03 -
04
04 -
05
05 -
06
06 -
07
07 -
08
08 -
09
09 -
10
Fiscal Year
ALAMO COMMUNITY COLLEGE DISTRICT
Unduplicated Headcount Enrollment

FY 2010-2011 Operating Budget
Page 80
SUPPLEMENTAL INFORMATION
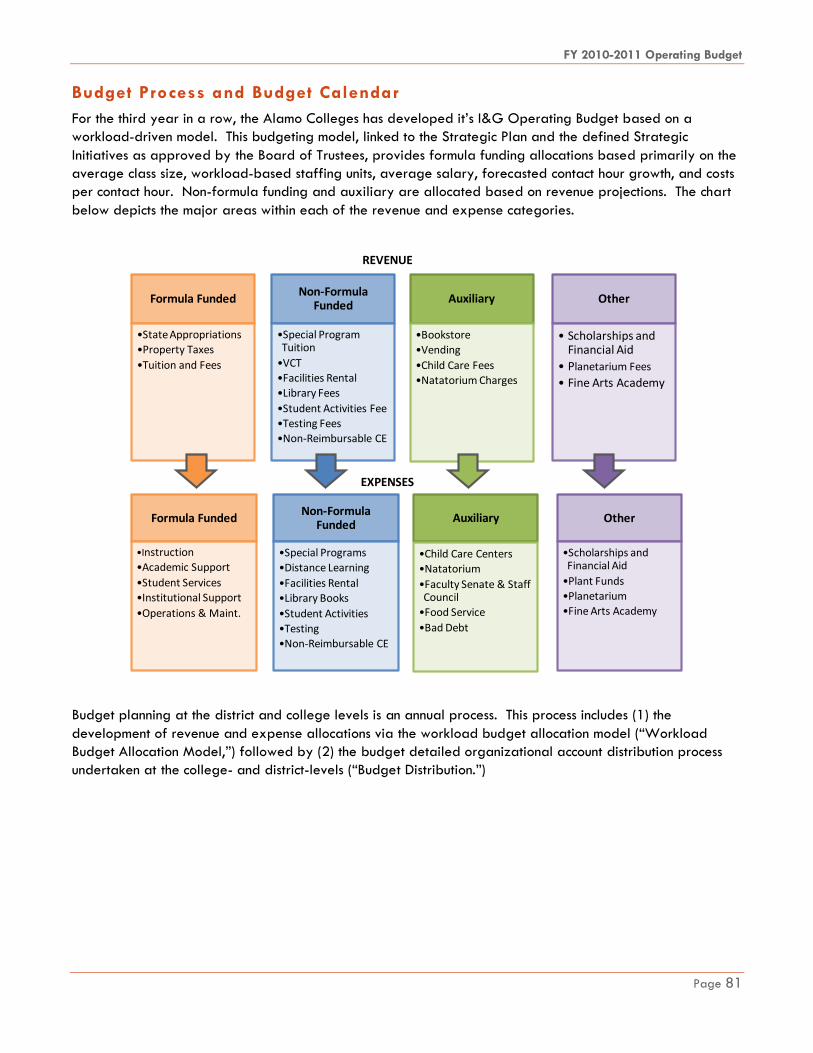
FY 2010-2011 Operating Budget
Page 81
Budget Process and Budget Calendar
For the third year in a row, the Alamo Colleges has developed it‘s I&G Operating Budget based on a
workload-driven model. This budgeting model, linked to the Strategic Plan and the defined Strategic
Initiatives as approved by the Board of Trustees, provides formula funding allocations based primarily on the
average class size, workload-based staffing units, average salary, forecasted contact hour growth, and costs
per contact hour. Non-formula funding and auxiliary are allocated based on revenue projections. The chart
below depicts the major areas within each of the revenue and expense categories.
Budget planning at the district and college levels is an annual process. This process includes (1) the
development of revenue and expense allocations via the workload budget allocation model (―Workload
Budget Allocation Model,‖) followed by (2) the budget detailed organizational account distribution process
undertaken at the college- and district-levels (―Budget Distribution.‖)
Formula Funded
•State Appropriations
•Property Taxes
•Tuition and Fees
Non-Formula Funded
•Special Program Tuition
•VCT
•Facilities Rental
•Library Fees
•Student Activities Fee
•Testing Fees
•Non-Reimbursable CE
Auxiliary
•Bookstore
•Vending
•Child Care Fees
•Natatorium Charges
Other
• Scholarships and Financial Aid
• Planetarium Fees
• Fine Arts Academy
Formula Funded
•Instruction
•Academic Support
•Student Services
•Institutional Support
•Operations & Maint.
Non-Formula Funded
•Special Programs
•Distance Learning
•Facilities Rental
•Library Books
•Student Activities
•Testing
•Non-Reimbursable CE
Auxiliary
•Child Care Centers
•Natatorium
•Faculty Senate & Staff Council
•Food Service
•Bad Debt
Other
•Scholarships and Financial Aid
•Plant Funds
•Planetarium
•Fine Arts Academy
REVENUE
EXPENSES

FY 2010-2011 Operating Budget
Page 82
Significant steps in the budget annual process leading up to the presentations of the Preliminary Budget and
Final Budget to the Board of Trustees are summarized, as follows.
Timeline Workload Budget Allocation – Board Approval Budget Distributions – Colleges/Dept
November
– January
The Alamo Colleges‘ District Budget Office coordinates projections
for enrollment, revenue, and other key data elements, in
collaboration with the campus budget officers.
Board Strategic Planning Retreat: Nov.
Colleges provide Contact Hour, Enrollment,
and non-formula revenue projections.
January -
March
In early spring, an initial operating expense budget allocation
amount for each of the campuses and the district units is generated
via the workload allocation model. Strategic Initiatives developed to
balance any shortfall in revenues.
March
The Vice Chancellor for Finance and Administration presents a draft
of the Preliminary Budget in late spring to the Audit, Budget and
Finance Committee of the Board of Trustees for their review and
feedback.
April - May The initial operating expense budget allocations generated by the
model are distributed to each of the colleges and the district-level
units after the Preliminary Budget is presented to the Budget and
Finance Committee of the Board of Trustees.
Board Budget Retreat: May
Preliminary work on the development of
detailed unit budgets, area budgets, and
college budgets begins, based on (1) a
review of previous fiscal year approved
budgets, (2) unit/department needs, (3)
educational needs and (4) college
objectives. All of these budgets are
based on actions plans, which are linked to
the approved strategic plan and strategic
initiatives.
April –
June
The Alamo Colleges‘ District Budget Office collaborates with the
colleges and district-level units to ensure that the preliminary budget
distributions balance to allocations assigned via the budget model.
These budget distributions are submitted to the Alamo Colleges‘
District Budget Office for compilation, summation, and preparation
of the District Preliminary Budget.
June Board Approval: Preliminary Operating Budget
July-
August
Updates to Final Workload Budget Allocation Model completed
upon receipt of Tax rolls.
Board Approval: All Funds Budget; Tuition & Fees for Spring; Tax rates
Colleges and Departments finalize Budget
Employee Positions Listings and non-labor
allocations
September Chief Budget Officer verifies Budget in Banner Budgets loaded into Banner Finance

FY 2010-2011 Operating Budget
Page 83
The budget planning process undertaken to develop the FY11 Budget included several meetings with the
Board of Trustees and college constituencies. A Timeline reflecting Board Meetings and Retreats held as part
of this fiscal year‘s budget-building process follows.
Workload-Driven Budgeting Model
The methodology of the workload-driven budgeting model used by the Alamo Colleges is based on the
previous work conducted by the National Center of Higher Education for Management Systems (NCHEMS) to
develop a national model. The state of Texas, through the Texas Higher Education Coordinating Board
(THECB), uses a model with many similar features.
This budgeting model allows for the calculation of an allocation for instructional faculty staffing at each if the
colleges, based on past enrollment activity by discipline and additional projected enrollments. It also allows
for the calculation of allocations for academic support, student services, institutional support, and operations
and maintenance.
The model‘s methodology is contingent on the use of certified and audited financial and enrollment data as
compiled by the THECB. This ensures the use of standardized criteria in the calculation of allocations for each
of colleges and allows for a transparent, fair and equitable approach to funding. Specific cost drivers used
in the model are listed below. Each of these cost drivers is critical to ensuring fair and equitable allocations.
1. Target Class Size by Discipline averaging to Alamo Colleges FY11 target of 23.5
2. Faculty Contact Hours per Staffing Unit
3. Faculty Staffing Units per College (with growth)
4. Projected FY11 annual contact hours by discipline
5. Projected Fall 2010 Enrollment
Meeting Dates Topic
November 7, 2009Board Retreat
Preliminary Operating Revenues
March 16, 2010Audit, Budget & Finance Committee
Revenue Projections
May 15, 2010Board Retreat
Operating Revenue and Expense Budget – Detailed Review(State notified in May - implem. 5% cut)
June 3, 2010Audit, Budget & Finance Committee
Approval of Preliminary Operating Expense Budget
Strategic Initiative Retreats:Part 1:June 28-29,2010Part 2: July 19-20,2010FY12 & FY13: Sept. 13-14, 2010
Develop Cost Reduction Strategies for FY11 Budget Reduction ($21M) and add’l $15M for FY12 & FY13
August 19, 2010Board Final Approval
Final Approval of FY11 Budget (Operating and Restricted Funds)
September 2010Budget Allocations – Colleges & Dept
Colleges and Departments load Banner system with Employee positions and detailed non-labor allocations at Organizational and Account level

FY 2010-2011 Operating Budget
Page 84
FY11 Budget Model Summary
8/1/2010
SAC SPC PAC NVC NLC DISTRICT TOTAL
FACULTY STAFFING UNIT (Exhibit 2)
FY 2011 (excl. Dual Credit) 616.61 369.00 228.16 369.42 129.10 1,712.29
CONTACT HOURS (TAB 1)
FY 2011 (excl. Dual Credit) 8,408,014 4,751,972 3,182,204 5,195,585 1,802,560 23,340,334
INSTRUCTION (TAB 2) -FY11 includes: Avg Salary
updated to 50/50 Faculty/Adjunct; 5% cost
efficiency on Instruction Administrative Costs;
SAC Avg Salary lowered to District Avg. (see
offsetting increases below)
FY 2011 41,352,687 25,188,327 15,224,386 23,633,973 8,009,231 - 113,408,603
ACADEMIC SUPPORT (TAB 3) - FY11 SAC
Academic Support raised by 1% to District-wide
rate.
FY 2011 5,080,044 3,009,529 1,856,929 2,927,642 1,034,596 - 13,908,739
STUDENT SERVICES (TAB 4) - includes transfer of
19 employees from Colleges to establish new
District Back-office CSI Team
FY 2011 5,597,686 2,622,840 2,122,264 3,549,337 1,822,223 4,827,852 20,542,202
INSTITUTIONAL SUPPORT (TAB 5) - FY11
includes: SAC Inst. Support raised by 2% to
District-wide rate; District includes Board
Approved additions and chargebacks classified
below the line in FY10
FY 2011 5,799,808 3,577,487 2,141,226 3,126,614 1,248,199 41,752,731 57,646,065
OPERATION AND MAINTENANCE (TAB 6) -
FY 2011 28,653,875 28,653,875
SAC SPC PAC NVC NLC DISTRICT TOTAL
TOTAL EDUCATIONAL AND GENERAL
FUNCTIONAL CATEGORIES (FORMULA
ALLOCATION) 57,830,224 34,398,184 21,344,804 33,237,566 12,114,248 75,234,459 234,159,484
District additional Overtime/Temp allocation (333,100) (333,100)
TOTAL NON-FORMULA 5,967,659 4,954,175 2,208,679 1,155,190 1,615,945 3,057,209 18,958,856
FY 2011 BASELINE BUDGET (before cross-
charges, mandated and contractual) 63,797,883 39,352,358 23,553,483 34,392,756 13,730,193 77,958,568 252,785,241
% Formula Allocation 36% 22% 13% 21% 8%
CAPITAL FF&E BUDGET 1,631,656 1,268,904 561,692 798,189 239,557 - 4,500,000
SEOG 298,430 167,412 123,739 138,297 - - 727,878
DISTRICT MANDATED/CONTRACTUAL - - - - - 26,575,881 26,575,881
1,930,086 1,436,316 685,432 936,486 239,557 26,575,881 31,803,759
Sub-total with Mandated and Contractual 65,727,969 40,788,675 24,238,915 35,329,242 13,969,750 104,534,448 284,589,000
IT and Communications (Allocated in Budget) 2,907,423 1,717,854 1,132,569 1,302,329 500,404 2,158,097 9,718,676
Less: Amount included in District Budgets for IT
and Communications Cross Charges (9,718,676) (9,718,676)
TOTAL FY11 BUDGET 68,635,392 42,506,529 25,371,484 36,631,571 14,470,154 96,973,869 284,589,000
NEW FY11 NON-BUDGETED ACCOUNTING:
Allocate District portion of IT and Communications
Cross-Charges 628,016 378,893 172,766 736,194 242,227 (2,158,097) -
NEW: Full District allocation 34,501,912 20,522,195 12,734,458 19,829,762 7,227,445 (94,815,772) -
Fully-Distributed FY11 Budget 103,765,320 63,407,617 38,278,708 57,197,527 21,939,826 - 284,589,000
TOTAL BASELINE BUDGET ALLOCATION (COLLEGE/DEPARTMENT DISCRETIONARY AMOUNTS)
TOTAL BASELINE BUDGET ALLOCATION (MANDATED & CONTRACTUAL NON-DISCRETIONARY AMOUNTS)
CROSS-CHARGES TO FULLY DISTRIBUTE DISTRICT COSTS TO COLLEGES FOR SEPARATE COLLEGE FINANCIAL STMTS
ALAMO COMMUNITY COLLEGE DISTRICT
FY11 BUDGET DEVELOPMENT - BUDGET MODEL SUMMARY

FY 2010-2011 Operating Budget
Page 85
Budget Model Funding Methodology and Formulas
INSTRUCTION
(A) There are two specific forms of funding that are generated for the Instructional areas.
Funding for Faculty Salary Costs
Allocation for Instructional Departments
(B) The funding for faculty is generated based on the following formula:
(Faculty Staffing Units per College with growth x District-wide Average Faculty Staffing Unit (FSU) Salary) =
Funding for Faculty
(C) Each instructional department receives an operations allocation based on the following formula:
Projected Contact Hours provided by Colleges x Costs per Contact Hour = Instructional Operations (without
furniture, fixtures & equipment). In addition, a 5 percent efficiency was overlaid to the budget allocation as
part of the strategic initiative: Instructional Department Consolidation.
(D) Cost Drivers
Target Average Class Size: Based on THECB FY2008-09 data from 50 Texas Comm. Colleges; FY09 base year contact hours in 26 disciplines with Target Class Size of 23.5
Contact Hours per Faculty Staffing Unit: College Target Average Class Size x 3 credit hours x 5 classes x 16 weeks in 26 disciplines Faculty Staffing Units per College: Contact Hours DIVIDED by Contact Hours per Faculty Staffing Unit FSU Average Salary: district-wide Faculty Salaries as of 3/25/10 with 50/50 ratio of Full-time Faculty/Adjunct Instructional Operations: (FY09 Actual Costs per CH ) x Contact Hours LESS 5% efficiency savings in FY11.
(E) Data Exhibits
Target Class Size by Discipline (Exhibit 1)
o The table in this exhibit indicates the ―targeted average class size‖ based on student headcount for each of
the 26 standard disciplines used by Texas community colleges per fiscal year (i.e., fall semester, spring
semester, flex semesters, summer I and summer I) to achieve a district-wide average class size of 23.5
students.
o The basis of this cost driver is the FY08-09 certified enrollment and cost data for the functional area of
instruction as received from the THECB. These data include all faculty salaries paid (whether for full time,
overload or adjunct) per contact hours by discipline for all 50 Texas community colleges. This is the same
type of financial data used by the THECB to support the Commissioner‘s community college funding
recommendations before the Governor and the Legislature for FY06-07 and FY07-08.
o The methodology involves the selection of disciplines with the lowest faculty salaries cost per contact hour. In
FY08-09, this discipline was Communication. That discipline‘s faculty salary cost per contact hour for the 50
Texas community colleges was calculated at $2.57, and all of the other discipline‘s faculty salary costs are
calculated as a percentage of the Communication cost figure per contact hour.
o The purpose of calculating the overall target class size by discipline is to equitably allocate funds to each
college based on the college‘s share of the current and projected district-wide enrollment toward reaching a
district-wide average class size of 23.5. These data are applied to the current and projected enrollment by
discipline and by college to derive the number of instructional faculty staffing units.
Faculty Contact Hours per Staffing Unit (Exhibit 2)
o This criterion provides a way to calculate the varying average contact hours per faculty staffing unit by
discipline as a companion snapshot to the TARGET CLASS SIZE BY DISCIPLINE (Exhibit 1).
o The table in this exhibit is based on calculating the average contact hours per faculty staffing unit per
discipline for the fall, spring, summer I, and summer II semesters, based on a standard of 15 credit hours per
semester per faculty staffing unit. An adjustment is made for the summer sessions, which are typically at ½
to ¼ the length of a regular semester or academic year. The calculation assumes that ―equivalencies‖ in
contact hours will be developed to match this standard of methodology, as follows:

FY 2010-2011 Operating Budget
Page 86
A Semester is generated based on the following formula: (targeted average class size x 3 credit
hour class x 5 classes per semester) x (16 weeks in a semester) = faculty contact hours per faculty
staffing unit for either the fall or spring semester;
The Academic Year, which is double the semester total, is generated based on the following
formula: academic year total generated as (fall or spring semester figure) x 2 = faculty contact
hours per faculty staffing unit for the academic year; and
The Fiscal Year, which is a combination of the academic year total plus 50 percent of the fall or
spring semester figure is generated based on the following formula: (faculty contact hours per
staffing unit for fall or spring semesters x 2) + (faculty contact hours per staffing unit for fall or
spring/2) = total faculty contact hours per faculty staffing unit for a fiscal year.
o The purpose of calculating faculty contact hours per staffing unit is to allow for consistent and equitable
method of calculating the number of faculty staffing units per college based on the current and projected
enrollment by discipline and by college.
Faculty Staffing Units per College (Exhibit 3)
o The table in this exhibit indicates the total number of district-wide faculty staffing units calculated for each
discipline for each college, based on what proportion of the total District discipline instructional activity is
generated by each college.
o This calculation is independent of funding sources, allowing for a fair and equitable allocation of total
faculty staffing units, based on each college‘s discipline variations.
ACADEMIC SUPPORT
Funding for the Academic Support area is generated based on the following formula:
(11percent of Instruction Distribution and Gateway Expense + Library upgrade) = Academic Support
The Library Upgrade is based on: (FY10 estimated Annual Headcount (100% non-exempt + 20% Exempt) * $12) –
additional cost efficiency per FY11 Library Strategic Initiative.
STUDENT SERVICES
(A) The College Student Services distribution is based on the following formula:
(Target Staffing Unit (minimum 40) per Student Services Staffing Unit x Average Salary) + Other Operating
Expense per FTE
(B) The College Student Services Staffing Unit is calculated based on (see Exhibit 4 for Enrollment):
a. Target Staffing Unit: 1 per 150 non-exempt Fall '09 enrollment over 5,000 (1:125 below 5,000)
b. PLUS: 20% Exempt at 1 per 150
c. Target Staffing allocated between COLLEGE & DISTRICT based on Percent of Actual FTE and includes CSI
transfer of 19 FTE to District
INSTITUTIONAL SUPPORT
Institutional Support funding is based on the following formula:
10 percent of Total Instruction, Academic Support, Student Services and Non-Formula
OPERATIONS AND MAINTENANCE
The Operations and Maintenance funding is based on the following formula:
19,000 gross square fee per housekeeping FTE
50,000 gross square feet per Maintenance FTE
20 acres per grounds FTE
Utilities: Projected consumption at current utility rates
Administrative Overhead
NON-FORMULA EXPENSE
Funded equal to related non-formula revenue projects (see Exhibit 5)

FY 2010-2011 Operating Budget
Page 87
Exhibit 1
1 Agriculture 68,847 24.0
2 Architecture and Precision Production Trades 179,804 19.0
3 Biology, Physical Sciences, and Science Technology 2,330,704 26.0
4Business Management, Marketing, and Administrative
Services 1,128,485 25.0
5 Career Pilot 2,992 8.0
6 Communications 310,847 30.0
7 Computer and Information Sciences 800,119 19.0
8 Construction Trades 88,658 19.0
9 Consumer and Homemaking Education 775,268 29.0
10 Engineering 23,168 15.0
11 Engineering Related 397,436 26.0
12English Language, Literature, Philosophy, Humanities,
and Interdisciplinary 4,053,134 21.0
13 Foreign Languages 726,212 25.0
14Health Occupations - Dental Assisting, Medical Lab, and
Associate Degree Nursing 460,608 12.0
15 Health Occupations - Dental Hygiene - 8.0
16 Health Occupations - Other 686,985 18.0
17 Health Occupations - Respiratory Therapy 41,360 11.0
18 Health Occupations - Vocational Nursing 190,576 16.0
19 Mathematics 2,889,492 25.0
20 Mechanics and Repairers - Automotive 295,925 17.0
21Mechanics and Repairers - Diesel, Aviation Mechanics, &
Transport . Workers 187,908 21.0
22 Mechanics and Repairers - Electronics 25,880 19.0
23 Physical Education and Fitness 585,216 18.0
24 Protective Services and Public Administration 540,424 28.0
25 Psychology, Social Sciences, and History 3,607,776 28.0
26 Visual and Performing Arts 1,077,936 18.0
Totals 21,475,760 23.5
NOTE: Base Year Period covered Summer 2008, Fall 2008 and Spring 2009.
All Texas Two Year Institutions Instructional Credit Programs
ALAMO COMMUNITY COLLEGE DISTRICT
College Target
Average Class
Size
Program
Base Year
Contact
Hours
Target Class Size by Discipline

FY 2010-2011 Operating Budget
Page 88
Exhibit 2
Resident Instruction
Target Avg
Class Size
of 23.5
Faculty Contact Hrs
Per Staffing Unit
1 Agriculture 24 14,400
2 Architecture and Precision Production Trades 19 11,400
3 Biology, Physical Sciences, and Science Technology 26 15,600
4Business management, Marketing, and Administrative
Services25 15,000
5 Career Pilot 8 4,800
6 Communications 30 18,000
7 Computer and Information Sciences 19 11,400
8 Construction Trades 19 11,400
9 Consumer and Homemaking Education 29 17,400
10 Engineering 15 9,000
11 Engineering Related 26 15,600
12English Language, Literature, Philosophy, Humanities,
and Interdisciplinary21 12,600
13 Foreign Languages 25 15,000
14Health Occupations - Dental Assisting, Medical Lab, and
Associate Degree Nursing12 7,200
15 Health Occupations - Dental Hygiene 8 4,800
16 Health Occupations - Other 18 10,800
17 Health Occupations - Respiratory Therapy 11 6,600
18 Health Occupations - Vocational Nursing 16 9,600
19 Mathematics 25 15,000
20 Mechanics and Repairers - Automotive 17 10,200
21Mechanics and Repairers - Diesel, Aviation Mechanics,
and Transportation Workers21 12,600
22 Mechanics and Repairers - Electronics 19 11,400
23 Physical Education and Fitness 18 10,800
24 Protective Services and Public Administration 28 16,800
25 Psychology, Social Sciences, and History 28 16,800
26 Visual and Performing Arts 18 10,800
Notes: Faculty contact hours per staffing unit calculation for all semesters is based on: 23.5
(avg.headcount) * 3 (# of credit hours) * 5 (# of classes) * 16 weeks or any other combination of
credit courses teaching formats to achieve the same target productivity that reflects and delivery
the discipline variations
ALAMO COMMUNITY COLLEGE DISTRICT
Based on a Target Average Class Size of 23.5
Faculty Contact Hours Per Staffing Unit

FY 2010-2011 Operating Budget
Page 89
B/A D/A F/A H/A J/A L/A
A B C D E F G H I J K L M
Per Exh 2 SAC SPC PAC NVC NLC TOTAL
Resident InstructionCH per
Staff ing Unit
Contact
Hours
Staff ing
Unit
Contact
Hours
Staff ing
Unit
Contact
Hours
Staff ing
Unit
Contact
Hours
Staff ing
Unit
Contact
Hours
Staff ing
Unit
Contact
Hours
Staff ing
Unit
Avg Class
Size
1 Agriculture 14,400 13,290 0.92 1,574 0.11 36,459 2.53 11,158 0.77 4,997 0.35 67,478 4.69 24.02 Architecture and Precision Production Trades 11,400 99,400 8.72 119,340 10.47 0 0.00 0 0.00 0 0.00 218,740 19.19 19.0
3Biology, Physical Sciences, and Science
Technology15,600 755,037 48.40 563,468 36.12 343,190 22.00 729,944 46.79
195,90412.56 2,587,543 165.87
26.0
4Business management, Marketing, and
Administrative Services15,000 496,342 33.09 263,755 17.58 173,932 11.60 246,920 16.46
28,7001.91 1,209,649 80.64
25.05 Career Pilot 4,800 0 0.00 0 0.00 4,939 1.03 0 0.00 0 0.00 4,939 1.03 8.06 Communications 18,000 174,722 9.71 0 0.00 58,378 3.24 118,671 6.59 5,766 0.32 357,536 19.86 30.07 Computer and Information Sciences 11,400 388,484 34.08 179,553 15.75 130,687 11.46 134,839 11.83 21,910 1.92 855,472 75.04 19.08 Construction Trades 11,400 0 0.00 124,413 10.91 2,851 0.25 0 0.00 0 0.00 127,264 11.16 19.09 Consumer and Homemaking Education 17,400 339,292 19.50 262,986 15.11 144,883 8.33 90,286 5.19 51,037 2.93 888,484 51.06 29.010 Engineering 9,000 7,100 0.79 0 0.00 6,264 0.70 9,693 1.08 0 0.00 23,057 2.56 15.011 Engineering Related 15,600 134,209 8.60 194,258 12.45 39,405 2.53 61,005 3.91 0 0.00 428,877 27.49 26.0
12English Language, Literature, Philosophy,
Humanities, and Interdisciplinary12,600 1,531,846 121.58 678,219 53.83 702,161 55.73 1,189,438 94.40
477,48237.90 4,579,146 363.42
21.013 Foreign Languages 15,000 393,099 26.21 58,367 3.89 73,360 4.89 131,336 8.76 51,720 3.45 707,882 47.19 25.0
14Health Occupations - Dental Assisting, Medical
Lab, and Associate Degree Nursing7,200 255,709 35.52 116,871 16.23 8,317 1.16 0 0.00
00.00 380,897 52.90
12.015 Health Occupations - Dental Hygiene 4,800 0 0.00 0 0.00 0 0.00 0 0.00 0 0.00 0 0.00 8.016 Health Occupations - Other 10,800 185,483 17.17 333,381 30.87 128,157 11.87 67,602 6.26 19,091 1.77 733,714 67.94 18.017 Health Occupations - Respiratory Therapy 6,600 0 0.00 47,152 7.14 0 0.00 0 0.00 0 0.00 47,152 7.14 11.018 Health Occupations - Vocational Nursing 9,600 0 0.00 94,265 9.82 0 0.00 0 0.00 0 0.00 94,265 9.82 16.019 Mathematics 15,000 1,000,464 66.70 544,523 36.30 498,062 33.20 777,021 51.80 301,993 20.13 3,122,063 208.14 25.020 Mechanics and Repairers - Automotive 10,200 0 0.00 280,625 27.51 0 0.00 0 0.00 0 0.00 280,625 27.51 17.0
21Mechanics and Repairers - Diesel, Aviation
Mechanics, and Transportation Workers12,600 0 0.00 138,562 11.00 1,807 0.14 0 0.00
00.00 140,369 11.14
21.022 Mechanics and Repairers - Electronics 11,400 2,899 0.25 32,451 2.85 4,864 0.43 10,263 0.90 0 0.00 50,476 4.43 19.023 Physical Education and Fitness 10,800 282,509 26.16 91,813 8.50 59,949 5.55 168,232 15.58 98,657 9.13 701,160 64.92 18.024 Protective Services and Public Administration 16,800 410,651 24.44 25,183 1.50 64,928 3.86 68,172 4.06 16,144 0.96 585,078 34.83 28.0
25 Psychology, Social Sciences, and History 16,800 1,349,169 80.31 442,204 26.32 517,255 30.79 992,820 59.10 400,009 23.81 3,701,458 220.32 28.026 Visual and Performing Arts 10,800 588,308 54.47 159,011 14.72 182,356 16.88 388,185 35.94 129,151 11.96 1,447,011 133.98 18.027 Non-State Funded 0 0 0 0 0 0
Total 8,408,014 616.61 4,751,972 369.00 3,182,204 228.16 5,195,585 369.42 1,802,560 129.10 23,340,334 1,712.29 23.5Average Class Size by College: 23.6 22.4 23.9 24.0 23.8 23.5
FY 2011 Budget methodology changes from prior year:
a) Off-Campus Dual Credit Contact Hours excluded in FY2011
b) Updated Contact Hours per FSU to THECB 50 Texas Colleges FY09 data (prior year used FY05)
FY11 Faculty Staffing Units per College - With College Projections (@ 23.5 Avg Class Size)
Exhibit 3
Note: Contact Hour Projections provided by Colleges on 4/2010

FY 2010-2011 Operating Budget
Page 90
Exhibit 4
SAC SPC PAC NVC NLC TOTAL
Non-Exempt 19,319 8,326 6,392 11,631 4,908 50,576
Total Non-Exempt 19,319 8,326 6,392 11,631 4,908 50,576
Other Exempt 383 154 212 158 66 973
Total Other Exempt 383 154 212 158 66 973
Dual Credit
Off-Campus 1,681 1,455 958 2,655 6,749
On-Campus 195 327 668 135 176 1,501
Total Off/On Campus Dual 1,876 1,782 1,626 2,790 176 8,250
Gateway
On-Campus 364 0 102 0 0 466
0
Total Off/On Campus Gateway 364 0 102 0 0 466
Total Exempt 2,623 1,936 1,940 2,948 242 9,689
Total Fall 2009 21,942 10,262 8,332 14,579 5,150 60,265
SAC SPC PAC NVC NLC TOTAL % TOTAL
Non-Exempt 19,761 8,903 6,904 12,213 5,813 53,594 82.7%
Total Non-Exempt 19,761 8,903 6,904 12,213 5,813 53,594
Other Exempt 383 154 229 167 66 999 1.5%
Total Other Exempt 383 154 229 167 66 999
Dual Credit
Off-Campus 1,681 1,654 1,035 2,790 0 7,160 11.0%
On-Campus 195 512 721 142 301 1,871 2.9%
Total Off/On Campus Dual 1,876 2,166 1,756 2,932 301 9,031 13.9%
Gateway
On-Campus 1,089 0 110 0 0 1,199 1.8%
0.0%
Total Off/On Campus Gateway 1,089 0 110 0 0 1,199 1.8%
Total Exempt 3,348 2,320 2,095 3,099 367 11,229 17.3%
Total Fall 2010 23,109 11,223 8,999 15,312 6,180 64,823 100.0%
SAC SPC PAC NVC NLC TOTAL % CHANGE
Non-Exempt 442 577 512 582 905 3,018 6.0%
Total Non-Exempt 442 577 512 582 905 3,018
Other Exempt 0 0 17 9 0 26 2.7%
Total Other Exempt 0 0 17 9 0 26
Dual Credit
Off-Campus 0 199 77 135 0 411 6.1%
On-Campus 0 185 53 7 125 370 24.7%
Total Off/On Campus Dual 0 384 130 142 125 781 9.5%
Gateway
Off-Campus 725 0 8 0 0 733 157.3%
On-Campus 0 0 0 0 0 0
Total Off/On Campus Gateway 725 0 8 0 0 733 157.3%
Total Exempt 725 384 155 151 125 1,540 15.9%
Total Variance 1,167 961 667 733 1,030 4,558 7.6%
Fall 2009 Actual and Fall 2010 Projected
Enrollment - College of Attendance
Variance Fall 2009 vs. Fall 2010
FALL 2009 ACTUAL *
* Z:\FY11 Budget Development\[SCH Load - Fall 2009 Census - All.xlsx]summary (IRES) & email dated 4/12/2010 from Director or IRES
Fall 10 Projected

FY 2010-2011 Operating Budget
Page 91
Exhibit 5
FORMULA FUNDED PUBLIC SERVICE AUXILIARY SCHOLARSHIPS &
FINANCIAL AID
EDUCATIONAL&GENERAL
State Appropriations
Tuition and Fees
CE Reimbursable Tuition
Taxes
Investment Income
Other: (Indirect Cost
Recovry for Federal Revenue,
Property Rental, Vendor
Fees, VA)
PROGRAM TUITION
Nursing
Fire Science
Dental Lab Tech
Aviation
Advanced Water Treatmt
STUDENT ACTIVITIES
Fees
ENTERPRISE
ACTIVITIES
Gateway Charges
Library Fines
Gym Rental Charges
Facility Rental Charges
Testing Fees
VCT Fees
CE Non-Reimbursable
PUBLIC SERVICE
Planetarium Fees
Fine Arts Acad. Charges
DESIGNATED
Child Care Center Fees
Natatorium Charges
NON-DESIGNATED
Bookstore Commission
Game Table Commission
Vending Commission
Copy Machine Charges
Park ing Permits & Fines
SCHOLARSHIPS AND
FINANCIAL AID
Earnings
FORMULA FUNDED PUBLIC SERVICE AUXILIARY SCHOLARSHIPS &
FINANCIAL AID
EDUCATIONAL&GENERAL
Instruction
Academic Support
Student Services
Institutional Support
Operation & Maintenance
PROGRAM TUITION
Nursing
Fire Science
Dental Lab Tech
Aviation
Advanced Water Treatmt
STUDENT ACTIVITIES
ENTERPRISE
ACTIVITIES
Gateway to College
Library Replacement
Bks
Gym/Facility Rentals
Testing
VCT
Continuing Education
PUBLIC SERVICE
Planetarium
SA Symphony
Fine Arts Academy
DESIGNATED
Child Care Centers
Natatorium
AUXILIARY
SUPPORTED
Intramural
Food Service
SCHOLARSHIPS AND
FINANCIAL AID
NON-FORMULA FUNDED
REVENUES
NON-FORMULA FUNDED
EXPENSES

FY 2010-2011 Operating Budget
Page 92
B/A D/A F/A H/A J/A L/A
A B C D E F G H I J K L M
SAC SPC PAC NVC NLC TOTAL
Resident InstructionCH per
Staffing Unit
Contact
Hours
Staffing
Unit
Contact
Hours
Staffing
Unit
Contact
Hours
Staffing
Unit
Contact
Hours
Staffing
Unit
Contact
Hours
Staffing
Unit
Contact
HoursStaffing Unit
1 Agriculture 14,400 13,290 0.92 1,574 0.11 36,459 2.53 11,158 0.77 4,997 0.35 67,478 4.69
2 Architecture and Precision Production Trades 11,400 99,400 8.72 119,340 10.47 0 0.00 0 0.00 0 0.00 218,740 19.19
3 Biology, Physical Sciences, and Science Technology 15,600 755,037 48.40 563,468 36.12 343,190 22.00 729,944 46.79195,904
12.56 2,587,543 165.87
4Business management, Marketing, and
Administrative Services15,000 496,342 33.09 263,755 17.58 173,932 11.60 246,920 16.46
28,7001.91 1,209,649 80.64
5 Career Pilot 4,800 0 0.00 0 0.00 4,939 1.03 0 0.00 0 0.00 4,939 1.03
6 Communications 18,000 174,722 9.71 0 0.00 58,378 3.24 118,671 6.59 5,766 0.32 357,536 19.86
7 Computer and Information Sciences 11,400 388,484 34.08 179,553 15.75 130,687 11.46 134,839 11.83 21,910 1.92 855,472 75.04
8 Construction Trades 11,400 0 0.00 124,413 10.91 2,851 0.25 0 0.00 0 0.00 127,264 11.16
9 Consumer and Homemaking Education 17,400 339,292 19.50 262,986 15.11 144,883 8.33 90,286 5.19 51,037 2.93 888,484 51.06
10 Engineering 9,000 7,100 0.79 0 0.00 6,264 0.70 9,693 1.08 0 0.00 23,057 2.56
11 Engineering Related 15,600 134,209 8.60 194,258 12.45 39,405 2.53 61,005 3.91 0 0.00 428,877 27.49
12English Language, Literature, Philosophy,
Humanities, and Interdisciplinary12,600 1,531,846 121.58 678,219 53.83 702,161 55.73 1,189,438 94.40
477,48237.90 4,579,146 363.42
13 Foreign Languages 15,000 393,099 26.21 58,367 3.89 73,360 4.89 131,336 8.76 51,720 3.45 707,882 47.19
14Health Occupations - Dental Assisting, Medical Lab,
and Associate Degree Nursing7,200 255,709 35.52 116,871 16.23 8,317 1.16 0 0.00
00.00 380,897 52.90
15 Health Occupations - Dental Hygiene 4,800 0 0.00 0 0.00 0 0.00 0 0.00 0 0.00 0 0.00
16 Health Occupations - Other 10,800 185,483 17.17 333,381 30.87 128,157 11.87 67,602 6.26 19,091 1.77 733,714 67.94
17 Health Occupations - Respiratory Therapy 6,600 0 0.00 47,152 7.14 0 0.00 0 0.00 0 0.00 47,152 7.14
18 Health Occupations - Vocational Nursing 9,600 0 0.00 94,265 9.82 0 0.00 0 0.00 0 0.00 94,265 9.82
19 Mathematics 15,000 1,000,464 66.70 544,523 36.30 498,062 33.20 777,021 51.80 301,993 20.13 3,122,063 208.14
20 Mechanics and Repairers - Automotive 10,200 0 0.00 280,625 27.51 0 0.00 0 0.00 0 0.00 280,625 27.51
21Mechanics and Repairers - Diesel, Aviation
Mechanics, and Transportation Workers12,600 0 0.00 138,562 11.00 1,807 0.14 0 0.00
00.00 140,369 11.14
22 Mechanics and Repairers - Electronics 11,400 2,899 0.25 32,451 2.85 4,864 0.43 10,263 0.90 0 0.00 50,476 4.43
23 Physical Education and Fitness 10,800 282,509 26.16 91,813 8.50 59,949 5.55 168,232 15.58 98,657 9.13 701,160 64.92
24 Protective Services and Public Administration 16,800 410,651 24.44 25,183 1.50 64,928 3.86 68,172 4.06 16,144 0.96 585,078 34.83
25 Psychology, Social Sciences, and History 16,800 1,349,169 80.31 442,204 26.32 517,255 30.79 992,820 59.10 400,009 23.81 3,701,458 220.32
26 Visual and Performing Arts 10,800 588,308 54.47 159,011 14.72 182,356 16.88 388,185 35.94 129,151 11.96 1,447,011 133.98
27 Non-State Funded 0 0 0 0 0 0
Total 8,408,014 616.61 4,751,972 369.00 3,182,204 228.16 5,195,585 369.42 1,802,560 129.10 23,340,334 1,712.29
FY11 Faculty Staffing Units per College - With College Projections
TAB 1

FY 2010-2011 Operating Budget
Page 93
TAB 2
SAC SPC PAC NVC NLC TOTAL
Staffing Unit 616.61 369.00 228.16 369.42 129.10 1,712.29
Districtwide Avg Salary
w/ 2% raise (a)50,669 50,669 50,669 50,669 50,669
TOTAL Faculty Salary & Benefits 31,243,443.24 18,696,824.60 11,560,952.32 18,718,098.22 6,541,524.61 86,760,842.99
Total Non Faculty Salaries & Wages * 6,421,886.13 3,990,377.32 2,155,235.45 3,151,710.44 948,413.55 16,667,622.90
Total Non Faculty Benefits * 602,923.12 374,639.27 202,345.74 295,900.47 89,042.45 1,564,851.05
Total Other Operating Expenses * 3,616,499.50 2,468,143.90 1,498,664.53 1,726,994.25 507,497.68 9,817,799.86
Total Non-Capitalized Equipment ** 0.00 0.00 0.00 0.00 0.00 0.00
TOTAL NON FACULTY OTHER
COSTS10,641,308.75 6,833,160.50 3,856,245.72 5,174,605.15 1,544,953.68 28,050,273.81
FY11 Administrative Cost Efficiency*** (532,065.44) (341,658.03) (192,812.29) (258,730.26) (77,247.68) (1,402,513.69)
TOTAL Expenses 10,109,243.31 6,491,502.48 3,663,433.44 4,915,874.90 1,467,706.00 26,647,760.12
TOTAL DISTRIBUTION 41,352,686.55 25,188,327.08 15,224,385.75 23,633,973.12 8,009,230.61 113,408,603.11
(a) Districtwide Average Salary with 50/50 full-time to adjunct ratio:
Adjunct 40,000
FT Faculty 52,126
Avg. Salary @ 50/50 46,063
with benefits: 50,669
* Calculated using Fiscal Year 2009 costs per contact hour
** Budgeted in separate Capital Budget
*** Strategic Initiative Instructional Department consolidation/Chairs
FY 11 BUDGET DEVELOPMENT - INSTRUCTION (1XX)

FY 2010-2011 Operating Budget
Page 94
TAB 3
SAC SPC PAC NVC NLC TOTAL
Instruction Distribution
Based on COLLEGE
Average Salary per FSU
41,352,687 25,188,327 15,224,386 23,633,973 8,009,231 113,408,603
11% of Instruction
Distribution: 4,548,796 2,770,716 1,674,682 2,599,737 881,015 12,474,946
Library Upgrade (TAB 3) 541,248 247,314 193,047 338,904 156,580 1,477,093
LESS: Academic Support
Non-Formula (10,000) (8,500) (10,800) (11,000) (3,000) (43,300)
Total Academic Support
Distribution5,080,044 3,009,529 1,856,929 2,927,642 1,034,596 13,908,739
FY11 Budget Distribution - ACADEMIC SUPPORT (3XX)

FY 2010-2011 Operating Budget
Page 95
TAB 4
Annual Headcount SAC SPC PAC NVC NLC TOTAL
FY11 Estimated non-exempt Headcount (Fall 2010 * 2.5) per
tab 549,403 22,258 17,260 30,533 14,533 133,985
Exempt Students (Fall 2010 * 2) 6,696 4,640 4,190 6,198 734 22,458
20% of Exempt Students 1,339 928 838 1,240 147 4,492
Total Headcount for Library upgrade distribution 50,742 23,186 18,098 31,772 14,679 138,477
FY11 Library Upgrade Distribution:
Current (Enrollment X $12) ** 608,900 278,226 217,176 381,265 176,152 1,661,719
Other Library savings - per strategic initiative (59,187) (27,044) (21,110) (37,060) (17,122) (161,523)
Sub-Total FY11 Library Distribution 549,714 251,182 196,066 344,205 159,029 1,500,196
LESS: FY09 Allowance for bad debt expense for all tuition
and fees: 1.54%(8,466) (3,868) (3,019) (5,301) (2,449) (23,103)
Total FY09 Library Distribution 541,248 247,314 193,047 338,904 156,580 1,477,093
** FY08 Library Upgrade Fee = $13 (rolled into Tuition); updated to $12 per Library FY11 strategic initiative
FY11 Library Strategic Initiative Expense Savings: SAC SPC PAC NVC NLC TOTAL
Library Upgrade Distribution (@ $13) 659,642 301,412 235,274 413,037 190,831 1,800,196
FY11 Library Upgrade Distribution (@ $12) 608,900 278,226 217,176 381,265 176,152 1,661,719
Rate decrease 50,742 23,186 18,098 31,772 14,679 138,477
Other Library Savings per Strategic Initiative 59,187 27,044 21,110 37,060 17,122 161,523
Agreed upon FY11 savings 109,928 50,230 39,208 68,832 31,802 300,000
ACADEMIC SUPPORT (3XX)
FY11 Library Upgrade Distribution

FY 2010-2011 Operating Budget
Page 96
TAB 5
SAC SPC PAC NVC NLC TOTAL
College Staffing Units 113 55 44 73 37 322
Districtwide Avg Salary & Benefits $43,893 $43,893 $43,893 $43,893 $43,893
FY11 Salary & Benefits 4,959,903 2,414,112 1,931,290 3,204,185 1,624,039 14,133,529
FY11 Salary Increase 99,198 48,282 38,626 64,084 32,481 282,671
TOTAL SALARY & BENEFITS 5,059,101 2,462,394 1,969,916 3,268,269 1,656,520 14,416,200
FY09 Other Costs per FTE 6,138$ 6,138$ 6,138$ 6,138$ 6,138$
FY11 PROJECTED OTHER
COSTS693,585 337,586 270,068 448,068 227,103 1,976,410
LESS: Non-Formula Student
Services (excludes Student
Activity Fees)
(155,000) (177,140) (117,720) (167,000) (61,400) (678,260)
Total 5,597,686 2,622,840 2,122,264 3,549,337 1,822,223 15,714,350
FY11 Budget Distribution - STUDENT SERVICES (4XX)
Colleges Only
FY11 Projected Expenses

FY 2010-2011 Operating Budget
Page 97
COLLEGE FY10 Model Calculation SAC SPC PAC NVC NLC Total Colleges
FY11 Instruction Model 41,352,687 25,188,327 15,224,386 23,633,973 8,009,231 113,408,603
FY11 Academic Support Model 5,080,044 3,009,529 1,856,929 2,927,642 1,034,596 13,908,739
FY11 Student Services Model 5,597,686 2,622,840 2,122,264 3,549,337 1,822,223 15,714,350
FY11 Non-Formula E&G 5,967,659 4,954,175 2,208,679 1,155,190 1,615,945 15,901,647
Total FY11 Models &
Non-Formula E&G57,998,075 35,774,871 21,412,257 31,266,142 12,481,994 158,933,339
% 10% 10% 10% 10% 10%
TOTAL FY11 COLLEGES
Institutional Support Model
Distribution
5,799,808 3,577,487 2,141,226 3,126,614 1,248,199 15,893,334
Total College Institutional
Support Allocation5,799,808 3,577,487 2,141,226 3,126,614 1,248,199 15,893,334
FY11 BUDGET DISTRIBUTION - INSTITUTIONAL SUPPORT (5XX)
TAB 6
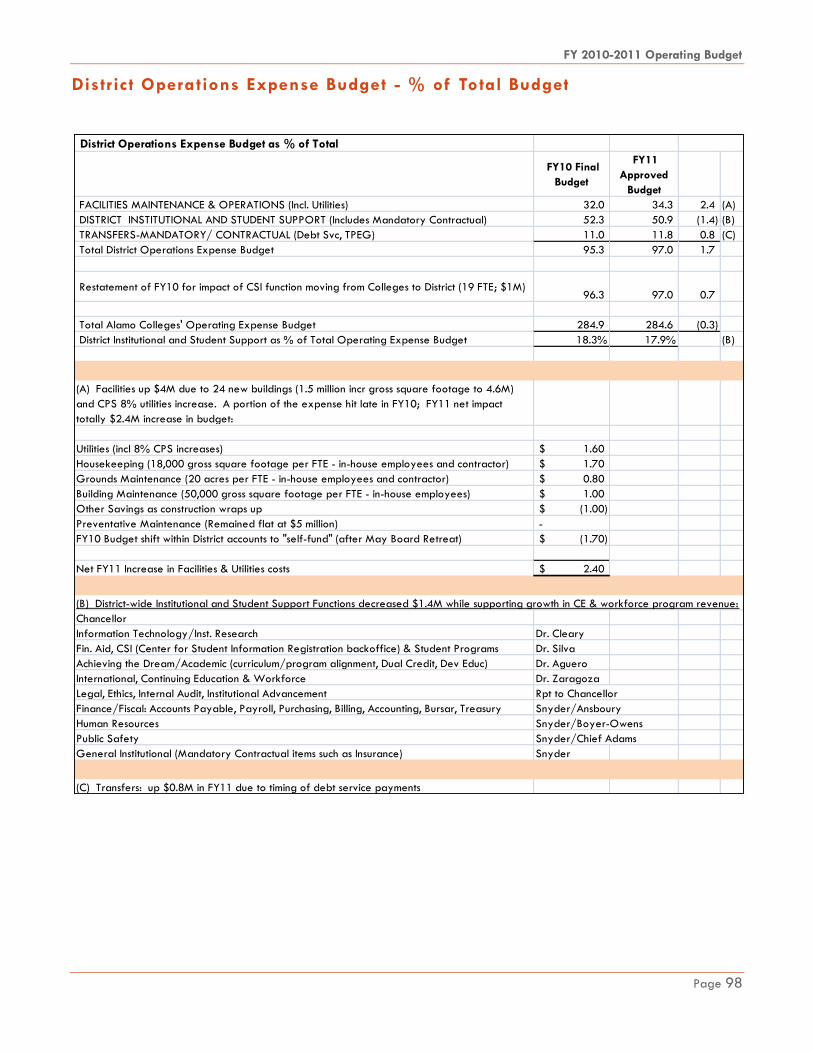
FY 2010-2011 Operating Budget
Page 98
District Operations Expense Budget - % of Total Budget
District Operations Expense Budget as % of Total
FY10 Final
Budget
FY11
Approved
Budget
FACILITIES MAINTENANCE & OPERATIONS (Incl. Utilities) 32.0 34.3 2.4 (A)
DISTRICT INSTITUTIONAL AND STUDENT SUPPORT (Includes Mandatory Contractual) 52.3 50.9 (1.4) (B)
TRANSFERS-MANDATORY/ CONTRACTUAL (Debt Svc, TPEG) 11.0 11.8 0.8 (C)
Total District Operations Expense Budget 95.3 97.0 1.7
Restatement of FY10 for impact of CSI function moving from Colleges to District (19 FTE; $1M) 96.3 97.0 0.7
Total Alamo Colleges' Operating Expense Budget 284.9 284.6 (0.3)
District Institutional and Student Support as % of Total Operating Expense Budget 18.3% 17.9% (B)
(A) Facilities up $4M due to 24 new buildings (1.5 million incr gross square footage to 4.6M)
and CPS 8% utilities increase. A portion of the expense hit late in FY10; FY11 net impact
totally $2.4M increase in budget:
Utilities (incl 8% CPS increases) 1.60$
Housekeeping (18,000 gross square footage per FTE - in-house employees and contractor) 1.70$
Grounds Maintenance (20 acres per FTE - in-house employees and contractor) 0.80$
Building Maintenance (50,000 gross square footage per FTE - in-house employees) 1.00$
Other Savings as construction wraps up (1.00)$
Preventative Maintenance (Remained flat at $5 million) -
FY10 Budget shift within District accounts to "self-fund" (after May Board Retreat) (1.70)$
Net FY11 Increase in Facilities & Utilities costs 2.40$
(B) District-wide Institutional and Student Support Functions decreased $1.4M while supporting growth in CE & workforce program revenue:
Chancellor
Information Technology/Inst. Research Dr. Cleary
Fin. Aid, CSI (Center for Student Information Registration backoffice) & Student Programs Dr. Silva
Achieving the Dream/Academic (curriculum/program alignment, Dual Credit, Dev Educ) Dr. Aguero
International, Continuing Education & Workforce Dr. Zaragoza
Legal, Ethics, Internal Audit, Institutional Advancement Rpt to Chancellor
Finance/Fiscal: Accounts Payable, Payroll, Purchasing, Billing, Accounting, Bursar, Treasury Snyder/Ansboury
Human Resources Snyder/Boyer-Owens
Public Safety Snyder/Chief Adams
General Institutional (Mandatory Contractual items such as Insurance) Snyder
(C) Transfers: up $0.8M in FY11 due to timing of debt service payments
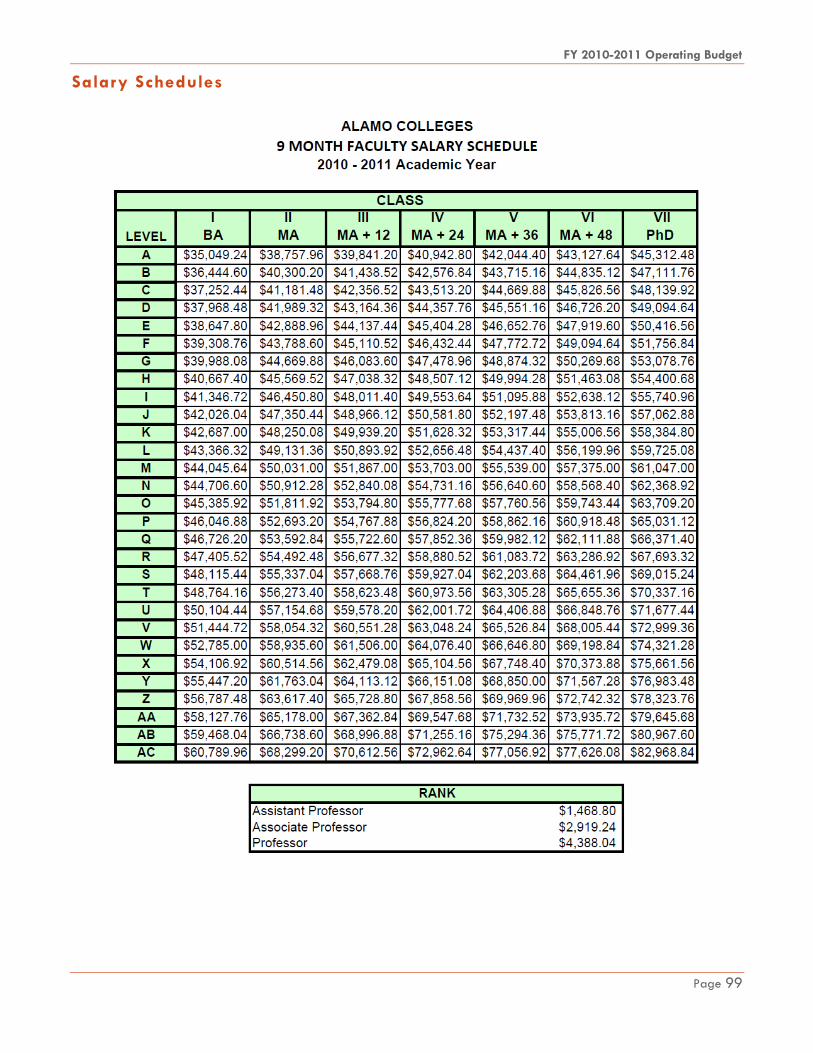
FY 2010-2011 Operating Budget
Page 99
Salary Schedules

FY 2010-2011 Operating Budget
Page 100
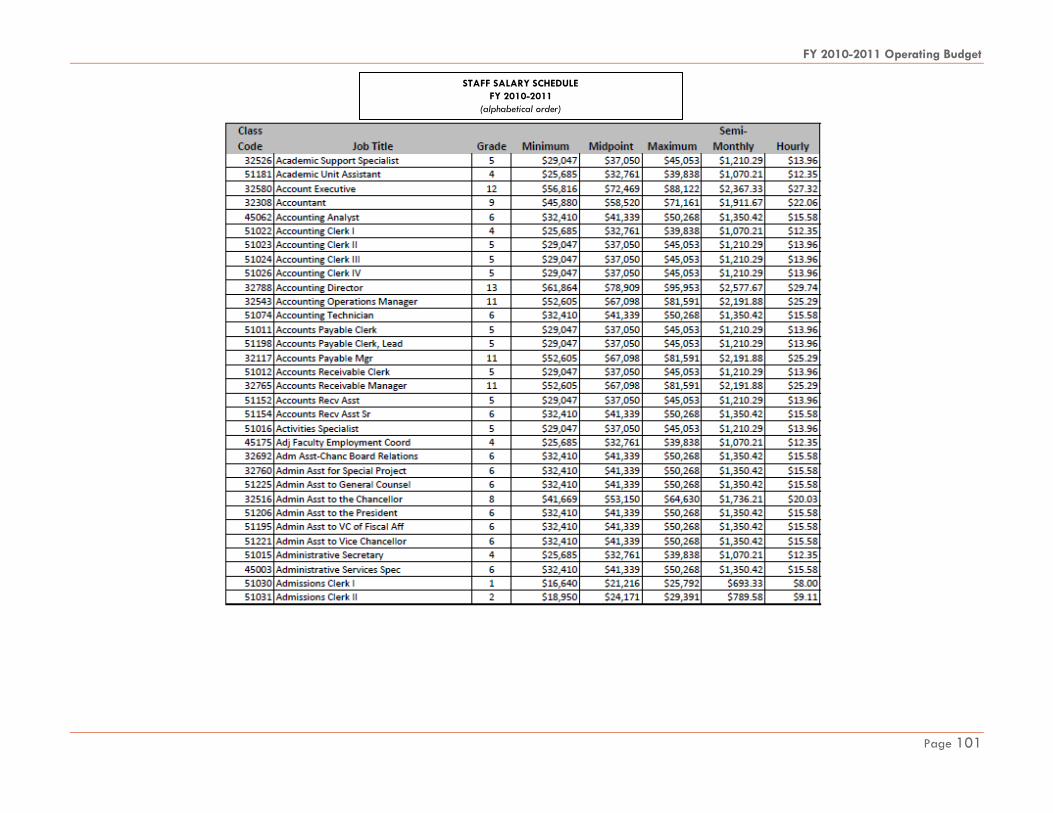
FY 2010-2011 Operating Budget
Page 101
STAFF SALARY SCHEDULE
FY 2010-2011
(alphabetical order)
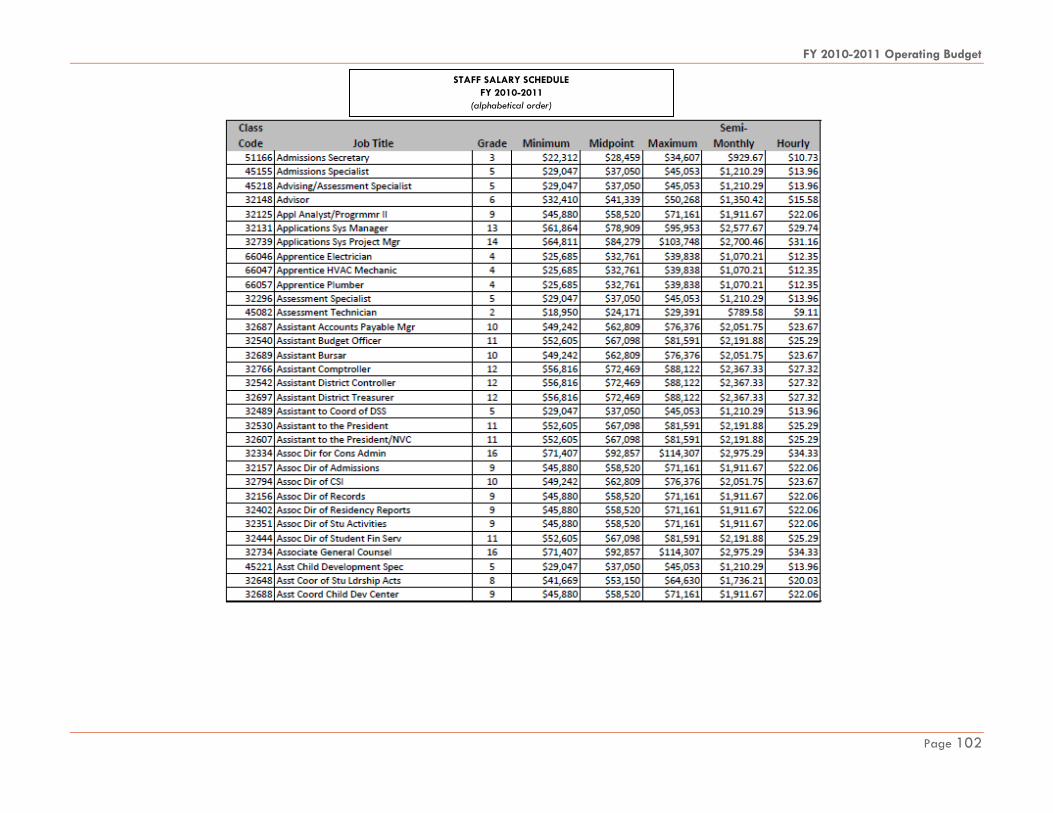
FY 2010-2011 Operating Budget
Page 102
STAFF SALARY SCHEDULE
FY 2010-2011
(alphabetical order)

FY 2010-2011 Operating Budget
Page 103
STAFF SALARY SCHEDULE
FY 2010-2011
(alphabetical order)

FY 2010-2011 Operating Budget
Page 104
STAFF SALARY SCHEDULE
FY 2010-2011
(alphabetical order)
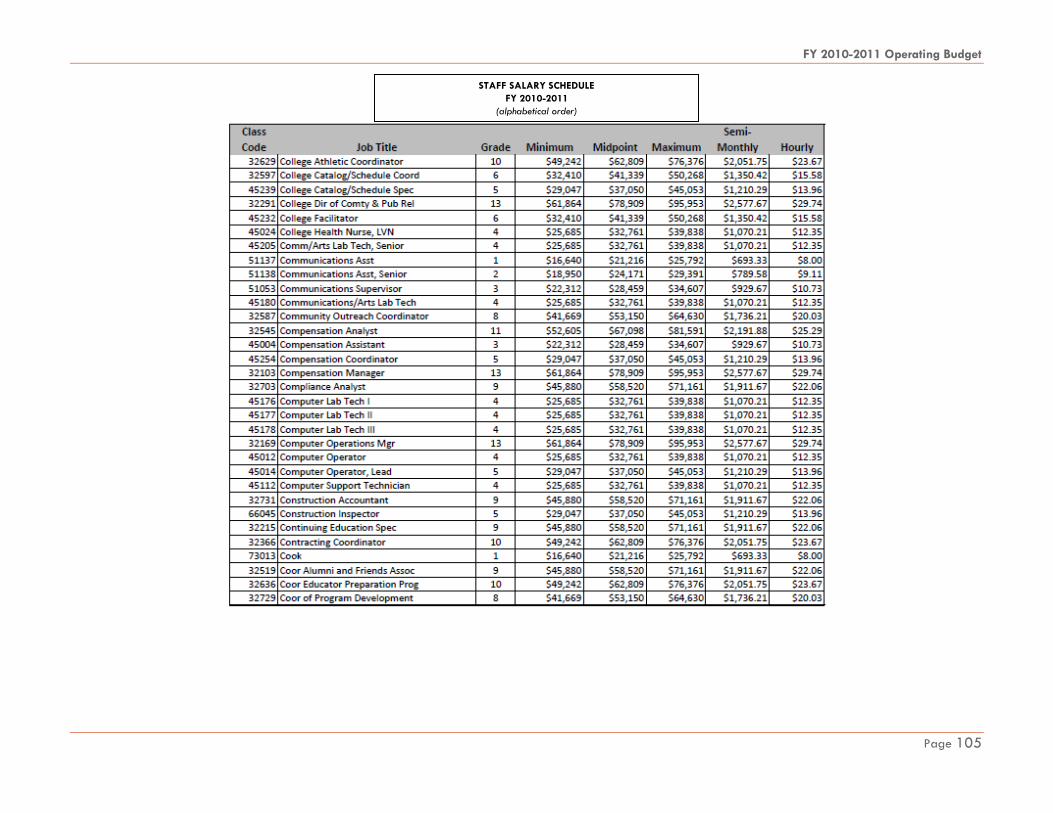
FY 2010-2011 Operating Budget
Page 105
STAFF SALARY SCHEDULE
FY 2010-2011
(alphabetical order)

FY 2010-2011 Operating Budget
Page 106
STAFF SALARY SCHEDULE
FY 2010-2011
(alphabetical order)

FY 2010-2011 Operating Budget
Page 107
STAFF SALARY SCHEDULE
FY 2010-2011
(alphabetical order)

FY 2010-2011 Operating Budget
Page 108
STAFF SALARY SCHEDULE
FY 2010-2011
(alphabetical order)

FY 2010-2011 Operating Budget
Page 109
STAFF SALARY SCHEDULE
FY 2010-2011
(alphabetical order)
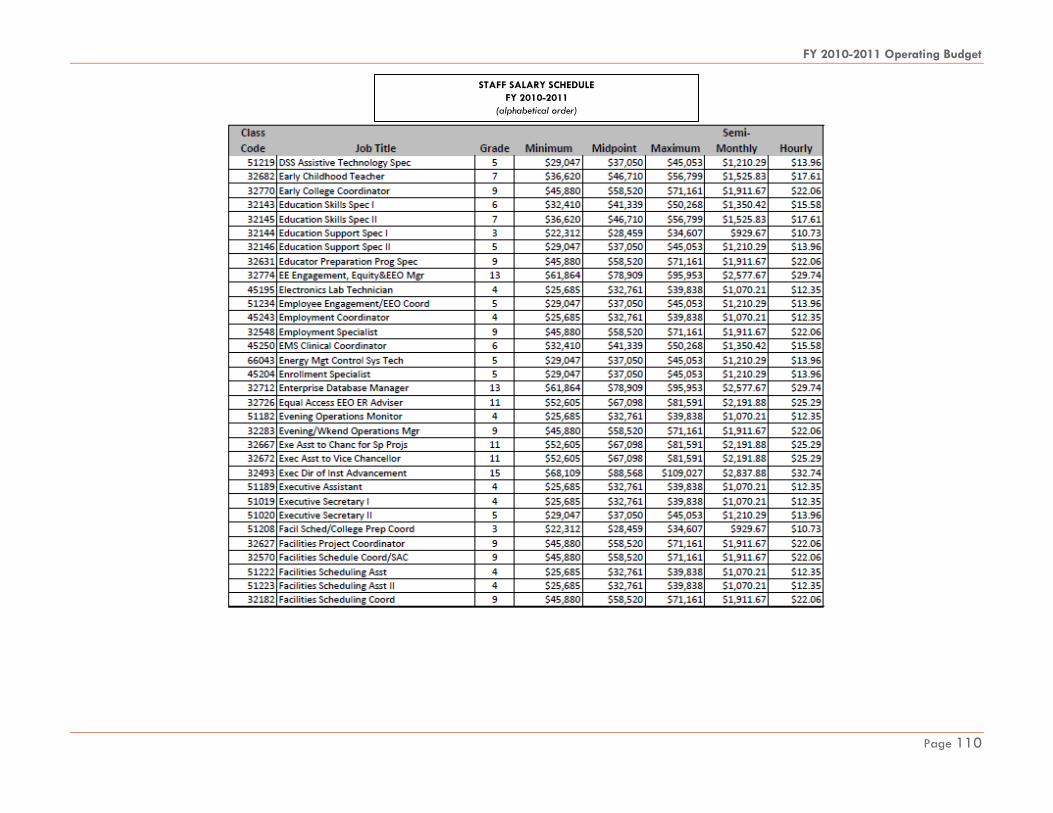
FY 2010-2011 Operating Budget
Page 110
STAFF SALARY SCHEDULE
FY 2010-2011
(alphabetical order)

FY 2010-2011 Operating Budget
Page 111
STAFF SALARY SCHEDULE
FY 2010-2011
(alphabetical order)

FY 2010-2011 Operating Budget
Page 112
STAFF SALARY SCHEDULE
FY 2010-2011
(alphabetical order)

FY 2010-2011 Operating Budget
Page 113
STAFF SALARY SCHEDULE
FY 2010-2011
(alphabetical order)
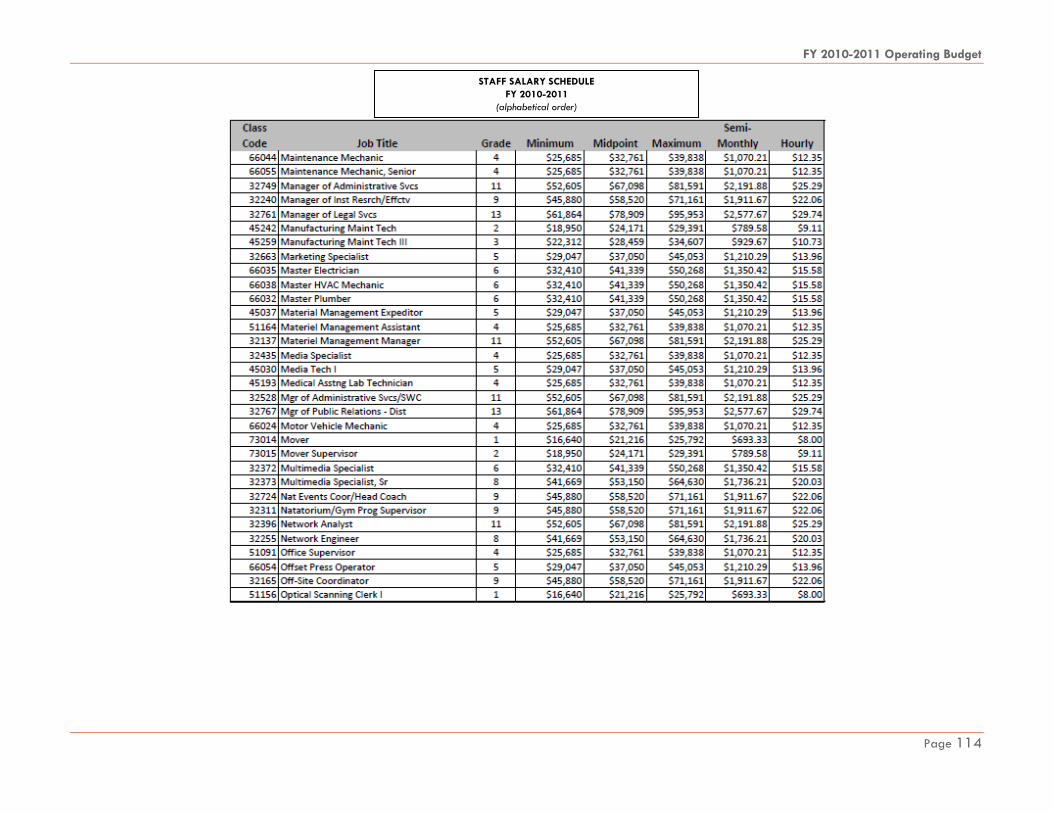
FY 2010-2011 Operating Budget
Page 114
STAFF SALARY SCHEDULE
FY 2010-2011
(alphabetical order)

FY 2010-2011 Operating Budget
Page 115
STAFF SALARY SCHEDULE
FY 2010-2011
(alphabetical order)

FY 2010-2011 Operating Budget
Page 116
STAFF SALARY SCHEDULE
FY 2010-2011
(alphabetical order)

FY 2010-2011 Operating Budget
Page 117
STAFF SALARY SCHEDULE
FY 2010-2011
(alphabetical order)
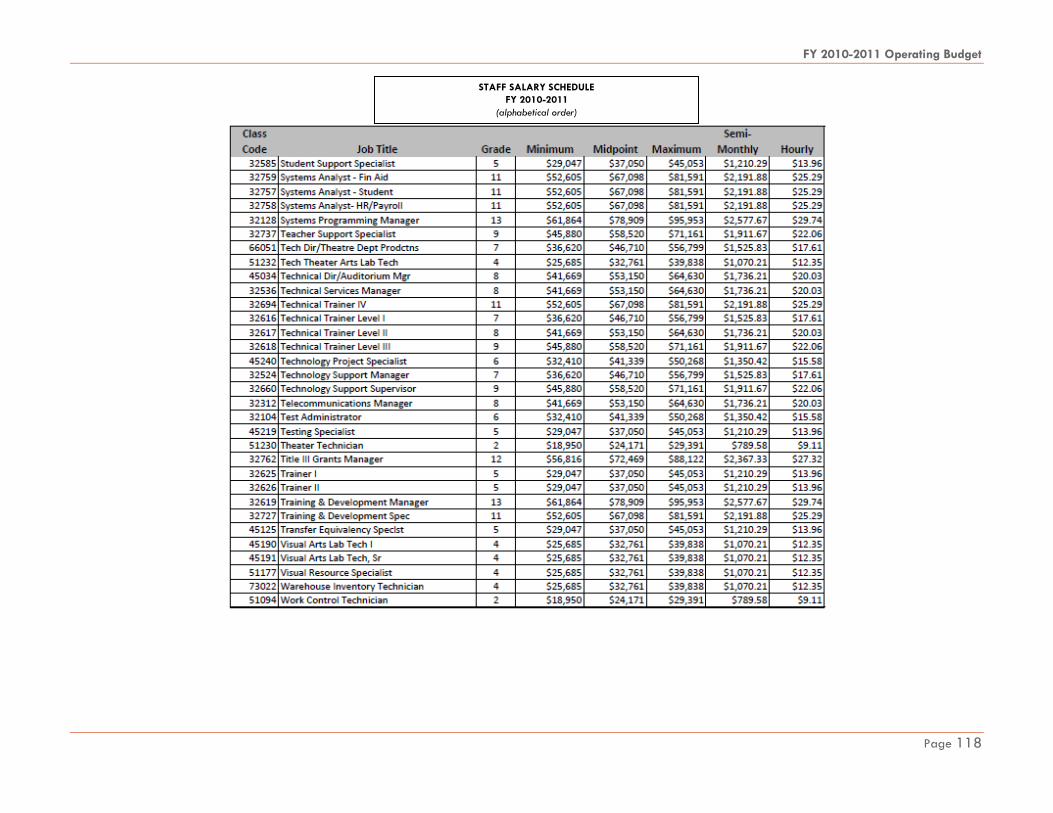
FY 2010-2011 Operating Budget
Page 118
STAFF SALARY SCHEDULE
FY 2010-2011
(alphabetical order)

FY 2010-2011 Operating Budget
Page 119
STAFF SALARY SCHEDULE
FY 2010-2011
(alphabetical order)

FY 2010-2011 Operating Budget
Page 120
Financial Policies and Procedures
C.1.4 (Policy) Budget Responsible Department: Vice Chancellor for Finance and Administration Board Adoption: 8-18-09 Last Board Action: 8-18-09 Annual Budget
The fiscal year for the College District shall begin on September 1 and end on August 31. The Board shall annually adopt a budget on or before September 1 of each year, providing authority to expend funds in accordance with state law, College District policy, and the College District‘s approved procedures. Scope
This policy and Procedure C.1.4.1 apply only to the annual College District current unrestricted funds budget. Budget Principles
The budget shall be developed to support the goals of the Board-approved strategic plan of the College District for the academic year stated in fiscal terms. The following principles shall be adhered to in developing the annual budget:
1. In preparing and passing the budget, the administration and Board shall strive to distribute funds in a manner that is aligned with the College District strategic plan to the maximum extent possible. The budget shall reflect an equitable allocation of resources among the many college and district services functions supporting the goals of the strategic plan.
2. The budget shall identify sufficient sources of funds to ensure a fiscally balanced budget.
3. The budget shall reasonably provide for contingencies to meet unforeseen demands.
4. The administration shall provide the Board with key indicators to assist the Board in its deliberations. Budget Adjustments and Reallocations
Budget adjustments (movement of budget between accounts) and reallocations of reserve/pooled budget accounts are allowed to support operations and to facilitate implementation of the College District strategic plan.
Line Item Groups
a. Instructional and General (―I & G‖): Instruction, Academic Support, Student Services, Institutional Support, and Operation and Maintenance of Plant;
b. Public Service;
c. Scholarships and Exemptions; and
d. Auxiliary Enterprises.
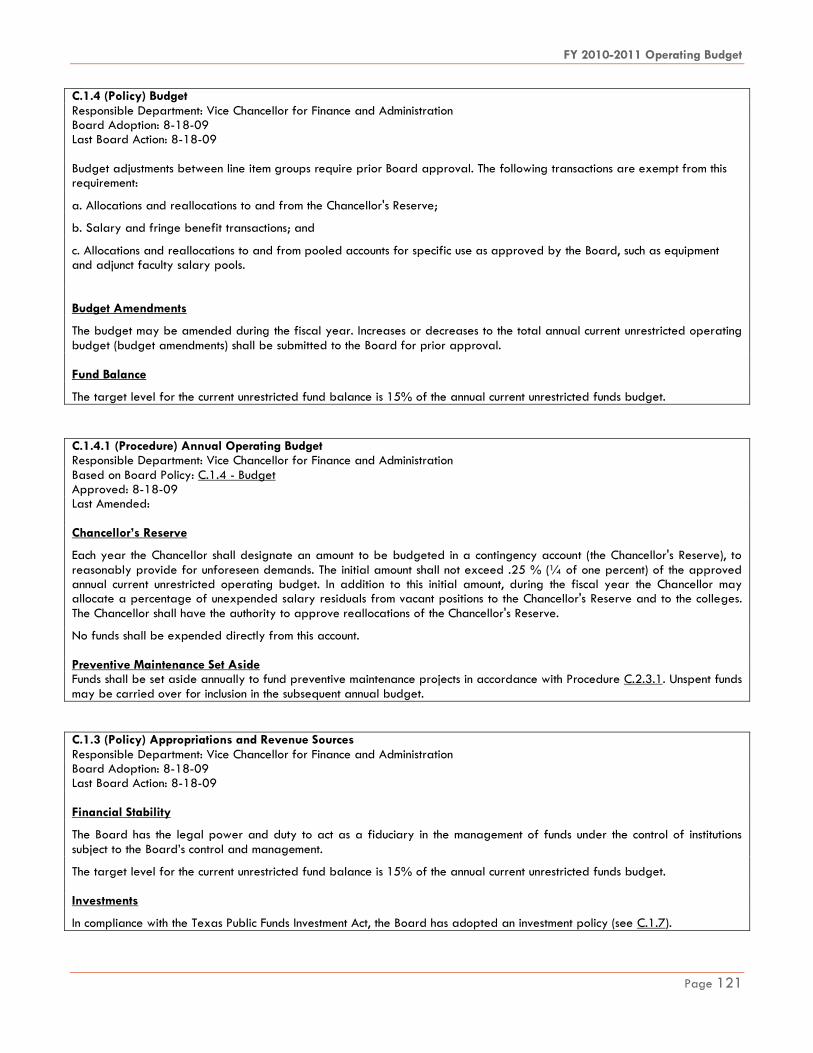
FY 2010-2011 Operating Budget
Page 121
C.1.4 (Policy) Budget Responsible Department: Vice Chancellor for Finance and Administration Board Adoption: 8-18-09 Last Board Action: 8-18-09
Budget adjustments between line item groups require prior Board approval. The following transactions are exempt from this requirement:
a. Allocations and reallocations to and from the Chancellor's Reserve;
b. Salary and fringe benefit transactions; and
c. Allocations and reallocations to and from pooled accounts for specific use as approved by the Board, such as equipment and adjunct faculty salary pools. Budget Amendments
The budget may be amended during the fiscal year. Increases or decreases to the total annual current unrestricted operating budget (budget amendments) shall be submitted to the Board for prior approval. Fund Balance
The target level for the current unrestricted fund balance is 15% of the annual current unrestricted funds budget.
C.1.4.1 (Procedure) Annual Operating Budget Responsible Department: Vice Chancellor for Finance and Administration Based on Board Policy: C.1.4 - Budget Approved: 8-18-09 Last Amended: Chancellor’s Reserve
Each year the Chancellor shall designate an amount to be budgeted in a contingency account (the Chancellor's Reserve), to reasonably provide for unforeseen demands. The initial amount shall not exceed .25 % (¼ of one percent) of the approved annual current unrestricted operating budget. In addition to this initial amount, during the fiscal year the Chancellor may allocate a percentage of unexpended salary residuals from vacant positions to the Chancellor's Reserve and to the colleges. The Chancellor shall have the authority to approve reallocations of the Chancellor's Reserve.
No funds shall be expended directly from this account. Preventive Maintenance Set Aside Funds shall be set aside annually to fund preventive maintenance projects in accordance with Procedure C.2.3.1. Unspent funds may be carried over for inclusion in the subsequent annual budget.
C.1.3 (Policy) Appropriations and Revenue Sources Responsible Department: Vice Chancellor for Finance and Administration Board Adoption: 8-18-09 Last Board Action: 8-18-09 Financial Stability
The Board has the legal power and duty to act as a fiduciary in the management of funds under the control of institutions subject to the Board‘s control and management.
The target level for the current unrestricted fund balance is 15% of the annual current unrestricted funds budget. Investments
In compliance with the Texas Public Funds Investment Act, the Board has adopted an investment policy (see C.1.7).

FY 2010-2011 Operating Budget
Page 122
Donations and Grants from Private Sources
The authority to accept and receive donations and grants from private sources on behalf of any college of the College District, or the College District as a whole shall be vested solely with the Board, and all bequests of property for the benefit of the College District shall vest in the Board, except to the extent that the Alamo Colleges Foundation serves as the official fund-raising and endowment arm of the College District for all donations and grants from private sources.
When not specified by the grantor, funds or other property donated, or the income there from, may be expended in any manner authorized by law and College District policy. The Chancellor shall make recommendations to the Board regarding the acceptance of gifts and donations. Facilities Use
The grounds and facilities of the College District shall be used for the educational goals and purposes of the College District as set forth by the Board. Such uses, as determined by the Board, the Chancellor, and the respective college President, have priority over any other use of College District facilities.
The grounds and facilities of the College District shall be made available to members of the College District community, including students and their respective registered organizations, when such use does not conflict with normally scheduled activities, or any College District policies or procedures. The requesting student(s) or student organization shall pay all expenses incurred by their use of the facilities. Such expenses are limited to the cost of required College District custodial, security, and building staffs.
Leasing or rental of College District facilities, in support of community needs and programs, is permitted, provided that such use does not interfere with College District operations and is consistent with the College District‘s public purpose. The College District shall establish a schedule of rates, competitive with the current market. The setting of rates shall at all times employ processes and practices consistent with those in the realty market to ensure that the College District receives fair and accurate market value for use of its property and services. Sale of College District Real Estate
All sales of College District real estate are subject to prior Board approval. Depository of Funds
The depository officially designated by the Board shall be the sole depository for College District funds. All deposits shall be in accordance with the depository agreement, the College District investment policy, and state law. Ad Valorem Taxes
To provide funds, the Board shall be authorized to levy and pledge annual ad valorem taxes sufficient to pay the principal of and interest on bonds for construction and equipment, for the maintenance of the College District.
For information on tax abatements and tax increment financing see C.1.10.
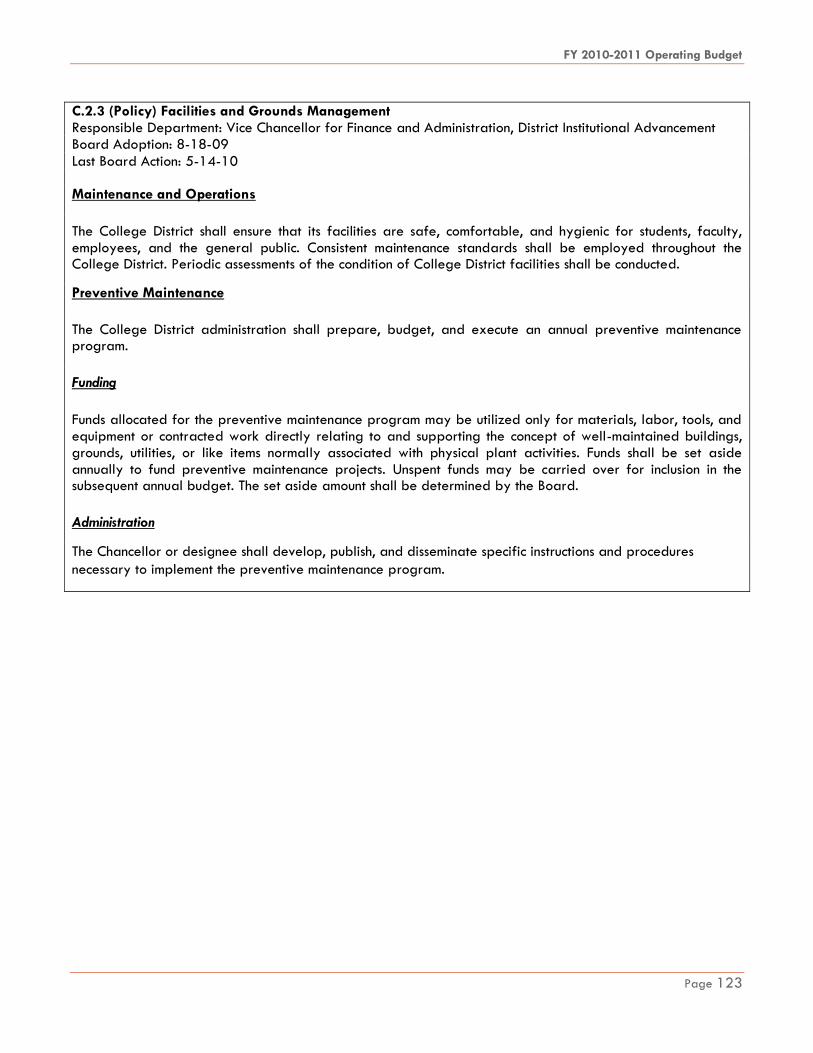
FY 2010-2011 Operating Budget
Page 123
C.2.3 (Policy) Facilities and Grounds Management Responsible Department: Vice Chancellor for Finance and Administration, District Institutional Advancement Board Adoption: 8-18-09
Last Board Action: 5-14-10 Maintenance and Operations
The College District shall ensure that its facilities are safe, comfortable, and hygienic for students, faculty, employees, and the general public. Consistent maintenance standards shall be employed throughout the College District. Periodic assessments of the condition of College District facilities shall be conducted.
Preventive Maintenance
The College District administration shall prepare, budget, and execute an annual preventive maintenance program.
Funding
Funds allocated for the preventive maintenance program may be utilized only for materials, labor, tools, and equipment or contracted work directly relating to and supporting the concept of well-maintained buildings, grounds, utilities, or like items normally associated with physical plant activities. Funds shall be set aside annually to fund preventive maintenance projects. Unspent funds may be carried over for inclusion in the subsequent annual budget. The set aside amount shall be determined by the Board.
Administration
The Chancellor or designee shall develop, publish, and disseminate specific instructions and procedures
necessary to implement the preventive maintenance program.
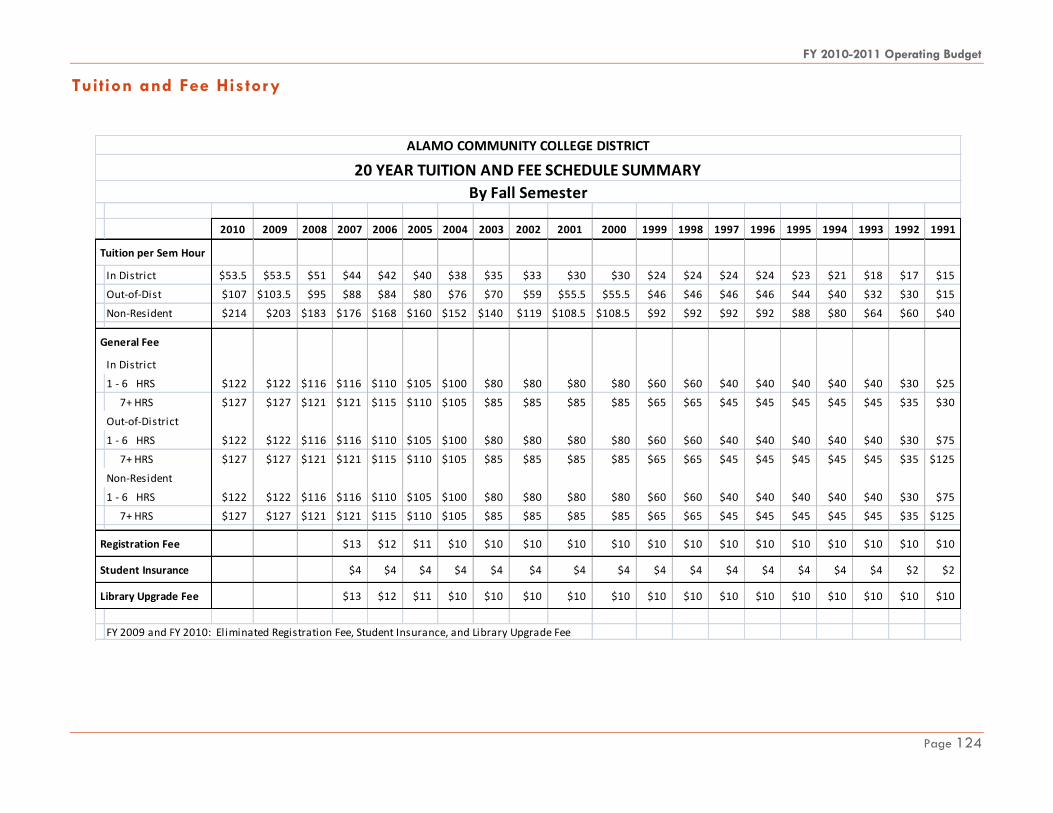
FY 2010-2011 Operating Budget
Page 124
Tuition and Fee History
ALAMO COMMUNITY COLLEGE DISTRICT
20 YEAR TUITION AND FEE SCHEDULE SUMMARY
By Fall Semester
2010 2009 2008 2007 2006 2005 2004 2003 2002 2001 2000 1999 1998 1997 1996 1995 1994 1993 1992 1991
Tuition per Sem Hour
In District $53.5 $53.5 $51 $44 $42 $40 $38 $35 $33 $30 $30 $24 $24 $24 $24 $23 $21 $18 $17 $15
Out-of-Dist $107 $103.5 $95 $88 $84 $80 $76 $70 $59 $55.5 $55.5 $46 $46 $46 $46 $44 $40 $32 $30 $15
Non-Resident $214 $203 $183 $176 $168 $160 $152 $140 $119 $108.5 $108.5 $92 $92 $92 $92 $88 $80 $64 $60 $40
General Fee
In District
1 - 6 HRS $122 $122 $116 $116 $110 $105 $100 $80 $80 $80 $80 $60 $60 $40 $40 $40 $40 $40 $30 $25
7+ HRS $127 $127 $121 $121 $115 $110 $105 $85 $85 $85 $85 $65 $65 $45 $45 $45 $45 $45 $35 $30
Out-of-District
1 - 6 HRS $122 $122 $116 $116 $110 $105 $100 $80 $80 $80 $80 $60 $60 $40 $40 $40 $40 $40 $30 $75
7+ HRS $127 $127 $121 $121 $115 $110 $105 $85 $85 $85 $85 $65 $65 $45 $45 $45 $45 $45 $35 $125
Non-Resident
1 - 6 HRS $122 $122 $116 $116 $110 $105 $100 $80 $80 $80 $80 $60 $60 $40 $40 $40 $40 $40 $30 $75
7+ HRS $127 $127 $121 $121 $115 $110 $105 $85 $85 $85 $85 $65 $65 $45 $45 $45 $45 $45 $35 $125
Registration Fee $13 $12 $11 $10 $10 $10 $10 $10 $10 $10 $10 $10 $10 $10 $10 $10 $10
Student Insurance $4 $4 $4 $4 $4 $4 $4 $4 $4 $4 $4 $4 $4 $4 $4 $2 $2
Library Upgrade Fee $13 $12 $11 $10 $10 $10 $10 $10 $10 $10 $10 $10 $10 $10 $10 $10 $10
FY 2009 and FY 2010: Eliminated Registration Fee, Student Insurance, and Library Upgrade Fee

FY 2010-2011 Operating Budget
Page 125
Enrollment Repor ts
Annual Unduplicated Headcount (Includes Credit and Non-Credit Students)
FY 2005 FY 2006 FY 2007 FY 2008 FY 2009 FY 2010 San Antonio College 36,583 35,198 35,587 36,018 38,175 40,122
St. Philips College 16,801 16,516 16,013 16,294 17,165 18,661
Palo Alto College 13,064 12,409 12,701 15,560 14,443 14,733
Northwest Vista College 13,845 13,308 15,113 16,302 19,094 22,518
Northeast Lakeview College * * * 449 1,011 1,551
Alamo Colleges
(Unduplicated Count) 77,448 75,646 76,619 81,216 86,099 93,218
Very Large Texas Community Colleges
(Unduplicated Count) 674,052 680,374 704,342 736,820 791,603 *
Texas Community Colleges System (Unduplicated
Count) 1,109,578 1,110,236 1,146,439 1,186,375 1,252,987 *
Source: THECB Accountability System
* Not Available Prepared by: Institutional Research and Effectiveness Services (IRES)
Annual Semester Credit Hours (SCH)
FY 2005 FY 2006 FY 2007 FY 2008 FY 2009 FY 2010
San Antonio College 448,502 432,394 440,478 442,200 459,318 515,922
St. Philips College 230,219 213,154 208,012 205,860 210,234 231,397
Palo Alto College 164,283 162,557 157,694 156,547 158,843 171,425
Northwest Vista College 174,096 179,600 193,397 207,810 240,456 293,105
Northeast Lakeview College * * * 3,886 8,938 10,829
Alamo Colleges
(Unduplicated Count) 1,017,100 987,705 999,581 1,016,303 1,077,789 1,222,678
Very Large Texas Community Colleges
(Unduplicated Count) 6,680,203 6,694,437 6,824,567 7,073,472 7,610,826 *
Texas Community Colleges System
(Unduplicated Count) 11,180,460 11,086,138 11,239,108 11,543,250 12,293,123 *
Source: THECB Accountability System * Not Available Prepared by: Institutional Research and Effectiveness Services (IRES)

FY 2010-2011 Operating Budget
Page 126
Campus Locations
Northeast Lakeview College 1201 Kitty Hawk Rd. Universal City, TX 78148
(210) 486-5000
Northwest Vista College 3535 N. Ellison Dr. San Antonio, TX 78251
(210) 486-4000
Palo Alto College 1400 Villaret Blvd. San Antonio, TX 78224 (210) 486-3000
San Antonio College 1300 San Pedro Ave. San Antonio, TX 78212-4299 (210) 486-0000
Southwest Campus 800 Quintana Road San Antonio, Texas 78211
(210) 486-7000
St. Philip's College 1801 Martin Luther King Dr. San Antonio, TX 78203
(210) 486-2000
District Office - Houston Street
811 W. Houston St. San Antonio, TX 78207
District Office - Sheridan
201 W. Sheridan San Antonio, TX 78204

FY 2010-2011 Operating Budget
Page 127
FY11 Budget-Rela ted Board Minute Orders/Approved Minutes

FY 2010-2011 Operating Budget
Page 128

FY 2010-2011 Operating Budget
Page 129

FY 2010-2011 Operating Budget
Page 130

FY 2010-2011 Operating Budget
Page 131

FY 2010-2011 Operating Budget
Page 132

FY 2010-2011 Operating Budget
Page 133

FY 2010-2011 Operating Budget
Page 134
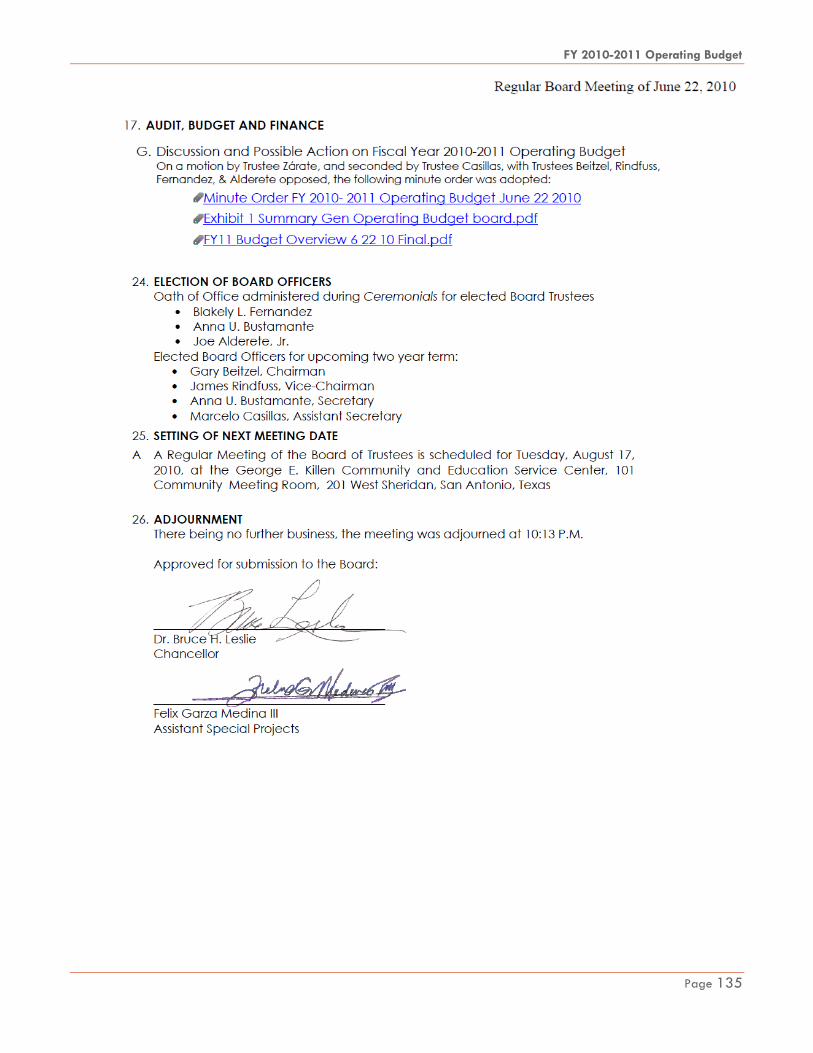
FY 2010-2011 Operating Budget
Page 135
FY 2010-2011 Operating Budget
Page 136

FY 2010-2011 Operating Budget
Page 137

FY 2010-2011 Operating Budget
Page 138

FY 2010-2011 Operating Budget
Page 139

FY 2010-2011 Operating Budget
Page 140
FY 2010-2011 Operating Budget
Page 141

FY 2010-2011 Operating Budget
Page 142

FY 2010-2011 Operating Budget
Page 143
FY 2010-2011 Operating Budget
Page 144

FY 2010-2011 Operating Budget
Page 145
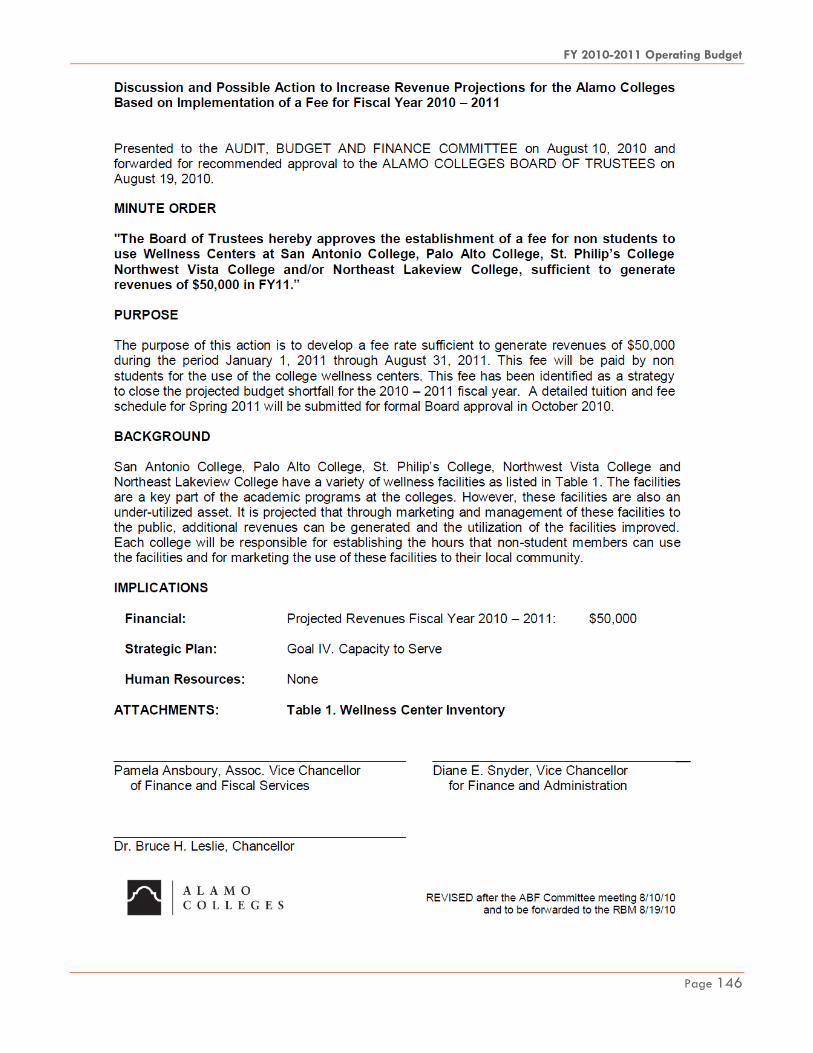
FY 2010-2011 Operating Budget
Page 146

FY 2010-2011 Operating Budget
Page 147

FY 2010-2011 Operating Budget
Page 148

FY 2010-2011 Operating Budget
Page 149

FY 2010-2011 Operating Budget
Page 150

FY 2010-2011 Operating Budget
Page 151
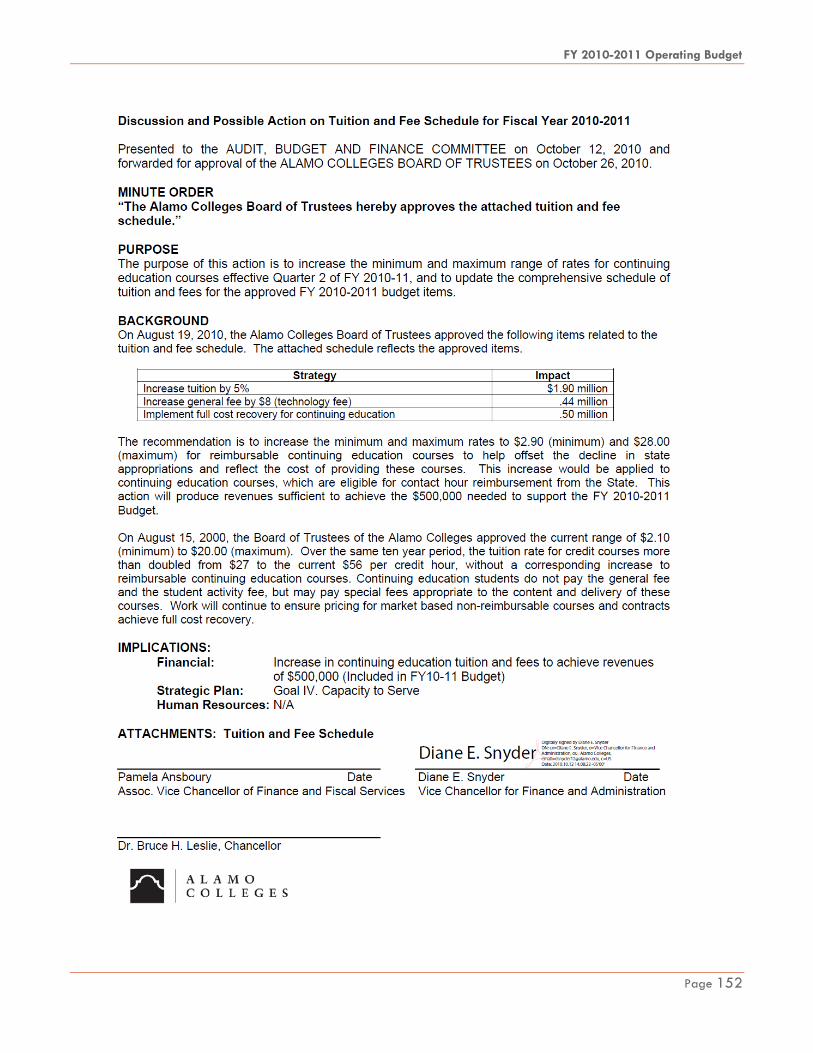
FY 2010-2011 Operating Budget
Page 152
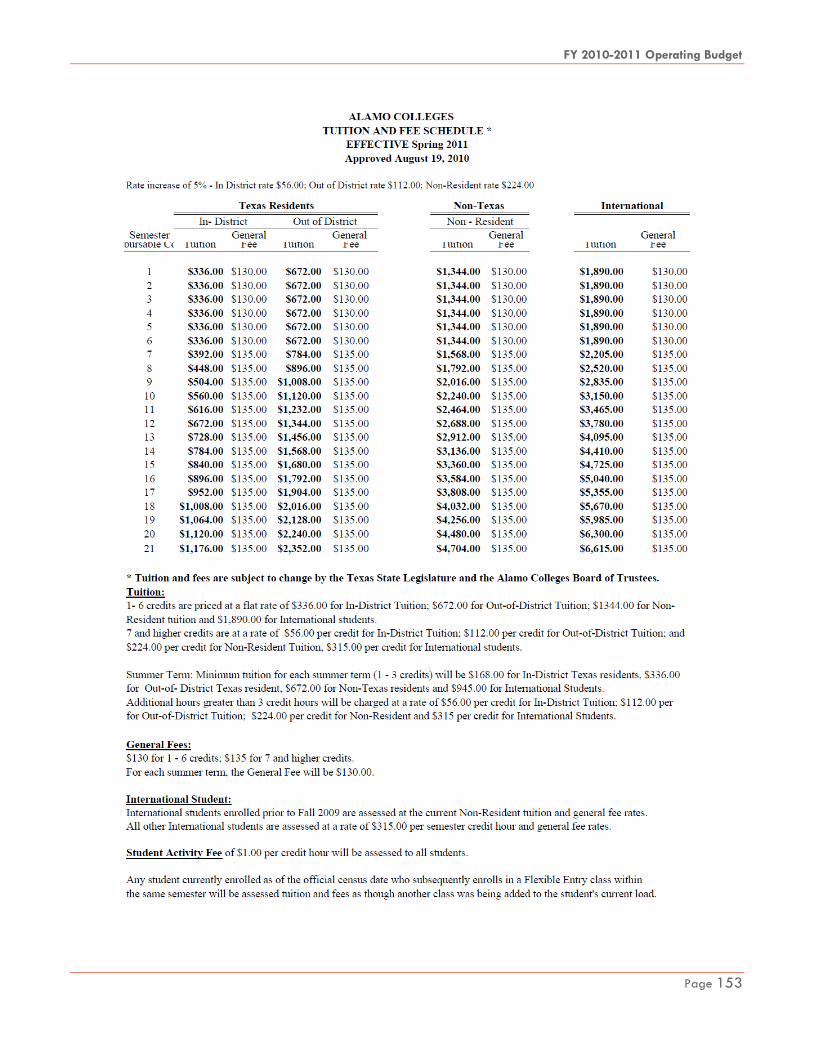
FY 2010-2011 Operating Budget
Page 153
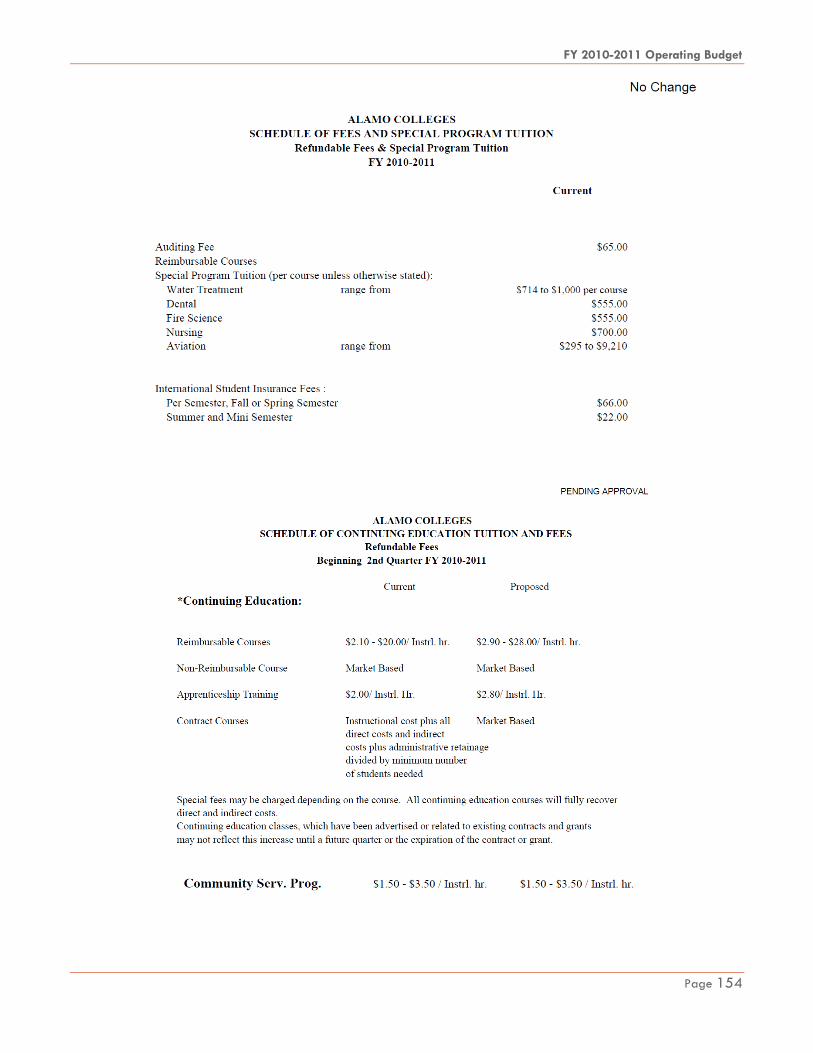
FY 2010-2011 Operating Budget
Page 154

FY 2010-2011 Operating Budget
Page 155

FY 2010-2011 Operating Budget
Page 156
Glossary
The terms included in this glossary are intended to serve as a general and basic reference for the material
contained in the budget document. It is not an all inclusive or a comprehensive glossary.
Academic Support Function – This function should include funds expended primarily to provide support
services for the institution‘s primary mission – instruction, research, and public service. It includes: (1) the
retention, preservation, and display of educational materials such as libraries, museums, and galleries; (2)
academic administration such as dean‘s salaries and office expenses; (3) technical support such as computer
services and audio-visual information; and (4) separately budgeted support for course and curriculum
development and related items.
Accountability – Accountability is the obligation to explain the institution‘s action, to justify what the institution
does, to justify to the citizenry and other interested parties the rationale for raising resources, and an
explanation for the expenditure of those resources.
Accounting Period –-The accounting period is a time period that is reflected in a set of financial statements.
Accounts Payable – Payables are amounts owed for goods or services actually rendered or provided to the
institution, but for which the agency has not yet made payment.
Accounts Receivables – Receivables are amounts owed to the institution from private persons or
organizations for goods and services furnished.
Accrual Basis – Basis of accounting under which revenues are recognized and recorded when earned and
expenses are recognized and recorded when they become a legal obligation or liability.
Accrued Expenses – An expense incurred during the accounting period but not paid or recorded.
Accrued Interest – Accrued interest is interest earned but not yet paid.
Accrued Liabilities – Accrued liabilities are those amounts owed but not yet paid.
Accrued Revenue – Revenue that has been earned during the fiscal year but not received or recorded.
Accumulated Depreciation – The amount of depreciation expense that has been recognized for capital
assets, or class of assets, to date.
Ad valorem – In proportion to value - basis for property tax levy
All Funds Budget Report – Provides detailed information for all revenues and expenditures received and
expended by the Alamo Colleges.
Annual Unduplicated Headcount – Total number of students enrolled with each student counted only once
during the entire academic year. For example, a student who enrolled in two or more semesters during the
year is counted only once. For district totals, students who enrolled at more than one of the Alamo Colleges
and in more than one term are counted once.
Assessed Valuation – Valuation set on real estate or other property as the basis of levying taxes.
Audit – Examination of documents, records, reports, internal control systems, accounting and financial
procedures and other evidence and the issuance of a report relating to the examination.

FY 2010-2011 Operating Budget
Page 157
Auxiliary Enterprise – Category of expenses that includes all expenses related to the operation of auxiliary
enterprises including expenses for operation and maintenance of pant and institutional support.
Auxiliary Enterprise Function – An activity that exists to provide a service to students, faculty or staff and
charges a fee directly related to, although not necessarily equal to, the cost of the service. The activity is
managed as essentially self-supporting.
Award – Credential granted a student for successful completion of a set curriculum such as a degree or
certificate.
Basic Financial Statements – Includes statement of net assets, statement of revenues, expenses and change in
net assets, statement of cash flows and notes to the financial statements.
Bond – A bond is a written promise to pay a specific sum of money, called the face value or principle amount,
at a specified date (or dates) in the future, called the maturity date, and with periodic interest at a rate
specified in the bond. A bond is generally issued for a specific purpose or project, such as construction of a
new facility.
Bond and Interest Fund – (a Debt Service Fund): The Bond and Interest Funds are used to account for
payment of principal, interest, and related charges on any outstanding bonds. Debt service for each bond
issue must be accounted for separately using a group of self-balancing accounts within the fund.
Bonded Debt – Bonded debt is the portion of an issuer‘s total tax-supported debt represented by outstanding
bonds.
Budget – A financial plan that sets forth the estimated expenses for a financial period and the proposed
means to finance them.
Capital Outlay – The purchase or construction of a capital asset that represents an exchange of an asset that
may be spent (cash) for an asset that cannot be spent, thus resulting in a net decrease in current financial
resources.
Cash – Includes currency, coin, checks, money orders, and bank drafts on hand or deposit with a designated
agent or official acting as custodian of deposited funds.
CBM001 – (Student Report) This report includes all students enrolled at the reporting institution in courses (for
which semester credit hours or quarter credit hours are awarded) as of the official census date, which shall be
the 12th class day for the fall and spring semesters (16 week sessions) and the 4th class day for each of the
summer terms (6 week sessions).
CBM004 – (Class Report) This report reflects courses offered as of the official census date which is the 12th
class day for the fall and spring semesters (16 week session) and the 4th class day for each of the summer
terms (6-week session). All higher education institutions may schedule enrollment periods different from the
standard periods noted. This report includes classes in Coordinating Board approved courses for resident
credit.
CBM008 – (Faculty Report) This report includes all personnel who teach a class that generates credit hours
and whose assigned responsibilities are directly related to the teaching function.
Certification/Licensure/Registration – A process sponsored by an agency or association, and designed by
educators in cooperation with business, industry, and/or labor, that validates and/or certifies the skills and
learning experiences of a candidate and enters the name of the successful candidate on a registry.

FY 2010-2011 Operating Budget
Page 158
CIP – Capital Improvement Projects
College of Attendance – Refers to the physical location (College) where a student attends the course.
College of Registration – Refers to the College where a student registers for a course during an academic
year.
Contingency -- Contingency funds are those appropriations set aside for emergencies or unforeseen
expenditures.
Contracts – A negotiated transaction in which both parties to the agreement specify their actions to be
performed.
Contractual Services – Contractual service costs are those monies paid for services rendered by firms and
individuals under contract who are not employees of the Alamo Colleges.
Credit Students – Students enrolled in a course that can be applied to a degree, diploma, certificate or other
formal award.
Debt Service – Interest and matured principal related to outstand debt obligations – may be either the cash
outlay needed or the amount accrued for meeting such payment during any accounting period.
Debt Service Requirements – The amount of the current period‘s principal and interest related to long-term
debt obligations.
Degree – An award conferred by a postsecondary education institution as official recognition for the
successful completion of a program of study.
Developmental Education – Developmental education refers to the range of courses and activities designed
to prepare students to complete credit bearing college level courses successfully.
Distance Education – Courses in which the majority of instruction occurs when the students and instructor are
not in the same physical setting. A distance education course can be delivered synchronously or asynchronously
to any single or multiple locations through electronic modes (e.g., the Internet, video conferencing, television,
etc.), by correspondence, or by other means.
Duplicated Headcount – Students enrolled at more than one college are counted for each college yielding
―duplicated‖ headcount.
Employed and/or Enrolled – Students who have taken a job after graduation or enrolled in higher education
after graduation.
Ethnicity – Ethnic origin of students, faculty or staff.
Fall to Fall Persistence FT FTIC – The rate at which full-time, first-time-in-college, degree-seeking credit
students either persist from the Fall term of entry (at census date) to the Fall term of the following year (at
census date) or earn a degree or certificate before the next fall term.
Fall to Fall Persistence PT FTIC – The rate at which part-time, first-time-in-college, degree-seeking credit
students persist from the Fall term of entry (at census date) to the Fall term of the following year (at census
date).
FY 2010-2011 Operating Budget
Page 159
Fall to Spring Persistence FT FTIC – The rate at which full-time, first-time-in-college, degree-seeking credit
students persist from Fall term of entry (at census date) to the subsequent Spring term (at census date) where
full-time is defined as a student taking 12 or more semester credit hours.
Fall to Spring Persistence PT FTIC – The rate at which part-time, first-time-in-college, degree-seeking credit
students persist from the Fall term of entry (at census date) to the subsequent Spring term (at census date)
where part-time is defined as a student taking less than 12 semester credit hours.
First-Time-in-College Student (FTIC) – An entering student who has never attended any college. Also includes
students who entered with advanced standing (college credits earned before graduation from high school).
Financial Aid – Grants, loans, assistantships, scholarships, fellowships, tuition waivers, tuition discounts,
veteran‘s benefits, employer aid (tuition reimbursement) and other monies provided to students to meet
expenses. This includes Title IV subsidized and unsubsidized loans made directly to students.
Fiscal Year – The period of time beginning September 1 and ending on the following August 31, both dates
inclusive which coincides with the State of Texas‘ fiscal year.
FTE – Full time equivalent.
Full Time Faculty – Tenured, tenure-track, and full-time faculty.
Full-Time Student – Students enrolled for 12 or more credit hours in a semester.
Gender – The gender of a student or faculty or staff member. An ‗M‘ denotes Male and an ‗F‘ denotes
Female.
Graduation Rate – Percentage of a given college-entering, first-time-in-college cohort of degree-seeking
students who graduate in a specific period of time.
Headcount – Number of students in a group by classification.
I&G Operating Budget – The Instruction and General Operating Budget contains all of the revenue and
expenditures associated with providing services and programs relating to instruction and general operating
activities of the College District.
Institutional Support Function – Expenses for (1) central executive level management and long-range
planning of the entire institution; (2) fiscal operations; (3) administrative data processing; (4) space
management; (5) employee personnel and records; (6) logistical activities that provide procurement,
storeroom, safety, security, printing and transportation services to the institution; (7) support services for
faculty and staff that do not operate as auxiliary enterprises; (8) activities concerned with community and
alumni relations, including development and fundraising; and (9) bad debt expense related to tuition and fee
revenue.
Instruction Function – Expenses for all activities that are part of an institution‘s instruction program. This
function includes expenses for credit and non-credit courses, for academic, vocational, and technical
instruction, for development and tutorial instruction, and for regular, special, and extension session.
Investments – The acquisition of interest earning items such as security instruments, equities, debt, U. S.
Government items, property, and other items.
Levy – To impose taxes, assessments or service charges.
FY 2010-2011 Operating Budget
Page 160
Liability – Probable future sacrifices of resources arising from obligations to transfer assets or provide
services in the future as a result of a transaction or event.
NLC – Northeast Lakeview College, one of the Alamo Community Colleges.
NVC – Northwest Vista College, one of the Alamo Community Colleges.
Non-Credit Students – Students enrolled in a higher education technical course offered for continuing
education units and conducted in a competency based format.
Operating Expense – These are expenditures that are incurred as a direct result of the nature of the activity
being reported. These costs are necessary to the maintenance of the institution. An example would be salary
and wages.
Operating Revenue – These are revenues that are derived from the nature of the activity being reported
and directly related to the nature of the activity performed by the entity. An example would be tuition and
course fees.
PAC – Palo Alto College, one of the Alamo Community Colleges.
Part time Faculty – Faculty employed less than 100 percent of time, often referred to as adjuncts.
Part-Time Student – Students who are enrolled in fewer than 12 semester credit hours in a given semester.
Public service function – This function of expenses includes funds expended for activities that are established
primarily to provide non-instructional services beneficial to individuals and groups external to the institution.
Restricted – Constraints stipulated by an external party to the institution. They may be based either on a
specific time or purpose.
Retention Rate Within Term – The rate at which credit students persist within the same term (excludes Fall late
flex, includes dual credit).
Revenue by Source – Funds received from tuition, taxes, state appropriations and other sources.
SAC – San Antonio College, one of the Alamo Community Colleges.
Service Area – The geographical area, or target market, for educational delivery by community/ junior
colleges. The District‘s service area is comprised of Atascosa (50%), Bandera, Comal, Guadalupe (98%),
Kendall, Kerr, and Wilson counties.
Semester Credit Hour (SCH) – Semester Credit Hour is a unit of measure representing an hour (50 minutes) of
instruction over the weeks in a semester.
Student Service Fees – Fees charged for the performance of activities related to student activities not related
to instruction, research or public service.
Student Services Function – This function of expenses should include resources expended for offices of
admissions and the registrar and activities that primarily contribute to students‘ emotional and physical well-
being and to their intellectual, cultural, and social development outside the context of the formal instruction
program.
Taxes – Non-exchange transactions levied or imposed by the institution
FY 2010-2011 Operating Budget
Page 161
Texas Community College System – Refers to all Texas public community colleges.
THECB – The Texas Higher Education Coordinating Board.
THECB Accountability System – Texas Higher Education Coordinating Board Accountability System refers to
an electronic, on-line system used to track performance on critical measures that exemplify higher education
institutions' missions. Its major focus is on the four target areas of participation, success, excellence and
research.
Transfer – A student entering an institution for the first time, but known to have previously attended a
postsecondary institution.
Tuition – Fees charged to students (consumer) for the delivery of instruction credit hour.
Tuition Discount – Tuition not expected to be paid by the student - may be either an internal
scholarship/fellowship or grant resources.
Unrestricted – Resources that have not stipulation as to their use.
Very Large Community College Group – The very large community college districts are located in major
metropolitan areas of Texas. These colleges include: Alamo Community College District, Austin Community
College, Collin County Community College District, Dallas County Community College District, El Paso
Community College, Houston Community College System, Lone Star Community College District, San Jacinto
College District, South Texas College and Tarrant County College District.
Unduplicated count – Student enrolled at more than one of the Alamo Colleges are counted only once in
district-wide totals.
Source: THECB Accountability System, CCSSE Key Performance Indicators, IPEDS, the THECB Budget Requirements and Annual
Financial Reporting Requirements for Texas Community and Junior Colleges Manual and the Institutional Research and Effectiveness
Services (IRES) Department-the Alamo Colleges.

FY2010-2011 Operating Budget
Published and distributed by the Finance and Fiscal Services Department
811 W. Houston Street, San Antonio, Texas 78207-3033
http://www.alamo.edu
(210)485-0301
(


