Futures Resource Expansion & Siting Review for MTEP21
25
Planning Advisory Committee August 12, 2020 Futures Resource Expansion & Siting Review for MTEP21 1
Transcript of Futures Resource Expansion & Siting Review for MTEP21

Planning Advisory Committee
August 12, 2020
Futures Resource Expansion & Siting Review for MTEP21
1

Purpose:
• Review draft resource expansion results
and siting to be used in MTEP21
• Discuss and request feedback from
stakeholders
Key Takeaways:
• Projected resource expansion ranged
between 148 GW (F1) to 352 GW (F3)
• Primarily consisting of gas, solar, & wind
2
ExecutiveSummary

Recap of new MISO Futures’ key assumptions
3
* Entire footprint in aggregate** 2005-2017; MISO calculation from EIA Form 860 data^ Compound annual growth rate (CAGR); does not include impact from DERs, DSM, or Wind/Solar
^^ Distributed Energy Resources (DER); Demand Response (DR); Energy Efficiency (EE);
Distributed Generation (DG): Capacity technical potential offered into EGEAS as resources;
final amounts selected to be determined by EGEAS simulations.

MTEP21 Nameplate Capacity Additions(through 2040)
4
Resource Future 1 Future 2 Future 3
CC 21.6 36.0 28.8
CT 28.8 18.0 18.0
CCS 0.0 0.0 28.8
Wind 28.8 28.8 97.2
Solar 43.2 64.8 108.0
Hybrid 0.0 10.8 32.4
Battery 0.0 1.0 10.0
Distributed PV 2.1 2.1 1.0
Demand Response 0.0 0.0 3.9
Energy Efficiency 6.4 6.7 6.8
IRPs 16.7 16.7 16.7
Resource Future 1 Future 2 Future 3
Coal 45.9 46.2 49.3
Gas 19.9 22.0 54.7
Nuclear 1.3 1.3 1.3
Oil 2.0 2.1 2.4
Hydro 0.0 0.0 0.0
Wind 10.3 10.3 10.3
Solar 0.0 0.0 0.0
Other 0.0 0.0 0.0
GW Retirements per Future
GW Additions per Future

Energy Projections by Future(through 2040)
51. Energy mix outputs from EGEAS do not consider transmission constraints2. Carbon emissions reduction (CER) from 2005 baseline
76%
13%
7% 4%
Future 2Companies/states meet their goals, mandates, etc. Footprint-wide CER2 of 60% by 2040. Energy increases 30% footprint-wide by 2040, driven by electrification.
Future 1Footprint develops in line with 100% of utility IRPs and 85% of utility/state announcements, etc. Emissions decline as an outcome of utility plans. Load growth consistent with trends.
2005
2040 Future Scenarios1
2019
Future 3Changing federal and state policies support footprint-wide CER of 80% by 2040. Increased electrification drives a footprint-wide 50% increase in energy by 2040.
40%
21%10%
10%
12%
4%3%
44%
18%
15%
5%
10%
4% 3%
34%
31%
19%
1%7%
3% 2%3%
17%
39%
32%
9%3%

Future 1 Total EGEAS Expansion Results
6
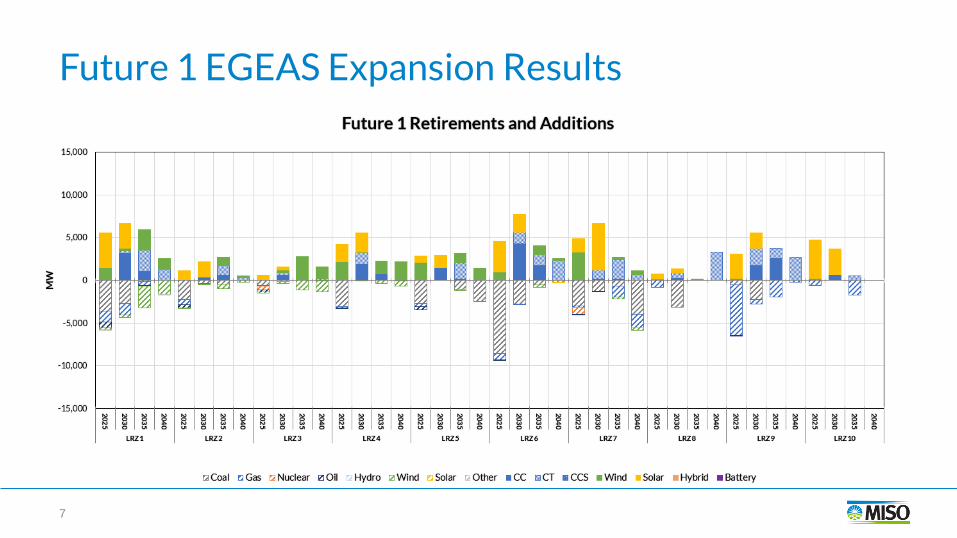
Future 1 EGEAS Expansion Results
7

8

9

10

Future 2 Total EGEAS Expansion Results
11

Future 2 EGEAS Expansion Results
12

13

14

15

Future 3 Total EGEAS Expansion Results
16

Future 3 EGEAS Expansion Results
17

18

19

20

Response to Feedback – CC + CCS
• CC + CCS units have been offered during
previous cycles in the MTEP process.
• Selection of these units was economic for
the first time because of Future 3 carbon
constraints.
• Costs for CC + CCS come from NREL ATB
21

EGEAS Modeling Updates
• Must-run turned off for all three Futures.
• Nuclear units will have contracts renewed
unless retirement is announced.
• Changed unit sizes from 1200MW to 3600MW.
Battery was changed from 100MW to 1000MW.
22

Next Steps
23
Feedback Request:
• Please provide general feedback on the MTEP21 expansion results and
siting by August 28 via the MISO Feedback portal, and send any
questions or attachments to [email protected]

Questions?