Siting Analysis for Plug-in Electric Vehicle Charging Stations in...
43
Siting Analysis for Plug-in Electric Vehicle Charging Stations in the City of Santa Monica J.R. DeShazo, Sam Krumholz, Norman Wong, Jason Karpman
Transcript of Siting Analysis for Plug-in Electric Vehicle Charging Stations in...
Siting Analysis for Plug-in Electric Vehicle Charging Stations in the City of Santa Monica
J.R. DeShazo, Sam Krumholz, Norman Wong, Jason Karpman
Siting Analysis for Plug-in Electric Vehicle Charging Stations in the City of Santa Monica
Authorship
J.R. DeShazo, principal investigator Sam Krumholz, plug-in electric vehicle growth analysis Norman Wong, spatial analysis and cartography Jason Karpman, project manager
About this Document
This document was prepared for the Office of Sustainability and the Environment at the City of Santa Monica by the UCLA Luskin Center for Innovation. It constitutes the final deliverable of contract 3226 between the City of Santa Monica and the UCLA Luskin Center for Innovation, with the purpose of supporting plug-in electric vehicle adoption for Santa Monica residents, and outside commuters, so that the City of Santa Monica can reach its ambitious goal of carbon neutrality by 2050 or sooner.
Acknowledgments
We thank the Southern California Association of Governments (SCAG), particularly Marco Anderson, Kimberly Clark, John Cho, Cheol-Ho Lee, Tom Vo, Ying Zhou, for sharing two of the primary datasets that made much of this analysis possible. We would also like to acknowledge the valuable research support that we received from UCLA graduate students in developing maps and text for this document, namely, Mustafa Ghuneim, Britta McOmber, and Julie Wedig. Lastly, we thank Ariana Vito and Garrett Wong at the City of Santa Monica for the expert guidance in developing a final product that will be of value to planners and policymakers in growing the PEV market, and ultimately working towards the goal of carbon neutrality.
Disclaimer
The UCLA Luskin Center for Innovation appreciates the contributions of the aforementioned individuals and their agencies and organizations. This document, however, does not necessarily reflect their views or anyone else other than those of the authors. Anyone other than the authors make no claims regarding the accuracy or completeness of the information in this report. Any errors are the responsibility of the primary authors.
For More Information
Contact J.R. DeShazo, Director, UCLA Luskin Center for Innovation, [email protected]
© 2017 by the Regents of the University of California, Los Angeles. All rights reserved.
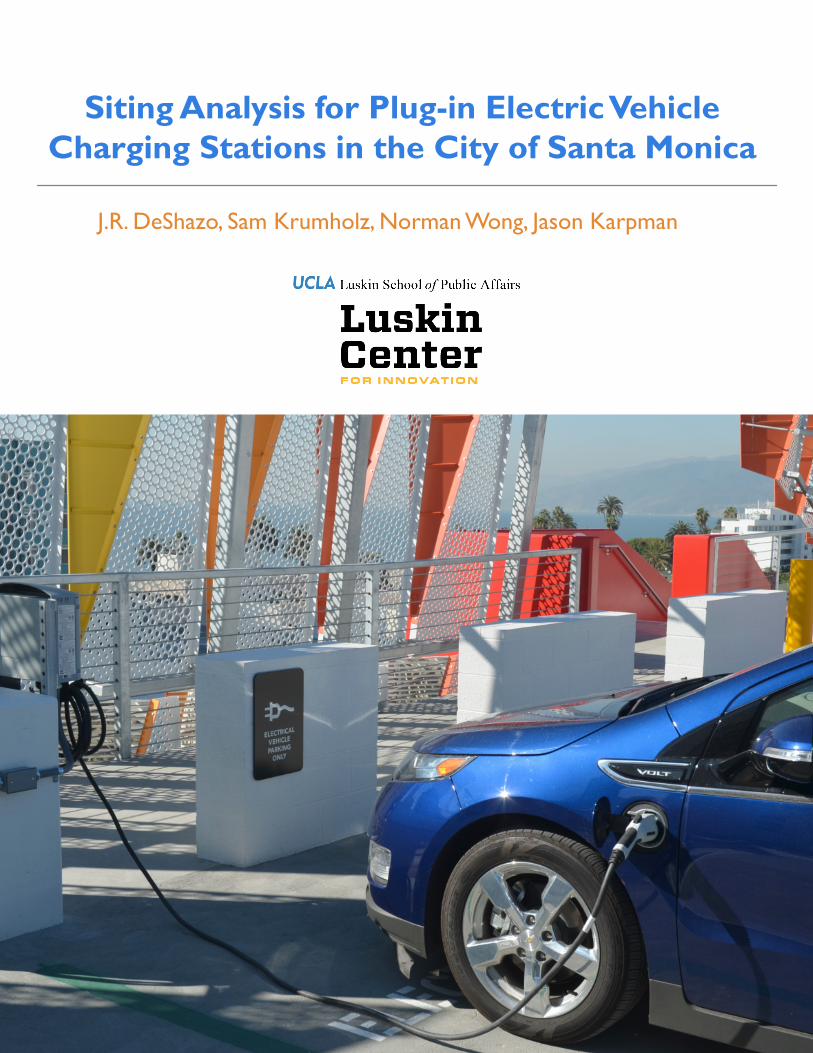
Cover photo courtesy of the City of Santa Monica.
Siting Analysis for PEV Charging Stations in the City of Santa Monica Page 2
Siting Analysis for Plug-in Electric Vehicle Charging Stations in the City of Santa Monica
Table of Contents Executive Summary ................................................................................................................................... 4
Introduction .............................................................................................................................................. 4
Key Findings ........................................................................................................................................... 4
Policy Recommendations ..................................................................................................................... 5
Report Roadmap .................................................................................................................................... 6
Chapter 1: PEV Growth in Santa Monica ............................................................................................... 7
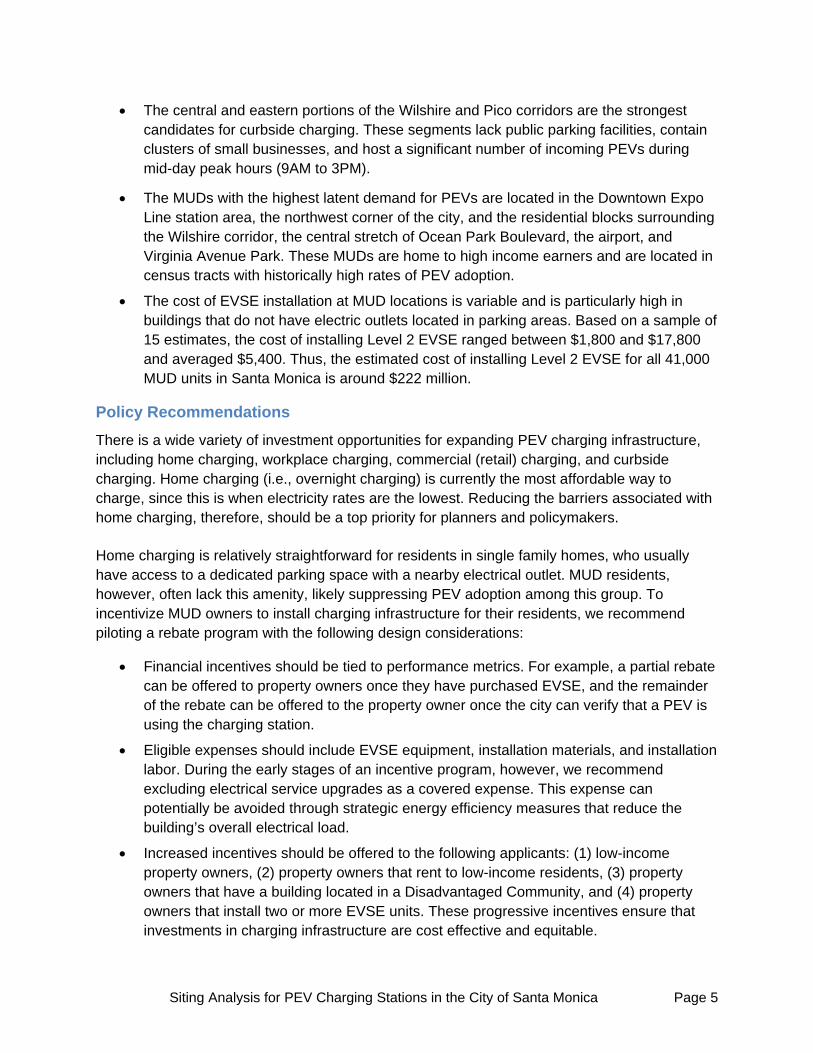
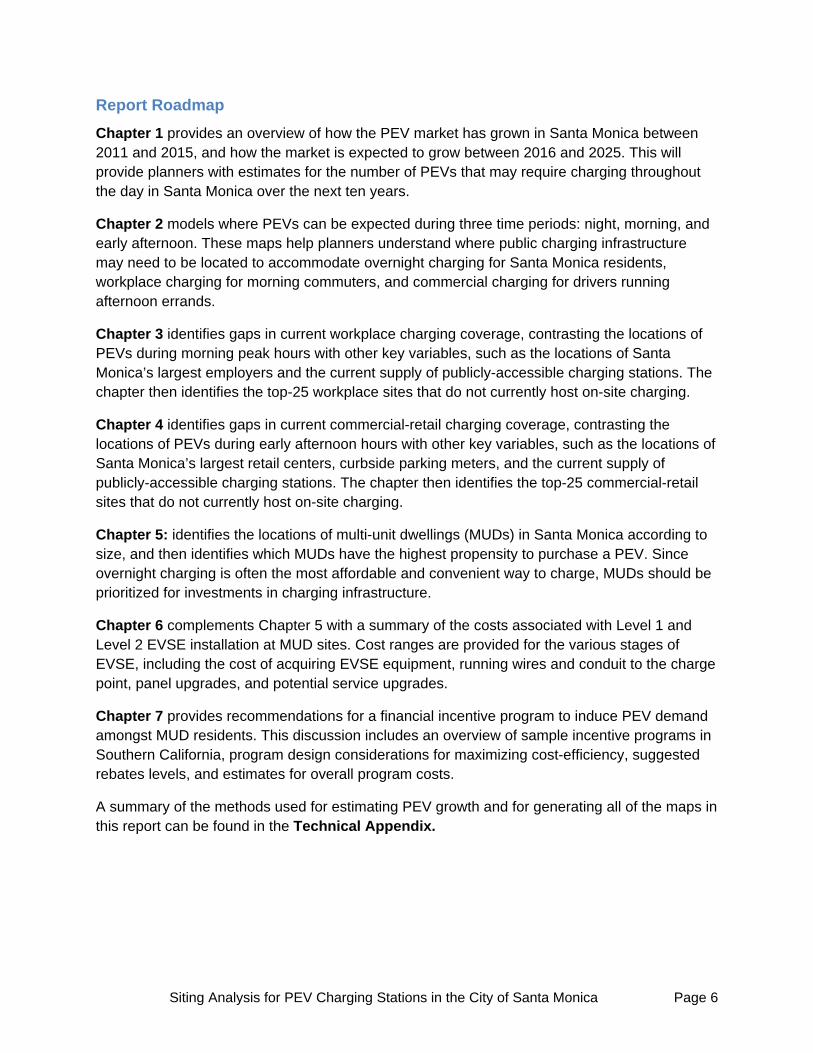
Cumulative PEV Growth ....................................................................................................................... 7
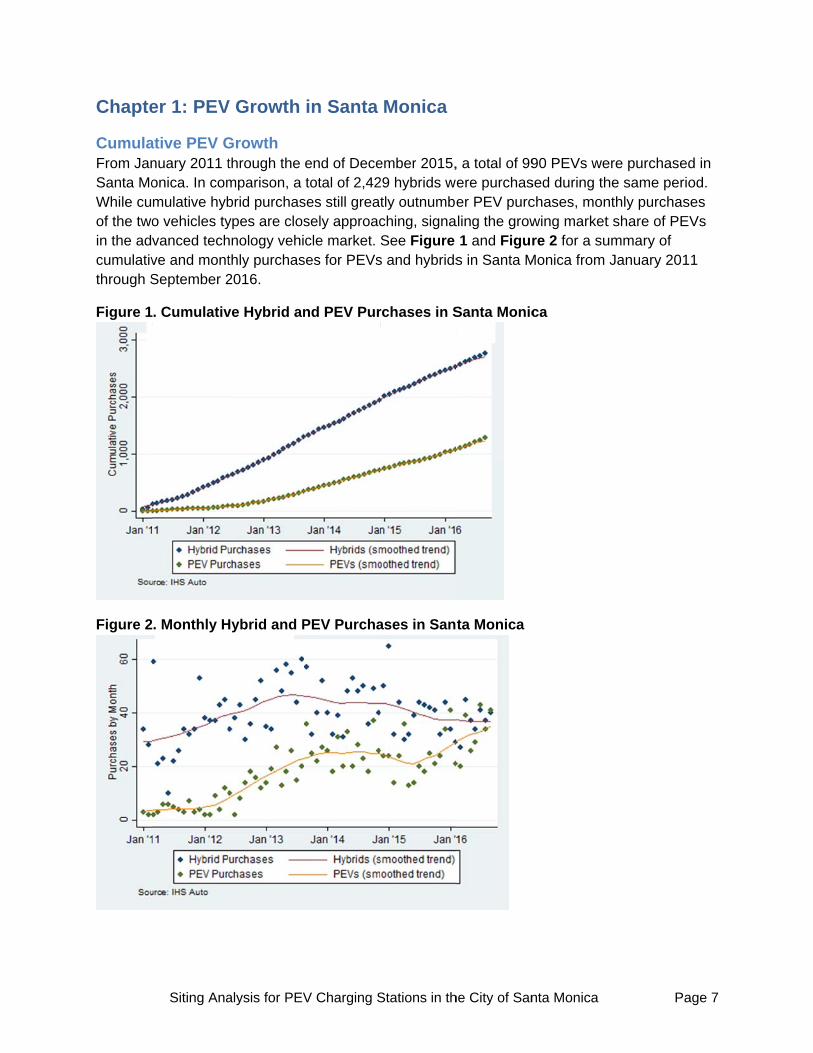
BEV and PHEV Growth ......................................................................................................................... 8
Predicted PEV Growth ........................................................................................................................... 9
Chapter 2: Regional Travel Demand Analysis for Santa Monica ..................................................... 11
PEV Registrations ................................................................................................................................ 11
PEV Peak Morning Destinations ........................................................................................................ 12
PEV Mid-Day Destinations ................................................................................................................. 13
Chapter 3: Workplace Charging Gap Analysis .................................................................................... 14
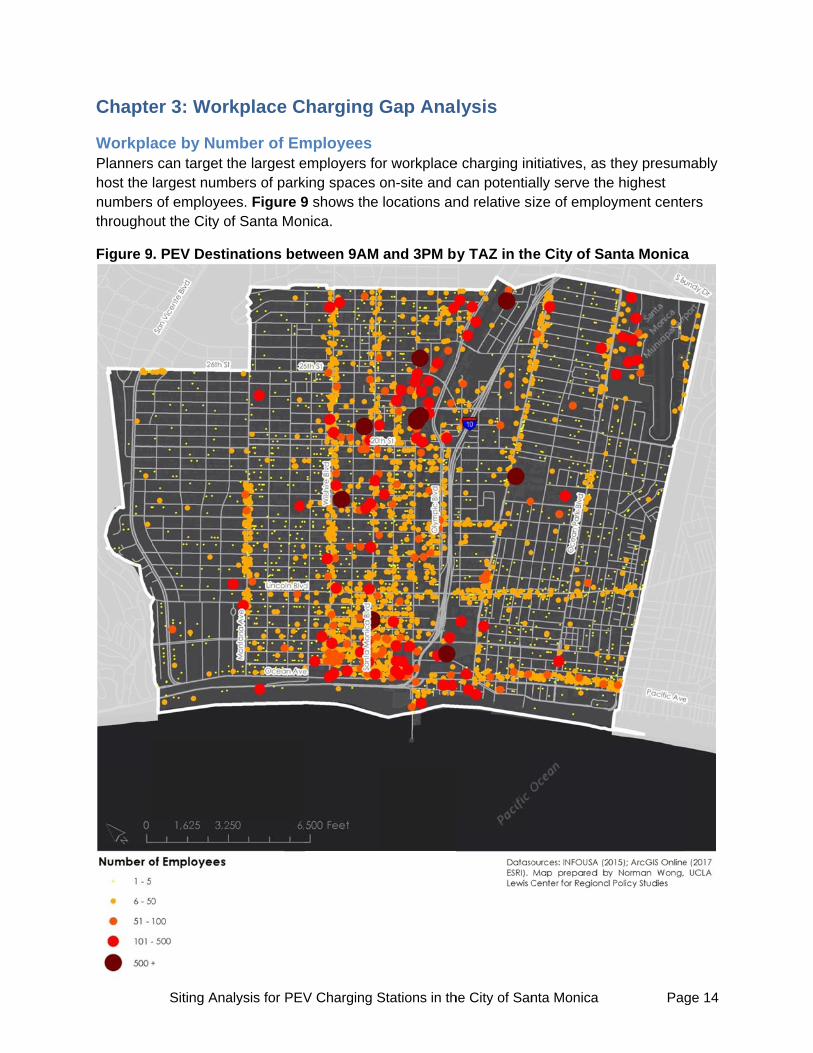
Workplace by Number of Employees ................................................................................................ 14
Publicly-accessible Charging Stations .............................................................................................. 15
PEV Peak Morning Destinations and Number of Employees ....................................................... 16
Top 25 Workplace Sites that do not Currently Host On-site Charging ........................................ 17
Chapter 4: Commercial (Retail) Charging Siting Analysis ................................................................. 18
Commercial Destinations .................................................................................................................... 18
PEV Mid-Day Destinations and Commercial Locations ................................................................. 19
Top 25 Commercial Sites that do not Currently Host On-site Charging ...................................... 20
Curbside Charging Siting Potential Assessment ............................................................................. 21
Chapter 5: Multi-Unit Dwelling (MUD) Analysis ................................................................................... 22
Multi-Unit (MUD) Analysis ................................................................................................................... 22
Propensity to Purchase ....................................................................................................................... 23
Chapter 6: EVSE Installation Costs for MUDs ..................................................................................... 24
Siting Analysis for PEV Charging Stations in the City of Santa Monica Page 3
Background on the Electrical Configuration of MUDs .................................................................... 25
Case Study Findings ............................................................................................................................ 26
Chapter 7: Financial Incentives for MUD Owners ............................................................................... 27
Background on Incentive Design ....................................................................................................... 27
Proposed Financial Incentive Program for the City of Santa Monica ........................................... 32
Estimated Cost for the City of Santa Monica ................................................................................... 33
Technical Appendix .................................................................................................................................. 35
PEV growth ........................................................................................................................................... 35
PEV registration .................................................................................................................................... 37
PEV morning peak destinations ......................................................................................................... 37
PEV mid-day destinations ................................................................................................................... 37
Employment density ............................................................................................................................. 38
Publicly-accessible charging stations ................................................................................................ 38
Top 25 workplace sites that do not currently host on-site charging ............................................. 38
Commercial (retail) destination maps ................................................................................................ 38
Top 25 Commercial sites that do not currently host on-site charging .......................................... 40
Parking Facilities .................................................................................................................................. 40
Parking Meters ...................................................................................................................................... 40
Multi-unit residences maps ................................................................................................................. 40
Propensity to Purchase Scores .......................................................................................................... 41
Siting Analysis for PEV Charging Stations in the City of Santa Monica Page 4
Executive Summary
Introduction
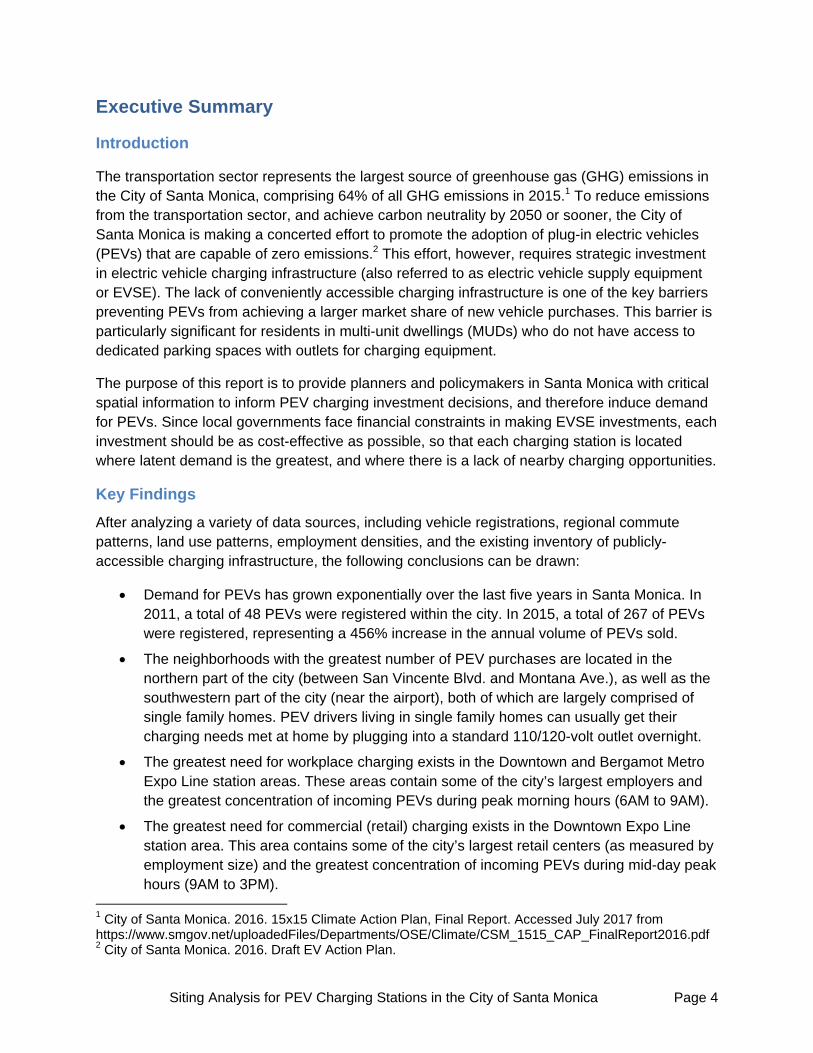
The transportation sector represents the largest source of greenhouse gas (GHG) emissions in the City of Santa Monica, comprising 64% of all GHG emissions in 2015.1 To reduce emissions from the transportation sector, and achieve carbon neutrality by 2050 or sooner, the City of Santa Monica is making a concerted effort to promote the adoption of plug-in electric vehicles (PEVs) that are capable of zero emissions.2 This effort, however, requires strategic investment in electric vehicle charging infrastructure (also referred to as electric vehicle supply equipment or EVSE). The lack of conveniently accessible charging infrastructure is one of the key barriers preventing PEVs from achieving a larger market share of new vehicle purchases. This barrier is particularly significant for residents in multi-unit dwellings (MUDs) who do not have access to dedicated parking spaces with outlets for charging equipment.
The purpose of this report is to provide planners and policymakers in Santa Monica with critical spatial information to inform PEV charging investment decisions, and therefore induce demand for PEVs. Since local governments face financial constraints in making EVSE investments, each investment should be as cost-effective as possible, so that each charging station is located where latent demand is the greatest, and where there is a lack of nearby charging opportunities.
Key Findings
After analyzing a variety of data sources, including vehicle registrations, regional commute patterns, land use patterns, employment densities, and the existing inventory of publicly-accessible charging infrastructure, the following conclusions can be drawn:
Demand for PEVs has grown exponentially over the last five years in Santa Monica. In 2011, a total of 48 PEVs were registered within the city. In 2015, a total of 267 of PEVs were registered, representing a 456% increase in the annual volume of PEVs sold.
The neighborhoods with the greatest number of PEV purchases are located in the northern part of the city (between San Vincente Blvd. and Montana Ave.), as well as the southwestern part of the city (near the airport), both of which are largely comprised of single family homes. PEV drivers living in single family homes can usually get their charging needs met at home by plugging into a standard 110/120-volt outlet overnight.
The greatest need for workplace charging exists in the Downtown and Bergamot Metro Expo Line station areas. These areas contain some of the city’s largest employers and the greatest concentration of incoming PEVs during peak morning hours (6AM to 9AM).
The greatest need for commercial (retail) charging exists in the Downtown Expo Line station area. This area contains some of the city’s largest retail centers (as measured by employment size) and the greatest concentration of incoming PEVs during mid-day peak hours (9AM to 3PM).
1 City of Santa Monica. 2016. 15x15 Climate Action Plan, Final Report. Accessed July 2017 from https://www.smgov.net/uploadedFiles/Departments/OSE/Climate/CSM_1515_CAP_FinalReport2016.pdf 2 City of Santa Monica. 2016. Draft EV Action Plan.
Siting Analysis for PEV Charging Stations in the City of Santa Monica Page 5
The central and eastern portions of the Wilshire and Pico corridors are the strongest candidates for curbside charging. These segments lack public parking facilities, contain clusters of small businesses, and host a significant number of incoming PEVs during mid-day peak hours (9AM to 3PM).
The MUDs with the highest latent demand for PEVs are located in the Downtown Expo Line station area, the northwest corner of the city, and the residential blocks surrounding the Wilshire corridor, the central stretch of Ocean Park Boulevard, the airport, and Virginia Avenue Park. These MUDs are home to high income earners and are located in census tracts with historically high rates of PEV adoption.
The cost of EVSE installation at MUD locations is variable and is particularly high in buildings that do not have electric outlets located in parking areas. Based on a sample of 15 estimates, the cost of installing Level 2 EVSE ranged between $1,800 and $17,800 and averaged $5,400. Thus, the estimated cost of installing Level 2 EVSE for all 41,000 MUD units in Santa Monica is around $222 million.
Policy Recommendations
There is a wide variety of investment opportunities for expanding PEV charging infrastructure, including home charging, workplace charging, commercial (retail) charging, and curbside charging. Home charging (i.e., overnight charging) is currently the most affordable way to charge, since this is when electricity rates are the lowest. Reducing the barriers associated with home charging, therefore, should be a top priority for planners and policymakers.
Home charging is relatively straightforward for residents in single family homes, who usually have access to a dedicated parking space with a nearby electrical outlet. MUD residents, however, often lack this amenity, likely suppressing PEV adoption among this group. To incentivize MUD owners to install charging infrastructure for their residents, we recommend piloting a rebate program with the following design considerations:
Financial incentives should be tied to performance metrics. For example, a partial rebate can be offered to property owners once they have purchased EVSE, and the remainder of the rebate can be offered to the property owner once the city can verify that a PEV is using the charging station.
Eligible expenses should include EVSE equipment, installation materials, and installation labor. During the early stages of an incentive program, however, we recommend excluding electrical service upgrades as a covered expense. This expense can potentially be avoided through strategic energy efficiency measures that reduce the building’s overall electrical load.
Increased incentives should be offered to the following applicants: (1) low-income property owners, (2) property owners that rent to low-income residents, (3) property owners that have a building located in a Disadvantaged Community, and (4) property owners that install two or more EVSE units. These progressive incentives ensure that investments in charging infrastructure are cost effective and equitable.
Siting Analysis for PEV Charging Stations in the City of Santa Monica Page 6
Report Roadmap
Chapter 1 provides an overview of how the PEV market has grown in Santa Monica between 2011 and 2015, and how the market is expected to grow between 2016 and 2025. This will provide planners with estimates for the number of PEVs that may require charging throughout the day in Santa Monica over the next ten years.
Chapter 2 models where PEVs can be expected during three time periods: night, morning, and early afternoon. These maps help planners understand where public charging infrastructure may need to be located to accommodate overnight charging for Santa Monica residents, workplace charging for morning commuters, and commercial charging for drivers running afternoon errands.
Chapter 3 identifies gaps in current workplace charging coverage, contrasting the locations of PEVs during morning peak hours with other key variables, such as the locations of Santa Monica’s largest employers and the current supply of publicly-accessible charging stations. The chapter then identifies the top-25 workplace sites that do not currently host on-site charging.
Chapter 4 identifies gaps in current commercial-retail charging coverage, contrasting the locations of PEVs during early afternoon hours with other key variables, such as the locations of Santa Monica’s largest retail centers, curbside parking meters, and the current supply of publicly-accessible charging stations. The chapter then identifies the top-25 commercial-retail sites that do not currently host on-site charging.
Chapter 5: identifies the locations of multi-unit dwellings (MUDs) in Santa Monica according to size, and then identifies which MUDs have the highest propensity to purchase a PEV. Since overnight charging is often the most affordable and convenient way to charge, MUDs should be prioritized for investments in charging infrastructure.
Chapter 6 complements Chapter 5 with a summary of the costs associated with Level 1 and Level 2 EVSE installation at MUD sites. Cost ranges are provided for the various stages of EVSE, including the cost of acquiring EVSE equipment, running wires and conduit to the charge point, panel upgrades, and potential service upgrades.
Chapter 7 provides recommendations for a financial incentive program to induce PEV demand amongst MUD residents. This discussion includes an overview of sample incentive programs in Southern California, program design considerations for maximizing cost-efficiency, suggested rebates levels, and estimates for overall program costs.
A summary of the methods used for estimating PEV growth and for generating all of the maps in this report can be found in the Technical Appendix.
Chapte
CumulaFrom JanSanta MoWhile cuof the twoin the adcumulativthrough S
Figure 1
Figure 2
Siting Ana
er 1: PEV
ative PEV Gnuary 2011 tonica. In commulative hybo vehicles tyvanced techve and montSeptember 2
. Cumulativ
. Monthly H
alysis for PEV
V Growth
Growth through the mparison, a brid purchasypes are closhnology vehithly purchas2016.
ve Hybrid an
Hybrid and P
V Charging S
in Santa
end of Decetotal of 2,42
ses still greasely approaccle market.
ses for PEVs
nd PEV Pur
PEV Purcha
Stations in th
Monica
ember 2015,29 hybrids wetly outnumbeching, signaSee Figure
s and hybrids
rchases in S
ases in San
he City of San
, a total of 99ere purchaser PEV purc
aling the grow1 and Figur
s in Santa M
Santa Monic
ta Monica
nta Monica
90 PEVs wesed during thchases, monwing marketre 2 for a su
Monica from
ca
Pa
ere purchasehe same pernthly purchast share of PEummary of January 201
age 7
ed in riod. ses EVs
11
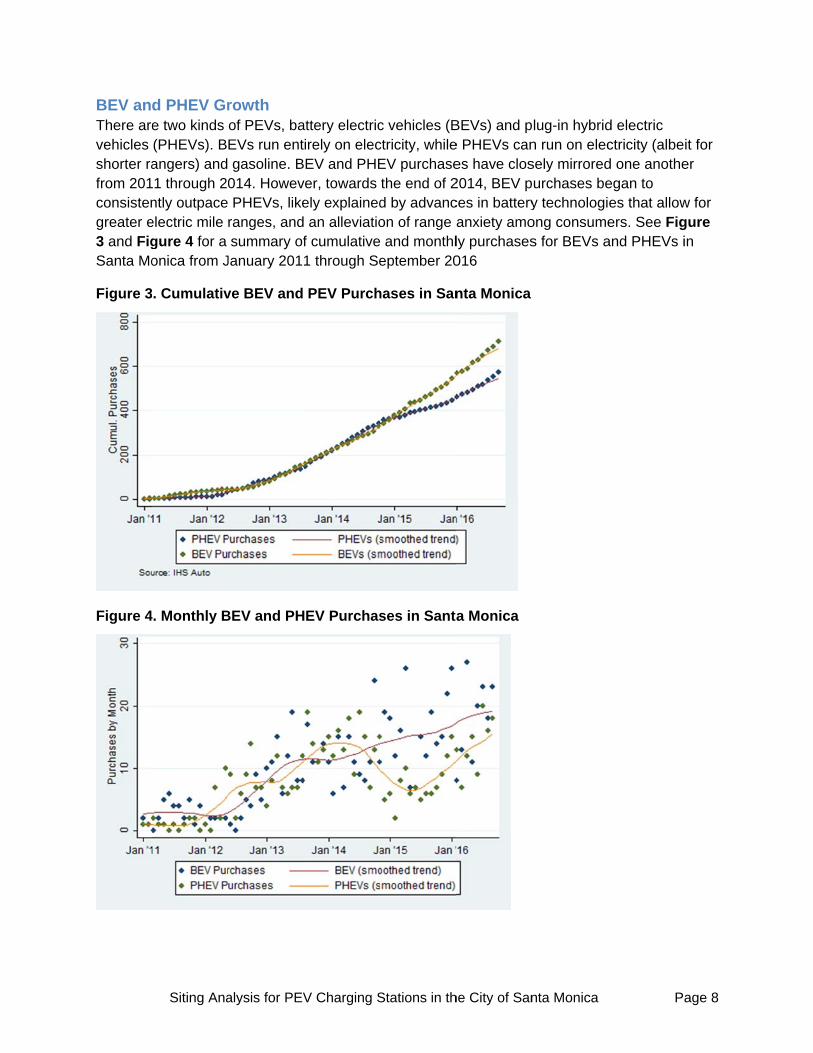
BEV anThere arevehicles shorter rafrom 201consistengreater e3 and FigSanta Mo
Figure 3
Figure 4
Siting Ana
d PHEV Gre two kinds (PHEVs). Bangers) and1 through 20ntly outpaceelectric mile gure 4 for a onica from J
. Cumulativ
4. Monthly B
alysis for PEV
rowth of PEVs, baEVs run ent gasoline. B014. Howev PHEVs, likeranges, andsummary of
January 201
ve BEV and
BEV and PH
V Charging S
attery electricirely on elecEV and PHE
ver, towards ely explained an alleviatiof cumulative1 through Se
PEV Purch
EV Purchas
Stations in th
c vehicles (Bctricity, whileEV purchasethe end of 2d by advancon of range a and monthleptember 20
hases in San
ses in Santa
he City of San
BEVs) and pe PHEVs canes have clos2014, BEV pces in batteryanxiety amoly purchases016
nta Monica
a Monica
nta Monica
lug-in hybridn run on elecsely mirroredurchases bey technologiong consumes for BEVs a
Pa
d electric ctricity (albed one anotheegan to es that allowers. See Fig
and PHEVs i
age 8
it for er
w for gure in
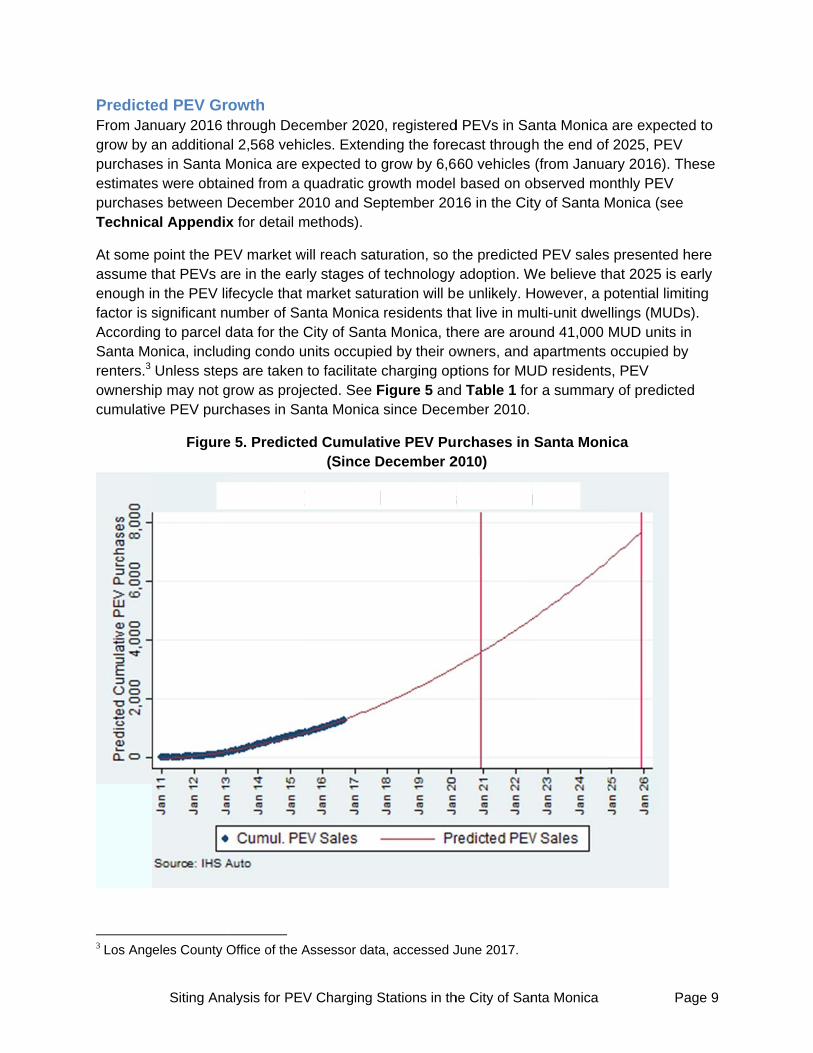
PredicteFrom Jangrow by apurchaseestimatespurchaseTechnica
At some assume tenough ifactor is sAccordinSanta Morenters.3 ownershcumulativ
3 Los Ang
Siting Ana
ed PEV Grnuary 2016 tan additionaes in Santa Ms were obtaies between Dal Appendix
point the PEthat PEVs an the PEV lisignificant ng to parcel donica, includUnless stepip may not gve PEV purc
Figure
eles County O
alysis for PEV
owth through Decal 2,568 vehiMonica are eined from a December 2x for detail m
EV market wre in the earfecycle that umber of Sadata for the Cding condo ups are taken grow as projechases in Sa
e 5. Predicte
Office of the A
V Charging S
cember 2020icles. Extendexpected to quadratic gr
2010 and Semethods).
will reach satrly stages ofmarket satu
anta Monica City of Santa
units occupieto facilitate
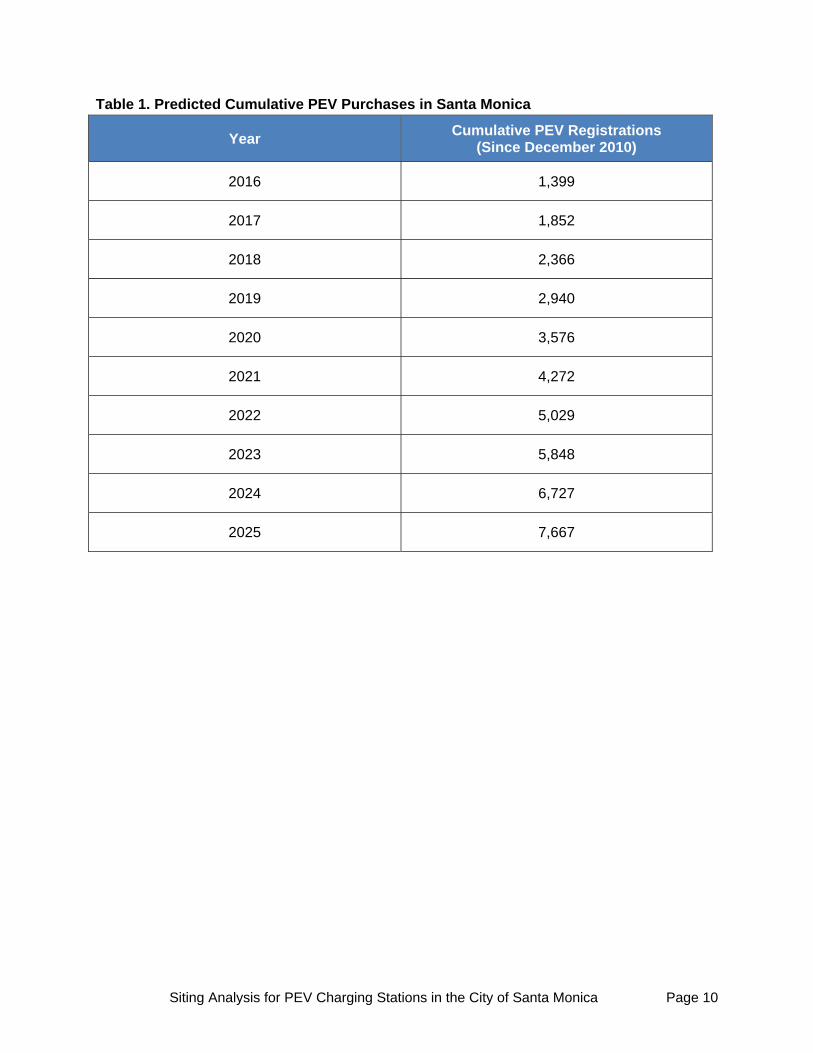
ected. See Fanta Monica
ed Cumulat(Since D
Assessor data
Stations in th
0, registeredding the foregrow by 6,6
rowth model eptember 20
uration, so tf technology uration will be
residents tha Monica, thed by their ocharging op
Figure 5 andsince Dece
ive PEV PuDecember 2
a, accessed J
he City of San
d PEVs in Saecast through60 vehicles based on o
16 in the Cit
the predictedadoption. We unlikely. H
hat live in muhere are arouowners, and ptions for MUd Table 1 fomber 2010.
rchases in 2010)
June 2017.
nta Monica
anta Monica h the end of(from Janua
observed moty of Santa M
d PEV salesWe believe thHowever, a pulti-unit dweund 41,000 apartments
UD residentsor a summary
Santa Mon
Pa
are expectef 2025, PEV ary 2016). Tonthly PEV Monica (see
s presented hhat 2025 is epotential limillings (MUDsMUD units ioccupied by
s, PEV y of predicte
ica
age 9
ed to
hese
here early ting s). n y
ed
Siting Analysis for PEV Charging Stations in the City of Santa Monica Page 10
Table 1. Predicted Cumulative PEV Purchases in Santa Monica
Year Cumulative PEV Registrations
(Since December 2010)
2016 1,399
2017 1,852
2018 2,366
2019 2,940
2020 3,576
2021 4,272
2022 5,029
2023 5,848
2024 6,727
2025 7,667
Chapte
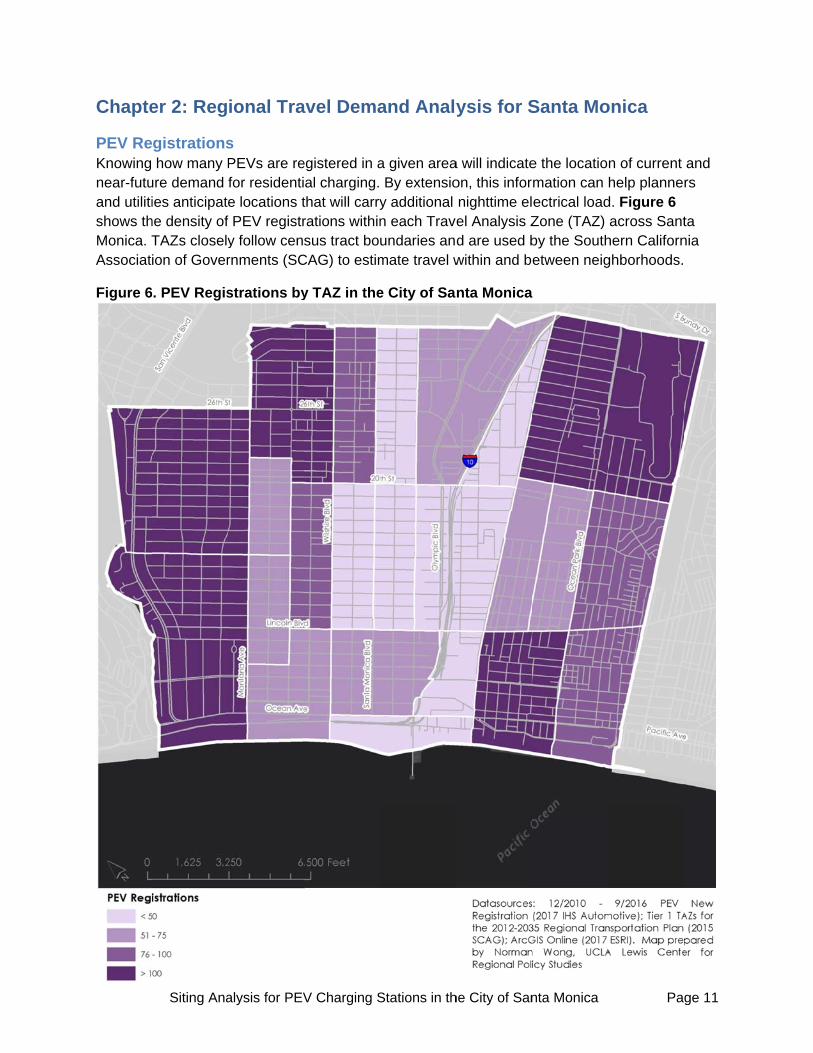
PEV ReKnowing near-futuand utilitishows thMonica. TAssociat
Figure 6
Siting Ana
er 2: Reg
gistrationshow many P
ure demand ies anticipate
he density ofTAZs closelyion of Gover
6. PEV Regis
alysis for PEV
ional Tra
s PEVs are refor residentie locations tf PEV registry follow cenrnments (SC
strations by
V Charging S
avel Dema
egistered in aal charging. that will carryrations withinsus tract bo
CAG) to estim
y TAZ in the
Stations in th
and Analy
a given areaBy extensio
y additional n each Traveundaries andmate travel w
e City of Sa
he City of San
ysis for S
a will indicateon, this infornighttime elel Analysis Zd are used bwithin and be
nta Monica
nta Monica
Santa Mo
e the locatiormation can ectrical loadZone (TAZ) by the Southetween neig
Pag
onica
n of current help planner
d. Figure 6 across Sant
hern Californghborhoods.
ge 11
and rs
ta nia
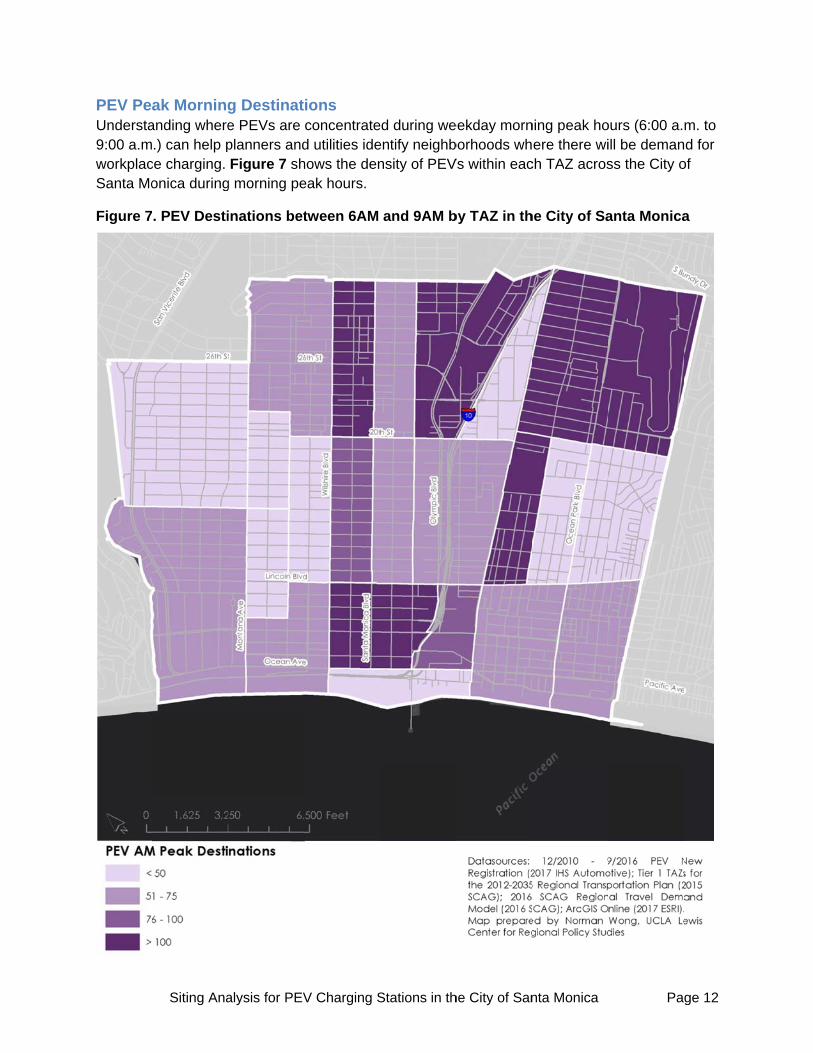
PEV PeUndersta9:00 a.mworkplacSanta Mo
Figure 7
Siting Ana
ak Morninganding where.) can help p
ce charging. onica during
. PEV Desti
alysis for PEV
g Destinate PEVs are planners andFigure 7 sh
g morning pe
inations bet
V Charging S
ions concentrated utilities idehows the deneak hours.
tween 6AM
Stations in th
ed during weentify neighbnsity of PEV
and 9AM b
he City of San
eekday mornborhoods whVs within eac
by TAZ in th
nta Monica
ning peak hoere there wi
ch TAZ acros
he City of Sa
Pag
ours (6:00 a.ill be demanss the City o
anta Monica
ge 12
m. to d for
of
a
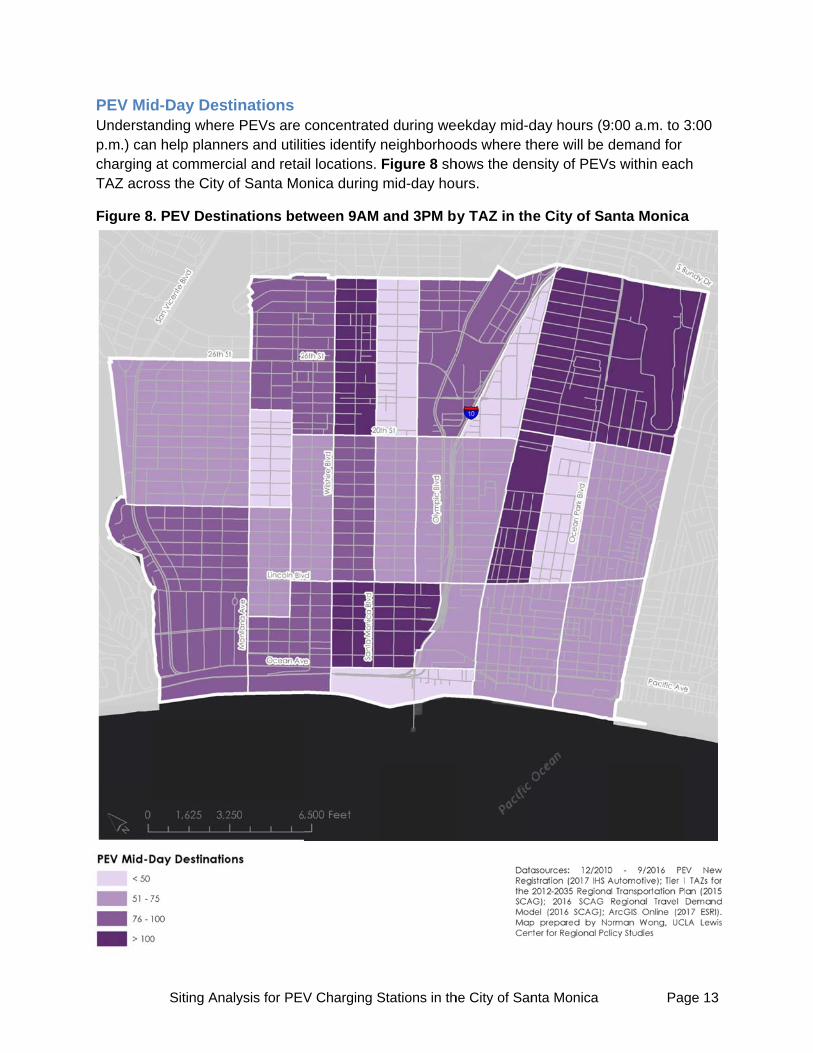
PEV MidUnderstap.m.) canchargingTAZ acro
Figure 8
Siting Ana
d-Day Destanding wheren help plannat commerc
oss the City
. PEV Desti
alysis for PEV
tinations e PEVs are ers and utilitcial and retaof Santa Mo
inations bet
V Charging S
concentrateties identify il locations.
onica during
tween 9AM
Stations in th
ed during weneighborhooFigure 8 shmid-day hou
and 3PM b
he City of San
eekday mid-dods where th
hows the denurs.
y TAZ in th
nta Monica
day hours (9here will be dnsity of PEV
e City of Sa
Pag
9:00 a.m. to 3demand for
Vs within eac
anta Monica
ge 13
3:00
ch
a
Chapte
WorkplaPlannershost the numbersthrougho
Figure 9
Siting Ana
er 3: Wor
ace by Nums can target tlargest num of employe
out the City o
. PEV Desti
alysis for PEV
rkplace C
mber of Emthe largest ebers of parkes. Figure 9
of Santa Mon
inations bet
V Charging S
Charging G
mployeesemployers foking spaces o9 shows the nica.
tween 9AM
Stations in th
Gap Ana
or workplaceon-site and locations an
and 3PM b
he City of San
lysis
e charging incan potentiand relative s
y TAZ in th
nta Monica
nitiatives, as ally serve theize of emplo
e City of Sa
Pag
they presume highest oyment cente
anta Monica
ge 14
mably
ers
a
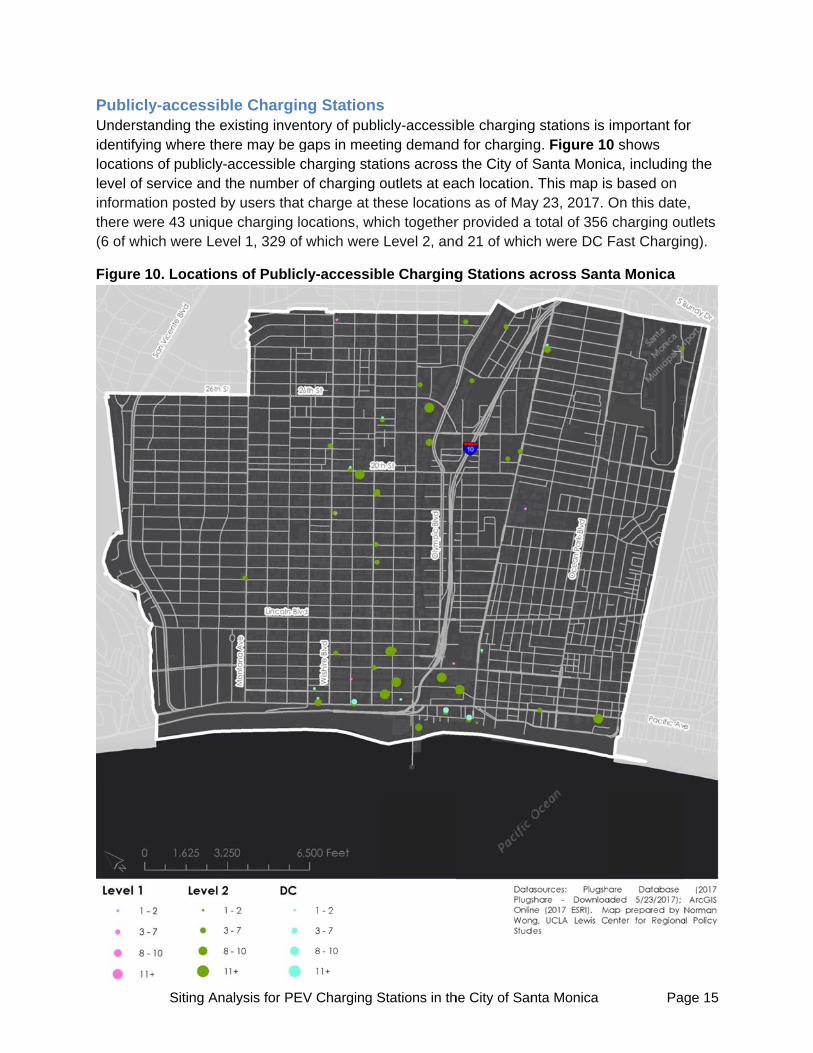
PubliclyUnderstaidentifyinlocationslevel of sinformatithere we(6 of whic
Figure 1
Siting Ana
y-accessibanding the exng where thes of publicly-aservice and ton posted bre 43 uniquech were Lev
0. Location
alysis for PEV
ble Charginxisting inven
ere may be gaccessible cthe number oy users that e charging lovel 1, 329 of
ns of Public
V Charging S
ng Stationsntory of publgaps in meetcharging statof charging ocharge at th
ocations, whwhich were
ly-accessib
Stations in th
s icly-accessibting demandtions acrossoutlets at eahese locationhich together
Level 2, and
ble Charging
he City of San
ble chargingd for chargins the City of ach location.ns as of Mayr provided a d 21 of whic
g Stations a
nta Monica
g stations is g. Figure 10Santa Monic. This map isy 23, 2017. total of 356
ch were DC F
across Sant
Pag
important fo0 shows ca, includings based on On this datecharging ou
Fast Chargin
ta Monica
ge 15
or
g the
e, utlets ng).
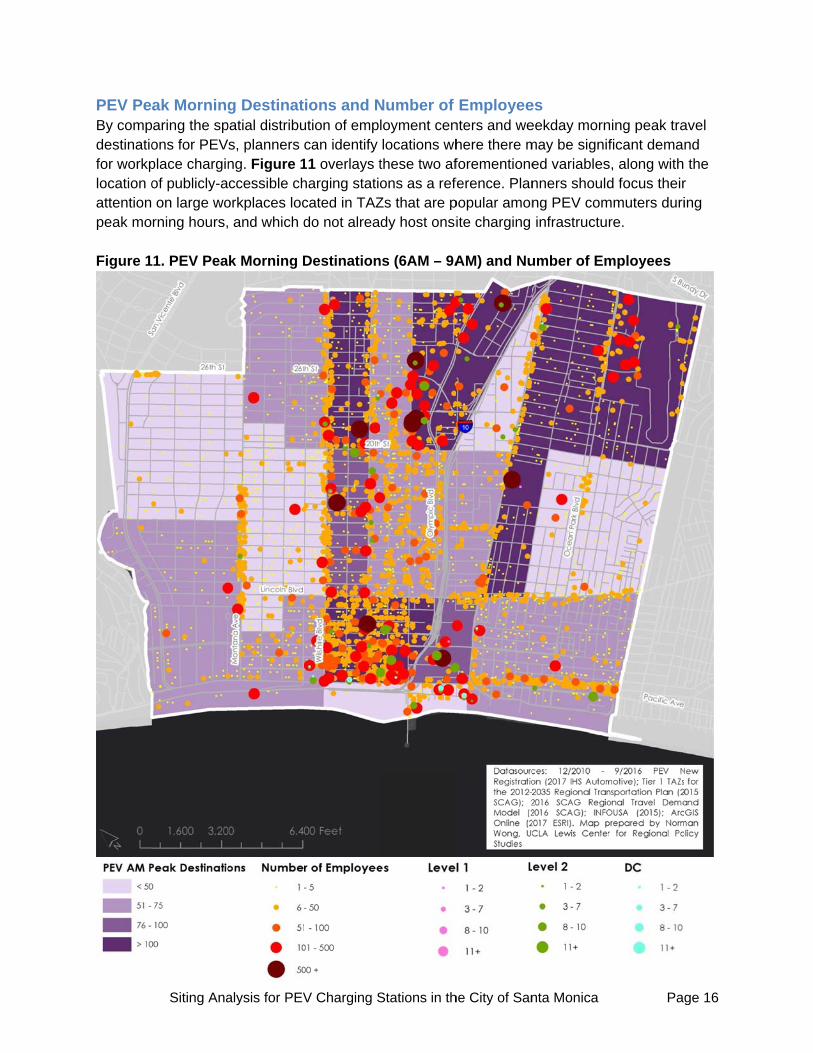
PEV PeBy compdestinatiofor workplocation oattention peak mo Figure 1
Siting Ana
ak Morningaring the spons for PEVplace charginof publicly-aon large wo
rning hours,
1. PEV Pea
alysis for PEV
g Destinatpatial distribus, planners ng. Figure 1ccessible ch
orkplaces loc and which d
k Morning D
V Charging S
ions and Nution of emplcan identify
11 overlays tharging statiocated in TAZdo not alrea
Destination
Stations in th
Number of loyment cenlocations whthese two afons as a ref
Zs that are pdy host onsi
ns (6AM – 9A
he City of San
Employeenters and wehere there mforementioneference. Planpopular amonite charging
AM) and Nu
nta Monica
es eekday mornmay be signifed variablesnners shouldng PEV cominfrastructu
umber of Em
Pag
ning peak traficant deman
s, along with d focus their
mmuters durire.
mployees
ge 16
avel nd the
r ing
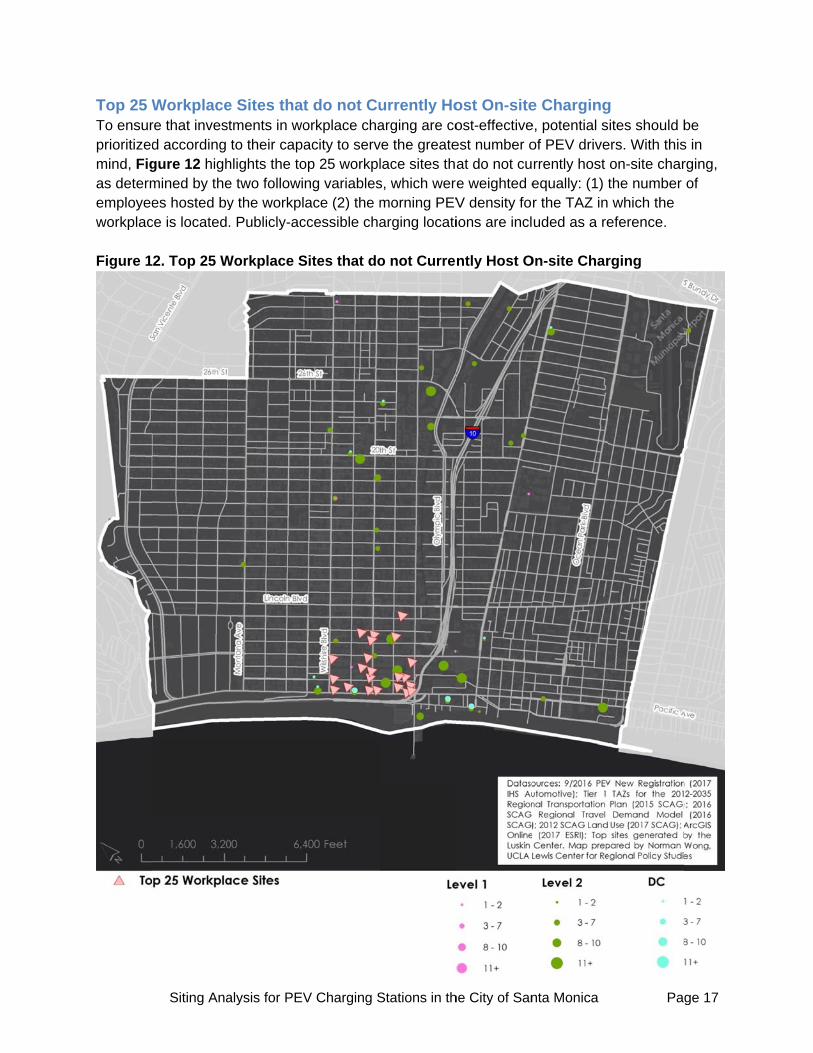
Top 25 WTo ensurprioritizedmind, Figas determemployeeworkplac Figure 1
Siting Ana
Workplacere that invesd according gure 12 highmined by thees hosted by
ce is located
2. Top 25 W
alysis for PEV
e Sites thattments in woto their capa
hlights the toe two followiy the workpl. Publicly-ac
Workplace S
V Charging S
t do not Cuorkplace chaacity to serv
op 25 workplng variablesace (2) the m
ccessible cha
Sites that do
Stations in th
urrently Hoarging are cove the greatelace sites thas, which weremorning PEVarging locati
o not Curre
he City of San
ost On-siteost-effectiveest number oat do not cu
re weighted eV density foions are incl
ntly Host O
nta Monica
e Charginge, potential sof PEV driverrently host equally: (1) tr the TAZ inuded as a re
On-site Char
Pag
g ites should b
ers. With thison-site charthe number which the eference.
rging
ge 17
be s in rging, of
Chapte
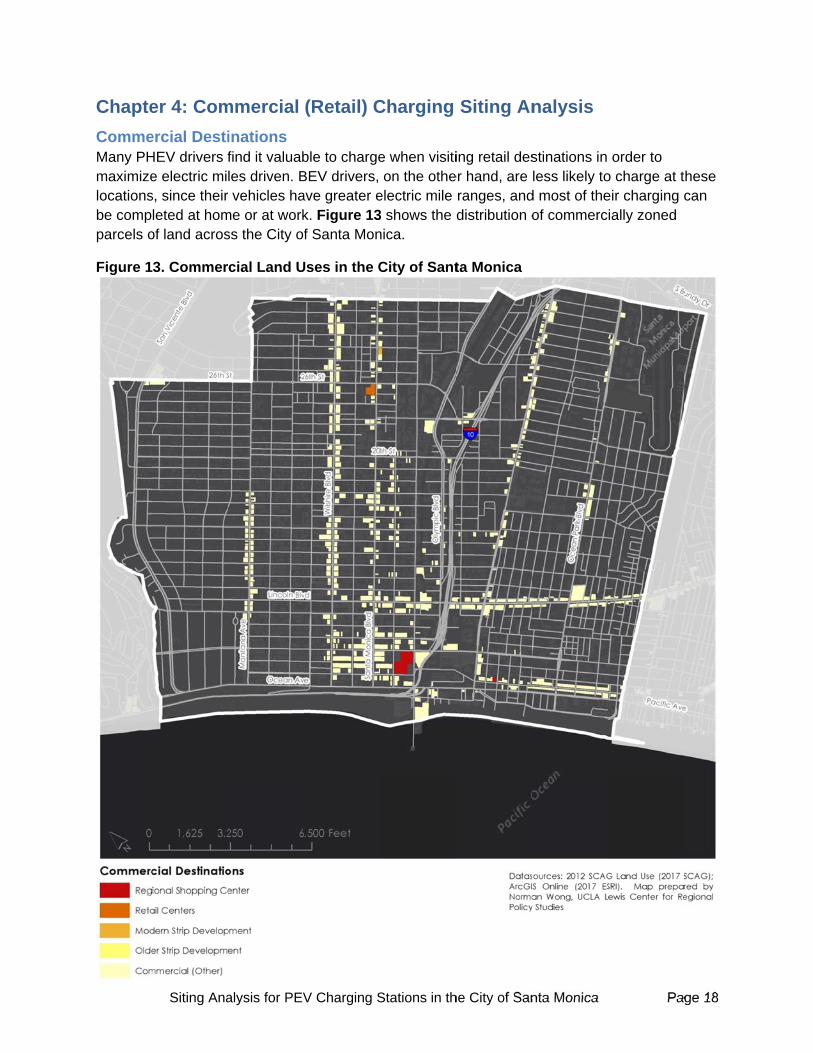
CommeMany PHmaximizelocationsbe compparcels o
Figure 1
Siting Ana
er 4: Com
ercial DestiHEV drivers fe electric mis, since theirleted at hom
of land acros
3. Commer
alysis for PEV
mmercial
inations find it valuables driven. Br vehicles hame or at workss the City of
rcial Land U
V Charging S
(Retail) C
ble to chargeBEV drivers, ave greater ek. Figure 13f Santa Mon
Uses in the C
Stations in th
Charging
e when visition the othe
electric mile 3 shows the dnica.
City of Sant
he City of San
Siting An
ing retail deser hand, are
ranges, anddistribution o
ta Monica
nta Monica
nalysis
stinations in less likely to
d most of theof commerc
Pag
order to o charge at teir charging cially zoned
ge 18
hese can
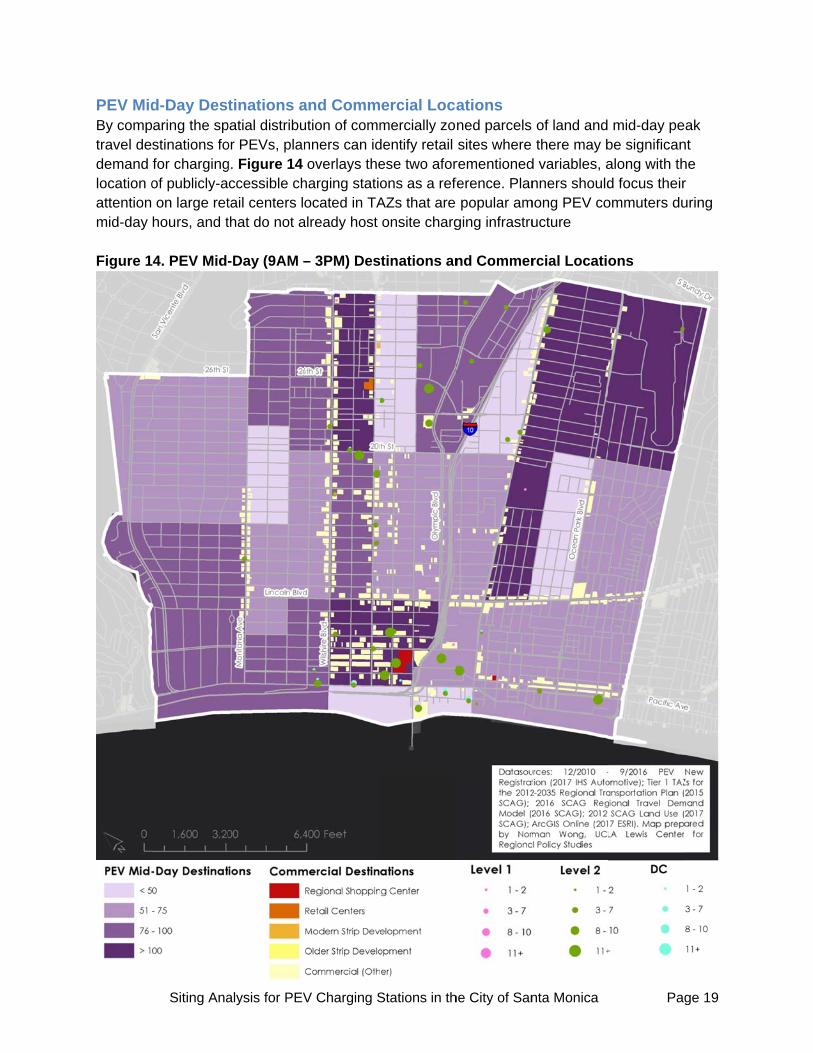
PEV MidBy comptravel dedemand location oattention mid-day Figure 1
Siting Ana
d-Day Destaring the spstinations fofor chargingof publicly-aon large ret
hours, and t
4. PEV Mid-
alysis for PEV
tinations apatial distribuor PEVs, plang. Figure 14 ccessible chtail centers lthat do not a
-Day (9AM –
V Charging S
and Commution of commnners can idoverlays the
harging statioocated in TA
already host
– 3PM) Des
Stations in th
ercial Locamercially zodentify retail ese two aforons as a refAZs that are onsite charg
tinations an
he City of San
ations ned parcels sites where
rementionedference. Planpopular am
ging infrastru
nd Commer
nta Monica
of land andthere may b
d variables, anners should
mong PEV coucture
rcial Locatio
Pag
mid-day pebe significanalong with thd focus theirommuters du
ons
ge 19
ak nt he r uring
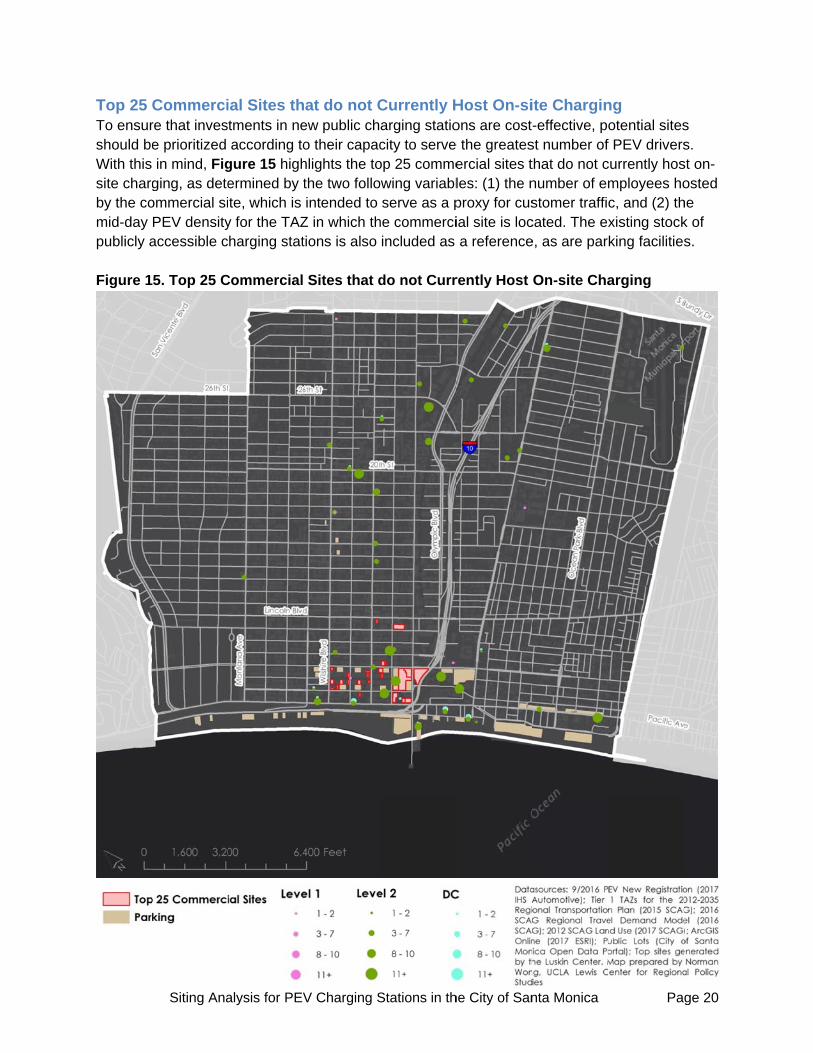
Top 25 To ensurshould beWith this site chargby the comid-day publicly a Figure 1
Siting Ana
Commercire that invese prioritized in mind, Fig
ging, as deteommercial siPEV densityaccessible c
5. Top 25 C
alysis for PEV
ial Sites thtments in neaccording to
gure 15 highermined by tte, which is
y for the TAZharging stat
Commercial
V Charging S
at do not Cew public cho their capachlights the tothe two follointended to
Z in which thtions is also
Sites that d
Stations in th
Currently Harging statiocity to serve
op 25 commeowing variabl
serve as a phe commerciincluded as
do not Curr
he City of San
Host On-sions are cost-e the greatesercial sites tles: (1) the nproxy for cusial site is loca reference
rently Host
nta Monica
ite Chargin-effective, po
st number ofthat do not cnumber of emstomer trafficcated. The exe, as are par
On-site Cha
Pag
ng otential sitesf PEV driverscurrently hosmployees hoc, and (2) thxisting stockking facilities
arging
ge 20
s s.
st on-osted
he k of s.

CurbsidCurbsidehost highand thereof meter mid-day locations Figure 1
Siting Ana
de Chargie charging shh numbers oefore lack splocations (wpeak travel d
s is also inclu
6. Meter Lo
alysis for PEV
ing Siting hould be priof mid-day PEpace for cha
which servesdestinationsuded as a re
ocations acr
V Charging S
Potentialoritized in neEV drivers. Srging infrast as a proxy f
s for PEVs. Teference, as
ross the Cit
Stations in th
l AssessmeighborhoodSmall businetructure. Figfor curbside
The existing are nearby
ty of Santa
he City of San
ment ds with clusteesses oftenure 16 over
e parking), costock of pubparking faci
Monica
nta Monica
ers of small lack onsite p
rlays the spaommercial dblicly-accesslities.
Pag
businesses parking facilatial distributdestinations,sible chargin
ge 21
that ities, tion and
ng
Chapte
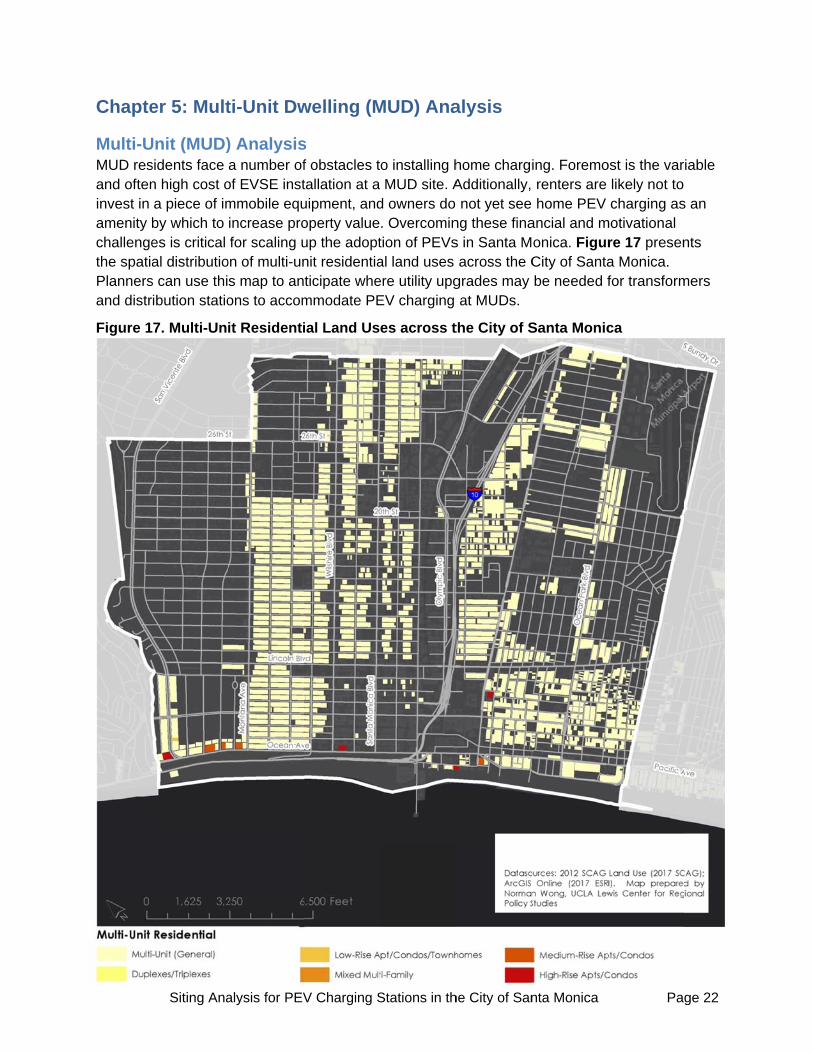
Multi-UMUD resand ofteninvest in amenity bchallengethe spatiaPlannersand distr
Figure 1
Siting Ana
er 5: Mult
Unit (MUD)sidents face n high cost oa piece of imby which to es is critical al distributio
s can use thiribution statio
7. Multi-Un
alysis for PEV
ti-Unit Dw
) Analysisa number of
of EVSE instmmobile equincrease profor scaling u
on of multi-uns map to anons to accom
it Residenti
V Charging S
welling (M
s f obstacles ttallation at a uipment, andoperty valueup the adoptnit residentiaticipate whemmodate PE
ial Land Us
Stations in th
MUD) Ana
o installing hMUD site. A
d owners do . Overcomintion of PEVsal land uses ere utility upgEV charging
es across t
he City of San
alysis
home chargiAdditionally, not yet see
ng these finas in Santa Macross the C
grades may at MUDs.
the City of S
nta Monica
ing. Foremorenters are home PEV
ancial and monica. FigurCity of Santabe needed f
Santa Monic
Pag
ost is the varlikely not to charging as
motivational re 17 presena Monica. for transform
ca
ge 22
iable
s an
nts
mers
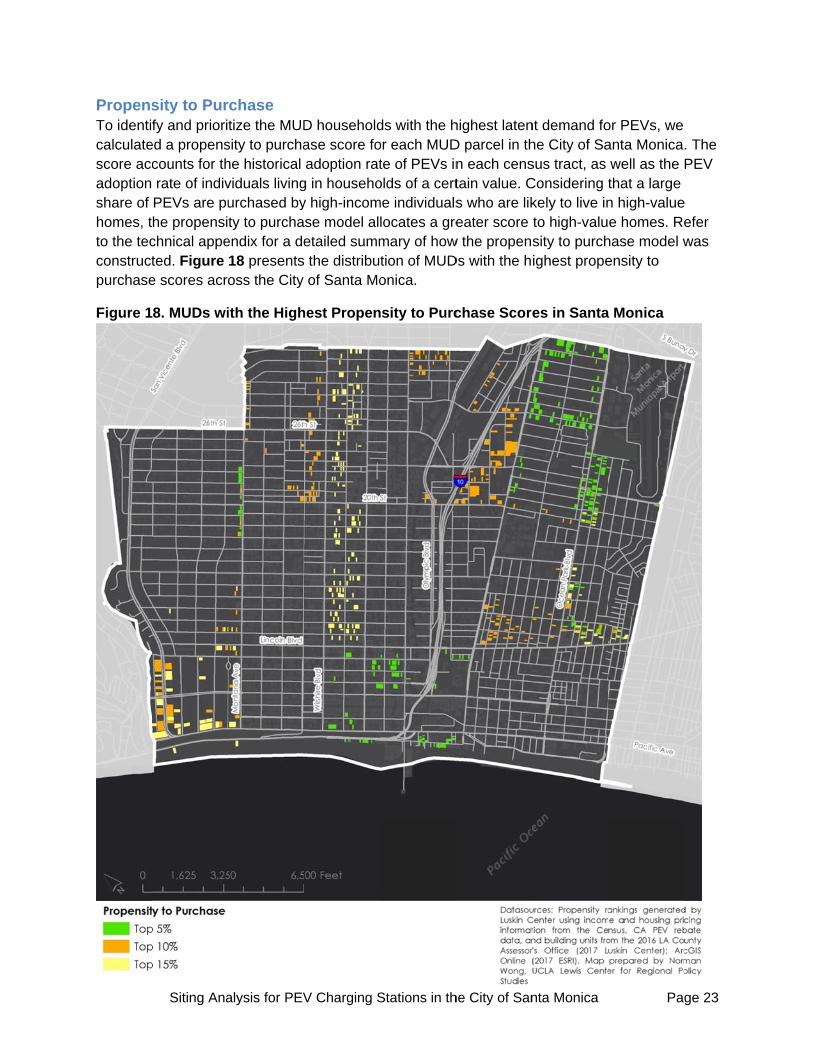
PropensTo identicalculatescore accadoption share of homes, tto the tecconstructpurchase
Figure 1
T
Siting Ana
sity to Purfy and priori
ed a propenscounts for thrate of indivPEVs are puhe propensichnical appeted. Figure e scores acro
8. MUDs wi
alysis for PEV
rchase tize the MUD
sity to purchahe historical viduals livingurchased byty to purcha
endix for a de18 presentsoss the City
ith the High
V Charging S
D householdase score foadoption rat
g in househoy high-incomse model aletailed summ the distribuof Santa Mo
hest Propen
Stations in th
ds with the hor each MUDte of PEVs inolds of a cert
me individualslocates a gremary of howtion of MUDonica.
nsity to Purc
he City of San
highest latenD parcel in thn each censtain value. Cs who are likeater score
w the propenDs with the h
chase Score
nta Monica
nt demand fohe City of Sasus tract, as Considering tkely to live into high-valusity to purchighest prope
es in Santa
Pag
or PEVs, we anta Monicawell as the that a large n high-valuee homes. Re
hase model wensity to
a Monica
ge 23
. The PEV
e efer was
ChapteTo chargcharging 110/120-It requirePEV drivof Level hour, but
For singlfamily hoinstallatiohas a preinstallingbecome electricalconnect tadequatethen pan
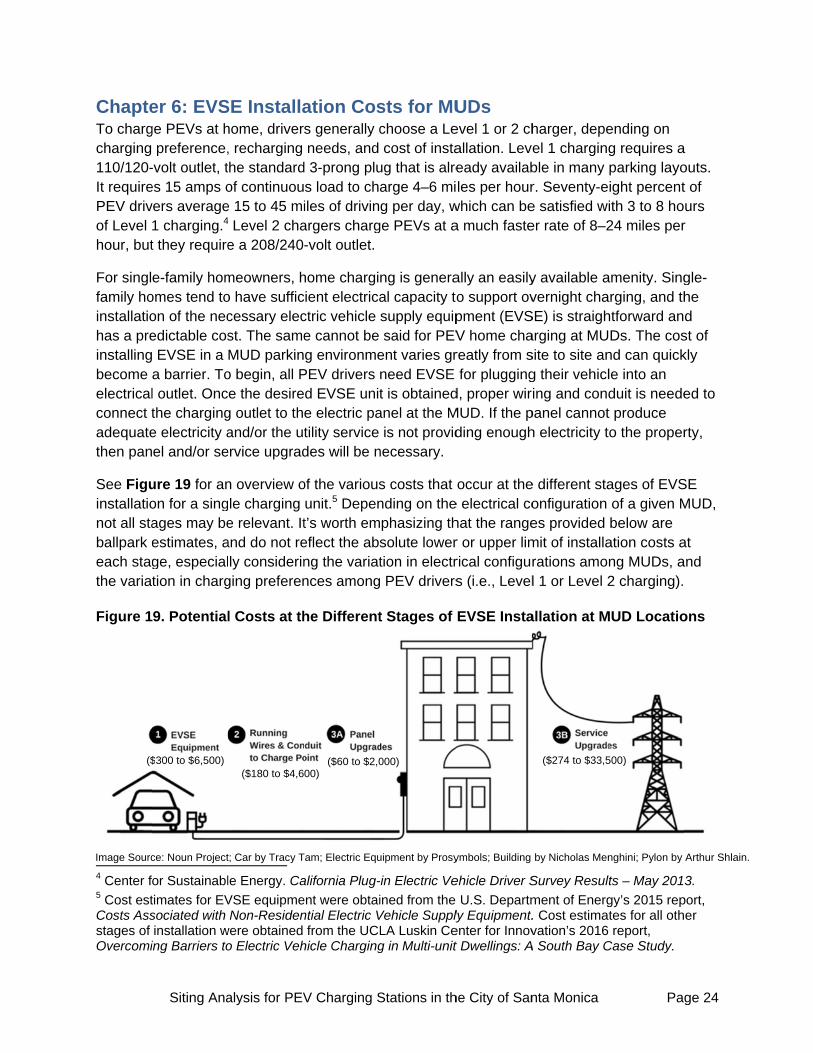
See Figuinstallationot all staballpark eeach stagthe varia
Figure 1
4 Center f5 Cost estCosts Assstages of Overcomi
Image Sourc
($
Siting Ana
er 6: EVSge PEVs at h
preference,-volt outlet, tes 15 amps overs average1 charging.4
t they require
e-family homomes tend toon of the necedictable cos EVSE in a a barrier. Tol outlet. Oncthe charginge electricity ael and/or se
ure 19 for anon for a singages may beestimates, age, especialtion in charg
9. Potential
for Sustainabl
timates for EVsociated with installation w
ing Barriers to
ce: Noun Project
$300 to $6,500)
alysis for PEV
SE Installahome, driver, recharging he standardof continuoue 15 to 45 mi Level 2 chae a 208/240
meowners, ho have sufficcessary elecst. The sameMUD parkin
o begin, all Pe the desire
g outlet to thand/or the ut
ervice upgrad
n overview ole charging e relevant. It
and do not rely considerin
ging preferen
l Costs at th
le Energy. Ca
VSE equipmeNon-Residen
were obtained o Electric Veh
t; Car by Tracy T
($180 to $4,6
V Charging S
ation Coss generally cneeds, and
d 3-prong plus load to chailes of drivinargers charg-volt outlet.
home chargicient electricactric vehicle e cannot be g environme
PEV drivers d EVSE unite electric patility service des will be n
of the variousunit.5 Depent’s worth emeflect the absng the variatnces among
he Different
alifornia Plug-
ent were obtaintial Electric V
from the UCLhicle Charging
Tam; Electric Equ
($60 to $2,000)
Stations in th
sts for MUchoose a Lecost of insta
ug that is alrearge 4–6 mig per day, w
ge PEVs at a
ng is generaal capacity tosupply equipsaid for PEV
ent varies grneed EVSE t is obtained
anel at the Mis not provid
necessary.
s costs that nding on thephasizing thsolute lowertion in electr PEV drivers
t Stages of
-in Electric Ve
ined from the Vehicle SupplyLA Luskin Ceg in Multi-unit
uipment by Prosy
000)
he City of San
UDs evel 1 or 2 challation. Leveeady availables per hour
which can bea much faste
ally an easilyo support ovpment (EVSV home chareatly from sfor plugging
d, proper wirMUD. If the pding enough
occur at thee electrical cohat the ranger or upper limrical configurs (i.e., Level
EVSE Insta
ehicle Driver S
U.S. Departmly Equipment.enter for Innovt Dwellings: A
ymbols; Building
nta Monica
harger, depeel 1 chargingble in many r. Seventy-ee satisfied wer rate of 8–2
y available avernight cha
SE) is straigharging at MUsite to site ang their vehicling and cond
panel cannoth electricity t
e different staonfiguration es provided mit of installarations amol 1 or Level 2
allation at M
Survey Resul
ment of Energ. Cost estimavation’s 2016
A South Bay C
by Nicholas Men
($274 to $33,5
Pag
ending on g requires aparking layoight percentith 3 to 8 ho24 miles per
amenity. Singarging, and thhtforward anDs. The cos
nd can quickle into an duit is needet produce to the proper
ages of EVSof a given Mbelow are
ation costs ang MUDs, a2 charging).
MUD Locatio
lts – May 201
gy’s 2015 reptes for all oth report,
Case Study.
nghini; Pylon by
500)
ge 24
a outs. t of urs r
gle-he d st of kly
ed to
rty,
SE MUD,
at and
ons
3.
port, er
Arthur Shlain.
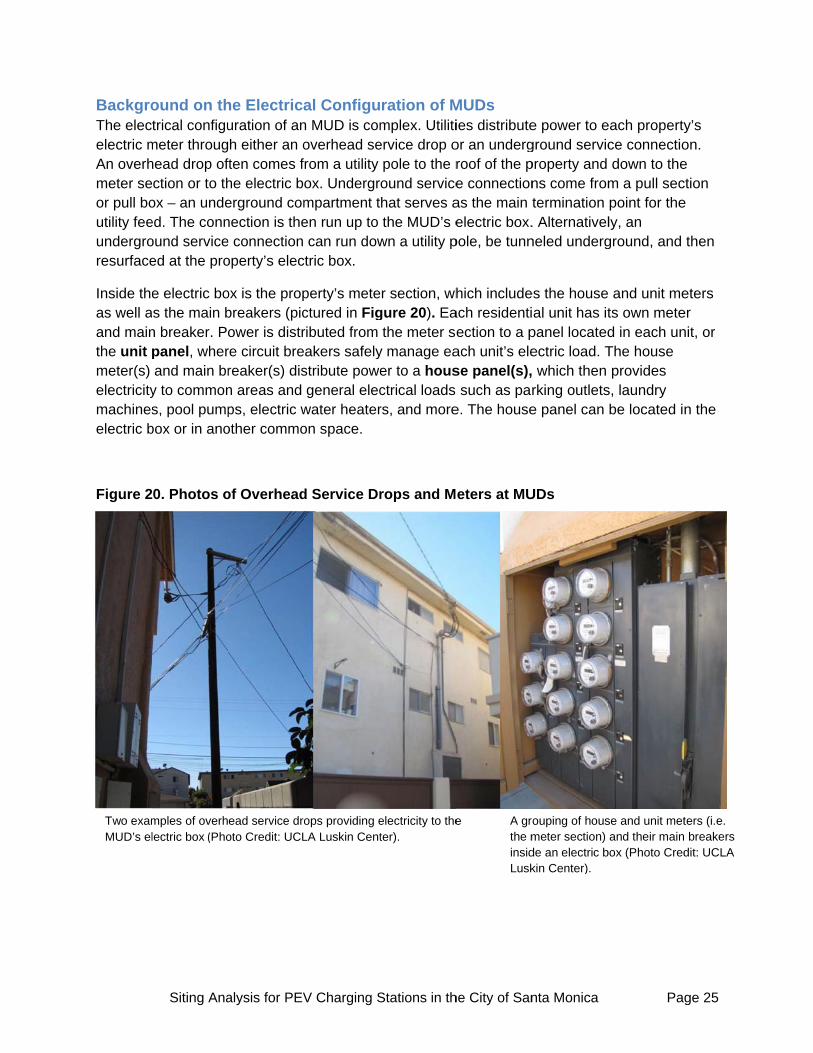
BackgroThe elecelectric mAn overhmeter seor pull boutility feeundergroresurface
Inside theas well aand mainthe unit meter(s) electricitymachineselectric b
Figure 2
Two examMUD’s el
Siting Ana
ound on thtrical configu
meter throughead drop ofction or to th
ox – an undeed. The connound serviceed at the pro
e electric bos the main b
n breaker. Popanel, wherand main br
y to commons, pool pump
box or in ano
0. Photos o
mples of overhlectric box (Pho
alysis for PEV
he Electricauration of anh either an o
ften comes fhe electric berground comnection is thee connection operty’s elec
ox is the propbreakers (picower is distrre circuit brereaker(s) disn areas and ps, electric wother commo
of Overhead
ead service drooto Credit: UCL
V Charging S
al Configun MUD is comoverhead sefrom a utility ox. Undergrmpartment ten run up to can run dow
ctric box.
perty’s metectured in Figributed from akers safely
stribute powegeneral elec
water heateron space.
d Service Dr
ops providing eLA Luskin Cent
Stations in th
ration of Mmplex. Utiliti
ervice drop opole to the round servicehat serves athe MUD’s e
wn a utility p
er section, whgure 20). Eathe meter se
y manage eaer to a housctrical loads rs, and more
rops and M
electricity to theter).
he City of San
MUDs ies distributeor an undergroof of the pe connectionas the main telectric box.
pole, be tunn
hich includeach residentiection to a pach unit’s elese panel(s),
such as pare. The house
eters at MU
e A grothe minsidLusk
nta Monica
e power to eground servicproperty and ns come fromtermination . Alternativelneled underg
es the houseal unit has it
panel locatedectric load. T which then rking outletse panel can
UDs
ouping of housmeter section) de an electric bkin Center).
Pag
each propertyce connectiodown to the
m a pull secpoint for thely, an ground, and
and unit mets own meted in each unThe house provides
s, laundry be located i
se and unit metand their main
box (Photo Cred
ge 25
y’s on. e ction e
then
eters er nit, or
n the
ters (i.e. breakers dit: UCLA
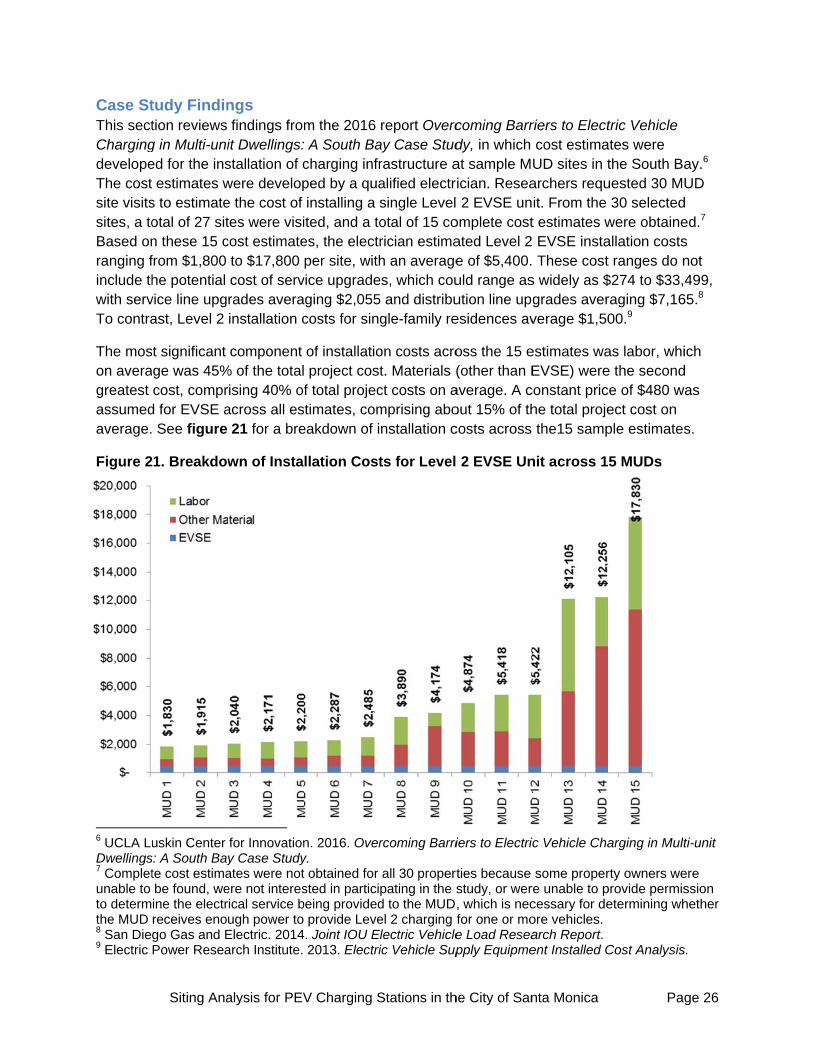
Case StThis sectChargingdevelopeThe cost site visitssites, a toBased onranging finclude thwith servTo contra
The moson averagreatest assumedaverage.
Figure 2
6 UCLA LuDwellings7 Completunable to to determthe MUD 8 San Die9 Electric
Siting Ana
tudy Findintion reviews g in Multi-unied for the ins
estimates ws to estimateotal of 27 sitn these 15 cfrom $1,800 he potential
vice line upgast, Level 2
t significant ge was 45%cost, compr
d for EVSE a See figure
1. Breakdow
uskin Center
s: A South Bayte cost estimabe found, weine the electrreceives enogo Gas and EPower Resea
alysis for PEV
ngs findings from
it Dwellings:stallation of cwere develope the cost of tes were visicost estimate
to $17,800 cost of servrades averainstallation c
component % of the totalrising 40% ofacross all es
21 for a bre
wn of Insta
for Innovationy Case Studyates were notere not interesical service bugh power to Electric. 2014arch Institute.
V Charging S
m the 2016 : A South Bacharging infrped by a quainstalling a s
ited, and a toes, the electrper site, with
vice upgradeging $2,055costs for sing
of installatio project costf total projectimates, com
eakdown of i
llation Cost
n. 2016. Overy. t obtained for sted in partici
being providedprovide Leve. Joint IOU El2013. Electri
Stations in th
report Overcay Case Studrastructure aalified electrsingle Levelotal of 15 corician estimah an average
es, which cou5 and distribugle-family re
on costs acrot. Materials (ct costs on amprising abonstallation c
ts for Level
rcoming Barri
all 30 propertpating in the sd to the MUDel 2 charging
Electric Vehicleic Vehicle Sup
he City of San
coming Barrdy, in which at sample Mrician. Resea 2 EVSE un
omplete costated Level 2e of $5,400.uld range asution line upgesidences av
oss the 15 e(other than E
average. A cout 15% of thcosts across
2 EVSE Un
iers to Electri
rties because study, or wer, which is necfor one or moe Load Reseapply Equipme
nta Monica
riers to Electcost estimaUD sites in tarchers requit. From the t estimates w EVSE insta These cost
s widely as $grades aververage $1,50
estimates waEVSE) were
constant priche total projethe15 samp
nit across 1
ic Vehicle Cha
some properre unable to pcessary for deore vehicles. arch Report. ent Installed C
Pag
tric Vehicle ates were the South Ba
uested 30 M30 selected
were obtaineallation costst ranges do n$274 to $33,raging $7,1600.9
as labor, whie the secondce of $480 wect cost on ple estimates
5 MUDs
arging in Mult
rty owners weprovide permisetermining wh
Cost Analysis
ge 26
ay.6 UD
d ed.7 s not 499,
65.8
ich d as
s.
ti-unit
ere ssion hether
s.
Siting Analysis for PEV Charging Stations in the City of Santa Monica Page 27
Chapter 7: Financial Incentives for MUD Owners
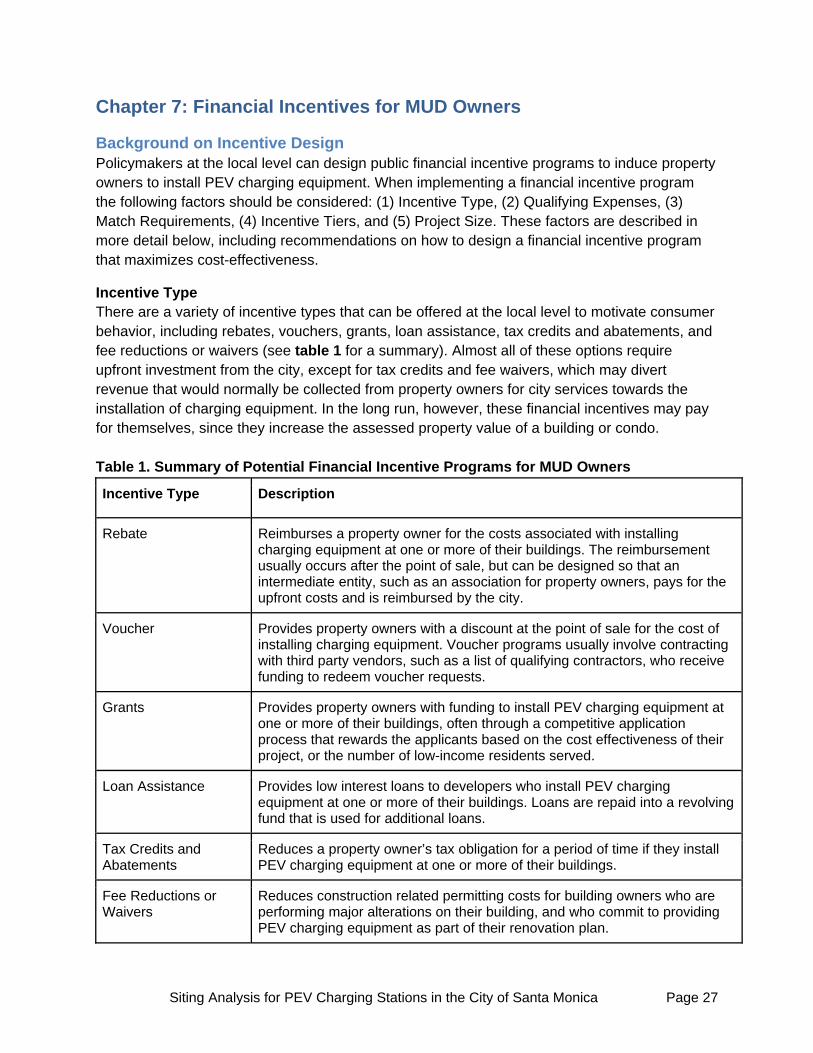
Background on Incentive Design Policymakers at the local level can design public financial incentive programs to induce property owners to install PEV charging equipment. When implementing a financial incentive program the following factors should be considered: (1) Incentive Type, (2) Qualifying Expenses, (3) Match Requirements, (4) Incentive Tiers, and (5) Project Size. These factors are described in more detail below, including recommendations on how to design a financial incentive program that maximizes cost-effectiveness.
Incentive Type There are a variety of incentive types that can be offered at the local level to motivate consumer behavior, including rebates, vouchers, grants, loan assistance, tax credits and abatements, and fee reductions or waivers (see table 1 for a summary). Almost all of these options require upfront investment from the city, except for tax credits and fee waivers, which may divert revenue that would normally be collected from property owners for city services towards the installation of charging equipment. In the long run, however, these financial incentives may pay for themselves, since they increase the assessed property value of a building or condo. Table 1. Summary of Potential Financial Incentive Programs for MUD Owners
Incentive Type Description
Rebate Reimburses a property owner for the costs associated with installing charging equipment at one or more of their buildings. The reimbursement usually occurs after the point of sale, but can be designed so that an intermediate entity, such as an association for property owners, pays for the upfront costs and is reimbursed by the city.
Voucher Provides property owners with a discount at the point of sale for the cost of installing charging equipment. Voucher programs usually involve contracting with third party vendors, such as a list of qualifying contractors, who receive funding to redeem voucher requests.
Grants
Provides property owners with funding to install PEV charging equipment at one or more of their buildings, often through a competitive application process that rewards the applicants based on the cost effectiveness of their project, or the number of low-income residents served.
Loan Assistance Provides low interest loans to developers who install PEV charging equipment at one or more of their buildings. Loans are repaid into a revolving fund that is used for additional loans.
Tax Credits and Abatements
Reduces a property owner’s tax obligation for a period of time if they install PEV charging equipment at one or more of their buildings.
Fee Reductions or Waivers
Reduces construction related permitting costs for building owners who are performing major alterations on their building, and who commit to providing PEV charging equipment as part of their renovation plan.
Siting Analysis for PEV Charging Stations in the City of Santa Monica Page 28
Of the financial incentive program discussed here, we recommend a rebate program because it allows the city to tie reimbursement funds to certain performance metrics. For example, a partial rebate can be offered to property owners once they have purchased EVSE (e.g., 50% of rebate funds), and the remainder of the rebate can be offered to the property owner once the city can verify that a PEV is using the charging station (e.g., the other 50% of rebate funds). We recommend making the verification process as simple and as inexpensive as possible. Smart EVSE equipment that logs charging information can be quite costly compared to less advanced technologies. Thus, at a minimum, property owners should be allowed to simply submit a copy of their vehicle registration (or their tenant’s vehicle registration) in which the address of the PEV matches the address of the EVSE location. Tax credits can also be tied to performance metrics, but they lack a mechanism for providing partial funding upfront to the property owner, which can be critical for generating initial interest.
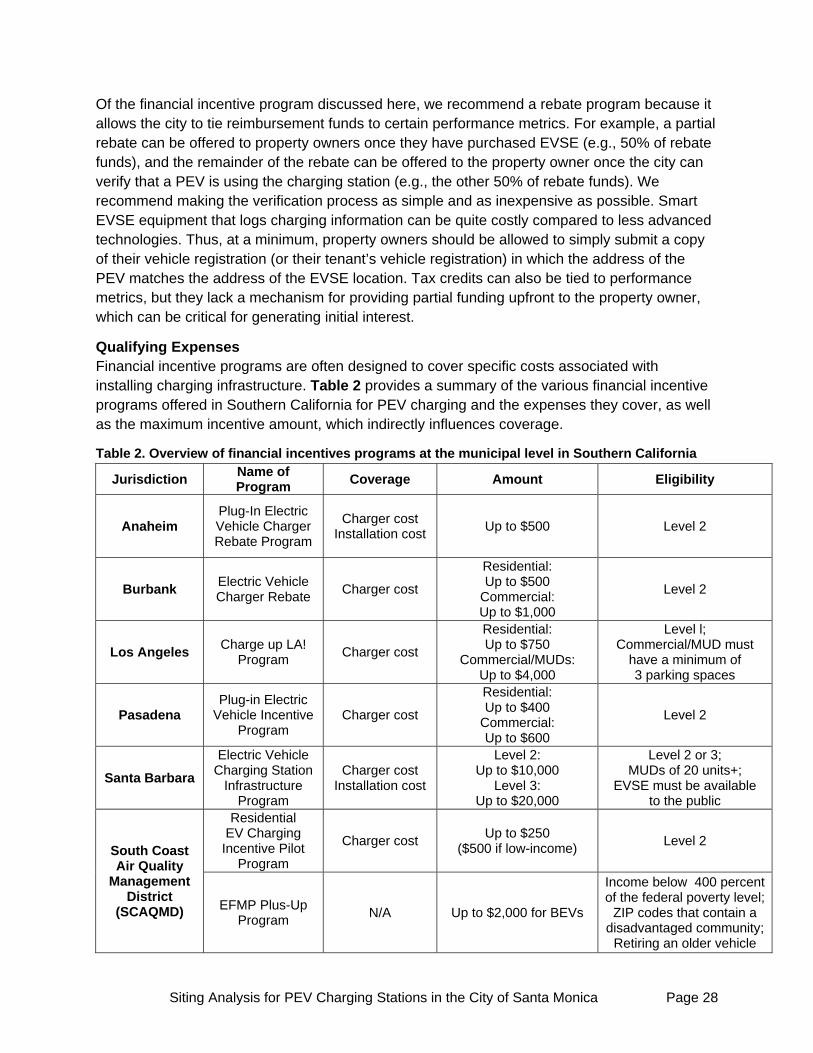
Qualifying Expenses Financial incentive programs are often designed to cover specific costs associated with installing charging infrastructure. Table 2 provides a summary of the various financial incentive programs offered in Southern California for PEV charging and the expenses they cover, as well as the maximum incentive amount, which indirectly influences coverage.
Table 2. Overview of financial incentives programs at the municipal level in Southern California
Jurisdiction Name of Program
Coverage Amount Eligibility
Anaheim Plug-In Electric Vehicle Charger Rebate Program
Charger cost Installation cost
Up to $500 Level 2
Burbank Electric Vehicle Charger Rebate
Charger cost
Residential: Up to $500
Commercial: Up to $1,000
Level 2
Los Angeles Charge up LA!
Program Charger cost
Residential: Up to $750
Commercial/MUDs: Up to $4,000
Level l; Commercial/MUD must
have a minimum of 3 parking spaces
Pasadena Plug-in Electric
Vehicle Incentive Program
Charger cost
Residential: Up to $400
Commercial: Up to $600
Level 2
Santa Barbara
Electric Vehicle Charging Station
Infrastructure Program
Charger cost Installation cost
Level 2: Up to $10,000
Level 3: Up to $20,000
Level 2 or 3; MUDs of 20 units+;
EVSE must be available to the public
South Coast Air Quality
Management District
(SCAQMD)
Residential EV Charging Incentive Pilot
Program
Charger cost Up to $250
($500 if low-income) Level 2
EFMP Plus-Up Program
N/A Up to $2,000 for BEVs
Income below 400 percent of the federal poverty level;
ZIP codes that contain a disadvantaged community;
Retiring an older vehicle
Siting Analysis for PEV Charging Stations in the City of Santa Monica Page 29
Many of the programs in Table 2 only cover the costs associated with purchasing EVSE, either explicitly through eligibility guidelines, or implicitly through the available incentive amounts (i.e., maximum incentive amounts of $500). Based on sample cost estimates, however, EVSE comprises a relatively small percentage of the total cost of installing charging equipment, averaging around 15% of total installation costs.10 Thus, we recommend expanding the coverage of a financial incentive program to include a greater variety of potential costs that may be incurred during the installation process, including installation costs from running additional wiring and conduit from the panel to the charge point, and any necessary panel upgrades. During the early stages of an incentive program, however, we do not recommend using public dollars for financial incentives that compensate property owners for the cost of service upgrades. In some cases, service upgrades can potentially be avoided through strategic energy efficiency measures that reduce the overall load of the house panel. This can include efficient lighting, or energy efficient replacements for a property’s electric water heater, washer/dryer, or pool pump. Additionally, limited public dollars should first be used for the most cost effective projects that do not require expensive service upgrades. Incentive funding should be awarded separately for EVSE purchases and installation costs. Each of these costs should also have a separate maximum incentive amount. This will help control for the cost of the incentive program. For example, if a project comes significantly under budget for the cost of running wires and conduit from the panel to the charge point, then the property owner is incentivized to use leftover incentive funds to purchase the most expensive EVSE option available, rather than the most cost effective option. Setting maximum incentive amounts for EVSE and installation activities also encourages retailers and contractors to keep their prices low, since property owners can’t combine incentive amounts for any single expense. The coverage of a rebate program should also take into account the incentives offered by overlapping programs. For example, if a condo owner qualifies for an EVSE unit through SCAQMD’s Residential EV Charging Incentive Pilot Program, then the cost of their EVSE should be excluded from their incentive amount offered through the City of Santa Monica. Ensuring that public dollars aren’t double counted towards the same purchase requires coordination among public agencies. Match Requirements Since the PEV market is still in the early stages of development, matching fund requirements should be as low as possible in order to quickly grow the availability of MUD charging. As the PEV market grows, and property owners begin to see MUD charging as an amenity that increases the value of their building or condo, the required match should increase to ensure that applicants aren’t using public funds for upgrades they would have made anyway. Thus, we recommend piloting a financial incentive program that requires 0% in matching funds from property owners for the cost of EVSE and 25% in matching funds from property owners for the cost of installation. We recommend 25% in matching funds for the cost of installation because
10 Based on a sample of 15 cost estimates developed from the Southbay subregion.

Siting Analysis for PEV Charging Stations in the City of Santa Monica Page 30
installation activities may result in private benefits for property owners regardless of whether the EVSE unit is ever used (i.e., additional electrical capacity in parking areas that can support a variety of end uses). As discussed, the cost of any potential service upgrades should be the responsibility of the property owner, at least during the early stages of financial incentive program. Incentive Tiers The role that cost plays in investment decisions around PEV charging infrastructure ultimately depends on the property owner’s household income. For wealthy condo owners, the cost of installing charging infrastructure may be relatively marginal, and their reluctance to switch to a PEV may be due to other some motivating factor (e.g., loyalty to a particular car brand that does not yet offer an electric option). For lower income condo owners, on the other hand, the cost of installing charging infrastructure is likely more critical in their decision to invest. To accommodate a range of incomes, incentive programs should offer tiered incentives based on income levels of property owners, such that lower income individuals receive the greatest financial incentives. These types of progressive incentives have proven to be more cost effective, have lower total policy costs, and result in greater allocative equity.11 Tiered incentives should also be offered for apartment building owners that rent to low income individuals, regardless of the property owner’s income. To receive the increased incentive for low income renters, the property should be required to document that the EVSE unit has been installed at a dedicated space for the low-income resident. Again, we recommend requiring a certain amount of charging sessions be logged at the EVSE unit by the low-income resident before the full financial incentive is distributed. This will help prevent property owners from using the increased incentive funding to install EVSE units at a parking sites that they plan to quickly reallocate to higher income renters. In addition to income, locational attributes can also be incorporated into an incentive scheme to ensure that the co-benefits of charging investments are maximized. If a MUD is located in a disadvantaged community, as identified by the California Environmental Protection Agency, then the financial incentive should be increased to incentivize greater investment in these neighborhoods. Disadvantaged communities are disproportionately affected by environmental pollution, or contain concentrations of people that are of low-income, high unemployment, low levels of home ownership, high rent burden, sensitive populations, or low levels of educational attainment.12 Investments in charging infrastructure in these neighborhoods can help reduce tailpipe emissions and improve local air quality.
11 Sheldon, Tamara L., J.R. DeShazo, Richard T. Carson, and Samuel Krumholz. 2016. Factors Affecting Plug-in Electric Vehicle Sales in California. Accessed August 2017 from http://innovation.luskin.ucla.edu/content/factors-affecting-plug-electric-vehicle-sales-california 12 CALEPA. 2017. Designation of Disadvantaged Communities Pursuant to Senate Bill 535 (De León). Accessed on August 2017 from https://calepa.ca.gov/wp-content/uploads/sites/34/2017/04/SB-535-Designation-Final.pdf
Siting Analysis for PEV Charging Stations in the City of Santa Monica Page 31
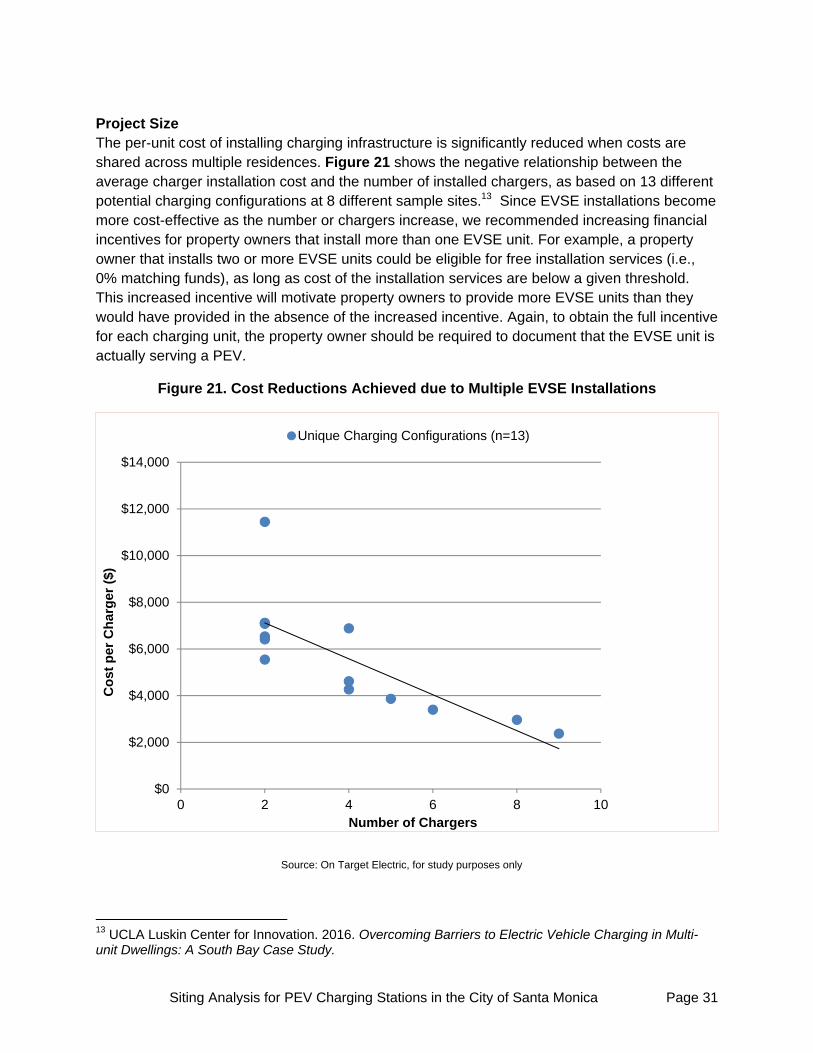
Project Size The per-unit cost of installing charging infrastructure is significantly reduced when costs are shared across multiple residences. Figure 21 shows the negative relationship between the average charger installation cost and the number of installed chargers, as based on 13 different potential charging configurations at 8 different sample sites.13 Since EVSE installations become more cost-effective as the number or chargers increase, we recommended increasing financial incentives for property owners that install more than one EVSE unit. For example, a property owner that installs two or more EVSE units could be eligible for free installation services (i.e., 0% matching funds), as long as cost of the installation services are below a given threshold. This increased incentive will motivate property owners to provide more EVSE units than they would have provided in the absence of the increased incentive. Again, to obtain the full incentive for each charging unit, the property owner should be required to document that the EVSE unit is actually serving a PEV.
Figure 21. Cost Reductions Achieved due to Multiple EVSE Installations
13 UCLA Luskin Center for Innovation. 2016. Overcoming Barriers to Electric Vehicle Charging in Multi-unit Dwellings: A South Bay Case Study.
$0
$2,000
$4,000
$6,000
$8,000
$10,000
$12,000
$14,000
0 2 4 6 8 10
Co
st p
er C
har
ger
($)
Number of Chargers
Unique Charging Configurations (n=13)
Source: On Target Electric, for study purposes only
Siting Analysis for PEV Charging Stations in the City of Santa Monica Page 32
Proposed Financial Incentive Program for the City of Santa Monica Based on the design considerations discussed in this report, we recommend piloting a rebate program that covers 100% of EVSE equipment costs (up to $750 in funding) and 75% of the installation costs (up to $3,000 in funding).
The rebate amounts are grounded in observed installation costs, as based on 15 sample cost estimates collected in the South Bay Region.14 Across the 15 sample cost estimates, $3,900 was the median cost of installation for a Level 2 EVSE unit, including the cost of EVSE and installation, but not the cost of service upgrades to the building. When all of the proposed rebate amounts are combined with the required match for installation costs, they sum to a total project cost of $4,750, which is about 22% above the median the total project cost observed in the South Bay region. Designing the rebate amounts for a total project cost that is slightly above the median cost observed in the South Bay allows for some contingency costs (i.e., unforeseeable costs that occur once installation activities actually begin), as well as more advanced EVSE technologies (the cost estimates from the South Bay region assume EVSE units that cost $480).
We also recommend an increased incentive for the following applicants: (1) low-income property owners, (2) property owners that rent to low-income residents who will charge a PEV in their designated parking spot, (3) property owners that have a building located in a Disadvantaged Community, and (4) property owners that install two or more EVSE units. For the increased incentive, we recommend waiving the match requirement for installation costs, as long as an EVSE unit is also installed. This would raise the full available incentive amount for installation costs from $3,000 to $4,000.
To qualify for installation related rebates, we recommend that applicants submit a cost estimates from a minimum of two qualified contractors before beginning their installation. If the total cost of installation falls below the upper limit of the allowable rebate amount ($3,000 for standard incentive or $4,000 for increased incentives), the property owner should be required to go with the least expensive contractor. Half of the rebate amount should be provided upfront, and the remaining half of the rebate should be provided once the property owner can document that the EVSE unit is serving a PEV.
The design of the financial incentive program, including match requirements and maximum rebate amounts, should be updated on an annual basis for the first three years of the program, and a biennial basis thereafter. A review of the program should evaluate whether the program is inducing demand, whether the incentive amounts accurately reflect the cost of EVSE installation for buildings in Santa Monica, and whether property owners are realizing private benefits from EVSE installation (e.g., an increase in property value). As the private benefits of EVSE installation becomes more recognized by property owners, an increasing match should be required from property owners at each stage of installation.
14 UCLA Luskin Center for Innovation. 2016. Overcoming Barriers to Electric Vehicle Charging in Multi-unit Dwellings: A South Bay Case Study.
Siting Analysis for PEV Charging Stations in the City of Santa Monica Page 33
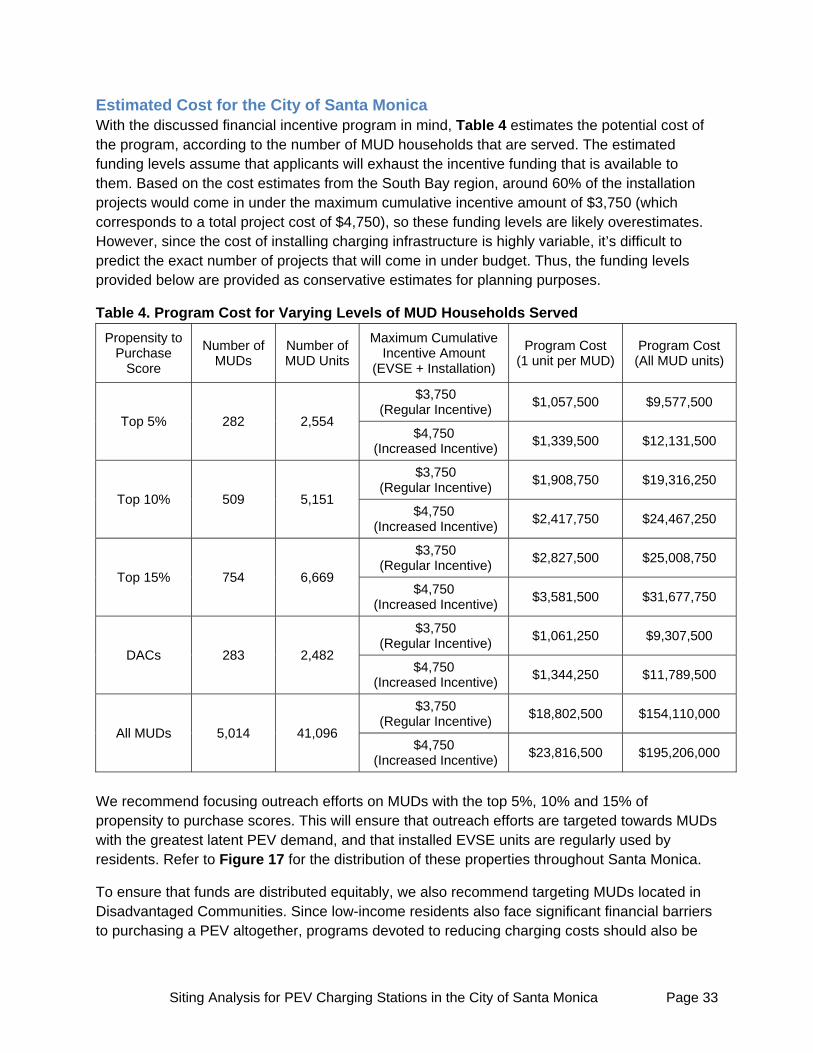
Estimated Cost for the City of Santa Monica With the discussed financial incentive program in mind, Table 4 estimates the potential cost of the program, according to the number of MUD households that are served. The estimated funding levels assume that applicants will exhaust the incentive funding that is available to them. Based on the cost estimates from the South Bay region, around 60% of the installation projects would come in under the maximum cumulative incentive amount of $3,750 (which corresponds to a total project cost of $4,750), so these funding levels are likely overestimates. However, since the cost of installing charging infrastructure is highly variable, it’s difficult to predict the exact number of projects that will come in under budget. Thus, the funding levels provided below are provided as conservative estimates for planning purposes.
Table 4. Program Cost for Varying Levels of MUD Households Served
Propensity to Purchase
Score
Number of MUDs
Number of MUD Units
Maximum Cumulative Incentive Amount
(EVSE + Installation)
Program Cost (1 unit per MUD)
Program Cost (All MUD units)
Top 5% 282 2,554
$3,750 (Regular Incentive)
$1,057,500 $9,577,500
$4,750 (Increased Incentive)
$1,339,500 $12,131,500
Top 10% 509 5,151
$3,750 (Regular Incentive)
$1,908,750 $19,316,250
$4,750 (Increased Incentive)
$2,417,750 $24,467,250
Top 15% 754 6,669
$3,750 (Regular Incentive)
$2,827,500 $25,008,750
$4,750 (Increased Incentive)
$3,581,500 $31,677,750
DACs 283 2,482
$3,750 (Regular Incentive)
$1,061,250 $9,307,500
$4,750 (Increased Incentive)
$1,344,250 $11,789,500
All MUDs 5,014 41,096
$3,750 (Regular Incentive)
$18,802,500 $154,110,000
$4,750 (Increased Incentive)
$23,816,500 $195,206,000
We recommend focusing outreach efforts on MUDs with the top 5%, 10% and 15% of propensity to purchase scores. This will ensure that outreach efforts are targeted towards MUDs with the greatest latent PEV demand, and that installed EVSE units are regularly used by residents. Refer to Figure 17 for the distribution of these properties throughout Santa Monica.
To ensure that funds are distributed equitably, we also recommend targeting MUDs located in Disadvantaged Communities. Since low-income residents also face significant financial barriers to purchasing a PEV altogether, programs devoted to reducing charging costs should also be

Siting Analysis for PEV Charging Stations in the City of Santa Monica Page 34
coupled with programs that focus on reducing vehicle costs. To support this effort, the California Air Resources Board (CARB) has launched several initiatives under its Low Carbon Transportation Program aimed at expanding PEV adoption among low- and moderate-income households (e.g., EFMP Plus-Up, Light-Duty Financing Assistance, CVRP increased incentives, etc.).15 Outreach to MUD residents in Disadvantaged Communities should focus on making these programs more visible to low- and moderate-income households.
15 CARB. 2015. “Low Carbon Transportation Light-Duty Project Projects that Benefit Disadvantaged Communities.” Accessed on August 2017 from https://www.arb.ca.gov/msprog/aqip/ldv_pilots.htm
Siting Analysis for PEV Charging Stations in the City of Santa Monica Page 35
Technical Appendix This appendix describes the methods, assumptions and data sources used to create the maps and charts presented in this study. They are presented in the same order in which they appear.
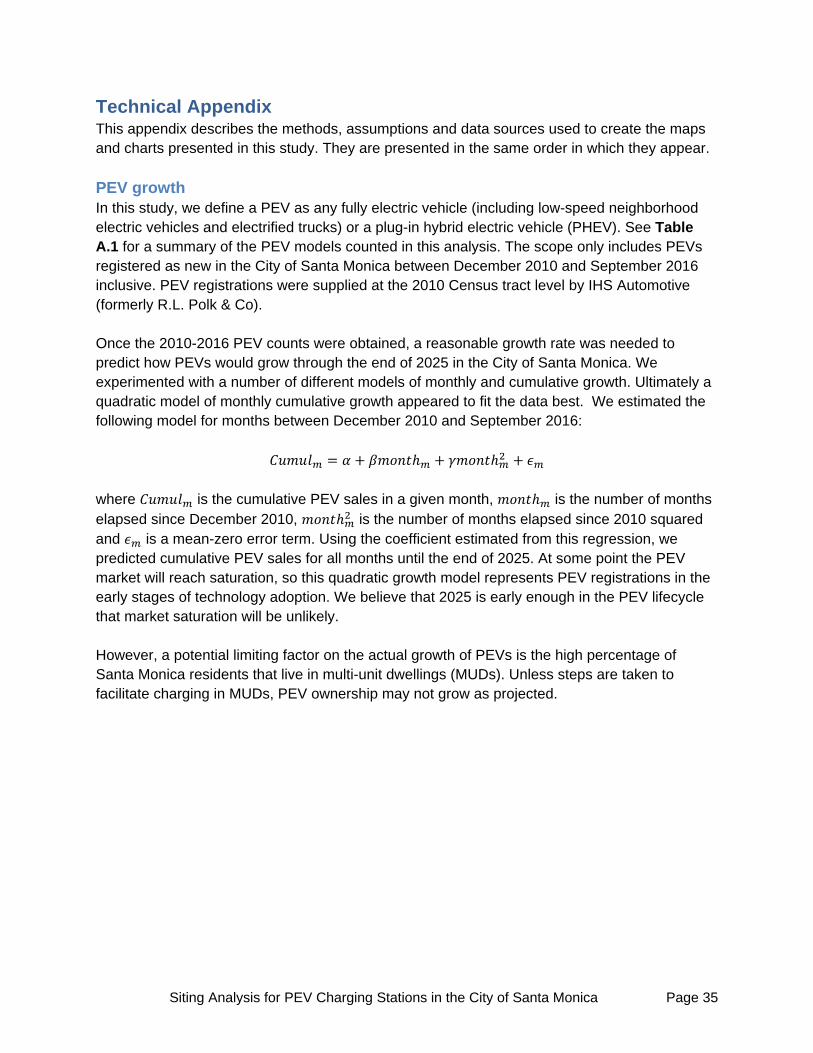
PEV growth In this study, we define a PEV as any fully electric vehicle (including low-speed neighborhood electric vehicles and electrified trucks) or a plug-in hybrid electric vehicle (PHEV). See Table A.1 for a summary of the PEV models counted in this analysis. The scope only includes PEVs registered as new in the City of Santa Monica between December 2010 and September 2016 inclusive. PEV registrations were supplied at the 2010 Census tract level by IHS Automotive (formerly R.L. Polk & Co). Once the 2010-2016 PEV counts were obtained, a reasonable growth rate was needed to predict how PEVs would grow through the end of 2025 in the City of Santa Monica. We experimented with a number of different models of monthly and cumulative growth. Ultimately a quadratic model of monthly cumulative growth appeared to fit the data best. We estimated the following model for months between December 2010 and September 2016:
where is the cumulative PEV sales in a given month, is the number of months elapsed since December 2010, is the number of months elapsed since 2010 squared and is a mean-zero error term. Using the coefficient estimated from this regression, we predicted cumulative PEV sales for all months until the end of 2025. At some point the PEV market will reach saturation, so this quadratic growth model represents PEV registrations in the early stages of technology adoption. We believe that 2025 is early enough in the PEV lifecycle that market saturation will be unlikely. However, a potential limiting factor on the actual growth of PEVs is the high percentage of Santa Monica residents that live in multi-unit dwellings (MUDs). Unless steps are taken to facilitate charging in MUDs, PEV ownership may not grow as projected.
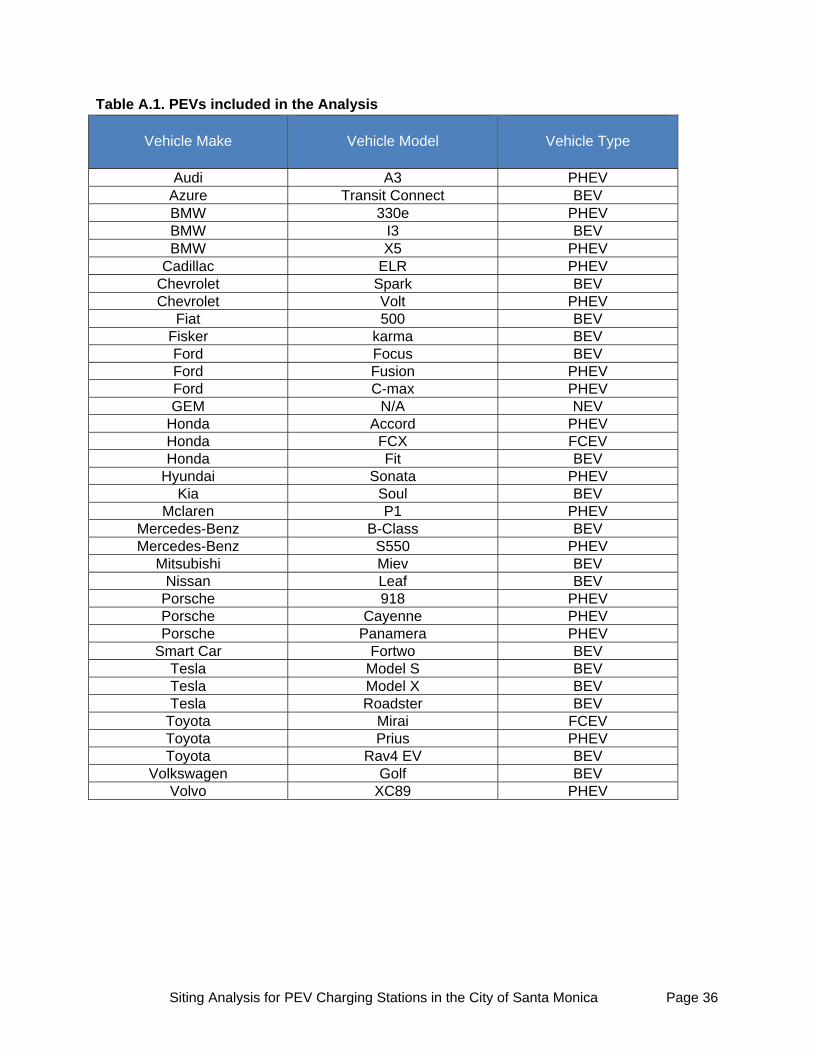
Siting Analysis for PEV Charging Stations in the City of Santa Monica Page 36
Table A.1. PEVs included in the Analysis
Vehicle Make
Vehicle Model
Vehicle Type
Audi A3 PHEV
Azure Transit Connect BEV BMW 330e PHEV BMW I3 BEV BMW X5 PHEV
Cadillac ELR PHEV Chevrolet Spark BEV Chevrolet Volt PHEV
Fiat 500 BEV Fisker karma BEV Ford Focus BEV Ford Fusion PHEV Ford C-max PHEV GEM N/A NEV
Honda Accord PHEV Honda FCX FCEV Honda Fit BEV
Hyundai Sonata PHEV Kia Soul BEV
Mclaren P1 PHEV Mercedes-Benz B-Class BEV Mercedes-Benz S550 PHEV
Mitsubishi Miev BEV Nissan Leaf BEV
Porsche 918 PHEV Porsche Cayenne PHEV Porsche Panamera PHEV
Smart Car Fortwo BEV Tesla Model S BEV Tesla Model X BEV Tesla Roadster BEV
Toyota Mirai FCEV Toyota Prius PHEV Toyota Rav4 EV BEV
Volkswagen Golf BEV Volvo XC89 PHEV
Siting Analysis for PEV Charging Stations in the City of Santa Monica Page 37
PEV registration The PEV registration maps show the number of PEVs registered between December 2010 and September 2016 in the City of Santa Monica by Tier 1 travel analysis zone (TAZ). TAZs closely follow 2000 Census tract boundaries and are used by the Southern California Association of Governments (SCAG) to estimate travel within and between neighborhoods. Within the City of Santa Monica, there are 23 TAZs and 19 Census tracts. The map colors move from lighter in areas with no or few PEVs registered to darker in areas with more PEVs registered. PEV registration data was supplied at the 2010 Census tract level by IHS Automotive (formerly R.L. Polk & Co), and was harmonized with TAZ boundaries.
PEV morning peak destinations We used the outputs from SCAG’s 2016 Regional Model to determine the arrival locations and densities of PEVs during peak morning hours.16 Using surveys of household travel behavior, SCAG’s travel demand model estimates the number of trips from home to work, school, and other destinations by time of day. The morning peak period represents weekday trips that occur between 6:00 a.m. to 9:00 a.m. (i.e., commutes to work). The model does not distinguish commuting patterns by vehicle type, so we assumed that the commuting patterns of PEVs are the same as those of conventional vehicles, and applied the proportion of PEVs registered in the origin TAZ to the commute patterns that characterize that TAZ. The data on PEV registrations comes from automotive data vendor IHS Automotive (formerly R.L. Polk & Co)., which provided the number of PEVs registered as new within each 2010 Census tract from December 2010 through September 2016. It is important to note that these morning peak destination TAZs receive vehicles from outside the City of Santa Monica.
PEV mid-day destinations We used the outputs from SCAG’s 2016 Regional Model to determine the arrival locations and densities of PEVs during mid-day hours.17 Using surveys of household travel behavior, SCAG’s travel demand model estimates the number of trips from home to work, school, and other destinations by time of day. The mid-day period represents weekday trips that occur between 9:00 a.m. to 3:00 p.m. (i.e., trips to run errands). The model does not distinguish commuting patterns by vehicle type, so we assumed that the commuting patterns of PEVs are the same as those of conventional vehicles, and applied the proportion of PEVs registered in the origin TAZ to the commute patterns that characterize that TAZ. The data on PEV registrations comes from automotive data vendor IHS Automotive (formerly R.L. Polk & Co)., which provided the number of PEVs registered as new within each 2010 Census tract from December 2010 through September 2016. It is important to note that these mid-day destination TAZs receive vehicles from outside the City of Santa Monica.
16 SCAG. 2016. SCAG Regional Travel Demand Model and 2012 Model Validation. Accessed August 2017 from http://www.scag.ca.gov/Documents/SCAG_RTDM_2012ModelValidation.pdf 17 Ibid.
Siting Analysis for PEV Charging Stations in the City of Santa Monica Page 38
Employment density The maps of employment density were prepared using commercially available Infogroup data from 2015 on employer size (i.e., number of employees) and location. This data is compiled form public documents that disclose employment size, as well as through a website and phone verification process. Each circle on the map represents one workplace. The circles move from small to large and from yellow to red as the number of employees per workplace increases.
Publicly-accessible charging stations Data on publicly-assessable charging stations was obtained from the online database maintained by PlugShare (www.plugshare.com), which contains information posted by users that charge at these locations. “Publicly-accessible” refers to stations that are owned by either the government or private businesses but that are available for use by the general public. The precise number of connectors or charging units that are operational at any given time and location are subject to maintenance and upgrade schedules. The distribution of publicly-accessible charging stations presented in this report reflect a snapshot of the PlugShare database as of May 23, 2017.
Top 25 workplace sites that do not currently host on-site charging This map highlights the top 25 workplace sites that do not currently host on-site charging, as determined by the two following variables: (1) the number of employees hosted by the workplace (2) the morning PEV density for the TAZ in which the workplace is located. To construct this map, all workplaces that currently host on-site charging were excluded from the analysis. This step was completed by spatially joining all workplace sites and publicly-accessible charging stations to parcels of land, and then excluding any workplaces that shared a parcel of land with a publicly accessible charging station. Then, a percentile ranking was assigned to each workplace site according to the two aforementioned variables (i.e., employment density and morning PEV density). These two percentile rankings were then summed to create a combined ranking. Each percentile ranking was weighted equally during the summation process.
Commercial (retail) destination maps This map data is obtained from SCAG’s 2012 Existing Land Use Dataset, which includes information on the concentration of retail centers in the SCAG region. The land use data was originally developed by Aerial Information Systems, Inc. as a Modified Anderson Land Use Classification for the 2008 SCAG land use dataset. The 2012 dataset is based on the 2008 dataset and is updated using 2008-2012 new construction data and inputs from local jurisdictions in the SCAG region.18 The designations were determined by using aerial photography to estimate the land use at the parcel level. The commercial (retail) destination maps contain retail and small business locations (such as beauty salons and small offices) within the City of Santa Monica. They highlight five types of 18 SCAG. 2012. Land Use Los Angeles. Accessed August 2017 from http://gisdata-scag.opendata.arcgis.com/datasets/0c432b1bca21426e83e40a358414fe7c_0

Siting Analysis for PEV Charging Stations in the City of Santa Monica Page 39
retail centers that are likely to attract many of the non-work related vehicular trips. These five categories are summarized in Table A.2. Table A.2. Commercial (Retail) Designations in the 2012 SCAG Existing Land Use Dataset
Code Description Key Attribute
1220 Commercial (Other) Retail stores and other/unknown commercial development
1221 Regional Shopping Center Department store with surrounding parking
1222 Retail Centers (Non-Strip With Contiguous Interconnected Off-Street Parking)
Magnet store with in-front parking
1223 Modern Strip Development Small businesses with parking on-street and on one side
1224 Older Strip Development Small businesses with on-street parking
Land use Code 1220, Commercial (Other), is the general code used for retail stores and commercial development when the specific sub-land use is not discernable. Land use Code 1221, Regional Shopping Center, contains large retail centers with at least one major department store and a range of other smaller retail establishments. These shopping centers are generally enclosed malls with parking surrounding the one to three story building. This also includes factory outlet malls. Land use Code 1222, Retail Centers, is comprised of at least one large magnet store, a large off-street parking lot, and additional detached commercial stores, including small retail stores, gas stations, and restaurants. All structures are generally one story tall. Retail Centers are often located conveniently off major highways or highly trafficked surface streets. Land use Code 1223, Modern Strip Malls, designates parcels which contain retail stores, restaurants, service shops, and offices, and are often located along major traffic corridors. Parking is available on-street as well as off-street either in front, on the side, or behind the structures. Included in this category are gas stations, auto repair shops, convenience stores, liquor stores, small bank branch offices, clothing stores, restaurants, furniture stores, discount stores, novelty stores, car dealerships or auto centers, drug stores, small corner markets, auctions, and smaller malls which do not contain a large magnet store. Finally, land use Code 1224, Older Strip Development, contains parcels of land with little or no off-street parking. This category is commonly found in older city and town business corridors. Units are small retail establishments, restaurants, and offices with storefronts without setback,
Siting Analysis for PEV Charging Stations in the City of Santa Monica Page 40
adjacent to the sidewalk. Units are often attached to the neighboring unit creating and uninterrupted streetscape. Units with commercial space on the first floor and residential units on upper floors can be considered Older Strip Development.19
Top 25 Commercial sites that do not currently host on-site charging This map highlights the top 25 commercial sites that do not currently host on-site charging, as determined by the two following variables: (1) the number of employees hosted by the commercial site, which is intended to serve as a proxy for customer traffic, and (2) the mid-day PEV density for the TAZ in which the commercial site is located. To construct this map, all commercial sites that currently host on-site charging were excluded from the analysis. This step was completed by spatially joining all the publicly-accessible charging stations to commercial parcels of land, and then excluding any parcels with a publicly-accessible charging station. Then, a percentile ranking was assigned to each commercial site according to the two aforementioned variables (i.e., employment density and afternoon PEV density). These two percentile rankings were then summed to create a combined ranking. Each percentile ranking was weighted equally during the summation process
Parking Facilities The locations of parking facilities were obtained from the Public Facilities shapefile published on Santa Monica’s Open Data portal.20 The shapefile includes public land parcel boundaries, including: public schools, public parks, hospitals, libraries, fire and police stations, public parking facilities and city occupied parcels. For the purposes of this study, public parking facilities were isolated from the all other public facility types.
Parking Meters The locations of parking meters were obtained from a dataset maintained by the City of Santa Monica, and made available on November 28, 2016.
Multi-unit residences maps This data is obtained from SCAG’s 2012 Existing Land Use Dataset, which includes information on the concentration of all residential units other than single-family in the SCAG region. The land use data was originally developed by Aerial Information Systems, Inc. as a Modified Anderson Land Use Classification for the 2008 SCAG land use dataset. The 2012 dataset is based on this 2008 dataset and is updated using 2008-2012 new construction data and inputs from local jurisdictions in the SCAG region.21 The designations were determined by using aerial photography to estimate the land use at the parcel level. Each residential parcel in the dataset is assigned a code that best describes the composition of residential unit types. The factors that
19 SCAG. 2002. Southern California 1990 Aerial Land Use Study: Land Use Code Descriptions and Key Signatures, Level III/IV. 20 City of Santa Monica. 2017. Santa Monica Open Data: Public Facilities. Accessed August 2017 from https://data.smgov.net/Public-Services/Public-Facilities/efsc-edft 21 SCAG. 2012. Land Use Los Angeles. Accessed August 2017 from
http://gisdata-scag.opendata.arcgis.com/datasets/0c432b1bca21426e83e40a358414fe7c_0
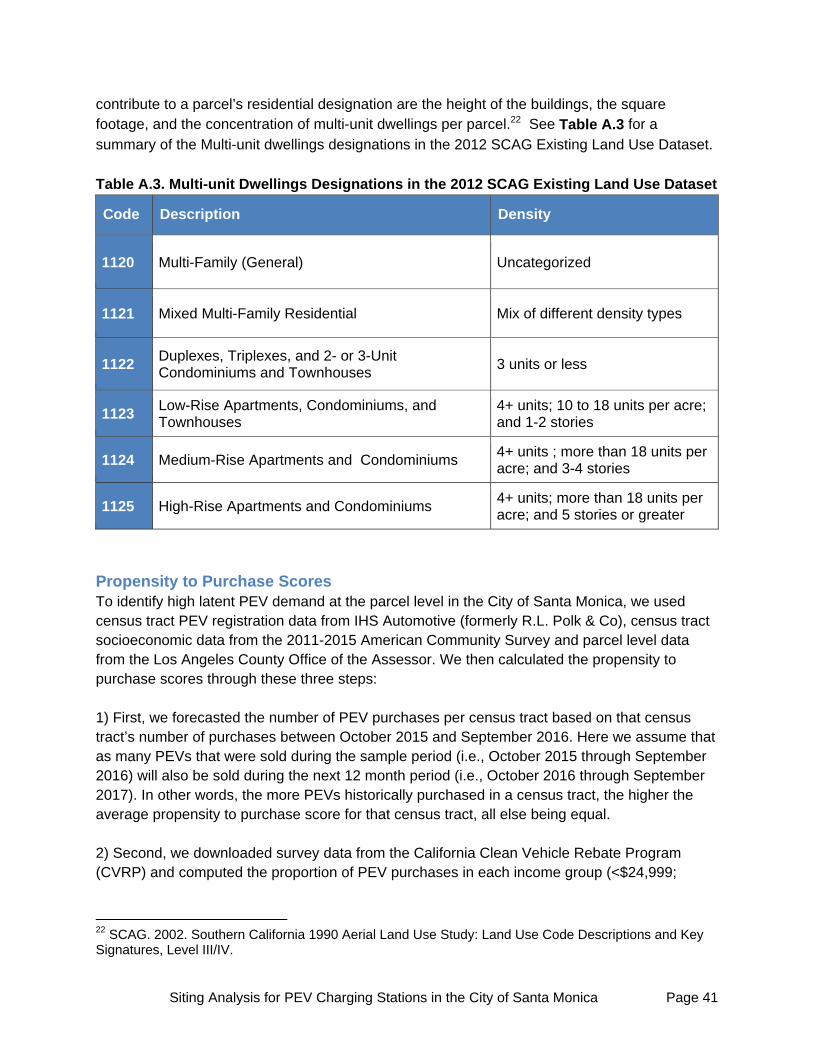
Siting Analysis for PEV Charging Stations in the City of Santa Monica Page 41
contribute to a parcel’s residential designation are the height of the buildings, the square footage, and the concentration of multi-unit dwellings per parcel.22 See Table A.3 for a
summary of the Multi-unit dwellings designations in the 2012 SCAG Existing Land Use Dataset. Table A.3. Multi-unit Dwellings Designations in the 2012 SCAG Existing Land Use Dataset
Code Description Density
1120 Multi-Family (General) Uncategorized
1121 Mixed Multi-Family Residential Mix of different density types
1122 Duplexes, Triplexes, and 2- or 3-Unit Condominiums and Townhouses
3 units or less
1123 Low-Rise Apartments, Condominiums, and Townhouses
4+ units; 10 to 18 units per acre; and 1-2 stories
1124 Medium-Rise Apartments and Condominiums 4+ units ; more than 18 units per acre; and 3-4 stories
1125 High-Rise Apartments and Condominiums 4+ units; more than 18 units per acre; and 5 stories or greater
Propensity to Purchase Scores To identify high latent PEV demand at the parcel level in the City of Santa Monica, we used census tract PEV registration data from IHS Automotive (formerly R.L. Polk & Co), census tract socioeconomic data from the 2011-2015 American Community Survey and parcel level data from the Los Angeles County Office of the Assessor. We then calculated the propensity to purchase scores through these three steps: 1) First, we forecasted the number of PEV purchases per census tract based on that census tract’s number of purchases between October 2015 and September 2016. Here we assume that as many PEVs that were sold during the sample period (i.e., October 2015 through September 2016) will also be sold during the next 12 month period (i.e., October 2016 through September 2017). In other words, the more PEVs historically purchased in a census tract, the higher the average propensity to purchase score for that census tract, all else being equal. 2) Second, we downloaded survey data from the California Clean Vehicle Rebate Program (CVRP) and computed the proportion of PEV purchases in each income group (<$24,999;
22 SCAG. 2002. Southern California 1990 Aerial Land Use Study: Land Use Code Descriptions and Key Signatures, Level III/IV.

Siting Analysis for PEV Charging Stations in the City of Santa Monica Page 42
$25,000-$49,999; $50,000-$74,999; $75,000-$99,999; greater than $100,000).23 Here we assume that PEV purchaser's income distribution at the census tract level is identical to that of the whole state. We also assume that the historical relationship between income and PEV adoption will continue into the future. In other words, the greater proportion of high-income residents in a census tract, the higher the average propensity to purchase score for that census tract, all else being equal. 3) Finally, we downloaded data on income by home value for each census tract and used this to estimate the probability of someone with a certain income level living in a home with a given value. Since MUDs are the focus of this study, home values were assumed to be commensurate with condo values and apartment values. We also assume that the historical relationship between home values and income will continue into the future. In other words, the greater the value of a condo or apartment, the higher the likelihood that someone with a high income is living in that unit, and the higher the propensity to purchase score assigned to that unit. In summary, we used three variables – the forecasted PEV purchases per census tract, the number of PEV purchases per income group, and the percentage of income group living in homes of certain values – to determine a relationship between the value of a home and its propensity to purchase a PEV. We then spatialized that relationship using parcel level data obtained from the Los Angeles County Office of the Assessor. For each MUD in the study area, we assigned a propensity to purchase score based on the MUD's average unit value (i.e., total property value divided by number of units).
23 Center for Sustainable Energy. 2017. “EV Consumer Survey Dashboard.” Accessed August 2017 from https://cleanvehiclerebate.org/eng/survey-dashboard/ev