Future Scenarios for the Bangladesh Petroleum Sector...
136
Future Scenarios for the Bangladesh Petroleum Sector Development Under Strengthening of Hydrocarbon Unit in the Energy and Mineral Resources Division (Phase-II) ADB Grant 0019: GTDP Prepared for: HYDROCARBON UNIT Energy and Mineral Resources Division Government of the People’s Republic of Bangladesh Originally submitted: October 10, 2011 Revised: June 5, 2012
Transcript of Future Scenarios for the Bangladesh Petroleum Sector...

Future Scenarios for the Bangladesh Petroleum Sector Development
Under
Strengthening of Hydrocarbon Unit in the
Energy and Mineral Resources Division (Phase-II)
ADB Grant 0019: GTDP
Prepared for:
HYDROCARBON UNIT
Energy and Mineral Resources Division
Government of the People’s Republic of Bangladesh
Originally submitted: October 10, 2011
Revised: June 5, 2012

6/5/2012 i Gustavson Associates
TABLE OF CONTENTS PAGE
1 EXECUTIVE SUMMARY ........................................................................................................ 1
2 INTRODUCTION ...................................................................................................................... 4
3 BANGLADESH GAS DEMAND FORECASTS ...................................................................... 5
3.1 INTRODUCTION .............................................................................................................. 5 3.2 HISTORICAL GAS DEMAND ......................................................................................... 6 3.3 SUMMARY OF PREVIOUS FORECASTS ..................................................................... 9 3.4 DETAILS OF PREVIOUS FORECASTS ....................................................................... 12
3.4.1 Wood Mackenzie .................................................................................................... 12 3.4.1.1 Total Gas Demand Forecast ...................................................................... 12 3.4.1.2 Power Sector Demand ............................................................................... 17 3.4.1.3 Non-Bulk Sector Demand ......................................................................... 20 3.4.1.4 Fertiliser Sector Demand ........................................................................... 22
3.4.2 Petrobangla ............................................................................................................. 23 3.4.2.1 Total Gas Demand ..................................................................................... 24 3.4.2.2 Power Sector Demand ............................................................................... 26 3.4.2.3 Captive Power Sector Demand .................................................................. 27 3.4.2.4 Fertiliser Sector Demand ........................................................................... 28 3.4.2.5 Non- Bulk Sector Demand ........................................................................ 30
3.4.3 ECON Analysis ....................................................................................................... 31 3.4.4 Global Data Forecast............................................................................................... 34
3.5 NEW FORECAST SCENARIOS .................................................................................... 35
4 GAS INFRASTRUCTURE AND POTENTIAL ENERGY SUPPLY SOURCES ................. 39
4.1 GAS TRANSMISSION AND MARKETING INFRASTRUCTURE ............................ 39 4.2 EXISTING FIELDS ......................................................................................................... 41
4.2.1 Field Production History ......................................................................................... 42 4.2.2 Petrobangla Owned Producing Gas Fields ............................................................. 43
4.2.2.1 Titas Gas Field, Block 12, BGFCL ........................................................... 43 4.2.2.2 Bakhrabad Gas Field, Block 9, BGFCL .................................................... 43 4.2.2.3 Habiganj Gas Field, Block 12, BGFCL .................................................... 44 4.2.2.4 Narsingdi Gas Field, Block 9, BGFCL ..................................................... 44 4.2.2.5 Meghna Gas Field, Block 9, BGFCL ........................................................ 45 4.2.2.6 Sylhet (Haripur) Gas Field, Block 13, SGFL ............................................ 45 4.2.2.7 Kailash Tila Gas Field, Block 13, SGFL ................................................... 46 4.2.2.8 Rashidpur Gas Field, Block 12, SGFL ...................................................... 47 4.2.2.9 Beani Bazar Gas Field, Block 14, SGFL ................................................... 48 4.2.2.10 Saldanadi Gas Field, BAPEX .................................................................... 48 4.2.2.11 Fenchuganj Gas Field, Block 14 ............................................................... 49 4.2.2.12 Shahbazpur Gas Field, Block 10, BAPEX ................................................ 49
4.2.3 Petrobangla Owned Undeveloped Gas Fields ......................................................... 50
6/5/2012 ii Gustavson Associates
4.2.3.1 Begumganj Gas Field ................................................................................ 50 4.2.3.2 Semutang Gas Field ................................................................................... 50 4.2.3.3 Kutubdia Gas Field .................................................................................... 50
4.2.4 IOC Operated Gas Fields ........................................................................................ 50 4.2.4.1 Jalalabad Gas Fields, Block 13, IOC: Chevron ......................................... 50 4.2.4.2 Moulavi Bazar Gas Field, Block 14, IOC: Chevron ................................. 51 4.2.4.3 Bibiyana Gas Field, Block 12, IOC: Chevron ........................................... 51 4.2.4.4 Sangu Gas Field, Block 16, IOC: Cairn/Santos ........................................ 52 4.2.4.5 Bangora Gas Field, Block 9, IOC: Niko/Tullow ....................................... 53 4.2.4.6 Feni Gas Field, block 15, IOC: Niko ......................................................... 53 4.2.4.7 Kamta Gas Field, Block 9, Suspended: Petrobangla ................................. 54 4.2.4.8 Chattak Gas Field, Block 12, Suspended: Niko & Bapex ......................... 54
4.3 PLANNED EXPLORATION .......................................................................................... 55 4.3.1 FY 2010 Plan .......................................................................................................... 55 4.3.2 Short Term Plan (expected completion by June 2013) ........................................... 56
4.3.2.1 Actions to be Taken by the National Gas Company ................................. 56 4.3.2.2 Actions to be Taken by International Oil Companies ............................... 57
4.3.3 Intermediate Term Plan (expected completion by December 2015) ...................... 57 4.3.3.1 Actions to be Taken by the National Gas Company ................................. 58 4.3.3.2 Actions Taken by International Oil Companies ........................................ 58
4.3.4 Summary ................................................................................................................. 58 4.3.5 Steps to Ensure the Implementation of the Plans .................................................... 58
4.4 GAS PRODUCTION AUGMENTATION (PREPARED BY SCHLUMBERGER) ..... 59 4.5 CONVENTIONAL GAS RESOURCE EXPLORATION .............................................. 60
4.5.1 Prospects ................................................................................................................. 60 4.5.2 Leads ....................................................................................................................... 60 4.5.3 Unmapped Resources.............................................................................................. 61
4.6 UNCONVENTIONAL GAS RESOURCES ................................................................... 63 4.6.1 Coal Bed Methane (CBM) ...................................................................................... 63 4.6.2 Shale Gas ................................................................................................................ 65
4.6.2.1 International Experience ............................................................................ 65 4.6.2.2 Shale Gas Prospects in Bangladesh ........................................................... 67 4.6.2.3 Shale Gas Development Initiative in Bangladesh ..................................... 68
4.6.3 Thin Beds ................................................................................................................ 69 4.7 SUPPLEMENTAL ENERGY SOURCES....................................................................... 69
4.7.1 LNG Imports ........................................................................................................... 70 4.7.2 Natural Gas Pipeline Imports .................................................................................. 71 4.7.3 Coal ......................................................................................................................... 72
4.7.3.1 Jamalganj Coal Field ................................................................................. 74 4.7.3.2 Barapukuria Coal Field ............................................................................. 74 4.7.3.3 Khalashpir Coal Field ................................................................................ 74 4.7.3.4 Dighipara Coal Field ................................................................................. 75 4.7.3.5 Phulbari Coal Field .................................................................................... 75

6/5/2012 iii Gustavson Associates
4.7.3.6 Coal Summary ........................................................................................... 75 4.7.4 Liquefied Petroleum Gas (LPG) ............................................................................. 77 4.7.5 Petroleum Products ................................................................................................. 78 4.7.6 Renewable Resources ............................................................................................. 78
4.7.6.1 Biomass ..................................................................................................... 79 4.7.6.2 Biofuel ....................................................................................................... 79 4.7.6.3 Hydro-electricity ....................................................................................... 81 4.7.6.4 Solar Energy .............................................................................................. 81 4.7.6.5 Wind Energy .............................................................................................. 83
4.7.7 Nuclear Energy ....................................................................................................... 84
5 IMPACT OF TARIFF REFORM ............................................................................................. 86
5.1 HISTORICAL GAS TARIFFS ........................................................................................ 86 5.2 PROBLEMS DUE TO THE CURRENT GAS TARIFF ................................................. 87 5.3 GOALS FOR A REVISED GAS TARIFF ...................................................................... 89 5.4 GAS PRICING METHODOLOGY ................................................................................. 90 5.5 SUMMARY ..................................................................................................................... 91
6 PRIVATE SECTOR INVOLVEMENT AND PRIVATIZATION OF GAS BUSINESS ....... 93
6.1 OVERVIEW OF THE PRIVATIZATION HISTORY IN BANGLADESH .................. 93 6.2 PETROBANGLA’S CURRENT ROLE IN THE GAS SECTOR ................................... 94 6.3 ALTERNATIVE ROLES FOR PETROBANGLA ......................................................... 94 6.4 SUMMARY ..................................................................................................................... 96
7 GAS SUPPLY SCENARIOS IN BANGLADESH .................................................................. 97
7.1 OVERVIEW..................................................................................................................... 97 7.2 ASSUMPTIONS .............................................................................................................. 98 7.3 BASE CASE .................................................................................................................. 101 7.4 ACCELERATED BASE CASE ..................................................................................... 108 7.5 HIGH DEMAND GROWTH CASE.............................................................................. 114 7.6 ACCELERATED HIGH DEMAND GROWTH CASE ................................................ 115 7.7 LOW DEMAND GROWTH CASE .............................................................................. 115 7.8 ACCELERATED LOW DEMAND GROWTH CASE................................................. 116
8 CONCLUSIONS..................................................................................................................... 118
APPENDIXA SECTOR DEMAND FORECASTS FROM PREVIOUS REPORTS APPENDIX B INPUTS FOR PROBABILISTIC MODELS

6/5/2012 iv Gustavson Associates
LIST OF FIGURES PAGE
Figure 3-1 Historical Annual Gas Consumption Bangladesh ........................................................... 8 Figure 3-2 Historical Average Daily Gas Consumption Bangladesh ............................................... 8 Figure 3-3 Comparison of Demand Forecasts .............................................................................. 11 Figure 3-4 Low Growth Total Gas Demand Forecast by Sector .................................................... 13 Figure 3-5 Comparison of Gas Demand by Sector (Low Growth) ................................................. 13 Figure 3-6 Base Case Total Gas Demand Forecast by Sector ........................................................ 14 Figure 3-7 Comparison of Gas Demand by Sector (Base Case) ..................................................... 15 Figure 3-8 High Growth Total Gas Demand by Sector .................................................................. 16 Figure 3-9 Comparison of Gas Demand by Sector (High Growth) ............................................... 17 Figure 3-10 Power Sector Gas Demand Forecast .......................................................................... 18 Figure 3-11 Representation of the Three Different GDP Growth Scenarios ................................. 19 Figure 3-12 Non-Bulk Sector Gas Demand .................................................................................... 21 Figure 3-13 Total Gas Demand by Sector ..................................................................................... 24 Figure 3-14 Distribution of Gas Demand by Sector FY 2009 ........................................................ 25 Figure 3-15 FY 2020 Sector Gas Demand Share Forecast ............................................................. 26 Figure 3-16 Forecast of Gas Demand in the Power Sector ............................................................. 27 Figure 3-17 Forecast of Gas Demand in the Captive Power Sector ............................................... 28 Figure 3-18 Forecast of Gas Demand in the Fertiliser Sector ........................................................ 29 Figure 3-19 Forecast of Gas Demand in the Non-Bulk Sector ....................................................... 30 Figure 3-20 Bangladesh Total Gas Demand Forecast .................................................................... 32 Figure 3-21 Share of Gas Demand by Economic Sector FY 2000 ................................................. 33 Figure 3-22 Share of Gas Demand by Economic Sector FY 2030 ................................................. 34 Figure 3-23 Total Gas Demand Forecast Bangladesh .................................................................... 35 Figure 3-24 New Bangladesh Gas Demand Forecast Scenarios .................................................... 37 Figure 4-1 Gas Transmission Network Map of Bangladesh ........................................................... 40 Figure 4-2 USGS map of resources in Bangladesh by region ....................................................... 62 Figure 7-1 Base Case - Annual average gas rate ......................................................................... 103 Figure 7-2 A Production Scenario for the Existing Fields ........................................................... 104 Figure 7-3 Scenario with significant domestic gas supply shortages .......................................... 105 Figure 7-4 A scenario with shortages, but growing domestic gas supplies .................................. 106 Figure 7-5 A base case scenario with substantial shale gas discoveries ...................................... 106 Figure 7-6 Base Case - Mean Gas Production .............................................................................. 108 Figure 7-7 Base Case with Accelerated Exploration ................................................................... 109 Figure 7-8 An accelerated base case scenario with delayed shortages ........................................ 110 Figure 7-9 An accelerated base case scenario with sufficient gas for 15 years ........................... 111 Figure 7-10 An accelerated base case scenario with substantial shale gas .................................. 111 Figure 7-11 Mean gas production - Accelerated base case ........................................................... 113 Figure 7-12 High Demand Growth - Annual average gas rates ................................................... 114 Figure 7-13 High Demand Growth with Accelerated Exploration .............................................. 115 Figure 7-14 Low Demand Growth - Annual Average Gas Rates ................................................ 116 Figure 7-15 Low Demand Growth with Accelerated Exploration ................................................ 117
6/5/2012 v Gustavson Associates
LIST OF TABLES
PAGE
Table 3-1 Historical Gas Consumption in Bangladesh .................................................................... 7 Table 3-2 Comparison of Total Forecasted Natural Gas Demand in 2020 .................................... 10 Table 3-3 Compound Annual Growth Rates by Franchise Area ................................................... 20 Table 3-4- Gas Demand Forecast in Fertiliser Sector ..................................................................... 22 Table 3-5 Gas Demand by Economic Sector .................................................................................. 31 Table 3-6 New Scenarios Forecast Growth Rates .......................................................................... 36 Table 4-1 Gas Reserve Summary .................................................................................................. 41 Table 4-2 Summary of Gas Production Increase (Estimated) ....................................................... 59 Table 4-3 Field-wide Gas Production increase (Estimated) .......................................................... 59 Table 4-4 Estimated, Proved, and Recoverable Coal Reserves ..................................................... 75 Table 5-1 Pre-Liberation Gas Tariff ............................................................................................... 86 Table 5-2 Current Gas Tariff (01/01/2010) .................................................................................... 87 Table 5-3 Petrobangla Deficits, Interest and IOC Income Tax Payments ...................................... 88 Table 7-1 Summary of the supply scenarios with the realistic exploration timeline ..................... 97 Table 7-2 Summary of the supply scenarios with the accelerated exploration timeline ............... 98 Table 7-3 Schedule of New Wells for Producing Fields ............................................................... 99 Table 7-4 Timeline of first exploration wells for base case ......................................................... 102 Table 7-5 Gas production over next 20 years .............................................................................. 107 Table 7-6 Timeline of first exploration wells for accelerated base case ...................................... 109 Table 7-7 Gas production over next 20 years – Accelerated base case ....................................... 112 Table A-1 Econ Analysis Sector Demand Forecast ...................................................................... 121 Table A-2 Wood Mackenzie Sector Demand Forecast ................................................................. 122 Table A-3 Petrobangla Sector Demand Forecast .......................................................................... 123

6/5/2012 1 Gustavson Associates
1 EXECUTIVE SUMMARY
This is a revised version of the report incorporating responses to comments by Petrobangla and
BGFCL that were received in April 2012.
This is a report on Future Scenarios for the Petroleum Development Sector in Bangladesh with a
primary focus on natural gas demand and supply. It has been prepared under ADB Grant 0019:
GTDP as a part of the project entitled “Strengthening of Hydrocarbon Unit in the Energy and
Mineral Resources Division (Phase-II)”.
The report begins with a review of historical gas consumption in Bangladesh and four previous
gas demand forecasts. It also presents three new demand forecasts for Bangladesh gas demand
and consumption. In this report, the word demand means total consumption of natural gas.
Historical gas demand/consumption has been measured. Projections of future demand assume
that gas will be available from various sources to meet that demand.
Actual gas consumption in Bangladesh has grown by an average of 10.0% per year from fiscal
year (FY) 19801 to FY 2009. The average daily gas consumption in FY 2009 was 1936 MMCF
per day. The annual consumption in that fiscal year was about 706 BCF. The previous gas
demand forecasts that were reviewed tended to underestimate future gas demand. It is difficult
to predict future gas demand accurately. This report considers three demand growth scenarios,
each starting with actual FY 2009 gas consumption: a base gas case with demand growth of
7.3% per year, a low case with growth of 5.7% per year, and a high case with growth of 8.9% per
year. The growth rate in each of these scenarios is lower than the long run historical average.
This is reasonable, since the historical growth started with a very low rate of gas use in the
country.
1 Fiscal year 1980 runs from July 1, 1980 through June 30, 1981.

6/5/2012 2 Gustavson Associates
The report considers several actual and possible sources of gas:
Existing fields
New conventional fields
o Mapped prospects and leads
o Unmapped prospects and leads
o Thin beds
Unconventional sources
o Coal bed methane (CBM)
o Shale gas
Gas imports
o LNG
o Pipelines
It also briefly mentions other energy sources including coal, LPG, petroleum products,
renewable energy, and nuclear power.
The country has been experiencing shortages of natural gas. Since much of the power generation
in the country is gas-fired, the gas shortages have caused power load shedding during certain
seasons. This has heightened awareness of the need to explore for and develop new sources of
natural gas.
There is also awareness of the potential for reform of end-user tariffs for natural gas to moderate
demand for natural gas. Residential consumers pay a low fixed monthly fee for natural gas
regardless of actual gas consumption. Other categories of gas consumers also pay a low price for
gas. Tariff reform is being considered, which could lead to lower growth rates in gas demand.
Besides the range of future demand scenarios, the report presents a range of possible supply
scenarios. Exploration and development of hydrocarbons is an intrinsically uncertain
undertaking. There is uncertainty about whether a particular prospect, lead or target will contain
commercial amounts of hydrocarbon, and if so, the quantity of hydrocarbon reserves or
resources. There is also uncertainty about the timing of exploration activity and the rate of

6/5/2012 3 Gustavson Associates
production from existing fields and new discoveries. We have built a probabilistic spreadsheet
tool that models all of this uncertainty. The probabilistic inputs for the model are based on the
Gustavson reserve and resource reports that were prepared earlier as part of this project.
The model predicts that there will continue to be small gas shortages over the next five years.
Additional development is planned for existing fields, which will lead to increases in the supply
of gas. However, the increases are not anticipated to keep pace with the increased demand for
natural gas. We predict that domestic gas supplies will begin to fall substantially short of
demand starting in about 2016, as production from existing fields goes on decline due to
depletion of reserves within those fields. It is possible that large discoveries of shale gas may
meet gas demand in late years after about 2024, but this is not assured.
The country has several options for dealing with the anticipated shortage in the domestic supply
of natural gas, including:
Accelerate natural gas exploration activity on the part of Petrobangla and/or international
oil and gas companies
Import natural gas as LNG, which will require construction of one or more LNG
regasification facilities
Arrange for import of natural gas by pipeline from neighboring countries
Raise end-user prices for natural gas to moderate the demand
Allow for more private sector involvement in the natural gas sector, for example allowing
gas producers to sell gas to end users, with Petrobangla being compensated for providing
transportation from the wellhead to the end user
Consider fuel options other than natural gas
Increase LPG supply to meet domestic demand.
Initiate studies of unconventional gas (shale gas and coalbed methane) and thin beds in
Bangladesh
A subsequent report on activity planning provides more detail about options to accommodate
future energy needs in Bangladesh.
6/5/2012 4 Gustavson Associates
2 INTRODUCTION
Gustavson Associates (GA) has been working on behalf of the Hydrocarbon Unit in Bangladesh
under ADB Grant 0019: GTDP on a project entitled Strengthening of Hydrocarbon Unit in the
Energy and Mineral Resources Division (Phase-II). As part of this project, GA has previously
prepared reports describing and quantifying the gas reserves and resources in Bangladesh.
This report uses those assessments to make predictions about future scenarios for natural gas
consumption and supply in the country.
This is the final version of the Future Scenarios report. It incorporates comments received from
Petrobangla and BGFCL based on their review of the draft version of the report, which was
completed in December 2011.

6/5/2012 5 Gustavson Associates
3 BANGLADESH GAS DEMAND FORECASTS
3.1 INTRODUCTION
Natural gas is an abundant indigenous energy resource in the People’s Republic of Bangladesh.
Bangladesh’s natural gas reserves have been estimated at roughly 18.8 trillion cubic feet (TCF)
as of January 1, 2011.2 With almost 90% of the country’s power plants being gas based, the
power sector is the largest user of natural gas in Bangladesh. The relative abundance of natural
gas in Bangladesh as well as the low end-user prices has led to the inefficient and wasteful use of
the resource. This has caused supply shortages throughout the country. Load shedding is a
common occurrence in Bangladesh, reaching nearly 1000 MW per day. 3
Bangladesh has small amounts of discovered oil. Other energy sources such as solar and nuclear
power are slowly being introduced. Solar energy eclipsed the 1 million homes powered mark in
2011. Yet the demand for natural gas has more than doubled in the past decade. Similar demand
growth is expected to continue into the future. Bangladesh consumed 349 billion cubic feet
(BCF) of natural gas in Fiscal Year (FY) 2000 and 707 BCF in FY 2009.4 The corresponding
average daily rates of consumption were 956 MMCF per day and 1,936 MMCF per day
respectively. Consumption increased by 102%, reflecting a compound annual growth rate
(CAGR) of 8.1%.
This chapter presents historical Bangladesh gas consumption data, reviews four previous natural
gas demand forecasts, and presents three new gas demand forecast scenarios. The four previous
forecasts are:
1. Wood Mackenzie, “Preparation and Development of Gas Sector Master Plan, 2006.”
2. ECON Analysis, “Bangladesh Optimal Gas Utilisation, 2004.”
3. Global Data, “Gas Market Outlook in Bangladesh, 2010.”
4. Technoconsult International, “Preparing the Gas Sector Development Program, 2009”.
(This report is an analysis of Petrobangla’s official demand forecast). 2 Source: Gustavson Associates, 2010. 3 Source: The Daily Star, 2011 4Source: Petrobangla Annual Report, 2009

6/5/2012 6 Gustavson Associates
3.2 HISTORICAL GAS DEMAND
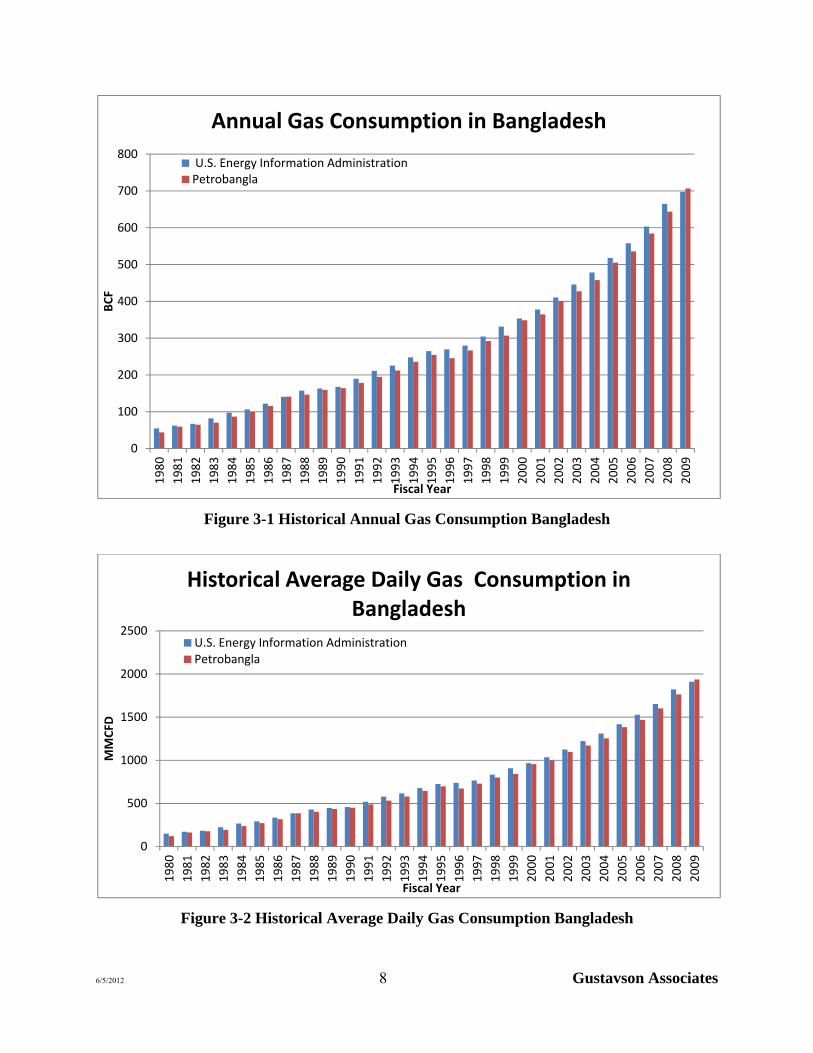
This section presents historical gas demand in Bangladesh from FY 1980 to FY 2009. Gas
consumption figures were compiled from two sources, the U.S Energy Information
Administration (EIA) and Petrobangla. Table 3-1 shows the annual consumption and annual
average daily consumption rates from both sources. There are small differences in the reported
consumption between the sources. The cause of the differences in the historical data is
unknown.
The EIA information shows annual demand rising from 54.8 BCF in FY 1980 to 697.5 BCF in
FY 2009. This represents a compound annual growth rate (CAGR) of 9.2%. The
corresponding annual average daily gas consumption in Bangladesh grew from 150 MMCF per
day to 1,911 MMCF per day.
Petrobangla’s figures show annual consumption rising from 44.0 BCF in FY 1980 to 706.5 BCF
in FY 2009. This represents a CAGR of 10.0%. The corresponding average daily gas
consumption grew from 120.5 MMCF per day to 1,935.5 MMCF per day. Figure 3-1 and
Figure 3-2 are graphical representations of the information provided in Table 3-1

6/5/2012 7 Gustavson Associates
Table 3-1 Historical Gas Consumption in Bangladesh
U.S. ENERGY INFORMATION
ADMINISTRATION PETROBANGLA
Fiscal Year
Annual Consumption
(BCF)
Avg. Daily Consumption
(MMCFD)
Annual Consumption
(BCF)
Avg. Daily Consumption
(MMCFD) 1980 54.8 150.2 44.0 120.5 1981 62.3 170.8 59.6 163.3 1982 66.8 183.0 64.7 177.3 1983 81.8 224.1 70.6 193.4 1984 97.5 267.1 86.6 237.3 1985 106.5 291.8 99.4 272.3 1986 122.2 334.7 115.6 316.7 1987 140.7 385.5 141.0 386.3 1988 157.2 430.5 146.4 401.1 1989 163.1 446.9 159.1 435.9 1990 167.5 458.9 164.1 449.6 1991 189.6 519.5 178.5 489.0 1992 211.0 578.1 194.5 532.9 1993 225.3 617.3 212.1 581.2 1994 247.6 678.2 235.6 645.4 1995 264.9 725.6 254.6 697.6 1996 269.5 738.2 245.8 673.4 1997 279.5 765.8 266.6 730.3 1998 304.6 834.5 292.1 800.3 1999 331.1 907.1 306.9 840.7 2000 353.2 967.5 348.8 955.5 2001 377.9 1035.3 364.6 999.0 2002 410.5 1124.8 400.8 1098.1 2003 445.9 1221.5 427.5 1171.3 2004 478.5 1311.0 457.6 1253.7 2005 517.7 1418.4 505.1 1383.9 2006 557.8 1528.2 535.8 1467.8 2007 603.4 1653.0 584.5 1601.3 2008 664.8 1821.4 643.9 1764.2 2009 697.5 1911.0 706.5 1935.5
6/5/2012 8 Gustavson Associates
Figure 3-1 Historical Annual Gas Consumption Bangladesh
Figure 3-2 Historical Average Daily Gas Consumption Bangladesh
0
100
200
300
400
500
600
700
8001980
1981
1982
1983
1984
1985
1986
1987
1988
1989
1990
1991
1992
1993
1994
1995
1996
1997
1998
1999
2000
2001
2002
2003
2004
2005
2006
2007
2008
2009
BCF
Fiscal Year
Annual Gas Consumption in Bangladesh
U.S. Energy Information AdministrationPetrobangla
0
500
1000
1500
2000
2500
1980
1981
1982
1983
1984
1985
1986
1987
1988
1989
1990
1991
1992
1993
1994
1995
1996
1997
1998
1999
2000
2001
2002
2003
2004
2005
2006
2007
2008
2009
MMCFD
Fiscal Year
Historical Average Daily Gas Consumption in Bangladesh
U.S. Energy Information AdministrationPetrobangla
6/5/2012 9 Gustavson Associates
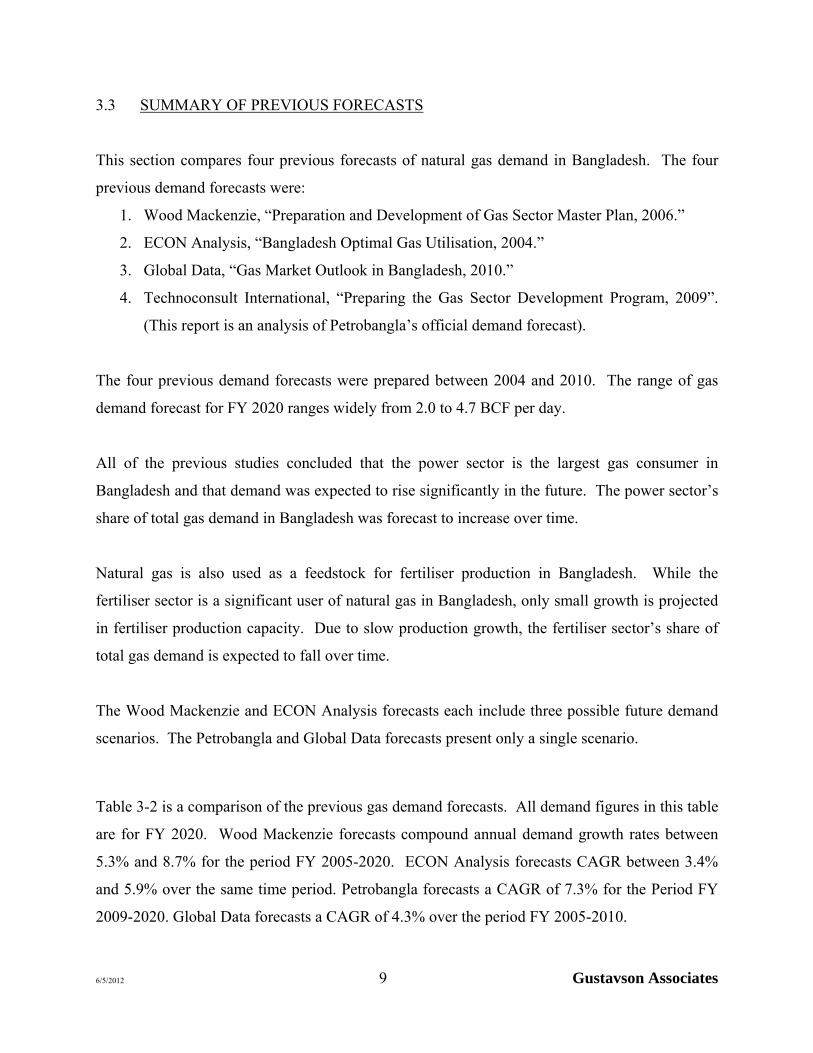
3.3 SUMMARY OF PREVIOUS FORECASTS
This section compares four previous forecasts of natural gas demand in Bangladesh. The four
previous demand forecasts were:
1. Wood Mackenzie, “Preparation and Development of Gas Sector Master Plan, 2006.”
2. ECON Analysis, “Bangladesh Optimal Gas Utilisation, 2004.”
3. Global Data, “Gas Market Outlook in Bangladesh, 2010.”
4. Technoconsult International, “Preparing the Gas Sector Development Program, 2009”.
(This report is an analysis of Petrobangla’s official demand forecast).
The four previous demand forecasts were prepared between 2004 and 2010. The range of gas
demand forecast for FY 2020 ranges widely from 2.0 to 4.7 BCF per day.
All of the previous studies concluded that the power sector is the largest gas consumer in
Bangladesh and that demand was expected to rise significantly in the future. The power sector’s
share of total gas demand in Bangladesh was forecast to increase over time.
Natural gas is also used as a feedstock for fertiliser production in Bangladesh. While the
fertiliser sector is a significant user of natural gas in Bangladesh, only small growth is projected
in fertiliser production capacity. Due to slow production growth, the fertiliser sector’s share of
total gas demand is expected to fall over time.
The Wood Mackenzie and ECON Analysis forecasts each include three possible future demand
scenarios. The Petrobangla and Global Data forecasts present only a single scenario.
Table 3-2 is a comparison of the previous gas demand forecasts. All demand figures in this table
are for FY 2020. Wood Mackenzie forecasts compound annual demand growth rates between
5.3% and 8.7% for the period FY 2005-2020. ECON Analysis forecasts CAGR between 3.4%
and 5.9% over the same time period. Petrobangla forecasts a CAGR of 7.3% for the Period FY
2009-2020. Global Data forecasts a CAGR of 4.3% over the period FY 2005-2010.

6/5/2012 10 Gustavson Associates
Table 3-2 Comparison of Total Forecasted Natural Gas Demand in 2020
WOOD MACKENZIE ECON ANALYSIS PETROBANGLA GLOBAL
DATA
CASE LOW BASE HIGH LOW BASE HIGH Base Base
Demand (mmcfd) 3125 4112 5193 1960 2622 3182 4115 2698
CAGR 5.3% 7.1% 8.7% 3.4% 4.9% 5.9% 7.3% 4.3%
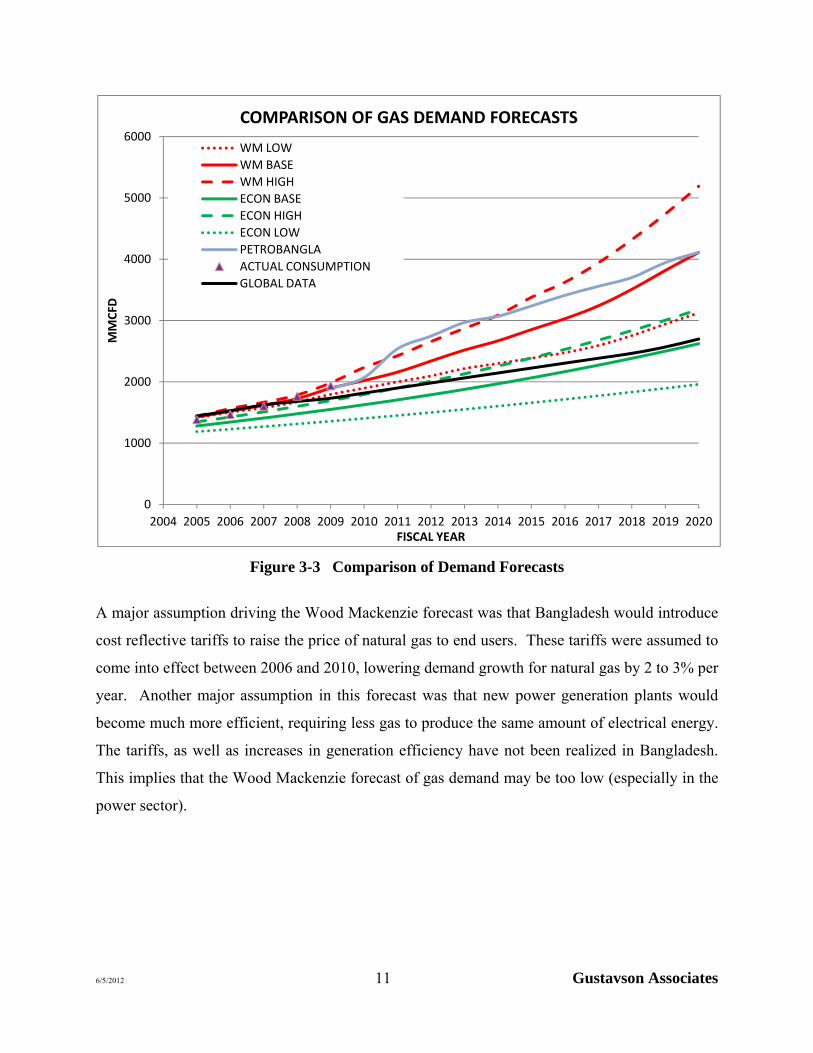
Figure 3-3 shows a comparison of the four previous gas demand forecasts as well as actual
historical gas consumption (using Petrobangla data). Actual annual average gas consumption in
FY 2009 was 1,936 MMCF per day. The Wood Mackenzie base forecast was nearly in line with
actual consumption over the period FY 2005-2009. The ECON Analysis projections were lower
than actual consumption over the period FY 2005-2009. The Global Data forecast was almost in
line with actual consumption, except for FY 2009 when the forecast was below the actual
consumption. The Petrobangla forecast was nearly in line with actual consumption in FY2009.
The Wood Mackenzie and Technoconsult reports provided detailed methodologies on how their
forecasts were derived, which will be discussed later in this report. The ECON Analysis and
Global Data reports did not describe the methodologies used to develop their forecasts.
6/5/2012 11 Gustavson Associates
Figure 3-3 Comparison of Demand Forecasts
A major assumption driving the Wood Mackenzie forecast was that Bangladesh would introduce
cost reflective tariffs to raise the price of natural gas to end users. These tariffs were assumed to
come into effect between 2006 and 2010, lowering demand growth for natural gas by 2 to 3% per
year. Another major assumption in this forecast was that new power generation plants would
become much more efficient, requiring less gas to produce the same amount of electrical energy.
The tariffs, as well as increases in generation efficiency have not been realized in Bangladesh.
This implies that the Wood Mackenzie forecast of gas demand may be too low (especially in the
power sector).
0
1000
2000
3000
4000
5000
6000
2004 2005 2006 2007 2008 2009 2010 2011 2012 2013 2014 2015 2016 2017 2018 2019 2020
MMCFD
FISCAL YEAR
COMPARISON OF GAS DEMAND FORECASTS
WM LOW
WM BASE
WM HIGH
ECON BASE
ECON HIGH
ECON LOW
PETROBANGLA
ACTUAL CONSUMPTION
GLOBAL DATA

6/5/2012 12 Gustavson Associates
3.4 DETAILS OF PREVIOUS FORECASTS
This sub-section describes the methodologies used to develop the previous forecasts. A
comparison of the demand forecasts by sector of each report is available in Appendix A.
3.4.1 Wood Mackenzie
The Wood Mackenzie report provides a detailed forecast of natural gas demand from FY 2004 to
FY 2024. Their report was published in 2006. The report provides three different gas demand
forecast scenarios, broken down into three sectors: power sector, fertiliser sector, and non-bulk
sector. Case A is Wood Mackenzie’s low growth forecast, Case B is their base case forecast, and
case C is their high growth forecast.
3.4.1.1 Total Gas Demand Forecast
Case A: Figure 3-4 shows Wood Mackenzie’s total low growth gas demand forecast by sector.
In this scenario total demand is forecast to grow from 1,362 MMCF per day in FY 2004 to 4,005
MMCF per day in FY 2024. That is an overall growth of 194% and a CAGR of 5.5% per year.
Demand is forecast to increase by 2.6 BCF per day by FY 2024. Figure 3-5 shows the actual
shares of gas demand by sector in FY 2004 and a forecast of shares by sector in FY 2024. The
power and non-bulk sectors constitute the bulk of the demand as well as the growth in demand.
Demand in the power and non-bulk sectors are forecast to be 57% and 38% of total demand
respectively in FY 2024. Demand in the fertiliser sector is forecast to remain almost unchanged.
Due to the large growth in the power and non-bulk sectors, the fertiliser sector’s share of total
demand drops from 19% in FY 2004 to 5% in FY 2024 as shown in Figure 3-5.

6/5/2012 13 Gustavson Associates
Figure 3-4 Low Growth Total Gas Demand Forecast by Sector5
Figure 3-5 Comparison of Gas Demand by Sector (Low Growth)
5 Source: Wood Mackenzie, 2006
0
500
1000
1500
2000
2500
3000
3500
4000
4500
2004 2006 2008 2010 2012 2014 2016 2018 2020 2022 2024
MMCFD
FISCAL YEAR
Case A Total Demand Forecast by Sector
Power Fertiliser Non‐Bulk
Power44%
Non‐Bulk37%
Fertiliser19%
Total Gas Demand Fiscal Year 2004
Total =1362
Power57%
Non‐Bulk38%
Fertiliser5%
Total Gas Demand Forecast Fiscal Year 2024
Total = 4005 mmcfd

6/5/2012 14 Gustavson Associates
Case B: Figure 3-6 shows Wood Mackenzie’s base case demand forecast by sector. In this
scenario total gas demand grows from 1,362 MMCF per day in FY 2004 to 5,606 MMCF per
day in FY 2024. This represents an overall growth of 312% and a CAGR of 7.3%. Gas demand
is forecast to increase by 4.2 BCF per day by FY 2024. Gas demand in the power and non-bulk
sectors is forecast to increase considerably in this scenario at a CAGR of 8.7% and 7.7%,
respectively. Demand in the fertiliser sector grows only slightly.
Figure 3-6 Base Case Total Gas Demand Forecast by Sector6
Figure 3-7 shows shares of actual gas demand in FY 2004 by sector as well as a forecast of
shares in FY 2024. The power sector’s share of total demand grows from 44% in FY 2004 to
57% in FY 2024. The fertiliser sector’s share drops from 19% to 5% over the same time period.
The non-bulk sector’s share of total demand remains almost unchanged.
6 Source: Wood Mackenzie, 2006
0
1000
2000
3000
4000
5000
6000
2004 2006 2008 2010 2012 2014 2016 2018 2020 2022 2024
MMCFD
FISCAL YEAR
Case B Total Demand by Sector
Power Fertiliser Non‐Bulk

6/5/2012 15 Gustavson Associates
Figure 3-7 Comparison of Gas Demand by Sector (Base Case)7 Case C:
Figure 3-8 shows Wood Mackenzie’s high growth demand forecast by sector. In this scenario,
total demand rises from 1,362 MMCF per day in FY 2004 to 7,441 MMCF per day in FY 2024.
This represents an overall growth of 546% and a CAGR of 8.9%. Gas demand is forecast to
increase by 6.1 BCF per day by FY 2024. Demand rises significantly in both the Non-Bulk and
power sectors, while rising by only a small amount in the fertiliser sector.
7 Source: Wood Mackenzie, 2006
Power44%
Non‐Bulk37%
Fertiliser19%
Total Gas Demand Fiscal Year 2004
Total = 1362 mmcfd
Power57%
Non‐Bulk38%
Fertiliser5%
Total Gas Demand Forecast Fiscal Year 2024
Total = 5606mmcfd

6/5/2012 16 Gustavson Associates
Figure 3-8 High Growth Total Gas Demand by Sector8
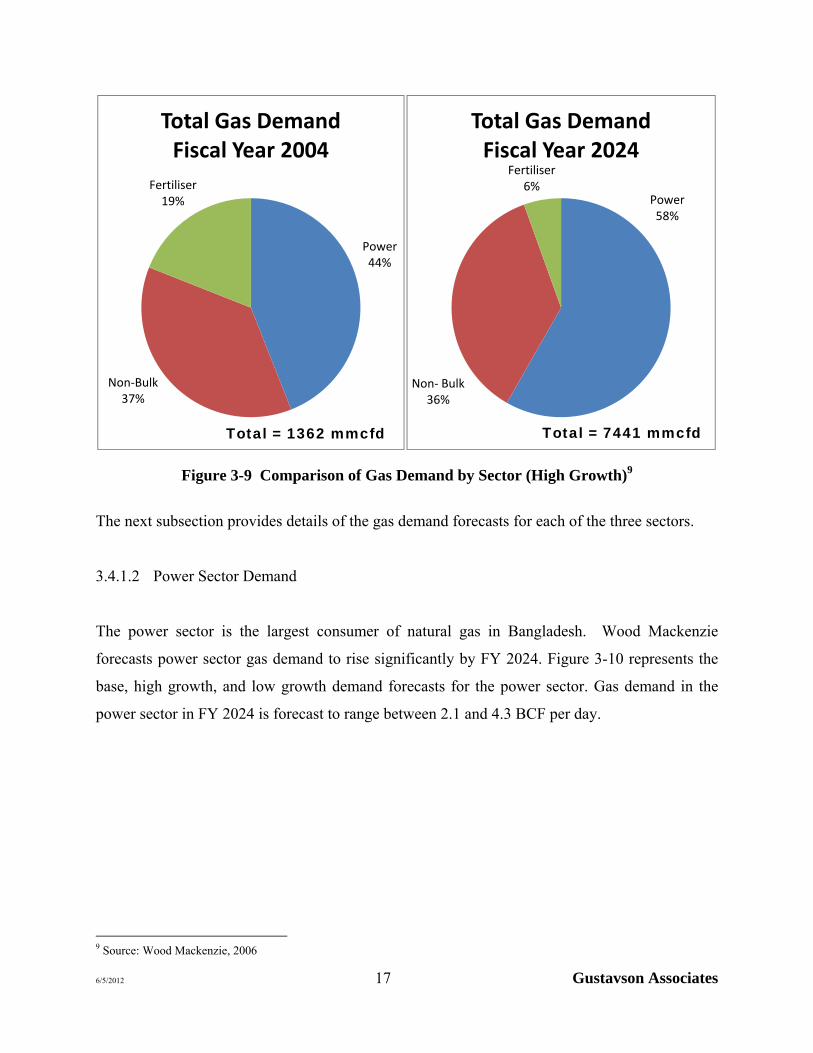
Figure 3-9 shows the shares of total gas demand by sector in FY 2004 and the forecast of gas
demand shares by sector in FY 2024. The share of demand in the fertiliser sector drops
considerably while the power sector’s share of total gas demand increases by 14%. The non-
bulk sector’s share of total gas demand remains almost constant.
8 Source: Wood Mackenzie, 2006
0
1000
2000
3000
4000
5000
6000
7000
8000
2004 2006 2008 2010 2012 2014 2016 2018 2020 2022 2024
MMCFD
FISCAL YEAR
Case C Total Demand Forecast by Sector
Power Fertiliser Non‐Bulk
6/5/2012 17 Gustavson Associates
Figure 3-9 Comparison of Gas Demand by Sector (High Growth)9
The next subsection provides details of the gas demand forecasts for each of the three sectors.
3.4.1.2 Power Sector Demand
The power sector is the largest consumer of natural gas in Bangladesh. Wood Mackenzie
forecasts power sector gas demand to rise significantly by FY 2024. Figure 3-10 represents the
base, high growth, and low growth demand forecasts for the power sector. Gas demand in the
power sector in FY 2024 is forecast to range between 2.1 and 4.3 BCF per day.
9 Source: Wood Mackenzie, 2006
Power44%
Non‐Bulk37%
Fertiliser19%
Total Gas Demand Fiscal Year 2004
Total = 1362 mmcfd
Power58%
Non‐ Bulk36%
Fertiliser6%
Total Gas Demand Fiscal Year 2024
Total = 7441 mmcfd

6/5/2012 18 Gustavson Associates
Figure 3-10 Power Sector Gas Demand Forecast10
Wood Mackenzie prepared forecasts of electricity load. The forecast of electricity load was
carried out by conducting a regression analysis to establish the relationship between historic
GDP and electrical energy load. The regression produced an r-squared value of over 99%
indicating an extremely strong relationship between GDP and electrical energy load. The
regression indicates that electricity load will grow by 1.5 times the GDP growth rate.
The gas demand forecasts in the power sector are based on three different GDP growth
scenarios: Case A, Case B, and Case C (Figure 3-11). Each scenario makes different
assumptions on how GDP will grow in Bangladesh.
Case A (Low Growth): This scenario represents the recent trend in GDP growth in
Bangladesh. It assumes that GDP will continue to grow at the most recent rate. In this
case real GDP11 will grow at 5.5% per annum to FY 2020 after which it is forecast to
decline slightly to 5.3% through FY 2024.
10 Source: Wood Mackenzie, 2006 11 Real GDP refers to GDP corrected for inflation.
0
500
1000
1500
2000
2500
3000
3500
4000
4500
5000
2004
2005
2006
2007
2008
2009
2010
2011
2012
2013
2014
2015
2016
2017
2018
2019
2020
2021
2022
2023
2024
MMCFD
FISCAL YEAR
Power Sector Gas DemandBase Case
Low Growth

6/5/2012 19 Gustavson Associates
Case B (Base): GDP growth is assumed to be stimulated by the Government reduction
of poverty. In this scenario real GDP growth rises to 7% in FY 2010, peaks at 8% in FY
2015, falls to 6.5% by FY 2021 and remains at this level to FY 2024.
Case C (High Growth): This scenario represents a high level of economic development
and Real GDP growth. Under this case real GDP grows to 7% in FY 2005 and continues
upward peaking at 9% in FY 2014. GDP then declines gradually to 7% by FY 2024.
Figure 3-11 Representation of the Three Different GDP Growth Scenarios12
Electricity load is also affected by natural gas tariff reform in this forecast. Wood Mackenzie
has assumed that a tariff reform would take effect in FY 2005-2010 increasing natural gas prices
to competitive world prices. This increase is forecast to lower electricity growth rates by 2-3%
per year over the five year period, after which the relationship between GDP and electricity load
is predicted to return to its historical norm.
12 Source: Wood Mackenzie, 2006
4%
5%
6%
7%
8%
9%
10%
2004
2005
2006
2007
2008
2009
2010
2011
2012
2013
2014
2015
2016
2017
2018
2019
2020
2021
2022
2023
2024
ANNUAL GDP GROWTH
FISCAL YEAR
CASE A CASE B CASE C

6/5/2012 20 Gustavson Associates
3.4.1.3 Non-Bulk Sector Demand
Wood Mackenzie derived demand forecasts for this sector by considering several franchise
areas.13 Within each franchise area a demand forecast was derived for the particular industries
involved in the non-bulk sector. The non-bulk sector gas demand is expected to rise significantly
in the future as shown in Table 3-3.
Table 3-3 Compound Annual Growth Rates by Franchise Area14
CASE Franchise Area A B C
Titas
Industrial 6.9% 8.8% 10.2% Captive 4.7% 5.6% 6.4%
Residential 5.9% 7.4% 8.5% Commercial 1.6% 2.6% 4.2%
CNG 10% 11% 12%
Bahkrabad
Industrial 8.1% 8.8% 9.5% Captive 5.6% 7% 8%
Residential 5.6% 7% 8.1% Commercial 2.8% 3.5% 4.4%
CNG 11% 12.2% 13.2%
Jalalabad
Industrial 11% 12.% 12.5% Captive 5.6% 6.7% 7.6%
Residential 4.4% 5.4% 6% Commercial 2.2% 2.4% 2.9%
CNG NA15 NA NA
PGCL Non-Bulk 16% 18% 20%
S & SW Non-Bulk 6.3% 7.7% 8.8%
TOTAL NON-BULK SECTOR DEMAND Case
A B C 6.3% 7.7% 8.8%
13 A franchise area can be thought of as a region of Bangladesh controlled by an individual distribution company. 14 Source: Wood Mackenzie, 2006 15 Due to the low level of expected demand for CNG in Jalalabad, no forecast was conducted. An upward adjustment has been made to the residential and commercial forecasts to compensate.

6/5/2012 21 Gustavson Associates
Figure 3-12 represents the low growth, base case, and high growth forecasts of gas demand in the
Non-Bulk Sector. Forecasted demand in the non-bulk sector in FY 2024 ranges from 1.7 to 2.7
BCF per day.
Figure 3-12 Non-Bulk Sector Gas Demand16
The industries included in the non-bulk sector are:
Captive Power
Commercial
Residential
CNG
Industrial
The non-bulk sector demand forecast was derived based on the three GDP growth assumptions
outlined above, and divided on a franchise area basis. Regression analyses were conducted to
ascertain the strength of the relationship between GDP growth and natural gas demand for each
industry and franchise area.
16 Source: Wood Mackenzie, 2006
0
500
1000
1500
2000
2500
3000
2004
2005
2006
2007
2008
2009
2010
2011
2012
2013
2014
2015
2016
2017
2018
2019
2020
2021
2022
2023
2024
MMCFD
FISCAL YEAR
Non‐ Bulk Sector Gas DemandLow Growth
Base Case
High Growth

6/5/2012 22 Gustavson Associates
Captive power refers to power generation used by industry for their own consumption, that is not
connected to the overall power grid. The captive power demand forecast was based on the
assumption that power reliability will continue to be an issue in Bangladesh into the future.
Without reliable power sources the need for captive power generation will continue to grow at a
significant rate.
The demand in the CNG sector is based on the number of vehicles converted to CNG, which
depends on whether consumers consider CNG as a good alternative to gasoline powered
vehicles. The CNG sector is in the early stages of development in Bangladesh, with roughly
40,000 vehicles converted to CNG in FY 2004. The potential for CNG demand is between 55
and 80 MMCF per day by FY 2024, with the majority of demand concentrated in the greater
Dhaka area.
3.4.1.4 Fertiliser Sector Demand
Bangladesh is an agricultural society with over 45% of its labor force employed in the
agricultural sector.17 This large segment of the economy drives the demand for fertiliser. Urea
fertiliser is manufactured at seven urea plants in Bangladesh which produce around three million
tons of urea per year.18 Natural gas is used as a feedstock in the production of urea.
Table 3-4 shows the results of Wood Mackenzie’s demand forecast for the fertiliser sector. Gas
demand in the fertiliser sector was predicted to grow only very slightly by FY 2024.
Table 3-4- Gas Demand Forecast in Fertiliser Sector
Case 2004 Gas Demand
(mmcfd) 2025 Gas Demand
(mmcfd) CAGR
A & B 274 280 0.1%
C 274 410 2.0%
17 Source: The World Fact Book, 2010 18 Source: Wood Mackenzie, 2006

6/5/2012 23 Gustavson Associates
The forecast for demand in the fertiliser sector was derived by estimating the demand for urea in
Bangladesh as well as the expansion of urea plant capacity. To produce the gas demand forecast
a plant by plant analysis was conducted. Wood Mackenzie derived three cases based on several
assumptions. Cases A & B concluded that new urea plants would generate a negative net present
value (NPV). Due to this fact no new urea plants would be built in Bangladesh. Gas demand in
Cases A & B would increase moderately by FY 2024 to include expansions in the Chittagong
facility.
Case A & B Assumptions:
o Notional ex-plant realized price of urea is US$ 165/ton.
o Current gas price to the fertiliser sector is US$1.0/mmbtu.
o A real discount rate of 10%
o No new Greenfield Urea plants are built
Case C Assumptions: This scenario takes into consideration the addition of two new
urea plants in Bangladesh. The following are assumptions based on this scenario.
o New Tata Urea plant will be commissioned by 2009.
o Shahjalal factory is replaced.
In case C it was assumed that the economics alone would not deter the expansion of domestic
production of urea. The logic here is that new urea facilities would create increased domestic
demand for gas. This will in turn provide a signal to upstream suppliers (especially IOCs) that
any future gas discoveries could be monetized in Bangladesh. In this way, it could be a positive
step towards stimulating domestic exploration and production in the gas sector.19
3.4.2 Petrobangla
Technoconsult’s report, published in 2009 was an analysis of Petrobangla’s demand forecast.
Petrobangla’s forecast provides gas demand projections from FY 2009 to FY 2020. This report
provides a total demand forecast as well as forecasts of gas demand in the power, fertiliser,
captive power, and non-bulk sectors. Petrobangla’s forecast can best be described as a
19 Source: Wood Mackenzie, 2006

6/5/2012 24 Gustavson Associates
constrained demand forecast as growth rates have been adjusted downwards due to supply
constraints. Petrobangla has not included demand that it is unable or does not intend to supply.20
3.4.2.1 Total Gas Demand
Figure 3-13 shows Petrobangla’s total gas demand forecast to FY 2020 by sector. Total gas
demand is forecast to rise from 1,890 MMCF per day in FY 2009 to 4,115 MMCF per day in FY
2020. This represents a CAGR of 7.3%. Gas demand is forecast to increase by 2.2 BCF per day
by FY 2020.
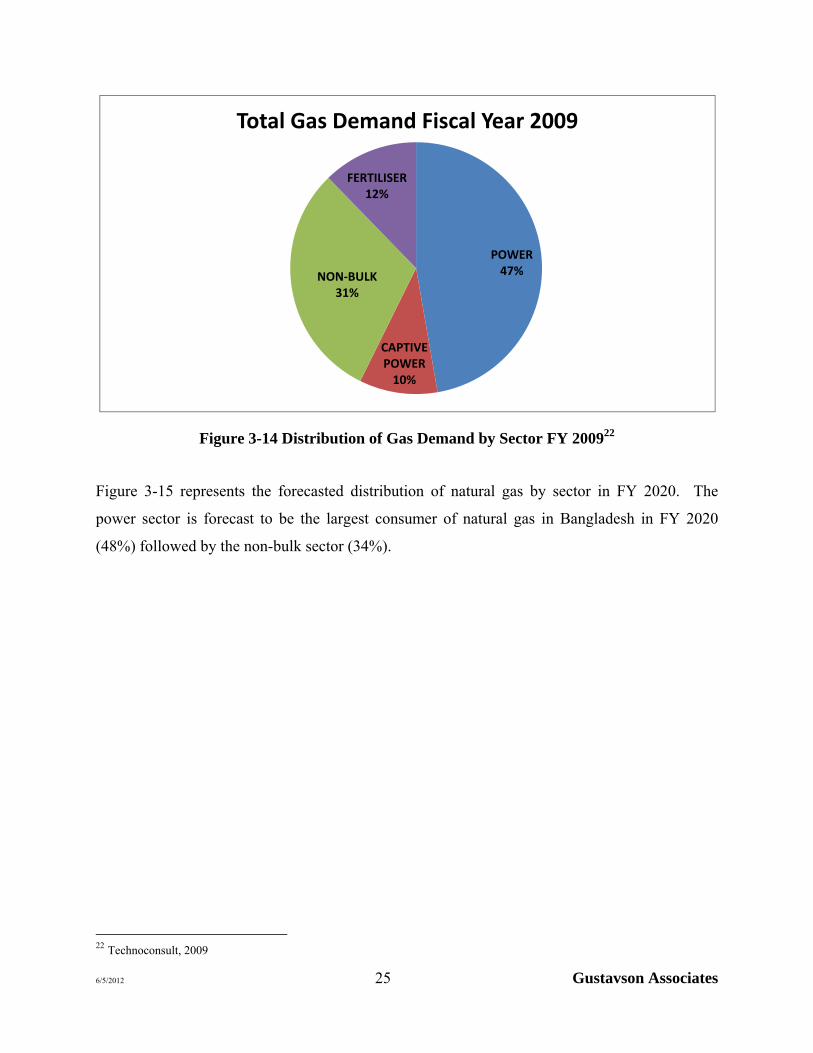
Figure 3-13 Total Gas Demand by Sector21
Figure 3-14 shows the actual distribution of gas demand by sector in FY 2009. The power sector
is the largest consumer of natural gas in Bangladesh (47% of total demand), followed by the non-
bulk sector (31%).
20 Source: Technoconsult, 2009 21 Source: Technoconsult, 2009
0
500
1000
1500
2000
2500
3000
3500
4000
4500
2009 2010 2011 2012 2013 2014 2015 2016 2017 2018 2019 2020
MMCFD
FISCAL YEAR
Petrobangla Total Demand Forecast
Power Captive Power Fertiliser Non‐Bulk
6/5/2012 25 Gustavson Associates
Figure 3-14 Distribution of Gas Demand by Sector FY 200922
Figure 3-15 represents the forecasted distribution of natural gas by sector in FY 2020. The
power sector is forecast to be the largest consumer of natural gas in Bangladesh in FY 2020
(48%) followed by the non-bulk sector (34%).
22 Technoconsult, 2009
POWER47%
CAPTIVE POWER10%
NON‐BULK31%
FERTILISER12%
Total Gas Demand Fiscal Year 2009

6/5/2012 26 Gustavson Associates
Figure 3-15 FY 2020 Sector Gas Demand Share Forecast23
3.4.2.2 Power Sector Demand
Figure 3-16 represents the demand forecast for natural gas in the power sector to FY 2020.
Demand over this period was forecast to grow considerably from about 1,100 MMCF per day in
FY 2009 to 2,450 MMCF per day in FY 2020. This represents a CAGR of 7.6%. The period
FY 2009-2013 is forecast to be a period of high growth in gas demand for the power sector while
the period FY 2013-2020 is forecasted to be a period of lower growth. The period of forecasted
high growth in demand can be explained by the Bangladesh Power Development Board (BPDB)
proposing to commission 5 new gas-fired power plants by FY 2012. The expansion plan of the
BPDB is less ambitious after 2012, explaining the period of lower growth in gas demand for the
power sector.
23 Technoconsult, 2009
POWER48%
CAPTIVE POWER11%
NON‐BULK34%
FERTILISER7%
Total Gas Demand Forecast Fiscal Year 2020

6/5/2012 27 Gustavson Associates
Figure 3-16 Forecast of Gas Demand in the Power Sector24
The power sector gas demand was derived using the 2005 Power Sector Master Plan, prepared
by Nexant as a basis for the forecast. A regression analysis was used to show the strong
correlation between electricity demand growth and GDP growth. This forecast assumed a
constant real GDP growth rate of 5.5% per year. Further assumptions were made on the growth
rate of the population as well as the power price to forecast electricity load. Electricity load was
then compared to the power plant expansion plan to derive the total power sector gas demand
forecast.
3.4.2.3 Captive Power Sector Demand
Figure 3-17 represents the forecasted demand in the captive power sector to FY 2020. In this
forecast demand rises from about 240 MMCF per day in FY 2009 to 570 MMCF per day in FY
2020. This represents a CAGR of 8.2%
24 Source: Technoconsult, 2009
1000
1200
1400
1600
1800
2000
2200
24002009
2010
2011
2012
2013
2014
2015
2016
2017
2018
2019
2020
MMCFD
FISCAL YEAR
Petrobangla Power Sector Demand Forecast

6/5/2012 28 Gustavson Associates
Figure 3-17 Forecast of Gas Demand in the Captive Power Sector25
Captive power refers to power generated by a firm for its own consumption. This power
generation is independent from the overall power grid. The lack of a reliable energy supply in
Bangladesh has driven the growth in demand for natural gas in the captive power sector. This is
mostly due to Bangladesh’s inability to currently supply 1,950 MW of grid power.26 Petrobangla
assumed a constant growth rate of roughly 8 % per year to forecast captive power gas demand.
3.4.2.4 Fertiliser Sector Demand
Figure 3-18 represents the gas demand in the fertiliser sector to FY 2020. This analysis shows
relatively constant demand out to FY 2015. In FY 2016 a new Urea plant is planned to be
25 Source: Technoconsult, 2009 26 Source: Technoconsult, 2009
200
250
300
350
400
450
500
550
6002008
2009
2010
2011
2012
2013
2014
2015
2016
2017
2018
2019
2020
MMCFD
FISCAL YEAR
Petrobangla Captive Power Sector Demand Forecast

6/5/2012 29 Gustavson Associates
commissioned leading to an increase in gas demand of 70 MMCF per day. After the
commissioning of the new facility, demand remains constant through FY 2020. No explanation
is given to explain the small increase in gas demand between FY 2010 and FY 2011, however
the data shows that the Jalalabad Gas Transmission and Distribution Systems (JGTDSL)
increases its demand by 10 MMCF per day during this period.
Figure 3-18 Forecast of Gas Demand in the Fertiliser Sector27
The Petrobangla forecast for demand in the fertiliser sector was derived by estimating the
demand for urea in Bangladesh as well as the planned expansion of urea plant capacity. This
involved a plant by plant study of the amount of natural gas consumed within each of the seven
urea plants operating in Bangladesh.
27 Source: Technoconsult,2009
250
270
290
310
330
350
370
390
2008
2009
2010
2011
2012
2013
2014
2015
2016
2017
2018
2019
2020
MMCFD
FISCAL YEAR
Petrobangla Fertiliser Sector Demand Forecast

6/5/2012 30 Gustavson Associates
3.4.2.5 Non- Bulk Sector Demand
Figure 3-19 shows the gas demand for the Non-Bulk Sector to FY 2020. Demand was predicted
to grow significantly in this sector from roughly 700 MMCF per day in FY 2009 to 1,750
MMCF per day in FY 2020. This represents a CAGR of 8.7%.
Figure 3-19 Forecast of Gas Demand in the Non-Bulk Sector28
The Non-Bulk demand forecast was derived using a constant annual growth rate of 8% for all
distribution companies in Bangladesh, excluding Pashchimanchal Gas Company Ltd (PGCL).
The growth rate in gas demand for PGCL was assumed to be 20%. No explanation was given
28 Source: Technoconsult,2009
700
900
1100
1300
1500
1700
1900
2008
2009
2010
2011
2012
2013
2014
2015
2016
2017
2018
2019
2020
MMCFD
FISCAL YEAR
Petrobangla Non‐Bulk Gas Demand Forecast

6/5/2012 31 Gustavson Associates
for why the growth rate in gas demand for PGCL was so much higher than the rest of the
distribution companies.
3.4.3 ECON Analysis
In 2004, Econ Analysis prepared a forecast of gas demand in Bangladesh to the year 2030. It is
divided by sectors which include Power, Fertiliser, Industry, Losses and Other. The report
contains a base case, high growth, and low growth projections of gas demand. The results of the
forecast for each sector are given in Table 3-5. The power sector is forecast to demand the most
natural gas, and growth in power sector gas demand ranges between 4.4% and 6.5% per year.
Table 3-5 Gas Demand by Economic Sector29 Units: MMCF per day
Sector Case 2000 2005 2010 2015 2020 2025 2030 CAGR
2000-2030
Power
Base Case
408
563 756 1044 1409 1831 2452 6.16%
High Growth 563 923 1310 1882 2282 2736 6.55% Low Growth 543 640 818 1033 1219 1499 4.43%
Fertiliser Base Case
233 247 304 306 282 282 230 0.00%
High Growth 265 342 345 321 321 269 0.48%
Low Growth 245 245 225 222 222 170 -1.05%
Industry Base Case
125 213 314 410 509 615 717 6.00%
High Growth 276 408 541 682 836 989 7.14%
Low Growth 222 285 351 419 491 554 5.09%
Other Base Case
100 158 218 280 360 462 591 6.10%
High Growth 128 206 290 404 556 755 6.97% Low Growth 100 130 167 222 292 382 4.57%
Losses Base Case
43 68 86 92 92 87 77 1.96%
High Growth 76 101 113 117 114 105 3.02% Low Growth 58 65 67 66 62 54 0.76%
Total Base Case
908 1249 1676 2132 2652 3277 4067 5.13%
High Growth 1308 1980 2599 3406 4108 4854 5.75% Low Growth 1167 1364 1628 1963 2286 2660 3.65%
29 Source: ECON Analysis, 2004.

6/5/2012 32 Gustavson Associates
Figure 3-20 shows the forecast of gas demand between FY 2005 and FY 2025. Demand in the
base case rises from 1,249 MMCF per day in FY 2005 to 3,277 MMCF per day in FY 2025
representing a CAGR of 4.9%. Demand is forecast to grow by about 2 BCF per day by FY 2025.
Demand in the high growth scenario rises from 1,308 MMCF per day to 4,108 MMCF per day
with a CAGR of 5.9%. In this scenario, demand grows by about 2.8 BCF per day by 2025.
Demand in the low growth scenario rises from 1,167 MMCF per day to 2,286 MMCF per day by
FY 2025. This represents a CAGR of 3.4%.
Figure 3-20 Bangladesh Total Gas Demand Forecast30
30 Source: ECON Analysis, 2004
1000
1500
2000
2500
3000
3500
4000
4500
2004
2005
2006
2007
2008
2009
2010
2011
2012
2013
2014
2015
2016
2017
2018
2019
2020
2021
2022
2023
2024
2025
2026
MMCFD
FISCAL YEAR
ECON Analysis Total Gas Demand Forecast
Base
High Growth
Low Growth

6/5/2012 33 Gustavson Associates
Figure 3-21 shows the share of total gas demand in Bangladesh by sector in FY 2000. The
power sector is by far the largest consumer followed by the fertiliser sector.
Figure 3-21 Share of Gas Demand by Economic Sector FY 200031
Figure 3-22 represents the forecasted share of total gas demand in FY 2030. The power sector is
forecast to remain the largest segment growing from 45% of total demand to 60% in FY 2030.
Industry becomes the second largest user consuming 18% of total demand in FY 2030. The
fertiliser sector’s share of total demand shrinks because its growth is forecast to be small.
31 Source: ECON Analysis, 2004
Fertiliser25%
Industry14%
Losses5%
Other11%
Power45%
FY 2000 Share of Total Bangladesh Gas Demand

6/5/2012 34 Gustavson Associates
Figure 3-22 Share of Gas Demand by Economic Sector FY 203032
3.4.4 Global Data Forecast
Global Data’s forecast was conducted in 2010 as an economy wide forecast from FY 2005 to FY
2020. Their forecast includes actual historical data before 2010. Figure 3-23 shows Global
Data’s forecast to FY 2020. Demand is forecast to rise from 1,817 MMCF per day in FY 2010
to 2,698 MMCF per day in FY 2020. Demand is expected to increase over the period FY 2010-
2020 at a CAGR of 4.0%.
32 Source: ECON Analysis, 2004.
Fertiliser6%
Industry18% Losses
2%Other14%
Power60%
FY 2030 Share of Total Bangladesh Gas Demand

6/5/2012 35 Gustavson Associates
Figure 3-23 Total Gas Demand Forecast Bangladesh33
The Global Data Report did not describe the methodology used to derive their forecast.
3.5 NEW FORECAST SCENARIOS
The total gas demand in Bangladesh was about 1.9 BCF per day in fiscal year 2009. The average
annual growth rate in historical gas demand over the previous decade was 9.2% or 10.0% per
year (depending on the information source). The power sector is the largest consumer of natural
gas. There have been shortages in the availability of natural gas. These shortages have resulted
in frequent electrical load shedding. Demand growth was probably limited due to the lack of
available gas.
We estimate that the average annual growth rate in the future demand for natural gas will be
between 5.7% and 8.9% per year, with a base case estimate of 7.3% per year. These estimates
imply that gas demand in FY 2025 will be between 5.1 and 8.3 BCF per day, with a base case
estimate of 6.5 BCF per day. This represents a growth in demand of between 3.0 and 6.2 BCF
33 Source: Global Data, 2010
1000
1200
1400
1600
1800
2000
2200
2400
2600
2800
2004 2006 2008 2010 2012 2014 2016 2018 2020 2022
MMCFD
FISCAL YEAR
Global Data Gas Demand ProjectionActual Historical Consumption
Global Data Forecast

6/5/2012 36 Gustavson Associates
per day, within 16 years from FY 2009. Since production from existing sources will go on
decline in this time period, the amount of additional gas that must be supplied to the country is
even larger than this. The next chapter of the report presents an analysis of the sources of supply
that can meet this anticipated growing demand for natural gas in Bangladesh.
We have prepared three new gas demand scenarios for Bangladesh: a base case together with
low and high scenarios that reflect a range of possible demands. Each scenario is based on actual
consumption in FY 2009. Since the primary objective of this report was to analyze the total gas
needs of the country a forecast by sector was not included in this analysis. Table 3-6 shows the
growth rates used to develop the new scenario demand forecast.
Table 3-6 New Scenarios Forecast Growth Rates
NEW SCENARIOS GROWTH RATES Fiscal Year
Low Growth
Base Case
High Growth
2010 5.7% 7.3% 8.9%
2011 5.7% 7.3% 8.9%
2012 5.7% 7.3% 8.9%
2013 5.7% 7.3% 8.9%
2014 5.7% 7.3% 8.9%
2015 5.7% 7.3% 8.9%
2016 5.7% 7.3% 8.9%
2017 5.7% 7.3% 8.9%
2018 5.7% 7.3% 8.9%
2019 5.7% 7.3% 8.9%
2020 5.7% 7.3% 8.9%
2021 5.7% 7.3% 8.9%
2022 5.7% 7.3% 8.9%
2023 5.7% 7.3% 8.9%
2024 5.7% 7.3% 8.9%
2025 5.7% 7.3% 8.9%
Our base case forecast assumes a growth rate of 7.3%, somewhat lower than the actual average
growth rate in gas demand over the previous decade, but the same as Petrobangla’s base case.
We find the Petrobangla growth rate to be a good estimate for the base case. They have
extensive experience with the gas sector in Bangladesh. It is reasonable that the growth in gas
demand should be slower than it has been in the past, since historical growth was from a very

6/5/2012 37 Gustavson Associates
low base. One would expect high initial growth rates from a low base in a developing economy.
However, growth typically slows down after rapid initial development. Our high and low growth
projections use growth rates of 8.9% and 5.7%, respectively. These growth rates are the same as
Wood Mackenzie’s high and low growth demand projections. Wood Mackenzie did a detailed
sector by sector forecast of gas demand. We carefully reviewed their work, and found their
growth rates to be reasonable. Since the Wood Mackenzie report was published five years
before our report, we used the actual gas production in fiscal year 2009 as a starting point rather
than 2009 rates that were forecast by Wood Mackenzie.
Figure 3-24 shows the new demand scenarios for Bangladesh. (The values from the chart are
shown below the horizontal axis.)
Figure 3-24 New Bangladesh Gas Demand Forecast Scenarios
2009 2010 2011 2012 2013 2014 2015 2016 2017 2018 2019 2020 2021 2022 2023 2024 2025
High Growth 1935.2107.2295.2499.2722.2964.3228.3515.3828.4169.4540.4944.5384.5863.6385.6953.7572.
Base Case 1935.2076.2228.2391.2565.2752.2953.3169.3400.3649.3915.4201.4508.4837.5190.5569.5975.
Low Growth 1935.2045.2162.2285.2416.2553.2699.2853.3015.3187.3369.3561.3764.3978.4205.4445.4698.
0
1000
2000
3000
4000
5000
6000
7000
8000
9000
MMCFD
6/5/2012 38 Gustavson Associates
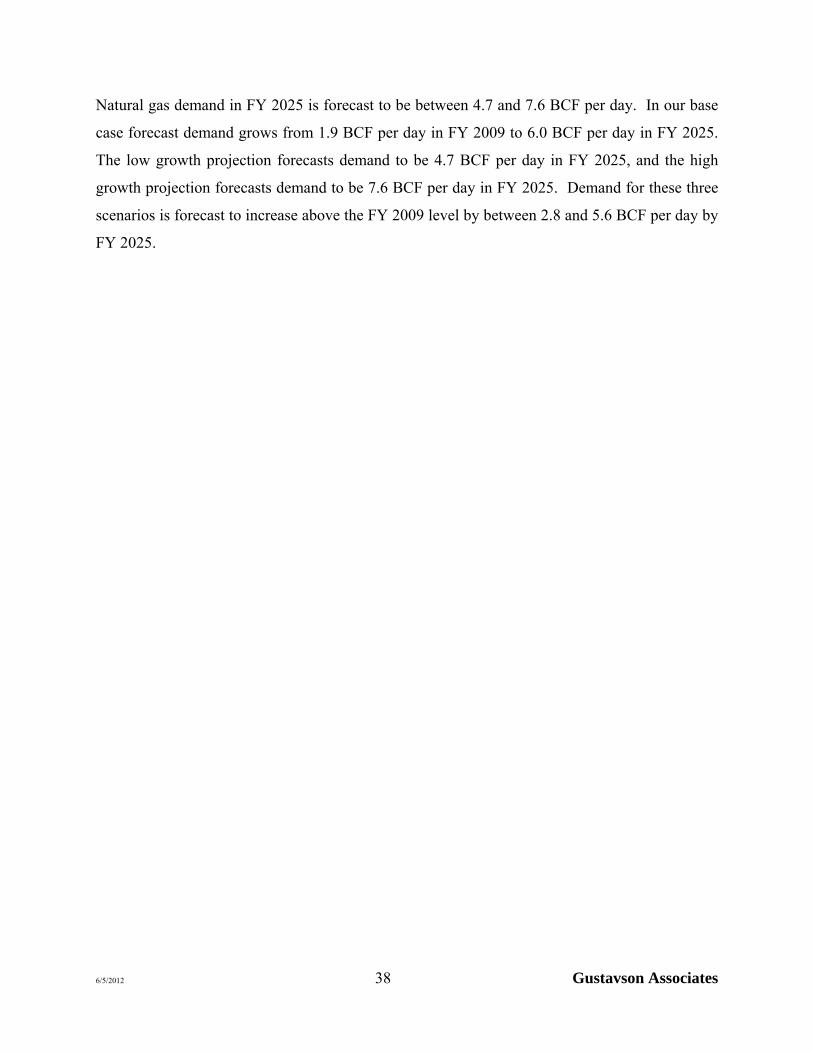
Natural gas demand in FY 2025 is forecast to be between 4.7 and 7.6 BCF per day. In our base
case forecast demand grows from 1.9 BCF per day in FY 2009 to 6.0 BCF per day in FY 2025.
The low growth projection forecasts demand to be 4.7 BCF per day in FY 2025, and the high
growth projection forecasts demand to be 7.6 BCF per day in FY 2025. Demand for these three
scenarios is forecast to increase above the FY 2009 level by between 2.8 and 5.6 BCF per day by
FY 2025.

6/5/2012 39 Gustavson Associates
4 GAS INFRASTRUCTURE AND POTENTIAL ENERGY SUPPLY SOURCES
4.1 GAS TRANSMISSION AND MARKETING INFRASTRUCTURE
Gas transportation pipelines, shown in Figure 4-1, carry gas from the fields in Bangladesh to
industrial and private customers that are located primarily in the eastern portion of the country.
Natural gas is also used to generate electricity, which is then distributed throughout the country.
In 2000 a multi-use bridge was completed over the Jamuna River to provide increased access to
the western portions of Bangladesh. This access includes a 30-inch gas pipeline that has
promoted additional pipeline systems in western Bangladesh. Some of these expansion projects
include Nalka to the Baghabari Power Plant in 2001, with a 20-inch pipeline, three network
integration projects between 2002 and 2006, and a pipeline to Dhaka in 2007. With predicted
increasing demand for natural gas and electricity in Bangladesh, the pipeline system will
continue to be important. The estimated total demand for natural gas in FY 2009 was about 707
BCF. The total delivered gas through the country’s pipeline system for 2009 was approximately
685 BCF.
There are six companies that market and transport natural gas to different areas of the country,
Titas Gas Transmission & Distribution Co. Ltd. (TGTDCL), Bakhrabad Gas Systems Ltd.
(BGSL), Jalalabad Gas Transmission & Distribution Company Ltd. (JGTDSL) and
Pashimanchal Gas Distribution Co. Ltd. (PGCL), Karnaphuli Gas Distribution Company Ltd.
(KGDCL), and Sundarbans Gas Company Ltd (SGCL). SGCL is not distributing any gas as yet.
It is a new company established for gas distribution in southwestern Bangladesh.
Titas Gas operates transmission and distribution lines totaling 11,496 kilometers and markets to
thirty-one power plants and four fertilizer plants along with other industrial and private
customers. Sales of natural gas in the fiscal year 2008-2009 were 474.8455 BCF.34
34 Petrobangla.org.bd

6/5/2012 40 Gustavson Associates
Figure 4-1 Gas Transmission Network Map of Bangladesh

6/5/2012 41 Gustavson Associates
Bakhrabad markets gas to nine power plants and three fertilizer plants in addition to other
industrial and private customers through its 6,246.62 kilometer pipeline network. Sales of
natural gas in the fiscal year 2008-2009 were 101.6348 BCF.35
Jalalabad sold gas through its 2,960.21 kilometers pipeline system to nine power plants and one
fertilizer plant, in addition to other industrial and private customers, amounting to 43.5471 BCF
in fiscal year 2008-2009.36
Pashchimanchal sells gas to areas west of the Jamuna River with a current pipeline network of
970.22 kilometers. It sold 27.68 BCF of gas to customers in fiscal year 2008-200937.
Gas Transmission Co. Ltd. (GTCL) was established to centralize the construction and operation
of high-pressure gas transmission pipelines.
4.2 EXISTING FIELDS
There are twenty-three discovered gas fields in Bangladesh that have an estimated total Proved
plus Probable gas initially in place (GIIP) of 35.5 TCF. Recoverable reserves are estimated to be
24.3 TCF (1P) and 28.2 TCF (2P). Currently, seventeen gas fields are producing from 79 wells.
Daily gas production is about 2,000 MMCF per day. Some of the fields have been producing
since 1960. Cumulative production reported by Petrobangla as of December 2010 is 9.43 TCF.
This means there is an estimated 18.77 TCF remaining reserves (2P). The gas reserves are
summarized in Table 4-1.
Table 4-1 Gas Reserve Summary Category Gas Reserves, TCF
GIIP (Proven+ Probable) 35.50 Recoverable (Proven + Probable) 28.20 Cumulative Production (as of December 2010) 9.43 Net Recoverable 18.77
35 Petrobangla.org.bd 36 Petrobangla.org.bd 37 Petrobangla.org.bd

6/5/2012 42 Gustavson Associates
The gas fields are operated by three national companies and four IOC companies. BGFCL is the
operator of the Titas, Bakhrabad, Habiganj, Narsingdi, Kamta (currently non-producing), and
Meghna gas fields. SGFL is the operator of the Sylhet, Kailashitila, Rashidpur, and Beani Bazar
gas fields. BAPEX is the operator of Slada Nadi, Fenchuganj, and Shahbazpur gas fields. The
fields that are operated by IOCs with PSCs are the Chevron operated Jalalabad, Moulavi Bazar,
and Bibiyana gas fields, the Santos operated Sangu gas field, the Tullow operated Bangura gas
field, and the Niko operated Feni (currently non-producing) gas field. There are three
undeveloped gas fields, the Begumganj, the Semutang, and the Kutubdia gas fields. IOC
operated fields make up 55% of the total production.
4.2.1 Field Production History
The Chattak gas field began producing in 1959. The gas was supplied to the Assam
Bengal Cement Factory.
The Sylhet gas field began commercial production in 1960. The only consumer was the
Fenchuganj Natural Gas Fertilizer Factory.
The Titas gas field started producing in 1968.
The Habiganj gas field started producing in 1969.
The Kailastila gas field started producing in 1984.
The Bakhrabad and Kamta gas fields started producing in 1985.
The Feni gas field started producing during the 1991-1992 time period.
Production from Chattak and Kamta was suspended in 1985 and 1998 as a result of
excessive water production from several different wells.
The first offshore gas field was the Cairn Energy Bangladesh Ltd. operated Sangu gas
field which began producing in June of 1998.
Currently gas is being produced from 17 fields that are operated by 3 national oil
companies and 4 international oil companies (IOCs) under PSC and JVA.
As of December 2010, the cumulative gas production is 9.43 TCF.
Gas production increased substantially after 2000.
6/5/2012 43 Gustavson Associates
4.2.2 Petrobangla Owned Producing Gas Fields
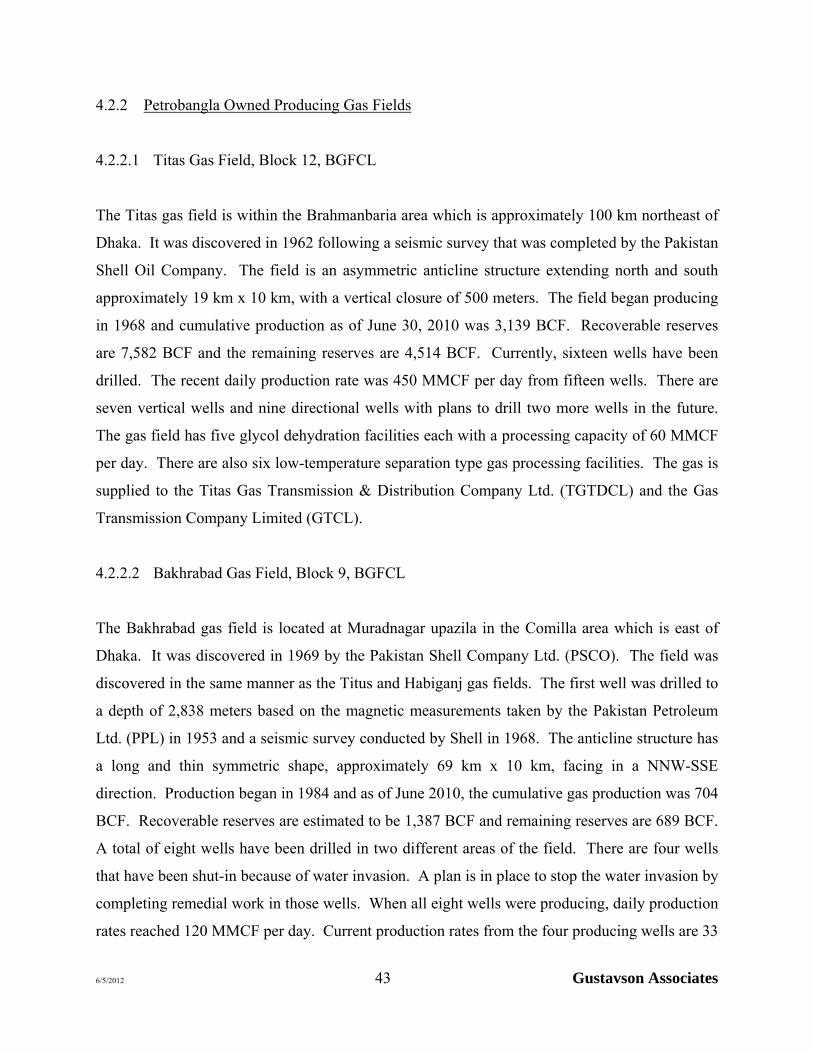
4.2.2.1 Titas Gas Field, Block 12, BGFCL
The Titas gas field is within the Brahmanbaria area which is approximately 100 km northeast of
Dhaka. It was discovered in 1962 following a seismic survey that was completed by the Pakistan
Shell Oil Company. The field is an asymmetric anticline structure extending north and south
approximately 19 km x 10 km, with a vertical closure of 500 meters. The field began producing
in 1968 and cumulative production as of June 30, 2010 was 3,139 BCF. Recoverable reserves
are 7,582 BCF and the remaining reserves are 4,514 BCF. Currently, sixteen wells have been
drilled. The recent daily production rate was 450 MMCF per day from fifteen wells. There are
seven vertical wells and nine directional wells with plans to drill two more wells in the future.
The gas field has five glycol dehydration facilities each with a processing capacity of 60 MMCF
per day. There are also six low-temperature separation type gas processing facilities. The gas is
supplied to the Titas Gas Transmission & Distribution Company Ltd. (TGTDCL) and the Gas
Transmission Company Limited (GTCL).
4.2.2.2 Bakhrabad Gas Field, Block 9, BGFCL
The Bakhrabad gas field is located at Muradnagar upazila in the Comilla area which is east of
Dhaka. It was discovered in 1969 by the Pakistan Shell Company Ltd. (PSCO). The field was
discovered in the same manner as the Titus and Habiganj gas fields. The first well was drilled to
a depth of 2,838 meters based on the magnetic measurements taken by the Pakistan Petroleum
Ltd. (PPL) in 1953 and a seismic survey conducted by Shell in 1968. The anticline structure has
a long and thin symmetric shape, approximately 69 km x 10 km, facing in a NNW-SSE
direction. Production began in 1984 and as of June 2010, the cumulative gas production was 704
BCF. Recoverable reserves are estimated to be 1,387 BCF and remaining reserves are 689 BCF.
A total of eight wells have been drilled in two different areas of the field. There are four wells
that have been shut-in because of water invasion. A plan is in place to stop the water invasion by
completing remedial work in those wells. When all eight wells were producing, daily production
rates reached 120 MMCF per day. Current production rates from the four producing wells are 33

6/5/2012 44 Gustavson Associates
MMCF per day. One well is a vertical well and the other seven wells are directional wells. The
Bakhrabad gas field has four silica gel type gas processing plants. The gas is supplied to the
transmission pipeline of the Bakhrabad Gas Systems, Ltd. (BGSL).
4.2.2.3 Habiganj Gas Field, Block 12, BGFCL
The Habiganj gas field is located in the Habiganj area which is approximately 100 km northeast
of Dhaka. The structure of the gas field is at the north end of the Tripuran Baramura anticline
structure in India. There is a main gas reservoir and an upper gas sandstone reservoir south of
Sadr. In 1962, the PSCO conducted a seismic survey. In 1963, an exploratory development plan
was initiated targeting the gas bearing sandstone reservoirs. The dimension of the structure is 12
km x 5 km, with a closure of 300 meters. Production began in 1968 and as of June 2010, the
cumulative field production was 1,713 BCF. Recoverable reserves are 2,787 BCF and remaining
reserves are 1,116 BCF. Of the eleven existing wells, nine are currently producing at a daily
production rate of 250 MMCF per day. There are six glycol type dehydration plants in the
Habiganj gas field. The processed gas is supplied to Titas Gas Transmission & Distribution Co.
Ltd. (TGTDCL), Jalalabad Transmission & Distribution Co. Ltd. (JDTDCL), and the Gas
Transmission Co. Ltd. (GTCL). There are nine vertical wells and two directional wells. The
wells are located approximately 14 km apart. There are two shut-in wells with water invasion
and sand problems.
4.2.2.4 Narsingdi Gas Field, Block 9, BGFCL
The Narsingdi gas field is located in the Narsingdi area in Shibpur upazila which is
approximately 45 km from Dhaka. The field is at the north peak of the large Bakhrabad
anticline. The Narsingdi gas field structure was named the A 2 peak by Shell in the 1960s. At
that time, Shell decided that it was a prospect with high risk. During 1984 and 1986, Petrobangla
completed a seismic survey in the field area and reevaluated the prospect. Petrobangla then
decided that the field had the potential of 2,474 BCF. During exploration two gas-bearing
sandstone reservoirs were confirmed and the lower reservoirs were also tested. Production began
in 1996 and as of June 2010 the cumulative production was 111 BCF. Recoverable reserves are
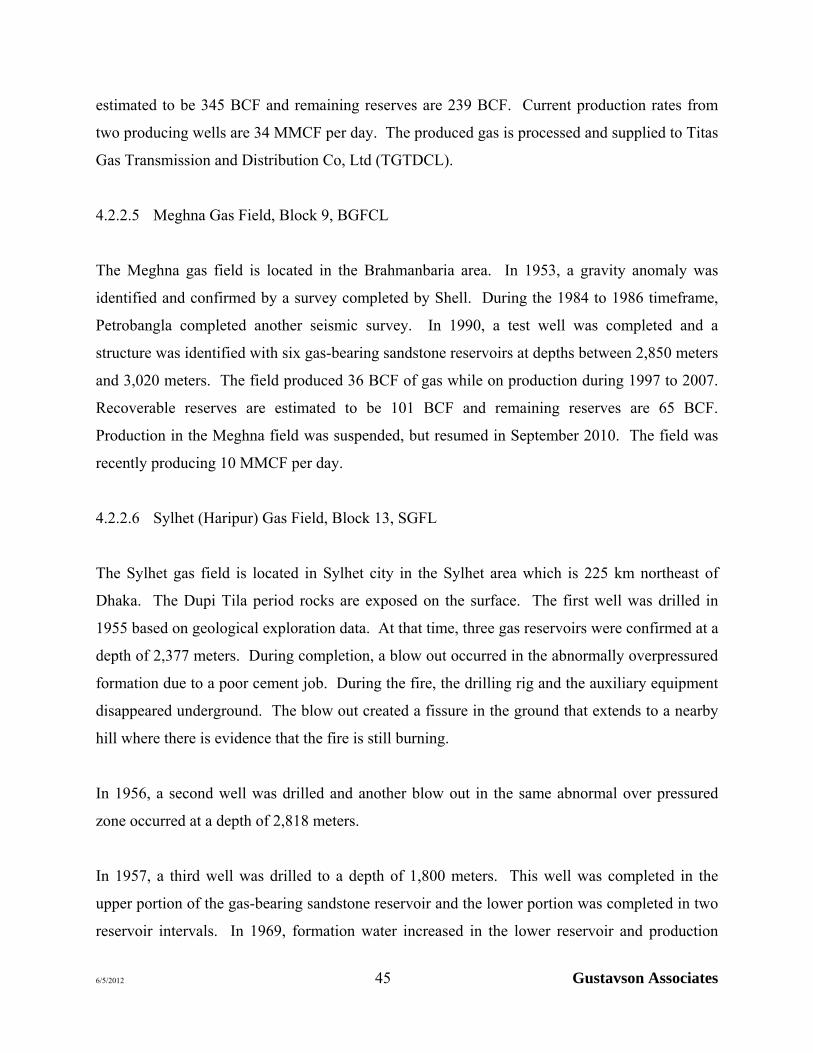
6/5/2012 45 Gustavson Associates
estimated to be 345 BCF and remaining reserves are 239 BCF. Current production rates from
two producing wells are 34 MMCF per day. The produced gas is processed and supplied to Titas
Gas Transmission and Distribution Co, Ltd (TGTDCL).
4.2.2.5 Meghna Gas Field, Block 9, BGFCL
The Meghna gas field is located in the Brahmanbaria area. In 1953, a gravity anomaly was
identified and confirmed by a survey completed by Shell. During the 1984 to 1986 timeframe,
Petrobangla completed another seismic survey. In 1990, a test well was completed and a
structure was identified with six gas-bearing sandstone reservoirs at depths between 2,850 meters
and 3,020 meters. The field produced 36 BCF of gas while on production during 1997 to 2007.
Recoverable reserves are estimated to be 101 BCF and remaining reserves are 65 BCF.
Production in the Meghna field was suspended, but resumed in September 2010. The field was
recently producing 10 MMCF per day.
4.2.2.6 Sylhet (Haripur) Gas Field, Block 13, SGFL
The Sylhet gas field is located in Sylhet city in the Sylhet area which is 225 km northeast of
Dhaka. The Dupi Tila period rocks are exposed on the surface. The first well was drilled in
1955 based on geological exploration data. At that time, three gas reservoirs were confirmed at a
depth of 2,377 meters. During completion, a blow out occurred in the abnormally overpressured
formation due to a poor cement job. During the fire, the drilling rig and the auxiliary equipment
disappeared underground. The blow out created a fissure in the ground that extends to a nearby
hill where there is evidence that the fire is still burning.
In 1956, a second well was drilled and another blow out in the same abnormal over pressured
zone occurred at a depth of 2,818 meters.
In 1957, a third well was drilled to a depth of 1,800 meters. This well was completed in the
upper portion of the gas-bearing sandstone reservoir and the lower portion was completed in two
reservoir intervals. In 1969, formation water increased in the lower reservoir and production

6/5/2012 46 Gustavson Associates
from that zone was shut-in. The well continued to produce from the upper reservoirs until 1988,
at which time, the upper reservoirs of the well were shut-in as a result of increased formation
water invasion.
In 1962, a fourth well was drilled, however, an abnormal overpressured zone was encountered at
a depth of 338 meters and the well was abandoned for safety reasons.
A fifth well was drilled next to the fourth well to monitor pressure behavior at the shallow
horizon. The fifth well was abandoned for technical reasons.
In 1964, the sixth well was drilled to a depth of 1,515 meters. The upper and lower layers of the
Bokabil sandstone beds were completed in two zones. In 1993, production from the lower
reservoir was shut-in because of water invasion. The upper reservoir is currently producing at a
rate of 2 MMCF per day. This well is expected to be shut-in in the near future. Cumulative
production in the field as of June 2010 was 189 BCF.
A seventh well was drilled by BAPEX to a depth of 2,009-2,033 meters. This well is the first oil
discovery in Bangladesh and initial production rates were 350 barrels per day. This well was
shut-in in July 1994 because of formation water invasion. The cumulative oil production was
560,869 barrels. In March 2005, this well was re-entered and completed as a gas well. Initial
gas rates were 15 MMCF per day. The well is currently shut-in and a workover is planned in the
future. Gas from this field is processed in a silica gel type gas processing plant located in Haipur
with a processing capacity of 30 MMCF per day.
4.2.2.7 Kailash Tila Gas Field, Block 13, SGFL
The Kailash Tila gas field is located at Gulapganj in the Sylhet area which is approximately 300
km northeast of Dhaka. The Kailash Tila structure is based on analog seismic data from a
seismic survey completed by Shell in 1960. The Shell data indicates that the anticline structure
is a 4-way closure. In 1961, the first well was drilled to a depth of 4,138 meters. The second
well and third well were drilled in 1988 and began producing in 1992. Afterward, the fourth

6/5/2012 47 Gustavson Associates
well was drilled and the production rate was 65 MMCF per day. From 2006 to 2007, the fifth
well and sixth wells were drilled. By the end of June 2010, the field cumulative production was
495 BCF. Recoverable reserves are estimated to be 2,880 BCF and remaining reserves are 2,400
BCF. The fifth well was recently shut-in as a result of increased water production. There is a
silica gel type gas processing plant that has been in operation since 1983 with a capacity of 30
MMCF per day. There is also a molecular sieve turbo expander gas processing plant that has
been in operation since 1995 with a capacity of 90 MMCF per day. To increase gas production
in this field, the drilling of two more wells is planned in the near future.
4.2.2.8 Rashidpur Gas Field, Block 12, SGFL
The Rashidpur gas field is located approximately 100 km northeast of Dhaka. The structure of
the field is an anticline extending north and south as identified by a seismic survey conducted by
Shell during 1959 and 1960. The first well was drilled in 1960 confirming two gas-bearing
sandstone reservoirs. In 1961, the second well was drilled to a depth of 4,593 meters. Research
indicated that the lower sandstone reservoir was water. Subsequently, five more wells were
drilled and began producing in 1993. By the end of June 2010, cumulative field production was
466 BCF. Recoverable reserves are estimated to be 3,134 BCF and remaining reserves are 2,677
BCF. The second and fifth wells are currently shut-in as a result of increased water production.
The five wells are currently producing at a rate of 50 MMCF per day.
Remedial work on the second and fifth wells is planned. The drilling of an eighth well is also
planned. There are four gas processing plants operating in the field, namely: a glycol type
processing plant with a 60 MMCF per day capacity, a silica gel type processing plant with a 70
MMCF per day capacity, and two silica gel type processing plants with a 45 MMCF per day
capacity.
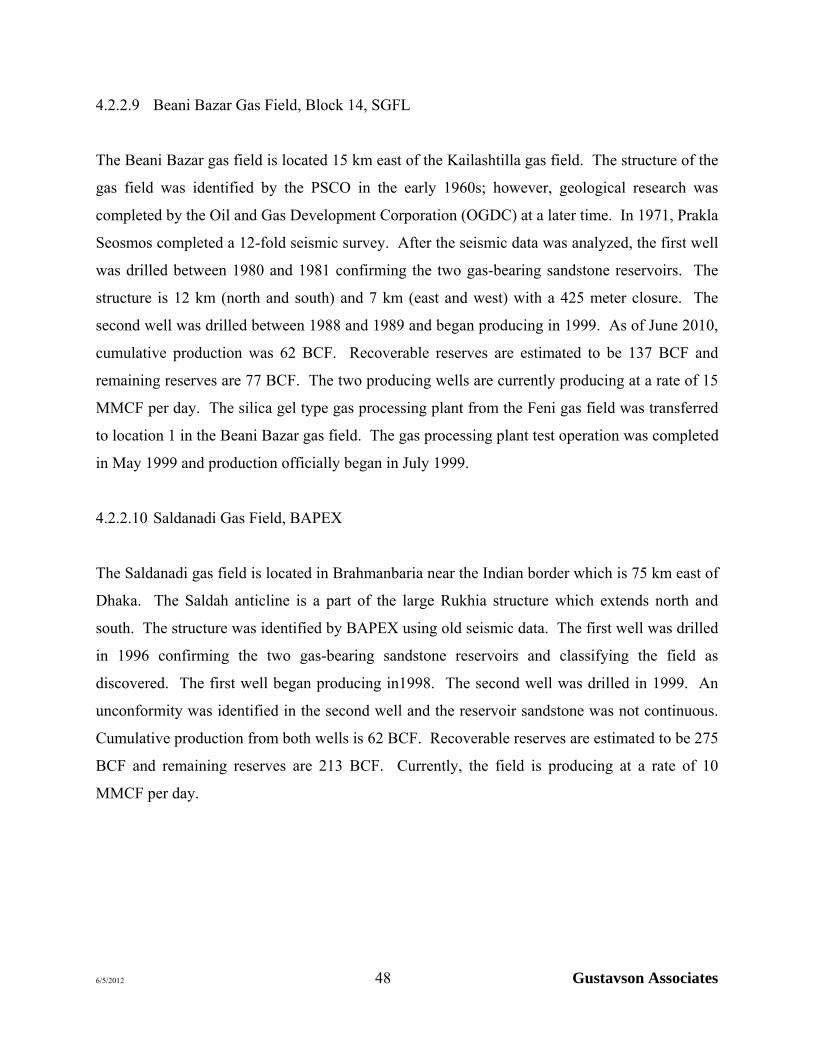
6/5/2012 48 Gustavson Associates
4.2.2.9 Beani Bazar Gas Field, Block 14, SGFL
The Beani Bazar gas field is located 15 km east of the Kailashtilla gas field. The structure of the
gas field was identified by the PSCO in the early 1960s; however, geological research was
completed by the Oil and Gas Development Corporation (OGDC) at a later time. In 1971, Prakla
Seosmos completed a 12-fold seismic survey. After the seismic data was analyzed, the first well
was drilled between 1980 and 1981 confirming the two gas-bearing sandstone reservoirs. The
structure is 12 km (north and south) and 7 km (east and west) with a 425 meter closure. The
second well was drilled between 1988 and 1989 and began producing in 1999. As of June 2010,
cumulative production was 62 BCF. Recoverable reserves are estimated to be 137 BCF and
remaining reserves are 77 BCF. The two producing wells are currently producing at a rate of 15
MMCF per day. The silica gel type gas processing plant from the Feni gas field was transferred
to location 1 in the Beani Bazar gas field. The gas processing plant test operation was completed
in May 1999 and production officially began in July 1999.
4.2.2.10 Saldanadi Gas Field, BAPEX
The Saldanadi gas field is located in Brahmanbaria near the Indian border which is 75 km east of
Dhaka. The Saldah anticline is a part of the large Rukhia structure which extends north and
south. The structure was identified by BAPEX using old seismic data. The first well was drilled
in 1996 confirming the two gas-bearing sandstone reservoirs and classifying the field as
discovered. The first well began producing in1998. The second well was drilled in 1999. An
unconformity was identified in the second well and the reservoir sandstone was not continuous.
Cumulative production from both wells is 62 BCF. Recoverable reserves are estimated to be 275
BCF and remaining reserves are 213 BCF. Currently, the field is producing at a rate of 10
MMCF per day.

6/5/2012 49 Gustavson Associates
4.2.2.11 Fenchuganj Gas Field, Block 14
The Fenchuganj gas field is located approximately 200 km northeast of Dhaka. The surface
structure of the Fenchuganj anticline is visible from air and satellite photos. The contour was
identified by the results of an analog seismic survey completed in 1957 by PPL. A test well was
drilled in 1960 and a gas show was observed.
A seismic survey was conducted by Prakla Seismos at the request of Petrobangla and under the
technical support of Germany to review the anticline structure map. The results of the seismic
survey indicated that the first well was drilled southwest of the center structure. Petrobangla
drilled a second well during 1985 and 1986 to a depth of 4,977 meters. The well log results
identified five sandstone reservoirs that contain hydrocarbons. The open hole test was completed
five times resulting in gas production. Oil was also found in one of the lower sandstone
reservoirs. A third well was drilled and began producing in 2004. As of June 2010, the
cumulative field production was 72 BCF. Recoverable reserves are estimated to be 329 BCF and
remaining reserves are 260 BCF. The current production rate is 27 MMCF per day.
4.2.2.12 Shahbazpur Gas Field, Block 10, BAPEX
The Shahbazpur gas field is located in the Bhola area which is approximately 140 km south of
Dhaka. Petrobangla completed a seismic survey in this area during 1986 and 1987 and selected a
drill site. BAPEX drilled the first well during 1993 and 1994 to a total depth of 3,631 meters.
Gas was discovered in several sandstone horizons. A second well was drilled and the field was
put on production in 2010. Daily production rates in the field are 7 MMCF per day. Cumulative
field production is 2 BCF. Recoverable reserves are expected to be 261 BCF and remaining
reserves are 259 BCF. It is estimated that 70 MMCF per day could be produced in the field in
the near future.
6/5/2012 50 Gustavson Associates
4.2.3 Petrobangla Owned Undeveloped Gas Fields
4.2.3.1 Begumganj Gas Field
The Begumganj gas field is located in the southern region of Bangladesh. Recoverable (Proven+
Probable) reserves are estimated to be 33 BCF.
4.2.3.2 Semutang Gas Field
The Semutang gas field was discovered by OGDC in 1970. The structure is visible on the
surface by outcrops of the Dupi Tila and Tipan sandstones. The estimated recoverable reserves
are 318 BCF.
4.2.3.3 Kutubdia Gas Field
In the mid 1970s, Union Oil (later called Unocal) discovered the Kutubdia gas field which is
located south of the coastal island of Shahbazpur, Hatia during offshore exploration.
Recoverable reserves are estimated to be 46 BCF.
4.2.4 IOC Operated Gas Fields
4.2.4.1 Jalalabad Gas Fields, Block 13, IOC: Chevron
The Jalalabad gas field is located approximately 200 km northeast of Dhaka. The Jalalabad
structure was identified by Petrobangla under the technical support of Germany. At that time,
the structure was selected as a drilling site under the support of Germany. Those projects were
never realized. In 1987, the PSC of this area was given to Scimitar Oil and the first well was
drilled in 1989. Gas was discovered in three sandstone reservoirs. The anticline structure is SW-
NE in direction. The PSC of block 13 in Scimitar that fell through in 1995 and was given to
Occidental. By 1998, Occidental drilled four additional wells, three of which were gas wells.
Production from those wells began in February 1999. In 1999, Unocal became the operator of

6/5/2012 51 Gustavson Associates
this field. Unocal laid 15 km of pipeline to the gas processing plant and to the existing north and
south transmission lines. The cumulative field production is 573 BCF. Recoverable reserves are
estimated to be 1,128 BCF and remaining reserves are 555 BCF. Currently field production is
155 MMCF per day. If current production rates continue, depletion is expected to occur within 3
to 4 years. Based on a 3D seismic survey, Chevron is optimistic regarding future production in
the Jalalabad field.
4.2.4.2 Moulavi Bazar Gas Field, Block 14, IOC: Chevron
The Moulavi Bazar gas field is located in the Kalapur, Srimangal, Moulavi Bazar area which is
approximately 170 km northwest of Dhaka. Under the supervision of Germany, a digital multi-
fold seismic survey was completed and a new structural drawing based on the seismic results
was completed. After reviewing the results, the structure was selected as an exploration target
which was funded by the German government. This project was never realized. An additional
seismic survey was completed by BAPEX during 1990 and 1991. In 1995, the mine sites of
blocks 12, 13 and 14 were awarded to Occidental. In 1997, Occidental started drilling the first
well. The well was not completed because there was a blow out at 840 meters. In 1999, Unocal
took over the project and drilled a second well to a depth of 3,510 meters. The second well
confirmed the presence of the multi-layered, gas-bearing sandstone formation. A third well was
drilled to research the scale of the gas field. In 2003, Chevron acquired Unocal and concluded a
Gas Purchase and Sales Agreement (GPSA) with Petrobangla. Chevron drilled three production
wells that began producing in 2005. Chevron also constructed a gas processing plant with the
processing capacity of 150 MMCF per day and laid 24 km of pipeline. Cumulative gas
production is 162 Bcf. Recoverable reserves are estimated to be 494 BCF and remaining
reserves are 332 BCF. Daily field production rates are 56 MMCF per day.
4.2.4.3 Bibiyana Gas Field, Block 12, IOC: Chevron
The Bibiyana gas field is located in the Habiganj area which is approximately 220 km northeast
of Dhaka. The field is a long anticline structure in the north and south direction with a 14 km (L)
and 4 km (W) closure. During 1997 and 1998, Occidental USA identified the Bibiyana gas

6/5/2012 52 Gustavson Associates
structure and drilled the first well in 1999. The first well was drilled to a depth of 4,014 meters.
Something fell in the wellbore and got stuck at a depth of 3,618 meters blocking test access to
the lower zones. There were six tests performed on the upper zones of the formation. A second
well was drilled to a depth of 4,276 meters and tests in the lower zones of the formation were
completed. The test results from the first two wells indicated that the formation consists of nine
gas-bearing sandstone reservoirs. During 1998 and 1999, a 3D seismic survey was completed.
In 1999, Unocal obtained the rights for blocks 12, 13, and 14 and became the operator of the
Bibiyana gas field.
After Chevron acquired Unocal, five wells were drilled in the southern area and seven wells were
drilled in the northern area. Chevron also installed a gas processing plant with a capacity of 600
MMCF per day and laid 42 km of pipeline from the gas processing plant to Muchai. Production
began in March 2007. The cumulative field production as of June 2010 was 735 BCF.
Recoverable reserves are estimated to be 4,532 BCF and remaining reserves are 3,797 BCF. Gas
production rates as of June 2010 are 692 MMCF per day, making it the largest gas field in
Bangladesh.
4.2.4.4 Sangu Gas Field, Block 16, IOC: Cairn/Santos
Cairn Energy Plc., a UK based company, has been involved in oil and gas exploration and
development projects in Bangladesh since 1974. A 2D seismic survey was completed in block
16 which was obtained by PSC. A gas field was discovered in 1996. The gas field is offshore
approximately 45 km southwest of Chittagong, Bangladesh. An offshore drilling platform was
constructed in a water depth of approximately 10 meters. At that time, nine production wells
were drilled. Production began in 1998 after construction of a 520 MMCF per day capacity gas
processing facility in the Chillimpur terminal in Chittagong. The drilling platform and the gas
processing facility are linked by a 20” pipeline. The initial wellbore pressure was 4,600 psi and
the current wellbore pressure is around 1,000 psi. As of June 2010 there are six producing wells
that produce at a rate of approximately 31 MMCF per day. The cumulative production is 476
BCF. Recoverable reserves are estimated to be 771 and remaining reserves are 295 BCF. The
6/5/2012 53 Gustavson Associates
structure of the gas field is a NW-SE trending anticline structure. Cairn sold its interest to Santos
in 2010.
The reservoir is a sandstone with ten gas-bearing zones. The primary target is the SG 3155
formation which is 50% of the entire structure. It is predicted that production from this field will
cease within the next few years.
4.2.4.5 Bangora Gas Field, Block 9, IOC: Niko/Tullow
The Bangora gas field is located 100 km southeast of Dhaka. Tullow Oil Plc has been involved
in oil and gas exploration activities in Bangladesh since 1997. In 2001, Tullow obtained a PSC
for the mine site of block 9. Tullow is the field operator but field development is the
collaborative effort of three companies. The breakdown of the collaboration is: Tullow (30%),
Niko (60%) and BAPEX (10%). Tullow identified the Lalmi-Bangora large anticline structure
and drilled the third well in the Lalmi area in May 2004. At that time, a gas reservoir was
discovered as a result of well testing. The first well drilled in Bongora was located 40 km north
of the third well drilled in Lalmi. That well was drilled to a depth of 3,636 meters and a gas-
bearing sandstone reservoir was discovered between 2,580 meters and 3,285 meters. The test
results indicated that the production rate capability is 25 MMCF per day. In May 2009, the fifth
well was drilled and put on production. The gas is processed in a gas processing plant with a
capacity of 120 MMCF per day. Currently, the production data and a 3D seismic survey are
interrelated with the Lalmi structure. As of June 2010, the cumulative production was 116 BCF.
Recoverable reserves are estimated to be 621 BCF and remaining reserves are 505 BCF. The
daily production rates are 107 MMCF per day.
4.2.4.6 Feni Gas Field, block 15, IOC: Niko
The Feni gas field is located approximately 125 km from Dhaka. During 1975 and 1976, a
seismic survey was completed by the Taila Sandhani Company. At that time, they named the
structure Feni. During 1979 and 1980, another seismic survey was completed, resulting in a new
structural drawing with a long and thin anticline structure. The first well was drilled in June

6/5/2012 54 Gustavson Associates
1960. An overpressured zone was found at a depth of 3,200 meters and the upper reservoir was
evaluated. The two producing intervals of the gas-bearing sandstone reservoir were identified by
the well logs and test data. The Feni gas field began producing in 1991. The second well was
drilled in 1994 and the production began in 1995. The production was shut-in in 1998 as a result
of increased formation water production.
In 2003, Niko Resources Ltd. signed the joint venture with BAPEX to promote the development
and production of the Feni and Chattak gas fields. The Feni gas field ceased production in 1996
and the Chhatak gas field ceased production in 1982. In late 2004, Niko Resources Ltd. restarted
production at a rate of 20 MMCF per day. In January 2005, the production processing plant was
reinforced. At that point, all activity ceased. As of June 2010 daily production rate was 1
MMCF per day. Cumulative production is 63 BCF. Recoverable reserves are estimated to be
130 BCF and remaining reserves are 67 BCF.
4.2.4.7 Kamta Gas Field, Block 9, Suspended: Petrobangla
The Kamta gas field is located near Kaliganj in the Gazipur area which is approximately 17 km
north of Dhaka. The Kamta gas field was discovered by Petrobangla in 1982. Production began
in November 1984 with a daily rate of 20 MMCF per day. By 1988, the production rate had
decreased to a rate of 3 MMCF per day as a result of increased water production. The field was
eventually shut-in in 1991. The cumulative production is 21 Bcf. Recoverable reserves are
estimated to be 50 BCF and remaining reserves are 29 BCF.
4.2.4.8 Chattak Gas Field, Block 12, Suspended: Niko & Bapex
The Chattak gas field is located approximately 2.5 km northwest of Sylhet city. The structure of
the gas field is the north end of the Surma basin which is an ESE-WNW anticline structure. In
1959, PPL completed a 75 km seismic survey. In 1959, the first well was drilled to a depth of
2,135 meters. Nine gas-bearing sandstone reservoirs were identified between 1,090 meters and
1,975 meters. The field began producing in 1960. The field was shut-in in 1986 as a result of
increased water production. Cumulative production is reported to be 26 BCF. Recoverable

6/5/2012 55 Gustavson Associates
reserves are estimated to be 474 BCF and the remaining reserves are 448 BCF. It appears that a
considerable amount of gas has not been recovered and there is potential for gas recovery in the
future.
In 2000, Niko Resources of Canada (Niko) completed a collective reserves research program
with BAPEX. There are outstanding legal issues between Petrobangla and Niko regarding the
Joint Venture Agreement (JVA). The situation is expected to be settled soon and it is expected
that a development program in the Chattak gas field will be initiated in the future. A 3D seismic
survey has already been completed with positive results.
4.3 PLANNED EXPLORATION
The Government has outlined a plan to explore, discover, and improve new gas fields. The
salient features of the short, medium, and long term objectives for the planned and ongoing
programs are as follows:
4.3.1 FY 2010 Plan
The short term plan to increase gas production is outlined below. The expected result of the
short term exploration and development plans was to increase production by 95-100 MMCF per
day, to be supplied to the national grid by June 2011.
Actions to be taken
Salda gas field - There are plans to workover one well. The results of the workover are
expected to increase production by 15-20 million cubic feet per day.
Fenchuganj gas field – There are plans to drill two evaluation/development wells. The
two new development wells are expected to increase production by 35 million cubic feet
per day.
Sundalpur gas field – There are plans to drill one exploration well in the Sundalpur gas
field in the Noakhali District. The exploration well is expected to increase production by
15 million cubic feet per day.

6/5/2012 56 Gustavson Associates
Sangu gas field - An exploration/development well in the southern area of the Sangu gas
field is expected to increase production by 30 million cubic feet per day.
4.3.2 Short Term Plan (expected completion by June 2013)
The short term plan includes the drilling of 39 exploration and development wells. The 39
planned wells are expected to add more than 1.9 billion cubic feet of gas production capacity per
day by 2013.
Gas shortages have resulted in the temporary closure of some power plants and fertilizer
factories that have severely interrupted the generation of electricity and fertilizer. Importing
LNG is a viable option for supplementing the natural gas supply. The medium term plan
includes importing up to 500 million cubic feet per day of LNG to convert to gas. An agreement
with Qatar has already been signed to import LNG, in which Moheshkhali has been selected as
the location for installation of the floating LNG receiving and storage station. Land acquisition
is under way to construct a pipeline from Moheshkhali to Anwara and a LNG terminal. The
process is expected to be complete by 2013.
4.3.2.1 Actions to be Taken by the National Gas Company
Salda, Titas, Fenchugonj, Semutang, Shabazpur, and Bakhrabad gas fields – The drilling
of ten development wells are planned. These wells are expected to produce 190 MMCF
per day.
Kapasia, Srikail, Sundalpur, and Mobarakpur gas fields - Exploration well sites have
been identified using seismic data. The planned wells are expected to produce 95 MMCF
per day.
The Fast Track Program – This program was developed to address the increasing gas
demand and supply shortage issues. The program includes plans to drill four
development wells in the Titas gas field and one development well in the Rashidpur gas
field. There is also one planned workover in the Rashidpur gas field. This program also
includes plans to indentify and drill new development wells using data collection,

6/5/2012 57 Gustavson Associates
processing, and analyses of a 3,100 kilometer 2-D seismic survey. If the exploration
program is successful, gas reserves and gas production will increase in the future.
Muchai, Ashuganj, and Elenga – To ensure optimum gas supply and maintain steady
pressure, compressor stations are planned to be installed at Muchai, Ashuganj, and
Elenga. The compressor at Muchai will be installed by November 2011, while the
compressors at Ashuganj and Elenga will be installed by December 2012.
Discovery of a New Gas Structure – In recent months, BAPEX interpreted 283 kilometers
of 2D thirty-fold seismic data, in which a potential gas structure (Sunetra) was identified.
Sunetra spreads across the Sunamganj and Netrokona districts. Based on the results of
the interpretation, the structure is expected to have a remarkable gas reserve. Land
acquisition, development of infrastructure, and other relevant activities are being done by
BAPEX in order to begin drilling an exploration well at the end of October 2011.
4.3.2.2 Actions to be Taken by International Oil Companies
Chevron plans to drill 9 development wells at Moulvibazar, 6 development wells at Bibiyana,
and 3 development wells at Jalalabad. These wells are expected to produce 1,000 MMCF per
day.
4.3.3 Intermediate Term Plan (expected completion by December 2015)
The intermediate term plan includes local and international oil companies drilling exploratory
wells. Exploratory wells drilled by local oil companies are expected to produce 180 MMCF per
day. Exploratory wells drilled by international oil companies are expected to produce 700
MMCF per day. In total, 880 MMCF per day is expected to be added to the national grid by
December 2015.

6/5/2012 58 Gustavson Associates
4.3.3.1 Actions to be Taken by the National Gas Company
The National Gas Company plans on drilling 9 development wells, 5 of which are planned in
Sylhet, Kailastilla, and Rashidpur gas fields. There are 4 development wells planned in the Titas
gas field. Expected production from these 9 wells is 180 million cubic feet per day.
4.3.3.2 Actions Taken by International Oil Companies
An offshore bidding round that took place in 2008 resulted in an agreement with ConocoPhillips
and Tullow for 3 offshore blocks. Subject to the signing of a production sharing contract (PSC),
a target has been set to produce 200 MMCF daily as a result of exploratory activities. A plan for
eleven development wells in Bibiyana, Jalalabad, and Moulvibazar gas fields in Blocks 12, 13,
and 14 is set to supply 500 MMCF daily to the national grid.
4.3.4 Summary
The target daily production rate outlined in the short, medium, and long term plans would
increase gas supply by 2,325 to 2,380 MMCF per day. Exploration and drilling programs are
expected to increase the gas supply by 1,825-1,880 MMCF per day. Imported LNG is expected
to increase the gas supply by 500 MMCF per day.
4.3.5 Steps to Ensure the Implementation of the Plans
Although the implementation of the current year, short term, and intermediate term plans would
add to the natural gas supply, it will not completely satisfy the expected future gas demand. To
ensure the execution of the plans to increase the natural gas supply, the following steps must be
taken:
Ensure provision of funds as per the plan.
Arrange for a timely bidding round for onshore and offshore blocks.
In an effort to strengthen BAPEX, the purchase of higher quality machinery, advanced
technology, and build up of manpower is necessary.
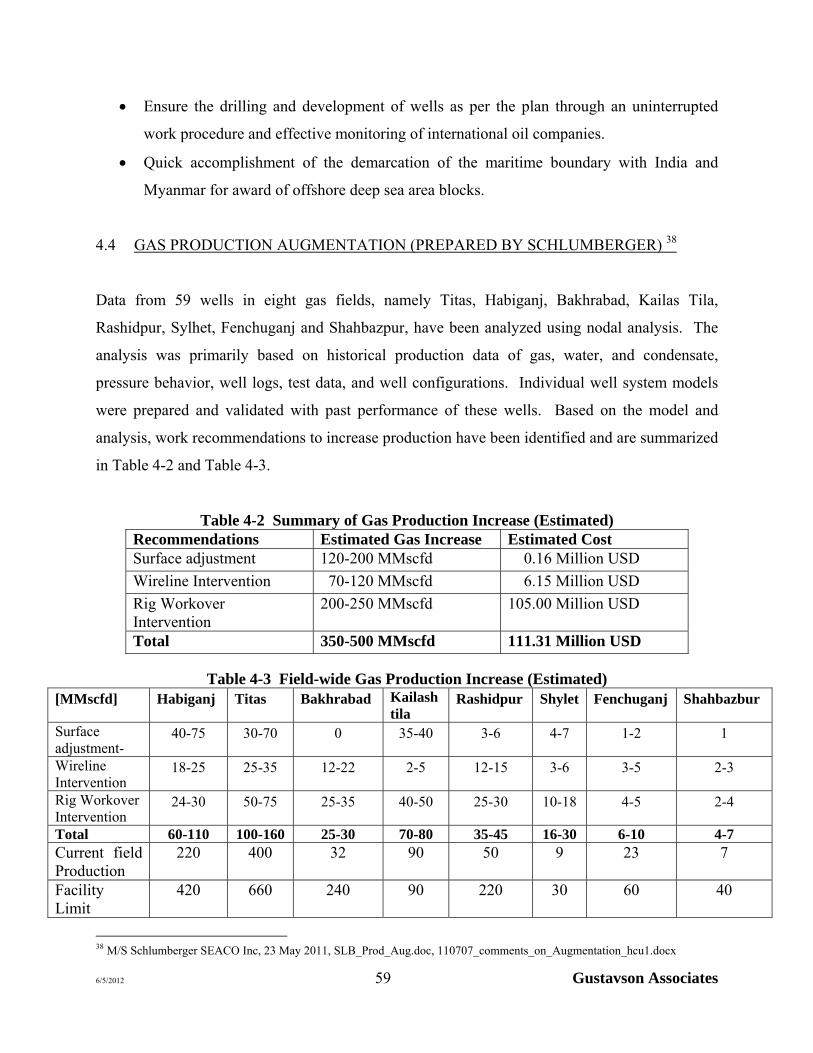
6/5/2012 59 Gustavson Associates
Ensure the drilling and development of wells as per the plan through an uninterrupted
work procedure and effective monitoring of international oil companies.
Quick accomplishment of the demarcation of the maritime boundary with India and
Myanmar for award of offshore deep sea area blocks.
4.4 GAS PRODUCTION AUGMENTATION (PREPARED BY SCHLUMBERGER) 38
Data from 59 wells in eight gas fields, namely Titas, Habiganj, Bakhrabad, Kailas Tila,
Rashidpur, Sylhet, Fenchuganj and Shahbazpur, have been analyzed using nodal analysis. The
analysis was primarily based on historical production data of gas, water, and condensate,
pressure behavior, well logs, test data, and well configurations. Individual well system models
were prepared and validated with past performance of these wells. Based on the model and
analysis, work recommendations to increase production have been identified and are summarized
in Table 4-2 and Table 4-3.
Table 4-2 Summary of Gas Production Increase (Estimated) Recommendations Estimated Gas Increase Estimated Cost Surface adjustment 120-200 MMscfd 0.16 Million USD
Wireline Intervention 70-120 MMscfd 6.15 Million USD
Rig Workover Intervention
200-250 MMscfd 105.00 Million USD
Total 350-500 MMscfd 111.31 Million USD
Table 4-3 Field-wide Gas Production Increase (Estimated) [MMscfd] Habiganj Titas Bakhrabad Kailash
tila Rashidpur Shylet Fenchuganj Shahbazbur
Surface adjustment-
40-75 30-70 0 35-40 3-6 4-7 1-2 1
Wireline Intervention
18-25 25-35 12-22 2-5 12-15 3-6 3-5 2-3
Rig Workover Intervention
24-30 50-75 25-35 40-50 25-30 10-18 4-5 2-4
Total 60-110 100-160 25-30 70-80 35-45 16-30 6-10 4-7Current field Production
220 400 32 90 50 9 23 7
Facility Limit
420 660 240 90 220 30 60 40
38 M/S Schlumberger SEACO Inc, 23 May 2011, SLB_Prod_Aug.doc, 110707_comments_on_Augmentation_hcu1.docx
6/5/2012 60 Gustavson Associates
Several steps were recommended to increase production as outlined above. A control device on
the PCV can be installed on wells that can be adjusted to increase the flow from a well as long as
the reservoir permits. This type of adjustment is actually done from time to time in the fields.
However, at a later stage when the plant upstream pressure declines by such a level that the
concerned PCV cannot handle the same volume with its designed operating range, the PCV
might need to be re-sized based on the process requirement. Since 2010, BGFCL has increased
production from the Titas field by 43 MMscfd by adjusting the PCV. The back pressure can also
be reduced to increase flow. In some wells, high skin factors can be removed to increase
productivity by reperforating and acidizing the area. This may not be applicable for all wells,
however, as there are restrictions in completion strings and many of the reservoir rocks are
argillaceous sandstones, which hardly react with acid. Another suggestion to increase production
was to replace the tubing with larger diameter tubing. This could be considered on a case by
case basis, but Titas, Habiganj, Kailas Tila, and Rashidpur gas fields were identified as good
candidates for replacing the tubing.
Wireline and rig workover interventions would require temporary shutdowns of wells. This is
not deemed to be possible at the current time due to the current gas shortage in Bangladesh.
4.5 CONVENTIONAL GAS RESOURCE EXPLORATION
4.5.1 Prospects
A prospect is an oil or gas exploration opportunity that has sufficient data to suggest a drilling
location. The data has been mapped and the resulting predicted hydrocarbon accumulation is
deemed to be economic if all necessary aspects are present. These prospects are considered to be
conventional resources.
4.5.2 Leads
A lead is an oil or gas exploration opportunity with sufficient data to suggest a possible prospect.
Either the data is insufficient to confirm the prospect or the work is incomplete on evaluation of
the data that could raise the lead to prospect status.
6/5/2012 61 Gustavson Associates
4.5.3 Unmapped Resources
The category of Unmapped Resources, as used in this report, includes additional prospective
resources from conventional accumulations that have not yet been identified as being in a
specific prospect or lead. This evaluation has been built on the foundation of the resource
estimate report prepared by the USGS in 2001. The USGS assessment divided the country into
six Assessment Areas:
1. The Surma Basin assessment unit;
2. Easternmost Extremely Folded assessment unit;
3. High-Amplitude Faulted Anticlines assessment unit;
4. Moderately Folded Anticlines assessment unit;
5. Western Slope assessment unit;
6. Western Platform assessment unit.
These areas are shown on Figure 4-2. The approach used by the USGS was to assign to each
assessment unit a triangular probability distribution for the number of fields to be discovered,
and a lognormal distribution for the size of fields to be discovered. These same distributions
were used for this report.
Because maps showing the exact location of each prospect and lead were not available to
Gustavson, when blocks were split between assessment areas, the number of prospects and leads
in those blocks were apportioned into the assessment areas roughly proportionally to the area of
the block within each assessment area. For example, half of Block 3’s prospects and leads were
assigned to the Western Slope area and half to the Western Platform area. Some areas had a
maximum number of discoveries in the distribution smaller than the number of mapped
prospects and leads in that area: those areas were assigned no unmapped resources in this Study.

6/5/2012 62 Gustavson Associates
Figure 4-2 USGS map of resources in Bangladesh by region

6/5/2012 63 Gustavson Associates
4.6 UNCONVENTIONAL GAS RESOURCES
Bangladesh is now suffering an acute energy crisis. There is a large difference between energy
demand and supply and the government is trying to solve the problem. It is very difficult to cope
with the ever increasing demand with conventional energy extraction technologies. Reducing
the dependency on natural gas is also necessary. Importing fuel is an alternative solution, but
may be costly. It is prudent for Bangladesh to identify alternative domestic energy sources such
as coalbed methane (CBM), shale gas, and thin beds.
4.6.1 Coal Bed Methane (CBM) 39
Many coal producing countries are evaluating the option of extracting methane gas, gas trapped
in coal seams that is also known as coalbed methane (CBM), before extracting coal by mining.
CBM projects could provide additional gas resources to assist in meeting gas demand.
In the south Asian region, CBM is still in the experimental stage. China has implemented
various policies that provide incentives to participants of CBM and CMM (coal mine methane)
development projects. India has a production sharing contract framework and has invited bids
from international companies interested in CBM exploration and development. CBM is a capital
intensive and specialized sector. Bangladesh needs to develop a conducive environment and an
incentive policy to attract international companies and investment. Initially, CBM potential must
be evaluated with consideration of expected returns and benefits of investment. The results of
that evaluation will help Bangladesh identify and suggest incentives, and suitable policy
measures required to invite foreign participation.
In most of the coalfields in Bangladesh, the coal beds are very deep. Methane gas trapped in the
coals can be extracted with very little disturbance to the current human habitat and agricultural
fields. Coal bed methane (CBM) is a form of natural gas that is composed mostly of methane,
with some carbon dioxide. It is often referred to as unconventional because it is stored within the
matrix of the coal itself instead of within the pores of the host rock.
39 This section is based on “Coal Bed Methane (CBM): A Compilation” by Hydrocarbon Unit (HCU), 2011

6/5/2012 64 Gustavson Associates
Coal miners have known about the presence of CBM in coal mines for centuries. In the past it
was viewed as an explosive danger and was something to be avoided or controlled. Extraction of
CBM is technologically feasible and economically viable. CBM extraction can provide
immediate relief to the current energy shortage. The extraction of CBM does not exclude coal
mining using open-pit or underground mining at a later time. In fact, the extraction of CBM
before coal mining actually reduces the dangers of methane explosions during underground
mining.
Coal-bed methane (CBM) is an economic source of pipeline-quality methane gas generated and
stored in coal beds. It is a widely occurring, exploitable resource that can be easily recovered.
Coal acts as both source rock and reservoir rock for methane. Methane is generated by microbial
(biogenic) or thermal (thermogenic) processes shortly after burial and throughout the digenetic
cycle resulting from further burial.
Much of this gas is physically adsorbed on coal surfaces in areas with coal micro porosity. One
short ton of coal can produce about 1,300 m3 of methane. Hydraulic pressure, rather than a
pressure seal or closed structure (common for conventional oil and gas fields), is the major
trapping force for CBM.
Coal is extremely porous (openings), but has low permeability (connected openings). Gas
adsorbed on coal is predominantly methane, but much of it cannot be economically produced
without the presence of natural fractures (cleats) to connect the pores. Cleats allow the desorbed
gas to flow to the well.

6/5/2012 65 Gustavson Associates
4.6.2 Shale Gas40
Natural gas produced from shale is considered to be an unconventional hydrocarbon and is
known as "shale gas". Shale gas is primarily composed of methane (90% or more methane). In
contrast to most conventional hydrocarbon plays, in the case of shale gas the strata are both the
reservoir and the source rock. Since permeability and porosity are very low in this reservoir the
application of the technology of artificial fracturing and horizontal drilling are necessary to
exploit this resource.
Shale is deposited as mud and silt in depositional environments charterized by quiet water. The
very fine-grained sediments and organic matter from algae, plants, and animal debris, form the
shale. The included organic matter when buried and mature generates natural gas. Shale gas is
stored within the shale bed and in macro-porosity systems (fracture porosity), micro-pores, or
adsorbed onto minerals or organic matter. Gas trapped in un-fractured shale (low permeability
on the order of 0.01 to 0.00001 millidarcies) cannot move easily within the rock.
Hydraulic fracturing involves pumping a fracture fluid into a formation at a calculated,
predetermined rate and pressure to enhance natural fractures and generate new fractures in the
target formation. The additional permeability created by fracing allows gas to flow more readily
toward the well bore. Frac fluids are primarily water-based fluids mixed with additives which
help the water carry sand “proppant” into the fractures. The sand “proppant” remains in the
formation to "prop" open the fractures. Hydraulic fracturing and long reach horizontal drilling
technology have made the development of shale gas viable.
4.6.2.1 International Experience
In the United States, shale gas exploration and production has increased rapidly and is the most
active exploration play in the United States. The estimated cost of producing shale gas is
between $6 and $11 per MMBtu (Million British Thermal Units). The Henry Hub spot price
40 This subsection is based on material from several sources including “Workshop Details on Shale Gas” HCU ,2011; Shale Gas Introduction”, Sagar, R SPL, Dhaka, 2011; “Shale Gas ,Energy & Power”, Hossain M.M, 2011; “Shale Gas” HCU, 2011

6/5/2012 66 Gustavson Associates
averaged $4.05 per MMBtu in August 2011. There are some countries in Europe and Asia that
are working on incorporating shale gas resources into their energy mix. Recently China and
India incorporated plans to harness shale gas resources into their future energy plan.
The United States has a long history in production of shale gas and has recently focused
exploration and production attention on this resource. Advances in horizontal drilling techniques
and hydraulic fracturing have made shale reserves more accessible and the price for natural gas
encouraged companies to explore for this resource. Strong gas prices were necessary to exploit
this resource since the technology involved is both time and money intensive. Natural gas prices
in the United States have dropped from their peak levels and have an effect on the profitability of
this resource.
In 2010 shale gas production in the United States accounted for 25% of the total U. S. production
of natural gas.41 In 2009 the Barnett Shale play in Texas produced 6% of all natural gas
produced in the United States, excluding Hawaii and Alaska,42 from more than 15,000 wells. As
of the end of 2010, the Barnett Shale play had cumulative production of more than 9 trillion
cubic feet of gas. 43 The total recoverable gas resources in four new shale gas plays (the
Haynesville, Fayetteville, Marcellus, and Woodford) may be over 550 TCF.44 There are around
35,000 wells under production in five major established shale gas plays in the US. From 1996 to
2008, production of shale gas increased from 0.3 to 2.02 TCF per year.
China set a target for the country to identify 50-80 percent shale gas prospects and 20-30 percent
exploration and development blocks by 2020. China also set a goal to locate one trillion cubic
meters of recoverable shale gas reserves, build 15-30 billion cubic meters per year of production
capacity and produce 8-12 percent of China's natural gas from shale gas wells by 2020.
Geological and geochemical characteristics of the black mud-shale in the Nenjiang and
Qingshankou formations in China suggest a favorable mud shale gas zone. China National
Petroleum Corporation (CNPC) has a target to produce 500 million cubic meters (mcm) of shale
41 www.eia.gov, Pressroom 42 Shale Gas Primer, 2009; U.S. Department of Energy 43 The Railroad Commission of Texas 44 www.eia.gov, Analysis & Projections

6/5/2012 67 Gustavson Associates
gas per day by 2015. In November 2009, the United States agreed to share information about
gas-shale technology with China, and to promote US investment in Chinese shale-gas
development.
In India, shale deposits are found across the Gangetic Plain, Assam, Rajasthan, and many coastal
areas. Basins of preliminary interest identified by Indian geologists are the Cambay Basin in
Gujarat, the Assam-Arakan Basin in northeast India, and the Gondwana Basin in central India.
The shales in Gondwana and Cambay basins are being explored for evaluating the shale gas
potential.
India and the United States have agreed to cooperate on clean technology and shale gas, and they
signed an agreement for cooperation with respect to shale gas technology. Indian scientists
consider shale gas to be an important energy independent resource for India and have expressed
concern about its lack of technological know-how in this sector.
4.6.2.2 Shale Gas Prospects in Bangladesh
Strata that may be explored for shale gas in Bangladesh are not yet well known or specifically
identified. Considerable work is necessary to investigate the potential shale gas plays that have
been suggested. Source rock analysis, burial history and maturity, details of the rock facies,
fracture analysis, geographic extent, and other factors will need to be researched and data
gathered. The potential shale gas plays in Bangladesh include organic-rich shales of Eocene,
Oligocene, and Miocene age that have been considered to be the source rocks for conventional
gas and oil discoveries and shows in wells in the different regions of Bangladesh. There are
several areas that warrant investigation for shale gas potential. These would be areas of the
Bogra Shelf, Surma Basin, Hatia Trough, and Fold Belt in locations and at depths that would be
expected to include source rocks that are mature to hydrocarbons.
Some data have been collected for rocks of Mesozoic through Tertiary age in Bangladesh
showing the total organic content TOC and the hydrogen index (HI) indicating suitability and
maturity of these potential source rocks. The TOC values range from 0.2 weight percent TOC to

6/5/2012 68 Gustavson Associates
16 weight percent TOC and greater45. A TOC value of 0.5 weight percent is considered the
minimum organic content for a good source rock. Both oil-prone and gas-prone rocks have been
sampled. Maturity is not well known for all of the potential strata. Additional work must be
done. The fact that gas is produced in Bangladesh and oil is known from wells indicates that
mature source rocks are present and could be exploited as shale gas plays.
Gustavson Associates has estimated the resource potential of a geographic area of 8,421 square
kilometers along the Bogra Shelf where shales of Late Cretaceous through Early Eocene age may
be buried at depths sufficient to place the strata within the hydrocarbon generation window. The
expected depth of maturity along the Bogra Shelf is 3,000 to 5,500 meters. Shales of this same
age would be expected to be mature at approximately 6,000 to 8,000 meters depth if present in
the Surma Basin. Resources were assigned to an area of 7,706 square kilometers for the resource
report. The same age shales, if present and of sufficient quality, would be expected to occur in
the Hatia Trough and be mature at depth of 5,400 to 10,000 meters. Resources have been
assigned to an area of 33,553 square kilometers of the region of the Hatia Trough. Pre- Miocene
age shales are predicted to be mature at depths of approximately 3,000 to 6,500 meters in the
region of the Fold Belt. Gas resources were estimated in this region for an area of 23,000 square
kilometers.46
4.6.2.3 Shale Gas Development Initiative in Bangladesh
1. A committee has been formed by the Ministry of Energy & Mineral Resources under the
leadership of the Director General, Hydrocarbon Unit to assess the potential for shale gas
in Bangladesh and to make proper recommendations for its development.
2. The Hydrocarbon Unit has recruited an international consultant to study shale gas
potential in Bangladesh.
3. Like the Indian Government, a delegation headed by the Director General of the
Hydrocarbon Unit and other competent officials from the Energy Ministry and
45 2011 Resource Report, Gustavson Associates 46 2011 Resource Report, Gustavson

6/5/2012 69 Gustavson Associates
Petrobangla may visit the US Geological Survey, USA to discuss assistance in
identifying and exploiting shale gas resources in Bangladesh.
4. An experienced shale gas consultant should be engaged for assessing the shale gas
potential in Bangladesh and determine reserves and/or resources, if any.
5. A workshop/training is recommended for capacity building with the participation of
officials and experts from concerned organizations.
6. As the USA is pioneer in shale gas development with experience in shale gas technology,
Bangladesh can request support from the United States Geological Survey (USGS) to
evaluate shale gas potential in Bangladesh as well as to improve technical know-how.
4.6.3 Thin Beds
Thin beds are simply thin pay zones that are too thin to show up on older logs. These pay zones
are present in producing fields in Bangladesh but were not recognized when the wells were
originally drilled because of the resolution of the logging tools. The inclusion of these zones
might increase the net pay thickness and thus the reserves in existing fields considerably. One
notable study has been done to identify these zones in the Bibiyana gas field. The results
indicate that reserves for this field can be increased by more than 60 percent.47 Some of the
reservoir intervals within the lower Bokabil and underlying Bhuban Formations consist of thin-
bed, interlaminated pay consisting of thin alternations of reservoir-quality sands and non-
reservoir shales. These intervals were identified by thin-bed logging tools, in particular the
STAR tool, a micro-resistivity device. These pays at Bibiyana, with thickness between 5 cm and
30 cm, represent over 60 percent of the net pay in the first two wells, as documented in Unocal’s
Evaluation Report of July 2000.
4.7 SUPPLEMENTAL ENERGY SOURCES
In order to meet energy demand, Bangladesh should consider new hydrocarbon exploration as
well as other sources of energy including gas imports and other types of energy besides natural
gas. Natural gas supply substitutes are identified and discussed below.
47 2011 Resource Report, Gustavson

6/5/2012 70 Gustavson Associates
4.7.1 LNG Imports48
LNG (Liquefied Natural Gas) brings to mind a big volume business using giant cryogenic
vessels moving across seas and oceans. LNG is exported from Algeria to EU countries and from
the Middle East, Malaysia, Indonesia to Japan and other Far East countries. Japan accounts for
around 80% of the total volume of LNG traded in the Asia Pacific region.
LNG has now become a proven commercial technology for transporting natural gas. Major
exporters of LNG include Algeria, Libya, Trinidad & Tobago, Oman, Qatar, UAE, Nigeria,
Australia, Brunei, Indonesia, and Malaysia. Importers include the USA, Puerto Rico, Belgium,
France, Greece, Italy, Portugal, Spain, Turkey, Japan, South Korea, and Taiwan. Japan is the
world’s biggest importer of LNG followed by South Korea and France.
LNG now accounts for 7 percent of the world’s natural gas demand. The global growth rate of
LNG business is 6 to 7 percent per year.49 Natural gas is expected to become an increasingly
important energy source world-wide for power generation, the production of petrochemicals, and
transportation. A gas dominant energy environment would increase LNG trading. The
decreasing cost of LNG liquefaction could also help the market grow. Continuous growth in
spot and short term LNG trading would also help promote market integrations and advance the
commercialization of LNG.
The major advantages of LNG are:
Its density is 600 times that of natural gas in the gas phase.
It can be stored above or below ground in specially designed double walled storage tanks.
LNG can be transported to main ports, remote areas, and over long distance via LNG
carriers or vessels, keeping LNG in chilled condition during transportation.
The major disadvantages of LNG include its capital intensive nature and stringent safety issues.
48 This subsection is based on several sources including “LNG New Opportunity”, Ahmed, N., Probe News Magazine , 2007; “Low Cost LNG” Ahmed, N., Probe News Magazine, 2007; “LNG Viable Alternative Energy & Power”, Saleque, K.A. , 2009. 49 Saleque, KA: ‘LNG Viable Alternative Energy & Power’, 2009

6/5/2012 71 Gustavson Associates
The Bangladesh energy outlook has changed as a result of substantial gas shortage. Bangladesh
is keen to import LNG to alleviate the gas shortage issues particularly the electricity needs. A
Memorandum of Understanding was signed with Qatar to import the LNG equivalent of 500
MMCF per day.
In January of 2011, the Bangladesh government decided to initiate a plan for a floating LNG
project. They have solicited the services of Eccelerate Energy to determine the LNG site
location and estimate costs for the planned project.
The government intends to quickly implement the project to prevent a natural gas shortage
related crisis from occurring in Chittagong before 2012. The main tasks of the project include
the construction of a floating LNG receiving gas storage terminal in Moheskhali, the
construction of a re-gasification infrastructure, and the construction of a Moheskhali-Chittagong
Pipeline.
GTLC would have to install the pipeline from Mohashkhali to Chittagong. The entire LNG
project will be implemented on a build-operate-transfer basis with an estimated cost of US $1.6
billion. Once the work order is issued, completion of the project is expected to take 18-24
months.
4.7.2 Natural Gas Pipeline Imports
There is a growing and urgent demand for natural gas in Bangladesh some of which could be
supplied by natural gas imports via new pipelines. In the past, there was a plan to supply natural
gas from Bibiyana gas field to the gas market in northern India. That plan was suspended
because the Bangladesh government asserted that they would not export gas unless a strategic
volume of reserves, enough reserves to support domestic demand for at least 50 years, were
secured. The conditions changed and the people of Bangladesh argued that natural gas supply
would not meet demand. Possible pipeline routes are from India or Myanmar.
6/5/2012 72 Gustavson Associates
In 2002, Reliance discovered a large gas field, Dhirubhai, east of the Bay of Bengal, India. The
Dhirubhai gas field is located at KG-DWN-98/3 (D6) mining area and located in the KG
sedimentation basin. This discovery stimulated investment and led to the discovery of other
large gas fields. The gas field began producing in April 2009, 7 years after the field was
discovered. It is expected that the discovery of the Dhirubhai gas field will continue to stimulate
the Indian economy and secure the Indian energy supply. Bangladesh has had several meetings
with India regarding importing natural gas to Bangladesh. The results of these meetings are
unknown.
In 2004, Daewoo, a company based out of South Korea, discovered the Shwe gas field at the A-
1/3 mining area off the western coast of Myanmar. Daewoo reports that gas reserves for 3 gas
fields in the vicinity of the Shwe gas field are estimated to be 4.8 to 8.6 TCF. In February 2002,
Bangladesh was in negotiations with Myanmar to import natural gas to Bangladesh via pipelines.
During this time, Myanmar announced their intention to prioritize their natural gas exports to
China and India. Myanmar disclosed that they would examine exporting natural gas to
Bangladesh provided there was sufficient supply after exporting to China and India. Importing
natural gas seems to be a very complex and sensitive issue with several speculations of the
related countries. Last year, Russia and India expressed new interest in the Tri-Nation gas
pipeline project initiating a new discussion.50 However, there are also recent reports that this
project may be abandoned.51
4.7.3 Coal52
Coal is one of the oldest sources of energy, although it has been viewed as a “dirty fuel” because
carbon dioxide emissions per unit of energy production from coal are higher than for other fuels,
such as natural gas. As a result of increased petroleum oil and natural gas prices, coal is being
viewed as a major energy substitute for other energy supplies. Coal prices have increased
50 Kaladan Press Network, May 7, 2011, http://www.kaladanpress.org/v3/index.php?option=com_content&view=article&id=3168:talks-with-burma-to-import-gas-tri-nation-gas-pipeline-talks-may-be-revived&catid=136:may-2011&Itemid=2 51 http://www.thefinancialexpress-bd.com/more.php?date=2012-04-21&news_id=127358 52 This subsection is based on material from ‘The Study for Master Plan on Coal Power Development in the People’s Republic of Bangladesh’, JICA & Tokyo Elec Power Ltd ,2010; “Coal: New Energy Option for Bangladesh” Ahmed. N, Probe News Magazine , 2007; and “Coal Can Change the Destiny of Bangladesh” , Ahmed, N, Probe News Magazine, 2007

6/5/2012 73 Gustavson Associates
globally generating new interest in commercial exploration and exploitation projects by
international coal companies.
There are five coal fields in NW Bangladesh with coal resources that have the potential to meet
the immediate energy needs. There is some debate about the best methods for extracting the coal
without endangering the socio-political and natural environment. There are many advantages
and disadvantages of both open-pit and underground coal mining in a densely populated and
agriculturally rich area like the Dinajpur and Rangpur districts.
Geological and hydro geological circumstances of the Gondwana coal basins of NW Bangladesh
imply that neither multi-slice long wall mining method (MLMM), nor open pit mining method
could be successful for its optimum production rates considering its surrounding environments.
For example, the present underground mining operation in the Barapukuria coal mine reveals
that only 10% (34 Mt) of the total in situ reserve coals (377 Mt) is recoverable by using MLMM.
On the other hand, the open pit mining method, where recoverable rate is over 90%, would
create devastating environmental degradation for valuable agricultural lands, damage of the
water-bearing Dupi Tila aquifer, surface water contamination by mine wastages, acid mine
drainage (AMD), replacement of densely populated villages, and other problems with
ecosystems. The mining method thus, shall be selected with careful consideration of the above
facts.
In the early 1960s, a coal deposit was discovered at Kuchma, Bogra district. The coal deposit
was discovered while drilling for oil and gas at a depth of 1,000 meters from the surface. After
the discovery, concerted efforts were made to find coal at economic depths. Substantial coal
deposits have been discovered in the greater Bogra, Dinajpur, and Rangur districts in
northwestern Bangladesh. The discovered coal is excellent in quality. The coals are bituminous
and sub-bituminous with low sulfur and ash content. A heating value of 11,000 BTU/lb is
reported.

6/5/2012 74 Gustavson Associates
There are five major coal fields in Bangladesh, namely, Jamaganj (Jaipurhat), Barapukuria
(Dinajpur), Khalashpir (Rangpur), Dighipara (Dinajpur), and Phulbari (Dinajpur). A brief
description of each field is discussed below.
4.7.3.1 Jamalganj Coal Field
Coal was discovered at Jamalganj in 1962. Estimated reserves are 1,470 million tons. Proved
reserves are 1,054 million tons across 7 coal seams at depths ranging from 800 meters to 1,150
meters. At that depth, underground mining would not be economically viable. With the
collaboration of expert foreign partners, coalbed methane extraction may be possible.
4.7.3.2 Barapukuria Coal Field
The Geological Survey of Bangladesh discovered high quality bituminous coal at Barapukuria in
1985. A techno economic feasibility study revealed estimated reserves of 390 million tons of
coal in 6 seams at depths ranging from 130 meters to 500 meters. Considering the geological
condition of the coals and the hydro geological system, Petrobangla decided to recover coal from
only the No 6 Seam. Proved reserves of the No 6 Seam are 271 million tons. Recovery from
this field is estimated to be 25 percent or 67 million tons of coal which is an energy equivalent of
1.77 TCF (Trillion Cubic Feet) of natural gas.
4.7.3.3 Khalashpir Coal Field
In 1989, an estimated 685 million tons of coal was discovered at Khalashpir at depths ranging
from 257 meters to 483 meters. Proved reserves are estimated to be 143 million tons.
Recoverable reserves are estimated to be 35 million tons of coal which is the energy equivalent
of 0.92 TCF of natural gas.
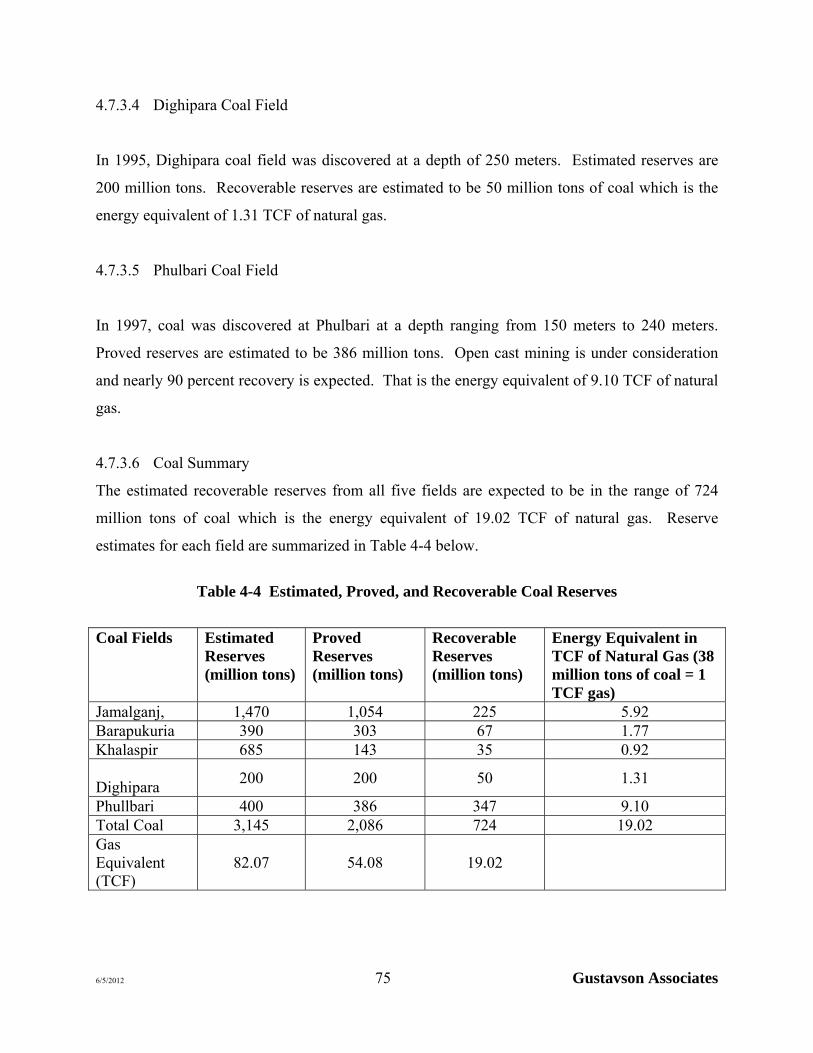
6/5/2012 75 Gustavson Associates
4.7.3.4 Dighipara Coal Field
In 1995, Dighipara coal field was discovered at a depth of 250 meters. Estimated reserves are
200 million tons. Recoverable reserves are estimated to be 50 million tons of coal which is the
energy equivalent of 1.31 TCF of natural gas.
4.7.3.5 Phulbari Coal Field
In 1997, coal was discovered at Phulbari at a depth ranging from 150 meters to 240 meters.
Proved reserves are estimated to be 386 million tons. Open cast mining is under consideration
and nearly 90 percent recovery is expected. That is the energy equivalent of 9.10 TCF of natural
gas.
4.7.3.6 Coal Summary
The estimated recoverable reserves from all five fields are expected to be in the range of 724
million tons of coal which is the energy equivalent of 19.02 TCF of natural gas. Reserve
estimates for each field are summarized in Table 4-4 below.
Table 4-4 Estimated, Proved, and Recoverable Coal Reserves
Coal Fields Estimated Reserves (million tons)
Proved Reserves (million tons)
Recoverable Reserves (million tons)
Energy Equivalent in TCF of Natural Gas (38 million tons of coal = 1 TCF gas)
Jamalganj, 1,470 1,054 225 5.92 Barapukuria 390 303 67 1.77 Khalaspir 685 143 35 0.92 Dighipara
200 200 50 1.31
Phullbari 400 386 347 9.10 Total Coal 3,145 2,086 724 19.02 Gas Equivalent (TCF)
82.07 54.08 19.02
6/5/2012 76 Gustavson Associates
Peat coal has also been discovered at the Khulna, Faridpur, and Madaripur areas at depths
ranging from 1.75 meters to 4.25 meters. The heating value of the peat coal is around 6,370
BTU/lb which is about half the heating value of bituminous coal. There is an estimated 55
million tons of peat coal in Bangladesh which is the energy equivalent of 0.72 TCF of natural
gas.
Experts opine that if all of the recoverable coal could be converted into power it could generate
20,000 MW of electricity for 66 to 90 years. Current technology used in the USA, Europe,
Japan, and South Africa converts coal into clean synthetic liquid petroleum, synthetic gas,
fertilizer, and other petrochemical products.
There are several challenges concerning the development of coal mines in Bangladesh. The first
challenge is that the coal seams are very deep. The second challenge is that the coal seams are
unusually thick. These problems make it very difficult for a poor country like Bangladesh to
extract coal. These challenges require the development of coal in Bangladesh to be dependent on
foreign energy companies.
The coal policy of Bangladesh will hopefully be finalized soon after proper consultation with
experts and stakeholders has taken place. Bangladesh has very little funding, an unskilled
workforce, and very little technology for coal development. Experts opine that extracting coal
through open pit mining would ensure 80 to 90 percent extraction of the coal and this type of
mining would pose less risk. Experts are in favor of at least 20 percent of power generation
based on local coal. In Australia, 85 percent of the electricity is generated from coal. In China,
80 percent of the electricity is generated from coal. In India, 75 percent of the electricity is
generated from coal. Currently in Bangladesh, 90 percent of the power generation is based on
natural gas. Utilization of coal for electricity generation as an alternative to natural gas could be
a viable option. Currently a 250 MW power plant is in operation at Barapukuria coal field where
the extraction of 1 million tons of coal per year is planned.
For successful exploitation of coal, participation from the private sector with direct foreign
investment is desirable. The terms for such private sector activity, including royalty rate, must
6/5/2012 77 Gustavson Associates
be carefully chosen to balance both the Bangladesh national interest and financial goals of
foreign investors.
Recently the Government has decided to set up a new company, Coal Power Generation
Company of Bangladesh Ltd. The cost of power generation will decrease substantially once the
company starts operating coal based power plants. The Government has set a target to generate
20,000 MW of power through coal-based power plants to run under the Power Development
Board (PDB).
It is beyond the scope of the current project to model development of coal reserves and resources
in Bangladesh. It would be appropriate for such a study to be conducted in order to assess the
potential for coal to alleviate future energy shortages in Bangladesh, as well as the implications
for emissions of carbon dioxide.
4.7.4 Liquefied Petroleum Gas (LPG) 53
There is not a complete pipeline network infrastructure across the country, and furthermore gas
resources are limited. In an effort to reduce deforestation and prevent pollution, the government
has provided special incentives to help popularize the use of LPG. The government has reduced
the tax rate on some spare parts of LPG bottles such as the pressure regulator/valve, the
safety/relief valve, and the submerged welding flux.
Currently the country consumes around 96,000 metric tons of LPG per year, of which local
production from the public sector is 22,500 metric tons and import from the private sector is
73,500 metric tons. Demand for LPG is increasing. The projected demand for LPG in the
country is about 200,000 metric tons.
53 This subsection is based on material from “Energy Scenario of Bangladesh”, HCU, 2011

6/5/2012 78 Gustavson Associates
4.7.5 Petroleum Products
To meet the total demand of commercial energy, including new oil based power plants, last year
Bangladesh imported about 5.4 million metric tons of petroleum products. Because of new diesel
and furnace oil based power plants (expected 30 plants) in the present, (FY 2011-2012)
petroleum import will be around 7.03 million tons; most of them will be in refined form. The
lone refinery, Eastern Refinery Limited (ERL), a company of the Bangladesh Petroleum
Corporation (BPC), is capable of processing 1.2 million metric tons of crude oil per year.
Condensate is also extracted from different local gas fields. Approximately 0.35 million metric
tons of condensate is being recovered from gas fields per year. To keep pace with the increasing
demand for fuel, a feasibility study has been undertaken to examine an increase in the refining
capacity of the Eastern Refinery Limited to 4 million tons through BMRE. In addition, a project
for deep sea offloading facilities has also been initiated.54
4.7.6 Renewable Resources
Renewable energy resources could assist in the energy security of Bangladesh and could help
reduce the natural gas demand. Regions of the country without supply or access to natural gas or
the electric grid use biomass for cooking and solar power and wind for drying different grains
and clothes. Biomass is currently the largest renewable energy resource in use due to its
extensive noncommercial use, mainly for cooking and heating. Biomass comprises 38 percent of
the total primary energy use in Bangladesh.
The country has a huge potential for generating solar power. Moreover the use of renewable
energy has become popular worldwide in view of the depleting reserves of non-renewable fossil
fuels. Renewable energy is environmentally friendly. The different sources of renewable energy
that are being used in Bangladesh are outlined below.
54 Source: Daily Prothom Alo, 14 September, 2011.

6/5/2012 79 Gustavson Associates
4.7.6.1 Biomass
Biomass refers to the organic materials produced from plants and animals. Examples of biomass
are fuel, woods, leaves, agricultural residues, and animal dung. Converting biomass into more
energy efficient fuel is a means of upgrading the rural energy consumption pattern. Biogas is
very suitable for cooking and lighting (Mantel/Hazak) and for running a small generator to
produce electricity. Throughout Bangladesh, there are currently about 50,000 households and
village-level biogas plants in place. There is a real potential for harnessing basic biogas
technology through rural electrification, village-level biogas production, and internal combustion
(or even micro turbine) power generation.
4.7.6.2 Biofuel55
Biofuels can be produced from a variety of plants like rapeseed, mustard, corn, sunflower, canola
algae, soybean, pulses, sugarcane, wheat, maize, and palm. The most popular option for
producing bio-fuels is from non-edible oilseed bearing trees. The two most suitable species are:
the Jamal gota (Jatropha curcas) and Verenda (Ricinus Communis). Both of these trees can grow
virtually anywhere in any soil and geo- climatic condition.
The use of bio-fuel is increasing in most European countries. Germany has thousands of filling
stations supplying bio-fuel and it is cheaper than petrol or diesel. The German government
declared that 5 percent of every liter of fuel must be bio-fuel by 2010 and 10 percent of every
liter of fuel must be bio-fuel by 2015. European Union (EU) countries are now capable of
producing around 3 million metric tons of bio-fuel per year. Today EU countries are the
pioneers in utilizing bio-fuel. It should be mentioned that all fossil fuel sold in France contains
between 2 to 5 percent bio-fuel.
For the last 30 years, Brazil has been pursuing the production of ethanol from sugar cane
resulting in an estimated saving of US $50 billion on oil imports as well as reducing
55 This subsection is based on material from: “Bio Fuel & Bangladesh”, Ahmed, N, Probe News Magazine, 2008 and Energy & Power magazine, 2008.
6/5/2012 80 Gustavson Associates
environmental pollution. In Brazil, sugar cane production is feasible because of favorable
climate and large land area. In the USA the main source of bio-fuel is corn which is blended
with gasoline in many states. Europe utilizes mainly rapeseed mustard biofuel feedstock.
Large scale bio-fuel investment is occurring in Australia, Brazil, India, Malaysia, and the USA.
Malaysia opened its first biodiesel plant in December 2007, with a capacity of 100,000 tonnes
per year.56 By law all Brazilian petrol must be at least 25 percent ethanol. In Brazil, it was
declared that by 2007, the majority of cars available must be able to run on 100 percent ethanol.
India is also giving proper attention to bio-fuel. One Indian Company in a joint venture with an
international partner has installed a plant with a production capacity of 100,000-120,000
MT/year of bio-fuel.
Bio-fuel use is not new in Bangladesh. In the early 20th century, bio-fuel was used for lighting
lamps or lanterns.
In an agriculturally based country like Bangladesh, bio-fuel can be a better alternative because a
30 percent blend of bio-fuel can be used along with our diesel or petrol. This can also be an
excellent fuel to kindle lamps in rural Bangladesh.
Bio-fuel in Bangladesh can be a cost effective nontraditional approach. Attractive incentives
should be offered to farmers who grow Jamal gota and Verenda and to the entrepreneurs
investing in establishing processing units for refining crude bio-fuels into fuel grade bio-fuel.
Barren lands in the hilly areas and fallow lands in the remote parts of the country may be used
for bio-fuel projects.
For effective cultivation, around 2,500 plants can be planted in one hectare of land. The average
yield of seeds per hectare per year is about 6 M tons. The cost for planting per hectare is
estimated to be around Tk 50,000. It is quite possible to get a yield of more than 2,000 liters of
oil from 1 acre of land planted with these types of trees.
56 http://en.wikipedia.org/wiki/Palm_oil#Biodiesel

6/5/2012 81 Gustavson Associates
Jamal gota or Verenda must be harvested, dried, and then crushed to produce oil. The oil can be
used directly in any existing, unmodified simple diesel engine or processed through a process of
refining or esterfication to produce bio-fuel that can be used in diesel run vehicles. Thus, in
Bangladesh, significant quantities of bio-fuel could be produced to decrease the import of
petroleum oil.
In Bangladesh, a non-edible source of bio-fuel (e.g. Jamal gota and Verenda) should be
encouraged for large scale production. Large unused or degraded land areas in Rajshahi, Sylhet,
Chitagong Hill Tracts, the Island in the South Bengal, and the Char areas of different rivers may
be suitable for cultivating Jamal gota and Verenda.
4.7.6.3 Hydro-electricity
There is one hydro-electric power plant in Bangladesh, the Karnaphuli hydro-electric plant, built
on the Karnaphuli River located at Kaptai. The power plant is operational and has a capacity of
230 MW. Geography and socio-economic conditions of the country may prohibit the expansion
of hydro-electricity in Bangladesh. However, the possibility of installing mini and micro level
hydroelectric power plants in the hilly areas of Bangladesh should be explored.
4.7.6.4 Solar Energy57
It is currently estimated that two billion people or roughly one third of the world’s population are
living without access to electricity. Many of these people live in countries whose governments
are unable to afford the infrastructure development costs to extend the electricity grid beyond
urban limits. In many cases, the rural population density is too low to justify economically
viable grid installation. An obstacle to the wider use of solar energy is its high cost in
comparison to other forms of power generation. It is uneconomic to extend electricity grids to
remote areas. In remote areas, it is difficult to transport fossil fuels. This makes renewable
57 This subsection is based on material at “Solar Energy: New Option” Ahmed, N: Probe News Magazine, 2006; and:”Solar Energy for the Buildings”, Ahmed, N, Probe News Magazine, 2008.

6/5/2012 82 Gustavson Associates
sources like solar energy more attractive and cost competitive. Solar home systems are
environmentally clean, user friendly, cost competitive, and reliable.
For these small remote populations, rural electrification can provide the cost effective means of
providing electricity for basic needs. In such situations, electrification utilizing solar energy, the
most important renewable form of energy, plays a very significant role.
In the past, there was not much use of solar energy for rural electrification. The related
technologies often seemed unreliable, too costly, or incapable of providing enough power. Over
the past few decades, renewable energy technology, particularly Photo Voltaic (PV) technology,
has steadily improved and is now an acceptable energy source for remote power needs around
the world.
Governments are politically, socially, and economically committed to the balanced development
of their countries. A way to achieve this objective is by raising the standard of living in rural
areas. Electrification with PV has been viewed as a viable solution by governments, NGOs, aid
agencies, and other philanthropic organizations interested in raising rural living standards. PV is
a low cost alternative used for lighting, ventilation, pumping water, and television in remote and
dispersed communities.
The potential of solar energy is excellent in Bangladesh. Bangladesh is geographically located in
a favorable position (within 20o34′ to 26o38′ north latitude) for harnessing bright sunlight. The
sunlight is abundantly available for most of the year except for three months, June-August, when
it rains excessively. The amount of solar energy available is about 5 KWh/day per square meter.
That is enough to meet the demand of the country.
In 1997, Grameen Shakti and BRAC started the Solar Home System (SHS) using a credit
incentive. The Rural Electrification Board (REB), a government agency, is also engaged in the
commercialization of solar power electrification in domestic, commercial, and irrigation uses in
rural areas. IDCOL, a government-owned entity, has disseminated some SHS through its partner
NGOs. As a result of high costs of production, it has a long way to go before becoming

6/5/2012 83 Gustavson Associates
commercially competitive. In remote areas of Bangladesh solar is gradually becoming popular
and the government has undertaken a lot of schemes to subsidize on it. Presently there are about
one million solar panels installed throughout the country. The government has planned to setup
solar panels with a capacity of 5-10 MW.
The increased industrialization and urbanization of recent years has dramatically affected the
number of urban buildings being built. The additional buildings have had major effects on
energy consumption. The number of urban dwellers rose from 600 million in 1950 to 2.5 billion
in 2010. It is predicted that by the mid 21st century, more than half of the world’s population
will be living in cities. It is widely accepted that urbanization leads to a very high increase in
energy use. A recent analysis shows that a 1 percent increase in the per capita GNP leads to an
similar (1.03 percent) increase in energy consumption. A 1 percent increase of the urban
population increases energy consumption by 2.2 percent.
A home solar panel is a reliable source of alternative power that could supply part or all of home
electricity needs. Solar panels produce clean energy and provide residences with a modern or
high technology touch.
In Dhaka, the large scale use of solar panels on the roof tops should be considered to assist in
resolving the power shortage issue.
The government of Bangladesh plans to substitute 5% of overall energy usage with solar energy
by 2015 and 10% of overall energy usage by 2020.
4.7.6.5 Wind Energy58
Bangladesh is exploring the potential of wind power. In the coastal area of Bangladesh,
windmills with a capacity of 2 MW are in operation. Bangladesh has had to wait for a
breakthrough in wind power technology to be competitive against other conventional
commercial energy sources. A pilot project to install windmills along the seashore with a
58 This subsection is based on “Energy Scenario of Bangladesh” HCU, 2011
6/5/2012 84 Gustavson Associates
capacity of 20 MW has been planned by the government. Based on the results of the pilot
project, another 200 MW of power could be harnessed from wind power.
4.7.7 Nuclear Energy59
As of 2005, there were 443 licensed nuclear power reactors in the world, of which, 441 are
currently operating in 31 countries. Together they produce about 17 percent of the world’s
electric power.
Well-constructed nuclear plants run by enriched uranium are an advantageous source of electric
power generation. They are extremely clean but improperly functioning plants can create
potentially disastrous circumstances. The Chernobyl disaster and the recent Japanese Fukushima
power plant disaster caused by a tsunami are examples of nuclear power plant related hazards.
Bangladesh plans to establish its nuclear power plant with the assistance of international partners
with proven experience, capacity, and willingness to transfer technology and ensure proper
safety and security.
On June 24, 2007, the International Atomic Energy Agency (IAEA) gave approval for
Bangladesh and seven other countries to set up nuclear reactors for power generation. This was
good news because Bangladesh is currently exploring all possible options for resolving its power
crisis. Currently, the power sector is based primarily on natural gas; nuclear energy would
reduce future gas demand.
A plan to establish a nuclear power plant in Bangladesh has been in the works since the 1960s.
Land selection and the acquisition of 260 acres for a nuclear power plant are the only tasks that
have been realized over the last 50 years. Arrangements have been made by the Bangladesh
government with the assistance of Russia to establish a nuclear power plant with a capacity of
1,000 MW at Ruppur. In this respect, the Bangladesh government has signed a framework
59 This subsection is based on “Nuclear Power in Bangladesh”, Rahim A, Energy & Power, 2009; and “Nuclear Power Plant in Bangladesh”, Ahmed, N, Probe News Magazine, 2007

6/5/2012 85 Gustavson Associates
agreement with the Russian National Nuclear Institute. Bangladesh expects to enter the nuclear
age by establishing the nuclear power plant by 2016.
There are several challenges that Bangladesh must face involving the installation of a nuclear
power plant. The safety of the population must be ensured, a knowledgeable workforce must be
trained to administer and maintain the nuclear power plant, and general awareness of risks
associated with a nuclear power plant must be administered to the public.

6/5/2012 86 Gustavson Associates
5 IMPACT OF TARIFF REFORM
5.1 HISTORICAL GAS TARIFFS
The first Bangladesh (then East Pakistan) gas tariff was announced in July 1968 by the
government. The end user prices for gas for different categories of consumers specified in that
tariff are shown in Table 5-1. The power and fertiliser sector had the lowest gas tariff, while the
domestic and commercial sectors had the highest tariffs.
Table 5-1 Pre-Liberation Gas Tariff Category of Consumer Rupees/MCF
Power 1.20 Fertiliser 1.20 Industry 2.52
Commercial 6.00 Domestic (metered) 6.00
The tariff was the same for the power and fertiliser sectors. The price for commercial and
domestic consumers was five times higher than the power and fertilizer prices. As the first tariff
of the Bangladesh gas sector, it served as a basis for subsequent gas tariff revisions in
Bangladesh.
After the independence of Bangladesh, gas tariffs were revised with different rates for different
categories of consumers. During the 41 years from 1968 to 2009, the gas tariff was changed 25
times. The increase in price however, appears to be insignificant compared to the average
inflation rate of 5% per annum, which exposes a significant gap with the price of energy.
The tariff rates in Table 5-2 show prominent changes from pre-liberalization tariffs rates that
took place over the decades in the process of price harmonization.
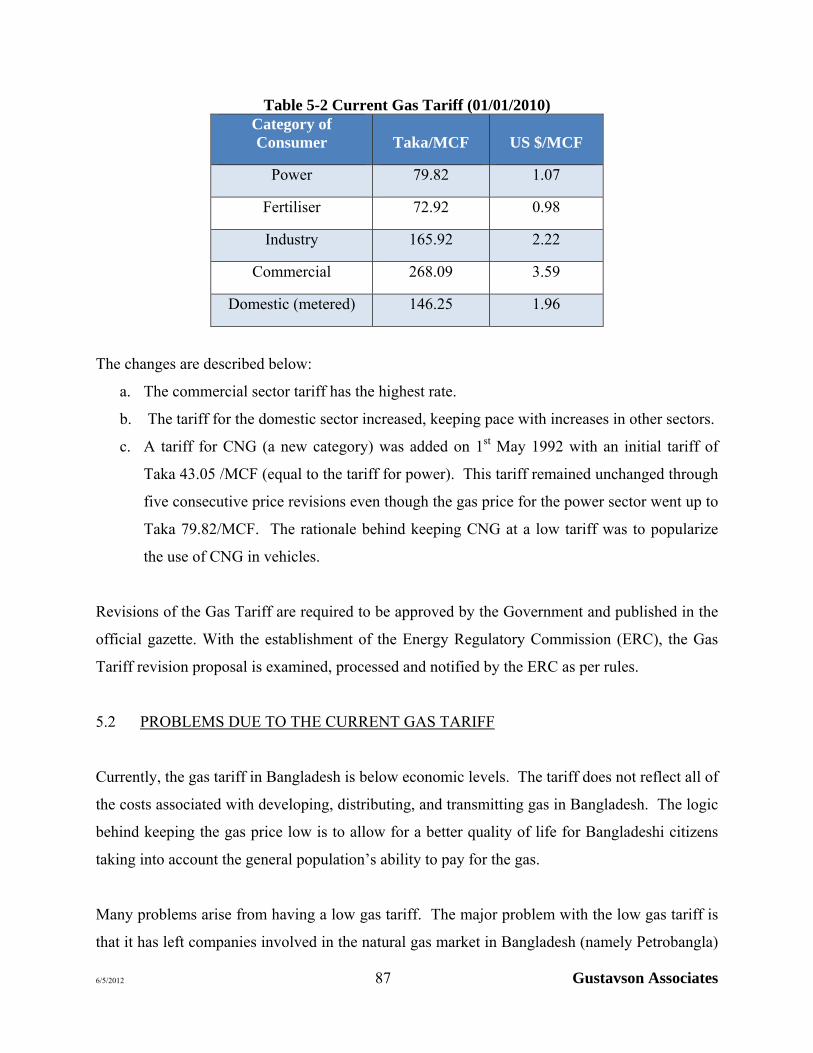
6/5/2012 87 Gustavson Associates
Table 5-2 Current Gas Tariff (01/01/2010) Category of Consumer Taka/MCF US $/MCF
Power 79.82 1.07
Fertiliser 72.92 0.98
Industry 165.92 2.22
Commercial 268.09 3.59
Domestic (metered) 146.25 1.96
The changes are described below:
a. The commercial sector tariff has the highest rate.
b. The tariff for the domestic sector increased, keeping pace with increases in other sectors.
c. A tariff for CNG (a new category) was added on 1st May 1992 with an initial tariff of
Taka 43.05 /MCF (equal to the tariff for power). This tariff remained unchanged through
five consecutive price revisions even though the gas price for the power sector went up to
Taka 79.82/MCF. The rationale behind keeping CNG at a low tariff was to popularize
the use of CNG in vehicles.
Revisions of the Gas Tariff are required to be approved by the Government and published in the
official gazette. With the establishment of the Energy Regulatory Commission (ERC), the Gas
Tariff revision proposal is examined, processed and notified by the ERC as per rules.
5.2 PROBLEMS DUE TO THE CURRENT GAS TARIFF
Currently, the gas tariff in Bangladesh is below economic levels. The tariff does not reflect all of
the costs associated with developing, distributing, and transmitting gas in Bangladesh. The logic
behind keeping the gas price low is to allow for a better quality of life for Bangladeshi citizens
taking into account the general population’s ability to pay for the gas.
Many problems arise from having a low gas tariff. The major problem with the low gas tariff is
that it has left companies involved in the natural gas market in Bangladesh (namely Petrobangla)

6/5/2012 88 Gustavson Associates
in an extremely poor financial state. The price that Petrobangla pays for gas purchased from
IOCs exceeds the average price paid to Petrobangla by end users. While Petrobangla is
providing the population with a low cost energy source, this approach is counterproductive and is
not in the best interest of the general population. The financial drain on Petrobangla makes it
much harder to develop any sort of reliable energy infrastructure in Bangladesh, to the detriment
of all.
Table 5-3 shows Petrobangla’s financial position between FY 1998 and FY 2008. Every year
between FY 1998 and FY 2007 Petrobangla had a large net operating loss. Also every year in
this range (excluding FY 2006) Petrobangla was forced to pay interest because they could not
make timely payments for their gas.
Table 5-3 Petrobangla Deficits, Interest and IOC Income Tax Payments60 Fiscal Year
Operating Loss/(Profit)
Interest Expense
Income Tax
Previous Years
Adjustment
Price Deficit Fund
Net Deficit
1998 -372.1 -4.9 0 832.2 455.2
1999 -2672.2 -37.6 0 1420.7 -1289.1
2000 -3901.5 -98.6 0 2694.4 -1305.7
2001 -5340.8 -104.2 0 3259.1 -2185.9
2002 -4113.4 -123.9 0 3707.6 -529.7
2003 -230.5 -71 -145.9 3854.6 3407.2
2004 -1750.8 -59.4 -1026.1 -707.9 4148.3 604.1
2005 -3817.9 -145.8 -584.9 4333.5 -215.1
2006 -2225.4 0 -1484.7 5316 1605.9
2007 -8150.4 -12.5 -1551.3 7113.4 -2600.8
2008 4323.18 -47.6 -3081.9 9542.2 10735.88
Total -28251.82 -705.5 -7874.8 -707.9 46222 8681.98
*Tk. Million
The gas tariff situation is also causing other problems in the economy. Due to the low gas price
and the Model PSC 2008 requirement that all natural gas must be offered to Petrobangla, IOCs
have limited incentive to explore for and produce natural gas in Bangladesh. The low gas tariff
to end users is also causing the inefficient use of the resource in Bangladesh. This is especially
true in the residential sector. Residential customers are charged a low fixed monthly price for
60 Petrobangla Annual Report, 2009

6/5/2012 89 Gustavson Associates
gas regardless of the actual amount of gas consumed, so there is no incentive to use gas in an
efficient manner.
5.3 GOALS FOR A REVISED GAS TARIFF
The Government considers the tariff as a tool for resource allocation, not a tool for revenue
generation. While the current tariff is providing consumers with cheap gas in the short run, it is
not allowing the energy sector to develop in Bangladesh. The main goals of revising the gas
tariff will be to strengthen the financial position of Petrobangla, induce firms to explore and
develop natural gas in Bangladesh, and prevent the wasteful use of the resource.
Raising the gas tariff would allow Petrobangla to cover its costs, allowing them to operate with a
net profit, eliminating the price deficit fund and interest payments made to IOCs. The money
saved from eliminating the deficit fund and interest payments could be used to fund projects to
develop a reliable energy infrastructure in the country. With Petrobangla in a strong financial
position, they will be able to induce IOCs to explore for and develop natural gas in Bangladesh.
Through an optimal pricing strategy the gas tariff will be able to achieve other institutional and
financial goals. A revised tariff will strengthen the mutual cooperation and assistance amongst
various energy providers allowing for balanced growth and maintaining a reliable supply of gas.
The revised tariff will also help in reducing misuse/waste of the resource. Natural gas, being a
non-renewable energy source is a scarce and costly resource. Misuse, waste, and unaccounted
pilferage are rampant in Bangladesh. This requires adjustments to the pricing policy to prevent
the inefficient use of the resource. Augmenting the gas tariff could assist in building a fund to
pay for the import of LNG.
It is natural for consumers to resist price increases that are perceived as an arbitrary imposition of
a burden. This resistance overlooks the underlying rationale with which political ramifications
are usually involved. Public awareness about the overall energy situation will be necessary in the
process of making any gas tariff increases.

6/5/2012 90 Gustavson Associates
5.4 GAS PRICING METHODOLOGY
Up to the 1980’s revisions of the gas tariff took place on the principles of recovery of full cost
plus margin for production, transmission, and distribution companies. In the 1990’s the
exploration margin was introduced to cover past and current exploration cost, both successful
and unsuccessful. Since the start of production from IOCs’ fields, the base of full cost has been
expanded to include cost of gas purchases at the rate of 75% - 93% of the international market
price of HSFO (capped by a ceiling that is currently binding) in addition to transmission and
distribution cost.
The average gas tariff is estimated to cover the full cost, exploration margin, desired ROR on net
fixed assets of production, transmission and distribution companies and government taxes.
Thereafter, price harmonization is made for fixing different tariffs for different categories of
consumers which all together will be equivalent to the required average gas tariff.
The prevailing gas tariff, though revised a number of times on an ad-hoc basis, is still
substantially lower than IOC gas price, let alone the price for LNG. The ongoing and escalating
gap between supply and demand may be moderated by revising gas tariffs at semi-annual
intervals. This would allow gas consumers to adapt to the new gas tariffs gradually.
Traditionally, the gas tariff encompasses different end user prices for different categories of
consumers. In fixing such tariffs these steps must be taken:
The gas pricing methodology of the new proposed tariff will gradually address issues emerging
from the growing complexities of transforming from the simple concept of ‘cost plus recovery’
to indexing with international fuel prices. The index to HSFO Singapore would tend to keep gas
prices in line with other local energy prices, except that there is currently a binding price cap.
The recent decision allowing Santos to sell gas directly from Block 16 to a third party may create
issues concerning price harmonization between similar categories of consumers.
Petrobangla felt it necessary to link the gas tariff with an international market index to address
the deficit that arises from purchasing IOC gas at a higher price than the average weighted gas
6/5/2012 91 Gustavson Associates
tariff. Petrobangla intends to establish a pricing framework which will allow the gas tariff to be
revised semi-annually based on the following criteria:
The end user price of natural gas will be market based related to indexing with
HSFO-FOB Singapore. Such a price for gas will be achieved gradually as a sudden
increase would be disruptive.
An automatic adjustment of prices as applicable to different categories of consumers
will take place on a six month interval, linked to the market price of HSFO- FOB
Singapore.
Restructuring of current gas prices will be made for setting an economic price for
each category of consumers.
Government taxes on each unit of gas sold will be of a fixed amount to be
determined, allowing Petrobangla to build a significant fund for its own investment.
5.5 SUMMARY
The current gas tariff in Bangladesh is too low and must be revised in order to develop the
natural gas sector in Bangladesh. The gas tariff is causing significant problems in the country,
most notably causing Petrobangla to operate at a significant deficit. Petrobangla has posted an
operating loss in every year of the last decade except for 2008. Petrobangla’s weak financial
position (as depicted in Table 5-3) is significantly hampering its ability to develop a reliable
energy infrastructure in Bangladesh. The low gas tariff is also hindering investment by IOCs in
exploration and development activities, as well as promoting the misuse and waste of natural gas.
The ultimate goal of the government for revising the gas tariff will be for efficient resource
allocation, rather than revenue generation. A higher tariff will strengthen Petrobangla’s financial
position allowing for investment in energy infrastructure, provide incentive for IOCs to explore
for natural gas in the country, and raise consciousness about energy efficiency and misuse. The
proposed tariff will be market related, indexed to HSFO-FOB Singapore. This tariff will keep
gas prices in line with other local energy prices.

6/5/2012 92 Gustavson Associates
Increases in the gas tariff should occur in phased manner, as it would be disruptive to raise the
tariff all at once. Tariff reform is of high importance for Bangladesh’s energy sector and will
benefit the general population in the long run by increasing the supply of natural gas.
6/5/2012 93 Gustavson Associates
6 PRIVATE SECTOR INVOLVEMENT AND PRIVATIZATION OF GAS BUSINESS
6.1 OVERVIEW OF THE PRIVATIZATION HISTORY IN BANGLADESH
Bangladesh faces a number of challenges in realizing its vision for the future development of the
gas sector. The national companies that explore and develop natural gas in Bangladesh are
totally owned by the government. These companies receive assistance from the Government
through a price deficit fund. The price deficit fund is designed to offset the losses incurred when
Petrobangla sells natural gas to end users at a lower price than it pays for the gas. Between the
years 1998 and 2008 Petrobangla has received 46.2 billion Taka from the Government.61 Every
year during this date range (excluding 2008), Petrobangla has operated with a significant
financial loss. One of the principal reasons for privatizing public enterprises in Bangladesh is to
reduce the fiscal burden that their losses and their subsidization impose on the state.
“The privatization process in Bangladesh evolved gradually before taking concrete shape in
1993. The most significant move in the privatization process occurred in 1982 with the
announcement of the New Industrial Policy. The Government introduced fundamental changes in
the industrial policy environment and the adoption of various promotional measures designed to
accelerate the pace of private sector-led industrial growth.”62 “In 1989, The Board of Investment
was created, and serves to promote and facilitate investment in the private sector in
Bangladesh.”63
Along with production sharing contracts for oil and gas exploration both onshore and offshore in
Bangladesh, the government may in the future allow open concession bidding for the
construction and operation of new gas transmission and distribution pipelines. The new bidding
system is to be regulated by an independent regulatory agency. This will facilitate increased
efficiency in the gas sector.
61 Gustavson Associates, Monitoring and Supervision Procedures for Exploration and Development Activities. 62 Momen, M. N. Implementation of Privatization Policy: Lessons From Bangladesh (2007) Pg. 4. 63 Momen, M. N. Implementation of Privatization Policy: Lessons From Bangladesh (2007) Pg. 4.
6/5/2012 94 Gustavson Associates
6.2 PETROBANGLA’S CURRENT ROLE IN THE GAS SECTOR
Petrobangla can be thought of as a gas merchant, as they are the primary buyer of natural gas in
Bangladesh, buying directly from the IOCs and directly transmitting and selling the gas to end
users. Under the current PSC (Model PSC 2008), Petrobangla has the right of first refusal which
requires the contractor to first offer its gas to Petrobangla. If Petrobangla refuses to buy the gas
from the IOCs, they must make alternative arrangements for sale in the domestic market. The
IOCs are required to sell the gas in the domestic market due to severe restrictions in the PSC that
do not allow piped gas to leave the country. Only gas which is converted to LNG is allowed to
be exported. This option however is not economically viable to IOCs operating in Bangladesh,
due to the large capital investment involved in building LNG plants and the requirements of
large reserve commitments.
This arrangement is causing significant difficulties for Petrobangla and IOCs alike. Petrobangla
is buying gas produced by IOCs at a higher price than they are selling to end users. This is
causing Petrobangla to operate at a significant financial loss, some of which is offset by the
government contributing to a price deficit fund.
IOCs may be hesitant to explore for and develop natural gas in Bangladesh because of the harsh
terms, particularly the low pricing, defined in the PSC. The natural gas infrastructure in
Bangladesh is very weak, and the market is not well established. Also, the transmission system
is wholly owned by Petrobangla and its subsidiaries. If IOCs are not confident that they will be
able to find a reliable buyer for their gas as well as receive an adequate price, they may take their
investments elsewhere.
6.3 ALTERNATIVE ROLES FOR PETROBANGLA
Petrobangla has options that could alleviate some of the problems in the gas sector. Instead of
acting as a gas merchant, Petrobangla could assume the role of a gas transporter. As a gas
transporter, Petrobangla would be responsible for maintaining the gas supply network,
transporting gas through their pipelines to end users for an agreed upon tariff.

6/5/2012 95 Gustavson Associates
This arrangement could be mutually beneficial for Petrobangla and the IOCs. As a gas
transporter, Petrobangla would be able to eliminate large payments to the IOCs for the purchase
of gas. Petrobangla has been plagued in the last 20 years by not being able to make timely
payments for IOC gas, which has resulted in hefty interest payments. By eliminating the need
for gas payments to the IOCs, Petrobangla will have a much better financial position and also
eliminate its interest payments. The increased revenue created by this arrangement could be
used to develop the gas infrastructure which is in its infancy in Bangladesh, as well as induce
new firms to explore and develop natural gas in Bangladesh.
Santos Bangladesh (one of the principal IOCs currently operating in Bangladesh), has suggested
that Santos be allowed to sell gas directly to a third party, paying a tariff to Petrobangla for using
their transportation network. This concept would allow free competition between buyers and
sellers that would lead to the efficient market price for natural gas. This would benefit the IOCs
with a higher sales price than they would get under the current arrangement, as well as entice
further investment by IOCs in Bangladesh’s gas sector.
Petrobangla’s transmission and distribution companies may find it beneficial to allow their
pipelines to become common carriers. Currently the transmission and distribution network in
Bangladesh is wholly owned and operated for exclusive use by Petrobangla. A common carrier
system would modify Petrobangla’s role as a gas merchant, into a natural gas carrier. Through
this system Petrobangla would own and operate the entire pipeline network; however they would
be required to offer transport services to any natural gas shippers at a fixed rate.
The transition to a common carrier system could allow the market to adequately distribute the
supply of natural gas in Bangladesh. Currently Petrobangla owns all the production,
transmission, and distribution rights in Bangladesh. Petrobangla monopolizes this industry in
Bangladesh, as potential entrants into the market are hindered by the inability to access the
distribution network. Separating the gas production, transmission, and distribution business to
new entrants through a common carrier system would improve economic efficiency through
increased competition and lower costs.

6/5/2012 96 Gustavson Associates
6.4 SUMMARY
Bangladesh is on its way to enhancing efficiency in the gas sector through privatization.64
Privatization is being pursued because Petrobangla, a State Owned Enterprise (SOE) has become
a burden on the state from operating at a significant financial loss. Due to the fact that
Petrobangla sells gas at a cheaper price than they buy it for, the government must contribute to a
price deficit fund to keep Petrobangla afloat. This price deficit fund could be used to make
enhancements in the country’s energy infrastructure. Privatization of the gas sector may also
enhance economic growth and employment in Bangladesh.
Petrobangla currently operates as a gas merchant, buying gas from IOCs and selling it directly to
end users. Gas tariffs in Bangladesh are far below international energy prices, a policy the
government has enacted to provide affordable energy to the general public. This policy however
has put Petrobangla in an extremely poor financial state, as they buy gas for more than they sell
it to end users. Petrobangla’s poor financial situation has made timely payments for natural gas
impossible, resulting in large interest payments.
Petrobangla should consider an alternative role as a gas transporter. As a gas transporter
Petrobangla would transport a third party’s gas across its distribution network for an agreed upon
fixed price. In this way Petrobangla could stabilize its financial position by eliminating the need
to buy gas from IOCs, thereby also eliminating its interest payments. Santos Bangladesh
supports this idea; they want the flexibility to sell gas directly to a 3rd party. Introducing
Petrobangla as a gas transporter through a proposed common carrier system will promote free
competition between buyers and sellers and allow the market to efficiently allocate the supply of
natural gas in Bangladesh.
64 http://boi.gov.bd/about-bangladesh/privatization

6/5/2012 97 Gustavson Associates
7 GAS SUPPLY SCENARIOS IN BANGLADESH
7.1 OVERVIEW
Gustavson Associates has prepared a computer model for forecasting future gas demand and
supply for the country of Bangladesh. The model includes forecasts for various categories of
reserves and resources, as follows:
Existing fields
Mapped prospects
Mapped leads
Unmapped resources
CBM
Shale gas
The volumes of reserves and resources have been estimated previously by Gustavson. The
forecasts are probabilistic, considering uncertainty about reserves, production rates, decline rates,
rates of exploration drilling, and probabilities of success for all of the resource categories. Six
scenarios have been modeled: two exploration timing assumptions for each of three demand
scenarios. The three demand scenarios are a base case as well as high and low growth demand
cases. The two exploration scenarios are a base case and an accelerated case in which
exploration activity for prospects and leads is assumed to occur earlier in time. Table 7-1 and
Table 7-2 summarize the findings of the six different scenarios.
Table 7-1 Summary of the supply scenarios with the realistic exploration timeline
Normal Exploration Timeline Demand Growth
Scenario Early Years (2011-2015) Intermed. Years (2016-2023) Late Years (2024-2030)
High shortage of about 0.3 BCFD is
likely almost no chance of sufficient domestic gas to meet demand
almost no chance of sufficient domestic gas to meet demand
Base Case small shortages (~ 0.2 BCFD)
likely shortages of 1.5 BCFD to 3
BCFD almost certain
>10% chance of sufficient domestic gas supply. 50%
chance there will be a shortage of 4 BCFD or more
Low sporadic small shortages are
likely shortage is almost guaranteed
>10% chance of sufficient domestic gas supply

6/5/2012 98 Gustavson Associates
Table 7-2 Summary of the supply scenarios with the accelerated exploration timeline
Accelerated Exploration Timeline
Demand Growth Scenario Early Years (2011-2015) Intermed. Years (2016-2023) Late Years (2024-2030)
High small shortage of about 0.1
BCFD is likely >10% chance of sufficient
domestic gas to meet demand >10% chance of sufficient
domestic gas to meet demand
Base Case small shortage of about 0.1
BCFD is likely 50% chance of sufficient
domestic gas to meet demand
>10% chance of sufficient domestic gas supply.
50% chance there will be a shortage of 2 BCFD or more
Low sporadic small shortages are
likely >50% chance of sufficient
domestic gas to meet demand >50% chance of sufficient
domestic gas to meet demand
In each of the scenarios, it is highly unlikely there will be an sufficient domestic supply of gas
throughout the next twenty years. It is very possible there will be small shortages through 2015
and almost certain there will be large supply shortages in the intermediate years of 2016 through
2023. In most of the scenarios, there is a low probability of sufficient gas supply in the late
years. Details of the model and scenarios are discussed below.
7.2 ASSUMPTIONS
The following assumptions were made in preparing the supply forecasts:
1. The initial rate for the existing fields was based on an average of recent production rates.
2. For each field, a random variable was set up for the percentage of reserves produced at which
production decline will begin. Prior to that percentage, production per well was assumed to
remain flat. The distribution for the random variable was set to a uniform distribution
between 35% and 73%. The 35% figure was based on judgment, while the 73% represents
the highest percentage recovery from producing fields where decline has not yet begun.
3. The decline, when it begins, was assumed to be exponential with a decline rate based on the
production in the last plateau year as a percentage of the reserves in that year.
4. There are some scenarios in which exploration success leads to excess gas availability. In the
event that the forecast demand is lower than the total forecast deliverability of supply, the

6/5/2012 99 Gustavson Associates
production from each type of source is uniformly scaled back by a factor equal to the demand
divided by the deliverability.
5. The decline is applied as a fraction of reserves in order to account for reduced decline if
production is scaled back due to limited demand.
6. The reserves uncertainty for each field is represented by a log normal distribution with P90
(low), P50 (mid), and P10 (high) as estimated in Gustavson’s prior reserve estimation. It may
be necessary to install additional compression at the fields in order to achieve the high
values. Due to the high cost of compression, there is uncertainty about whether it will be
installed.
7. Additional drilling in existing fields as projected by Petrobangla65 is accounted for in the
forecasts (see Table 7-3).
8. New wells are assumed to come online at the current average rate of other wells producing in
each field.
Table 7-3 Schedule of New Wells for Producing Fields
Field Fiscal Year
Total 2011 2012 2013 2014 2015 Bakhrabad 0 0 1 0 0 1 Bibiyana 0 4 0 2 1 7
Fenchuganj 1 0 0 0 0 0 Jalalabad 0 0 0 1 0 1
Kailash Tila 0 0 0 3 1 4 Moulavi Bazar 0 1 0 1 0 2
Rashidpur 0 2 0 3 2 7 Salda Nadi 1 1 1 0 0 2
Shahbazpur 0 2 0 0 0 2 Sylhet 0 0 2 0 1 3 Titas 0 2 0 3 2 7 Total 2 12 4 13 7 36
9. For the six discovered fields not currently producing (Chhatak, Feni, Kamta, Begumganj,
Kutubdia, and Semutang), all except Semutang were assumed to begin producing in July
2016. Semutang was assumed to begin producing in July 2011 per Petrobangla plans.66
65 From “Energy Division LCG meeting 110411.ppt” 66 From “Energy Division LCG meeting 110411.ppt” page 11.
6/5/2012 100 Gustavson Associates
10. The currently non-producing fields were assumed to require a certain amount of time to
complete development and achieve their peak rate. A random variable was used to estimate
the fraction of reserves produced at the time peak rate will be achieved, based on analysis of
the distribution of recovery at peak rate for the currently producing fields.
11. The peak rate for each currently non-producing field was assumed to be equal to the ratio of
that field’s reserves to the original reserves of Bibiyana Field, multiplied by the peak rate at
Bibiyana.
12. Total well count by year for the currently non-producing fields was based on the average
well count per MMCF of annual production for the producing fields multiplied by the annual
production for that year, rounded up to the next whole number.
13. The category of Awarded Blocks, for the purposes of this report, consists of blocks 8 and 11
held by Bapex and block 7 held by Chevron.
14. The category of Unawarded Blocks, for the purposes of this report, consists of all other
blocks not held by production.
15. Exploration drilling of the mapped prospects was assumed to begin in August 2013.
16. The amount of time between exploration wells was assumed to be a random variable with an
exponential distribution and a mean of one year.
17. Each mapped prospect was modeled with the mean and standard deviation equal to that of all
the mapped prospects in the appropriate area (whether in the eastern foldbelt or outside the
eastern foldbelt and on awarded or unawarded blocks). These values were derived from
Gustavson’s resource report.
18. The probability of success of the mapped prospects as discussed in Gustavson’s resource
report was applied to each prospect.
19. For mapped prospects, the ramp up, peak rate, decline, and well count for the successful
mapped prospects were modeled in the same manner as the not currently producing fields as
described above.
20. Exploration drilling of mapped leads was assumed to begin in August 2015.
21. For mapped leads, the time between exploration wells, probability of success, ramp up, peak
rate, decline, and well count for the successful mapped leads were modeled in the same
manner as the mapped prospects as described above.

6/5/2012 101 Gustavson Associates
22. The start of exploration drilling for unmapped conventional resources was assumed to
delayed until August 2025, since other better defined prospects would be explored first.
23. For unmapped conventional resources, the time between exploration wells, probability of
success, ramp up, peak rate, decline, and well count for the successful unmapped targets were
modeled in the same manner as the mapped prospects as described above. The resource sizes
were based on the probability approach used in the USGS report, which identified six
assessment units. The present model uses the USGS probability distribution for each
assessment unit, and the mean number of targets within each to estimate the relative
frequency of target exploration.
24. Exploration drilling for coal bed methane (CBM) resources was also assumed to begin in
August 2013.
25. For CBM resources, the time between exploration wells, probability of success, ramp up,
peak rate, decline, and well count for the successful CBM targets were modeled in the same
manner as the mapped prospects as described above, with the exception that the peak rate per
well for calculation of well count was assumed to be 500 MCF per day. Five CBM targets
were modeled with a probability of success of 41% for each target.
26. Exploration drilling for shale gas resources was assumed to begin in August 2016.
27. For shale gas resources, the time between exploration wells, probability of success, ramp up,
peak rate, decline, and well count for the successful shale gas targets were modeled in the
same manner as the mapped prospects as described above, with the exception that the peak
rate per well for calculation of well count was assumed to be 4 MMCF per day. Four shale
gas targets were modeled with each having a probability of success of 4%.
7.3 BASE CASE
The supply model is a Monte Carlo model that incorporates uncertainty about all supply sources. There is some uncertainty about supply from existing fields, but more uncertainty about the supply from other sources such as leads and prospects. A base case model was run with a realistic timeline for exploration of the various resource categories. It was assumed that exploration wells for prospects and leads would be drilled in blocks that have been awarded first, then blocks in the eastern foldbelt, followed by the remaining blocks.

6/5/2012 102 Gustavson Associates
Table 7-4 lists the assumptions for the date to drill the first exploration well in each of the
resource categories.
Table 7-4 Timeline of first exploration wells for base case
Date of First Exploration Well Prospect Lead Awarded Blocks 8/1/2013 8/1/2015 Eastern foldbelt, unawarded 8/1/2017 8/1/2020 Other, unawarded 8/1/2019 8/1/2025 Target CBM 8/1/2013 Shale Gas 8/1/2016 Unmapped 8/1/2025
Figure 7-1 shows the results of the Monte Carlo model for the base case (intermediate) demand
forecast. There is a 10% chance that production will exceed the P10 curve, and a 10% chance
that it will be below the P90 curve. The production is equally likely to be above or below the
P50 curve. The figure illustrates the high likelihood of domestic gas shortages in the future,
given the assumptions about the timing of future exploration. The figure shows annual averages,
and does not consider short term or seasonal fluctuations in supply and demand. Such short term
or seasonal fluctuations may lead to temporary shortages, which are not modeled. The figure
shows the demand curve as well as possible twenty year production profiles.
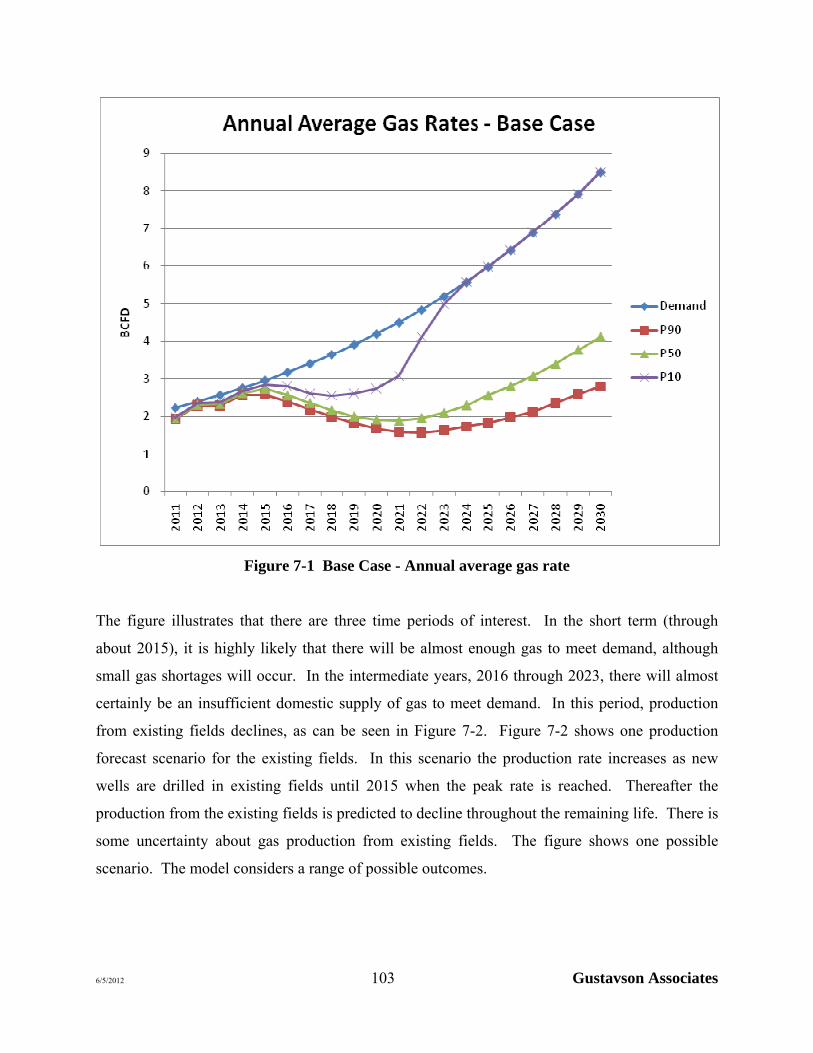
6/5/2012 103 Gustavson Associates
Figure 7-1 Base Case - Annual average gas rate
The figure illustrates that there are three time periods of interest. In the short term (through
about 2015), it is highly likely that there will be almost enough gas to meet demand, although
small gas shortages will occur. In the intermediate years, 2016 through 2023, there will almost
certainly be an insufficient domestic supply of gas to meet demand. In this period, production
from existing fields declines, as can be seen in Figure 7-2. Figure 7-2 shows one production
forecast scenario for the existing fields. In this scenario the production rate increases as new
wells are drilled in existing fields until 2015 when the peak rate is reached. Thereafter the
production from the existing fields is predicted to decline throughout the remaining life. There is
some uncertainty about gas production from existing fields. The figure shows one possible
scenario. The model considers a range of possible outcomes.

6/5/2012 104 Gustavson Associates
Figure 7-1 shows that in the late years (after 2023) there is at least a 10% chance that enough gas
will be produced to meet demand. However there is a 50% chance that domestic supplies will
fall short of demand by about 3 BCFD or more. The gas supply may increase in the long term
as new fields begin to come online, but there is a low probability that these new fields will
provide enough gas to meet the domestic gas demand in the later years. Alternative sources of
energy, such as LNG and coal, should be considered to alleviate the anticipated domestic gas
supply shortages.
Figure 7-2 A Production Scenario for the Existing Fields
There are many possible future supply scenarios depending on the number and timing of gas
discoveries that are made. Figure 7-3, Figure 7-4, and Figure 7-5 illustrate three possible types
of scenario for gas supply and demand in Bangladesh predicted by the model. In all of the
scenarios, a small gas supply shortage is forecast to occur in the short term (through 2015).
Figure 7-3 shows a significant supply shortage of up to 3 BCFD or more in the intermediate
0
200
400
600
800
1,000
1,200
2011
2012
2013
2014
2015
2016
2017
2018
2019
2020
2021
2022
2023
2024
2025
2026
2027
2028
2029
2030
Annual Production, BCF
Production Forecast, Existing Bangladesh Fields
Semutang
Kutubdia
Begumganj
Titas
Sylhet
Shahbazpur
Sangu
Salda Nadi
Rashidpur
Feni
Beani Bazar
Meghna
Moulavi Bazar
Narshingdi
Bakhrabad
Fenchuganj
Kailash Tila
Jalalabad
Bangora
Habiganj
Bibiyana

6/5/2012 105 Gustavson Associates
years as very few supply sources other than the existing fields come online. Even though more
prospects and leads come online in the later years, the domestic supply of gas falls short of
demand by up to 5 BCFD or more as demand increases.
Figure 7-3 Scenario with significant domestic gas supply shortages
Figure 7-4 illustrates a scenario in which prospects and leads begin to come online earlier than in
Figure 7-3 as the results of earlier and larger discoveries. Domestic supply is still insufficient to
meet demand in the intermediate years and in the long term. But the shortage is reduced to
between 2 and 3 BCFD.
0.0
1.0
2.0
3.0
4.0
5.0
6.0
7.0
8.0
9.0
2011
2013
2015
2017
2019
2021
2023
2025
2027
2029
BCFD
Annual Average Gas Production ‐ One Trial
Shale Gas
CBM
Unmapped
Leads
Prospects
Existing
Demand
Annual Average Gas Production – One Scenario with Potentially Large Supply Shortages after
2015

6/5/2012 106 Gustavson Associates
Figure 7-4 A scenario with shortages, but growing domestic gas supplies
Figure 7-5 shows another potential base case scenario in which significant shale gas discoveries
are made. This could eliminate the gas supply shortage in the late years. In this scenario the
largest supply shortage occurs in the intermediate years and is approximately 1.5 BCFD.
Figure 7-5 A base case scenario with substantial shale gas discoveries
0.0
1.0
2.0
3.0
4.0
5.0
6.0
7.0
8.0
9.0
2011
2013
2015
2017
2019
2021
2023
2025
2027
2029
BCFD
Annual Average Gas Production ‐ One Trial
Shale Gas
CBM
Unmapped
Leads
Prospects
Existing
Demand
Annual Average Gas Production – One Scenario with Smaller Supply Shortages after 2015 if Prospects and Leads begin Production Earlier
0.0
1.0
2.0
3.0
4.0
5.0
6.0
7.0
8.0
9.0
2011
2013
2015
2017
2019
2021
2023
2025
2027
2029
BCFD
Annual Average Gas Production ‐ One Trial
Shale Gas
CBM
Unmapped
Leads
Prospects
Existing
Demand
Annual Average Gas Production – One Potential Scenario with Significant Shale Gas Discoveries
Eliminating the Shortage in Later Years
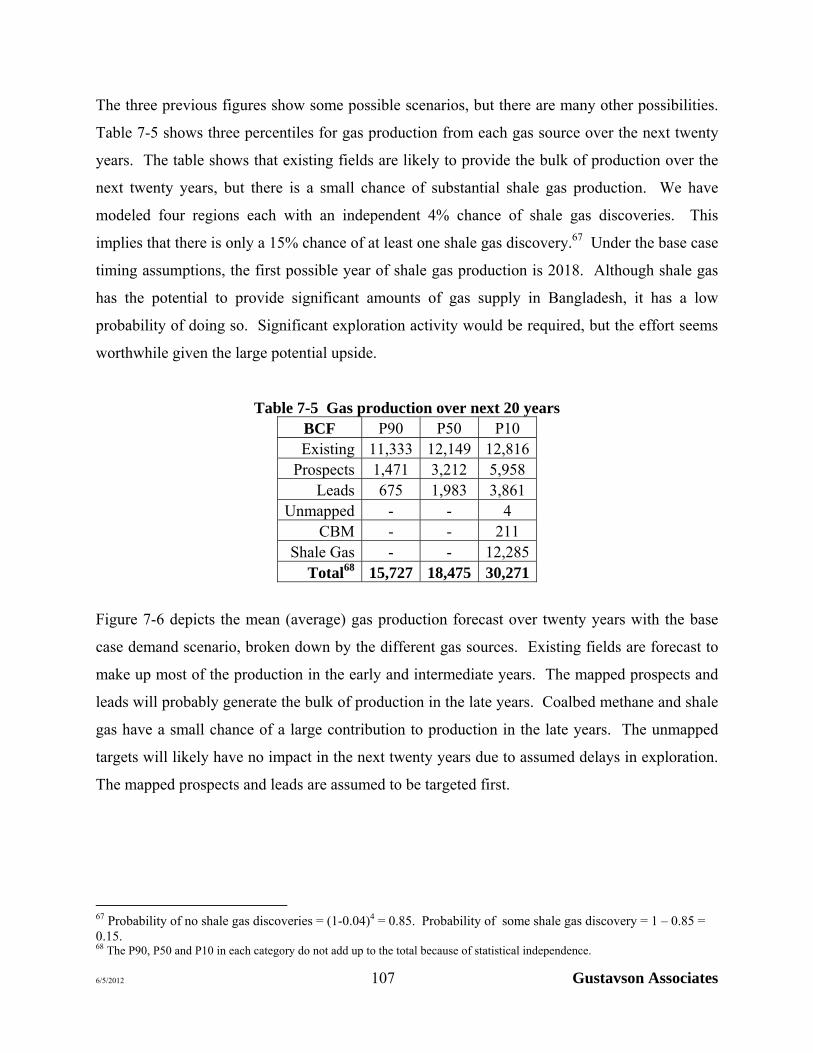
6/5/2012 107 Gustavson Associates
The three previous figures show some possible scenarios, but there are many other possibilities.
Table 7-5 shows three percentiles for gas production from each gas source over the next twenty
years. The table shows that existing fields are likely to provide the bulk of production over the
next twenty years, but there is a small chance of substantial shale gas production. We have
modeled four regions each with an independent 4% chance of shale gas discoveries. This
implies that there is only a 15% chance of at least one shale gas discovery.67 Under the base case
timing assumptions, the first possible year of shale gas production is 2018. Although shale gas
has the potential to provide significant amounts of gas supply in Bangladesh, it has a low
probability of doing so. Significant exploration activity would be required, but the effort seems
worthwhile given the large potential upside.
Table 7-5 Gas production over next 20 years BCF P90 P50 P10 Existing 11,333 12,149 12,816
Prospects 1,471 3,212 5,958 Leads 675 1,983 3,861
Unmapped - - 4 CBM - - 211
Shale Gas - - 12,285Total68 15,727 18,475 30,271
Figure 7-6 depicts the mean (average) gas production forecast over twenty years with the base
case demand scenario, broken down by the different gas sources. Existing fields are forecast to
make up most of the production in the early and intermediate years. The mapped prospects and
leads will probably generate the bulk of production in the late years. Coalbed methane and shale
gas have a small chance of a large contribution to production in the late years. The unmapped
targets will likely have no impact in the next twenty years due to assumed delays in exploration.
The mapped prospects and leads are assumed to be targeted first.
67 Probability of no shale gas discoveries = (1-0.04)4 = 0.85. Probability of some shale gas discovery = 1 – 0.85 = 0.15. 68 The P90, P50 and P10 in each category do not add up to the total because of statistical independence.

6/5/2012 108 Gustavson Associates
Figure 7-6 Base Case - Mean Gas Production
7.4 ACCELERATED BASE CASE
One possible approach for alleviation of potential gas shortages is to accelerate exploration
activity. A second base case model was run assuming an accelerated timeline for the prospects
and leads, with the first prospect and lead exploration wells being drilled in January 2012. This
is an unrealistically aggressive assumption, but it demonstrates how an accelerated exploration
schedule could alleviate gas supply concerns in Bangladesh. Table 7-6 lists the assumed
accelerated timeline for prospects and leads.

6/5/2012 109 Gustavson Associates
Table 7-6 Timeline of first exploration wells for accelerated base case
Date of First Exploration Well Prospect Lead Awarded Blocks 1/1/2012 1/1/2012 Eastern foldbelt, unawarded 1/1/2012 1/1/2012 Other, unawarded 1/1/2012 1/1/2012 Target CBM 8/1/2013 Shale Gas 8/1/2016 Unmapped 8/1/2025
Figure 7-7 shows that there is about a 50% chance that gas supply will be able to meet demand
through 2023 under this accelerated exploration schedule, although small shortages are predicted
for fiscal year 2011.
Figure 7-7 Base Case with Accelerated Exploration

6/5/2012 110 Gustavson Associates
Figure 7-8, Figure 7-9, and Figure 7-10 show three potential scenarios for the accelerated base
case model. In all of these scenarios, a small gas supply shortage is predicted to occur in the
short term (through 2015). The scenario in Figure 7-8 shows a small shortage of gas of up to 1.5
BCFD in the intermediate years. The shortage doubles in the late years to 3 BCFD as
exploration and development activity does not keep pace with gas demand.
Figure 7-8 An accelerated base case scenario with delayed shortages
Figure 7-9 depicts an accelerated base case scenario in which exploration success with prospects
and leads enables supply to meet demand in the intermediate years. A small shortage would
arise in 2024 and increase thereafter.
0.0
1.0
2.0
3.0
4.0
5.0
6.0
7.0
8.0
9.0
2011
2013
2015
2017
2019
2021
2023
2025
2027
2029
BCFD
Annual Average Gas Production ‐ One Trial
Shale Gas
CBM
Unmapped
Leads
Prospects
Existing
Demand
Annual Average Gas Production – One Accelerated Scenario where Prospects and
Leads Alleviate the Shortage
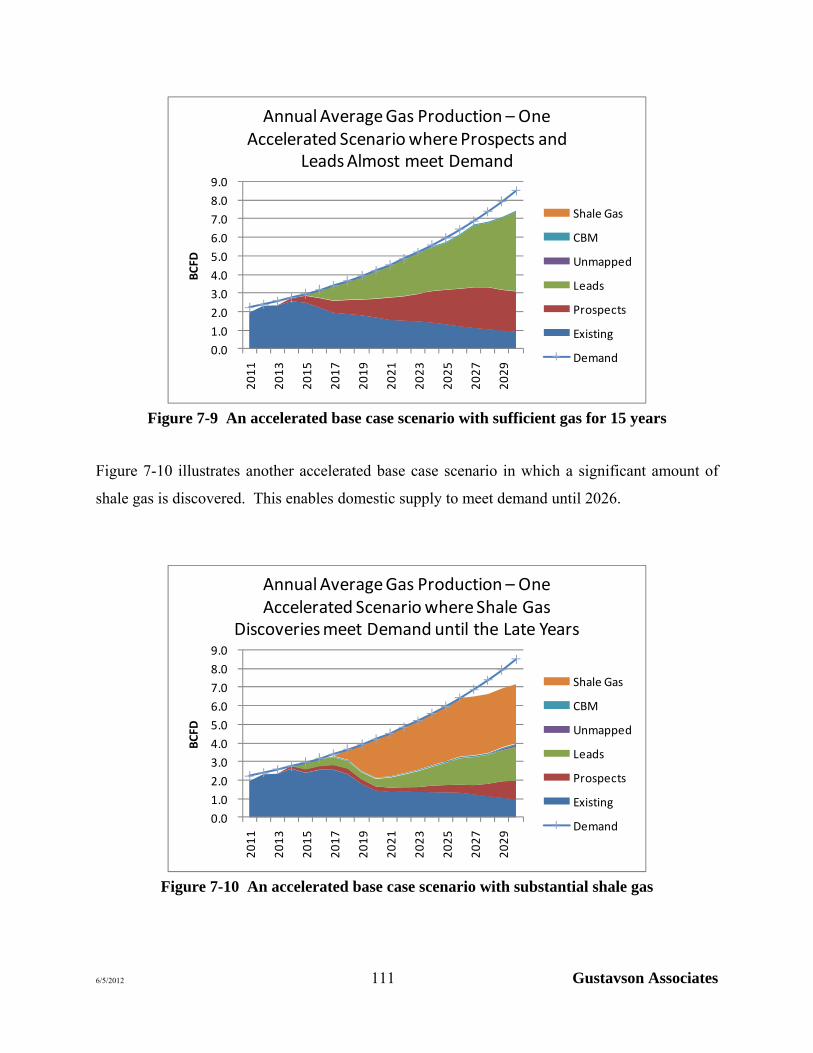
6/5/2012 111 Gustavson Associates
Figure 7-9 An accelerated base case scenario with sufficient gas for 15 years
Figure 7-10 illustrates another accelerated base case scenario in which a significant amount of
shale gas is discovered. This enables domestic supply to meet demand until 2026.
Figure 7-10 An accelerated base case scenario with substantial shale gas
0.0
1.0
2.0
3.0
4.0
5.0
6.0
7.0
8.0
9.0
2011
2013
2015
2017
2019
2021
2023
2025
2027
2029
BCFD
Annual Average Gas Production ‐ One Trial
Shale Gas
CBM
Unmapped
Leads
Prospects
Existing
Demand
Annual Average Gas Production – One Accelerated Scenario where Prospects and
Leads Almost meet Demand
0.0
1.0
2.0
3.0
4.0
5.0
6.0
7.0
8.0
9.0
2011
2013
2015
2017
2019
2021
2023
2025
2027
2029
BCFD
Annual Average Gas Production ‐ One Trial
Shale Gas
CBM
Unmapped
Leads
Prospects
Existing
Demand
Annual Average Gas Production – One Accelerated Scenario where Shale Gas
Discoveries meet Demand until the Late Years

6/5/2012 112 Gustavson Associates
Table 7-7 separates the production over the next twenty years by resource category into the P90,
P50 and P10 while Figure 7-11 illustrates the potential breakdown by resource category of the
mean production in the next twenty years with the accelerated base case. Existing fields will
likely hold the majority of production in the early years. Mapped prospects and leads will likely
contribute the most production in the intermediate and late years, with coalbed methane and
shale gas each contributing a small amount. Like the base case, the unmapped targets will likely
not contribute to production in the next twenty years.
Table 7-7 Gas production over next 20 years – Accelerated base case
BCF P90 P50 P10 Existing 10,465 11,861 12,543
Prospects 3,656 6,931 10,335Leads 4,696 9,467 14,283
Unmapped - - 4 CBM - - 202
Shale Gas - - 10,970Total69 24,745 30,854 34,126
A comparison of Table 7-5 and Table 7-7 shows that accelerated exploration of prospects and
leads could lead to a large increase in Bangladeshi gas production over the next twenty years.
The median (P50) country-wide production is predicted to increase by about 12.4 TCF from
about 18.5 TCF to about 30.9 TCF. The bulk of the increase (about 7.5 TCF) is predicted to
come from leads that are explored and developed. Prospects are predicted to add about 3.7 TCF
of gas production over the twenty year period. The median 20-year production from existing
fields is predicted to decrease slightly, as production from new fields displaces that from existing
fields.
Table 7-7 illustrates a striking benefit that arises from the multiplicity of potential gas sources in
Bangladesh. The sum of the P10 gas production values from all of the potential sources is much
larger than the P10 of the total gas production. This is not a mistake. The total gas production
will not exceed the gas demand. So the P10 for total production is bounded above by demand.
However, the 20-year production from any individual type of gas supply can be large, if the
69 The P90, P50 and P10 in each category do not add up to the total because of statistical independence.

6/5/2012 113 Gustavson Associates
supply from other sources is significantly lower than demand. In other words, there is a small
probability of large quantities of gas production from each of the potential sources, although
because of demand limitations, there will not be simultaneously large production from multiple
sources. Simply put, the presence of several potentially large sources of gas reduces the chance
of large shortages in the domestic supply of gas, if exploration activity for conventional gas
sources can be accelerated. This can also be seen in Figure 7-7, which shows that there is at least
a 10% chance of no gas shortages over the twenty year forecast period, with the accelerated
exploration timeline.
Figure 7-11 Mean gas production - Accelerated base case

6/5/2012 114 Gustavson Associates
The accelerated exploration schedule results in a mean gas production that increases steadily for
20 years. This is in contrast to the base case schedule shown in Figure 7-6 where mean
production is forecast to drop after FY 2015 as existing fields go on decline. In the accelerated
scenario new discoveries offset this decline in production from existing fields.
7.5 HIGH DEMAND GROWTH CASE
The supply model was run again with the high demand growth scenario described in Section 3.5.
Figure 7-12 shows the results of this scenario. With the high demand growth scenario, it is
highly unlikely that gas supply will meet demand at all through 2030. Significant domestic
supply shortages (between 1 to 9 BCFD) are predicted to occur starting in FY 2016. Other
sources of natural gas such as LNG or gas imports by pipeline would be necessary to support
such high growth rate in gas demand.
Figure 7-12 High Demand Growth - Annual average gas rates

6/5/2012 115 Gustavson Associates
7.6 ACCELERATED HIGH DEMAND GROWTH CASE
The high demand growth case was run a second time with the aggressive assumption of the
accelerated timeline for prospects and leads. Figure 7-13 shows that there is at least a 10%
chance that gas supply will be able to meet demand through 2030 even in the high growth case,
although small shortages are forecast to occur in 2011, 2012, and 2013.
Figure 7-13 High Demand Growth with Accelerated Exploration
7.7 LOW DEMAND GROWTH CASE
The low demand growth scenario described in Section 3.5 was also considered. Figure 7-14
shows that small shortages may occur in the short term through 2015, but it is highly likely a gas
shortage of greater than 1 BCFD will occur in the intermediate years (2016 through 2023).
There is a greater than 10% chance that there will be a sufficient supply of gas in the late years.

6/5/2012 116 Gustavson Associates
Figure 7-14 Low Demand Growth - Annual Average Gas Rates
7.8 ACCELERATED LOW DEMAND GROWTH CASE
The low demand growth scenario was also run with the accelerated timeline for prospects and
leads. With this strong assumption, there is a greater than 50% chance there will be enough gas
supplied to meet demand, except for small sporadic shortages in the early years, as illustrated in
Figure 7-15.
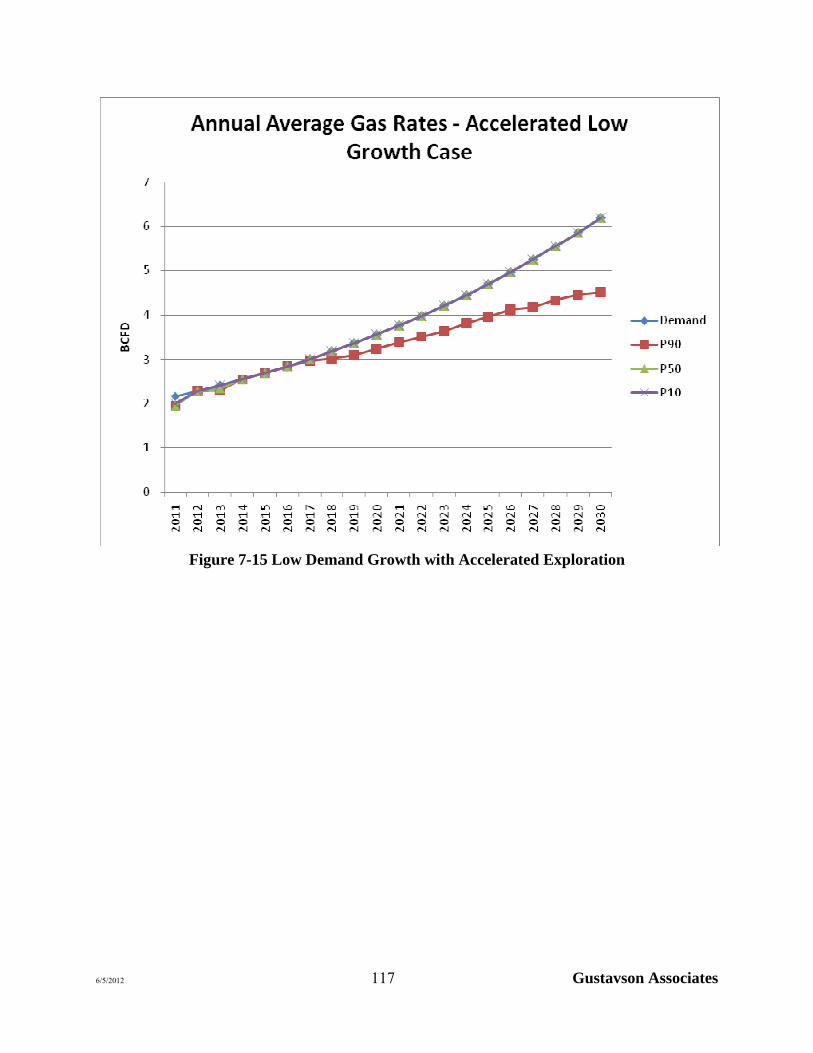
6/5/2012 117 Gustavson Associates
Figure 7-15 Low Demand Growth with Accelerated Exploration

6/5/2012 118 Gustavson Associates
8 CONCLUSIONS
Actual gas consumption in Bangladesh has grown by an average of 10.0% per year from fiscal
year (FY) 198070 to FY 2009. The annual average gas consumption in FY2009 was 1936
MMCF per day. The annual consumption in that fiscal year was about 706 BCF. The previous
gas demand forecasts that were reviewed tended to underestimate future gas demand. It is
difficult to predict future gas demand accurately. This report considers 3 demand growth
scenarios, each starting with actual gas consumption in FY 2009: a base gas case with demand
growth of 7.3% per year, a low case with growth of 5.7% per year, and a high case with growth
of 8.9% per year. The growth rate in each of these scenarios is lower than the long run historical
average. This is reasonable, since the historical growth started with a very low rate of gas use in
the country.
This report considered several actual and possible sources of gas:
Existing fields
New conventional fields
o Mapped prospects and leads
o Unmapped prospects and leads
o Thin beds
Unconventional sources
o Coal bed methane (CBM)
o Shale gas
Gas imports
o LNG
o Pipelines
The country has been experiencing shortages of natural gas. Since much of the power generation
in the country is gas-fired, the gas shortages have caused power load shedding during certain
seasons. This has heightened awareness of the need to explore for and develop new sources of
natural gas.
70 Fiscal year 1980 runs from July 1, 1980 through June 30, 1981.

6/5/2012 119 Gustavson Associates
There is also awareness of the potential for reform of end-user tariffs for natural gas to moderate
demand for natural gas. Residential consumers pay a low fixed monthly fee for natural gas
regardless of actual gas consumption. Other categories of gas consumer pay a low price for gas.
Tariff reform is being considered, which could lead to lower growth rates in gas demand.
Besides the range of future demand scenarios, the report presented a range of possible supply
scenarios. Exploration and development of hydrocarbons is an intrinsically uncertain
undertaking. There is uncertainty about whether a particular prospect, lead or target will contain
commercial amounts of hydrocarbon, and if so, about the amount of hydrocarbon reserves or
resources. There is also uncertainty about the timing of exploration activity and the rate of
production from existing fields or new discoveries. We have built a probabilistic spreadsheet
tool that models all of this uncertainty. The probabilistic inputs for the model are based on the
Gustavson reserve and resource reports that were prepared earlier as part of this project.
The model predicts that there will continue to be small gas shortages over the next five years.
Additional development is planned for existing fields, which will lead to increases in the supply
of gas. However, the increases are not anticipated to keep pace with the increased demand for
natural gas. We predict that domestic gas supplies will begin to fall substantially short of
demand starting in about 2016, as production from existing fields goes on decline due to
depletion of reserves within those fields. It is possible that large discoveries of shale gas may
meet gas demand in late years after about 2024, but this is not assured.
The country has several options for dealing with the anticipated shortage in the domestic supply
of natural gas, including:
Accelerate natural gas exploration activity on the part of Petrobangla and/or international
oil and gas companies
Import natural gas as LNG, which will require construction of one or more LNG
regasification facilities
Initiate studies of unconventional gas (shale gas and coalbed methane) and thin beds in
Bangladesh
Arrange for import of natural gas by pipeline from neighboring countries

6/5/2012 120 Gustavson Associates
Raise end-user prices for natural gas to moderate the demand
Allow for more private sector involvement in the natural gas sector, for example allowing
gas producers to sell gas to end users, with Petrobangla being compensated for providing
transportation from the wellhead to the end user.

6/5/2012 121 Gustavson Associates
APPENDIX A
SECTOR DEMAND FORECASTS FROM PREVIOUS REPORTS
This appendix presents the values in the sector-wide gas demand forecasts of three of the four
previous reports that Gustavson Associates has reviewed. The Global Data forecast did not
include a gas demand forecast by sector; therefore it is not included in this appendix. The
information in this appendix was gathered from the previous reports and summarized in table
form below for quick comparison.
Table A-1 Econ Analysis Sector Demand Forecast71
Sector Case 2000 2005 2010 2015 2020 2025 2030
Power
Base Case
408
563 756 1044 1409 1831 2452
High Growth 563 923 1310 1882 2282 2736 Low Growth 543 640 818 1033 1219 1499
Fertiliser Base Case
233 247 304 306 282 282 230
High Growth 265 342 345 321 321 269
Low Growth 245 245 225 222 222 170
Industry Base Case
125 213 314 410 509 615 717
High Growth 276 408 541 682 836 989
Low Growth 222 285 351 419 491 554
Other Base Case
100 158 218 280 360 462 591
High Growth 128 206 290 404 556 755 Low Growth 100 130 167 222 292 382
Losses Base Case
43 68 86 92 92 87 77
High Growth 76 101 113 117 114 105 Low Growth 58 65 67 66 62 54
Total Base Case
908 1249 1676 2132 2652 3277 4067
High Growth 1308 1980 2599 3406 4108 4854 Low Growth 1167 1364 1628 1963 2286 2660
Units: MMCFD
71 Source: ECON Analysis, Bangladesh Optimal Gas Utilisation, 2004.

6/5/2012 122 Gustavson Associates
Table A-2 Wood Mackenzie Sector Demand Forecast72
Units: MMCFD
72 Source: Wood Mackenzie, Preparation and Development of Gas Sector Master Plan, 2006.
Fiscal Year 2004 2005 2006 2007 2008 2009 2010 2011 2012 2013 2014 2015 2016 2017 2018 2019 2020 2021 2022 2023 2024
Base Case 600 652 709 771 838 911 990 1076 1169 1271 1382 1502 1633 1775 1929 2097 2279 2478 2693 2928 3182
Low Growth 600 639 681 725 772 822 875 932 993 1058 1126 1199 1277 1360 1449 1543 1643 1750 1864 1985 2114
High Growth 600 662 731 807 891 984 1086 1199 1324 1462 1614 1782 1967 2171 2397 2647 2922 3226 3561 3932 4340
Base Case 274 274 274 274 274 280 280 280 280 280 280 280 280 280 280 280 280 280 280 280 280
Low Growth 274 274 274 274 274 280 280 280 280 280 280 280 280 280 280 280 280 280 280 280 280
High Growth 274 274 274 274 274 365 365 365 365 365 410 410 410 410 410 410 410 410 410 410 410
Base Case 500 539 580 625 673 725 780 840 905 975 1050 1131 1218 1312 1413 1521 1638 1765 1900 2047 2204
Low Growth 500 532 565 601 638 679 721 767 815 867 921 979 1041 1106 1176 1250 1329 1413 1502 1596 1697
High Growth 500 544 592 644 701 762 829 902 982 1068 1162 1264 1376 1497 1628 1772 1928 2097 2282 2483 2701
Base Case 1362 1426 1525 1619 1725 1896 2022 2158 2340 2518 2669 2853 3030 3240 3509 3818 4112 4439 4792 5182 5606
Low Growth 1362 1414 1503 1577 1672 1795 1896 2000 2096 2217 2299 2386 2476 2593 2754 2942 3125 3312 3528 3762 4005
High Growth 1362 1440 1563 1666 1785 1983 2234 2426 2657 2873 3087 3379 3625 3942 4320 4739 5193 5698 6244 6830 7441
Power Sector
Fertilizer
Non‐Bulk
Total
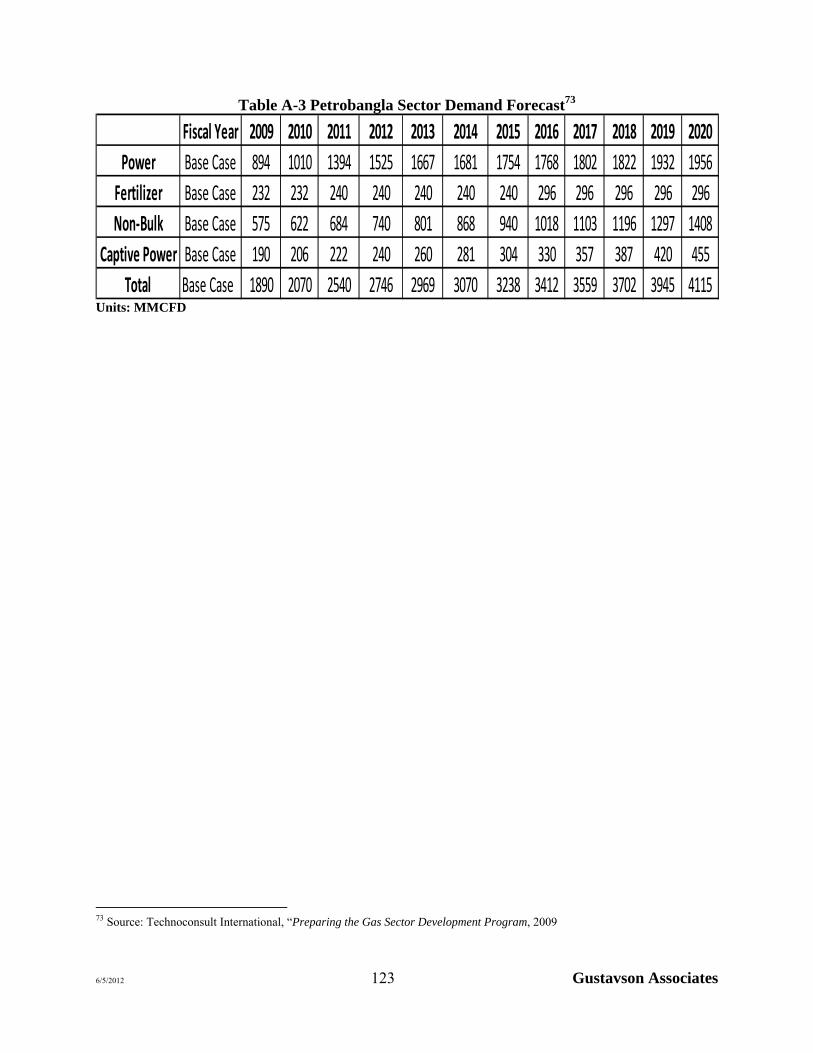
6/5/2012 123 Gustavson Associates
Table A-3 Petrobangla Sector Demand Forecast73
Fiscal Year 2009 2010 2011 2012 2013 2014 2015 2016 2017 2018 2019 2020
Power Base Case 894 1010 1394 1525 1667 1681 1754 1768 1802 1822 1932 1956
Fertilizer Base Case 232 232 240 240 240 240 240 296 296 296 296 296
Non‐Bulk Base Case 575 622 684 740 801 868 940 1018 1103 1196 1297 1408
Captive Power Base Case 190 206 222 240 260 281 304 330 357 387 420 455
Total Base Case 1890 2070 2540 2746 2969 3070 3238 3412 3559 3702 3945 4115Units: MMCFD
73 Source: Technoconsult International, “Preparing the Gas Sector Development Program, 2009

6/5/2012 124 Gustavson Associates
APPENDIX B
INPUTS FOR PROBABILISTIC MODELS
Exploration Start – Base Case
Exploration Start – Accelerated Case
Average time between exploration wells, years
Prospects 1.00
Leads 1.00
Unmapped 1.00
CBM 1.00
Shale gas 1.00
Date of 1st exploration well Prospect Lead
Awarded blocks (not yet in IOC hands) 8/1/2013 8/1/2015
Eastern fold belt, unawarded 8/1/2017 8/1/2020
Unawarded other 8/1/2019 8/1/2025
Target
Unmapped 8/1/2025
CBM 8/1/2013
Shale Gas 8/1/2016
Date of 1st exploration well Prospect Lead
Awarded blocks (not yet in IOC hands) 1/1/2012 1/1/2012
Eastern fold belt, unawarded 1/1/2012 1/1/2012
Unawarded other 1/1/2012 1/1/2012
Target
Unmapped 8/1/2025
CBM 8/1/2013
Shale Gas 8/1/2016

6/5/2012 125 Gustavson Associates
Summary of Bangladesh Major Fields Gas Reserves
FieldEstimated Ultimate Recovery
(BCF)Reserves
P90 P50 P10 P90 P50 P10
Shahbazpur 213.7 261.2 315.7 208.9 256.3 310.8
Chhatak 265.0 474.0 727.0 239.2 448.2 701.2
Bibiyana 4,075.2 4,531.7 4,988.3 3,226.5 3,683.0 4,139.6
Rashidpur 2,415.5 3,134.0 3,989.9 1,932.8 2,651.4 3,507.3Kailash Tila 2,553.4 2,880.2 3,226.3 2,024.6 2,351.5 2,697.6
Bangora 557.7 621.4 686.3 397.7 461.4 526.4
Narshingdi 316.8 344.7 371.5 193.0 220.9 247.7
Salda Nadi 155.7 275.3 403.2 91.2 210.8 338.7
Fenchuganj 194.5 329.3 475.8 109.9 244.7 391.2
Moulavi Bazar 401.9 493.6 601.6 220.2 311.9 420.0
Titas 6,837.8 7,582.2 8,336.4 3,549.7 4,294.1 5,048.3
Meghna 76.4 101.2 208.6 38.5 63.3 170.7
Jalalabad 1,013.1 1,127.8 1,250.3 387.4 502.0 624.5
Bakhrabad 1,200.7 1,387.2 1,594.4 483.6 670.1 877.3
Sylhet 322.7 408.3 511.5 128.6 214.2 317.4
Beani Bazar 107.7 136.6 168.6 40.2 69.2 101.1
Sangu 677.3 770.5 863.7 196.4 289.5 382.7
Habiganj 2,412.8 2,786.8 3,220.8 607.7 981.7 1,415.7
Feni 62.8 129.6 202.0 0.0 66.5 138.9
Kamta 21.1 50.3 100.0 0.0 29.2 29.2
Begumganj 10.0 32.7 108.0 10.0 32.7 108.0
Kutubdia 45.5 45.5 100.0 45.5 45.5 45.5
Semutang 318.0 318.0 600.0 318.0 318.0 318.0

6/5/2012 126 Gustavson Associates
POS 7.29%
POS 9%
POS 9%
UNMAPPEDRef. USGS Survey Bulletin 2208‐A
Mean #
fields Rel. Freq. Mean SD
Surma Basin 33 21.0% 265 909
E. Extremely Folded Belt 7 4.5% 71 36
Hi‐Amp. Faulted Anticlines 16 10.2% 114 171
Moderately Faulted Anticlines 74 47.1% 274 899
Western Slope 22 14.0% 140 409
Western Platform 5 3.2% 71 36
Total 157 100.0%
Field Size BCF
Name Block
Mean
(BCF)
St Dev
(BCF) Variance
10‐2 (Char Jabbar) 10 438 127 16,025
12‐3 (Balarampur/ Byronpur) 12 2,186 716 512,713
Kuakata 17 11,316 3,167 10,028,812
Adinath 17 3,790 1,423 2,025,811
Average 4,433 1,774 3,145,840
Prospects on Unawarded Blocks NOT in the Eastern Foldbelt
Name Block
Mean
(BCF)
St Dev
(BCF) Variance
Kapasia 11 2631 491 241,042
Netrakona 11 5081 1821 3,316,405
Char Kajal 7 3046 728 529,562
Average 3586 1,167 1,362,336
Prospects on Awarded Blocks NOT in the E.
Foldbelt
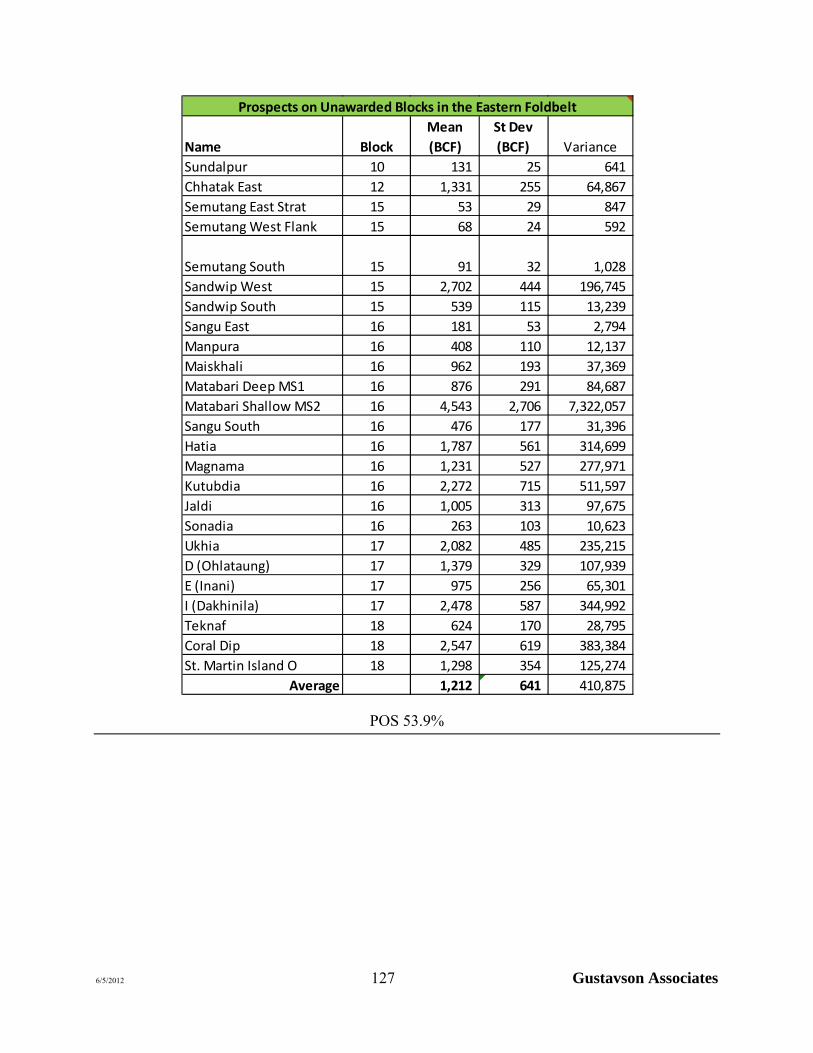
6/5/2012 127 Gustavson Associates
POS 53.9%
Name Block
Mean
(BCF)
St Dev
(BCF) Variance
Sundalpur 10 131 25 641
Chhatak East 12 1,331 255 64,867
Semutang East Strat 15 53 29 847
Semutang West Flank 15 68 24 592
Semutang South 15 91 32 1,028
Sandwip West 15 2,702 444 196,745
Sandwip South 15 539 115 13,239
Sangu East 16 181 53 2,794
Manpura 16 408 110 12,137
Maiskhali 16 962 193 37,369
Matabari Deep MS1 16 876 291 84,687
Matabari Shallow MS2 16 4,543 2,706 7,322,057
Sangu South 16 476 177 31,396
Hatia 16 1,787 561 314,699
Magnama 16 1,231 527 277,971
Kutubdia 16 2,272 715 511,597
Jaldi 16 1,005 313 97,675
Sonadia 16 263 103 10,623
Ukhia 17 2,082 485 235,215
D (Ohlataung) 17 1,379 329 107,939
E (Inani) 17 975 256 65,301
I (Dakhinila) 17 2,478 587 344,992
Teknaf 18 624 170 28,795
Coral Dip 18 2,547 619 383,384
St. Martin Island O 18 1,298 354 125,274
Average 1,212 641 410,875
Prospects on Unawarded Blocks in the Eastern Foldbelt

6/5/2012 128 Gustavson Associates
POS 8.1%
Name Block
Mean
(BCF)
St Dev
(BCF) Variance
Bajitpur 11 1,758 700 490,098
Madon 11 917 447 200,024
Nandail 11 3,263 1,218 1,482,891
Nikli 11 2,000 790 624,874
Bhairab (11‐2,3) 11 1,585 684 467,706
Haluaghat (11‐1/ Lead‐C) 11 11 6 39
8‐1 (L, M, E. Mio‐Oligo) 8 1,831 542 293,255
8‐2 (E. Mio. & Oligo) 8 754 230 52,780
8‐3 8 823 256 65,388
8‐4 8 401 138 19,146
8‐5A (L, M, E. Mio‐Oligo) 8 436 145 21,063
8‐5B (L, M, E. Mio‐Oligo) 8 612 199 39,681
8‐5C (L, M, E. Mio‐Oligo) 8 802 265 70,485
8‐6 (L, M, E. Miocene) 8 368 123 15,203
8‐7 8 1,499 555 308,025
8‐8 8 3,424 1,205 1,451,664
8‐9 8 736 352 123,693
8‐10 8 312 188 35,168
8‐11 8 678 363 131,660
8‐12 8 1,214 472 222,463
8‐13 8 2,825 990 980,496
8‐14 (Eoc. & Cret) 8 444 233 54,256
8‐15 (L. & M. Mio.) 8 250 87 7,646
Lead A 8 412 144 20,848
Lead B 8 266 133 17,796
Lead D 8 516 182 33,266
Lead E 8 481 168 28,056
Lead F 8 250 90 8,105
Lead G 8 1,131 359 129,226
Lead H 8 3,508 924 853,536
Chandramohan 7 952 275 75,394
Amtoli 7 595 188 35,213
Average 1,095 511 261,223
Leads on Awarded Blocks (NOT in the Eastern Foldbelt)

6/5/2012 129 Gustavson Associates
POS 8.1%
Name Block
Mean
(BCF)
St Dev
(BCF) Variance
2‐1 (Oligo‐Eo‐Cre) 2 1,549 415 172,607
2‐2 2 2,127 750 562,005
2‐3 2 1,467 527 277,813
Sherpur East 2 579 169 28,507
3‐1 3 3,537 1,239 1,534,972
3‐2 3 5,280 1,634 2,668,584
3‐3 3 2,232 812 659,052
3‐4 3 660 248 61,578
3‐5 3 2,472 698 487,316
3‐6 3 3,169 876 767,078
3‐7 3 3,047 1,015 1,029,677
3‐8 3 1,464 516 266,524
3‐9 3 1,467 523 273,791
3‐10 3 264 123 15,063
3‐11 3 530 175 30,674
3‐12 3 331 176 30,825
3‐13 3 265 123 15,191
3‐14 3 265 124 15,391
4‐1 4 4,459 1,481 2,191,880
4‐2 4 3,565 1,177 1,384,623
4‐3 4 5,610 1,870 3,496,376
4‐4 4 127 58 3,364
4‐5 4 263 120 14,309
4‐6 4 347 163 26,517
4‐7 4 409 203 41,225
4‐8 4 335 157 24,580
4‐9 4 79 42 1,767
4‐11 4 260 121 14,731
4‐12 4 266 125 15,623
4‐13 4 429 170 28,859
4‐15 4 83 45 1,982
4‐16 4 351 165 27,166
4‐18 4 352 166 27,450
4‐10 4 399 184 33,867
4‐14 4 356 167 27,806
4‐17 4 267 125 15,563
4‐19 4 395 181 32,606
4‐20 4 1,918 590 348,206
4‐21 4 1,470 518 268,210
4‐22 4 1,471 521 271,608
4‐23 4 1,471 519 269,714
6‐3 6 2,714 674 454,478
6‐4 (L. & M. Mio.) 6 1,114 280 78,187
6‐5 (L. & M. Mio.) 6 3,514 813 660,953
6‐7 (L. & M. Mio.) 6 3,355 830 688,253
12‐10 12 2,251 396 156,571
Lead 19‐A 19 9,661 4,335 18,794,219
Lead 19‐B 19 3,864 1,825 3,332,049
Lead 20‐A 20 11,071 4,857 23,590,643
Lead 20‐B 20 7,297 3,501 12,253,780
Lead 20‐C 20 12,996 5,667 32,113,189
Average 2,220 1,466 2,148,765
Leads on Unawarded Blocks NOT in the Eastern Foldbelt

6/5/2012 130 Gustavson Associates
POS 38.5%
Name Block
Mean
(BCF)
St Dev
(BCF) Variance
Srikail, North (?) 9 312 254 64,404
Chandpur (?) 9 256 205 41,833
9‐2 (L. & M. Mio.)/ Daudkandi 9 868 226 51,062
Darbesh 13 912 220 48,519
Dupitila (?) 13 746 166 27,632
Fenchuganj‐East ? 14 1,049 254 64,633
Patharia North Pitch 14 2,391 527 277,392
Patharia West 14 452 98 9,645
Harargaj 14 10,127 2,108 4,442,610
Harargaj North 14 2,420 524 274,911
Batchia North Pitch 14 6,645 1,457 2,121,975
J 17 1,282 330 108,715
Q 17 1,306 493 243,315
R 17 1,306 495 245,431
Bandarban 22 7,186 1,184 1,401,761
Barkal 22 2,695 501 250,911
Belachari 22 3,915 645 416,102
Bhuachari 22 1,019 234 54,583
Changohtang 22 1,769 322 103,813
Gilachari 22 1,599 283 80,049
Gobamura 22 3,211 577 333,402
Kasalang 22 3,213 588 345,274
Matamuhuri 22 11,746 2,078 4,316,006
Shishak 22 1,208 230 52,808
Uttan Chhatra 22 5,786 1,040 1,080,997
Average 2,937 811 658,311
Leads on Unawarded Blocks in the Eastern Foldbelt