Future internationalisation of Higher Education in Ibero ... · PDF fileJuly 2014 Future...
19
July 2014 Future internationalisation of Higher Education in Ibero-America A British Council databook Education Intelligence www.britishcouncil.org/education-intelligence
Transcript of Future internationalisation of Higher Education in Ibero ... · PDF fileJuly 2014 Future...
July 2014
Future internationalisation of Higher Education in Ibero-America A British Council databook
EducationIntelligence
www.britishcouncil.org/education-intelligence

2
© 2014 British Council. All rights reserved.
3
The future of internationalisation 4
Megatrends: The future of international education 5
Demographic shifts 6
Economic dynamics 8
Growth in education provision 9
Student mobility forecasts 10
The student decision-making process 12
Investment in research and business 13
Internationalisation of higher education 16
The promising future 19
Table of contents

4
One of the most important challenges shared by Ibero-American universities in this new millennium is how to achieve a deeper and sustainable relationship with the global research community.
In order to reach international recognition, many higher education institutions from the region need to overcome common structural issues, such as scarce resources for research, a low level of English fluency of the population, an underdeveloped job market for PhDs and a lack of public policies to strengthen international cooperation. While the countries that fall under the Ibero-American umbrella may have different priority areas, the broad challenges that arise in this era of internationalisation are shared by all.
What the region offers to the research community are varied and plentiful: a vibrant and multicultural environment, a young and creative population, unexplored natural resources and a great willingness to participate in the global scenario. Harnessing this potential and channeling momentum towards the development of sustainable policies have evolved into a common goal.
In this report, we aim to further understand the rate and nature of the ongoing change in the internationalisation of higher education in the Ibero-American region. We welcome today’s discourse on internationalisation and hope through our analysis we can contribute to the region’s competitiveness in the future global marketplace.
Claudio Anjos
Director Education and Society
British Council, Brazil
The future of internationalisation

5
Economic and demographic data provide the most reliable foundation upon which to base analysis of future growth of international education. How these two drivers merge can often indicate the direction of international higher education’s future growth. However, further investigation has shown that other factors, outside of an increase in population and the capacity to fund education, will impact emerging trends.
The Copenhagen Institute for Future Studies describes Megatrends as great forces in societal development that will affect all areas of general human growth and progress in years to come. These long term driving forces, or Megatrends, have great importance now and there is confidence they will have great importance in the future. Apply this conceptual strategy of future planning to the world’s international education industry and what Megatrends can we identify?
Whilst developing forecasting models that aimed to predict future flows of tertiary students we have been able to refine our list of core drivers that we believe will have a profound effect on the direction and growth of international higher education in the future. Although not an exhaustive or complete list, we have identified seven Megatrends. These are demographic shifts, economic dynamics, growth in education provision, changes to political conditions, digital technology, global work force demands and cultural impact. This report looks at a number of these drivers in assessment of the future of higher education in Ibero-America.
Megatrends: The future of international education

6
Demographic shifts
Forecast population growth in Ibero-America: 2015 – 2030
Country 2015 2020 2025 2030
Brazil 203 657 211 102 217 519 222 748
Mexico 125 236 131 955 138 195 143 663
Colombia 49 529 52 379 54 955 57 219
Spain 47 199 47 789 48 082 48 235
Argentina 42 155 43 835 45 423 46 859
Venezuela 31 293 33 417 35 383 37 172
Peru 31 161 33 079 34 877 36 514
Guatemala 16 255 18 281 20 394 22 566
Chile 17 924 18 645 19 285 19 815
Ecuador 16 226 17 416 18 563 19 649
Bolivia 11 025 11 913 12 801 13 665
Dominican Republic
10 652 11 235 11 759 12 219
Honduras 8 424 9 235 10 035 10 811
Portugal 10 610 10 579 10 514 10 433
Paraguay 7 033 7 607 8 165 8 693
Nicaragua 6 257 6 665 7 038 7 391
El Salvador 6 426 6 614 6 759 6 875
Costa Rica 5 002 5 295 5 549 5 760
Panama 3 988 4 296 4 597 4 882
Puerto Rico 3 680 3 679 3 693 3 704
Uruguay 3 430 3 482 3 536 3 581
Andorra 81 84 86 89
Source: UN Population Division 2014
The UN population division describes the current rate of aging in the global population as unprecedented. Examples from developed economies allow us to understand more immediately the consequences of people growing older and living longer as well as the profound effect these factors have on societal development; Spain and Portugal are two cases of countries with low population growth forecasts due to the birth rate slowing. Running counter to the increasing age of the global population is the rise of youth populations in emerging and developing nations, including Brazil, Mexico, Peru, and Argentina.
740 MillionTotal population in 2030

7
FUtUre iNterNAtioNAliSAtioN oF HigHer eDUCAtioN iN iBero-AmeriCA
Regional population forecasts, 2015 - 2030
Guatemala Honduras
Nicaragua
Costa RicaPanama
Colombia
Ecuador
Peru
Bolivia
Paraguay
Chile
Argentina
Uruguay
Brazil
Venezuela
DominicanRepublic
PuertoRico
SpainPortugal
Mexico
El Salvador
Andorra
Above 25%
21 - 25%
15 - 20%
5 - 14%
Below 5%
Forecast population growth trend from 2015 to 2030
Source: UN Population Division, 2014
One effect of the growth in the youth population is the steady increase of young people seeking better access to healthcare and educational opportunities in urbanised areas. In some parts of Ibero-America the rapidly rising number of tertiary-aged individuals adds a further layer of complexity to the shifts in demographics that are predicted to impact demand for and access to education.

8
GDP per capita (current US$), 2012
0
2,500
5,000
7,500
10,000
12,500
15,000
17,500
20,000
22,500
25,000
27,500
30,000
Nic
arag
ua
Ho
ndur
as
Bo
livia
Gua
tem
ala
Par
agua
y
El S
alva
do
r
Ecua
do
r
Do
min
ican
Rep
ublic
Peru
Co
lom
bia
Co
sta
Ric
a
Mex
ico
Pan
ama
Bra
zil
Vene
zuel
a, R
B
Arg
entin
a
Uru
gua
y
Chi
le
Port
ugal
Pue
rto
Ric
o
Spai
n
Source: World Bank World Development indicators
Economic dynamics
The diverse size and maturity of economies in Ibero-America is best illustrated by varying GDP per capita. Led by Spain, Puerto Rico and Portugal, there are clearly countries within the group that are developed, and emerging and frontier markets that have lower per capita incomes which can be described as higher-risk. Colombia is often described as an emerging market that could provide potential for rapid growth and outsized returns attracting interest from high-risk investors.
Government expenditure on education
2
3
4
5
6
7
8
Do
min
ican
Rep
ublic
Peru
Gua
tem
ala
And
orr
a
El S
alva
do
r
Pan
ama
Ho
ndur
as
Ecua
do
r
Co
lom
bia
Uru
gua
y
Chi
le
Nic
arag
ua
Par
agua
y
Spai
n
Mex
ico
Port
ugal
Bra
zil
Arg
entin
a
Co
sta
Ric
a
Vene
zuel
a
Bo
livia
% o
f GD
P
Source: UNeSCo institute for Statistics, most recent year available 2008 – 2012, data for Puerto __rico not available
As a nation’s GDP rises, so does government’s ability to invest in education. Whilst a considerable proportion of government expenditure on education is invested in basic education as the focus on improving basic numerously and literacy continues, increasing investment in foundational skills and higher education is beginning to be seen.
9
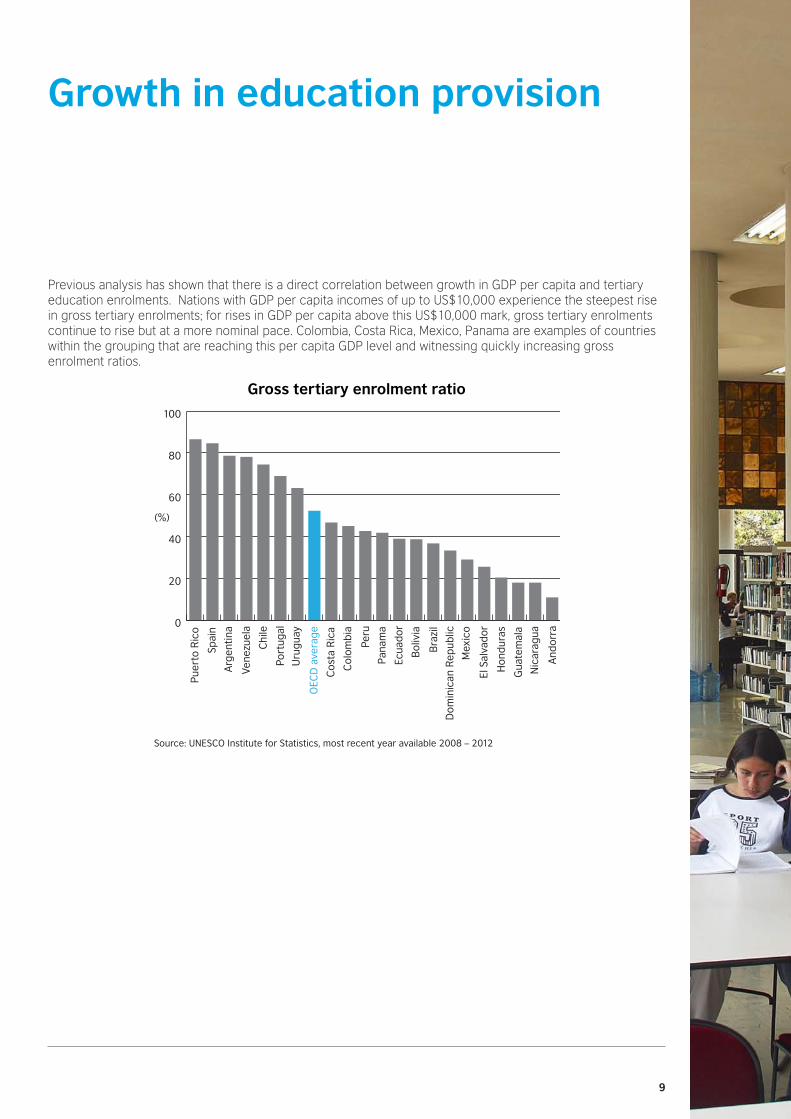
Previous analysis has shown that there is a direct correlation between growth in GDP per capita and tertiary education enrolments. Nations with GDP per capita incomes of up to US$10,000 experience the steepest rise in gross tertiary enrolments; for rises in GDP per capita above this US$10,000 mark, gross tertiary enrolments continue to rise but at a more nominal pace. Colombia, Costa Rica, Mexico, Panama are examples of countries within the grouping that are reaching this per capita GDP level and witnessing quickly increasing gross enrolment ratios.
Gross tertiary enrolment ratio
0
20
40
60
80
100
And
orr
a
Nic
arag
ua
Gua
tem
ala
Ho
ndur
as
El S
alva
do
r
Mex
ico
Do
min
ican
Rep
ublic
Bra
zil
Bo
livia
Ecua
do
r
Pan
ama
Peru
Co
lom
bia
Co
sta
Ric
a
OEC
D a
vera
ge
Uru
gua
y
Port
ugal
Chi
le
Vene
zuel
a
Arg
entin
a
Spai
n
Pue
rto
Ric
o
(%)
Source: UNeSCo institute for Statistics, most recent year available 2008 – 2012
Growth in education provision
10
Student mobility forecasts
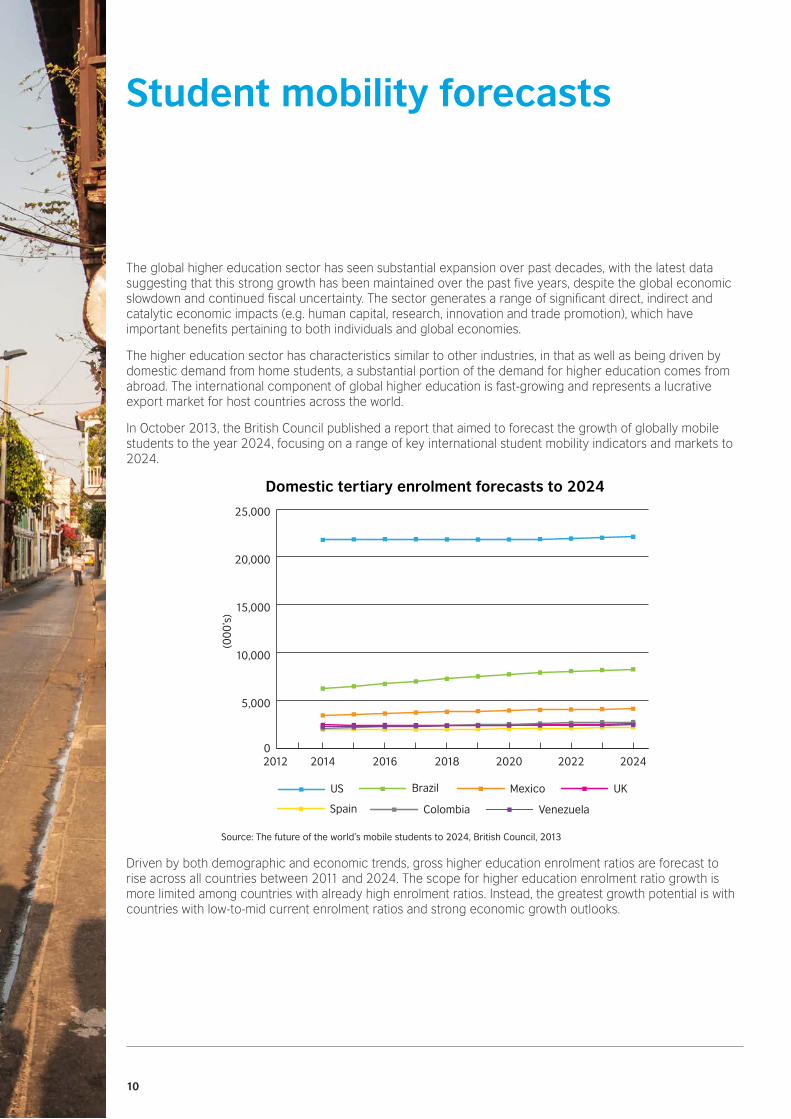
The global higher education sector has seen substantial expansion over past decades, with the latest data suggesting that this strong growth has been maintained over the past five years, despite the global economic slowdown and continued fiscal uncertainty. The sector generates a range of significant direct, indirect and catalytic economic impacts (e.g. human capital, research, innovation and trade promotion), which have important benefits pertaining to both individuals and global economies.
The higher education sector has characteristics similar to other industries, in that as well as being driven by domestic demand from home students, a substantial portion of the demand for higher education comes from abroad. The international component of global higher education is fast-growing and represents a lucrative export market for host countries across the world.
In October 2013, the British Council published a report that aimed to forecast the growth of globally mobile students to the year 2024, focusing on a range of key international student mobility indicators and markets to 2024.
Domestic tertiary enrolment forecasts to 2024
0
5,000
10,000
15,000
20,000
25,000
US Brazil Mexico UK
Spain Colombia Venezuela
202420222020201820162014
(00
0’s
)
2012
Source: the future of the world’s mobile students to 2024, British Council, 2013
Driven by both demographic and economic trends, gross higher education enrolment ratios are forecast to rise across all countries between 2011 and 2024. The scope for higher education enrolment ratio growth is more limited among countries with already high enrolment ratios. Instead, the greatest growth potential is with countries with low-to-mid current enrolment ratios and strong economic growth outlooks.

11
FUtUre iNterNAtioNAliSAtioN oF HigHer eDUCAtioN iN iBero-AmeriCA
Outbound mobile students to 2024
10
20
30
40
50
60
70
80
US Brazil Mexico UK
Spain Colombia Venezuela
20242023202220212020201920182017201620152014
(00
0’s
)
Source: the future of the world’s mobile students to 2024, British Council, 2013
Host countries globally will continue to attract mobile students in higher education over the next decade. By 2024, almost 3.9 million students are predicted to be studying towards higher education qualifications outside their home countries (in nations analysed as part of the British Council study), up from just over 3 million in 2011; this is equivalent to annual average growth of 1.8 per cent per annum. Outbound mobility ratios are forecast using a combination of the following variables: household incomes, trend factors, exchange rate, and domestic tertiary sector capacity. These ratios tend to be relatively stable over time.
Inbound mobile students to 2024
0
200
400
600
800
1,000
US UK Australia
Germany Canada Spain
Brazil
20242023202220212020201920182017201620152014
(00
0’s
)
Source: the future of the world’s mobile students to 2024, British Council, 2013
Forecasting the study destinations of globally mobile students is limited by data availability and the range of countries included in the research. Whereas outbound mobile student forecasts are based on higher education enrolments within a single country and its outbound mobility ratio, inbound student forecasts essentially require the summation of outbound mobile student flows from all origin markets to the particular destination market in question.

12
Since February 2007, the British Council has been collecting data from aspiring international students on their decisions to study around the world. Our Student Insight data set currently represents survey responses from over 180,000 people in 200 countries and territories and gives details of the factors influencing student decisions in selecting a country, city, institution and programme, as well as who and what have influenced their decision to study overseas.
Influencing factors when considering overseas study
0 5 10 15 20 25 30
Spain
Portugal
Mexico
Colombia
Brazil
Better quality of education/course overseas
Cheaper to study in another country
Course not offered at home
Cultural experience of living overseas
Family's expectations of overseas study
Intend to emigrate
Obtained scholarship overseas
Other
Previously studied overseas
To improve career prospects
To improve English language skills
Unable to obtain an offer in home country
Source: Student insight, education intelligence, British Council, data from 2012 – 2014
Respondents from Ibero-America indicated that improvement of career prospects, better quality of education, improvement of English language skills and having the cultural experience of living overseas are all highly influential factors when selecting a destination country to study in.
The student decision-making process

13
Gross domestic expenditure on research and development (GERD) as a percentage of GDP
(2010)
0.0
0.2
0.4
0.6
0.8
1.0
1.2
1.4
1.6
1.8
Gua
tem
ala
El S
alva
do
r
Pan
ama
Co
lom
bia
Uru
gua
y
Chi
le
Mex
ico
Co
sta
Ric
a
Cub
a
Arg
entin
a
Bra
zil
Spai
n
Port
ugal
(% o
f GD
P)
Source:UNeSCo institute of Statistics, 2014
Investment in research and business
There is a correlation between government investment in research and development (GERD) and the number of researchers in a country as well as the level of innovation and business research nationally. Higher spending in Portugal, Spain, Brazil, Argentina and Costa Rica are manifested in part by the comparatively higher number of researchers per million inhabitants. Conversely, lower investment in Colombia, Panama and Guatemala is mirrored in lower numbers of researchers.
Researchers per million inhabitants (FTE)
Portugal 4,166
Spain 2,924
Argentina 1,092
Costa Rica 973
Puerto Rico 674
Brazil 667
Uruguay 509
Mexico 369
Chile 286
Venezuela 182
Colombia 164
Bolivia 142
Panama 109
Guatemala 40
Source: UNeSCo institute of Statistics
While growth in higher education systems in Ibero-America will certainly link to increased academic research and collaboration, such growth may come from a low base and as such, opportunities for high-quality research production are also dependent on other interlinked factors. Networks and casual acquaintances amongst academics are often the catalysts for initiating joint research projects, thus placing special importance on cultural and physical links between people, cities and countries.
Investment in research and business remain drivers of not only international education but also of globalisation of an economy and a society. Data show that within Ibero-America, investment trends are diverse and disparate, indicative of the varying degrees of growth in this area.

14
FUtUre iNterNAtioNAliSAtioN oF HigHer eDUCAtioN iN iBero-AmeriCA
Citations, by country
Country Citable documents Citations
Spain 715,452 8,688,942
Portugal 134,447 1,342,075
Brazil 53,083 17,580
Mexico 15,464 6,531
Puerto Rico 10,953 150,252
Argentina 10,430 6,040
Chile 7,707 5,001
Colombia 5,498 3,196
Cuba 2,012 372
Venezuela 1,656 466
Peru 1,105 722
Uruguay 975 474
Costa Rica 577 329
Ecuador 540 377
Panama 422 331
Bolivia 207 144
Guatemala 178 110
Paraguay 124 43
El Salvador 105 45
Nicaragua 104 49
Andorra 93 921
Dominican Republic
78 52
Honduras 72 24
Source: SCimago Journal & Country rank, SCoPUS
International research collaboration motivates greater cooperation, revenue generation and international recognition and there remains a correlation between collaboration rates and citations per document, which is a proxy for the quality of a piece of work. Citations and published research also play a strong role in international rankings and countries with relatively higher investment in research, including Brazil and Argentina have higher numbers of citable documents and citations.
Total patent applications by origin (direct and PCT national phase entries)
Spain 11,755
Brazil 6,597
Mexico 2,206
Portugal 1,130
Argentina 1,082
Chile 790
Colombia 348
Cuba 181
Venezuela 96
Peru 71
Uruguay 52
Costa Rica 45
Panama 32
Paraguay 32
Dominican Republic 24
Andorra 18
Ecuador 15
Guatemala 14
Honduras 9
Nicaragua 6
Bolivia 3
Source: WiPo statistics database. last updated: June 2014
Global business research continues to grow exponentially and be used as an indicator of national innovation; on INSEAD’s Global Innovation Index 2014, Spain and Portugal were the top ranking Ibero-American nations, at 26 and 24 respectively, followed by Costa Rica at number 39. Business research allows education institutions to partner with businesses to enhance productivity and advancement in a nation and patents are often used as an indicator of technological development. We see that according to patent applications, Spain, Brazil, Mexico and Portugal, followed by Argentina and Chile, are the most innovative Ibero-American nations, while Honduras, Nicaragua and Bolivia are progressing much more slowly.

15
FUtUre iNterNAtioNAliSAtioN oF HigHer eDUCAtioN iN iBero-AmeriCA
Foreign direct investment, net inflows (BoP, current US$)Country 2004 2008 2012
Brazil 18,165,693,855 50,716,402,711 76,110,663,189
Spain 24,791,557,810 77,884,454,330 33,231,832,534
Chile 7,172,719,415 15,149,843,109 30,323,047,078
Mexico 24,820,542,066 28,336,685,790 17,223,652,740
Colombia 3,015,635,874 10,158,358,827 15,528,957,750
Portugal 1,660,654,223 7,518,979,341 13,377,449,646
Peru 1,599,038,389 6,923,651,285 12,244,224,090
Argentina 4,124,710,000 9,725,560,000 12,115,818,514
Dominican Republic
909,040,000 2,728,400,000 3,415,900,000
Panama 1,019,100,000 2,454,600,000 3,250,600,000
Uruguay 332,369,488 2,141,969,341 2,906,636,723
Costa Rica 793,834,548 2,078,238,732 2,680,664,969
Venezuela, RB 1,483,000,000 1,258,000,000 2,199,000,000
Guatemala 296,000,000 751,109,110 1,263,638,429
Honduras 546,864,271 1,200,798,087 1,067,550,208
Bolivia 65,430,000 512,335,605 1,059,965,391
Nicaragua 250,000,000 626,100,000 804,600,000
Ecuador 836,939,594 1,006,330,020 591,323,301
Paraguay 37,679,000 260,900,000 497,700,000
El Salvador 363,270,000 903,050,000 447,709,564 Source: World Bank World Development indicators
There also exists a positive relationship between foreign direct investment (FDI) and knowledge transfer, as well as the internationalisation of higher education. In many cases, nations look to FDI in order to acquire relationship and technologies to spur internal national growth and industry and this positive relationship is partially evidenced by the high levels of FDI and innovation in Brazil, Chile and Mexico.
Global 500 companies by countryRanking Country # of companies
12 Spain 8
16 Brazil 7
19 Mexico 3
25 Venezuela 1
25 Colombia 1
25 Chile 1
Source: Fortune, 2014
Investment and innovation manifest themselves in growth in productivity and industry and rising numbers of Ibero-American companies are operating on a global scale. Companies based in Spain, Brazil, Mexico, Venezuela, Colombia and Chile are represented within the top 500 global companies by Fortune in 2014.

16
Internationalisation of higher education According to the 2013/14 QS World University Rankings, 37 of the top 500 universities globally are found in Ibero-American nations; over 2,000 higher education institutions are evaluated for the study. The rankings are compiled according to six categories: academic reputation (40%), student-to-faculty ratio (20%), citations per faculty (20%), employer reputation (10%) and lastly international faculty ratio (5%) and international student ratio (5%); academic reputation, the most weighted category, is based on a global survey of academics regarding their preferences. Spain has the highest number of high-ranking institutions, followed by Brazil and Argentina. It is also worth noting that other ranking services use dissimilar methodologies and therefore use different weights, such as increased emphasis on research and publishing, to evaluate universities.
Number of universities in QS World University Rankings top 500
SpainPortugal
Andorra
Colombia
Ecuador
Peru
Bolivia
Paraguay
Chile
Argentina
Uruguay
Brazil
Venezuela
DominicanRepublic
PuertoRicoGuatemala Honduras
Nicaragua
Costa RicaPanama
Mexico
El Salvador
13
3
2
13
3
6
6
Source: QS World University ranking

17
FUtUre iNterNAtioNAliSAtioN oF HigHer eDUCAtioN iN iBero-AmeriCA
With the assistance of an expert Advisory Committee and support from our sponsoring partners, the British Council, the European Commission, NAFSA and EAIE and the International Association of Universities (IAU) analysed responses from 1,336 higher education institutions in 131 different countries. The research presents the largest and most geographically comprehensive collection of primary data on internationalisation of higher education available today.
This tailored analysis focuses specifically on countries from the Ibero-American region that took part in the survey across Latin America, Portugal and Spain.
Institutional benefits: What are the three most significant benefits of internationalisation to your institution?
Most significant
Second most significant
Third most significant
0 20 40 60 80 100
Increased international networking by faculty and researchers
Improved quality of teaching, learning
Increased international awareness / deeper engagement with global issues by students
Strengthened institutional research and knowledge production capacity
Enhanced prestige/profile for the institution
Enhanced internationalisation of the curriculum
Enhanced international cooperation and capacity building
Opportunity to benchmark/compare institutional performance within the context of international good practice
Increased/diversified revenue generation
Source: iAU 4th global Survey, April 2014, British Council analysis
When asked to identify the three most significant benefits of internationalisation to institutions in Ibero-America, surveyed institutions indicated increased international networking by faculty and researchers, improved quality of teaching, learning and increased international awareness/deeper engagement with global issues by students as most significant.

18
FUtUre iNterNAtioNAliSAtioN oF HigHer eDUCAtioN iN iBero-AmeriCA
Institutional risks: What are the three most significant potential risks of internationalisation to your institution?
Most significant
Second most significant
Third most significant
0 20 40 60 80 100 120
International opportunities accessible only to students with financial resources
Difficulty regulating locally the quality of foreign programmes offered
Pursuit of international partnerships/policies only for reasons of prestige
Brain drain
Over-emphasis on internationalisation at the expense of other priorities of importance for staff and students
Excessive competition among higher education institutions
Overuse of English as a medium of instruction
Homogenisation of curriculum
Too much focus on recruitment of fee paying international students
Reputational risk derived from our institution's offshore activity
Source: iAU 4th global Survey, April 2014, British Council analysis
International opportunities accessible only to students with financial resources, difficulty regulating locally the quality of foreign programmes offered and pursuit of international partnerships/policies only for reasons of prestige, were identified as the greatest risks to institutions.
Societal risks: In your country, what are the three most significant potential societal risks associated with current trends in internationalisation of higher education?
Most significant
Second most significant
Third most significant
0 20 40 60 80 100
Unequal sharing of benefits of internationalisation amongst partners
Growing gaps (e.g. quality / prestige / institutional capacity) among higher education institutions within your country
Commodification and commercialisation of education
Brain drain
Increase in number of foreign ‘degree mills’ and/or low quality providers
Growing gaps in terms of development among countries and regions
Loss of cultural identity
Dominance of a ‘western’ epistemological approach
Loss of linguistic diversity
Over-dependence on international students
Source: iAU 4th global Survey, April 2014, British Council analysis
Unequal sharing of benefits of internationalisation amongst partners, growing gaps (e.g. quality, prestige, and institutional capacity) among higher education institutions within your country and commodification and commercialisation of education were identified as the potential greatest risks to society.

19
Strong demographic growth and economic development will provide the basis for future trends in higher education in the Ibero-America region. Investment by governments and industry in research and development will drive the enrolment in the tertiary education sector that, propelled by increased investment and focus on internationalisation in institutional strategies, will begin to mature. Students from within the region have increasing international aspirations to both study overseas and experience other cultures. All of these long term drivers, or Megatrends, will shape the future of internationalisation of higher education in Ibero-America.
The promising future
In this report, Education Intelligence, the British Council’s global higher education research team, brings together significant primary and secondary data and tailored analysis to illustrate future growth in international higher education in Ibero-America. Our aim is to facilitate institutions and organisations in the development of their internationalisation strategies through global research that examines timely and significant education trends.
http://ei.britishcouncil.org
British Council Education Intelligence