
Funding, Financing and Investment - Engines of Startup … Botelho IUPERJ.pdf · Source: Jeffrey E....
22
Funding, Financing and Investment - Engines of Startup Growth? Antonio José Junqueira Botelho PhD Professor Titular / Coordenador do Programa de Pós-Graduação em Ciência Política e Relações Internacionais / Coordenador do Laboratório de Estudos em Ciência, Tecnologia, Inovação & Sociedade LECTIS, Instituto Universitário de Pesquisas do Rio de Janeiro - Iuperj / UCAM Presidente do Conselho Diretor, Gávea Angels 3ª Conferência Consórcio Internacional de Estudos sobre Inovação e Empreendedorismo:Políticas e Recursos de Apoio ao Empreendedorismo Mesa 3: Startups: Funding and Financing /Investimento e Financiamento de Startups Rio de Janeiro, 21 de novembro de 2013
Transcript of Funding, Financing and Investment - Engines of Startup … Botelho IUPERJ.pdf · Source: Jeffrey E....

Funding, Financing and
Investment - Engines of
Startup Growth? Antonio José Junqueira Botelho PhD Professor Titular / Coordenador do Programa de Pós-Graduação em Ciência Política e Relações Internacionais / Coordenador do Laboratório de Estudos em Ciência, Tecnologia, Inovação & Sociedade LECTIS, Instituto Universitário de Pesquisas do Rio de Janeiro - Iuperj / UCAM Presidente do Conselho Diretor, Gávea Angels
3ª Conferência Consórcio Internacional de Estudos sobre Inovação e Empreendedorismo:Políticas e Recursos de Apoio ao Empreendedorismo
Mesa 3: Startups: Funding and Financing /Investimento e Financiamento de Startups
Rio de Janeiro, 21 de novembro de 2013

1. Funding, Financing and Investment
2. Startup Growth
3. Context
4. Funding & Financing in Brazil
5. Engines of Startup Growth?
Agenda

1. Funding, Financing and Investment
1. Funding, Financing and Investment
2. Startup Growth
3. Context
4. Funding & Financing in Brazil
Agenda

5
0.0
0.5
1.0
0 0.5 1
Market
Tech
nolo
gy
Existing New
Exi
stin
g
Evolutionary
businesses
]
Leverage base
Market
Discontinuity
Creative
Destruction
IBM PC
Digital Cameras DVD
Automobiles Electronics Cameras
MRI Cell-phone

Uncertainty is the measure of of the array of potetial outcomes for a company or a project Asymmetric information – moral hazard / adverse selection Nature of firm assets – tangible / intangible Market conditions – different supply and cost of capital-public vs private / nature of product market shifts
Gomper’s Entrepreneurial Financing 4 Factors for assessing startup financing

• People – key players / experienceopporunity / s & w / add-remove
• Opportunity – nature / competitive advantage / barriers to entry / exploitation timing / milestones
• Deal – right structure / incentives and contingencies
• Context – most dificult / government polocies+> market size & industrial structure
• 3 Questions:
What can go right?
What can go wrong?
What actions can be taken to increase the probability that things go right and to minimize the chances that things will go wrong?
=> FIT
Sanlman’s 4 Critical Success Factors

1. Startup Growth

Startup Life Cycle Source: Chandra, A. (2007)

Differents Forms of Startup Growth Capital P
re-V
entu
re C
apit
al
Tran
siçã
o
Funding: R&D Capital / Concept Capital Descoberta e Invenção
Clá
ssic
o
Mer
can
til
Mezzanine Capital
Development / Growth Capital
Ven
ture
Cap
ital
Financing: Innovation Capital
Startup Capital
Investing: Angel Capital Seed Capital
Co
mp
etên
cia
em N
egó
cio
s
C
om
pet
ênci
a Te
cno
lógi
ca
Pro
of
of
Co
nce
pt
Fin
anci
ng

1. Context
12
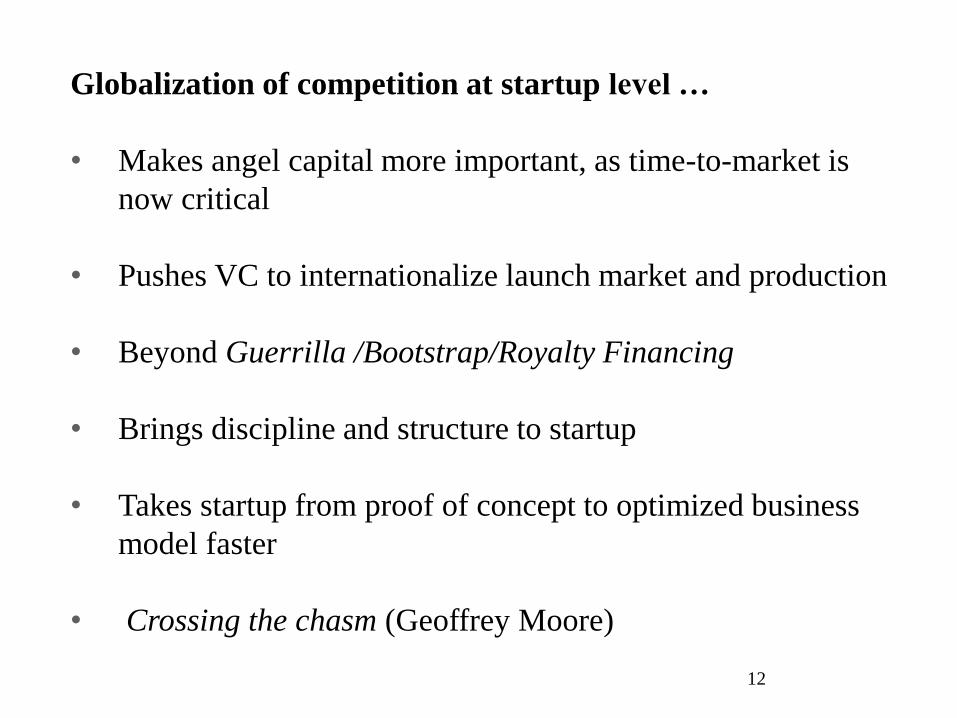
Globalization of competition at startup level …
• Makes angel capital more important, as time-to-market is
now critical
• Pushes VC to internationalize launch market and production
• Beyond Guerrilla /Bootstrap/Royalty Financing
• Brings discipline and structure to startup
• Takes startup from proof of concept to optimized business
model faster
• Crossing the chasm (Geoffrey Moore)

13
Desenvolvimento e financiamento de empresas
Founders, friends and
family
Estágio
Bancos
Capital de
risco Empresas não
financeiras
Mercado de capitais
Capital
semente
Inicial Emergente Crescimento Consolidada
Nív
el
de r
isco
p/i
nvesti
do
r
Baixo
Alto
Tecnova
Fundos VC
INOVAR
Inova Empresa
Funding and Financing Mechanisms - Brazil
Fundos incubadoras
SENAI Inovação
Startup
Brasil, Rio
Faperj e Rio
PM
Fundos
Semente

Angels: Majority of US Startup Funding
6,231
9,976
3,491
1,700
5,321
8,583
6,371
0
4,000
8,000
12,000
16,000
Seed Early Expansion Later
US
$ M
illion
s
Investment Stage
Funding by Source and Stage- 2010
Venture Capital
Angels
• US $22.5 billion
• ~66,200 deals
• 42% seed/startup
• 57% early/expansion stage
• 318,500 individuals
Angel Investors 2011
• US $28.4 billion
• ~3,750 deals
• 3% seed/startup/ 29% early stage
• 68% later/expansion capital
• 462 firms active
Venture Capital 2011

20,02924,035
11,445
309
889
1,604
0
5,000
10,000
15,000
20,000
25,000
30,000
Startup/Seed Early Stage Expansion/Later
Venture Capital
Angel Investment
Angels Invest in the Majority of Startup & Early Stage Deals
Number of Deals in 2009: Angel Investment and Venture Capital
Source: Jeffrey E. Sohl, Center for Venture Research and 2010 NVCA Yearbook

ACA Members and Innovative Startups
• Fund about 800 new companies every year (mostly USA, Canada)
• More than 5,000 companies in portfolio
• Typically on Board of Directors (or observers)
• See 75,000+ companies every year – lead deal flow in their communities
• Exits by acquisition and IPO – more members are partnering with strategic corporations for early exits

• Founded November 2002 • Associates: 30 => 36 • Angels who made at least 1 investment: 12 => 22 • Angels with > 1 investment: 6 => 12 • Gávea Angels Forum: to date 25 => 2013: 5 • Deals closed: 10 (2010:1 /2011:2 /2012:3 => 2013: 6
1 syndicated investment (RJ/SP)
1 Series A, 1 Series B 1 Seed follow-on in negotiation
• Average deal size (with follow-on): US$ 300K • Negotiations: 2012= 8 / 2013 = 12 • Investment proposals reviewed: 2012: 600 • III International Angel Investor Workshop, 8-9 November
2012: 100 participants (LA/Europe/US)
Gávea Angels
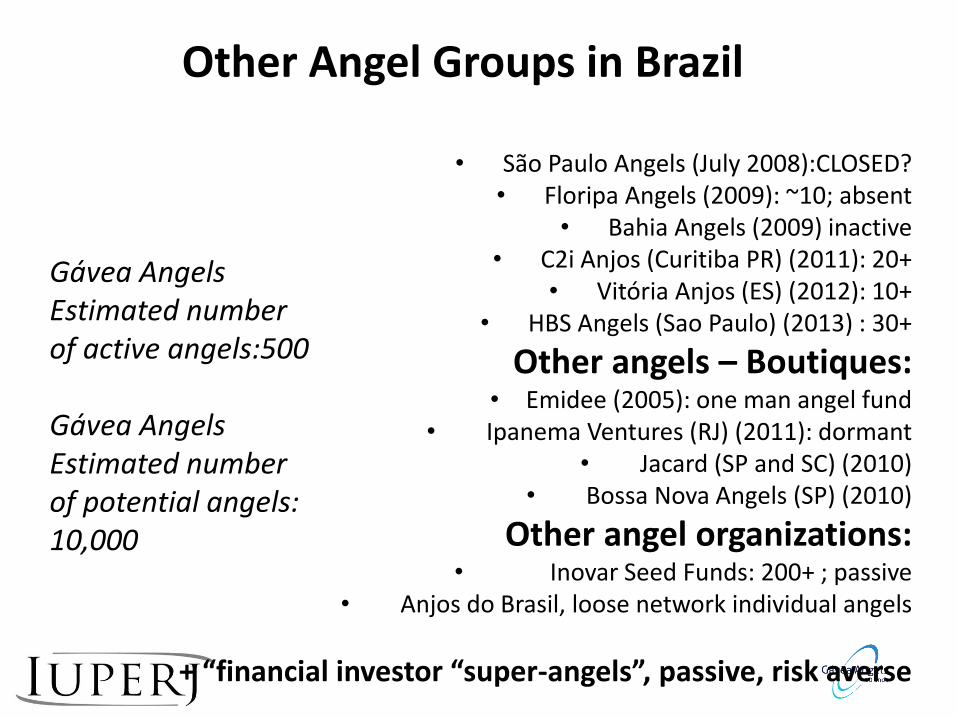
Other Angel Groups in Brazil • São Paulo Angels (July 2008):CLOSED?
• Floripa Angels (2009): ~10; absent • Bahia Angels (2009) inactive
• C2i Anjos (Curitiba PR) (2011): 20+ • Vitória Anjos (ES) (2012): 10+
• HBS Angels (Sao Paulo) (2013) : 30+
Other angels – Boutiques: • Emidee (2005): one man angel fund
• Ipanema Ventures (RJ) (2011): dormant • Jacard (SP and SC) (2010)
• Bossa Nova Angels (SP) (2010)
Other angel organizations: • Inovar Seed Funds: 200+ ; passive
• Anjos do Brasil, loose network individual angels
+ “financial investor “super-angels”, passive, risk averse
Gávea Angels Estimated number of active angels:500 Gávea Angels Estimated number of potential angels: 10,000

Latin America
Pais Número de redes
(año 1a red)
Inversionistas
ángeles en las redes
Inversiones Valor (US$
milliones)
Argentina 3(2006) 150 25 3.5
Bolivia 1(2008) nd 1 nd
Brasil 4 (2002) 88 9 1.1
Chile 7(2004) 127 30 9
Colombia 2(2010) +3 93 6 0.5
México 3(2009) 100 8 8.2
Panamá 1(2009) 26 3 nd
Perú 2(2009) 24 6 nd
Dominicana 1(2008) 57 (20) 0.270 nd
Venezuela 2(2000) 20 22 nd
Uruguay 1(2006) 26 5 nd
1. Engines of Startup Growth?

21
• Global distribution of VC (2012): top 5 regions represent 52% of $42.3 billion in global VC investments: SV, New England, S. Calif, Ny Metro UK…. followed by Beijing , Germany, Israel…NO LA country or region
• How to?
– Entrepreneurial communities, Brad Feld’s network bottom-up model
– Beijing innovation cluster state leverage, large market autarkic model
– Israel military-entrepreneurial model: competences spillover and skillful incentives
– Ontario’s Waterloo state-private model: future tech to create newq market
• Silicon Valley model it IS NOT ABOUT funding and financing, is it about investment ($ 11 billion VC in 2012) ?
– Bilions $ spent in attemps to replicate – top down strategy a failure
• Kendal Square densesr concetration of startups in the worls : 450+ next to $ 8.7 billion VC investments
– 52% (1995-2005) of founders with at least one foreign-born founder
Innovation clusters
Antonio José J. Botelho
Professor Titular, Iuperj/ UCAM
(21) 2216 7421 / 9347 0472
MUITO OBRIGADO