Fundamental Processes in Organic and Hybrid Solar Cells
41
www.tu-chemnitz.de/physik/OPKM LHP15, Kloster Banz · 12. März 2015 · [email protected] Carsten Deibel Optik und Photonik kondensierter Materie Institut für Physik Technische Universität Chemnitz Fundamental Processes in Organic and Hybrid Solar Cells
-
Upload
disorderedmatter -
Category
Science
-
view
331 -
download
4
Transcript of Fundamental Processes in Organic and Hybrid Solar Cells

www.tu-chemnitz.de/physik/OPKMLHP15, Kloster Banz · 12. März 2015 · [email protected]
Carsten Deibel
Optik und Photonik kondensierter Materie
Institut für Physik
Technische Universität Chemnitz
Fundamental Processes in Organic and Hybrid Solar Cells

www.tu-chemnitz.de/physik/[email protected]
How Do Organic Solar Cells Work?
Step 1: Light Absorption ➟ Exciton Generation in Polymer
Fulle
rene
Aluminium Cathode
Transparent Anode
Polymer
Voltage
Current

www.tu-chemnitz.de/physik/[email protected]
How Do Organic Solar Cells Work?
Step 2: Exciton Diffusion ➟ to Acceptor Interface
Fulle
rene
Aluminium Cathode
Transparent Anode
Polymer
Voltage
Current
singlet losses

www.tu-chemnitz.de/physik/[email protected]
Step 3: Exciton Dissociation ➟ Polaron Pair Generation
How Do Organic Solar Cells Work?Fulle
rene
Aluminium Cathode
Transparent Anode
Polymer
charge transfer: very fast and very efficient
Voltage
Current
singlet losses

www.tu-chemnitz.de/physik/[email protected]
How Do Organic Solar Cells Work?
Step 4: Polaron Pair Dissociation ➟ Free Electron–Hole Pairs!
Fulle
rene
Aluminium Cathode
Transparent Anode
Polymer
Voltage
Current
singlet lossesgeminate losses

www.tu-chemnitz.de/physik/[email protected]
How Do Organic Solar Cells Work?
Step 5: Charge Transport ➟ Photocurrent
Fulle
rene
Aluminium Cathode
Transparent Anode
Polymer
Voltage
Current
singlet lossesgeminate losses
nongeminate losses

www.tu-chemnitz.de/physik/[email protected]
Outline
photogeneration vs geminate recombination
experiment: effect of intercalation
nongeminate recombination
simulation: effect of phase separation
radiative efficiency
experiment: perovskite photovoltaics
www.tu-chemnitz.de/physik/[email protected]
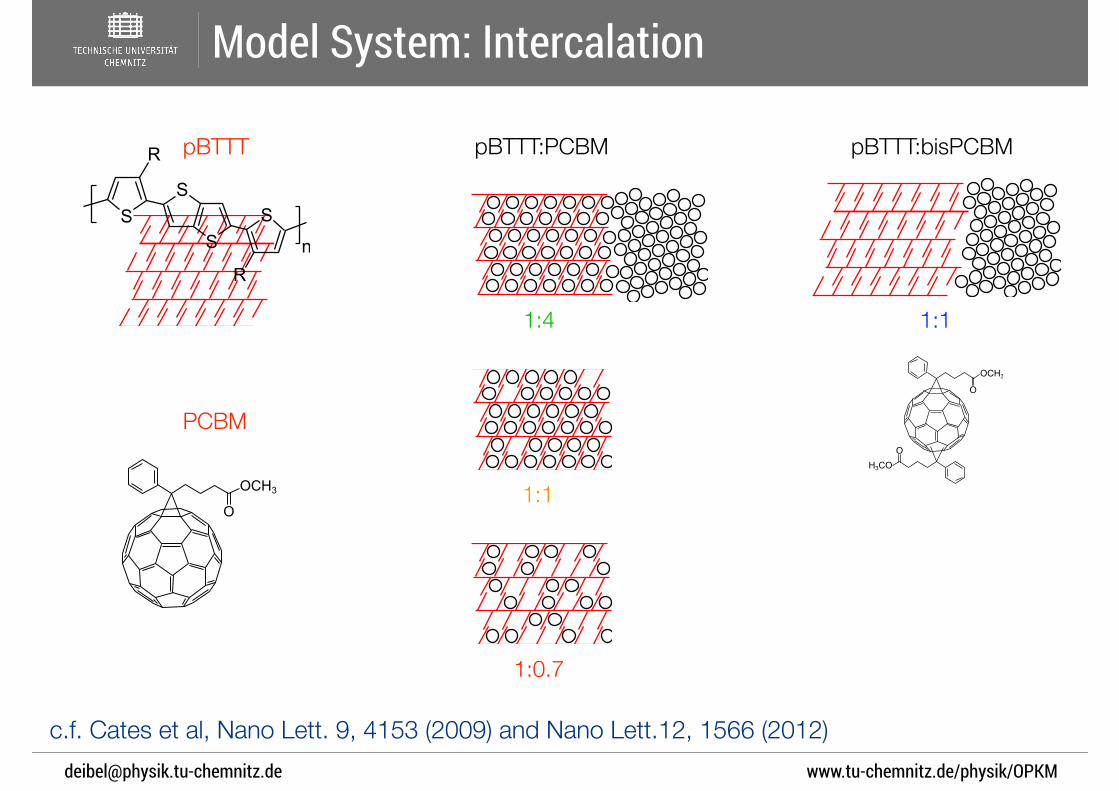
Model System: Intercalation
OCH3O
SS
SS
R
Rn
pBTTT pBTTT:PCBM
1:4
1:0.7
1:1
OCH3O
H3COO
pBTTT:bisPCBM
1:1
PCBM
c.f. Cates et al, Nano Lett. 9, 4153 (2009) and Nano Lett.12, 1566 (2012)

www.tu-chemnitz.de/physik/[email protected]
Intercalation→ Microstructure
pBTTT:PCBM
1:4
1:1
100
80
60
40
20
Cou
nts
/ a.u
.
4.54.03.53.02.52.0
2θ / °
neat pBTTT pBTTT:PCBM, 1:1 pBTTT:PCBM, 1:4 pBTTT:bisPCBM, 1:1
3.1 nm
2.3 nm85 °C, 30 min
pBTTT:bisPCBM
1:1
OCH3O
OCH3O
H3COO
SS
SS
R
Rn

www.tu-chemnitz.de/physik/[email protected]
Formation of Charge Transfer Complex
pBTTT:PCBM
1:4
1:1
pBTTT:bisPCBM
1:1
101
102
103
104
105
106
107
Abs
orpt
ion
/ cm
-1
1000 800 700 600 500
Wavelength / nm
3.02.52.01.51.0
Energy / eV
neat pBTTT pBTTT:PCBM, 1:1 pBTTT:PCBM, 1:4 pBTTT:bisPCBM, 1:1
CT
groundstate
singletexcitons
CT
freecarriers
c
h

www.tu-chemnitz.de/physik/[email protected]
Time Delayed Collection Field (TDCF)
0
td tcoll
-V
Vpre
Vcoll
t
laserpulse
0
j
Qpre
Qcoll
t
Qtot = Qpre+Qcoll
Laser excitation: 532 nm, 80 ps
typical delay time td=20ns
c.f. Mort et al, PRL 45, 1348 (1980)
www.tu-chemnitz.de/physik/[email protected]
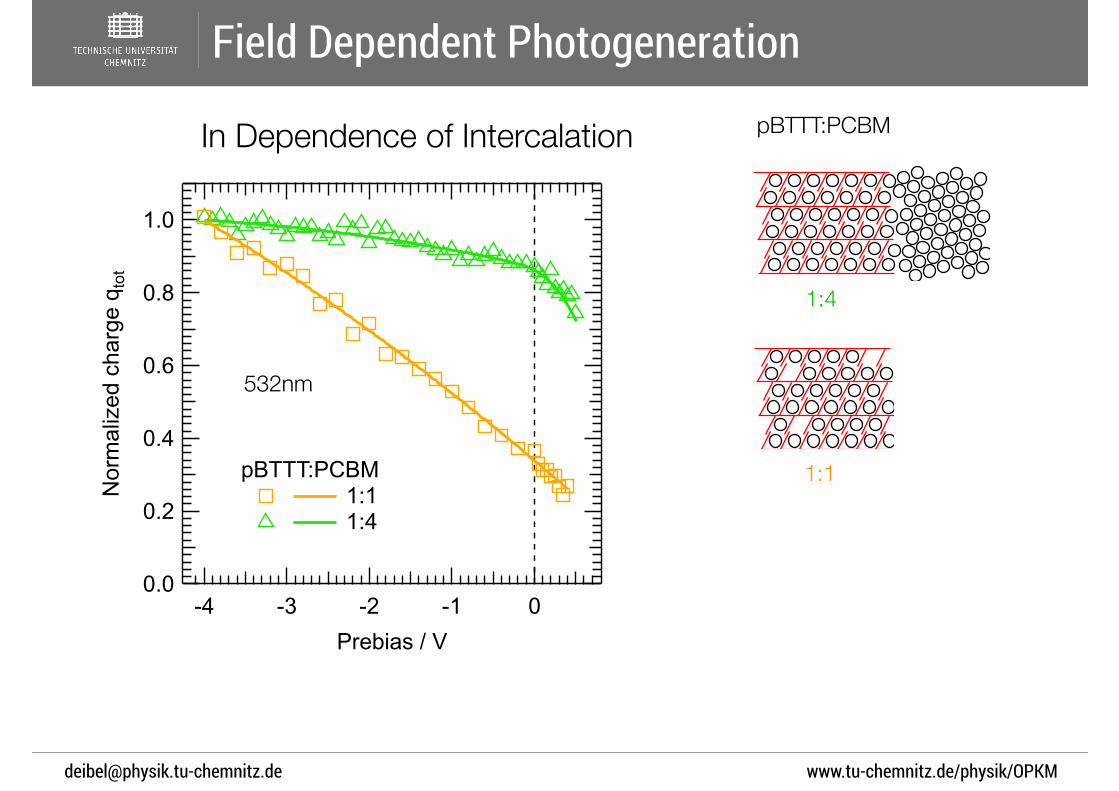
Field Dependent Photogeneration
In Dependence of Intercalation
1.0
0.8
0.6
0.4
0.2
0.0
Nor
mal
ized
cha
rge
q tot
-4 -3 -2 -1 0
Prebias / V
pBTTT:PCBM 1:1 1:4
532nm
pBTTT:PCBM
1:4
1:1

www.tu-chemnitz.de/physik/[email protected]
Hot or not? Scenarios:
ground state
singletexcitons
CTcomplexes
freecarriers
fastrelaxation
ground state
singletexcitons
CTcomplexes
freecarriers
hotdissociation
Photon energy dependence
1.0
0.8
0.6
0.4
0.2
0.0
Nor
mal
ized
cha
rge
q tot
-4 -3 -2 -1 0
Prebias / V
pBTTT:PCBM 1:1 1:4
532nm

www.tu-chemnitz.de/physik/[email protected]
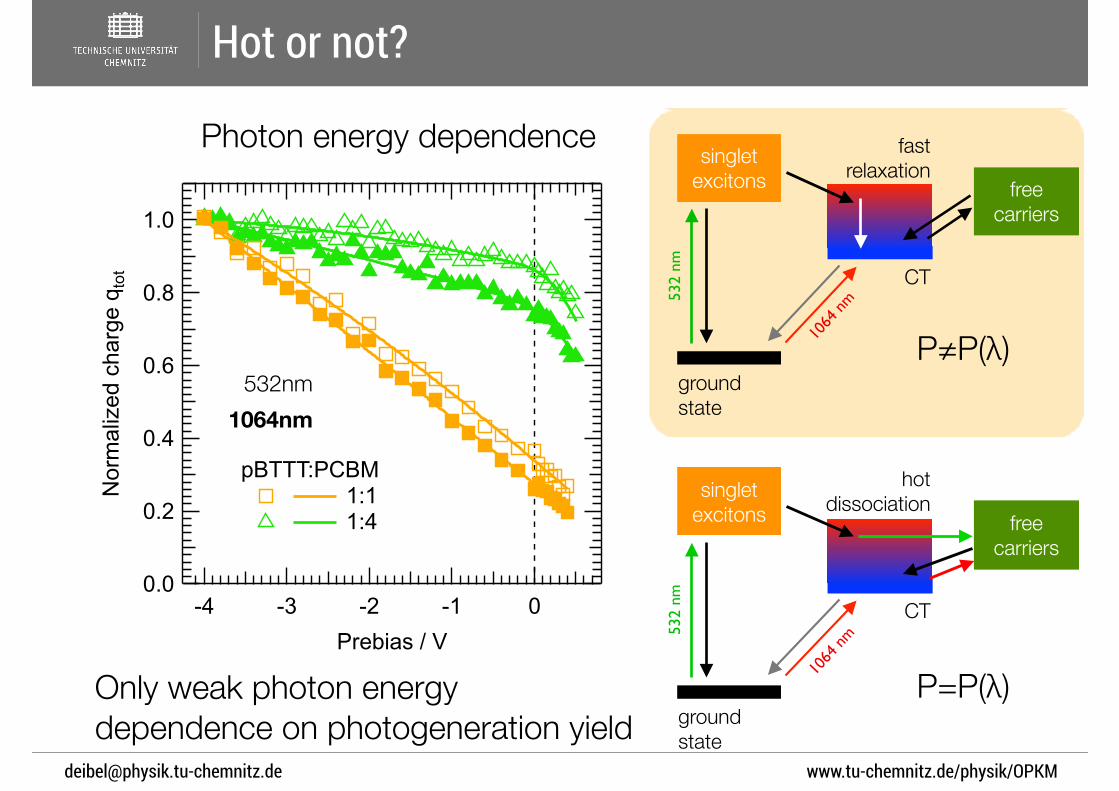
Hot or not?
P=P(λ)
P≠P(λ)ground state
singletexcitons
CT
freecarriers
fastrelaxation
ground state
singletexcitons
CT
freecarriers
hotdissociation
Photon energy dependence
532
nm53
2 nm
1064
nm
1064
nm
1.0
0.8
0.6
0.4
0.2
0.0
Nor
mal
ized
cha
rge
q tot
-4 -3 -2 -1 0
Prebias / V
pBTTT:PCBM 1:1 1:4
532nm
www.tu-chemnitz.de/physik/[email protected]
Hot or not?
Photon energy dependence
Only weak photon energy dependence on photogeneration yield
P=P(λ)
P≠P(λ)ground state
singletexcitons
CT
freecarriers
fastrelaxation
ground state
singletexcitons
CT
freecarriers
hotdissociation
532
nm53
2 nm
1064
nm
1064
nm
1.0
0.8
0.6
0.4
0.2
0.0
Nor
mal
ized
cha
rge
q tot
-4 -3 -2 -1 0
Prebias / V
pBTTT:PCBM 1:1 1:4
532nm1064nm
www.tu-chemnitz.de/physik/[email protected]
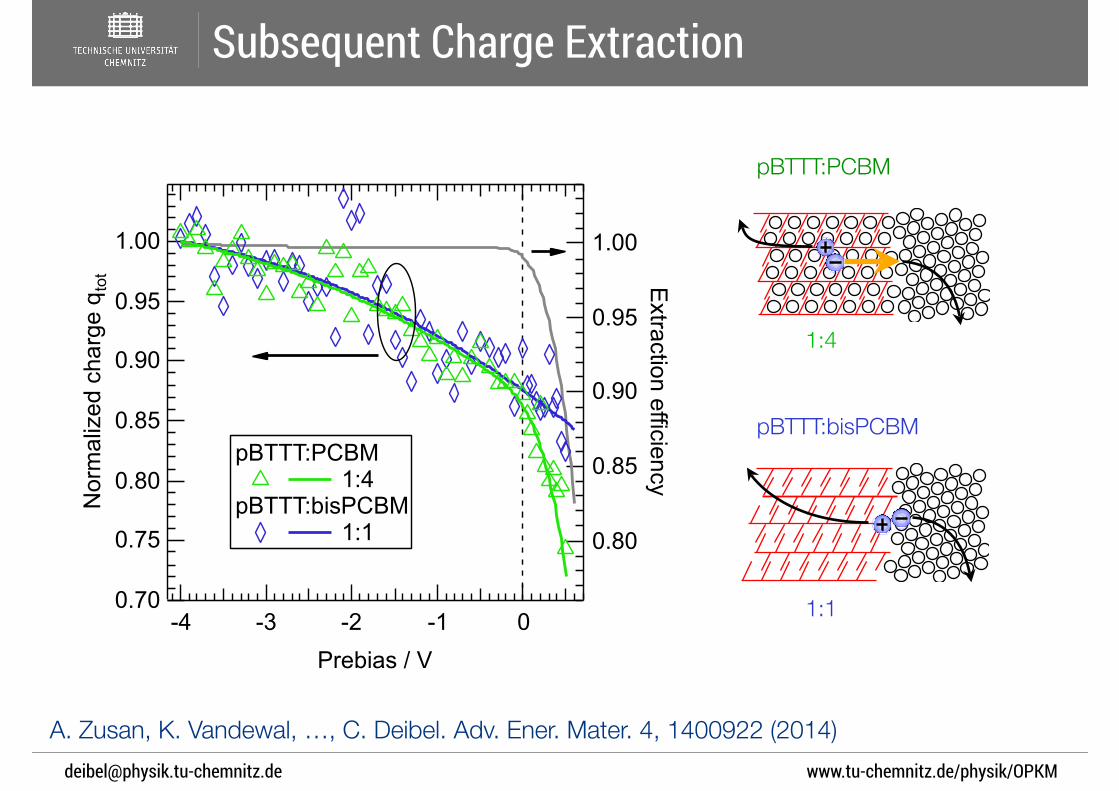
Subsequent Charge Extraction
1.00
0.95
0.90
0.85
0.80
Extraction efficiency
-4 -3 -2 -1 0
Prebias / V
1.00
0.95
0.90
0.85
0.80
0.75
0.70
Nor
mal
ized
cha
rge
q tot
pBTTT:PCBM 1:4
pBTTT:bisPCBM 1:1
pBTTT:PCBM
1:4
pBTTT:bisPCBM
1:1
A. Zusan, K. Vandewal, …, C. Deibel. Adv. Ener. Mater. 4, 1400922 (2014)

www.tu-chemnitz.de/physik/OPKMLHP15, Kloster Banz · 12. März 2015 · [email protected]
Intermediate Conclusions on Photogeneration
Photogeneration depends on electric field • strong vs weak field dependence
(pBTTT 1:1→1:4): role of delocalisation!
Photogeneration is approx. photon energy independent • Photogeneration via
relaxed intermediate state (charge transfer complex)
ground state
singletexcitons
CT
freecarriers
fastrelaxation
A. Zusan, K. Vandewal, …, C. Deibel. Adv. Ener. Mater. 4, 1400922 (2014)

www.tu-chemnitz.de/physik/[email protected]
Outline
photogeneration vs geminate recombination
experiment:
nongeminate recombination
simulation: effect of phase separation
radiative efficiency
experiment: perovskite photovoltaics
www.tu-chemnitz.de/physik/[email protected]
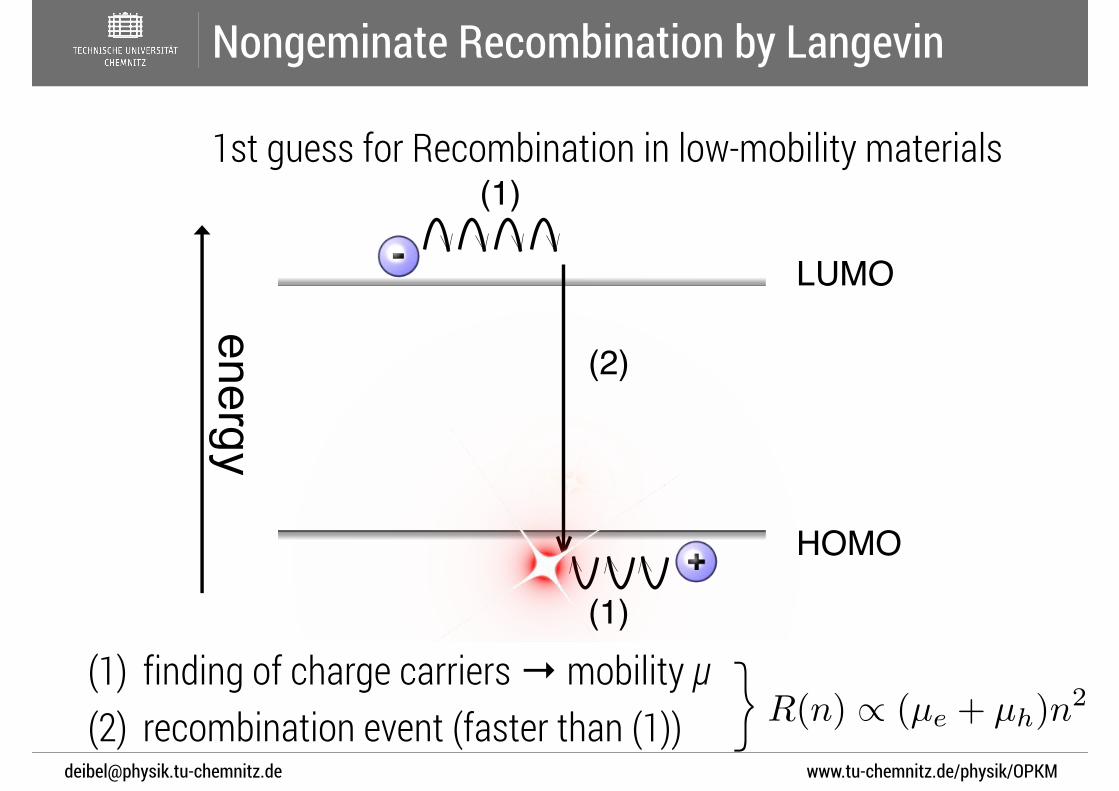
LUMO
HOMO
(1)
(2)
(1)
Nongeminate Recombination by Langevin
1st guess for Recombination in low-mobility materials
}R(n) / (µe + µh)n2
(1) finding of charge carriers → mobility μ
(2) recombination event (faster than (1))
www.tu-chemnitz.de/physik/[email protected]
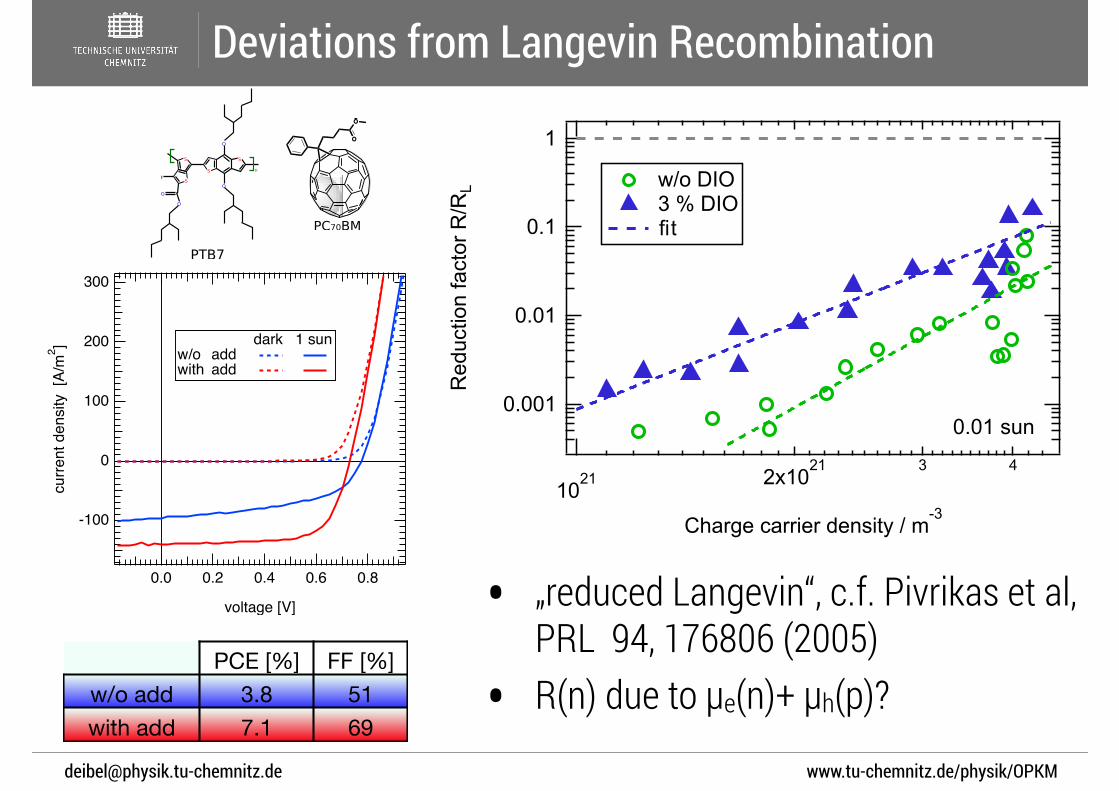
Deviations from Langevin Recombination
300
200
100
0
-100
curre
nt d
ensi
ty [
A/m
2 ]
0.80.60.40.20.0
voltage [V]
dark 1 sunw/o add with add
PCE [%] FF [%]w/o add 3.8 51with add 7.1 69
• „reduced Langevin“, c.f. Pivrikas et al,
PRL 94, 176806 (2005)
• R(n) due to μe(n)+ μh(p)?
PC70BM
F
S
S
O
S
S
O
O
n
O
PTB7

www.tu-chemnitz.de/physik/[email protected]
(a) (b) (c)
Impact of Morphology
Phase separation with bulk traps
Phase separation, bulk & interface traps
Classical Langevin case, R ∝ (μe+μh)⋅n2
R ∝ f(μe,μh)⋅n2 ? In addition, deep interface traps?
Homogeneous, „effective medium“

www.tu-chemnitz.de/physik/[email protected]
Kinetic Monte Carlo Simulation
• hopping transport
• energetic disorder, e.g. Gaussian
density of states distribution
• blend morphology
• determine μe, μh, and R=k(μe, μh)npAcceptor
Donor
+
E-Field
−
c.f. Bässler, PSSB 175, 15 (1993)
www.tu-chemnitz.de/physik/[email protected]
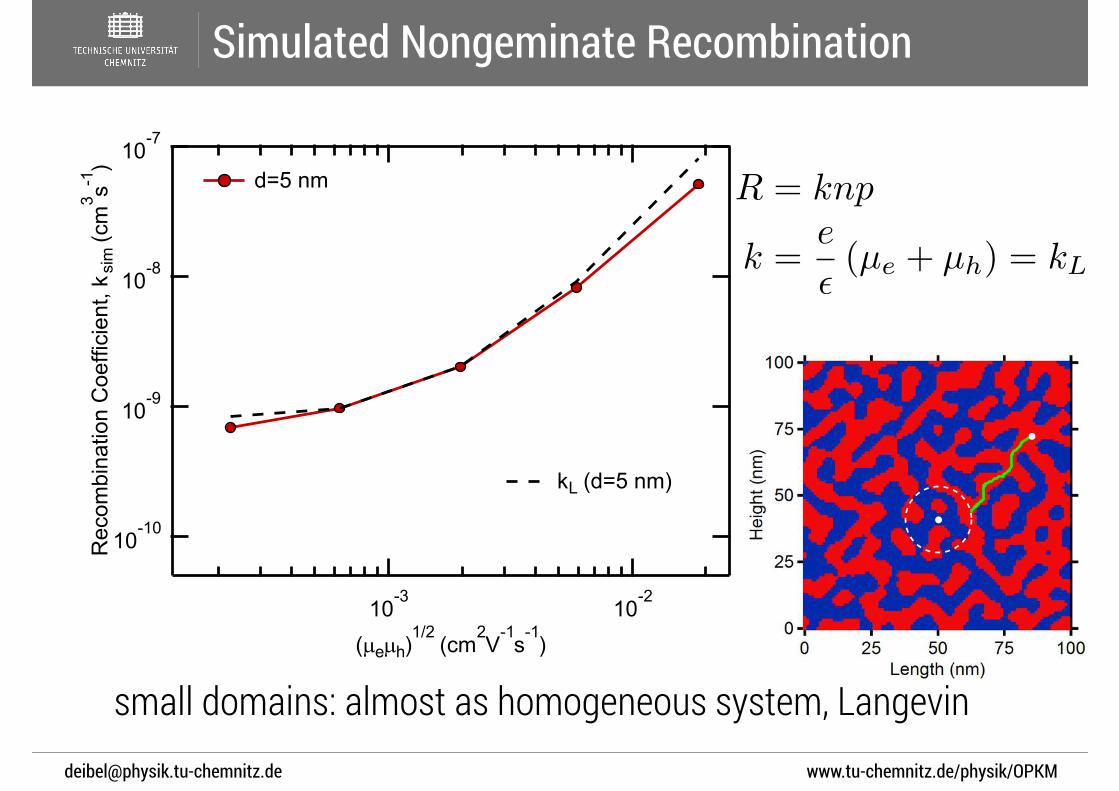
Simulated Nongeminate Recombination
small domains: almost as homogeneous system, Langevin
R = knp
k =e
✏(µe + µh) = kL
www.tu-chemnitz.de/physik/[email protected]
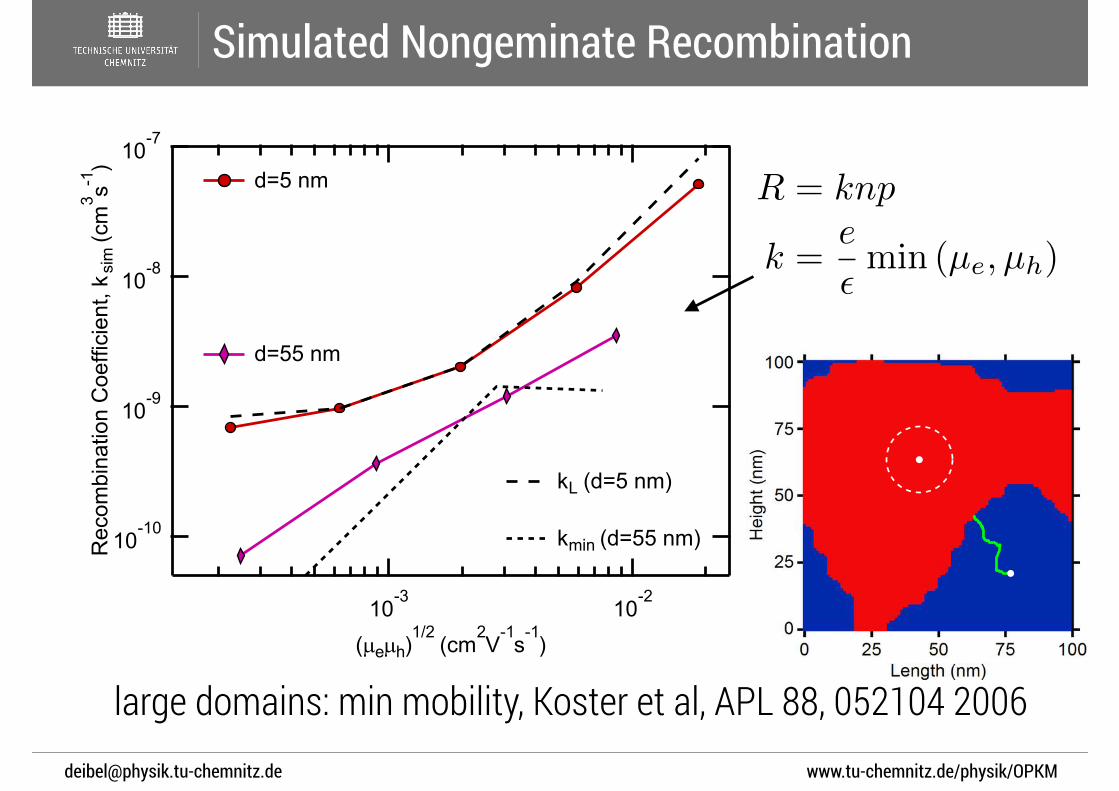
Simulated Nongeminate Recombination
large domains: min mobility, Koster et al, APL 88, 052104 ︎2006︎
R = knp
k =e
✏min (µe, µh)

www.tu-chemnitz.de/physik/[email protected]
Simulated Nongeminate Recombination
general case: „mix of both“!

www.tu-chemnitz.de/physik/[email protected]
Simulated Nongeminate Recombination
Result:
power law mean
R = knp
k =e
✏f1(d)2Mg(d) (µe, µh)
where Mg =
✓µge + µg
h
2
◆1/g
d (nm) f1 g Case
small domains < 5nm ≈ 1 1 arithmetic mean
typical case 10–35 0,5–1 0 geometric mean
large domains > 50nm < 0,5 -1 harmonic mean k /✓
1
µe+
1
µh
◆�1
k /✓µe + µh
2
◆
k / (µeµh)1/2
M. Heiber, V. Dyakonov, C. Baumbach, C. Deibel. Accepted by PRL (2015). arXiv:1503.02848

www.tu-chemnitz.de/physik/OPKMLHP15, Kloster Banz · 12. März 2015 · [email protected]
Intermediate Conclusions on Nongeminate Recombination
Charge carrier recombination in dependence of phase separation • most organic bulk heterojunction
solar cells: geometric mean of mobilitiesbetter approximation of nongeminate losses than Langevin’s arithmetic mean
• reduction factor partly explained for asymmetric mobilities
M. Heiber, V. Dyakonov, C. Baumbach, C. Deibel. PRL, accepted (2015). arXiv:1503.02848

www.tu-chemnitz.de/physik/[email protected]
Outline
photogeneration vs geminate recombination
experiment:
nongeminate recombination
simulation: effect of phase separation
radiative efficiency
experiment: perovskite photovoltaics
www.tu-chemnitz.de/physik/[email protected]
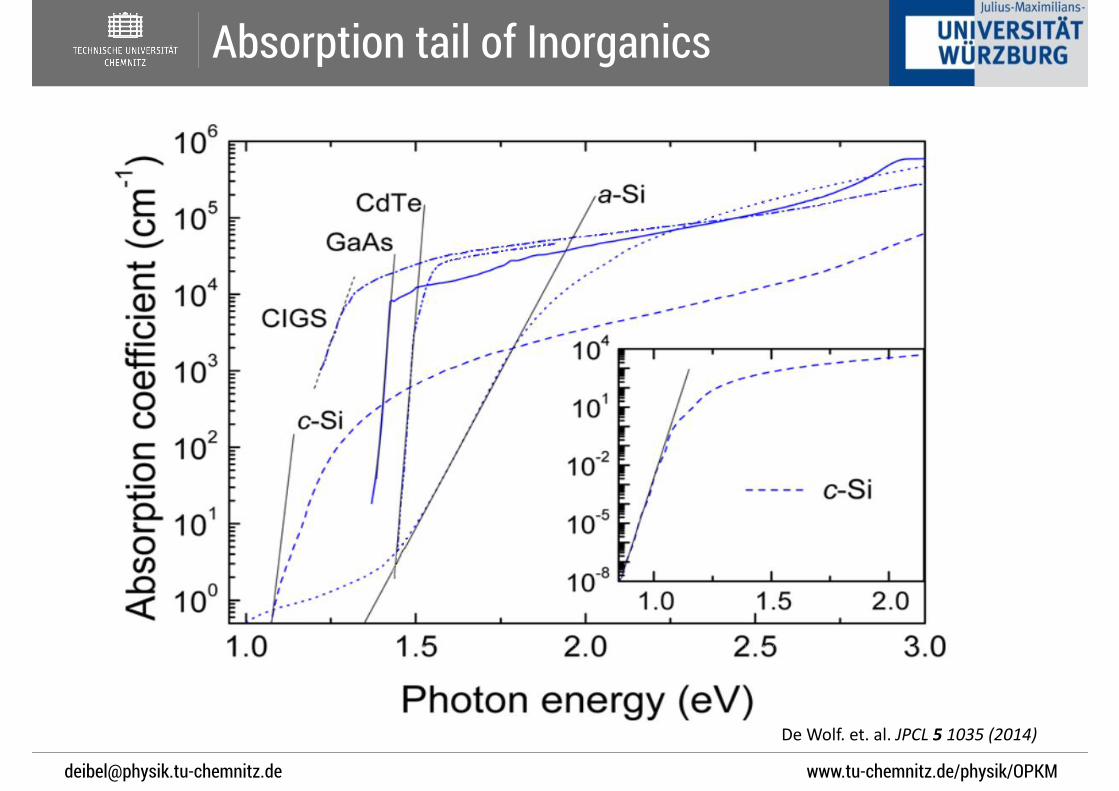
Absorption tail of Inorganics
De#Wolf.#et.#al.#JPCL%5%1035%(2014)%
www.tu-chemnitz.de/physik/[email protected]
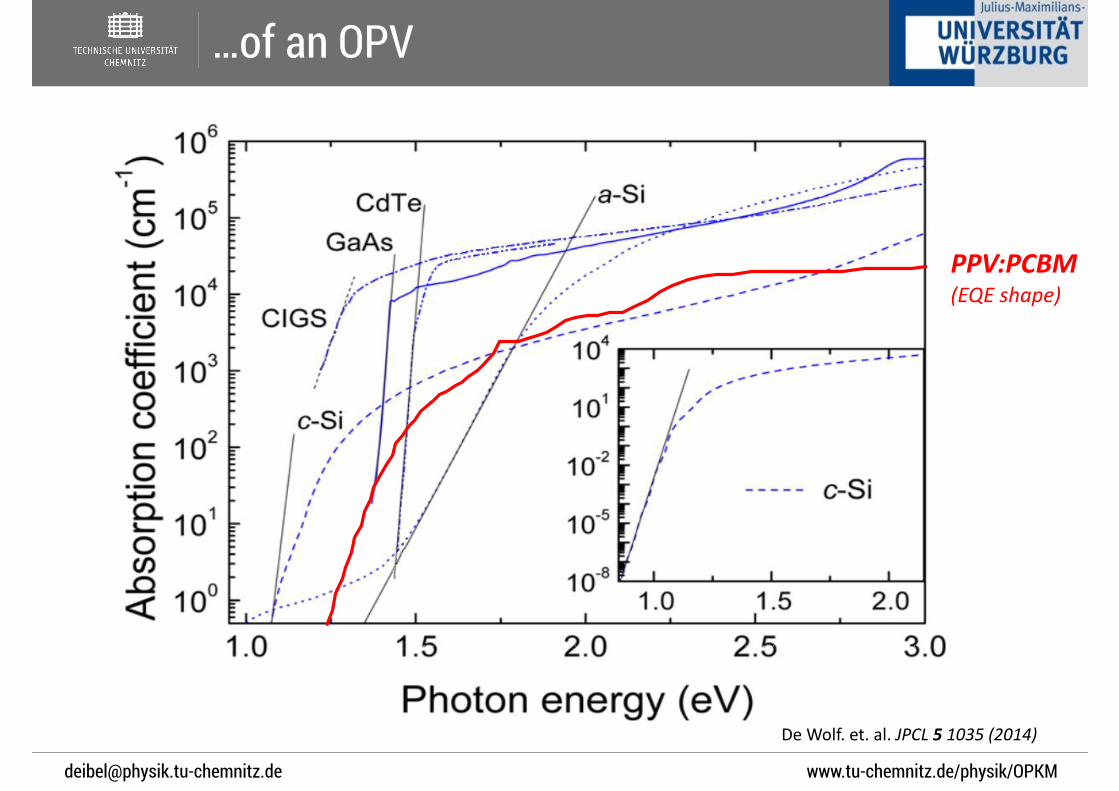
…of an OPV
De#Wolf.#et.#al.#JPCL%5%1035%(2014)%
PPV:PCBM((EQE%shape)

www.tu-chemnitz.de/physik/[email protected]
De#Wolf.#et.#al.#JPCL%5%1035%(2014)%EU=15#meV
…and a Perovskite
www.tu-chemnitz.de/physik/[email protected]
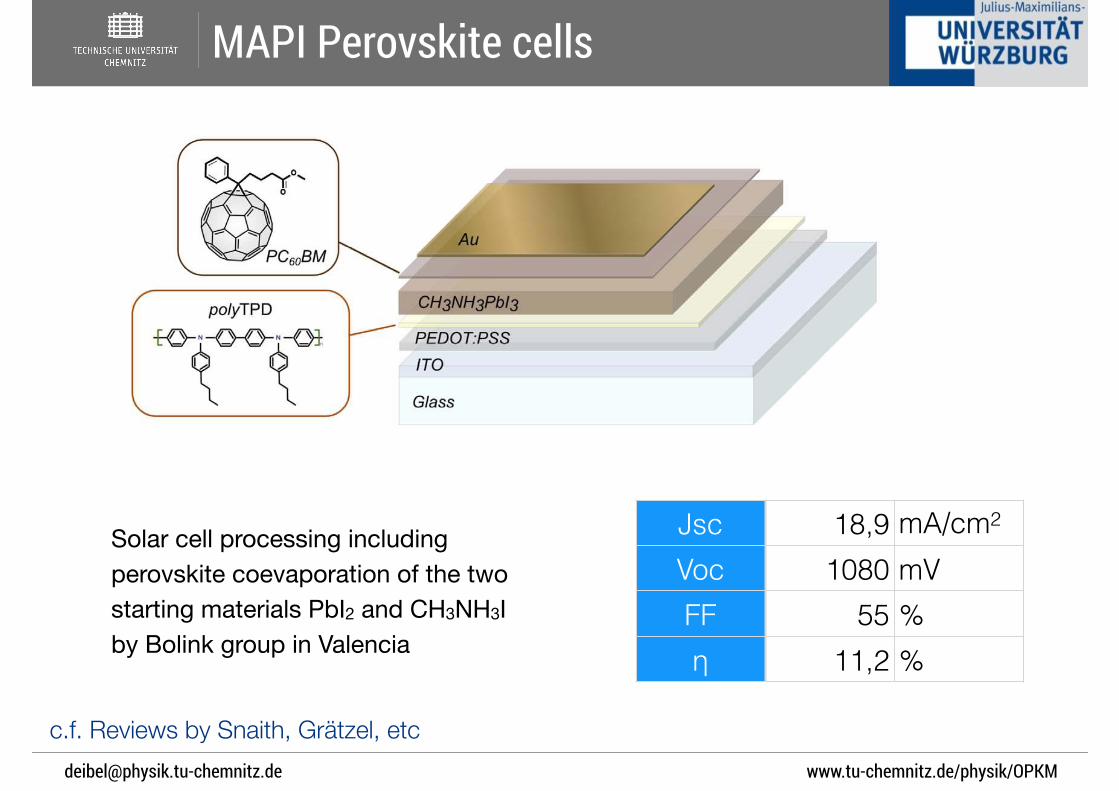
MAPI Perovskite cells
hence relates to the offset between band gap and open circuit voltagedefined by: Woc ; (Egap/q) – Voc.
A highly relevant figure of merit to compare different PV tech-nologies is therefore to determine how far they are from their respect-ive radiative upper limits8 and hence also what we focus on here. Thiscan be determined in two separate ways: A) One basically measuresthe EQEEL of the cell in absolute terms. This is performed by injectinga small forward current, as close as possible to the short circuitphotocurrent (determined under solar illumination) and then mea-sure how many photons are emitted from the device. The procedureis hence analog to measuring the efficiency of a LED close to the veryonset of emission. With the EQEEL determined and the device darksaturation current (J0), obtained from Eqn. 4, one can calculate thedark saturation current in the radiative limit (J0,Rad) via their simplerelation
J0,Rad~EQEEL:J0 ð6Þ
and then also the corresponding open circuit voltage in the radiativelimit (VOC,Rad). B) The second method to determine radiative effi-ciency relies on measuring the EQEPV(E) at the band edge and thencalculate J0,Rad via Eqn. 2. Since J0,Rad calculated this way is fullydetermined by the shape of the EQEPV(E) at very low energies andthe earth blackbody spectrum is such a strongly decreasing exponen-tial function, it is essential to measure the spectral shape of EQEPV(E)very accurately with high sensitivity to minimize measurement noisein the lowest energy regime. By rearranging Eqn. 5 one obtains:
EQEEL~eqVOC
kT : J0,Rad
JSC
! "ð7Þ
so that with a reliable value of J0,Rad available, one can instead cal-culate the radiative efficiency. Hence two methods are available andhere we have pursued both methods to verify their accuracy in deter-mining the radiative efficiency and as such we assess if the R.R.R. isvalid for the new perovskite based solar cells.
Devices. The device structures of the two types of solar cells used inthis study are shown schematically in Figure 2. We first emphasizethat the I–V characteristics of the fresh MAPI cells showed negligiblehysteresis, meaning that concerns related to voltage sweep directionand time dependence, could be safely disregarded22. Such depen-dencies would likely affect the illuminated and dark I–V sweeps
differently, and may therefore also invalidate the superpositionassumption in the R.R.R. A short circuit current of 189 A/m2, anopen circuit voltage of 1080 mV and a fill factor (FF) of 55% wereobtained for the MAPI cell. The OPV showed, as expected,substantially worse performance with a JSC limited to only 32 A/m2, a VOC of 830 mV and a FF of 51%.
Quantum efficiency of radiative recombination. The observedpeak position of electroluminescence from the MAPI cell is similarto that detected earlier by photoluminescence23 and is located at760 nm or 1.61 eV (Figure 3A) and the shape is independent ofthe injection current density. The very sharp peak with a full-width-at-half-maximum of only 81 meV indicates that the emis-sion comes from a narrow distribution of states likely located atthe band edge of this perovskite semiconductor24. The peak of theEL coincides with the location of the steep slope of the EQEPV(E)spectra, highlighting the complete absence of any Stokes shift in theMAPI material. Hence, the assumption that this MAPI structure is adirect band gap semiconductor with its band gap energy located atthe peak of EL emission is highly justified, but actually somewhat indisagreement with recent published values18,25,26 of the band gap ofMAPI cells. Those were obtained from diffuse reflectance spectro-scopy or UPS, and reported to be 1.50–1.57 eV. This implies thateither the earlier band gap determination is not fully justified, or thehere observed radiative recombination does not occur over the bandgap, but from higher lying electronic states, which we deem less likelyto occur. It must be pointed out that the absorptance andcorresponding EQEPV(E) spectra actually do extend to slightlylower energies than the peak position of the EL spectra, indicatingthat absorption does indeed occur slightly below the here determinedband gap from EL, also in our device.
A typical EL spectrum obtained by driving the perovskite cells at acurrent density similar to its JSC is depicted in Figure 3A, showing themeasured photon flux distribution (in eV) (black line). When thisflux distribution is integrated over all energies the total EL flux isobtained, which when divided with the injected current provides thevalue of the radiative efficiency EQEEL under solar flux charge carrierdensity.
Figure 3B shows the measured EQEPV(E) spectra, the spectraldistribution of the 300 K BB environment radiation, and thesought-after product of these two spectra. This spectrum, in accord-
Figure 2 | Device layout of the studied solar cells. (A) Perovskite (MAPI) and (B) Organic (MDMO-PPV:PCBM) cells.
www.nature.com/scientificreports
SCIENTIFIC REPORTS | 4 : 6071 | DOI: 10.1038/srep06071 3
Jsc 18,9 mA/cm2
Voc 1080 mVFF 55 %η 11,2 %
Solar cell processing including perovskite coevaporation of the two starting materials PbI2 and CH3NH3I by Bolink group in Valencia
c.f. Reviews by Snaith, Grätzel, etc

www.tu-chemnitz.de/physik/[email protected]
Photovoltaic Quantum Efficiency
1.5 2.0 2.5 3.0 3.5Energy (eV)
0.0
0.2
0.4
0.6
0.8
1.0 EQE PV
EQ
EP
V
normalised

www.tu-chemnitz.de/physik/[email protected]
and Emission (Electroluminescence)
1.5 2.0 2.5 3.0 3.50.0
5.0x10¹⁷
1.0x10¹⁸
1.5x10¹⁸
Energy (eV)
EQEEL=1.2E-4
Pho
ton
Flu
x nr
/(s*e
V*m
2 ) Emission Flux(Jinj=189 A/m2)
0.0
0.2
0.4
0.6
0.8
1.0 EQE PV
EQ
EP
V
Electroluminescence Yield = 0,012 % for Jinj = Jsc (1 sun)

www.tu-chemnitz.de/physik/[email protected]
Black Body Radiation: Sun and Sample
EQEPV (E) = EL(E)E�2exp
✓E
kT
◆Reciprocity: G. Kirchhoff (1860); P. Würfel (1982); U. Rau, PRB (2007)
SunEarth

www.tu-chemnitz.de/physik/[email protected]
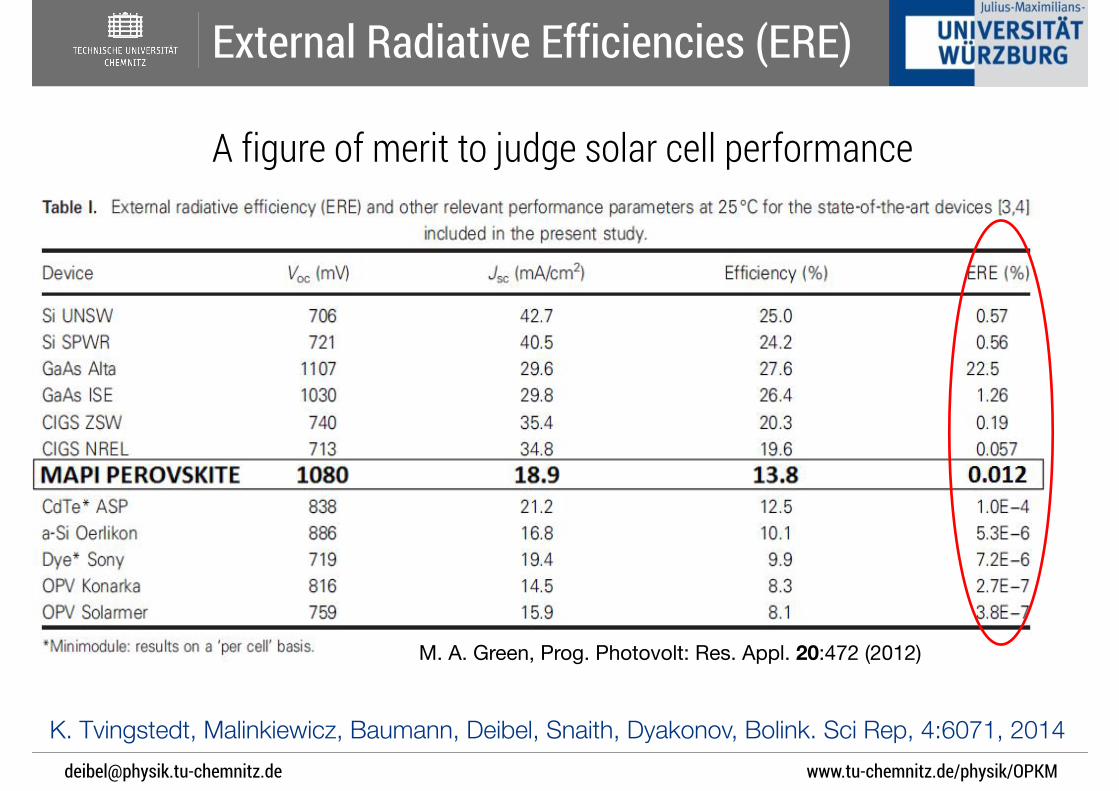
A figure of merit to judge solar cell performance.
External Radiative Efficiencies (ERE)
M. A. Green, Prog. Photovolt: Res. Appl. 20:472 (2012)
www.tu-chemnitz.de/physik/[email protected]
A figure of merit to judge solar cell performance
External Radiative Efficiencies (ERE)
K. Tvingstedt, Malinkiewicz, Baumann, Deibel, Snaith, Dyakonov, Bolink. Sci Rep, 4:6071, 2014
M. A. Green, Prog. Photovolt: Res. Appl. 20:472 (2012)

www.tu-chemnitz.de/physik/OPKMLHP15, Kloster Banz · 12. März 2015 · [email protected]
Intermediate Conclusions on Radiative Efficiency in Perov’SC
Perovskite Hybrid Solar Cells • steep absorption onset:
high degree of order • reciprocity fulfilled • EL yield: promising • voltage induced PL quenching:
dominantly free carriers
K. Tvingstedt, Malinkiewicz, Baumann, Deibel, Snaith, Dyakonov, Bolink. Sci Rep, 4:6071, 2014
hence relates to the offset between band gap and open circuit voltagedefined by: Woc ; (Egap/q) – Voc.
A highly relevant figure of merit to compare different PV tech-nologies is therefore to determine how far they are from their respect-ive radiative upper limits8 and hence also what we focus on here. Thiscan be determined in two separate ways: A) One basically measuresthe EQEEL of the cell in absolute terms. This is performed by injectinga small forward current, as close as possible to the short circuitphotocurrent (determined under solar illumination) and then mea-sure how many photons are emitted from the device. The procedureis hence analog to measuring the efficiency of a LED close to the veryonset of emission. With the EQEEL determined and the device darksaturation current (J0), obtained from Eqn. 4, one can calculate thedark saturation current in the radiative limit (J0,Rad) via their simplerelation
J0,Rad~EQEEL:J0 ð6Þ
and then also the corresponding open circuit voltage in the radiativelimit (VOC,Rad). B) The second method to determine radiative effi-ciency relies on measuring the EQEPV(E) at the band edge and thencalculate J0,Rad via Eqn. 2. Since J0,Rad calculated this way is fullydetermined by the shape of the EQEPV(E) at very low energies andthe earth blackbody spectrum is such a strongly decreasing exponen-tial function, it is essential to measure the spectral shape of EQEPV(E)very accurately with high sensitivity to minimize measurement noisein the lowest energy regime. By rearranging Eqn. 5 one obtains:
EQEEL~eqVOC
kT : J0,Rad
JSC
! "ð7Þ
so that with a reliable value of J0,Rad available, one can instead cal-culate the radiative efficiency. Hence two methods are available andhere we have pursued both methods to verify their accuracy in deter-mining the radiative efficiency and as such we assess if the R.R.R. isvalid for the new perovskite based solar cells.
Devices. The device structures of the two types of solar cells used inthis study are shown schematically in Figure 2. We first emphasizethat the I–V characteristics of the fresh MAPI cells showed negligiblehysteresis, meaning that concerns related to voltage sweep directionand time dependence, could be safely disregarded22. Such depen-dencies would likely affect the illuminated and dark I–V sweeps
differently, and may therefore also invalidate the superpositionassumption in the R.R.R. A short circuit current of 189 A/m2, anopen circuit voltage of 1080 mV and a fill factor (FF) of 55% wereobtained for the MAPI cell. The OPV showed, as expected,substantially worse performance with a JSC limited to only 32 A/m2, a VOC of 830 mV and a FF of 51%.
Quantum efficiency of radiative recombination. The observedpeak position of electroluminescence from the MAPI cell is similarto that detected earlier by photoluminescence23 and is located at760 nm or 1.61 eV (Figure 3A) and the shape is independent ofthe injection current density. The very sharp peak with a full-width-at-half-maximum of only 81 meV indicates that the emis-sion comes from a narrow distribution of states likely located atthe band edge of this perovskite semiconductor24. The peak of theEL coincides with the location of the steep slope of the EQEPV(E)spectra, highlighting the complete absence of any Stokes shift in theMAPI material. Hence, the assumption that this MAPI structure is adirect band gap semiconductor with its band gap energy located atthe peak of EL emission is highly justified, but actually somewhat indisagreement with recent published values18,25,26 of the band gap ofMAPI cells. Those were obtained from diffuse reflectance spectro-scopy or UPS, and reported to be 1.50–1.57 eV. This implies thateither the earlier band gap determination is not fully justified, or thehere observed radiative recombination does not occur over the bandgap, but from higher lying electronic states, which we deem less likelyto occur. It must be pointed out that the absorptance andcorresponding EQEPV(E) spectra actually do extend to slightlylower energies than the peak position of the EL spectra, indicatingthat absorption does indeed occur slightly below the here determinedband gap from EL, also in our device.
A typical EL spectrum obtained by driving the perovskite cells at acurrent density similar to its JSC is depicted in Figure 3A, showing themeasured photon flux distribution (in eV) (black line). When thisflux distribution is integrated over all energies the total EL flux isobtained, which when divided with the injected current provides thevalue of the radiative efficiency EQEEL under solar flux charge carrierdensity.
Figure 3B shows the measured EQEPV(E) spectra, the spectraldistribution of the 300 K BB environment radiation, and thesought-after product of these two spectra. This spectrum, in accord-
Figure 2 | Device layout of the studied solar cells. (A) Perovskite (MAPI) and (B) Organic (MDMO-PPV:PCBM) cells.
www.nature.com/scientificreports
SCIENTIFIC REPORTS | 4 : 6071 | DOI: 10.1038/srep06071 3

www.tu-chemnitz.de/physik/OPKMLHP15, Kloster Banz · 12. März 2015 · [email protected]
Acknowledgments…
Andreas Zusan Michael Heiber → Kristofer Tvingstedt Alexander Wagenpfahl → Alexander Förtig Jens Pflaum Vladimir Dyakonov
Martin Heeney
Koen Vandewal (→TUD) Alberto Salleo
Juliane Kniepert Thomas Brenner Dieter Neher
Arved HüblerBystrik TrnovecTino Zillger et al.