Functions...3.1 Lesson relation, p. 104 function, p. 104 domain, p. 106 range, p. 106 independent...
8
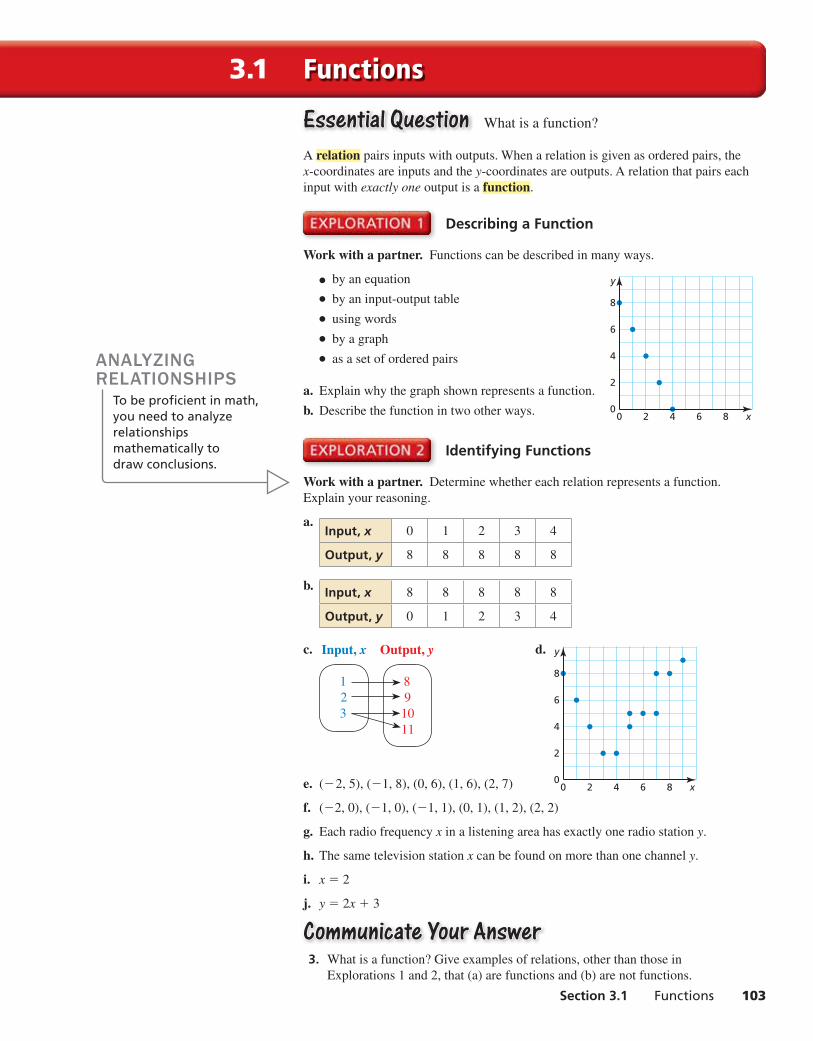
Section 3.1 Functions 103 Functions 3.1 Essential Question Essential Question What is a function? A relation pairs inputs with outputs. When a relation is given as ordered pairs, the x-coordinates are inputs and the y-coordinates are outputs. A relation that pairs each input with exactly one output is a function. Describing a Function Work with a partner. Functions can be described in many ways. ● by an equation ● by an input-output table ● using words ● by a graph ● as a set of ordered pairs a. Explain why the graph shown represents a function. b. Describe the function in two other ways. Identifying Functions Work with a partner. Determine whether each relation represents a function. Explain your reasoning. a. Input, x 0 1 2 3 4 Output, y 8 8 8 8 8 b. Input, x 8 8 8 8 8 Output, y 0 1 2 3 4 c. 8 9 10 11 1 2 3 Input, x Output, y d. 4 2 0 8 6 4 2 0 8 6 x y e. (−2, 5), (−1, 8), (0, 6), (1, 6), (2, 7) f. (−2, 0), (−1, 0), (−1, 1), (0, 1), (1, 2), (2, 2) g. Each radio frequency x in a listening area has exactly one radio station y. h. The same television station x can be found on more than one channel y. i. x = 2 j. y = 2x + 3 Communicate Your Answer Communicate Your Answer 3. What is a function? Give examples of relations, other than those in Explorations 1 and 2, that (a) are functions and (b) are not functions. ANALYZING RELATIONSHIPS To be proficient in math, you need to analyze relationships mathematically to draw conclusions. x y 4 2 0 8 6 4 2 0 8 6
Transcript of Functions...3.1 Lesson relation, p. 104 function, p. 104 domain, p. 106 range, p. 106 independent...
Section 3.1 Functions 103
Functions3.1
Essential QuestionEssential Question What is a function?
A relation pairs inputs with outputs. When a relation is given as ordered pairs, the
x-coordinates are inputs and the y-coordinates are outputs. A relation that pairs each
input with exactly one output is a function.
Describing a Function
Work with a partner. Functions can be described in many ways.
● by an equation
● by an input-output table
● using words
● by a graph
● as a set of ordered pairs
a. Explain why the graph shown represents a function.
b. Describe the function in two other ways.
Identifying Functions
Work with a partner. Determine whether each relation represents a function.
Explain your reasoning.
a. Input, x 0 1 2 3 4
Output, y 8 8 8 8 8
b. Input, x 8 8 8 8 8
Output, y 0 1 2 3 4
c.
8
9
10
11
1
2
3
Input, x Output, y d.
4
2
0
8
6
420 86 x
y
e. (− 2, 5), (−1, 8), (0, 6), (1, 6), (2, 7)
f. (−2, 0), (−1, 0), (−1, 1), (0, 1), (1, 2), (2, 2)
g. Each radio frequency x in a listening area has exactly one radio station y.
h. The same television station x can be found on more than one channel y.
i. x = 2
j. y = 2x + 3
Communicate Your AnswerCommunicate Your Answer 3. What is a function? Give examples of relations, other than those in
Explorations 1 and 2, that (a) are functions and (b) are not functions.
ANALYZING RELATIONSHIPS
To be profi cient in math, you need to analyze relationships mathematically to draw conclusions.
x
y
4
2
0
8
6
420 86
hsnb_alg1_pe_0301.indd 103hsnb_alg1_pe_0301.indd 103 2/4/15 3:38 PM2/4/15 3:38 PM

104 Chapter 3 Graphing Linear Functions
3.1 Lesson
relation, p. 104function, p. 104domain, p. 106range, p. 106independent variable, p. 107dependent variable, p. 107
Previousordered pairmapping diagram
Core VocabularyCore Vocabullarry
What You Will LearnWhat You Will Learn Determine whether relations are functions.
Find the domain and range of a function.
Identify the independent and dependent variables of functions.
Determining Whether Relations Are FunctionsA relation pairs inputs with outputs. When a relation is given as ordered pairs, the
x-coordinates are inputs and the y-coordinates are outputs. A relation that pairs each
input with exactly one output is a function.
Determining Whether Relations Are Functions
Determine whether each relation is a function. Explain.
a. (−2, 2), (−1, 2), (0, 2), (1, 0), (2, 0)
b. (4, 0), (8, 7), (6, 4), (4, 3), (5, 2)
c. Input, x −2 −1 0 0 1 2
Output, y 3 4 5 6 7 8
d.
4
15
−1
3
11
Input, x Output, y
SOLUTION
a. Every input has exactly one output.
So, the relation is a function.
b. The input 4 has two outputs, 0 and 3.
So, the relation is not a function.
c. The input 0 has two outputs, 5 and 6.
So, the relation is not a function.
d. Every input has exactly one output.
So, the relation is a function.
Monitoring ProgressMonitoring Progress Help in English and Spanish at BigIdeasMath.com
Determine whether the relation is a function. Explain.
1. (−5, 0), (0, 0), (5, 0), (5, 10) 2. (−4, 8), (−1, 2), (2, −4), (5, −10)
3. Input, x Output, y
2 2.6
4 5.2
6 7.8
4.
−2
0
4
1 —
2
Input, x Output, y
REMEMBERA relation can be represented by a mapping diagram.
hsnb_alg1_pe_0301.indd 104hsnb_alg1_pe_0301.indd 104 2/4/15 3:38 PM2/4/15 3:38 PM

Section 3.1 Functions 105
Core Core ConceptConceptVertical Line TestWords A graph represents a function when no vertical line passes through more
than one point on the graph.
Examples Function Not a function
x
y
x
y
Using the Vertical Line Test
Determine whether each graph represents a function. Explain.
a.
x
y
4
2
0420 6
b.
4
2
0420 6 x
y
SOLUTION
a. You can draw a vertical line through
(2, 2) and (2, 5).
b. No vertical line can be drawn through
more than one point on the graph.
So, the graph does not represent a function.
So, the graph represents
a function.
Monitoring ProgressMonitoring Progress Help in English and Spanish at BigIdeasMath.com
Determine whether the graph represents a function. Explain.
5.
x
y
4
2
0
6
420 6
6.
x
y
4
2
0
6
420 6
7.
x
y
4
2
0
6
420 6
8.
x
y
4
2
0
6
420 6
hsnb_alg1_pe_0301.indd 105hsnb_alg1_pe_0301.indd 105 2/4/15 3:38 PM2/4/15 3:38 PM
106 Chapter 3 Graphing Linear Functions
Finding the Domain and Range of a Function
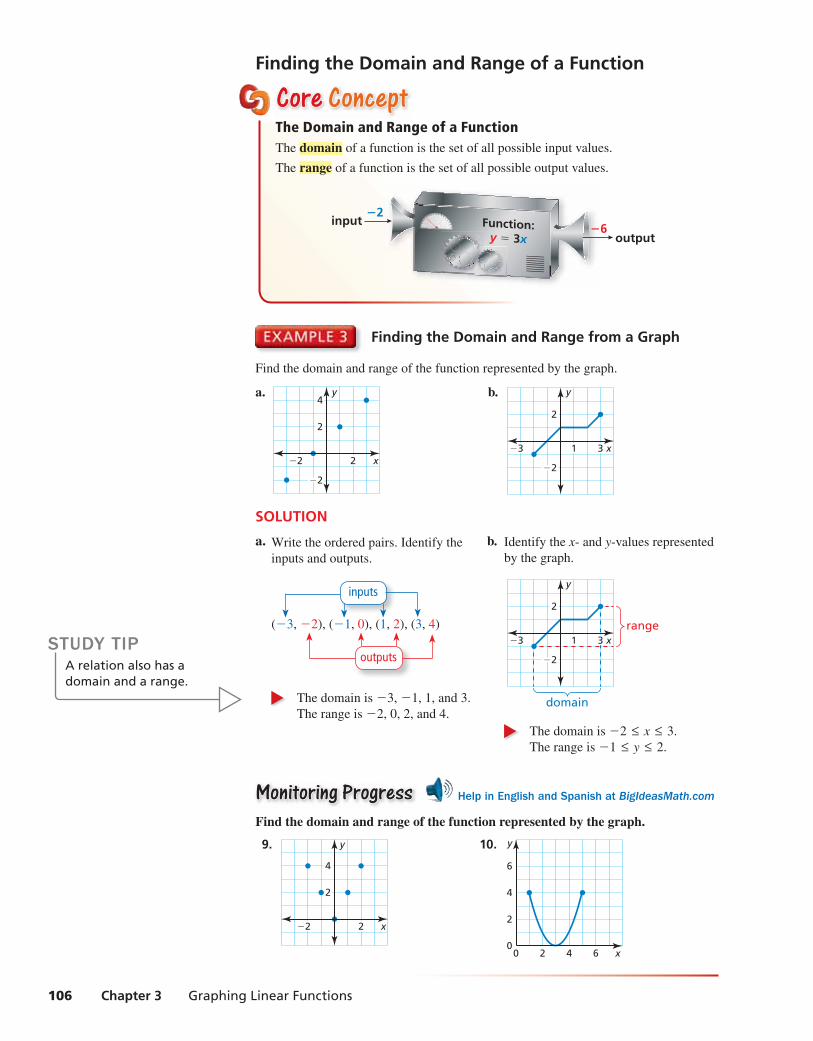
Core Core ConceptConceptThe Domain and Range of a FunctionThe domain of a function is the set of all possible input values.
The range of a function is the set of all possible output values.
input−2
output−6
Finding the Domain and Range from a Graph
Find the domain and range of the function represented by the graph.
a.
x
y4
2
−2
2−2
b.
x
y
2
−2
31−3
SOLUTION
a. Write the ordered pairs. Identify the
inputs and outputs.
b. Identify the x- and y-values represented
by the graph.
(−3, −2), (−1, 0), (1, 2), (3, 4)
inputs
outputs
x
y
2
−2
1−3 3range
domain The domain is −3, −1, 1, and 3.
The range is −2, 0, 2, and 4.
The domain is −2 ≤ x ≤ 3.
The range is −1 ≤ y ≤ 2.
Monitoring ProgressMonitoring Progress Help in English and Spanish at BigIdeasMath.com
Find the domain and range of the function represented by the graph.
9.
x
y
4
2
2−2
10.
x
y
4
2
0
6
420 6
STUDY TIPA relation also has a domain and a range.
hsnb_alg1_pe_0301.indd 106hsnb_alg1_pe_0301.indd 106 2/4/15 3:38 PM2/4/15 3:38 PM
Section 3.1 Functions 107
Identifying Independent and Dependent VariablesThe variable that represents the input values of a function is the independent variablebecause it can be any value in the domain. The variable that represents the output
values of a function is the dependent variable because it depends on the value of the
independent variable. When an equation represents a function, the dependent variable
is defi ned in terms of the independent variable. The statement “y is a function of x”
means that y varies depending on the value of x.
y = −x + 10
dependent variable, y independent variable, x
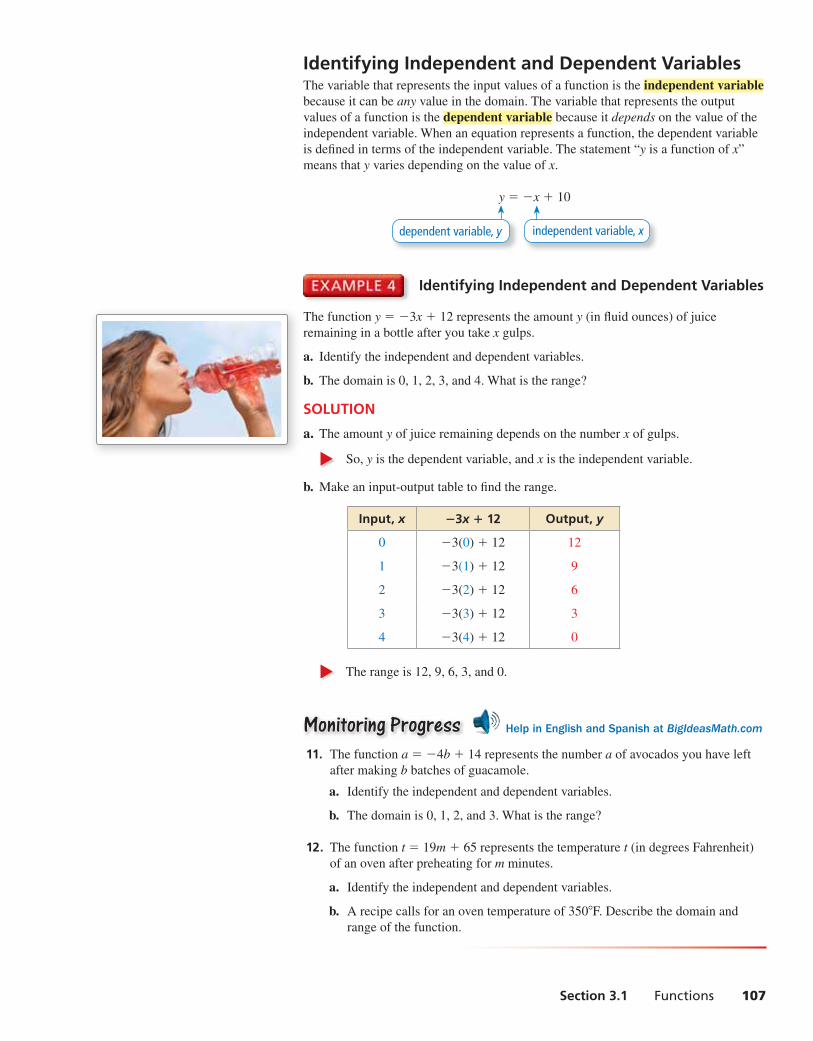
Identifying Independent and Dependent Variables
The function y = −3x + 12 represents the amount y (in fl uid ounces) of juice
remaining in a bottle after you take x gulps.
a. Identify the independent and dependent variables.
b. The domain is 0, 1, 2, 3, and 4. What is the range?
SOLUTION
a. The amount y of juice remaining depends on the number x of gulps.
So, y is the dependent variable, and x is the independent variable.
b. Make an input-output table to fi nd the range.
Input, x −3x + 12 Output, y
0 −3(0) + 12 12
1 −3(1) + 12 9
2 −3(2) + 12 6
3 −3(3) + 12 3
4 −3(4) + 12 0
The range is 12, 9, 6, 3, and 0.
Monitoring ProgressMonitoring Progress Help in English and Spanish at BigIdeasMath.com
11. The function a = −4b + 14 represents the number a of avocados you have left
after making b batches of guacamole.
a. Identify the independent and dependent variables.
b. The domain is 0, 1, 2, and 3. What is the range?
12. The function t = 19m + 65 represents the temperature t (in degrees Fahrenheit)
of an oven after preheating for m minutes.
a. Identify the independent and dependent variables.
b. A recipe calls for an oven temperature of 350°F. Describe the domain and
range of the function.
hsnb_alg1_pe_0301.indd 107hsnb_alg1_pe_0301.indd 107 2/4/15 3:38 PM2/4/15 3:38 PM
108 Chapter 3 Graphing Linear Functions
Exercises3.1
Monitoring Progress and Modeling with MathematicsMonitoring Progress and Modeling with Mathematics
Dynamic Solutions available at BigIdeasMath.com
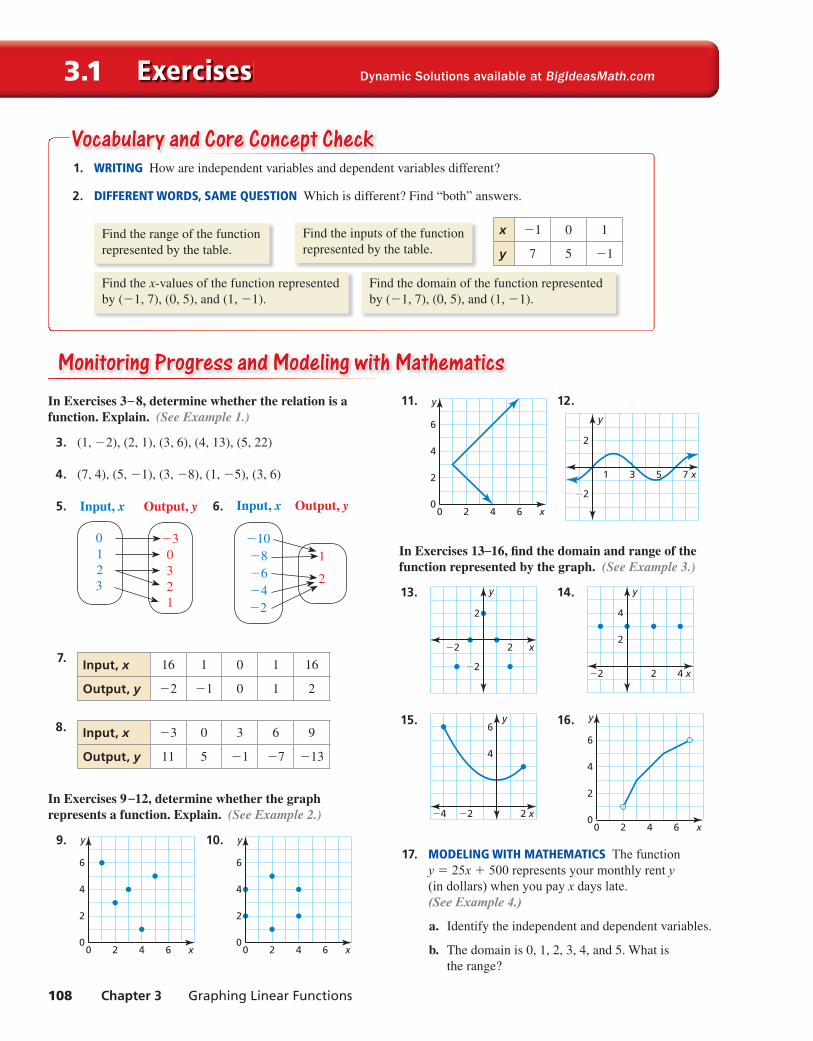
In Exercises 3– 8, determine whether the relation is a function. Explain. (See Example 1.)
3. (1, −2), (2, 1), (3, 6), (4, 13), (5, 22)
4. (7, 4), (5, −1), (3, −8), (1, −5), (3, 6)
5.
−3
0
3
2
1
0
1
2
3
Input, x Output, y 6.
1
2
−10
−8
−6
−4
−2
Input, x Output, y
7. Input, x 16 1 0 1 16
Output, y −2 −1 0 1 2
8. Input, x −3 0 3 6 9
Output, y 11 5 −1 −7 −13
In Exercises 9–12, determine whether the graph represents a function. Explain. (See Example 2.)
9.
x
y
4
2
0
6
420 6
10.
4
2
0
6
420 6 x
y
11.
4
2
0
6
420 6 x
y 12.
x
y
2
−2
31 75
In Exercises 13–16, fi nd the domain and range of the function represented by the graph. (See Example 3.)
13.
x
y
2
−2
2−2
14.
x
y
4
2
42−2
15.
x
y
4
6
2−2−4
16.
4
2
0
6
420 6 x
y
17. MODELING WITH MATHEMATICS The function y = 25x + 500 represents your monthly rent y (in dollars) when you pay x days late. (See Example 4.)
a. Identify the independent and dependent variables.
b. The domain is 0, 1, 2, 3, 4, and 5. What is
the range?
1. WRITING How are independent variables and dependent variables different?
2. DIFFERENT WORDS, SAME QUESTION Which is different? Find “both” answers.
Find the range of the function
represented by the table.
Find the inputs of the function
represented by the table.
Find the x-values of the function represented
by (−1, 7), (0, 5), and (1, −1).
Find the domain of the function represented
by (−1, 7), (0, 5), and (1, −1).
x −1 0 1
y 7 5 −1
Vocabulary and Core Concept Checkpppp
hsnb_alg1_pe_0301.indd 108hsnb_alg1_pe_0301.indd 108 2/4/15 3:38 PM2/4/15 3:38 PM
Section 3.1 Functions 109
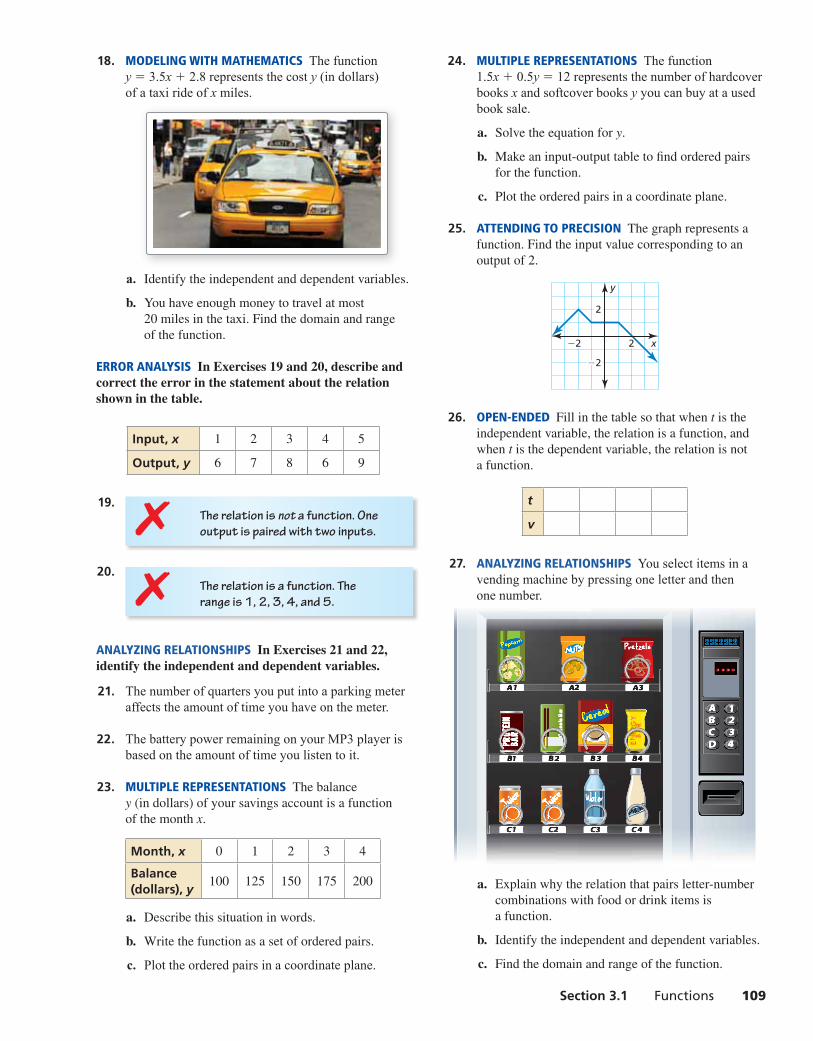
18. MODELING WITH MATHEMATICS The function y = 3.5x + 2.8 represents the cost y (in dollars) of a taxi ride of x miles.
a. Identify the independent and dependent variables.
b. You have enough money to travel at most
20 miles in the taxi. Find the domain and range
of the function.
ERROR ANALYSIS In Exercises 19 and 20, describe and correct the error in the statement about the relation shown in the table.
Input, x 1 2 3 4 5
Output, y 6 7 8 6 9
19. The relation is not a function. One
output is paired with two inputs.✗ 20.
The relation is a function. The
range is 1, 2, 3, 4, and 5.✗ANALYZING RELATIONSHIPS In Exercises 21 and 22, identify the independent and dependent variables.
21. The number of quarters you put into a parking meter affects the amount of time you have on the meter.
22. The battery power remaining on your MP3 player is based on the amount of time you listen to it.
23. MULTIPLE REPRESENTATIONS The balance
y (in dollars) of your savings account is a function
of the month x.
Month, x 0 1 2 3 4
Balance (dollars), y
100 125 150 175 200
a. Describe this situation in words.
b. Write the function as a set of ordered pairs.
c. Plot the ordered pairs in a coordinate plane.
24. MULTIPLE REPRESENTATIONS The function 1.5x + 0.5y = 12 represents the number of hardcover books x and softcover books y you can buy at a used book sale.
a. Solve the equation for y.
b. Make an input-output table to fi nd ordered pairs
for the function.
c. Plot the ordered pairs in a coordinate plane.
25. ATTENDING TO PRECISION The graph represents a
function. Find the input value corresponding to an
output of 2.
x
y
2
−2
2−2
26. OPEN-ENDED Fill in the table so that when t is the
independent variable, the relation is a function, and
when t is the dependent variable, the relation is not
a function.
t
v
27. ANALYZING RELATIONSHIPS You select items in a vending machine by pressing one letter and then one number.
a. Explain why the relation that pairs letter-number
combinations with food or drink items is
a function.
b. Identify the independent and dependent variables.
c. Find the domain and range of the function.
hsnb_alg1_pe_0301.indd 109hsnb_alg1_pe_0301.indd 109 2/4/15 3:38 PM2/4/15 3:38 PM
110 Chapter 3 Graphing Linear Functions
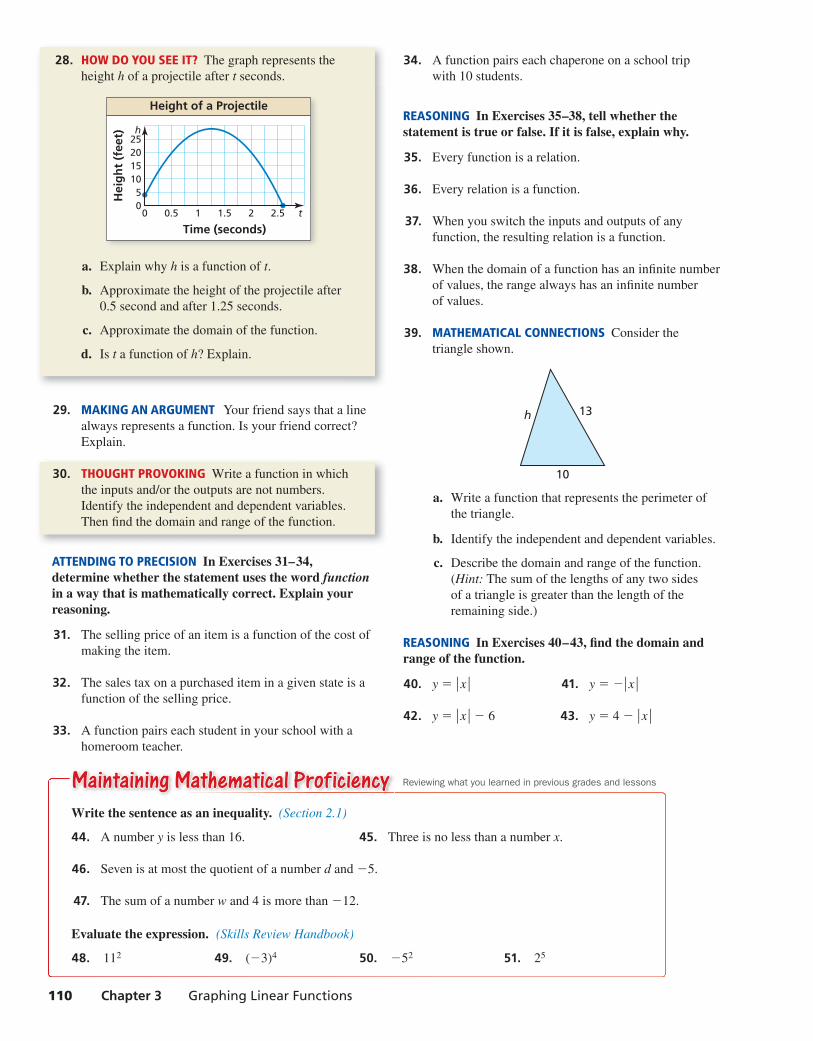
28. HOW DO YOU SEE IT? The graph represents the
height h of a projectile after t seconds.
Height of a ProjectileH
eig
ht
(fee
t)
05
10152025h
Time (seconds)0.50 1 1.5 2 2.5 t
a. Explain why h is a function of t.
b. Approximate the height of the projectile after
0.5 second and after 1.25 seconds.
c. Approximate the domain of the function.
d. Is t a function of h? Explain.
29. MAKING AN ARGUMENT Your friend says that a line
always represents a function. Is your friend correct?
Explain.
30. THOUGHT PROVOKING Write a function in which
the inputs and/or the outputs are not numbers.
Identify the independent and dependent variables.
Then fi nd the domain and range of the function.
ATTENDING TO PRECISION In Exercises 31–34, determine whether the statement uses the word function in a way that is mathematically correct. Explain your reasoning.
31. The selling price of an item is a function of the cost of
making the item.
32. The sales tax on a purchased item in a given state is a
function of the selling price.
33. A function pairs each student in your school with a
homeroom teacher.
34. A function pairs each chaperone on a school trip
with 10 students.
REASONING In Exercises 35–38, tell whether the statement is true or false. If it is false, explain why.
35. Every function is a relation.
36. Every relation is a function.
37. When you switch the inputs and outputs of any
function, the resulting relation is a function.
38. When the domain of a function has an infi nite number
of values, the range always has an infi nite number
of values.
39. MATHEMATICAL CONNECTIONS Consider the
triangle shown.
10
13h
a. Write a function that represents the perimeter of
the triangle.
b. Identify the independent and dependent variables.
c. Describe the domain and range of the function.
(Hint: The sum of the lengths of any two sides
of a triangle is greater than the length of the
remaining side.)
REASONING In Exercises 40–43, fi nd the domain and range of the function.
40. y = ∣ x ∣ 41. y = − ∣ x ∣
42. y = ∣ x ∣ − 6 43. y = 4 − ∣ x ∣
Maintaining Mathematical ProficiencyMaintaining Mathematical ProficiencyWrite the sentence as an inequality. (Section 2.1)
44. A number y is less than 16. 45. Three is no less than a number x.
46. Seven is at most the quotient of a number d and −5.
47. The sum of a number w and 4 is more than −12.
Evaluate the expression. (Skills Review Handbook)
48. 112 49. (−3)4 50. −52 51. 25
Reviewing what you learned in previous grades and lessons
hsnb_alg1_pe_0301.indd 110hsnb_alg1_pe_0301.indd 110 2/4/15 3:39 PM2/4/15 3:39 PM