Functionally-focused algorithmic analysis of high ... by the Health Sciences Center (HSC) and Kuwait...
23
RESEARCH ARTICLE Functionally-focused algorithmic analysis of high resolution microarray-CGH genomic landscapes demonstrates comparable genomic copy number aberrations in MSI and MSS sporadic colorectal cancer Hamad Ali 1,2 *, Milad S. Bitar 2,3 , Ashraf Al Madhoun 2 , Makia Marafie 4 , Fahd Al-Mulla 5,6 * 1 Department of Medical Laboratory Sciences, Faculty of Allied Health Sciences, Kuwait University, Jabriya, Kuwait, 2 Research Division, Immunology Unit, Dasman Diabetes Institute (DDI), Dasman, Kuwait, 3 Department of Pharmacology & Toxicology, Faculty of Medicine, Kuwait University, Jabriya, Kuwait, 4 Kuwait Medical Genetics Center, Kuwait City, Kuwait, 5 Molecular Pathology Unit, Department of Pathology, Faculty of Medicine, Kuwait University, Jabriya, Kuwait, 6 Research Division, Genomics Unit, Dasman Diabetes Institute (DDI), Dasman, Kuwait * [email protected] (HA); [email protected] (FA) Abstract Array-based comparative genomic hybridization (aCGH) emerged as a powerful technology for studying copy number variations at higher resolution in many cancers including colorec- tal cancer. However, the lack of standardized systematic protocols including bioinformatic algorithms to obtain and analyze genomic data resulted in significant variation in the re- ported copy number aberration (CNA) data. Here, we present genomic aCGH data obtained using highly stringent and functionally relevant statistical algorithms from 116 well-defined microsatellites instable (MSI) and microsatellite stable (MSS) colorectal cancers. We utilized aCGH to characterize genomic CNAs in 116 well-defined sets of colorectal cancer (CRC) cases. We further applied the significance testing for aberrant copy number (STAC) and Genomic Identification of Significant Targets in Cancer (GISTIC) algorithms to identify func- tionally relevant (nonrandom) chromosomal aberrations in the analyzed colorectal cancer samples. Our results produced high resolution genomic landscapes of both, MSI and MSS sporadic CRC. We found that CNAs in MSI and MSS CRCs are heterogeneous in nature but may be divided into 3 distinct genomic patterns. Moreover, we show that although CNAs in MSI and MSS CRCs differ with respect to their size, number and chromosomal distribu- tion, the functional copy number aberrations obtained from MSI and MSS CRCs were in fact comparable but not identical. These unifying CNAs were verified by MLPA tumor-loss gene panel, which spans 15 different chromosomal locations and contains 50 probes for at least 20 tumor suppressor genes. Consistently, deletion/amplification in these frequently cancer altered genes were identical in MSS and MSI CRCs. Our results suggest that MSI and MSS copy number aberrations driving CRC may be functionally comparable. PLOS ONE | DOI:10.1371/journal.pone.0171690 February 23, 2017 1 / 23 a1111111111 a1111111111 a1111111111 a1111111111 a1111111111 OPEN ACCESS Citation: Ali H, Bitar MS, Al Madhoun A, Marafie M, Al-Mulla F (2017) Functionally-focused algorithmic analysis of high resolution microarray-CGH genomic landscapes demonstrates comparable genomic copy number aberrations in MSI and MSS sporadic colorectal cancer. PLoS ONE 12(2): e0171690. doi:10.1371/journal.pone.0171690 Editor: Hassan Brim, Howard University, UNITED STATES Received: July 31, 2016 Accepted: January 23, 2017 Published: February 23, 2017 Copyright: © 2017 Ali et al. This is an open access article distributed under the terms of the Creative Commons Attribution License, which permits unrestricted use, distribution, and reproduction in any medium, provided the original author and source are credited. Data Availability Statement: All relevant data are within the manuscript. Funding: This work was supported by grant number 2011-1302-06, given to Prof. Fahd Al- Mulla by the Kuwait Foundation for the Advancement of Sciences KFAS (www.kfas.org). The funders had no role in study design, data collection and analysis, decision to publish, or preparation of the manuscript.
Transcript of Functionally-focused algorithmic analysis of high ... by the Health Sciences Center (HSC) and Kuwait...
RESEARCH ARTICLE
Functionally-focused algorithmic analysis of
high resolution microarray-CGH genomic
landscapes demonstrates comparable
genomic copy number aberrations in MSI and
MSS sporadic colorectal cancer
Hamad Ali1,2*, Milad S. Bitar2,3, Ashraf Al Madhoun2, Makia Marafie4, Fahd Al-Mulla5,6*
1 Department of Medical Laboratory Sciences, Faculty of Allied Health Sciences, Kuwait University, Jabriya,
Kuwait, 2 Research Division, Immunology Unit, Dasman Diabetes Institute (DDI), Dasman, Kuwait,
3 Department of Pharmacology & Toxicology, Faculty of Medicine, Kuwait University, Jabriya, Kuwait,
4 Kuwait Medical Genetics Center, Kuwait City, Kuwait, 5 Molecular Pathology Unit, Department of
Pathology, Faculty of Medicine, Kuwait University, Jabriya, Kuwait, 6 Research Division, Genomics Unit,
Dasman Diabetes Institute (DDI), Dasman, Kuwait
* [email protected] (HA); [email protected] (FA)
Abstract
Array-based comparative genomic hybridization (aCGH) emerged as a powerful technology
for studying copy number variations at higher resolution in many cancers including colorec-
tal cancer. However, the lack of standardized systematic protocols including bioinformatic
algorithms to obtain and analyze genomic data resulted in significant variation in the re-
ported copy number aberration (CNA) data. Here, we present genomic aCGH data obtained
using highly stringent and functionally relevant statistical algorithms from 116 well-defined
microsatellites instable (MSI) and microsatellite stable (MSS) colorectal cancers. We utilized
aCGH to characterize genomic CNAs in 116 well-defined sets of colorectal cancer (CRC)
cases. We further applied the significance testing for aberrant copy number (STAC) and
Genomic Identification of Significant Targets in Cancer (GISTIC) algorithms to identify func-
tionally relevant (nonrandom) chromosomal aberrations in the analyzed colorectal cancer
samples. Our results produced high resolution genomic landscapes of both, MSI and MSS
sporadic CRC. We found that CNAs in MSI and MSS CRCs are heterogeneous in nature
but may be divided into 3 distinct genomic patterns. Moreover, we show that although CNAs
in MSI and MSS CRCs differ with respect to their size, number and chromosomal distribu-
tion, the functional copy number aberrations obtained from MSI and MSS CRCs were in fact
comparable but not identical. These unifying CNAs were verified by MLPA tumor-loss gene
panel, which spans 15 different chromosomal locations and contains 50 probes for at least
20 tumor suppressor genes. Consistently, deletion/amplification in these frequently cancer
altered genes were identical in MSS and MSI CRCs. Our results suggest that MSI and MSS
copy number aberrations driving CRC may be functionally comparable.
PLOS ONE | DOI:10.1371/journal.pone.0171690 February 23, 2017 1 / 23
a1111111111
a1111111111
a1111111111
a1111111111
a1111111111
OPENACCESS
Citation: Ali H, Bitar MS, Al Madhoun A, Marafie M,
Al-Mulla F (2017) Functionally-focused algorithmic
analysis of high resolution microarray-CGH
genomic landscapes demonstrates comparable
genomic copy number aberrations in MSI and
MSS sporadic colorectal cancer. PLoS ONE 12(2):
e0171690. doi:10.1371/journal.pone.0171690
Editor: Hassan Brim, Howard University, UNITED
STATES
Received: July 31, 2016
Accepted: January 23, 2017
Published: February 23, 2017
Copyright: © 2017 Ali et al. This is an open access
article distributed under the terms of the Creative
Commons Attribution License, which permits
unrestricted use, distribution, and reproduction in
any medium, provided the original author and
source are credited.
Data Availability Statement: All relevant data are
within the manuscript.
Funding: This work was supported by grant
number 2011-1302-06, given to Prof. Fahd Al-
Mulla by the Kuwait Foundation for the
Advancement of Sciences KFAS (www.kfas.org).
The funders had no role in study design, data
collection and analysis, decision to publish, or
preparation of the manuscript.
Introduction
Comparative genomics have been extensively used to identify DNA copy number variations
in cancer. At the chromosomal level, Mertens et al. assessed the distribution of chromosomal
gains and losses in published karyotypes from 11 tumour types including 333 cases of colo-
rectal carcinomas (CRCs) [1]. In CRC, recurrent gains in chromosomes 7, 8q, 13 and 20; and
losses of lp, 5q, 8p, 14p, 17p, 18 and 22 were found [2, 3]. Later, metaphase-based compara-
tive genomic hybridization (m-CGH), a technique of about 5 million bases resolution, was
utilized to decipher chromosomal copy number changes in CRC progression. A plethora of
studies used m-CGH to identify chromosomal imbalances in CRC, which included gain of
chromosomes 1, 13 and 20 and chromosome arms 7p and 8q, whereas chromosome 4 and
chromosome arms 8p and 10q were frequently deleted [2–7]. However, the large size of geno-
mic aberrations identified by these low resolution techniques, which may contain hundreds
of genes, prohibited the precise identification of DNA stretches involved in CRC progression
[8–12]. In 2004, array-based comparative genomic hybridization (aCGH) emerged as a more
promising technology for studying copy number variations at higher resolutions even from
formalin-fixed paraffin-embedded (FFPE) archived material [13–17]. Bacterial artificial
chromosome or BAC-based microarrays have a resolution of 1 million bases, while oligonu-
cleotide-based microarrays have a much higher resolution of 8.9 KB overall median probe
spacing (7.4 KB in Refseq genes) with 44,000 to 4.5 million probes dotted on slides, many of
which densely cover all known or possible human genes [8]. Oligonucleotide-based aCGH
is now capable of identifying copy number alterations in few thousands of bases or smaller
[18–20].
This powerful technology, however, comes with its own limitations. For example, similar
or even the same samples performed on different platforms may yield significantly different
results. Moreover, the lack of standardized bioinformatic algorithms or analytical methods
used to detect genomic aberrations complicates conclusions even further. These are com-
pounded by the inherent heterogeneous nature of cancer evolution [21]. Seldom do aCGH-
based studies account for such biologically confounding variables. Consequently, previously
published colorectal cancer-related aCGH studies have yielded a high level of discordance in
the reported genomic aberrations of colorectal cancer [20, 22, 23]. In addition, traditional
means of classifying the importance of cancer-related copy number aberrations (CNAs) in-
clude the frequency of their occurrence in different patients. However, cancer genomes are
highly complex and frequently harbor random ’passenger’ CNAs that are of no functional sig-
nificance [24]. To alleviate interference from those non-random CNAs, a systematic method,
termed Genomic Identification of Significant Targets in Cancer (GISTIC) was recently devel-
oped and used in identifying biologically significant CNAs in several cancer types. The GISTIC
algorithm determines a ’G’ score based on the frequency and amplitude of the gains and losses.
By giving more weight to high copy gains and homozygous losses (amplitude), the GISTIC
algorithm argues that such aberrations may be more functionally relevant to the successful
evolution of the cancer genome [25–27].
Here, we have utilized genomic high-density oligonucleotide-based microarrays to identify
CNAs in well-defined colorectal cancers. In addition, we used the GISTIC algorithm to iden-
tify ’driver’ chromosomal aberrations in colorectal cancer. We identified 3 distinct CNA pat-
terns in CRCs and show that although CNAs in MSI and MSS CRCs differ with respect to
their size, number and chromosomal distribution, the evolutionary and biologically relevant
driver mutations of MSI and MSS CRC are not as dissimilar with respect to non-randomcopy
number aberrations as traditional methods have previously suggested [15,28].
Genomic profiling in MSI and MSS sporadic colorectal cancer
PLOS ONE | DOI:10.1371/journal.pone.0171690 February 23, 2017 2 / 23
Competing interests: The authors have declared
that no competing interests exist.
Abbreviations: aCGH, Array-based comparative
genomic hybridization; BAC, Bacterial artificial
chromosome; mCGH, Metaphase-based
comparative genomic hybridization; CNA, Copy
number aberration; MSS, Microsatellite Stable;
STAC, Significance testing for aberrant copy
number; GISTIC, Genomic Identification of
Significant Targets in Cancer; CRC, Colorectal
Carcinomas; MSI, Microsatellite Instability; MLPA,
Multiplex Ligation-dependent Probe Amplification;
FFPE, Formalin-fixed paraffin-embedded; DLRS,
Derivative of log ratio spread; FASST, Fast Adaptive
State Segmentation Technique.
Materials and methods
CRC samples
A total of 116 CRC patients were recruited for this study. The study’s protocols were approved
by by the Health Sciences Center (HSC) and Kuwait Institute for Medical Specialization
(KIMS) joint committee for the protection of human subjects in research. Written informed
consent was obtained from all patients before their inclusion in the study. DNA extracted
from formalin-fixed paraffin-embedded (FFPE) tissues from 96 patients with sporadic early
stage II CRC were used for genomic profiling. Genomic DNA was isolated from microdis-
sected FFPE CRC tissues as described previously [29].
aCGH for FFPE samples
a. Labeling of genomic DNA. Human Genome CGH Microarray 244A slides (Agilent
Technologies, CA, USA) were used for FFPE extracted DNA samples. We followed the proto-
col described in [30, 31]. A total of 2.5 μg sex matched control DNA (Promega, WI, USA) was
fragmented by sonication. The FFPE DNA was fragmented only if there was any large molecu-
lar weight DNA. About 500 ng of the fragmented samples were then run on 1.5% agarose gel
for 1 hour to check the extent of fragmentation of the DNA. Once fragmentation was deemed
appropriate, 2 μg of the control DNA was labeled with Cy3 (Agilent technologies, CA, USA)
and 2μg of FFPE DNA with Cy5 (Agilent technologies, CA, USA) for 30 minutes at 85˚C.
After labeling the DNA was purified using KREA pure columns (Agilent technologies, CA,
USA). The samples were then measured on a Nanodrop and Degree of Labeling (DOL) was
calculated according to the following formula;
Degree of Labeling¼ ð340 x pmol=ml of dyeÞ=ðng=lm of Genomic DNA x 1000Þ
The samples were hybridized onto microarray slides only if the DOL was between 1.5–
2.5%.
b. Hybridization of labeled DNA. Appropriate volumes of Human Cot-I DNA (Invitro-
gen, CA, USA), 10X Blocking Agent (Agilent Technologies) and 2X Hybridization buffer (Agi-
lent Technologies) were added to the paired Cy5 and Cy3 labeled DNA and the hybridization
mix was mixed by pipetting gently. The Hybridization cocktail was then incubated at 95˚C for
3 minutes, then immediately followed by 30 minutes at 37˚C. The tubes were spun to collect
the samples and an appropriate volume of Agilent-CGH block buffer (Agilent technologies,
CA, USA) was added to the hybridization cocktail. The samples were mixed gently and centri-
fuged for collection. We dispensed 490 μl of the hybridization cocktail onto a clean gasket
slide, which was already placed into a hybridization chamber. A microarray slide was placed
active side down onto the gasket. The chamber was assembled and incubated in the hybridiza-
tion rotating oven (Agilent technologies, CA, USA) for 40 hours at 60˚C and 20 rpm.
c. Washing of the microarray slide. The hybridization chamber was disassembled care-
fully and the microarray slide sandwich was completely submerged into wash buffer 1 (Agilent
technologies, CA, USA) at room temperature. The slides were then gently pried open using a
pair of forceps and the gasket was allowed to drop to the bottom of the jar. The microarray
slide was quickly transferred to a slide rack submerged in wash buffer 1 and incubated for
5 minutes. Then the rack was transferred to the next dish containing wash buffer 2 (Agilent
technologies, CA, USA) at 37˚C for 1 minute. The slide rack was then transferred to a dish
containing Acetonitrile for 1 minute followed by 30 seconds in Stabilization solution (Agilent
technologies). The rack was removed carefully in order to minimize the number of droplets on
the slide. The slides were scanned immediately on an Agilent scanner.
Genomic profiling in MSI and MSS sporadic colorectal cancer
PLOS ONE | DOI:10.1371/journal.pone.0171690 February 23, 2017 3 / 23
d. Data analysis of the sample. Scanned images were imported; background subtracted
and normalized using Feature extraction software version 10.7.1.1 (Agilent Technologies, CA,
USA). The feature extraction software generates a quality Control Report which helps deter-
mine the quality of the aCGH. Quality Control metrics such as derivative of log ratio spread
(DLRS), background noise (BG noise), signal intensity, reproducibility and signal to noise
ratio are generated in the QC report.DLR Spread is defined as the spread of the Log Ratio dif-
ferences between consecutive probes along all chromosomes. It is the most important metric
as it gives us the ability to measure noise of the log ratio independent from the number and
severity of aberrations found, making it instrumental in assessing the overall quality of each
microarray experiment. If the DLR Spread value was higher than 0.5, the cases were excluded
from further analysis. The text files representing data ratio points log2 of test/control ratios
were imported to Nexus software (Biodiscovery, CA, U.S.A). Quality values ranged between
0.05–0.4, which are excellent values given the degraded nature of the samples. To minimize
false positive calls and random CNV variations, Fast Adaptive State Segmentation Technique
(FASST2) with a stringent significance threshold of 5.0E-6 was used to determine copy num-
ber aberrations. Moreover, we utilized two algorithms to more accurately reflect functional
CNVs and separate them from bystander genomic aberrations. The first termed Significance
Testing for Aberrant Copy number (STAC) algorithm, and the second is a systematic method
termed Genomic Identification of Significant Targets in Cancer (GISTIC) o identify biologi-
cally significant copy number aberrations in these samples. Both algorithms were calculated
using Nexus software version 8 (Biodiscovery, El Segundo CA, USA)
Multiplex Ligation-dependent Probe Amplification (MLPA)
DNA was diluted to a working stock concentration of 50 ng/μl. A total of 250 ng (5μl) of DNA
was aliquoted into sterile 0.2 ml tubes and denatured and then cooled to 25˚C in a thermal
cycler. A master mix containing hybridization components supplied as part of the kit (SALSA
MLPA probemix P294-B1 Tumour-Loss from MRC Holland, Amsterdam, Netherlands) was
prepared and added to the samples at 25˚C and the reaction was mixed by pipetting. The hybrid-
ization reaction was carried out according to the manufacturer’s instructions and the samples
were incubated overnight at 60˚C. A ligase buffer mix was prepared with reagents supplied with
the kit and ligation was carried out with Liagse-65. Following ligation, a PCR master mix was
prepared using SALSA PCR reagents from the kit and PCR reaction was carried out by mixing
10μl of ligation product with the PCR master mix in new tubes at temperatures recommended
in the protocol. All reactions were carried according to manufacturer’s protocol. The amplified
PCR product was mixed with formamide, CEQ-600 marker, and 3μl of this MLPA PCR sample
was then added to each well of a 96 well plate and a drop of mineral oil was added on top. Frag-
ment separation was carried out by loading the plate into the CEQ8000 Genetic Analysis System
according to manufacturer’s protocol. CSV files generated from these runs were then imported
into the Coffalyser Software (MRC Holland, Amsterdam, Netherlands) for MLPA analysis.
MSI fragment analysis
DNA was extracted from 116 macro-dissected colorectal tumors and MSI fragment analysis
was performed on them and their matching normal using MSI analysis system version 1.2 kit
(Promega Corporation, WI, USA). Powerplex Matrix Standards 3100/3130 kit (Promega Cor-
poration, WI, USA) was used to perform spectral calibration of the Applied Biosystems 3130
Genetic Analyzer. The system allowed co-amplification of a total of seven markers including
mononucleotide repeat markers (Bat-25, BAT-26, NR-21, NR-24 and MONO-27) and penta-
nucleotide repeat markers (Penta C and Penta D). MSI status was determined using the
Genomic profiling in MSI and MSS sporadic colorectal cancer
PLOS ONE | DOI:10.1371/journal.pone.0171690 February 23, 2017 4 / 23
mononucleotide markers by comparing results from tumor and its matching normal, a cancer
was classified as MSS when no length variations were detected between the samples for all the
markers. The cancer was classified as MSI-high when 2 or more markers showed length varia-
tions between the tumors sample and its matching normal. We further classified each cancer
into MSI or MSS subclasses by analyzing the expression of MLH1, MSH2, PMS2 and MSH6
using immunohistochemistry. Statistical correlation was performed for samples were both
methods were used to determine MSI status.
Results and discussion
Genetic aberration in colorectal cancer detected using high resolution
oligo-microarrays
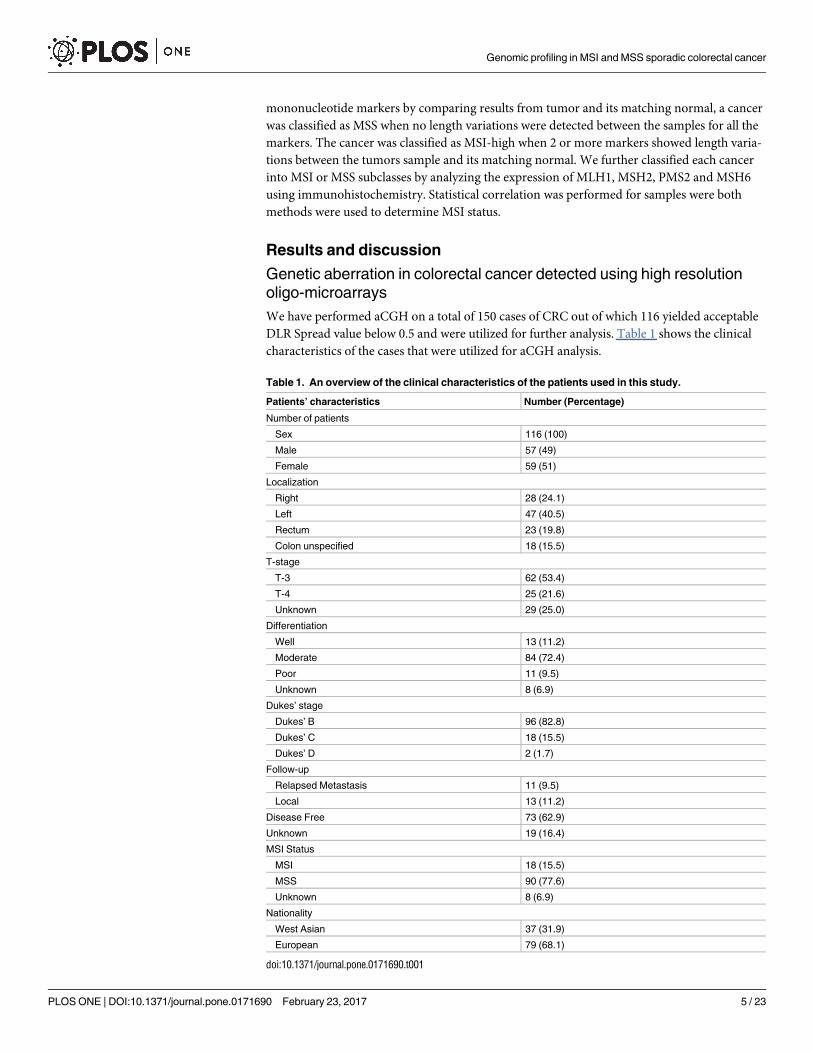
We have performed aCGH on a total of 150 cases of CRC out of which 116 yielded acceptable
DLR Spread value below 0.5 and were utilized for further analysis. Table 1 shows the clinical
characteristics of the cases that were utilized for aCGH analysis.
Table 1. An overview of the clinical characteristics of the patients used in this study.
Patients’ characteristics Number (Percentage)
Number of patients
Sex 116 (100)
Male 57 (49)
Female 59 (51)
Localization
Right 28 (24.1)
Left 47 (40.5)
Rectum 23 (19.8)
Colon unspecified 18 (15.5)
T-stage
T-3 62 (53.4)
T-4 25 (21.6)
Unknown 29 (25.0)
Differentiation
Well 13 (11.2)
Moderate 84 (72.4)
Poor 11 (9.5)
Unknown 8 (6.9)
Dukes’ stage
Dukes’ B 96 (82.8)
Dukes’ C 18 (15.5)
Dukes’ D 2 (1.7)
Follow-up
Relapsed Metastasis 11 (9.5)
Local 13 (11.2)
Disease Free 73 (62.9)
Unknown 19 (16.4)
MSI Status
MSI 18 (15.5)
MSS 90 (77.6)
Unknown 8 (6.9)
Nationality
West Asian 37 (31.9)
European 79 (68.1)
doi:10.1371/journal.pone.0171690.t001
Genomic profiling in MSI and MSS sporadic colorectal cancer
PLOS ONE | DOI:10.1371/journal.pone.0171690 February 23, 2017 5 / 23
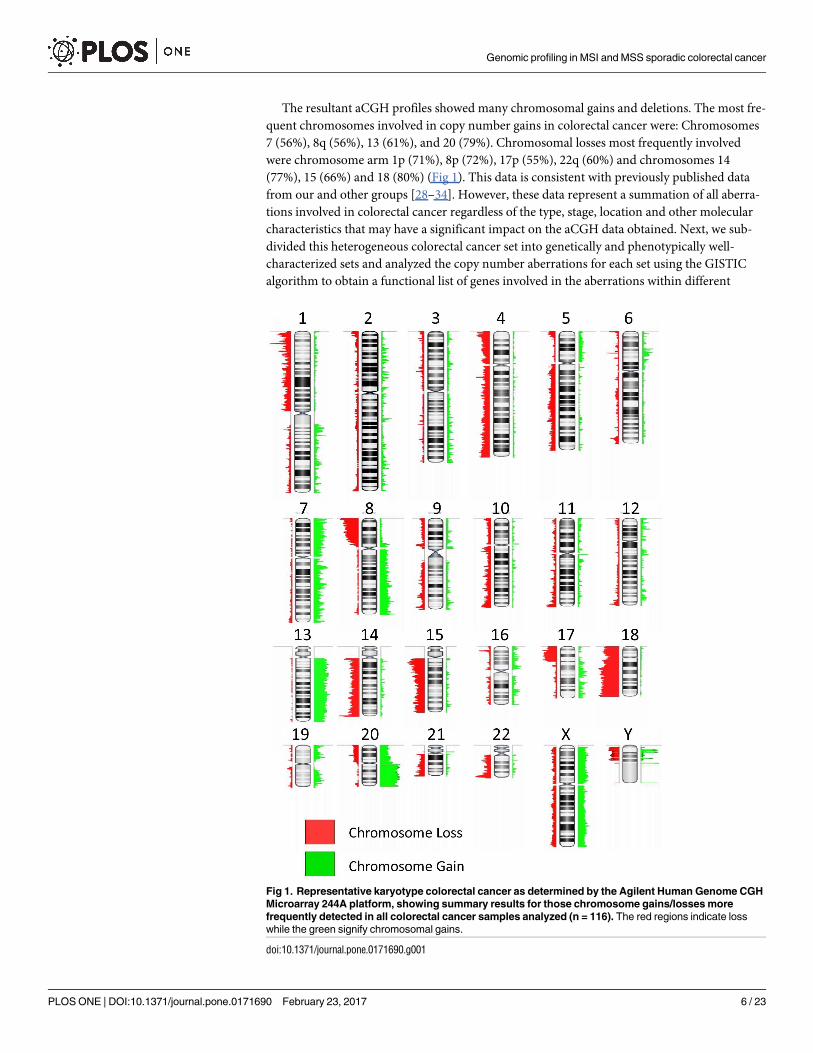
The resultant aCGH profiles showed many chromosomal gains and deletions. The most fre-
quent chromosomes involved in copy number gains in colorectal cancer were: Chromosomes
7 (56%), 8q (56%), 13 (61%), and 20 (79%). Chromosomal losses most frequently involved
were chromosome arm 1p (71%), 8p (72%), 17p (55%), 22q (60%) and chromosomes 14
(77%), 15 (66%) and 18 (80%) (Fig 1). This data is consistent with previously published data
from our and other groups [28–34]. However, these data represent a summation of all aberra-
tions involved in colorectal cancer regardless of the type, stage, location and other molecular
characteristics that may have a significant impact on the aCGH data obtained. Next, we sub-
divided this heterogeneous colorectal cancer set into genetically and phenotypically well-
characterized sets and analyzed the copy number aberrations for each set using the GISTIC
algorithm to obtain a functional list of genes involved in the aberrations within different
Fig 1. Representative karyotype colorectal cancer as determined by the Agilent Human Genome CGH
Microarray 244A platform, showing summary results for those chromosome gains/losses more
frequently detected in all colorectal cancer samples analyzed (n = 116). The red regions indicate loss
while the green signify chromosomal gains.
doi:10.1371/journal.pone.0171690.g001
Genomic profiling in MSI and MSS sporadic colorectal cancer
PLOS ONE | DOI:10.1371/journal.pone.0171690 February 23, 2017 6 / 23
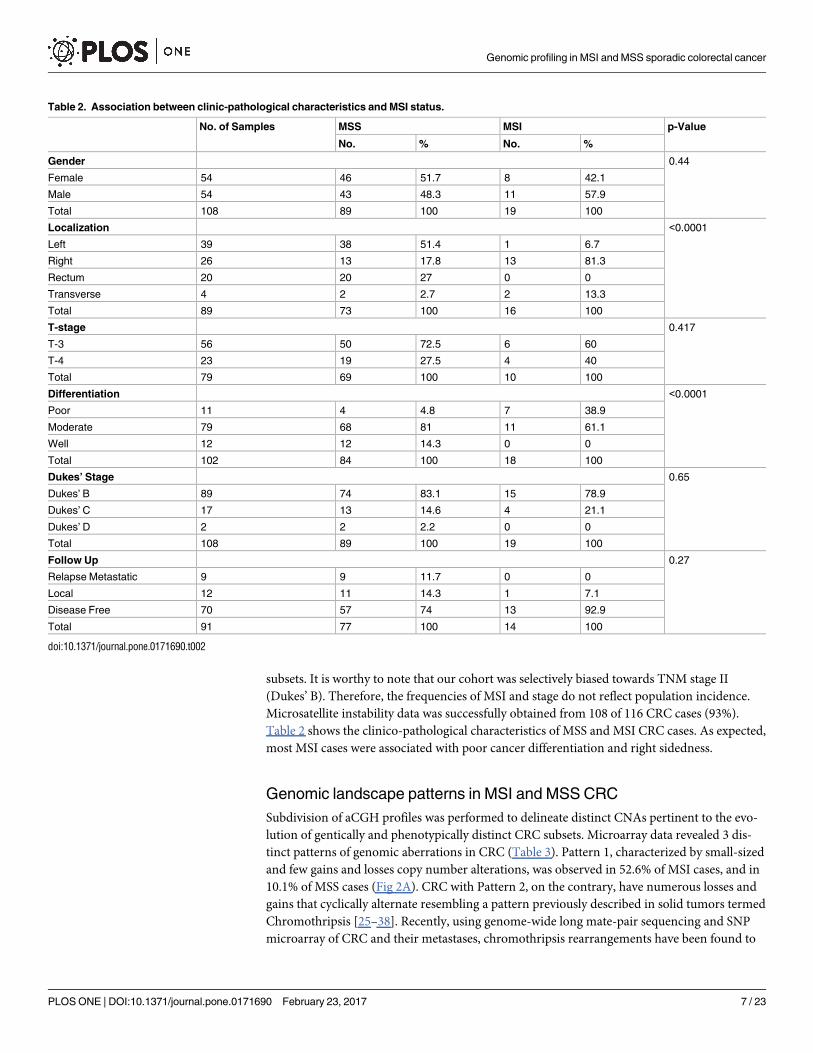
subsets. It is worthy to note that our cohort was selectively biased towards TNM stage II
(Dukes’ B). Therefore, the frequencies of MSI and stage do not reflect population incidence.
Microsatellite instability data was successfully obtained from 108 of 116 CRC cases (93%).
Table 2 shows the clinico-pathological characteristics of MSS and MSI CRC cases. As expected,
most MSI cases were associated with poor cancer differentiation and right sidedness.
Genomic landscape patterns in MSI and MSS CRC
Subdivision of aCGH profiles was performed to delineate distinct CNAs pertinent to the evo-
lution of gentically and phenotypically distinct CRC subsets. Microarray data revealed 3 dis-
tinct patterns of genomic aberrations in CRC (Table 3). Pattern 1, characterized by small-sized
and few gains and losses copy number alterations, was observed in 52.6% of MSI cases, and in
10.1% of MSS cases (Fig 2A). CRC with Pattern 2, on the contrary, have numerous losses and
gains that cyclically alternate resembling a pattern previously described in solid tumors termed
Chromothripsis [25–38]. Recently, using genome-wide long mate-pair sequencing and SNP
microarray of CRC and their metastases, chromothripsis rearrangements have been found to
Table 2. Association between clinic-pathological characteristics and MSI status.
No. of Samples MSS MSI p-Value
No. % No. %
Gender 0.44
Female 54 46 51.7 8 42.1
Male 54 43 48.3 11 57.9
Total 108 89 100 19 100
Localization <0.0001
Left 39 38 51.4 1 6.7
Right 26 13 17.8 13 81.3
Rectum 20 20 27 0 0
Transverse 4 2 2.7 2 13.3
Total 89 73 100 16 100
T-stage 0.417
T-3 56 50 72.5 6 60
T-4 23 19 27.5 4 40
Total 79 69 100 10 100
Differentiation <0.0001
Poor 11 4 4.8 7 38.9
Moderate 79 68 81 11 61.1
Well 12 12 14.3 0 0
Total 102 84 100 18 100
Dukes’ Stage 0.65
Dukes’ B 89 74 83.1 15 78.9
Dukes’ C 17 13 14.6 4 21.1
Dukes’ D 2 2 2.2 0 0
Total 108 89 100 19 100
Follow Up 0.27
Relapse Metastatic 9 9 11.7 0 0
Local 12 11 14.3 1 7.1
Disease Free 70 57 74 13 92.9
Total 91 77 100 14 100
doi:10.1371/journal.pone.0171690.t002
Genomic profiling in MSI and MSS sporadic colorectal cancer
PLOS ONE | DOI:10.1371/journal.pone.0171690 February 23, 2017 7 / 23
occur frequently in CRC [39–41]. Since aCGH can only detect copy number alterations, and
only that, we are not sure that these rearrangements represent true chromothripsis events. We,
therefore, will refer to this pattern as chromothripsis-like or alternating copy state (Fig 2B).
Chromothripsis-like events were observed in 31.6% of MSI CRC cases. In MSS CRC cases,
chromothripsis-like events were uncommon and documented in only 10% of the cases. This
data indicated that chromothripsis-like events were more significantly associated with MSI
than MSS genotypes (p = 0.024). Pattern 3, exemplified by large sized gains and losses, which
may span chromosomal arms or whole chromosomes (Fig 2C) were found in 15.8% of MSI
CRC cases. As expected, this particular pattern was the most common in the genomic land-
scape of MSS CRC cases (89.9%).
Enumeration of genomic aberrations in MSI and MSS CRC
It is widely accepted that MSS CRC have higher number and larger-sized genomic aberrations
compared to MSI CRC. Nevertheless, seldom do researchers divide the genomic profiles
obtained by microarrays or other advanced methodologies into patterns before comparing
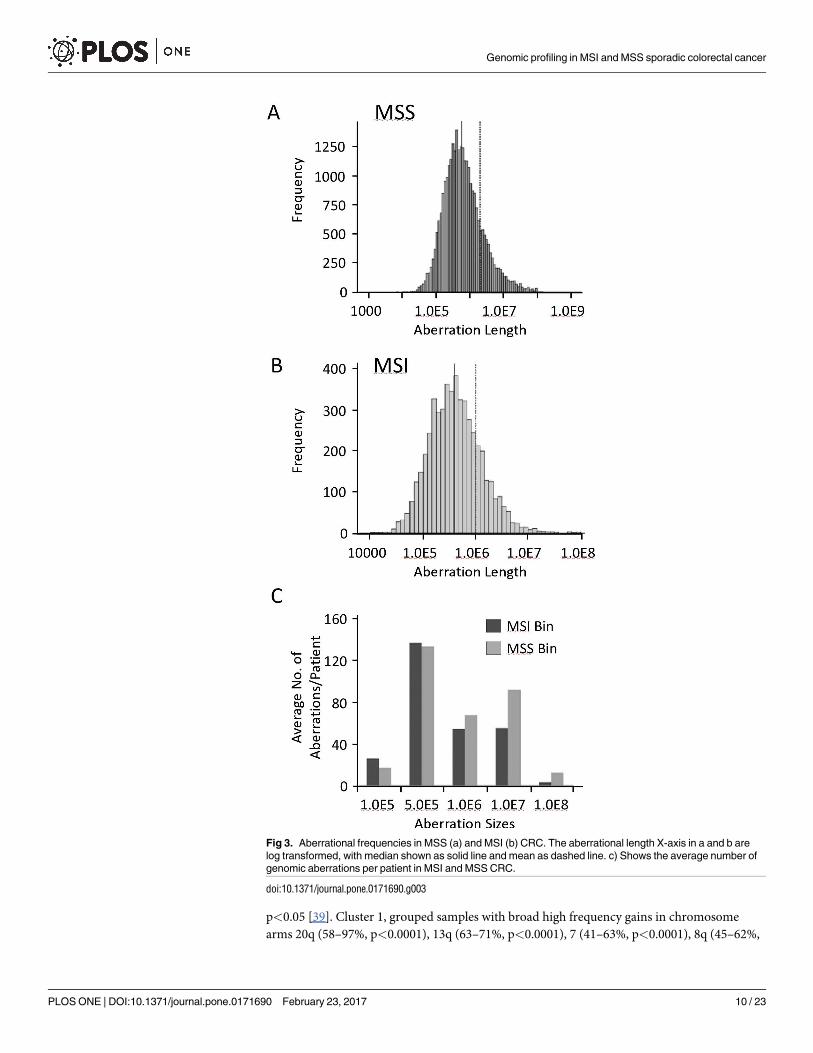
aberration frequencies and sizes between the two groups. Fig 3 shows the frequencies of total
aberrations in different classes and patterns of CRC. Table 3 subdivides these aberrations into
losses and gains. As shown, the mean number of autosomal genomic aberrations in MSS CRC
was 217.5 (95% C.I: 186–249), which was significantly higher than MSI CRC with pattern 1
(mean of 60 and 95% C.I: 26–95; p<0.0001) but equivalent to MSI CRC with pattern 3 geno-
mic aberrations (mean of 170 and 95% C.I: 9.8–331.5; p>0.05). However, MSI CRC with pat-
tern 2 had significantly more cumulative genomic aberrations than MSS CRC (mean of 624
and 95% C.I: 355–894; p<0.0001). Similarly, MSS CRC with pattern 2 had the highest number
of genomic aberration (Table 3).
We next assessed and compared the length of genomic aberrations in MSS and MSI CRC.
Fig 3 shows the histogram spread of genomic aberration sizes with the indicated median and
mean length in MSS (Fig 3A) and MSI (Fig 3B) CRC. On average, patients with MSI CRC had
smaller sized genomic aberrations compared to MSS CRC patients (Fig 3C).
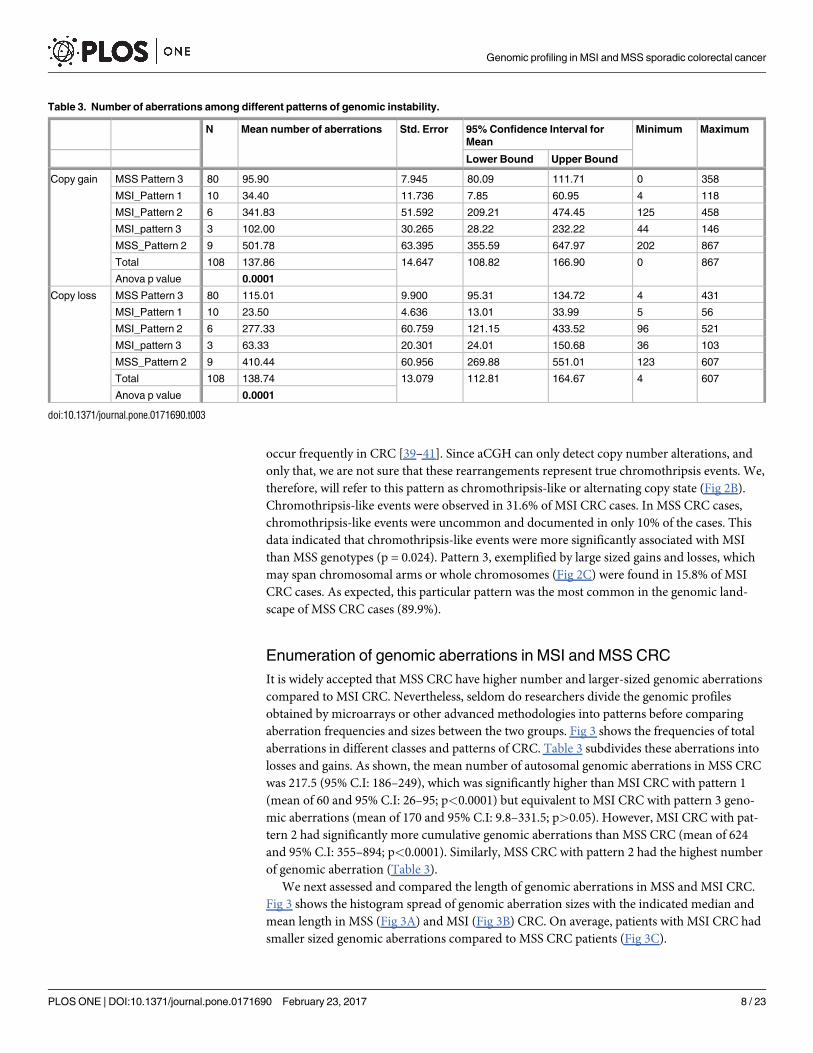
Table 3. Number of aberrations among different patterns of genomic instability.
N Mean number of aberrations Std. Error 95% Confidence Interval for
Mean
Minimum Maximum
Lower Bound Upper Bound
Copy gain MSS Pattern 3 80 95.90 7.945 80.09 111.71 0 358
MSI_Pattern 1 10 34.40 11.736 7.85 60.95 4 118
MSI_Pattern 2 6 341.83 51.592 209.21 474.45 125 458
MSI_pattern 3 3 102.00 30.265 28.22 232.22 44 146
MSS_Pattern 2 9 501.78 63.395 355.59 647.97 202 867
Total 108 137.86 14.647 108.82 166.90 0 867
Anova p value 0.0001
Copy loss MSS Pattern 3 80 115.01 9.900 95.31 134.72 4 431
MSI_Pattern 1 10 23.50 4.636 13.01 33.99 5 56
MSI_Pattern 2 6 277.33 60.759 121.15 433.52 96 521
MSI_pattern 3 3 63.33 20.301 24.01 150.68 36 103
MSS_Pattern 2 9 410.44 60.956 269.88 551.01 123 607
Total 108 138.74 13.079 112.81 164.67 4 607
Anova p value 0.0001
doi:10.1371/journal.pone.0171690.t003
Genomic profiling in MSI and MSS sporadic colorectal cancer
PLOS ONE | DOI:10.1371/journal.pone.0171690 February 23, 2017 8 / 23

Unsupervised clustering of genomic aberrations in CRC
We employed unsupervised complete Linkage Hierarchical clustering on the 116 CRC cases.
The method orders cases based solely on their genomic aberrations without prior knowledge
of other clinical, genetic or MMR data. Fig 4A shows the 5 clusters generated from this analy-
sis. The CNAs of each group/cluster are shown in Fig 4B. Cluster 1 (group 1) identified geno-
mic aberrations significantly associated with MSS CRC harboring largely wild type BRAF, and
were left-sided with rectosigmoidal subsite enrichment (Table 4).
We next employed a global frequency statistical approach using the significance testing for
aberrant copy number (STAC) algorithm. STAC-based algorithm is a robust method which
identifies a set of aberrations that are stacked on top of each other from different patients or
microarrays such that it would not occur by chance. To find these events, aberrations (usually
narrow regions) are permuted in each arm of each chromosome and assess how likely it is
for an event to occur at any location at a particular frequency set here at 35% and minimum
Fig 2. Patterns of genomic aberrations highlighted by high-resolution aCGH in CRC. a) Shows pattern 1 from 3 patients as examples (upper 22
autosomes). The zoomed inset focused on an area of chromosome arm 3P with 2 small deletions. b) Shows 4 cases of CRC with pattern 2. Notice the
large number of small aberrations that alternate between gain-baseline-loss. Insets show zoomed in picture of chromosome 7 from one patients (upper
panels) and chromosome 1 from a different case. Notice how well-demarcated and clear are these alternating aberrations. c) Shows a case with pattern 3,
which involves copy number alterations of chromosomal arms or whole chromosomes (Insets). In all figures deletions are shown in red and deviate below
the 0 (log2 ratio) and gains are depicted in blue.
doi:10.1371/journal.pone.0171690.g002
Genomic profiling in MSI and MSS sporadic colorectal cancer
PLOS ONE | DOI:10.1371/journal.pone.0171690 February 23, 2017 9 / 23
p<0.05 [39]. Cluster 1, grouped samples with broad high frequency gains in chromosome
arms 20q (58–97%, p<0.0001), 13q (63–71%, p<0.0001), 7 (41–63%, p<0.0001), 8q (45–62%,
Fig 3. Aberrational frequencies in MSS (a) and MSI (b) CRC. The aberrational length X-axis in a and b are
log transformed, with median shown as solid line and mean as dashed line. c) Shows the average number of
genomic aberrations per patient in MSI and MSS CRC.
doi:10.1371/journal.pone.0171690.g003
Genomic profiling in MSI and MSS sporadic colorectal cancer
PLOS ONE | DOI:10.1371/journal.pone.0171690 February 23, 2017 10 / 23
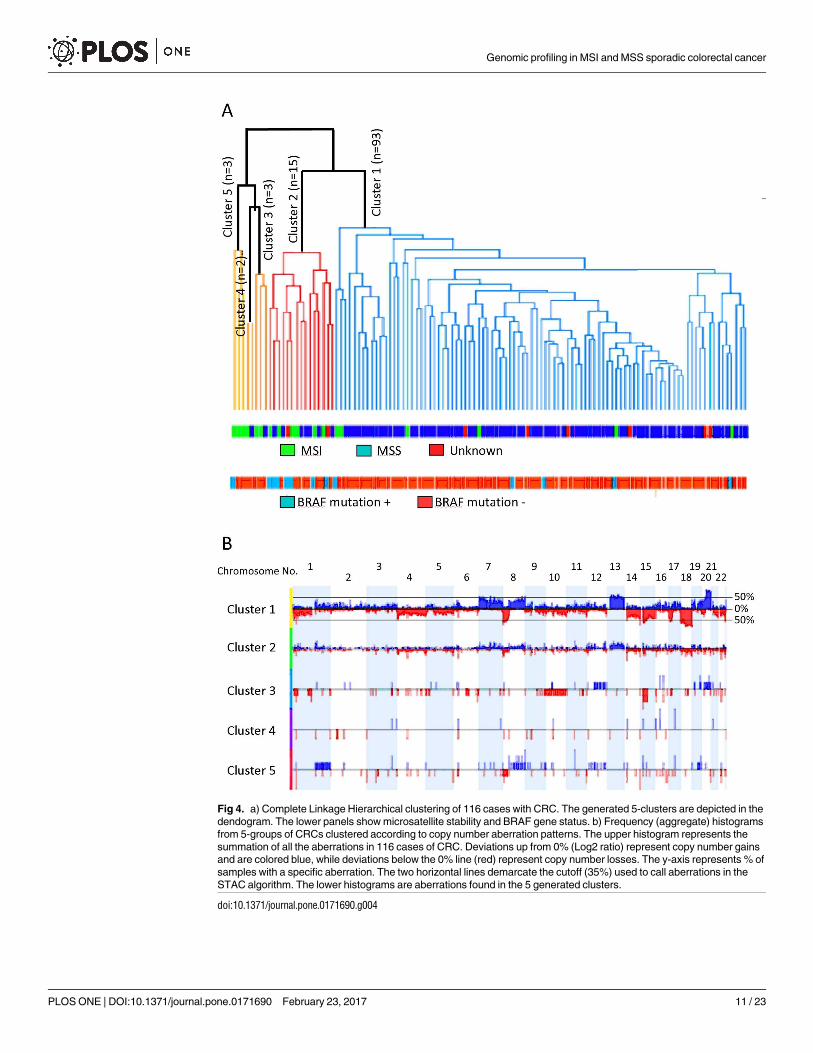
Fig 4. a) Complete Linkage Hierarchical clustering of 116 cases with CRC. The generated 5-clusters are depicted in the
dendogram. The lower panels show microsatellite stability and BRAF gene status. b) Frequency (aggregate) histograms
from 5-groups of CRCs clustered according to copy number aberration patterns. The upper histogram represents the
summation of all the aberrations in 116 cases of CRC. Deviations up from 0% (Log2 ratio) represent copy number gains
and are colored blue, while deviations below the 0% line (red) represent copy number losses. The y-axis represents % of
samples with a specific aberration. The two horizontal lines demarcate the cutoff (35%) used to call aberrations in the
STAC algorithm. The lower histograms are aberrations found in the 5 generated clusters.
doi:10.1371/journal.pone.0171690.g004
Genomic profiling in MSI and MSS sporadic colorectal cancer
PLOS ONE | DOI:10.1371/journal.pone.0171690 February 23, 2017 11 / 23
p<0.0001), and broad losses in chromosomes 18 (76–91%, p<0.0001), 14q (45–84%, p<
0.0001), 8p (65–82%, p<0.0001), 15q (54–76%, p<0.0001), and 1 (35–76%, p<0.0001). Cluster
2, identified cases with MSI, which also harbored BRAF V600E mutation, were significantly
associated with right-sidedness and ascending colon subsite enriched (Table 4). This cluster
had low frequency gains and losses stretching along the genome, with specific and signifi-
cant peaks of gains at chromosome arms 1q 23.3 (40%, p<0.0001), 11q11 (40%, p<0.0001),
12q24.31 (40%, p<0.001), 13q14.12–14.13 (40%, p<0.005), and losses at chromosome arms
14q11.2 (60%, p<0.0001), 22q11.23 (53%, p<0.0001), 6q21.32 (47%, p<0.0001), 14q32.33
(40%, p<0.01), 16p13.2 (40%, p<0.0001), 8p23.3, 8p23.1,18q12.2 and 18q23 (40%, p<0.02).
The other clusters, namely clusters 3, 4 and 5, aggregated small number of cases and exhibited
similar characteristics to group 2 (Table 4). Group5, specifically, was similar to group 2, while
group 3 was enriched with cecal cancers.
Genomic aberrations in MSI and MSS CRC using supervised clustering
analysis
Genetic aberrations generated by Supervised clustering from well-defined sets of samples, in
this case 19 and 89 cases of MSI and MSS CRC respectively, are shown in (Fig 5A). Consistent
with unsupervised clustering, the genomic aberration profiles of MSS and MSI CRC were
largely identical to group 1 and group 2 respectively (Fig 5A). Direct comparison of the gener-
ated genomic profiles between MSS and MSI CRC, highlighted the extensive differences in
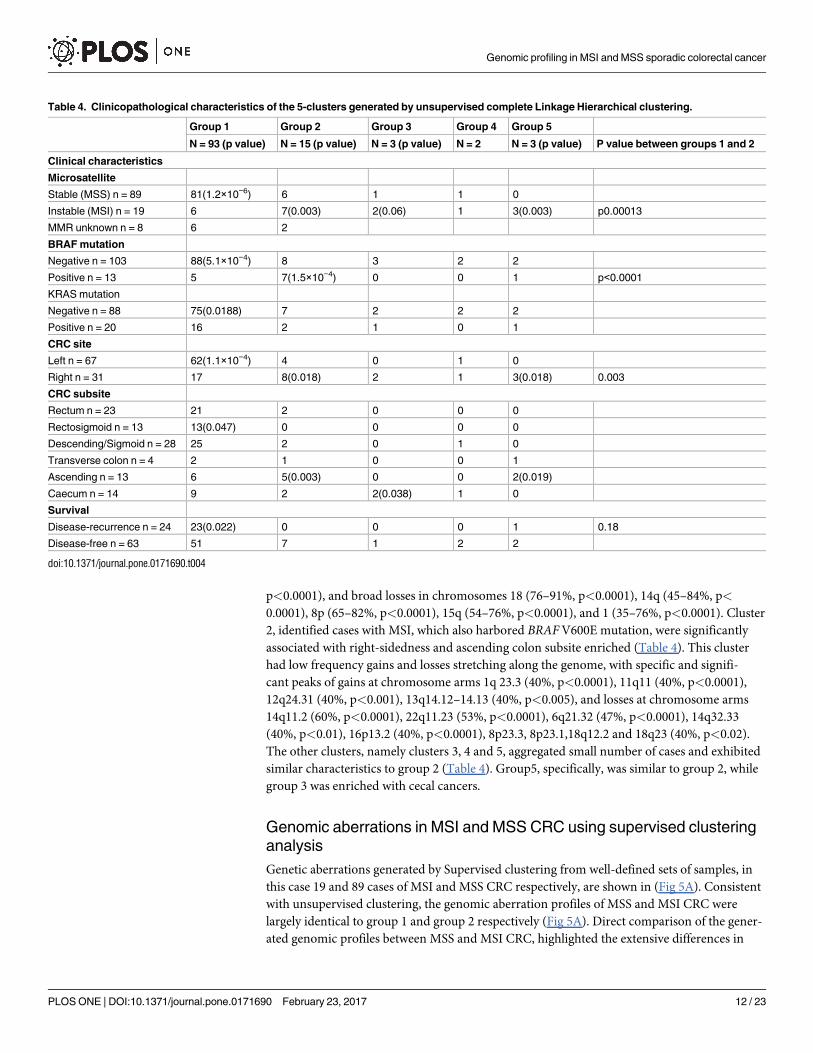
Table 4. Clinicopathological characteristics of the 5-clusters generated by unsupervised complete Linkage Hierarchical clustering.
Group 1 Group 2 Group 3 Group 4 Group 5
N = 93 (p value) N = 15 (p value) N = 3 (p value) N = 2 N = 3 (p value) P value between groups 1 and 2
Clinical characteristics
Microsatellite
Stable (MSS) n = 89 81(1.2×10⁻⁶) 6 1 1 0
Instable (MSI) n = 19 6 7(0.003) 2(0.06) 1 3(0.003) p0.00013
MMR unknown n = 8 6 2
BRAF mutation
Negative n = 103 88(5.1×10⁻⁴) 8 3 2 2
Positive n = 13 5 7(1.5×10⁻⁴) 0 0 1 p<0.0001
KRAS mutation
Negative n = 88 75(0.0188) 7 2 2 2
Positive n = 20 16 2 1 0 1
CRC site
Left n = 67 62(1.1×10⁻⁴) 4 0 1 0
Right n = 31 17 8(0.018) 2 1 3(0.018) 0.003
CRC subsite
Rectum n = 23 21 2 0 0 0
Rectosigmoid n = 13 13(0.047) 0 0 0 0
Descending/Sigmoid n = 28 25 2 0 1 0
Transverse colon n = 4 2 1 0 0 1
Ascending n = 13 6 5(0.003) 0 0 2(0.019)
Caecum n = 14 9 2 2(0.038) 1 0
Survival
Disease-recurrence n = 24 23(0.022) 0 0 0 1 0.18
Disease-free n = 63 51 7 1 2 2
doi:10.1371/journal.pone.0171690.t004
Genomic profiling in MSI and MSS sporadic colorectal cancer
PLOS ONE | DOI:10.1371/journal.pone.0171690 February 23, 2017 12 / 23
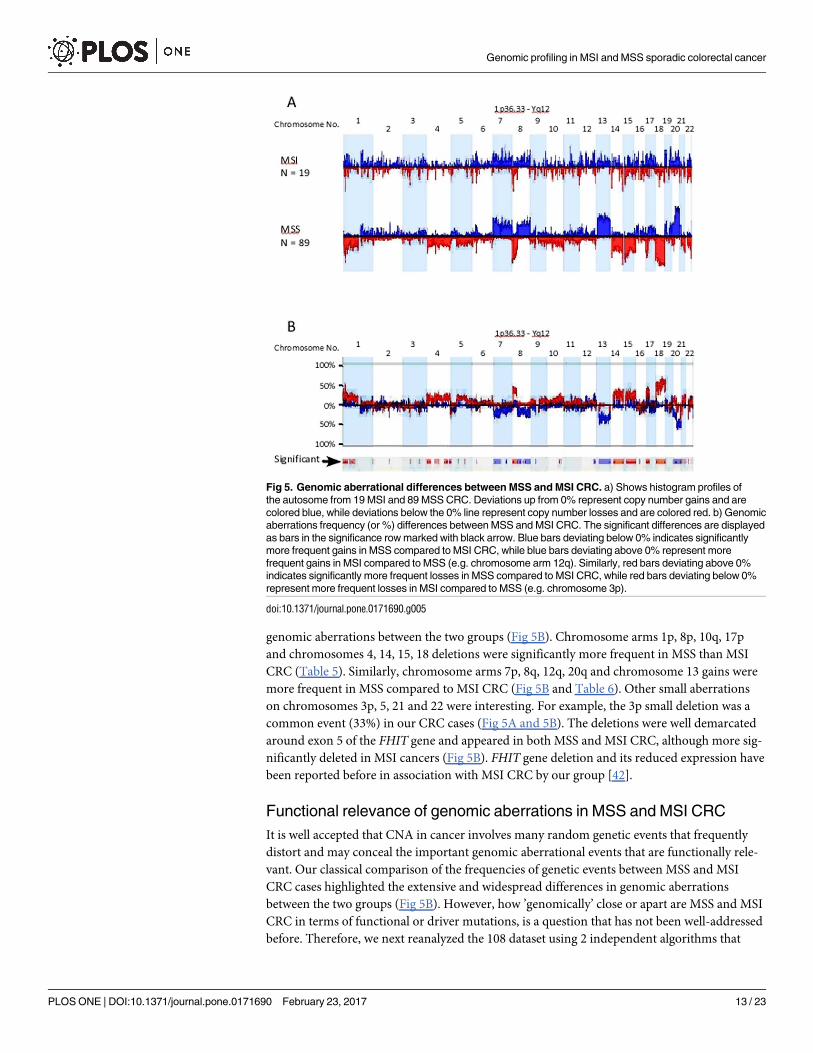
genomic aberrations between the two groups (Fig 5B). Chromosome arms 1p, 8p, 10q, 17p
and chromosomes 4, 14, 15, 18 deletions were significantly more frequent in MSS than MSI
CRC (Table 5). Similarly, chromosome arms 7p, 8q, 12q, 20q and chromosome 13 gains were
more frequent in MSS compared to MSI CRC (Fig 5B and Table 6). Other small aberrations
on chromosomes 3p, 5, 21 and 22 were interesting. For example, the 3p small deletion was a
common event (33%) in our CRC cases (Fig 5A and 5B). The deletions were well demarcated
around exon 5 of the FHIT gene and appeared in both MSS and MSI CRC, although more sig-
nificantly deleted in MSI cancers (Fig 5B). FHIT gene deletion and its reduced expression have
been reported before in association with MSI CRC by our group [42].
Functional relevance of genomic aberrations in MSS and MSI CRC
It is well accepted that CNA in cancer involves many random genetic events that frequently
distort and may conceal the important genomic aberrational events that are functionally rele-
vant. Our classical comparison of the frequencies of genetic events between MSS and MSI
CRC cases highlighted the extensive and widespread differences in genomic aberrations
between the two groups (Fig 5B). However, how ’genomically’ close or apart are MSS and MSI
CRC in terms of functional or driver mutations, is a question that has not been well-addressed
before. Therefore, we next reanalyzed the 108 dataset using 2 independent algorithms that
Fig 5. Genomic aberrational differences between MSS and MSI CRC. a) Shows histogram profiles of
the autosome from 19 MSI and 89 MSS CRC. Deviations up from 0% represent copy number gains and are
colored blue, while deviations below the 0% line represent copy number losses and are colored red. b) Genomic
aberrations frequency (or %) differences between MSS and MSI CRC. The significant differences are displayed
as bars in the significance row marked with black arrow. Blue bars deviating below 0% indicates significantly
more frequent gains in MSS compared to MSI CRC, while blue bars deviating above 0% represent more
frequent gains in MSI compared to MSS (e.g. chromosome arm 12q). Similarly, red bars deviating above 0%
indicates significantly more frequent losses in MSS compared to MSI CRC, while red bars deviating below 0%
represent more frequent losses in MSI compared to MSS (e.g. chromosome 3p).
doi:10.1371/journal.pone.0171690.g005
Genomic profiling in MSI and MSS sporadic colorectal cancer
PLOS ONE | DOI:10.1371/journal.pone.0171690 February 23, 2017 13 / 23
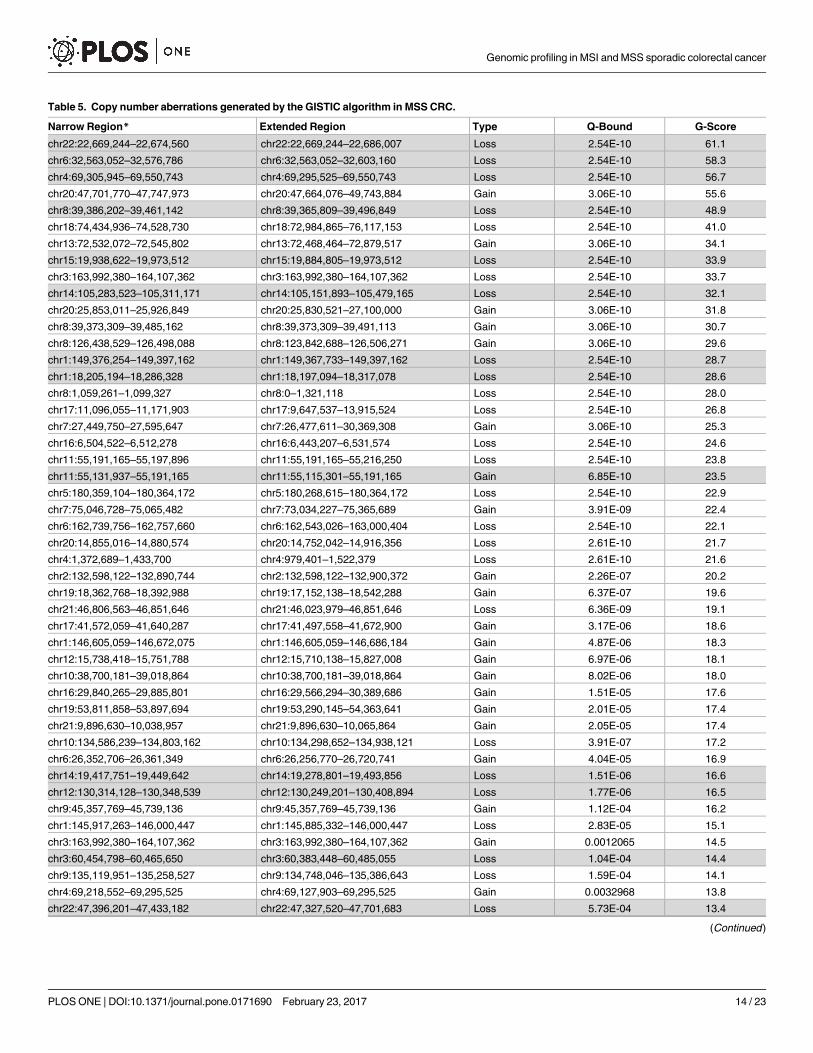
Table 5. Copy number aberrations generated by the GISTIC algorithm in MSS CRC.
Narrow Region* Extended Region Type Q-Bound G-Score
chr22:22,669,244–22,674,560 chr22:22,669,244–22,686,007 Loss 2.54E-10 61.1
chr6:32,563,052–32,576,786 chr6:32,563,052–32,603,160 Loss 2.54E-10 58.3
chr4:69,305,945–69,550,743 chr4:69,295,525–69,550,743 Loss 2.54E-10 56.7
chr20:47,701,770–47,747,973 chr20:47,664,076–49,743,884 Gain 3.06E-10 55.6
chr8:39,386,202–39,461,142 chr8:39,365,809–39,496,849 Loss 2.54E-10 48.9
chr18:74,434,936–74,528,730 chr18:72,984,865–76,117,153 Loss 2.54E-10 41.0
chr13:72,532,072–72,545,802 chr13:72,468,464–72,879,517 Gain 3.06E-10 34.1
chr15:19,938,622–19,973,512 chr15:19,884,805–19,973,512 Loss 2.54E-10 33.9
chr3:163,992,380–164,107,362 chr3:163,992,380–164,107,362 Loss 2.54E-10 33.7
chr14:105,283,523–105,311,171 chr14:105,151,893–105,479,165 Loss 2.54E-10 32.1
chr20:25,853,011–25,926,849 chr20:25,830,521–27,100,000 Gain 3.06E-10 31.8
chr8:39,373,309–39,485,162 chr8:39,373,309–39,491,113 Gain 3.06E-10 30.7
chr8:126,438,529–126,498,088 chr8:123,842,688–126,506,271 Gain 3.06E-10 29.6
chr1:149,376,254–149,397,162 chr1:149,367,733–149,397,162 Loss 2.54E-10 28.7
chr1:18,205,194–18,286,328 chr1:18,197,094–18,317,078 Loss 2.54E-10 28.6
chr8:1,059,261–1,099,327 chr8:0–1,321,118 Loss 2.54E-10 28.0
chr17:11,096,055–11,171,903 chr17:9,647,537–13,915,524 Loss 2.54E-10 26.8
chr7:27,449,750–27,595,647 chr7:26,477,611–30,369,308 Gain 3.06E-10 25.3
chr16:6,504,522–6,512,278 chr16:6,443,207–6,531,574 Loss 2.54E-10 24.6
chr11:55,191,165–55,197,896 chr11:55,191,165–55,216,250 Loss 2.54E-10 23.8
chr11:55,131,937–55,191,165 chr11:55,115,301–55,191,165 Gain 6.85E-10 23.5
chr5:180,359,104–180,364,172 chr5:180,268,615–180,364,172 Loss 2.54E-10 22.9
chr7:75,046,728–75,065,482 chr7:73,034,227–75,365,689 Gain 3.91E-09 22.4
chr6:162,739,756–162,757,660 chr6:162,543,026–163,000,404 Loss 2.54E-10 22.1
chr20:14,855,016–14,880,574 chr20:14,752,042–14,916,356 Loss 2.61E-10 21.7
chr4:1,372,689–1,433,700 chr4:979,401–1,522,379 Loss 2.61E-10 21.6
chr2:132,598,122–132,890,744 chr2:132,598,122–132,900,372 Gain 2.26E-07 20.2
chr19:18,362,768–18,392,988 chr19:17,152,138–18,542,288 Gain 6.37E-07 19.6
chr21:46,806,563–46,851,646 chr21:46,023,979–46,851,646 Loss 6.36E-09 19.1
chr17:41,572,059–41,640,287 chr17:41,497,558–41,672,900 Gain 3.17E-06 18.6
chr1:146,605,059–146,672,075 chr1:146,605,059–146,686,184 Gain 4.87E-06 18.3
chr12:15,738,418–15,751,788 chr12:15,710,138–15,827,008 Gain 6.97E-06 18.1
chr10:38,700,181–39,018,864 chr10:38,700,181–39,018,864 Gain 8.02E-06 18.0
chr16:29,840,265–29,885,801 chr16:29,566,294–30,389,686 Gain 1.51E-05 17.6
chr19:53,811,858–53,897,694 chr19:53,290,145–54,363,641 Gain 2.01E-05 17.4
chr21:9,896,630–10,038,957 chr21:9,896,630–10,065,864 Gain 2.05E-05 17.4
chr10:134,586,239–134,803,162 chr10:134,298,652–134,938,121 Loss 3.91E-07 17.2
chr6:26,352,706–26,361,349 chr6:26,256,770–26,720,741 Gain 4.04E-05 16.9
chr14:19,417,751–19,449,642 chr14:19,278,801–19,493,856 Loss 1.51E-06 16.6
chr12:130,314,128–130,348,539 chr12:130,249,201–130,408,894 Loss 1.77E-06 16.5
chr9:45,357,769–45,739,136 chr9:45,357,769–45,739,136 Gain 1.12E-04 16.2
chr1:145,917,263–146,000,447 chr1:145,885,332–146,000,447 Loss 2.83E-05 15.1
chr3:163,992,380–164,107,362 chr3:163,992,380–164,107,362 Gain 0.0012065 14.5
chr3:60,454,798–60,465,650 chr3:60,383,448–60,485,055 Loss 1.04E-04 14.4
chr9:135,119,951–135,258,527 chr9:134,748,046–135,386,643 Loss 1.59E-04 14.1
chr4:69,218,552–69,295,525 chr4:69,127,903–69,295,525 Gain 0.0032968 13.8
chr22:47,396,201–47,433,182 chr22:47,327,520–47,701,683 Loss 5.73E-04 13.4
(Continued )
Genomic profiling in MSI and MSS sporadic colorectal cancer
PLOS ONE | DOI:10.1371/journal.pone.0171690 February 23, 2017 14 / 23
focus on the functional relevance of a particular genomic aberration. First, we used STAC algo-
rithm approach to identify statistically significant and recurrent genomic CNAs within subsets
of samples under the same settings mentioned above. The second algorithm GISTIC, which
identifies functionally significant CNAs by giving more weight to high copy gains and homo-
zygous losses (amplitudes), which may be functionally relevant to the successful evolution of
the cancer genome [27]. Such permutations are not considered in the STAC analysis we used.
Therefore, the two methods may be considered complementary rather than comparable.
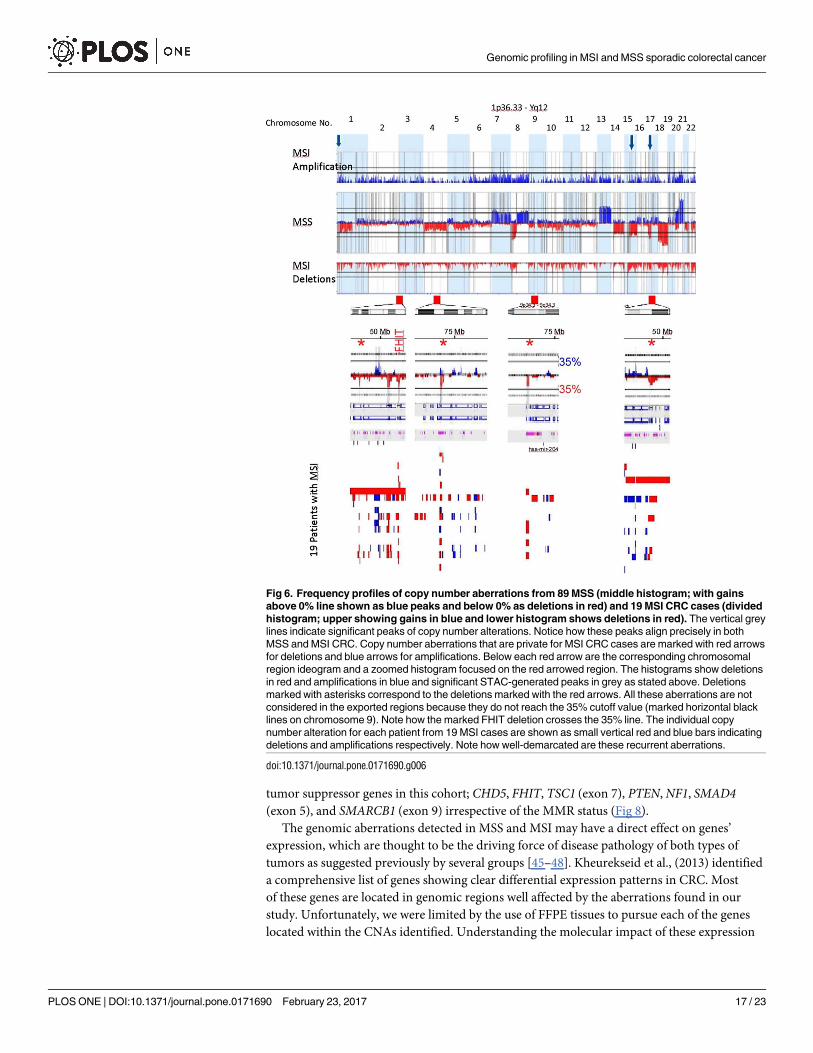
Fig 6 shows functionally significant CNAs generated by the STAC algorithm in MSI and
MSS CRC. The peaks identify aberrations that are significantly recurrent. As demonstrated
before with the traditional frequency-based method, that MSS CRC accumulated more CNAs
than MSI CRC, albeit, more functionally relevant here. A remarkable observation that ema-
nated from the use of the STAC algorithm was the high-degree of similarity between the func-
tionally-relevant copy number alterations in MSI and MSS CRC. On almost all the autosomes,
functionally significant CNAs found in MSI CRC mapped precisely onto those found in MSS
CRC (Fig 6). All genomic aberrations specific to MSI CRC are highlighted with arrows in Fig
6. These aberrations did not reach the 35% cutoff, or did not contain functional genes (chro-
mosome 4) and therefore excluded by the algorithm.
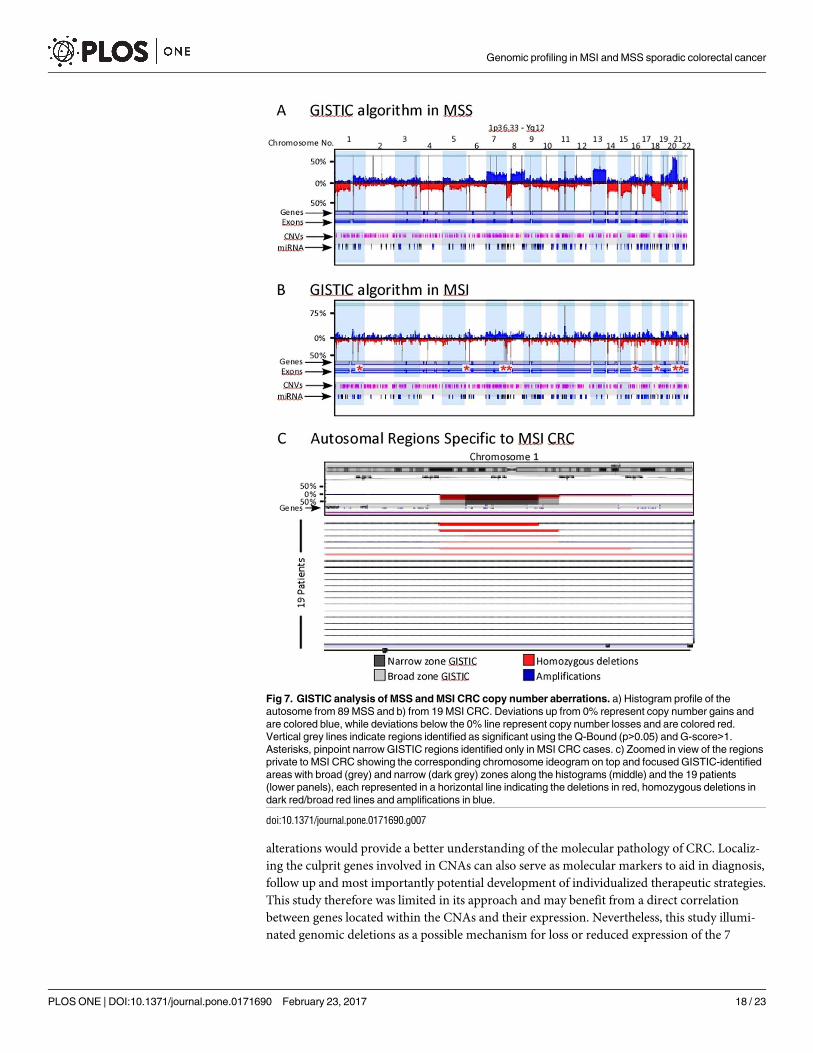
We next employed the GISTIC algorithm on the same data set. Fig 7 shows the significant
CNAs in both MSS (Fig 7A) and MSI (Fig 7B) as broad and narrow regions represented by ver-
tical grey lines. Again, these functionally significant aberrations were more common in MSS
compared to MSI CRC cases (Tables 5 and 6). Genes involved in cellular senescence, S-phase
control of the cell cycle, histone H4-K5 acetylation, nucleosome assembly and telomere main-
tenance were among the top 10 most significant GO-functions identified.
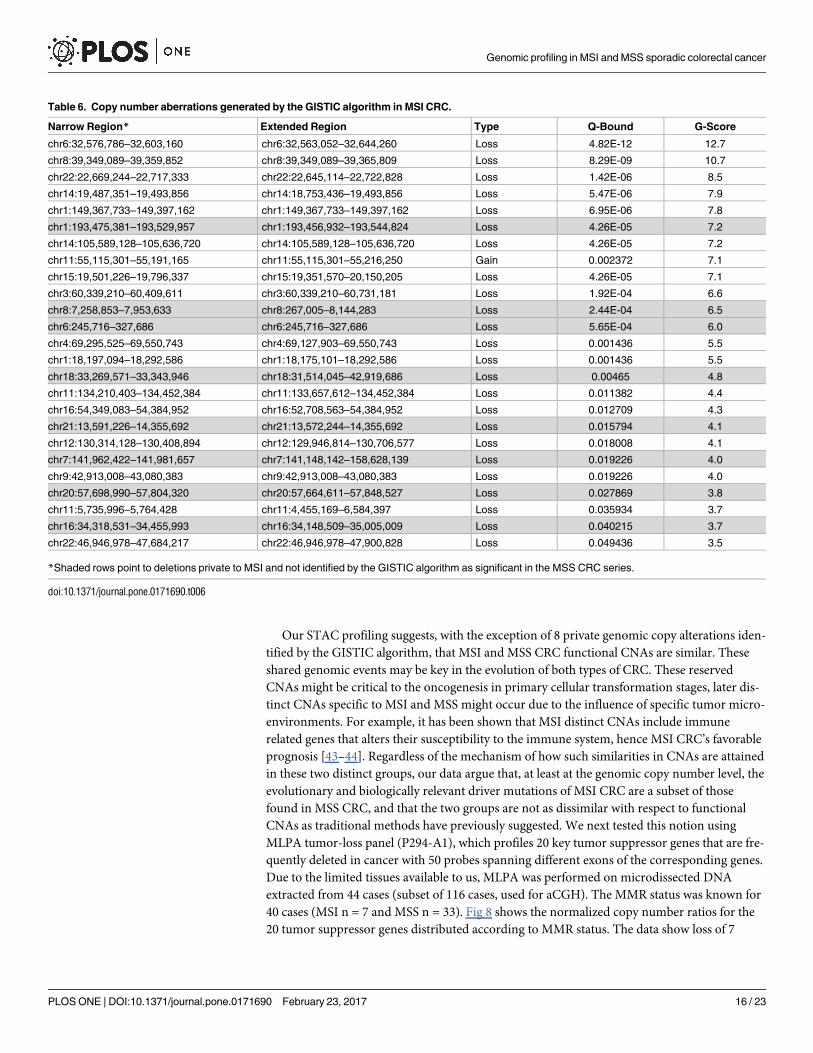
Deletions were the most overwhelming functional aberrations identified by the GISTIC
algorithm in MSI CRC (Fig 7B). As proposed by the STAC algorithm, the GISTIC-generated
regions in MSI corresponded precisely to regions on the MSS histogram (Fig 7 and Table 5).
However, GISTIC analysis identified 8 narrow autosomal regions specific to MSI CRC (Fig 7B
and 7C and Table 6).
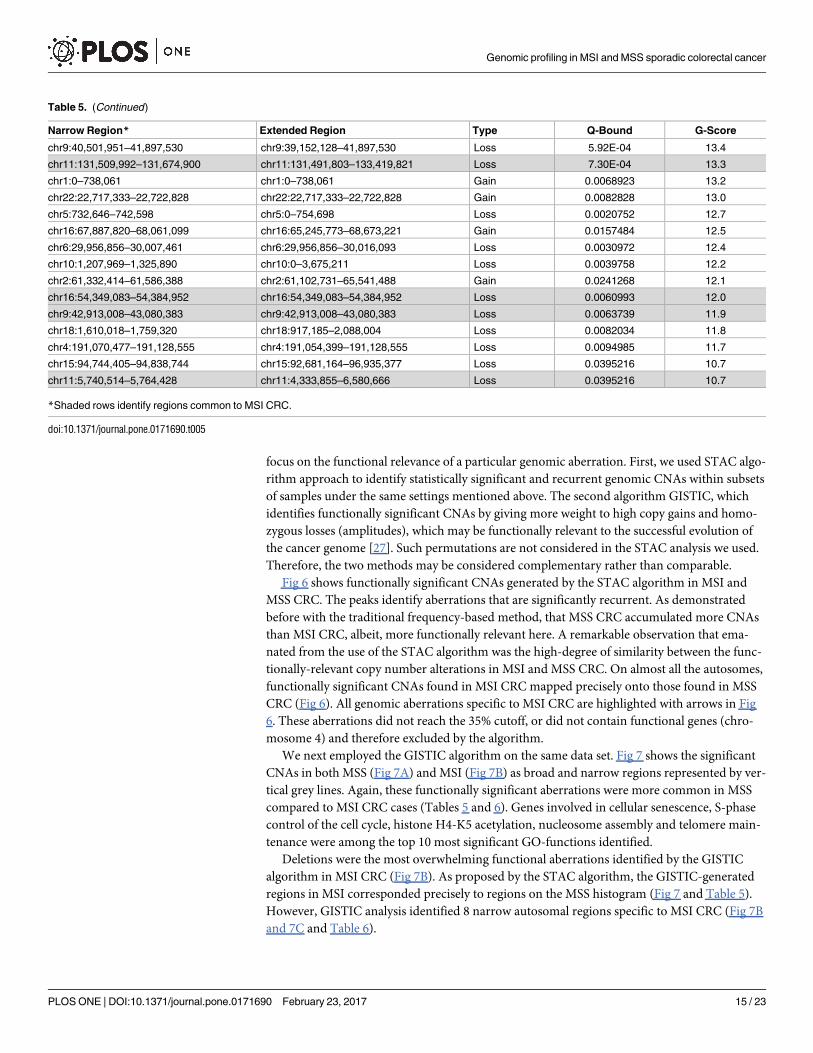
Table 5. (Continued)
Narrow Region* Extended Region Type Q-Bound G-Score
chr9:40,501,951–41,897,530 chr9:39,152,128–41,897,530 Loss 5.92E-04 13.4
chr11:131,509,992–131,674,900 chr11:131,491,803–133,419,821 Loss 7.30E-04 13.3
chr1:0–738,061 chr1:0–738,061 Gain 0.0068923 13.2
chr22:22,717,333–22,722,828 chr22:22,717,333–22,722,828 Gain 0.0082828 13.0
chr5:732,646–742,598 chr5:0–754,698 Loss 0.0020752 12.7
chr16:67,887,820–68,061,099 chr16:65,245,773–68,673,221 Gain 0.0157484 12.5
chr6:29,956,856–30,007,461 chr6:29,956,856–30,016,093 Loss 0.0030972 12.4
chr10:1,207,969–1,325,890 chr10:0–3,675,211 Loss 0.0039758 12.2
chr2:61,332,414–61,586,388 chr2:61,102,731–65,541,488 Gain 0.0241268 12.1
chr16:54,349,083–54,384,952 chr16:54,349,083–54,384,952 Loss 0.0060993 12.0
chr9:42,913,008–43,080,383 chr9:42,913,008–43,080,383 Loss 0.0063739 11.9
chr18:1,610,018–1,759,320 chr18:917,185–2,088,004 Loss 0.0082034 11.8
chr4:191,070,477–191,128,555 chr4:191,054,399–191,128,555 Loss 0.0094985 11.7
chr15:94,744,405–94,838,744 chr15:92,681,164–96,935,377 Loss 0.0395216 10.7
chr11:5,740,514–5,764,428 chr11:4,333,855–6,580,666 Loss 0.0395216 10.7
*Shaded rows identify regions common to MSI CRC.
doi:10.1371/journal.pone.0171690.t005
Genomic profiling in MSI and MSS sporadic colorectal cancer
PLOS ONE | DOI:10.1371/journal.pone.0171690 February 23, 2017 15 / 23
Our STAC profiling suggests, with the exception of 8 private genomic copy alterations iden-
tified by the GISTIC algorithm, that MSI and MSS CRC functional CNAs are similar. These
shared genomic events may be key in the evolution of both types of CRC. These reserved
CNAs might be critical to the oncogenesis in primary cellular transformation stages, later dis-
tinct CNAs specific to MSI and MSS might occur due to the influence of specific tumor micro-
environments. For example, it has been shown that MSI distinct CNAs include immune
related genes that alters their susceptibility to the immune system, hence MSI CRC’s favorable
prognosis [43–44]. Regardless of the mechanism of how such similarities in CNAs are attained
in these two distinct groups, our data argue that, at least at the genomic copy number level, the
evolutionary and biologically relevant driver mutations of MSI CRC are a subset of those
found in MSS CRC, and that the two groups are not as dissimilar with respect to functional
CNAs as traditional methods have previously suggested. We next tested this notion using
MLPA tumor-loss panel (P294-A1), which profiles 20 key tumor suppressor genes that are fre-
quently deleted in cancer with 50 probes spanning different exons of the corresponding genes.
Due to the limited tissues available to us, MLPA was performed on microdissected DNA
extracted from 44 cases (subset of 116 cases, used for aCGH). The MMR status was known for
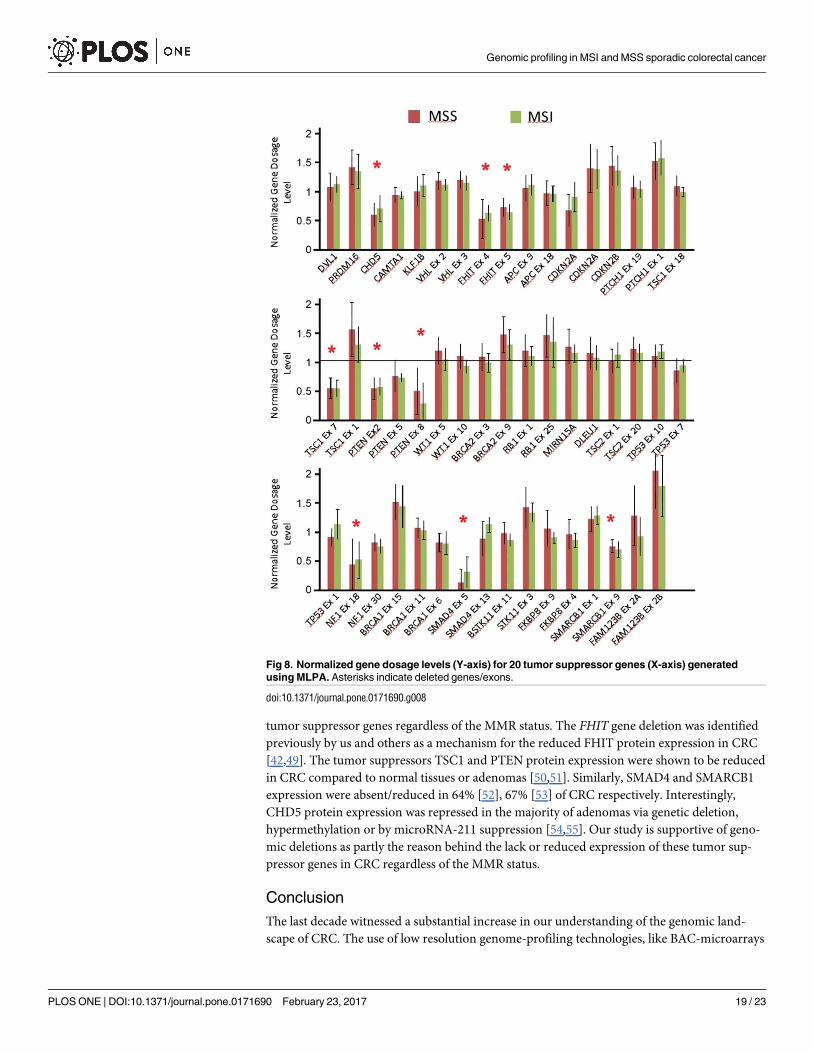
40 cases (MSI n = 7 and MSS n = 33). Fig 8 shows the normalized copy number ratios for the
20 tumor suppressor genes distributed according to MMR status. The data show loss of 7
Table 6. Copy number aberrations generated by the GISTIC algorithm in MSI CRC.
Narrow Region* Extended Region Type Q-Bound G-Score
chr6:32,576,786–32,603,160 chr6:32,563,052–32,644,260 Loss 4.82E-12 12.7
chr8:39,349,089–39,359,852 chr8:39,349,089–39,365,809 Loss 8.29E-09 10.7
chr22:22,669,244–22,717,333 chr22:22,645,114–22,722,828 Loss 1.42E-06 8.5
chr14:19,487,351–19,493,856 chr14:18,753,436–19,493,856 Loss 5.47E-06 7.9
chr1:149,367,733–149,397,162 chr1:149,367,733–149,397,162 Loss 6.95E-06 7.8
chr1:193,475,381–193,529,957 chr1:193,456,932–193,544,824 Loss 4.26E-05 7.2
chr14:105,589,128–105,636,720 chr14:105,589,128–105,636,720 Loss 4.26E-05 7.2
chr11:55,115,301–55,191,165 chr11:55,115,301–55,216,250 Gain 0.002372 7.1
chr15:19,501,226–19,796,337 chr15:19,351,570–20,150,205 Loss 4.26E-05 7.1
chr3:60,339,210–60,409,611 chr3:60,339,210–60,731,181 Loss 1.92E-04 6.6
chr8:7,258,853–7,953,633 chr8:267,005–8,144,283 Loss 2.44E-04 6.5
chr6:245,716–327,686 chr6:245,716–327,686 Loss 5.65E-04 6.0
chr4:69,295,525–69,550,743 chr4:69,127,903–69,550,743 Loss 0.001436 5.5
chr1:18,197,094–18,292,586 chr1:18,175,101–18,292,586 Loss 0.001436 5.5
chr18:33,269,571–33,343,946 chr18:31,514,045–42,919,686 Loss 0.00465 4.8
chr11:134,210,403–134,452,384 chr11:133,657,612–134,452,384 Loss 0.011382 4.4
chr16:54,349,083–54,384,952 chr16:52,708,563–54,384,952 Loss 0.012709 4.3
chr21:13,591,226–14,355,692 chr21:13,572,244–14,355,692 Loss 0.015794 4.1
chr12:130,314,128–130,408,894 chr12:129,946,814–130,706,577 Loss 0.018008 4.1
chr7:141,962,422–141,981,657 chr7:141,148,142–158,628,139 Loss 0.019226 4.0
chr9:42,913,008–43,080,383 chr9:42,913,008–43,080,383 Loss 0.019226 4.0
chr20:57,698,990–57,804,320 chr20:57,664,611–57,848,527 Loss 0.027869 3.8
chr11:5,735,996–5,764,428 chr11:4,455,169–6,584,397 Loss 0.035934 3.7
chr16:34,318,531–34,455,993 chr16:34,148,509–35,005,009 Loss 0.040215 3.7
chr22:46,946,978–47,684,217 chr22:46,946,978–47,900,828 Loss 0.049436 3.5
*Shaded rows point to deletions private to MSI and not identified by the GISTIC algorithm as significant in the MSS CRC series.
doi:10.1371/journal.pone.0171690.t006
Genomic profiling in MSI and MSS sporadic colorectal cancer
PLOS ONE | DOI:10.1371/journal.pone.0171690 February 23, 2017 16 / 23
tumor suppressor genes in this cohort; CHD5, FHIT, TSC1 (exon 7), PTEN, NF1, SMAD4(exon 5), and SMARCB1 (exon 9) irrespective of the MMR status (Fig 8).
The genomic aberrations detected in MSS and MSI may have a direct effect on genes’
expression, which are thought to be the driving force of disease pathology of both types of
tumors as suggested previously by several groups [45–48]. Kheurekseid et al., (2013) identified
a comprehensive list of genes showing clear differential expression patterns in CRC. Most
of these genes are located in genomic regions well affected by the aberrations found in our
study. Unfortunately, we were limited by the use of FFPE tissues to pursue each of the genes
located within the CNAs identified. Understanding the molecular impact of these expression
Fig 6. Frequency profiles of copy number aberrations from 89 MSS (middle histogram; with gains
above 0% line shown as blue peaks and below 0% as deletions in red) and 19 MSI CRC cases (divided
histogram; upper showing gains in blue and lower histogram shows deletions in red). The vertical grey
lines indicate significant peaks of copy number alterations. Notice how these peaks align precisely in both
MSS and MSI CRC. Copy number aberrations that are private for MSI CRC cases are marked with red arrows
for deletions and blue arrows for amplifications. Below each red arrow are the corresponding chromosomal
region ideogram and a zoomed histogram focused on the red arrowed region. The histograms show deletions
in red and amplifications in blue and significant STAC-generated peaks in grey as stated above. Deletions
marked with asterisks correspond to the deletions marked with the red arrows. All these aberrations are not
considered in the exported regions because they do not reach the 35% cutoff value (marked horizontal black
lines on chromosome 9). Note how the marked FHIT deletion crosses the 35% line. The individual copy
number alteration for each patient from 19 MSI cases are shown as small vertical red and blue bars indicating
deletions and amplifications respectively. Note how well-demarcated are these recurrent aberrations.
doi:10.1371/journal.pone.0171690.g006
Genomic profiling in MSI and MSS sporadic colorectal cancer
PLOS ONE | DOI:10.1371/journal.pone.0171690 February 23, 2017 17 / 23
alterations would provide a better understanding of the molecular pathology of CRC. Localiz-
ing the culprit genes involved in CNAs can also serve as molecular markers to aid in diagnosis,
follow up and most importantly potential development of individualized therapeutic strategies.
This study therefore was limited in its approach and may benefit from a direct correlation
between genes located within the CNAs and their expression. Nevertheless, this study illumi-
nated genomic deletions as a possible mechanism for loss or reduced expression of the 7
Fig 7. GISTIC analysis of MSS and MSI CRC copy number aberrations. a) Histogram profile of the
autosome from 89 MSS and b) from 19 MSI CRC. Deviations up from 0% represent copy number gains and
are colored blue, while deviations below the 0% line represent copy number losses and are colored red.
Vertical grey lines indicate regions identified as significant using the Q-Bound (p>0.05) and G-score>1.
Asterisks, pinpoint narrow GISTIC regions identified only in MSI CRC cases. c) Zoomed in view of the regions
private to MSI CRC showing the corresponding chromosome ideogram on top and focused GISTIC-identified
areas with broad (grey) and narrow (dark grey) zones along the histograms (middle) and the 19 patients
(lower panels), each represented in a horizontal line indicating the deletions in red, homozygous deletions in
dark red/broad red lines and amplifications in blue.
doi:10.1371/journal.pone.0171690.g007
Genomic profiling in MSI and MSS sporadic colorectal cancer
PLOS ONE | DOI:10.1371/journal.pone.0171690 February 23, 2017 18 / 23
tumor suppressor genes regardless of the MMR status. The FHIT gene deletion was identified
previously by us and others as a mechanism for the reduced FHIT protein expression in CRC
[42,49]. The tumor suppressors TSC1 and PTEN protein expression were shown to be reduced
in CRC compared to normal tissues or adenomas [50,51]. Similarly, SMAD4 and SMARCB1
expression were absent/reduced in 64% [52], 67% [53] of CRC respectively. Interestingly,
CHD5 protein expression was repressed in the majority of adenomas via genetic deletion,
hypermethylation or by microRNA-211 suppression [54,55]. Our study is supportive of geno-
mic deletions as partly the reason behind the lack or reduced expression of these tumor sup-
pressor genes in CRC regardless of the MMR status.
Conclusion
The last decade witnessed a substantial increase in our understanding of the genomic land-
scape of CRC. The use of low resolution genome-profiling technologies, like BAC-microarrays
Fig 8. Normalized gene dosage levels (Y-axis) for 20 tumor suppressor genes (X-axis) generated
using MLPA. Asterisks indicate deleted genes/exons.
doi:10.1371/journal.pone.0171690.g008
Genomic profiling in MSI and MSS sporadic colorectal cancer
PLOS ONE | DOI:10.1371/journal.pone.0171690 February 23, 2017 19 / 23
to identify copy number differences between MSS and MSI CRCs propagated the notion that
these two subtypes of CRC are substantially different at the copy number level. Our high reso-
lution genetic profiling of CRC supports this genomic heterogeneity between MSS and MSI
CRC. For example, MSS-CRC had more numerous larger aberrations while MSI-CRC had
smaller-sized aberrations. Moreover, there were distinct patterns of genomic aberrations in
CRC, one of which, pattern 2 (chromothripsis-like) was significantly enriched in MSI CRC,
while MSS CRC was significantly associated with Pattern 3 (loss/gain of whole chromosomes
or chromosome arms). In fact, the examination of the genomic histograms showed significant
differences between MSI and MSS as previously reported. However, closer inspection of the
patterns generated suggests that, although there were unique copy number differences, MSI
and MSS CRC functional copy number aberrations are similar. These shared genomic events
could highlight key events in the evolution of both types of CRC. This finding supports the
hypothesis that driver mutations incurred by CNAs in MSI CRC are also found in MSS CRC,
and that the two groups are not as dissimilar in respect to CRC development. Our results sug-
gest that MSI and MSS copy number aberrations driving CRC development may be function-
ally comparable.
Acknowledgments
This work was supported by grant number 2011-1302-06, given to Prof. Fahd Al-Mulla by the
Kuwait Foundation for the Advancement of Sciences KFAS. We wish to thank Mrs Sindhu
Jacob, and Mrs Diana Thomas for their technical assistance.
Author Contributions
Conceptualization: HA FA.
Data curation: HA FA AA.
Formal analysis: HA FA.
Funding acquisition: FA.
Investigation: HA MM.
Methodology: HA FA.
Project administration: HA FA.
Resources: HA FA.
Software: HA FA.
Supervision: MB FA.
Validation: MB.
Visualization: AA.
Writing – original draft: HA FA.
Writing – review & editing: HA.
References1. Mertens F, Johansson B, Hoglund M, Mitelman F. Chromosomal imbalance maps of malignant solid
tumors: a cytogenetic survey of 3185 neoplasms. Cancer research 1997; 57(13):2765–2780. PMID:
9205089
Genomic profiling in MSI and MSS sporadic colorectal cancer
PLOS ONE | DOI:10.1371/journal.pone.0171690 February 23, 2017 20 / 23
2. Korn WM, Yasutake T, Kuo WL, Warren RS, Collins C, Tomita M, et al. Chromosome arm 20q gains
and other genomic alterations in colorectal cancer metastatic to liver, as analyzed by comparative geno-
mic hybridization and fluorescence in situ hybridization. Genes, chromosomes & cancer 1999; 25
(2):82–90.
3. Ried T, Knutzen R, Steinbeck R, Blegen H, Schrock E, Heselmeyer K, et al. Comparative genomic
hybridization reveals a specific pattern of chromosomal gains and losses during the genesis of colorec-
tal tumors. Genes, chromosomes & cancer 1996; 15(4):234–245.
4. Diep CB, Parada LA, Teixeira MR, Eknaes M, Nesland JM, Johansson B, et al. Genetic profiling of colo-
rectal cancer liver metastases by combined comparative genomic hybridization and G-banding analy-
sis. Genes, chromosomes & cancer 2003; 36(2):189–197.
5. Aragane H, Sakakura C, Nakanishi M, Yasuoka R, Fujita Y, Taniguchi H, et al. Chromosomal aberra-
tions in colorectal cancers and liver metastases analyzed by comparative genomic hybridization. Inter-
national journal of cancer 2001; 94(5):623–629. PMID: 11745455
6. Nakao K, Shibusawa M, Ishihara A, Yoshizawa H, Tsunoda A, Kusano M, et al. Genetic changes in
colorectal carcinoma tumors with liver metastases analyzed by comparative genomic hybridization and
DNA ploidy. Cancer 2001; 91(4):721–726. PMID: 11241239
7. Al-Mulla F, Keith WN, Pickford IR, Going JJ, Birnie GD. Comparative genomic hybridization analysis of
primary colorectal carcinomas and their synchronous metastases. Genes, chromosomes & cancer
1999; 24(4):306–314.
8. Kallioniemi A. CGH microarrays and cancer. Current opinion in biotechnology 2008; 19(1):36–40. doi:
10.1016/j.copbio.2007.11.004 PMID: 18162393
9. Pinkel D, Segraves R, Sudar D, Clark S, Poole I, Kowbel D, et al. High resolution analysis of DNA copy
number variation using comparative genomic hybridization to microarrays. Nature genetics 1998; 20
(2):207–211. doi: 10.1038/2524 PMID: 9771718
10. Pollack JR, Perou CM, Alizadeh AA, Eisen MB, Pergamenschikov A, Williams CF, et al. Genome-wide
analysis of DNA copy-number changes using cDNA microarrays. Nature genetics 1999; 23(1):41–46.
doi: 10.1038/12640 PMID: 10471496
11. Kallioniemi OP, Kallioniemi A, Piper J, Isola J, Waldman FM, Gray JW, et al. Optimizing comparative
genomic hybridization for analysis of DNA sequence copy number changes in solid tumors. Genes,
chromosomes & cancer 1994; 10(4):231–243.
12. Bentz M, Plesch A, Stilgenbauer S, Dohner H, Lichter P. Minimal sizes of deletions detected by compar-
ative genomic hybridization. Genes, chromosomes & cancer 1998; 21(2):172–175.
13. Pinkel D, Albertson DG. Array comparative genomic hybridization and its applications in cancer. Nature
genetics 2005; 37 Suppl:S11–17.
14. Barrett MT, Scheffer A, Ben-Dor A, Sampas N, Lipson D, Kincaid R, et al. Comparative genomic hybrid-
ization using oligonucleotide microarrays and total genomic DNA. Proceedings of the National Academy
of Sciences of the United States of America 2004; 101(51):17765–17770. doi: 10.1073/pnas.
0407979101 PMID: 15591353
15. Jones AM, Douglas EJ, Halford SE, Fiegler H, Gorman PA, Roylance RR, Carter NP, Tomlinson IP:
Array-CGH analysis of microsatellite-stable, near-diploid bowel cancers and comparison with other
types of colorectal carcinoma. Oncogene 2005, 24(1):118–129. doi: 10.1038/sj.onc.1208194 PMID:
15531920
16. Al-Mulla F, Behbehani AI, Bitar MS, Varadharaj G, Going JJ. Genetic profiling of stage I and II colorectal
cancer may predict metastatic relapse. Mod Pathol 2006; 19(5):648–658. doi: 10.1038/modpathol.
3800564 PMID: 16528379
17. Al-Mulla F. Microarray-based CGH and copy number analysis of FFPE samples. Methods in molecular
biology 2011; 724:131–145. doi: 10.1007/978-1-61779-055-3_9 PMID: 21370011
18. Bejjani BA, Shaffer LG. Application of array-based comparative genomic hybridization to clinical diag-
nostics. J Mol Diagn 2006; 8(5):528–533. doi: 10.2353/jmoldx.2006.060029 PMID: 17065418
19. Lockwood WW, Chari R, Chi B, Lam WL. Recent advances in array comparative genomic hybridization
technologies and their applications in human genetics. European journal of human genetics: EJHG
2006; 14(2):139–148. doi: 10.1038/sj.ejhg.5201531 PMID: 16288307
20. Douglas EJ, Fiegler H, Rowan A, Halford S, Bicknell DC, Bodmer W, et al. Array comparative genomic
hybridization analysis of colorectal cancer cell lines and primary carcinomas. Cancer research 2004;
64(14):4817–4825. doi: 10.1158/0008-5472.CAN-04-0328 PMID: 15256451
21. Meacham CE, Morrison SJ. Tumour heterogeneity and cancer cell plasticity. Nature 2013; 501
(7467):328–337. doi: 10.1038/nature12624 PMID: 24048065
22. Ashktorab H, Schaffer AA, Daremipouran M, Smoot DT, Lee E, Brim H. Distinct genetic alterations in
colorectal cancer. PloS one 2010; 5(1):e8879. doi: 10.1371/journal.pone.0008879 PMID: 20126641
Genomic profiling in MSI and MSS sporadic colorectal cancer
PLOS ONE | DOI:10.1371/journal.pone.0171690 February 23, 2017 21 / 23
23. Marisa L, de Reynies A, Duval A, Selves J, Gaub MP, Vescovo L, et al. Gene expression classification
of colon cancer into molecular subtypes: characterization, validation, and prognostic value. PLoS medi-
cine 2013; 10(5):e1001453. doi: 10.1371/journal.pmed.1001453 PMID: 23700391
24. Ji X, Tang J, Halberg R, Busam D, Ferriera S, Pena MM, et al. Distinguishing between cancer driver
and passenger gene alteration candidates via cross-species comparison: a pilot study. BMC cancer
2010; 10:426. doi: 10.1186/1471-2407-10-426 PMID: 20707908
25. Zack TI, Schumacher SE, Carter SL, Cherniack AD, Saksena G, Tabak B, et al. Pan-cancer patterns of
somatic copy number alteration. Nature genetics 2013; 45(10):1134–1140. doi: 10.1038/ng.2760
PMID: 24071852
26. Chin L, Hahn WC, Getz G, Meyerson M. Making sense of cancer genomic data. Genes Dev 2011; 25
(6):534–555. doi: 10.1101/gad.2017311 PMID: 21406553
27. Mermel CH, Schumacher SE, Hill B, Meyerson ML, Beroukhim R, Getz G. GISTIC2.0 facilitates sensi-
tive and confident localization of the targets of focal somatic copy-number alteration in human cancers.
Genome biology 2011; 12(4):R41. doi: 10.1186/gb-2011-12-4-r41 PMID: 21527027
28. Lassmann S, Weis R, Makowiec F, Roth J, Danciu M, Hopt U, et al. Array CGH identifies distinct DNA
copy number profiles of oncogenes and tumor suppressor genes in chromosomal- and microsatellite-
unstable sporadic colorectal carcinomas. Journal of molecular medicine 2007; 85(3):293–304. doi: 10.
1007/s00109-006-0126-5 PMID: 17143621
29. Bosso M, Al-Mulla F. Whole genome amplification of DNA extracted from FFPE tissues. Methods in
molecular biology 2011; 724:161–180. doi: 10.1007/978-1-61779-055-3_11 PMID: 21370013
30. Al-Mulla F. Microarray-based CGH and copy number analysis of FFPE samples. Methods in molecular
biology 2011; 724:131–145. doi: 10.1007/978-1-61779-055-3_9 PMID: 21370011
31. Al-Mulla F, Al-Tamimi R. Uses of microarray platforms in cancer: a correlative study between genomic
copy number changes and their expression at mRNA and protein levels. Methods in molecular biology
2007; 382:77–95. doi: 10.1007/978-1-59745-304-2_6 PMID: 18220226
32. Loo LW, Tiirikainen M, Cheng I, Lum-Jones A, Seifried A, Church JM, et al. Integrated analysis of
genome-wide copy number alterations and gene expression in microsatellite stable, CpG island methyl-
ator phenotype-negative colon cancer. Genes, chromosomes & cancer 2013; 52(5):450–466.
33. Trautmann K, Terdiman JP, French AJ, Roydasgupta R, Sein N, Kakar S, et al. Chromosomal instability
in microsatellite-unstable and stable colon cancer. Clinical cancer research: an official journal of the
American Association for Cancer Research 2006; 12(21):6379–6385.
34. Jasmine F, Rahaman R, Dodsworth C, Roy S, Paul R, Raza M, et al. A genome-wide study of cyto-
genetic changes in colorectal cancer using SNP microarrays: opportunities for future personalized treat-
ment. PloS one 2012; 7(2):e31968. doi: 10.1371/journal.pone.0031968 PMID: 22363777
35. Camps J, Armengol G, del Rey J, Lozano JJ, Vauhkonen H, Prat E, et al. Genome-wide differences
between microsatellite stable and unstable colorectal tumors. Carcinogenesis 2006; 27(3):419–428.
doi: 10.1093/carcin/bgi244 PMID: 16272173
36. Dyrso T, Li J, Wang K, Lindebjerg J, Kolvraa S, Bolund L, et al. Identification of chromosome aberra-
tions in sporadic microsatellite stable and unstable colorectal cancers using array comparative genomic
hybridization. Cancer genetics 2011; 204(2):84–95. doi: 10.1016/j.cancergencyto.2010.08.019 PMID:
21504706
37. Martin ES, Tonon G, Sinha R, Xiao Y, Feng B, Kimmelman AC, et al. Common and distinct genomic
events in sporadic colorectal cancer and diverse cancer types. Cancer research 2007; 67(22):10736–
10743. doi: 10.1158/0008-5472.CAN-07-2742 PMID: 18006816
38. Jones MJ, Jallepalli PV. Chromothripsis: chromosomes in crisis. Developmental cell 2012; 23(5):908–
917. doi: 10.1016/j.devcel.2012.10.010 PMID: 23153487
39. Kloosterman WP, Hoogstraat M, Paling O, Tavakoli-Yaraki M, Renkens I, Vermaat JS, et al. Chromo-
thripsis is a common mechanism driving genomic rearrangements in primary and metastatic colorectal
cancer. Genome biology 2011; 12(10):R103. doi: 10.1186/gb-2011-12-10-r103 PMID: 22014273
40. Kloosterman WP, Guryev V, van Roosmalen M, Duran KJ, de Bruijn E, Bakker SC, et al. Chromothrip-
sis as a mechanism driving complex de novo structural rearrangements in the germline. Human molec-
ular genetics 2011; 20(10):1916–1924. doi: 10.1093/hmg/ddr073 PMID: 21349919
41. Diskin SJ, Eck T, Greshock J, Mosse YP, Naylor T, Stoeckert CJ Jr., et al. STAC: A method for testing
the significance of DNA copy number aberrations across multiple array-CGH experiments. Genome
Res 2006; 16(9):1149–1158. doi: 10.1101/gr.5076506 PMID: 16899652
42. Al-Temaimi RA, Jacob S, Al-Ali W, Thomas DA, Al-Mulla F. Reduced FHIT expression is associated
with mismatch repair deficient and high CpG island methylator phenotype colorectal cancer. The journal
of histochemistry and cytochemistry: official journal of the Histochemistry Society 2013; 61(9):627–
638.
Genomic profiling in MSI and MSS sporadic colorectal cancer
PLOS ONE | DOI:10.1371/journal.pone.0171690 February 23, 2017 22 / 23
43. Nosho K, Baba Y, Tanaka N, Shima K, Hayashi M, Meyerhardt JA, et al. Tumour-infiltrating T-cell sub-
sets, molecular changes in colorectal cancer, and prognosis: cohort study and literature review. The
Journal of pathology 2010; 222(4):350–366. doi: 10.1002/path.2774 PMID: 20927778
44. Mlecnik B, Bindea G, Angell HK, Maby P, Angelova M, Tougeron D, et al. Integrative Analyses of Colo-
rectal Cancer Show Immunoscore Is a Stronger Predictor of Patient Survival Than Microsatellite Insta-
bility. Immunity 2016; 44(3):698–711. doi: 10.1016/j.immuni.2016.02.025 PMID: 26982367
45. Jorissen RN, Lipton L, Gibbs P, Chapman M, Desai J, Jones IT, et al. DNA copy-number alterations
underlie gene expression differences between microsatellite stable and unstable colorectal cancers.
Clinical cancer research: an official journal of the American Association for Cancer Research 2008; 14
(24):8061–8069.
46. Chu CM, Yao CT, Chang YT, Chou HL, Chou YC, Chen KH, et al. Gene expression profiling of colorec-
tal tumors and normal mucosa by microarrays meta-analysis using prediction analysis of microarray,
artificial neural network, classification, and regression trees. Disease markers 2014; 2014:634123. doi:
10.1155/2014/634123 PMID: 24959000
47. Kheirelseid EA, Miller N, Chang KH, Nugent M, Kerin MJ. Clinical applications of gene expression in
colorectal cancer. Journal of gastrointestinal oncology 2013; 4(2):144–157. doi: 10.3978/j.issn.2078-
6891.2013.010 PMID: 23730510
48. Calon A, Lonardo E, Berenguer-Llergo A, Espinet E, Hernando-Momblona X, Iglesias M, et al. Stromal
gene expression defines poor-prognosis subtypes in colorectal cancer. Nature genetics 2015; 47
(4):320–329. doi: 10.1038/ng.3225 PMID: 25706628
49. Sarli L, Bottarelli L, Azzoni C, Campanini N, Di Cola G, Bader G, et al. Abnormal Fhit protein expression
and high frequency of microsatellite instability in sporadic colorectal cancer. European journal of cancer
2004; 40(10):1581–1588. doi: 10.1016/j.ejca.2004.02.021 PMID: 15196543
50. Lee S, Bang S, Song K, Lee I. Differential expression in normal-adenoma-carcinoma sequence sug-
gests complex molecular carcinogenesis in colon. Oncology reports 2006; 16(4):747–754. PMID:
16969489
51. Sawai H, Yasuda A, Ochi N, Ma J, Matsuo Y, Wakasugi T, et al. Loss of PTEN expression is associated
with colorectal cancer liver metastasis and poor patient survival. BMC gastroenterology 2008; 8:56.
doi: 10.1186/1471-230X-8-56 PMID: 19036165
52. Salovaara R, Roth S, Loukola A, Launonen V, Sistonen P, Avizienyte E, et al. Frequent loss of SMAD4/
DPC4 protein in colorectal cancers. Gut 2002; 51(1):56–59. PMID: 12077092
53. Pancione M, Remo A, Zanella C, Sabatino L, Di Blasi A, Laudanna C, et al. The chromatin remodelling
component SMARCB1/INI1 influences the metastatic behavior of colorectal cancer through a gene sig-
nature mapping to chromosome 22. Journal of translational medicine 2013; 11:297. doi: 10.1186/1479-
5876-11-297 PMID: 24286138
54. Fatemi M, Paul TA, Brodeur GM, Shokrani B, Brim H, Ashktorab H. Epigenetic silencing of CHD5, a
novel tumor-suppressor gene, occurs in early colorectal cancer stages. Cancer 2014; 120(2):172–180.
doi: 10.1002/cncr.28316 PMID: 24243398
55. Wang X, Lau KK, So LK, Lam YW. CHD5 is down-regulated through promoter hypermethylation in gas-
tric cancer. Journal of biomedical science 2009; 16:95. doi: 10.1186/1423-0127-16-95 PMID:
19840376
Genomic profiling in MSI and MSS sporadic colorectal cancer
PLOS ONE | DOI:10.1371/journal.pone.0171690 February 23, 2017 23 / 23