FUNCTIONALIZED POLYMERIC MATERIALS SUPPORTED NOBLE …
248
FUNCTIONALIZED POLYMERIC MATERIALS SUPPORTED NOBLE METAL NANOPARTICLES FOR CATALYZING INORGANIC AND ORGANIC REDOX REACTIONS By SANKARARAO CHAPPA CHEM01201304032 Bhabha Atomic Research Centre, Mumbai A thesis submitted to the Board of Studies in Chemical Sciences In partial fulfillment of requirements for the Degree of DOCTOR OF PHILOSOPHY of HOMI BHABHA NATIONAL INSTITUTE August, 2018
Transcript of FUNCTIONALIZED POLYMERIC MATERIALS SUPPORTED NOBLE …

FUNCTIONALIZED POLYMERIC MATERIALS SUPPORTED
NOBLE METAL NANOPARTICLES FOR CATALYZING
INORGANIC AND ORGANIC REDOX REACTIONS
By
SANKARARAO CHAPPA
CHEM01201304032
Bhabha Atomic Research Centre, Mumbai
A thesis submitted to the
Board of Studies in Chemical Sciences
In partial fulfillment of requirements
for the Degree of
DOCTOR OF PHILOSOPHY
of
HOMI BHABHA NATIONAL INSTITUTE
August, 2018

STATEMENT BY AUTHOR
This dissertation has been submitted in partial fulfillment of requirements for an advanced degree
at Homi Bhabha National Institute (HBNI) and is deposited in the Library to be made available to
borrowers under rules of the HBNI.
Brief quotations from this dissertation are allowable without special permission, provided that
accurate acknowledgement of source is made. Requests for permission for extended quotation
from or reproduction of this manuscript in whole or in part may be granted by the Competent
Authority of HBNI when in his or her judgment the proposed use of the material is in the interests
of scholarship. In all other instances, however, permission must be obtained from the author.
Sankararao Chappa

DECLARATION
I, hereby declare that the investigation presented in the thesis has been carried out by me. The work
is original and has not been submitted earlier as a whole or in part for a degree / diploma at this or
any other Institution / University.
Sankararao Chappa

LIST OF PUBLICATIONS ARISING FROM THE THESIS
Journal
1. Self-reducing asymmetric polymer membrane for in situ formation and containment of
noble metal nanocatalysts. S. Chappa, R.N. Shinde, A.K. Pandey, Green Chem. 2015, 17
(8), 4157–4161.
2. Egg-shell membrane mimicking synthetic polymer membrane supported palladium
nanoparticles for catalyzing reduction of uranyl (VI) ions. S. Chappa, A.M. Mhatre, V.C.
Adya, A.K Pandey, Appl. Catal. B Environ. 2017, 203, 53-64.
3. Dual-function grafted electrospun polymer nanofibers scaffold hosted palladium
nanoparticles for catalyzing the organic and inorganic redox reactions. S. Chappa, Bharath
R. Sundar Ram, Charlie Oommen and A.K. Pandey, Macromol. Chem. Phys. 2017, 218,
1600555.
4. Poly(ethylenimine) and poly(ethylene glycol methacrylate phosphate) anchored
membranes hosted palladium nanoparticles for catalyzing U(VI) ions reduction and
Mizoroki-Heck coupling reaction, S. Chappa, P.B. Rathod, A.K. Debnath, Debasis Sen
and A.K. Pandey, ACS Appl. Nano Mater. 2018, 1, 3259−3268.

Conferences
1. Nanocatalyst in synthetic polymer membranes for redox applications. S. Chappa and A.K.
Pandey, “Proceedings of International conference on Recent Advances in Analytical
Science” by Department of Chemistry, Indian Institute of Technology (IIT, BHU), April
7-9, 2016. (Best Paper award)
2. Poly (ethylene glycol methacrylate phosphate) anchored Fe3O4/membrane nanoparticles as
a multipurpose material. S. Chappa, P.B Rathod and A.K Pandey “Proceedings of
International Conference on Nanotechnology: Ideas, Innovations and Initiatives (ICN: 3I-
2017)” by IIT Roorkee during 06-08, December 2017, 72. (Best paper award)
3. Presented “Functionalized polymeric materials supported noble metal nanoparticls for
catalyzing inorganic and organic redox reactions.” S. Chappa and A.K. Pandey, At 30th
research scholars meet, by Indian chemical society (Mumbai branch) in association with
Department of chemistry, Jai Hid college, Mumbai during 9-10, February 2018, 39.
Sankararao Chappa

Dedicated To……
…… My Parents

ACKNOWLEDGEMENTS
I humbly grab this opportunity to express my profound gratitude to my supervisor, Prof. Ashok
Kumar Pandey for his constant encouragement from finding a challenging research problem, how
to approach a research problem, the need to be persistent to accomplish it, and to the process of
writing thesis. His logical way of thinking, explaining things and his wide knowledge on the
subject have created a lot of impact on me to learn things. He inspired me to become an
independent researcher with his exceptional scientific knowledge, skills, and values.
I am thankful to Dr. B S. Tomar and Prof. A K. Tyagi former and present Deans, chemical
sciences, HBNI for permitting me to register for my Ph.D. I would like to thank Dr. P K. Pujari,
Assosiate director and Head, Radiochemistry division, BARC for his constant support and
encouragement. My sincere thanks must go to members of my doctoral committee: Prof. R C.
Bindal (chairman), Prof. Manmohan Kumar, Dr. Sk. Musharaf Ali, and Dr. Virendra Kumar
for their valuable suggestions and comments.
I am grateful to all the teachers in my life who had taught me and encouraged me to achieve
my goals. I am very much thankful to Mr. K. Trinath, Mr. Chinni babu, Mr. Srinivas, Mr.
Chakradhar, Mr. CH. Sivunnaidu, Mr. B. Venkataramana, Dr. N. Sivaraman for their
inspiration.
I express my sincere thanks to my fellow labmates: Mr. Amol Mhatre, Mr. Prakash
Rathod, Dr. Seraj Ansari, Dr. Rajesh gujar, Mr. D.R. Prabhu, Dr. Dhaval raut, Mr. Avinash
Kanekar, Mr. Parveen Kumar Verma, Dr. B.N. Mohanty, Dr. C. Agarwal, Dr. Sanhita
Chaudhury, Dr. Rakesh Shinde, Dr. V.R. Chavan, Ms. Apurna Naik, Dr. A. Bhattacharya,
Dr. D. Dutta, Dr. K. Sudarsan, Dr. S. Sodaye, Dr. R. Tripathi, Dr. Priya Maheswari, Dr. S.

Mukharjee, Dr. A. Sengupta, Dr. S.K. Gupta, Mr. N. Pathak, Mr. V. Telmore for their
constant support and encouragement during the course of the present work.
I express my sincere thanks to my collaborators, who have contributed significantly to
make my work complete in all aspects. I am very much grateful to Dr. Charlie Oommen, Dr.
Chandru, Mr. Bharath, Mrs. Rekha, Sri. Shashikumar of Aerospace engineering, IISc,
Bangalore. Dr. R Gupta and Dr. V.C. Adya, BARC for their help. I am also thankful to the
operating personnel of sophisticated Analytical Instrumentation Facility (SAIF), IIT Bombay,
Mumbai for providing FE-SEM facility on chargeable basis.
I am also thankful to my friends: Mr. Satyanarayana, Mr. Praveen Kumar, Mr.
Srinivasarao, Mr. Mohan, Mr. Parasuramu, Ms. Prasanna, Ms. Bharathi, Mr. Sudheer, Dr.
Krishna, Mr. YA Naidu, Dr. Omkar, Mr. Raveendra Kumar, Dr. K. D Prasad, Dr. Guravaih,
Dr. Parthiban, Dr. Raja. Mr. Murali, Dr. M. Naik, Dr. Chhillar, Mr. R. Mehta, Mr. GK.
Mourya, Mr. SA. Khan, Dr. P. Maity, Mr. A. Sharma, Mr. A. Kaushik, Mr. T. Roy, Mr.
Rahul, Mr. V. Belwanshi, Mr. R. Dhawan, Dr. V. Rastogi, Dr. N. Singh, Dr. S. Kumar for
their love and support.
It is very difficult to find the right words to express my gratitude to my parents for their
love, care and support. I express my sincere gratitude to my brothers Raju and Ramesh, my sister
in-laws Radha and Lakshmi, my niece Gayatri, Harika, and Geeta, my nephew Ganesh for
their endless love and support. My sincere thanks to my family friends Kiran, Mrs. Gowri,
Satyam, Mrs. Simhachalam, Ms. Havanthi, Mrs. Lavanya, Mrs. Tulasi for their endless love
and support. And last, but certainly not least, my sincere thanks to all people who have helped
directly or indirectly towards the completion of this thesis.
Sankararao Chappa

CONTENTS
SYNOPSIS .................................................................................................................................... i
LIST OF FIGURES ................................................................................................................... xiii
LIST OF TABLES ................................................................................................................... xxii
LIST OF SCHEMES ............................................................................................................... xxiv
ABBREVIATIONS .................................................................................................................. xxv
INTRODUCTION ........................................................................................... 1
1.1 Introduction to nanoscience ......................................................................................... 2
1.1.1 Nanomaterials ........................................................................................................... 3
1.1.2 Why nanomaterials are different ............................................................................... 4
1.1.3 Properties of nanomaterials....................................................................................... 7
1.2 Syntheses of nanomaterials .......................................................................................... 9
1.2.1 Bottom up approach: Mechanism of growth/formation of nanoparticles ................. 9
1.2.2 Top down approach................................................................................................. 18
1.3 Metal nanoparticles as catalyst .................................................................................. 18
1.4 Immobilization of nanocatalyst on solid supports ..................................................... 25
1.4.1 Synthetic polymer membranes as host matrix ........................................................ 25
1.4.2 Bio-polymers as host matrix ................................................................................... 27
1.4.3 Electrospun fibres mat ............................................................................................ 28
1.5 Scope of the thesis...................................................................................................... 30
EXPERIMENTAL......................................................................................... 31
2.1 Nanoparticles synthesis .............................................................................................. 32
2.1.1 Experimental methods used for syntheses of noble metal NPs .............................. 32
2.2 Analytical techniques for characterization of nanoparticles ...................................... 39
2.2.1 Electron microscopy ............................................................................................... 39
2.2.2 Inductively coupled plasma-atomic emission spectroscopy (ICP-AES) ................ 42
2.2.3 Ultraviolet-Visible spectroscopy (UV-Vis) ............................................................ 43
2.2.4 X-ray diffraction (XRD) ......................................................................................... 47
2.2.5 Energy dispersive X-ray fluorescence (EDXRF) ................................................... 49
2.2.6 Nuclear Magnetic resonance spectroscopy (NMR) ................................................ 50
2.2.7 X-ray photoelectron spectroscopy (XPS) ............................................................... 52
2.2.8 Small angle X-ray scattering (SAXS) ..................................................................... 55
2.2.9 Capillary flow porometry (CFP) ............................................................................. 56
2.2.10 Electrospinning technique ....................................................................................... 59
2.3 Application of nanoparticles for catalysis .................................................................. 61
2.3.1 Reduction of p-nitrophenol (PNP) .......................................................................... 62
2.3.2 Reduction of methylene blue (MB) ........................................................................ 64
2.3.3 Hexavalent chromium reduction ............................................................................. 65
2.3.4 Reduction of uranium (VI to IV) ............................................................................ 66
SELF-REDUCING ASYMMETRIC POLYMER MEMBRANE FOR IN
SITU FORMATION AND CONTAINMENT OF NOBLE METAL
NANOCATALYSTS ................................................................................................ 67
3.1 Introduction ................................................................................................................ 68
3.2 Experimental .............................................................................................................. 70
3.2.1 Synthesis of self-reducing membrane ..................................................................... 70
3.2.2 Formation of noble metal NPs in self-reducing membrane .................................... 71
3.2.3 Reduction of p-nitrophenol (PNP) and methylene blue (MB) ................................ 71
3.2.4 Reduction of Cr(VI) ions ........................................................................................ 72
3.3 Results and discussion ............................................................................................... 73
3.4 Conclusions ................................................................................................................ 86
PALLDIUM NANOPARTICLES HOSTD IN
HYDRAZINE/SULFONATE ANCHORED MEMBRANES FOR
CATALYZING REDUCTION OF URANYL(VI) IONS..................................... 87
4.1 Introduction ................................................................................................................ 88
4.2 Experimental .............................................................................................................. 91
4.2.1 Formation of Pd NPs embedded neutral membrane ............................................... 92
4.2.2 Formation of Pd NPs embedded cation-exchange membrane ................................ 93
4.2.3 Determination of Pd0 content loaded in membranes ............................................... 94
4.2.4 Characterizations of membranes ............................................................................. 94
4.2.5 Reduction of U(VI) ions ......................................................................................... 95
4.3 Results and discussion ............................................................................................... 98
4.3.1 Characterizations of Pd NPs embedded membranes .............................................. 98
4.3.2 Comparison of catalytic activities of Pd NPs embedded membrane. ................... 107
4.3.3 Quantification of U(VI) ions reduction with formic acid ..................................... 112
4.3.4 Kinetics of reduction ............................................................................................. 116
4.3.5 Enhancement of kinetics of reduction using sonication ....................................... 117
4.4 Conclusions .............................................................................................................. 118

GRAFTED-ELECTROSPUN POLYMER MICROFIBER SCAFFOLD
HOSTED PALLADIUM NANOPARTICLES FOR CATALYZING REDOX
REACTIONS .......................................................................................................... 120
5.1 Introduction .............................................................................................................. 121
5.2 Experimental ............................................................................................................ 124
5.2.1 Preparation of electrospun PES microfibers mat .................................................. 124
5.2.2 Chemical treatments.............................................................................................. 126
5.2.3 Reductions of U(VI), Cr(VI) and p-nitrophenol ................................................... 127
5.3 Results and discussion ............................................................................................. 128
5.3.1 Formation of Pd NPs embedded PES fibers mat .................................................. 128
5.3.2 Catalytic reduction of U(VI) ions ......................................................................... 133
5.3.3 Catalytic reduction of Cr(VI) anions .................................................................... 135
5.3.4 Catalytic reduction of p-nitrophenol ..................................................................... 137
5.4 Conclusions .............................................................................................................. 142
PALLADIUM NANOPARTICLES HOSTED IN
POLY(ETHYLENIMINE) AND POLY(ETHYLENE GLYCOL
METHACRYLATE PHOSPHATE) ANCHORED MEMBRANES FOR
CATALYZING U(VI) IONS REDUCTION AND MIZOROKI-HECK
COUPLING REACTION...................................................................................... 144
6.1 Introduction .............................................................................................................. 145
6.2 Experimental ............................................................................................................ 147
6.2.1 Synthesis of Pd NPs on polyethylenimine (PEI) anchored membrane ................. 147
6.2.2 Synthesis of Pd NPs in poly(ethylene glycol methacrylate phosphate) (EGMP)
anchored membrane ............................................................................................................ 148
6.2.3 Characterizations of membranes ........................................................................... 148
6.2.4 Mizoroki-Heck coupling reaction ......................................................................... 150
6.2.5 Reduction of U(VI) ions ....................................................................................... 151
6.3 Results and discussion ............................................................................................. 151
6.3.1 Catalytic activities of Pd NPs embedded PEI and poly(EGMP) in U(VI) ions
reduction ............................................................................................................................. 162
6.3.2 Catalytic activities of Pd2+/Pd NPs loaded membranes for Mizoroki-Heck coupling
reaction 166
6.4 Conclusions .............................................................................................................. 173
SUMMARY AND FUTURE SCOPE ........................................................ 174
7.1 Summary of the present study and major conclusions ............................................. 175
7.1.1 Chemical synthesis involved in synthesis of noble metal nanoparticles in polymer
matrices ……………………………………………………………………………………176

7.1.2 Catalytic applications of the metal nanoparticles hosted on polymer matrices .... 176
7.2 Future scope ............................................................................................................. 178
REFERENCES ......................................................................................................................... 179

SYNOPSIS

Synopsis
ii
Nanomaterial science is the intermediate domain between atoms/molecules and macro-world,
where properties resemble neither to individual atoms nor bulk materials. In nanoscale region,
neither quantum chemistry nor the classical laws of physics hold. Most of the emerging
technologies of immense commercial importance such as catalysis, nanoelectronics, sensors,
energy conversion and storage are based upon the application of the functional nanomaterials. The
functional nanomaterials exhibit exceptional catalytic activity originating mainly from their size
reduction and shape variation.
In catalysis, the ability to accept or donate charge plays a key role. The electrons are
extensively delocalised and the extension of delocalisation varies with the size in nanoscale region.
Similarly, surface energies and surface morphologies are also size dependant. There are always
the questions of how the catalytic activity is affected by size in the regime between atoms and
bulk, what is the minimum bulk-like lattice required for normal catalytic behaviour, or is there
ideal size for which catalytic activity is maximized? The relationship between size and activity
depends on choice of a catalyst and nature of a reaction. The catalytic properties of nanocatalyst
would be influenced by at least two major factors: (1) changing the electronic structure of metallic
nanocatalysts i.e. increasing the Fermi level of the nanocatalyst leading to a lower reduction
potential of the metal on the surface of the nanocatalyst, and (2) increasing the number of
chemically unsaturated and thermodynamically high-energy active surface atoms. It is also known
that the type of exposed crystal planes (which can be controlled by the nanocatalyst shape) can
influence the activity and selectivity of the nanocatalyst. In some cases, the nanocatalysts exhibit
new properties due to plasmonic electromagnetic fields. However, the major problems in a large-
scale application of the nanoparticles as catalysts originate from: (1) reshaping of the nanocatalyst
during catalysis reaction, (2) products deposition on the surface could decrease the nanoparticle

Synopsis
iii
stability and limit their recycling, (3) capping materials on the surface of colloidal nanocatalysts
reduce their activity and can affect their Fermi energy, and (4) aggregation of the nanocatalysts.
It is interesting to note that the nanocatalysts are intermediate between conventional heterogeneous
catalysts and homogeneous catalysts. The nanocatlysts may be considered either as heterogeneous
catalyst or homogeneous catalyst depending upon the prevailing conditions. The common and
acceptable definition of colloidal heterogeneous nanocatalysis is when the reaction occurs on the
surface of nanoparticles. However, in homogeneous catalysis, the solvent can dissolve high-energy
atoms or ions from the sharp edges or corners of the nanoparticle surface and form a complex that
can catalyze the reaction in solution. With the help of molecular orbital (MO) theory, the
interaction between an adsorbate and a metal catalyst can be explained. Noble metal nanoparticles
show superior catalytic activity due to the formation of bonds between reactant molecules and the
surface atoms of the nanoparticles, which weakens the bonds in the reacting molecules resulting
to the lowering of activation barrier. Electronic structure and the geometry are the important
considerations in the metal nanoparticles catalysts. From Bronsted-Evans-Polanyi (BEP) relation,
the strong adsorption energies result in faster reaction rates for the first order surface reactions.
The BEP relation shows the small energy barriers for the strong binding, and thus the catalytic
performance is limited by desorption of products. However, in the case of weak binding, the
reaction rate is limited by the large activation energies as predicted by BEP. Therefore, an optimum
binding energy is needed for better performance of a catalyst.
Noble metal nanoparticles are most studied nanocatalysts because of their high surface area,
under-coordinated surface sites, quantum confinement effects, and their chemical stability.
However, because of their small size and high surface area, they often tend to agglomerate. Also,
it is difficult to withdraw the nanoparticles from the system/solution leading to recyclability and

Synopsis
iv
products contamination problems. In recent years, considerable efforts have been made to
effectively stabilize and prevent the agglomeration of nanoparticles. The nanoparticles in the form
of nanocomposites are extensively used in the optics, sensors and catalysis applications. Solid
supports like carbon nanomaterials, superparamagnetic iron oxides particles, porous/non-porous
inorganic nanoparticles (silica, titania, zirconia etc), natural and synthetic polymeric materials
(resins/beads/films/membranes) have been explored to host the nanocatalysts. Among all these
solid supports, the nanocatalysts immobilized on the magnetic nanoparticles and polymer
films/membranes are easily retrievable from the process in which they act as nanocatalysts. The
control over size and distribution of nanoparticles in the polymer matrix are the major issues in the
polymer nanocomposites that have to be taken care of. Also, the immobilization of nanoparticles
in the dense solid matrices may cause a diffusion resistance during the catalytic reaction. By
immobilizing the nanoparticles in an open matrix like microfiltration membrane, the diffusion
resistance can be minimised due to a high accessibility of the nanoparticles in porous matrix.
Therefore, the porous structure of the support matrix has advantage for attaining highly efficient
utilization of the available catalytic sites due to easy accessibility to the nanoparticles inside the
interior matrix.
A synthetic or bio-polymer membranes have been studied extensively as the host matrices to
stabilize nanoparticles. In general, the membranes provide an interphase that separates two phases
and controls the selective transport of a component from one phase into the other. Membranes can
be porous or homogeneous dense membranes. The transport in the dense membrane occurs through
hopping between ion-exchange sites or functional groups. Structure of the membrane may be
isotropic (symmetric: the structure is identical over the cross-section of the membrane) or
anisotropic (asymmetric: the structure varies over the cross-section of the membrane). Membrane

Synopsis
v
supported transition/noble metal nanoparticles have shown the potential application in catalysis
because of their special optical, electrical, and catalytic properties compare to bulk metal.
The present thesis is mainly focused on the functionalization of microporous membranes and
microfibers by UV-initiator induced anchoring/grafting and subsequent chemical modifications to
host the noble metal nanoparticles such as Ag, Au, Pd, Ru and Rh. In actual applications, these
nanoparticles embedded membranes have not been used as the conventional membranes are
defined. Based on the applications in the present thesis these membranes should have been termed
as porous films or nanocomposite porous sheets. However, the “membrane” terminology has been
retained due to their resemblance with the membranes such as egg shell membranes, and possibility
of using them as the membrane in the “flow-through” catalysis. Thus prepared nanocomposites
membranes have been studied for their potential applications in the organic and inorganic redox
reactions. The functionalized polymeric membranes developed to host the metal nanocatalysts are
of three types: (i) self-reducing membranes, (ii) cation-exchange membranes, and (iii)
amine/phosphate functionalized membranes. For comparison, the self-reducing electrospun
microfiber mat has also been synthesized to host the Pd nanocatalyst. All these membranes have
been found to possess different noble metal nanoparticles loading capacities. The thesis is divided
into seven chapters. The brief description of each chapter is given below:

Synopsis
vi
Chapter 1: Introduction
This chapter describes a brief introduction about nanoscience and nanochemistry relevant to the
present thesis, particularly how these nanomaterials are different compare to their bulk (size
dependent properties). The literature on the immobilization of nanoparticles on the polymeric
materials, relevant to the present work, and how their physical architecture influences the rate of
the catalytic reaction have also been discussed. General introduction on the noble metal
nanoparticles mediated catalysis has been discussed by using d-band centre model. Finally, the
scope of the present thesis has been outlined.
Chapter 2: Experimental
The experimental procedures for syntheses of noble metal nanoparticles on the host
membranes/electrospun microfiber mats and also the various instrumental techniques used for
characterizing these nanocomposites have been discussed briefly. The electrospinning technique
used for preparation of poly (ether sulfone) microfibers has also been explained. The details of
UV-initiator induced grafting (poly (ether sulfone) fiber mat)/anchoring (poly(propylene)
membrame) used for the functionalization of the polymeric materials are given. The
characterization techniques include field emission scanning electron microscopy (FE-SEM),
inductively coupled plasma-atomic emission spectroscopy (ICP-AES), UV-VIS
spectrophotometry, X-ray diffraction (XRD), energy dispersive X-ray fluorescence (EDXRF), X-
ray photoelectron spectroscopy (XPS) and capillary flow porometry (CFP).

Synopsis
vii
Chapter 3: Self-reducing asymmetric polymer membrane for in situ formation and
containment of noble metal nanocatalysts
In this chapter, the poly(propylene) membrane having an asymmetric physical structure, dense at
the surface with fibrous interior, has been developed by anchoring glycidyl methacrylate in pores
of the host poly(propylene) membrane and subsequently reacting with N-methyl-D-glucamine to
host the Ag, Au, Ru, Rh and Pd nanocatalysts. These nanocatalysts are formed by in situ reductions
in the precursor salt solutions without need of any external reducing agent. The polyol containing
N-methyl-D-glucamine acts as the reducing agent and also stabilizes the nanoparticles formed on
it. This functionalized membrane mimics the egg shell membrane in terms of reduction and
stabilization of the nanoparticles. The catalytic activities of these nanocatalysts embedded polymer
matrix have been tested for the organic redox reactions such as reduction of p-nitrophenol (PNP)
to p-aminophenol, degradation of methylene blue (MB) by using Ag nanoparticles containing
polymer matrices as a catalyst and borohydrate as a reducing agent. For inorganic redox reactions
like Cr(VI) to Cr(III) and U(VI) to U(IV), the Pd nanoparticles embedded polymer matrix has been
used as the catalyst and in situ hydrogen produced by the decomposition of formic acid as the
reducing agent. It has been observed that the functionalized membrane developed in this work acts
as a robust container of almost bare nanoparticles without affecting their accessibility, and it was
also found that nanoparticles formed by this method have long shelf-life.
Chapter 4: Palladium nanoparticles hosted in hydrazine/sulfonate anchored membranes for
catalyzing reduction of uranyl (VI) ions
Studies on the palladium nanoparticles hosted in the hydrazine/sulfonate anchored membranes
have been described in this chapter. The functionalized membrane has been prepared by anchoring

Synopsis
viii
of glycidyl methacrylate monomer by the UV-initiator induced polymerization in the pores of
poly(propylene) membrane, and reacting subsequently with hydrazine hydrate. This functionalized
polymer matrix has been found to form Pd nanoparticles by spontaneously reducing Pd2+ ions. The
variation of Pd nanoparticles loading capacity of this polymer matrix with time has been studied.
In addition to this self-reducing polymer membrane, a cation-exchange membrane has also been
prepared by functionalizing with 2-acrylamido-2-methylpropane sulfonic acid monomer in pores
of the host poly(propylene) membrane. These two functionalized membranes/matrices have been
characterized for their ion-exchange capacities, porosity, Pd nanoparticles size distribution, and
elemental mappings. Pd nanoparticles embedded in the hydrazine grafted membrane have
exhibited excellent catalytic activity towards UO22+ ions reduction in the presence of formic acid.
While, the Pd nanoparticles embedded in a cation-exchange membrane have not shown any
catalytic activity towards UO22+ ions reduction under the similar conditions. The kinetics of
reduction has also been analysed which shows that a threshold amount of Pd0 in the hydrazine
grafted membrane is required for a significant rate of reduction. It has been observed that the
kinetics of reduction at lower amount of Pd0 is controlled by pseudo-second-order kinetics. With
increased amount of Pd0, the reduction process switches to diffusion controlled indicating matrix
effect on the reduction kinetics. To improve mass transfer of reactants to the host polymer matrix
and to overcome the diffusion barrier affecting the kinetics of UO22+ ions reduction, high intensity
ultrasonication has been used. This has resulted in a switching kinetics of the reduction from
diffusion-controlled process to pseudo-first-order kinetics leading to a very high catalytic activity
of Pd nanoparticles. The Pd nanoparticles embedded in the host poly(propylene) matrix have
shown long shelf-life and do not deteriorate during the successive cycles of reuse.

Synopsis
ix
Chapter 5: Grafted-electrospun polymer microfiber scaffold hosted palladium nanoparticles
for catalysing redox reactions
This chapter deals with the preparation of porous poly (ether sulfone) (PES) microfiber mat using
the electrospinning technique, immobilization of Pd nanoparticles on to this fiber mat and its
application in the organic and inorganic redox reactions. The microfiber mat as a host has been
studied to explore the possibility of providing more accessibility of the Pd nanoparticles to the
reactants. It is expected that the catalytic reduction in the microfiber mat would not be diffusion
controlled. The reducing moiety has been attached covalently to the PES microfiber mat by UV-
initiator induced graft polymerization of glycidyl methacrylate, and reacting subsequently with
hydrazine via epoxy ring opening. The reduction of precursor Pd2+ ions by grafted hydrazine has
lead to the nucleation and growth of Pd nanoparticles on the shell of microfiber itself. The organic
reductions involving p-nitrophenol to p-aminophenol, degradation of methylene blue, and
inorganic reductions involving Cr(VI) to Cr(III) and U(VI) to U(IV) have been examined. The
normalised catalytic activities of the Pd nanoparticles hosted on electrospun PES microfiber mat
have been found to be higher than earlier reported in literature, but lower than that given in
previous chapter using Pd nanoparticles embedded membrane.
Chapter 6: Palladium nanoparticles hosted in poly(ethylenimine) and poly(ethylene glycol
methacrylate phosphate) anchored membranes for catalyzing U(VI) ions reduction and
Mizoroki-Heck coupling reaction
This chapter describes the development of amine functionalized membrane which can hold higher
amount of nanoparticles, and also provides tertiary/secondary amine sites which are required for
some of the C-C coupling reactions. To increase the amount of nanoparticles loading, the host
Synopsis
x
poly(propylene) membrane has been functionalized with polyethylenimine (PEI) by first
anchoring of poly(glycidy methacrylate) by UV-polymerization, and subsequently attaching PEI
by the glycidyl ring opening reaction. Pd nanoparticles have been formed by reducing the Pd2+
ions-loaded PEI-membrane with sodium borohydride. The effect of porosity of PEI functionalized
membrane on the catalytic activity of Pd nanoparticles has also been studied toward UO22+ ions
reduction with formic acid. For comparison, the UO22+ ions reduction has also studied using Pd
nanoparticles immobilized on poly(ethylene glycol methacrylate phosphate) (poly(EGMP))
anchored poly(propylene) membrane. The poly(EGMP)-membrane hosted Pd nanoparticles have
been found to be less efficient compared to the Pd nanoparticles hosted in the PEI-membrane. This
could be attributed to a fact that the amine groups on PEI enhance the formic acid decomposition,
thereby increase the hydrogen production rate. The in situ H2 produced from formic acid
decomposition eventually leads to the reduction of UO22+ ions. The Pd nanoparticles loaded on
PEI and EGMP functionalized membranes have also been tested in Mizoroki-Heck coupling
reaction which is most efficient route for the vinylation of aryl/vinyl halides (C-C coupling). In a
typical experiment, 1mmol of iodobenzene, 1.1 mmol of ethyl acrylate and 3 mmol of
triethylamine have been taken. It has been found that, the coupling reaction is successful with
reduced and unreduced palladium in both types of the membranes. However, the Pd nanoparticles
embedded PEI-membrane gives better yield (76%) in comparison with the EGMP grafted
membrane (70%). This could be due to the amine groups in the PEI-grafted membrane facilitating
the reaction. It has been seen from mechanism that, in presence of a base, the Pd2+ ions get reduced
first and then reaction proceeds. Since the functionalized membrane contains amine group, the
reaction with Pd nanoparticles without external base has been found to be successful to some
extent.

Synopsis
xi
Chapter 7: Summary and Future Scope
In this chapter, the conclusions drawn from the work carried out in the present thesis and future
scope related to this topic of research have been given. The major conclusions include:
(i) The noble metal nanocatalysts embedded on polymer membranes provide the physical stability
(by preventing agglomeration), chemical stability (by inhibiting chemical corrosion), and makes
it easy to withdraw from the system which helps in recyclability and prevents contamination of
the products.
(ii) The self-reducing membranes developed in this work provide an easy route to host noble metal
nanocatalysts without using any external reducing agents. These membranes mimic the egg-shell
membrane in terms of formation and stabilization of nanoparticles.
(iii) These functionalized membranes developed in the present work also provide control over
nanoparticles growth/size. This can be achieved by controlling the amount of monomers anchored
in the membranes or keeping the functionalized membranes in a precursor salt solution for a
predetermined time.
(iv) The self-reducing membranes developed in the present work have an asymmetric structure,
dense at the surface and fibrous interior. The nanoparticles formed in the interior of the matrix
have shown remarkable enhancement in the catalytic activity compared to surface immobilized
nanoparticles.
(v) The nanocatalysts formed on the polymer membranes/microfiber mats have been found to
catalyse both organic and inorganic redox reactions. As part of inorganic redox reactions,

Synopsis
xii
reductions of Cr(VI) to Cr(III) and U(VI) to U(IV) have been studied. Reduction of p-nitrophenol
and degradation of methylene blue have been studied as the examples of the organic reductions.
(vi) In situ generated hydrogen from formic acid decomposition could be used as a reducing agent
for the inorganic ions reduction, which is produced by the decomposition of formic acid on Pd
nanoparticles surface. The Pd nanoparticles loaded cation-exchange membranes have been found
to be unsuccessful in reducing UO22+ ions under similar conditions.
(vii) The Pd0/Pd2+-loaded PEI/poly(EGMP) functionalized poly(propylene) membrane has been
studied for catalysing Mizoroki-Heck coupling reaction. The model reaction has been successful
with both reduced and unreduced palladium embedded membranes.

xiii
LIST OF FIGURES
Figure 1.1 Lycurgus Cup in transmitted (a) and reflected (b) light (Freestone et al. 2007). .......... 5
Figure 1.2 Illustration of the increased surface to volume ratio provided by nanostructured
materials. ...................................................................................................................... 6
Figure 1.3 Illustrations of the density of states vs. energy for bulk material, quantum well, quantum
wire and quantum dot (atom like behavior when the particle size is reduced). (Redrawn
from Xu 2005). ............................................................................................................. 7
Figure 1.4 The general approaches used for synthesis of the nanoparticles. .................................. 9
Figure 1.5 The schematic graph represents the principle of NP nucleation due to Mer’s mechanism
of (sulfur) nucleation derived from CNT (Polte 2015). ............................................. 11
Figure 1.6 Change in the Gibbs free energy as a function of the nucleus radius (r) as a sum of the
volume and surface free energies (Camargo et al. 2015). .......................................... 13
Figure 1.7 The Schematic representation of electric double layer (EDL) formed around a
nanoparticle (according to Gouy-Chapman model) which consists of inner Stern layer
and the outer diffusive layer, and (b) corresponding decrease of the counter and co-ion
concentration with respect to the distance from the particle surface(Polte 2015). .... 16
Figure 1.8 Schematic representation of electrostatic and steric stabilization of the Ag nanoparticles
(Tüzüner and Demir 2015). ........................................................................................ 18
Figure 1.9 A scatter plot of the d-band centre of the metal surface versus the adsorption strength
of p-nitrophenol (Pozun et al. 2013). ......................................................................... 22
Figure 1.10 The possible reaction pathway of formic acid decomposition by Pd on basic groups
containing membrane/resin (Mori et al. 2013)........................................................... 23

xiv
Figure 1.11 Plot of rates of formic acid decomposition versus d-band centre (Tedsree et al. 2011).
....................................................................................................................................................... 24
Figure 1.12 Various applications of the functionalized polymer membranes. ............................. 27
Figure 1.13 Various applications of electrospun fibres. ............................................................... 29
Figure 2.1 Schematic representation of the steps involved in synthesis of pore-filled precursor
membranes. ................................................................................................................ 35
Figure 2.2 The different types of pore-filling membranes prepared by controlling the amount of
polymer anchored/grafted on the pore walls of the membrane. ................................. 36
Figure 2.3 Schematic comparison of optical/light microscope (LM), transmission electron
microscope (TEM) and scanning electron microscope (SEM). ................................. 40
Figure 2.4 A representative FE-SEM image of poly(propylene) membrane. ............................... 42
Figure 2.5 The schematic representation of ICP-AES instrument. ............................................... 43
Figure 2.6 The excitation process. ................................................................................................ 43
Figure 2.7 Electronic energy level and transitions........................................................................ 44
Figure 2.8 Electronic transitions with vibrational transitions superimposed. (Rotational levels,
which are very closely spaced within the vibrational levels, are omitted for clarity.)45
Figure 2.9 Schematic representation of a typical UV-Visible spectrophotometer. ...................... 47
Figure 2.10 A typical XRD instrumental setup. ........................................................................... 48
Figure 2.11 The direction of magnetic moment due to spinning of proton (a) and the difference in
energy of the two spin states (b). ............................................................................... 52
Figure 2.12 The schematic diagram of XPS. ................................................................................ 54
Figure 2.13 A representative survey spectrum of Pd NPs embedded in PEI functionalized PP host
membrane. .................................................................................................................. 54

xv
Figure 2.14 Schematic representation of the experimental setup for a SAXS experiment and
representation of the scattering vector (q) on the detector surface (Kikhney and
Svergun 2015). ........................................................................................................... 55
Figure 2.15 The schematic representation of principles of CFP of a membrane. ......................... 57
Figure 2.16 The plots showing flow rates as a function of applied pressure across dry and wet
poly(propylene) membrane. ....................................................................................... 59
Figure 2.17 A schematic representing the electrospinning apparatus. .......................................... 61
Figure 2.18 A typical electrospun fiber mat produced by electrospinning technique. ................. 61
Figure 2.19 Reduction scheme of p-nitrophenol to p-aminophenol. ............................................ 63
Figure 2.20 The mechanism involved in PNP reduction with borohydride in presence of Ag NPs
(Baruah 2016). ........................................................................................................... 63
Figure 2.21 The UV-Vis spectra of p-nitrophenol to p-amonophenol conversion. ...................... 63
Figure 2.22 Chemical structure of methylene blue in its oxidized and reduced forms. ............... 64
Figure 2.23 The UV-Vis spectra of methylene blue degradation. ................................................ 64
Figure 2.24 UV-Vis spectra showing reduction of Cr(VI) to Cr(III) with formic acid at 45 0C as a
function of time in the presence of Pd NPs loaded membrane. ................................. 65
Figure 2.25 UV-Vis spectra showing reduction of U (VI) to U(IV). ........................................... 66
Figure 3.1 FE-SEM images showing surface (a) and cross-section (b) of the host poly(propylene)
membrane, and surface (c) cross-section (d) of the same host membrane after
anchoring with poly(GMA) and subsequent treatment with NMDG. ....................... 73
Figure 3.2 The representative FE-SEM image of the surface of Rh NPsloaded membrane (a), and
corresponding elemental mappings of nitrogen(b) and Rh (c) by EDS. .................... 75

xvi
Figure 3.3 FE-SEM images showing Au NPs having geometries of cubes and prisms at the surface
(a), spherical at the porous surface (b), Silver NPs (c), Palladium NPs (d) and Ru NPs
(e) formed at the surfaces of membrane samples equilibrated with 0.1 mol L-1
HAuCl4/AgNO3/PdCl2 /RuCl3 solutions for overnight. ............................................. 77
Figure 3.4 EDXRF spectra of Rh (a) and Ru NPs (b) loaded membrane. .................................... 78
Figure 3.5 FE-SEM images of cross-section of the Ag0 loaded membrane samples (a), elemental
mappings of nitrogen (b), Silver (c), and mixed elemental mapping image of nitrogen
and silver (d). ............................................................................................................. 79
Figure 3.6 Variations in loading of Ag0 and Pd0 in the membrane as a function of equilibration
time at room temperature in 0.05 mol L-1 solutions of AgNO3 and PdCl2. ............... 80
Figure 3.7 FE-SEM images showing Ag NPs formed on the surfaces of the membrane after 1 min
(a) and 60 min (b) equilibration in 0.05 mol L-1 AgNO3 solution. ............................ 81
Figure 3.8 XRD pattern of Ag NPs loaded membrane stored for three months under ambient
conditions. .................................................................................................................. 82
Figure 3.9 Successive UV-Vis spectra showing reduction of Cr(VI) to Cr(III) at 45℃ using formic
acid as a function of time in the presence of a Pd NPs loaded membrane (a), and
corresponding variation of logarithm of At/A0 as a function of reduction time (b). At
and A0 represent absorbance at 350 nm corresponding to concentration of Cr(VI) at
time t and initial respectively. .................................................................................... 83
Figure 3.10 UV-Vis spectra showing the absence of significant reductions of Cr(VI) with formic
acid at 45℃ as a function of time in the presence of NMDG-membrane sample without
Pd NPs. ....................................................................................................................... 83

xvii
Figure 3.11 Successive UV-Vis spectra showing the reduction of methyl blue with BH4- ions at
room temperature as a function of time in the presence of Ag NPs loaded membrane
(a), and corresponding variation of logarithm of At/A0 as a function of reduction time
(b). .............................................................................................................................. 85
Figure 3.12 Successive UV-Vis spectra showing the reduction of p-nitrophenol to p- aminophenol
reduction with BH4- ions at room temperature as a function of time in the presence of
Ag NPs loaded membrane (a) , and corresponding variation of logarithm of At/A0 as a
function of reduction time (b). ................................................................................... 85
Figure 4.1 The experimental setup of Z-flow cell spectrophotometry used for on-line monitoring
of UV-Vis absorption spectra during U(VI) to U(IV) ions reduction. ....................... 92
Figure 4.2 Successive UV–Vis spectra showing reduction of UO22+to U4+ions using formic acid:
(a) in the presence of Pd NPs embedded hydrazine-grafted PP membrane at room
temperature and (b) in the presence of hydrazine-grafted membrane without Pd NPs at
50℃ as a function of time. ......................................................................................... 96
Figure 4.3 Comparison of pore-size distributions obtained by capillary flow porometry in the
pristine poly(propylene) membrane, hydrazine-grafted poly(propylene)membrane,
and Pd NPs embedded membrane samples. ............................................................. 100
Figure 4.4 Variation of Pd0 content in the hydrazine-grafted membrane sample as a function of
equilibration times in the aqueous solution containing 0.01 mol L−1 PdCl2 at pH = 2.
.................................................................................................................................. 101
Figure 4.5 The representative FE-SEM images of surface of pristine PP membrane (a & b), cross-
section of pristine PP membrane (c & d), surfaces of Pd NPs embedded hydrazine
grafted membrane (e & f), cross-section of Pd NPs embedded hydrazine-grafted

xviii
membrane (g & h), and EDS elemental mappings of nitrogen (i), Pd (j) and mixture
of N and Pd at cross-sections (4×4 m) of the same Pd NPs embedded hydrazine-
grafted membrane (k). .............................................................................................. 105
Figure 4.6 Representative FE-SEM images of surface (a & b), cross-section (c & d) of PP based
cation-exchange membrane, and elemental mappings of Pd (e), N (f), and mixture of
Pd and N along the cross-sections of the same PP membrane (g). .......................... 106
Figure 4.7 Variation of logarithm of [U(VI)]t/[U(VI)]0 as a function of reduction time with formic
acid in the presence of Pd embedded PP membrane at 40, 50, 60℃ temp.[U(VI)]t and
[U(VI)]0 represent conc. of UO22+ ions at time t and initial, respectively. .............. 108
Figure 4.8 Variation of catalytic activity of the Pd NPs embedded in hydrazine-grafted membrane
as a function of Pd0 content in the reduction of U(VI) ions by formic acid to U(IV)
ions at 50℃. ............................................................................................................. 109
Figure 4.9 UV–Vis spectra showing no reduction of U(VI) with formic acid in the presence of Pd
NPs immobilized in the cation-exchange membrane at 50℃. Figures. a & b present the
experiments carried out using the cation-exchange membrane loaded with Pd NPs in
one cycle and four cycles, respectively. ................................................................... 110
Figure 4.10 The successive UV–Vis spectra obtained online after every 5 min intervals during 70
min reduction of U(VI) ions with formic acid in the presence of Pd NPs embedded
hydrazine-grafted PP membrane at 50℃. ................................................................ 112
Figure 4.11 UV-Vis spectra showing the stability of absorbance peaks of U(IV) ions stored at-4℃
(a) and at room temperature (25℃) (b). ................................................................... 114

xix
Figure 4.12 UV–Vis spectra showing the absorbance peaks corresponding to U(IV) ions after 1 h
successive cycles of the reduction of U(VI) ions with formic acid in the presence of
Pd embedded PP membrane. .................................................................................... 115
Figure 5.1 FE-SEM images of electrospun nanofiber mats formed by using the solutions having:
(a) 20 wt. % of PES in DMAc, (b) 28 wt. % of PES in DMAc, (c) 30 wt. % of PES in
DMAc, and (d) 28 wt. % of PES in DMAc: acetone in 80:20 ratio under lower and
higher magnifications. .............................................................................................. 126
Figure 5.2 FE-SEM images of the pristine PES nanofibers mat (a,b), and same nanofibers mat after
the chemical modifications shown in Scheme 1 (c,d) under higher and lower
magnifications. ......................................................................................................... 130
Figure 5.3 The C, N, Pd elemental mappings of Pd NPs loaded PES microfibers mat (70x70 m)
by EDS showing the presence of nitrogen from residual hydrazine and Pd NPs. ... 131
Figure 5.4 Cross-sectional FE-SEM image of Pd NPs loaded microfiber. ................................. 131
Figure 5.5 Elemental mappings of Pd and N on the cross-section of Pd NPs loaded PES microfibers
Fiber@Pd using FE-SEM/EDS. ............................................................................... 132
Figure 5.6 The increase in the concentration of U(IV) ions as a function of reduction time of U(VI)
ions with formic acid at 50℃ was monitored from the f-f transition peaks in successive
UV-Vis spectra recorded from the samples taken from reaction solution. .............. 134
Figure 5.7 Successive UV-Vis spectra obtained during reductions of Cr(VI) with formic acid at
50℃ (a) and 25℃ (b) and corresponding variation of ln [A]t/[A]0 vs reduction time (t)
in the presence of Fiber@Pd. The UV-Vis spectra shown in (c) indicate no reduction
of Cr(VI) under similar conditions (50℃) in absence of the catalyst along with
comparisons of reduction rate profiles at room temperature and at 50℃. ............... 136

xx
Figure 5.8 The successive UV-Vis spectra showing quantitative conversion of PNP to PAP with
borohydride in the presence of Fiber@Pd (a) and corresponding variation of ln
[A]t/[A]0 vs. reduction time (b). ............................................................................... 138
Figure 5.9 The successive UV-Vis spectra showing no reduction of p-nitrophenol to p-
aminophenol with borohydride (a) and hydrazine (b) in the absence of catalyst
Fiber@Pd. ................................................................................................................ 139
Figure 5.10 The kinetic rate profile showing variation ofln [A]t/[A]0 vs. time in the reduction of p-
nitrophenol to p-aminophenol with hydrazine at room temp. .................................. 140
Figure 5.11 The kinetic rate profiles showing variations of ln [A]t/[A]0 vs. time in the reductions
of p-nitrophenol to p-aminophenol with borohydride (a) and hydrazine (b) at room
temperature in recycles of catalyst Fiber@Pd. ........................................................ 142
Figure 6.1 The comparison of obtained pore-size distributions of pristine membrane and PEI
functionalized membrane (PP2, PP3 and PP4) by capillary flow porometry. ......... 154
Figure 6.2 A representative SEM images of the PP membranes anchored with different amounts
of polymer PP2 (a & b), PP3 (c & d) and PP4 (e & f), respectively, under two different
magnifications. ......................................................................................................... 155
Figure 6.3 The representative SEM image of the Pd NPs formed on the PP2 membrane (a), and
corresponding elemental mappings of nitrogen (b) and Pd (c) by EDS. ................. 156
Figure 6.4 The surface morphology of Pd NPs embedded membrane (PP1) (a) and cross-sectional
image of the same membrane (b) under same magnification. ................................. 157
Figure 6.5 (a) Scattering profile from blank membrane, Pd2+ ions loaded and Pd NPs loaded
membrane, (b) Scattering contribution solely from the nanoparticles as obtained from
the subtraction of scattering profile of blank and Pd2+ ions loaded membrane. ...... 158

xxi
Figure 6.6. Size distribution of the Pd NPs in the PEI-membrane PP1 (a), PP3 (b), and PP4 (c) as
obtained from the SAXS data analysis. ................................................................... 159
Figure 6.7 The EDS elemental mappings of nitrogen (a), palladium (b) across the cross-section of
the PP1 membrane. .................................................................................................. 160
Figure 6.8 Representative FE-SEM images of surface (a & b) and corresponding elemental
mappings of phosphorus (c) and palladium (d) by EDS of poly(EGMP)- membrane.
.................................................................................................................................. 161
Figure 6.9. UV– Vis spectra showing growth of U(IV) ions absorption peaks (a), variation of
logarithm of [U(VI)]t/[U(VI)]0 as a function of reduction time with formic acid in the
presence of Pd NPs embedded PEI (PP3) membrane at 50℃, (b) and no reduction of
U(VI) ions with formic acid in absence of Pd catalyst (c). ...................................... 164
Figure 6.10 UV–Vis spectra showing less efficient growth of absorption peaks of U(IV) ions
during reduction of U(VI) ions with formic acid in the presence of Pd NPs immobilized
in the EGMP anchored membrane at 50℃............................................................... 166
Figure 6.11 Deconvoluted XPS spectra of binding energies peaks of 3d5/2 and 3d3/2 obtained before
using Pd2+ ions loaded PEI-membrane (a), and after coupling reaction (b). ........... 170
Figure 6.12 The 1H NMR (a) and 13C NMR spectra of ethyl cinnamate (b). ............................. 171
Figure 6.13 The LC-MS spectra of ethyl cinnamate ................................................................... 172
Figure 6.14 The bar diagram of catalyst (Pd NPs embedded PEI-membrane) cycle with yield (%).
..................................................................................................................................................... 172

xxii
LIST OF TABLES
Table 2.1 The primary beam filters used in EDXRF. ................................................................... 50
Table 4.1 Comparison of absorption energy levels for U(IV) ion in solution (Misbah and Iftikhar
2013) and observed in the present work due to its complex formation with formate.
.................................................................................................................................. 113
Table 4.2 Analyses of the kinetics of U(VI) ions reduction with formic acid in the presence of Pd
NPs hosted in the hydrazine-grafted PP membrane. The chemical conditions were kept
constant and varied either temperature or catalyst. .................................................. 117
Table 5.1 Comparison of the catalytic activities of Fiber@Pd with Pd/C during the reduction of
UO22+ ions with formic acid at 50℃ temp. The conditions were kept same in all the
experiments as 0.1 mol L-1 UO2(NO3)2 at pH=2 and 1 mol L-1 formic acid. ........... 134
Table 5.2 Comparison of catalytic activity of Pd NPs hosted in different matrices for the reduction
of Cr(VI) anions with formic acid............................................................................ 137
Table 5.3 Comparison of the catalytic activity of Fiber@Pd in the reduction of p-nitrophenol with
borohydride at room temp. with the catalytic activities of Pd, Au and Ag NPs reported
in literature under similar conditions. ...................................................................... 141
Table 6.1The comparisons of the amount of polymer anchored, percentage of water uptake
(hydrophilicity) and amount of Pd0 loading in PEI and poly(EGMP) anchored PP
membranes. .............................................................................................................. 153
Table 6.2 The comparisons in catalytic activities of Pd NPs immobilized on PEI functionalized PP
membranes. .............................................................................................................. 165
Table 6.3 The outcome of Mizoroki-Heck coupling reaction examined in different experimental
conditions. Triethylamine was used as external base. ............................................. 168

xxiii
Table 6.4 Comparison of Mizoroki-Heck coupling reaction yield carried out with Pd NPs hosted
in different matrices and conditions. ........................................................................ 169

xxiv
LIST OF SCHEMES
Scheme 2.1 Formation of free radicals (1R, 2R, 3R) from photolysis of ’--dimethoxy--phenyl
acetophenone (DMPA). ............................................................................................. 36
Scheme 2.2 Mechanism of formation of free radicals from photolysis of poly (ether sulfone). .. 36
Scheme 3.1 The chemical reaction involved in the anchoring of NMDG on to the poly(GMA)
anchored membrane that reduces noble metal precursor ions and stabilizes the thus
formed NPs. ............................................................................................................... 74
Scheme 4.1 Chemical modifications involved in the formation of Pd NPs in the neutral PP
membrane. .................................................................................................................. 99
Scheme 4.2 Representative steps involved in the formation of Pd NPs in the cation-exchange
membrane. ................................................................................................................ 102
Scheme 4.3 Preferential UO22+ ions interactions with sulfonic acid groups in a pore of Pd NPs
embedded cation-exchange membrane (a), and with Pd NPs in hydrazine-grafted
membrane (b). .......................................................................................................... 111
Scheme 5.1 Chemical modifications involved in the covalent attachment of reducing hydrazine
groups on the electrospun PES microfibers mat. ..................................................... 128
Scheme 6.1 Chemical modifications involved in formation of Pd NPs on the PEI anchored PP
membrane. ................................................................................................................ 152
Scheme 6.2 Formation of Pd NPs in the poly(EGMP)-membrane. ............................................ 161
Scheme 6.3 Formation of Pd NPs from Pd2+ ions by the amine groups in the PEI functionalized
membrane. ................................................................................................................ 167
Scheme 6.4. Mizoroki-Heck coupling reaction between iodobenzene and ethyl acrylate. ........ 170

xxv
ABBREVIATIONS
AFM : Atomic force microscopy
AMPS : 2-acrylamido-2-methyl-1-propane sulfonic acid
APTMS : (3-acryloxy propyl) trimethoxysilane
BEP : Bronsted-Evans-Polanyi
BET : Brunauer-Emmentt-Teller
CCD : Charge coupled device
CFP : Capillary flow porometry
CNT : Classical nucleation theory
CTAB : Cetyltrimethylammonium bromide
DFT : Density functional theory
DLVO : Derjaguin-Landau-Verwey-Overbeek
DMF : N-N'-dimethyl formamide
DMPA : α,α'-dimethoxy-α-phenyl-acetophenone
DOS : Density of states
EDL : Electrical double layer
EDS : Energy dispersive spectrometer
EDX : Energy-dispersive X-ray spectroscopy
EDXRF : Energy dispersive X-ray fluorescence
EGDM : Ethylene glycol dimethacrylate
EGMP : Ethylene glycol methacrylate phosphate
ESCA : Electron spectroscopy of chemical analysis
xxvi
ESM : Egg-shell membrane
FE-SEM : Field emission scanning electron microscopy
FTIR : Fourier-transform infrared spectroscopy
HOMO : Highest occupied molecular orbital
HRTEM : High resolution transmission electron microscopy
ICP-AES : Inductively coupled plasma atomic emission spectroscopy
LC-MS : liquid chromatography - mass spectrometry
LUMO : Lowest unoccupied molecular orbital
MB : Methylene blue
MCA : Multi channel analyzer
MO : Molecular orbital
NCs : Nanocatalysts
NFs : Nanofibers
NHE : Normal hydrogen electrode
NMDG : N-methyl-D-glutamine
NMP : N-Methyl-2-pyrrolidone
NMR : Nuclear magnetic resonance
NPs : Nanoparticles
PA : Polyamide
PAA : poly(acrylic) acid
PAN : Poly(acrylonitrile)
PAP : p- aminophenol
PEG : Poly(ethylene glycol)

xxvii
PEI : Poly(ethylenimine)
PES : Poly(ether sulfone)
PNP : p- nitrophenol
PP : Poly(propylene)
PU : Poly(urethane)
PUREX : Plutonium uranium reduction extraction
PVA : Poly(vinyl alcohol)
PVAc : Poly(vinyl acetate)
SAXS : Small angel X-ray scattering
TEM : Transmission electron microscopy
TLC : Thin-layer chromotography
TMS : Tetramethylsilane
UV-Vis : Ultraviolet-Visible
WDXRF : Wavelength dispersive X-ray fluorescence
XRD : X-ray diffraction
XRF : X-ray fluorescence
XPS : X-ray photoelectron spectroscopy

INTRODUCTION

Chapter 1
2
1.1 Introduction to nanoscience
The concept of nanoscience was first introduced about 55 years ago by the Nobel physicist Richard
Feynman in his talk at American Physical society, Caltech on December 29, 1959 entitled
“There’s plenty of room at the bottom”. The statement in his words “The principles of physics,
as far as I can see, do not speak against the possibility of maneuvering things atom by atom. It is
not an attempt to violate any laws; it is something, in principle, that can be done; but in practice,
it has not been done because we are too big”. This was widely accepted as the spark that initiated
the present ‘nano’ age. Till 1990’s, the talk went unnoticed and did not inspire the conceptual
beginnings of the field and then it made a remarkable progress in the nanoscience and
nanotechnology.
Nanotechnology is the branch of science which involves the manipulation of the matter to
the nanoscale level whose properties are different from that of the bulk material. Nanotechnology
promises the possibility of creating nanostructures of meta-stable phases with non–conventional
properties including superconductivity and magnetism etc. Another important aspect of
nanotechnology is the miniaturization of current and new instruments, sensors and machines that
will greatly influence the world we live in. Nanoscience is one of the most active disciplines all
over the globe and is considered to be the fastest growing revolutionary fields in the human history.
Rapid developments of many advanced instruments such as field emission electron microscope
(FE-SEM), high resolution transmission electron microscope (HRTEM), X-ray bound techniques,
atomic force microscope (AFM) etc. for advance research in nanomaterials are the witness of
global interest in the subject.

Chapter 1
3
1.1.1 Nanomaterials
Nanomaterial science is a broad and interdisciplinary area of research which has been growing
around the globe passionately. The term “nano” comes from the Greek prefix “nanos” meaning
dwarf or extremely small. A nanometer (nm) is a measurement of length which is one billionth of
a meter (10-9 m). Thus nanomaterials can be defined as “the particles (crystalline or amorphous)
of organic or inorganic materials having at least one dimension in the range of 1-100 nm
(Edelstein and Cammaratra 1998), and whose physical and chemical properties are significantly
different from that of the bulk material. Nanomaterial science is the boundary between the atoms
/molecules and the macro-world. To distinguish nanomaterials from bulk, it is very important to
determine the unique properties of nanomaterials and their prospective impact on the science and
technology. A well-known example is that the allotropes of carbon are diamond and graphite, both
have different bonding and structural characteristics so their thermal, electrical, optical, and
chemical properties. However, fullerenes (C60, C70, and others) the new forms of carbon show
exceptional physical and chemical properties. These unique properties of nanomaterials are so
different from the bulk that raises a question, “how big or small is the nanometer?” For example,
size of a water molecule is 0.3 nm across whereas; the red blood cell is approximately 7,000nm
wide.
Nanomaterials are classified on the basis of their origin, dimensions and structural
composition (Cao 2004). Depending on their origin, they are categorized as natural and artificial.
Viruses, bacteria, protein molecules etc. belong to natural nanomaterials, whereas artificial
nanomaterials are made through mechanical or fabrication process. According to their dimensions,
they are grouped as a zero, one, two and three-dimensional materials. Zero dimensional materials
are quantum dots in which the movements of the electrons are restricted in all the three directions.

Chapter 1
4
One dimensional material includes wire, ribbon, rod and tube-like shape, where the movements of
electrons are restricted in the X and Y directions. In two dimensional materials such as thin films,
sheets etc. the electrons can move freely in the X-Y plan. The three-dimensional material is
constructed from the nanoparticles as building blocks, in which the electron can move freely in all
the three directions (X, Y and Z) (Siegel 1993). Metal nanoparticles are extensively used in the
catalytic applications and these have potential for the extensive industrial applications. Among the
metal nanoparticles, the noble metal nanoparticles (Ag, Au, Pd, Pt, Ru and Rh) are mostly used
because these possess the spectacular properties such as tunable surface plasmon and photo-
thermal effects, excellent resistance to corrosion and air oxidation, and lesser cytotoxicity. The
other examples are metal oxide nanoparticles such ZnO, TiO2, NiO, Co3O4 and Fe3O4
nanoparticles. The present thesis mainly focuses on the noble metal nanomaterials such as Ag, Au,
Pd, Ru and Rh nanoparticles which are extensively used as the industrial catalysts.
1.1.2 Why nanomaterials are different
Nanomaterials behave differently compared to bulk. For example, Gold is yellow in colour, non-
magnetic and melts at 1336K when it is bulk. However, if the size of gold is reduced to around
10nm range then it appears red in colour and melts at lower temperature compare to bulk. If we
reduce the size of the gold even lower then it acts as very good catalyst. In ancient times, the
nanomaterials had been used to play with optical properties to decorate the object as shown in
Figure 1.1 It is, therefore, the properties of nanomaterials are size dependent and their unusual
properties are explained by two factors: (i) total fraction of atoms at the surface, and (ii) quantum
confinement.

Chapter 1
5
Figure 1.1 Lycurgus Cup in transmitted (a) and reflected (b) light (Freestone et al. 2007).
1.1.2.1 Total fraction of atoms at the surface
The physical and chemical properties of nanomaterials change drastically with the change in the
surface to volume ratio. As the size of the material decreases, this ratio increases significantly. As
shown in Figure 1.2, the total surface area of given particle with 1cm3 cube in the size is 6cm2,
whereas when the particle size is reduced to 1mm3 then surface area increases to 60cm2, the
proportion of number of surface atoms to bulk atoms has increased nearly 10%. If the particle size
is further decreased to 1nm3 then the surface area becomes 60,000,000cm2.This gives nearly 80%
of atoms at the surface. This increase in the surface atoms alters the physical and chemical
properties of the material, and is extremely important for the industrial applications such as
catalytic processing and separation science.

Chapter 1
6
Figure 1.2 Illustration of the increased surface to volume ratio provided by nanostructured
materials.
1.1.2.2 Quantum confinement: Atom like behavior of nanoparticles
The electron movements in nanomaterial depend on the dimension. Quantum size effects appear
when the size of nanomaterials is closer to single atom or molecules compare to bulk materials.
Based on dimensions these new materials can be divided as:(i) zero dimensional (Quantum dots)
in which electron movement is confined in all three dimensions, (ii) quantum wires, which are one
dimensional nanomaterial where electrons are free to move in X-direction, (iii) two dimensional
material like thin films where, electrons are free to move in X-Y plane, and (iv) three dimensional
material, where electron can move in X,Y and Z directions. As shown in Figure 1.3, the density of
states in these nanomaterials (g(E)) are defined by the number of energy states between energy E
and E+dE, which is derived by dn(E)/dE. When the particle size is reduced to nanometre range
then discrete energy levels are formed and particles behave like individual atoms. Whereas, the
energy levels are continuum in bulk material. When the particle size is less than 10nm diameter,
the electrons in the conduction band are confined rather than continuum. The density of states g(E),
which is defined by the number of energy states between energy E and E+dE and this energy

Chapter 1
7
spacing between the electrons in a box quantum levels are greater than the thermal energy (kBT)
at low temperature, so the energy levels are considered as discrete. The discretization of the
electronic states and widening in band gap makes some nanoparticles strongly fluorescent (CdS,
PdS etc.).
Figure 1.3 Illustrations of the density of states vs. energy for bulk material, quantum well, quantum
wire and quantum dot (atom like behavior when the particle size is reduced). (Redrawn from Xu
2005).
1.1.3 Properties of nanomaterials
1.1.3.1 Optical properties
In case of bulk metal a continuous electronic states exist because overlapping of conduction and
valance bands. When the particle size is reduced to nanometer range then these two band energy
levels are well separated. This changes the light absorption property in the nanomaterials compare
to bulk material. As an example, gold is yellow when it is in bulk but changes to red in colour
when the size is reduced to around 10nm. The origin for this change in colour is surface plasmon.
Energy Energy Energy Energy
Den
sity
of
stat
es
Den
sity
of
stat
es
Den
sity
of
stat
es
Den
sity
of
stat
es
Bulk Quantum well Quantum wire Quantum
dot

Chapter 1
8
This is described as the natural oscillation of the electrons inside in a given nanosphere. The
surface plasmon resonance occurs when the frequency of the incident light is close to that of the
natural oscillation of the electrons in the conduction band. The frequency of the surface plasmon
depends on the shape, size and dielectric function of the material. This surface plasmon resonance
can occur in the visible or ultraviolet region. Noble metals like copper, silver and gold have strong
plasmon resonance in the visible light region. Whereas, most of the other transition metals show
poorly resolved absorption band in the Ultraviolet region (Lavrich et al. 1998; Maier 1987).
1.1.3.2 Mechanical properties
Atomic density of the amorphous surface changes when size of the material approaches to
nanoscale. In nanomaterials the crystal interfaces are incoherent, this mis-alignment causes
modification of the grain boundary of the atomic structure. Due to these, many mechanical
properties such as scratch resistance, fracture toughness and hardness are changed. For example,
nanomaterials of titanium carbide and tungsten carbide are erosion-resistant, wear-resistant and
harder as compared to the bulk.
1.1.3.3 Catalytic properties
The physical and chemical properties of the nanomaterials depend on the size, shape, surface
functionality and composition. The catalytic activity of the metal ion increases orders of magnitude
with increasing the surface area. Apart from the surface area, shape of the nanomaterials enables
the exposure of specific surface facets that can be more catalytically active or selective for a
reaction of interest. The increase in surface area increases the defective coordination environment
of the atoms, which increases the adsorption of reactant molecule, and therefore, eventually
increases the catalytic activity of the nanomaterials.
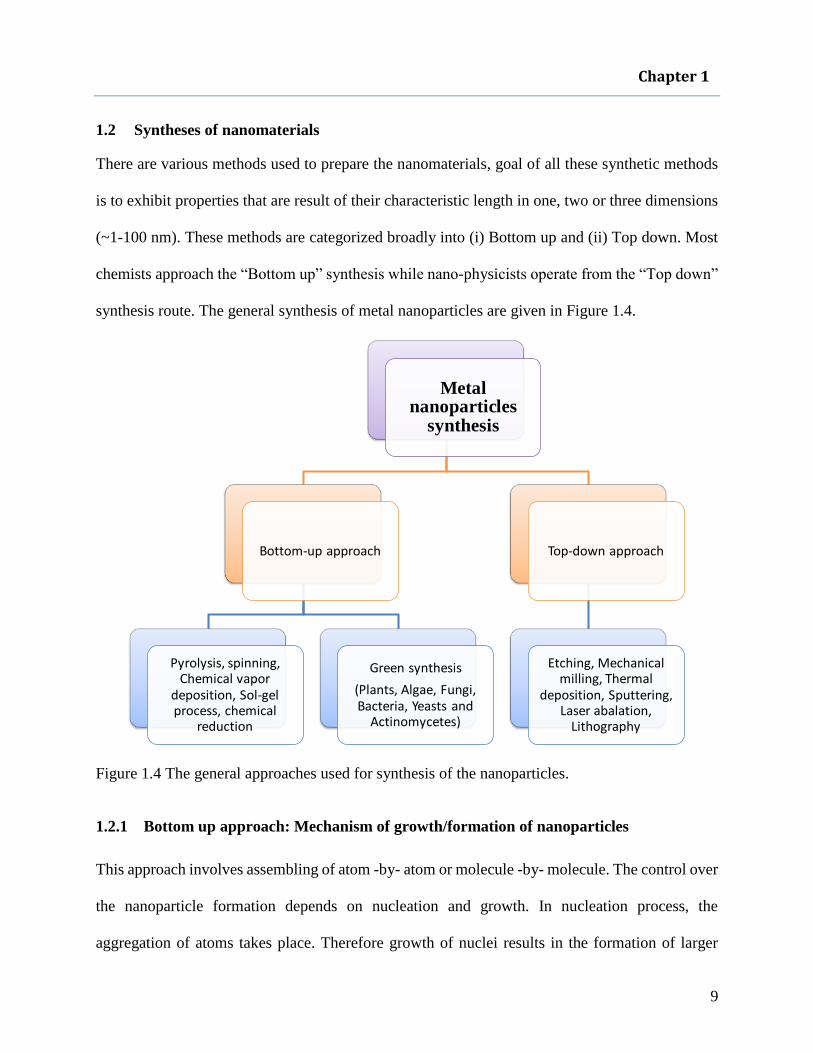
Chapter 1
9
1.2 Syntheses of nanomaterials
There are various methods used to prepare the nanomaterials, goal of all these synthetic methods
is to exhibit properties that are result of their characteristic length in one, two or three dimensions
(~1-100 nm). These methods are categorized broadly into (i) Bottom up and (ii) Top down. Most
chemists approach the “Bottom up” synthesis while nano-physicists operate from the “Top down”
synthesis route. The general synthesis of metal nanoparticles are given in Figure 1.4.
Figure 1.4 The general approaches used for synthesis of the nanoparticles.
1.2.1 Bottom up approach: Mechanism of growth/formation of nanoparticles
This approach involves assembling of atom -by- atom or molecule -by- molecule. The control over
the nanoparticle formation depends on nucleation and growth. In nucleation process, the
aggregation of atoms takes place. Therefore growth of nuclei results in the formation of larger
Metal nanoparticles
synthesis
Bottom-up approach
Pyrolysis, spinning, Chemical vapor
deposition, Sol-gel process, chemical
reduction
Green synthesis
(Plants, Algae, Fungi, Bacteria, Yeasts and
Actinomycetes)
Top-down approach
Etching, Mechanical milling, Thermal
deposition, Sputtering, Laser abalation,
Lithography
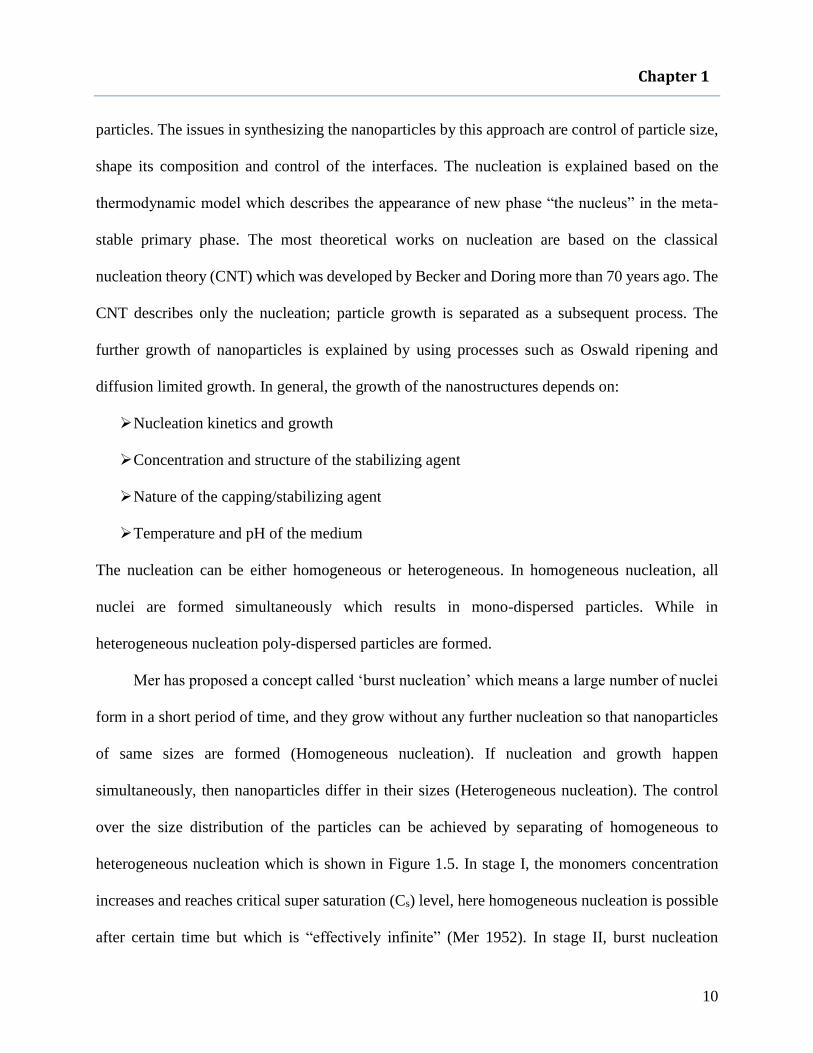
Chapter 1
10
particles. The issues in synthesizing the nanoparticles by this approach are control of particle size,
shape its composition and control of the interfaces. The nucleation is explained based on the
thermodynamic model which describes the appearance of new phase “the nucleus” in the meta-
stable primary phase. The most theoretical works on nucleation are based on the classical
nucleation theory (CNT) which was developed by Becker and Doring more than 70 years ago. The
CNT describes only the nucleation; particle growth is separated as a subsequent process. The
further growth of nanoparticles is explained by using processes such as Oswald ripening and
diffusion limited growth. In general, the growth of the nanostructures depends on:
Nucleation kinetics and growth
Concentration and structure of the stabilizing agent
Nature of the capping/stabilizing agent
Temperature and pH of the medium
The nucleation can be either homogeneous or heterogeneous. In homogeneous nucleation, all
nuclei are formed simultaneously which results in mono-dispersed particles. While in
heterogeneous nucleation poly-dispersed particles are formed.
Mer has proposed a concept called ‘burst nucleation’ which means a large number of nuclei
form in a short period of time, and they grow without any further nucleation so that nanoparticles
of same sizes are formed (Homogeneous nucleation). If nucleation and growth happen
simultaneously, then nanoparticles differ in their sizes (Heterogeneous nucleation). The control
over the size distribution of the particles can be achieved by separating of homogeneous to
heterogeneous nucleation which is shown in Figure 1.5. In stage I, the monomers concentration
increases and reaches critical super saturation (Cs) level, here homogeneous nucleation is possible
after certain time but which is “effectively infinite” (Mer 1952). In stage II, burst nucleation

Chapter 1
11
happens due to a rapid self-nucleation. In stage III, the nucleation period ends because the super
saturation level lowers below the self-nucleation level. After that, the growth occurs by diffusion
of further monomers in solution/matrix toward particle surfaces which can be interpreted as
homogeneous nucleation and growth. The expected particle concentration is fast at stage II (the
self-nucleation stage) and mostly constant at final growth stage (III).
Figure 1.5 The schematic graph represents the principle of NP nucleation due to Mer’s mechanism
of (sulfur) nucleation derived from CNT (Polte 2015).
The formation of nanoparticles was also explained based on Gibbs free energy. During
the formation of new solid phase (nanoparticles) from super saturated solution, the Gibbs free

Chapter 1
12
energy decreases and this change in Gibbs energy depends on the concentration of the solute which
is represented as:
∆𝐺𝑉 = −𝑘𝑇
ln(𝐶/𝐶0)
C is the concentration of the solute, C0 is equilibrium concentration, T is temperature, and is
atomic volume. Spontaneous nucleation is favoured when ΔGV becomes negative and
concentration of the solute is higher than equilibrium concentration (C>C0). The amount of
decrease in Gibbs free energy is accompanied by increase in surface area of the newly formed
particles per unit area (). The overall Gibbs free energy change for the formation of spherical
particles of radius r from supersaturated solution is:
∆𝐺 = (4
3)𝜋𝑟3∆𝐺𝑉 + 4𝜋𝑟2𝛾
The two terms in the above equation represent change in volume free energy (Δµv) and change in
surface free energy (Δµs) respectively. The variation of ΔG as a function of spherical nuclei with
radius r (solid line) is shown in Figure 1.6. In the Figure, the surface and volume terms are shown
in dashed lines. As long as the solution is super saturated, the term is positive and ΔG is negative.
The ΔG reaches maximum at a critical radius of r* which is minimum size at which a nucleus can
survive in solution or minimum radius it must possess in order to spontaneously grow from
supersaturated solution. If r<r*, the surface term exceeds the volume term then any nucleus smaller
than r* will dissolve into the solution. In other words, the increase in the surface energy due to the
nucleus formation is higher than the stabilization due to the formation of a new solid phase from
the supersaturated solution, and hence nucleation is not favoured. On the other hand, if r*>r, the
contribution from the volume term exceeds the surface term so that the created nuclei is stable and
undergoes subsequent growth.

Chapter 1
13
Figure 1.6 Change in the Gibbs free energy as a function of the nucleus radius (r) as a sum of the
volume and surface free energies (Camargo et al. 2015).
1.2.1.1 Particle growth by theoretical approach
According to Lamer model the mono-dispersed particles can be synthesized by separating
nucleation and growth. Therefore, some theoretical models are required to predict the actual and
final particle size distribution. Reiss (Reiss 1951) has developed a model called “growth by
diffusion” soon after Mer. According to this, the monomer flux supplied to the particles decides
the spherical particles growth rate. If diffusion growth mechanism is only dependent on the
monomer fluxes, then the smaller particles will grow predominantly with respect to larger particles
leading to a narrow size distribution. This mechanism does not include other effects such as
aggregation, coalescence or dissolution (Ostwald ripening). The broadening of particles size
distribution by considering nanoparticle dissolution was explained by Sugimoto (Sugimoto 1987)
by considering the Gibbs–Thomson equation. There are several approaches that have been used to
characterize the particle growth such as single particle growth laws or rate equations and CNT.
The limited availability of experimental time resolved in situ data for the rates of nanoparticles
formation and growth enables to verify theoretical models.

Chapter 1
14
1.2.1.2 Stabilization of nanoparticles / colloidal stability of nanoparticles
The nanoparticles tend to agglomerate due to electrostatic, magnetic and van der Waals forces.
These arise because of small size, large surface area and short inter-particle distance. Thus, it is
important to study the nanoparticle stabilization in a dispersed medium. These nanoparticles tend
to agglomerate in the absence of any counteractive repulsive forces. The electrostatic and steric
stabilization provides the repulsive forces to the nanoparticles. Electrostatic stabilized
nanoparticles possess at least one electrical double layer due to surface charge, this causes
electrostatic repulsion between the particles. If this electrostatic repulsion is sufficiently high, then
coagulation between the particles can be prevented. As an example, in the synthesis of gold
nanoparticles using sodium citrate, the gold nanoparticles are stabilized by electrical double layer
formed by adsorbed citrate and chloride ions from gold precursor and sodium salts.
The two major interaction forces between the nanoparticles are:
(i) van der Walls force, and (ii) Electrostatic interaction.
Van der Waals interaction
The intermolecular attraction force W(D) between the two molecules of distance r, by Lennard-
Jones potential is
W(D) = −C
r6+
B
r12
The above equation shows that the extent of van der Waals force varies inversely as the sixth
power of the distance between the surfaces of two adjacent particles. Constant C is van der Waals

Chapter 1
15
attractive force and B is Born repulsion force, this term can be neglected. Then the van der Waals
interaction between two molecules of radius R1 and R2 can be simplified as
𝑊𝑎(𝐷) = −2
12
6𝐶 [
2𝑅1𝑅2𝐶2– (𝑅1 + 𝑅2)2
+2𝑅1𝑅2
𝐶2– (𝑅1 + 𝑅2)2+ ln (
𝐶2– (𝑅1 + 𝑅2)2
𝐶2– (𝑅1 − 𝑅2)2)]
Here ρ is electron density, c is distance between center to center of two particles and D is distance
between two particle surfaces (D = c-(R1+ R2)), for two identical particles R= R1= R2 and D<<R
that means particles in close proximity, then the equation is modified as
Wa(D) = −2
12CR
12D= −
AR
12D
A is Hamaker constant, the above equation shows that the surface interaction potential (thus the
surface forces) decays less with distance D than the interaction potential between two molecules
(1/D compared to 1/r6) and that potential is proportional to the particle size (Wa(D ~ R)).
Electrostatic interaction
As discussed above, the van der Waals interaction is the attractive force between the molecules
which promotes reversible/ irreversible agglomeration of suspended particles. In order to control
the size and stability of the nanoparticles, the opposite force to van der Waals interaction is needed.
Surface charge on the metal nanoparticles often provides the repulsive inter-particle forces. The
surface charges on the nanoparticles are shielded by the solvated ions in the solution. The surface
charge decreases within two layers, which is called as electrical double layer (EDL) (according to
Stern–Gouy–Chapman theory). This double layer is measured in terms of Debye length λ (κ−1) and
by using simple electrostatics it can be quantified. The compact inner layer is called stern layer
and the second layer is diffuse layer; see Figure 1.7. The boundary in the diffusion layer is called
slipping plane. The interaction between at least two EDLs is important to describe the colloidal

Chapter 1
16
stability. The particles agglomeration is prevented when this repulsive interaction overcomes the
van der Waals attractive forces.
Figure 1.7 The Schematic representation of electric double layer (EDL) formed around a
nanoparticle (according to Gouy-Chapman model) which consists of inner Stern layer and the outer
diffusive layer, and (b) corresponding decrease of the counter and co-ion concentration with
respect to the distance from the particle surface(Polte 2015).
DLVO theory
The DLVO theory (theory is named after the scientists Derjaguin, Landau, Verwey and Overbeek)
has been developed to explain colloidal stability more than 70 years ago and is still considered as
ground breaking characterization models in the physics and chemistry of colloids (Verwey and
Overbeek 1948). According to this theory, the potential interaction between the two particles is
the sum of van der Waals (attractive force) and electro static interaction (repulsive) forces.
Wtotal(D) = Wa(D) +Wr(D)
With thin EDL and constant surface potential assumption, the above equation says that in a close
proximity the particle size is proportional to both attractive and repulsive terms. Therefore, for
charge stabilized particles colloidal stability increases because the aggregation barrier increases
with increasing size.

Chapter 1
17
Steric stabilization
The stabilization caused by the adsorption of larger molecules like polymers or surfactants on the
particle surface is termed the as steric stabilization. The polymer/surfactant coating on the particle
prevents the aggregation. The density of the adsorbed molecules coating depends on the inter-
particle distance. As the inter-particle distance decreases, the adsorbed molecule density between
the inter-particle spaces would increase resulting in a decrease in entropy, this is less energetically
favourable because of increase in Gibbs free energy. Because of increase in density and higher
solubility of the stabilizing molecule counteracts agglomeration (Pomogailo and Kestelman 2006).
Hence, interaction potential extended by further term to the DLVO theory describing about steric
stabilization (Wsteric) as:
Wtotal(D) = Wa(D) +Wr(D) +Wsteric
The stability of the particles mainly depends on the concentration of the polymer, temperature,
average chain length and solubility of the polymer but not on the particle size (Hunter 2001;
Napper 1983; Verwey and Overbeek 1948; Simo et al. 2012). As an example, when silver
nanoparticles formed by reducing the silver nitrate with sodium borohydride, the negative charge
formed on the nanoparticles surface by BH4- ions repel each other so that these particles are electro-
statically stabilized. When these nanoparticles are capped with cetyltrimethyl ammonium bromide
(CTAB), the positive charge on the ammonium in the CTAB molecules react with negative centre
on the particle's surface. Therefore, the Ag nanoparticles are stabilized sterically by the long cetyl
chains which prevent the particles from getting close in the range of attractive forces; see Figure
1.8.

Chapter 1
18
Figure 1.8 Schematic representation of electrostatic and steric stabilization of the Ag nanoparticles
(Tüzüner and Demir 2015).
1.2.2 Top down approach
This approach involves in breaking up larger particles into smaller by using of physical processes
like crushing, milling or grinding. The major disadvantage using top-down approach is the
imperfection of the surface structure. These surface imperfections have a significant impact on the
physical properties and surface chemistry of nanomaterials. This technique is similar to the
approach used by the semiconductor industry in forming devices out of an electronic substrate
(silicon), utilizing pattern formation (such as electron beam lithography) and pattern transfer
processes.
1.3 Metal nanoparticles as catalyst
Noble metal nanoparticles are often used as the nanocatalysts (NCs) in organic and inorganic
transformations. Decrease in size and increase in surface area of the nanoparticles not only change
their physical and electronic properties but also change their chemical behaviour as the catalysts.
Electrostatic stabilization Steric stabilization
::CTAB

Chapter 1
19
In nanoscale region both quantum chemistry and classical laws of physics hold. In catalysis the
ability to accept or donate charge plays a key role. The electrons are delocalized extensively and
the extent of delocalization varies with the size in nanoscale region. Similarly, the surface energies
and surface morphologies are also size dependent. There are always the questions arise how the
catalytic activity is related to size of catalyst? how the catalytic activity is maximized, there exist
an ideal size? The relationship between size and activity depends on the choice of catalyst and
reaction. Based on these relationships, the reactions are divided into three types of reactions:
positive size-sensitivity reactions, negative size-sensitivity reactions, and size-insensitive
reactions.
In positive size-sensitivity reactions the turnover frequency (TOF) (which is defined as the
total number of moles transformed into the desired product by one mole of active site per hour)
increases with decrease in a particle size. Methane activation is example for this, in which
dissociative bond cleavage is the rate limiting step. In negative size-sensitive reactions, the
turnover frequency decreases with the particle size. Example is dissociation of CO and N2
molecules i.e. in which formation and dissociation of a -bond is rate limiting step. These require
step-edge sites and contact with multiple atoms but, these sites do not always exist in very small
nanoparticles. But sometimes, the certain particle sizes geometrically favour the formation of these
sorts of sites. In this case, a local maximum in turnover frequency versus particle size exists. In
size-insensitive reactions, there is no dependence of turnover frequency on nanoparticle diameter.
Example is hydrocarbon hydrogenation on transition metal catalysts. Here, the rate-limiting step
is complimentary associative σ-bond formation. In addition to size-sensitivity effects, reactions
are structure-sensitive also. Arrangement of atoms on a surface has a significant effect on the
catalytic behaviour. Nanoparticles predominantly form (111) oriented surface which is the lowest

Chapter 1
20
energy crystal face. Different shapes of nanoparticles show the different stability, activity and
selectivity. In nanomaterials, the under coordinated surface atoms provide an additional freedom
to the reactants in catalysis compare to its bulk counterpart. The impact of under-coordination is
tremendous because of deviation from bond length, order and angle.
Catalysis is the driving force behind some chemical industries and also is foundation for a
large-scale production of the chemical and petroleum industry. In recent years, the significant
achievements have been made in the area of metal nanoparticles as heterogeneous catalysts. With
the help of molecular orbital (MO) theory, the interaction between an adsorbate and a metal
catalyst can be explained. Noble metal nanoparticles show superior catalytic activity because these
nanocatalysts are involve in the formation of bonds between reactant molecules and the surface
atoms of the nanoparticles, which causes weakening of the bonds in the reacting molecules. This
eventually results in the lowering of activation barrier. Electronic structure and the geometry is an
important consideration in the metal nanoparticles catalysis. From Bronsted-Evans-Polanyi (BEP)
relation, the strong adsorption energies result in the faster reaction rates for first order surface
reactions. The BEP relation shows that the strong binding will lead to small energy barriers, and
thus the catalytic performance is limited by desorption of the products. However, in the case of
weak binding, the reaction rate is limited by the large activation energies as predicted by BEP.
Therefore, an optimum binding energy is needed for better performance of a catalyst. The
reduction of p-nitrophenol (PNP) using mono and bi-metallic nanoparticles has been studied by
Pozun et al. 2013. Using BEP relation, they have shown that the rate of PNP reduction can be
predicted from the binding energy of adsorption. The PNP reduction in an excess of sodium
borohydrate (NaBH4) fallows pseudo-first-order kinetics in the presence of metal nanoparticles
catalysts and depends only on the concentration of PNP in solution. Here, the PNP molecule binds

Chapter 1
21
to the metal nanoparticles through two oxygen atoms of the nitro group and creates a pentagonal
cyclic intermediate (M-O-N-O-M). Hence, the rate constant for the catalytic reaction can be
correlated easily to the initial adsorption of the PNP molecule to the nanoparticles surface.
Therefore, the rate of the reaction is controlled by the PNP adsorption onto the metal nanoparticles
in the presence of excess of NaBH4 as reductant.
The Hammer-Nørskov (Hammer and Nørskov 1995) model suggests that the primary controlling
factor in chemisorption is d-band of the metal surface. After interaction of the adsorbate with metal
d-band, the adsorbate state overlaps with the metal states and is split off into bonding and
antibonding interactions. The antibonding states are increasingly populated, as the d-band becomes
farther below the Fermi energy and the overall chemisorption strength weakens. Figure 1.9 shows
a scatter plot of the d-band centre against the adsorption energy. As can be seen from Figure 1.9,
the adsorption strength increases as d-band centre gets closer to Fermi energy. The adsorption
energy decreases as we move down the columns of the periodic table. This trend has been observed
by Hammer for oxygen adsorption on noble metals. The d-band is nearly filled and many anti-
bonding states are populated for coinage metals. The population of bonding and anti-bonding
levels cause repulsive forces which increase with the orbital size down the periodic table. This
causes eventually weaker adsorption on to Pd and Pt rather than Cu, despite differences in d-band
centres.

Chapter 1
22
Figure 1.9 A scatter plot of the d-band centre of the metal surface versus the adsorption strength
of p-nitrophenol (Pozun et al. 2013).
Similarly, the effect of d-band centre of noble metals for the formic acid decomposition has
been studied. Formic acid is an in situ source of hydrogen which has been studied in the fuel cell
applications. Formic acid is non-toxic, offers high energy density (contains 4.4 wt% of hydrogen),
safely handled in aqueous solutions, and more importantly it is one of the major products formed
during biomass processing. As reported in literature, formic acid decomposes in two path ways on
the Pd surface and some of other metal complexes at suitable temperatures (Akiya and Savage
1998; Ruthven and Upadhye 1971; Hill and Winterbottom 1988; Puddephatt and Yap 1998; Coffey
1967; Hyde and Poliakoff 2014; Abdur-Rashid et al. 2002).
HCOOH → CO2 ↑ +H2 ↑∶ ∆G = −48.4KJmol−1(1)
HCOOH → CO ↑ +H2O ↑∶ ∆G = −28.5KJmol−1(2)
From the above equations, dehydrogenation (eq 1) is a promising decomposition process for
hydrogen gas production compare to dehydration (eq 2). CO gas produced during dehydration of
formic acid contaminates the catalytic surface which leads to reduction in the activity of catalyst.
There are two ways reported in the literature to overcome this problem. The first one is by using
the core-shell nanoparticles of noble metals. The CO adsorption on metal surfaces fallows the

Chapter 1
23
trend: Pd > Cu > Ag > Au (Abild-Pedersen and Andersson 2007). This shows that Ag and Au do
not form stable complexes with CO (Judai et al. 2003). When the Pd is alloyed with Cu, Ag, and
Au, the resultant core-shell particles inhibit the adsorption of CO on Pd surface (Johanek et al.
2001; Karski et al. 2005). Hence, the occupied active sites are released due to desorption of CO
from the Pd surface and consequently reaction (1) is not inhibited. The second one is by basic
groups containing platform for hydrogen production, in which a cooperative action between active
Pd NPs and weakly basic groups (–NR2 ) on the supported platform plays an important role in
achieving efficient catalytic performance. The basic groups containing matrices eliminate the
requirement for the additives to suppress the concomitant CO formation. The decomposition of
formic acid on the Pd0 surface is shown in Figure 1. 10.
Figure 1.10 The possible reaction pathway of formic acid decomposition by Pd on basic groups
containing membrane/resin (Mori et al. 2013).
As shown in Figure 1.10, first -O-H bond cleavage of formic acid is facilitated by the weakly
basic group (-NR2). This acts as a proton scavenger and forms a Pd-formate complex/species. The
Pd-formate species undergoes -hydride elimination to produce CO2 and palladium hydride

Chapter 1
24
species. The reaction of hydride species with –+HN(R2) produce molecular hydrogen along with
regeneration of the Pd0 species.
To understand the trends in the reactivity of metal surfaces, Ruban et al. have proposed a
model for the chemisorption systems. This model involves the density functional theory (DFT),
summarized by the d-band centre model (Ruban et al. 1997). The closer d-band centre is to the
Fermi level of a metal, the higher the adsorption energy it exerts on an adsorbate until reaching
optimum at Pd. The adsorption trend of formic acid on noble metal fallows: Pd > Rh > PtRu >
Au > Ag. Thus, the activity of formic acid decomposition depends on intrinsic electronic properties
of the metallic NPs. In Figure 1.11, the decomposition of formic acid versus d-band centre is
depicted. Among transition metals, Pd is the most active monometallic element that had been
reported in the literature for formic acid decomposition in aqueous phase.
Figure 1.11 Plot of rates of formic acid decomposition versus d-band centre (Tedsree et al.
2011).

Chapter 1
25
1.4 Immobilization of nanocatalyst on solid supports
Among the metal nanocatalysts, noble metal nanoparticle catalysis has emerged as one of the
forefront subjects in scientific community due to their spectacular properties such as tuneable
surface plasmon and photo-thermal effects, excellent resistant to corrosion and air oxidation, and
lesser cytotoxicity as well as their easy experimental realization. These properties make them
excellent candidates for the biological, opto-electronic and environmental related applications.
However, because of their small size and high surface area, they tend to agglomerate causing the
physical instability. Moreover, they are difficult to withdraw from the system because of their size.
This problem limits their recyclability and reusability. Therefore, a support matrix is prerequisite
to stabilize effectively and prevent the nanocatalysts from agglomeration. In recent years the solid
supports such as carbon nanomaterials (Yang et al. 2014, Su et al. 2013), superparamagnetic Fe3O4
nanoparticles (Gawande et al. 2013), inorganic particles (silica and titania) (Boudjahem et al.
2010), porous inorganic supports, synthetic/natural polymers (film, membranes, resins and beads)
(Mori et al. 2013; Trzeciak et al. 2008) have been examined. Among all these solid supports,
nanocatalysts immobilized on the magnetic nanoparticles and polymer films /membranes are easily
retrievable from the process in which they act as nanocatalysts.
1.4.1 Synthetic polymer membranes as host matrix
Synthetic polymer membranes have been extensively used as a host matrix for numerous
applications as shown in Figure 1.12. These membrane hosts provide an inter phase that separates
two phases and controls the transport of various components from one phase into the other in a
specific manner. The membrane systems are compact and low energy consuming. A membrane
can have defined pores in the range of 1 nm to 1000 nm. Membrane may be liquid or solid and

Chapter 1
26
may consist of organic, inorganic, or metallic materials. It may be neutral or it may carry positive
or negative charges, or functional groups having specific binding abilities. The thickness of the
membrane can be less than 100 nm or more than several millimetres. Driving forces in membranes
processes are gradients in the activity, hydrostatic pressure, electrical potential, and temperature
that can lead to a diffusive and/or convective transport of the individual molecules through
membrane. Membranes can be porous or homogeneous dense membranes. These dense
membranes can be carrying electrical charges or selective functional groups. Structure of the
membrane may be isotropic or symmetric, that is the structure is identical over the cross-section
of the membrane. Anisotropic or asymmetric, that is the structure varies over the cross section of
the membrane.
Membrane supported transition/noble metal nanoparticles have the potential applications in
catalysis. Nanocomposites containing metal nanoparticles embedded in the polymer matrix are
used in optics, sensors and catalysis applications see Figure 1.12. The control over size and
distribution of nanoparticles in the polymer matrix are the main issues in the polymer
nanocomposites. The immobilization of nanoparticles in solid and dense matrix may cause a
diffusion resistance during the catalytic reaction as reactants need to diffuse to the nanoparticle
surface. The diffusion resistance can be minimized by immobilizing the nanoparticles in an open
matrix like microfiltration membrane. The porous structure of the membrane is essential for
attaining the efficient utilization of available sites and easy accessibility to the nanoparticles
embedded at the interior membrane matrix. Nanoparticles immobilized in the membrane have
great advantage for the catalytic reactions because diffusion limitation can be minimized under
convective flow.

Chapter 1
27
Figure 1.12 Various applications of the functionalized polymer membranes.
1.4.2 Bio-polymers as host matrix
Even though nanocatalyst colloid suspensions are having high catalytic activities, these face
serious issues such as irreversible agglomeration and difficulty in product separation and recycling.
Therefore, the effective way of maintaining these nanocatalysts is immobilizing them on a solid
support. Among many solid supports, biopolymer supports provide a green to the nanoparticles
synthesis. Bio-polymers including eggshell membrane, plant tissue, and mushrooms have been
used as solid supports. Because eggshell membrane is rich in functional groups like -NH2, -OH,
and -CHO on the surface, it has been explored as a bio-sensing material, high performance
electrode material, heavy metal ions adsorber and as a catalyst support material. The eggshell
membranes are very good supports for the nanoparticles synthesis because the functional groups
on the fiber surfaces act as stabilizing as well as reducing agents, which removes the need of
external reducing agent and capping agents for NPs synthesis. As reported in the literature (Nakano
et al. 2003; Zheng et al. 2010; Mallampati and Valiyaveettil 2014), the main constituents of
chicken eggshell membranes are amino acids (glycine and alanine) and uronic acid. The aldehyde
Membrane pore
Functionalization
Functional groups: -OH, -COOH,
-NH2, SO3H, etc
Nanofiltartion
Catalysis
Metal ions capture
Gas separation
Protein purification
Functionalized Membrane pore

Chapter 1
28
moiety of uronic acid and saccharides in eggshell play significant role in reducing the surface-
adsorbed metal ions to NPs. In addition to the eggshell membrane, the bio polymer chitosan has
also been used as a catalyst support. The amine and hydroxyl groups on the chitosan polymer
stabilize the nanoparticles formed on it and also prevent them from oxidation (Baig et al. 2014).
1.4.3 Electrospun fibres mat
Nanostructured materials such as nanoparticles, nanotubes, nanofibers (NFs), and nanowires
are the most studied nanomaterials (Safari et al. 2014; Khajeh and Dastafkan 2014; Zohoori et al.
2014; Meng et al. 2014; Choi 2014.). Among these materials, NFs are the most efficient and
promising nanomaterials due to their distinctive characteristics like flexibility of their surface
functionalities and high surface to volume ratio. Therefore, NFs are extensively used as the
building blocks of nanodevices, and nanomembranes (Wu et al. 2007; Suren et al. 2014). The NFs
have also got applications in the fields of catalysis (Panthi et al. 2013; Chun and Jo 2014; Zhang
et al. 2010), antibacterial (Liu et al. 2014), biomedical (Du et al. 2012; Shao et al. 2011), and
sensing (Zheng et al. 2014; Yoon et al. 2012) applications. Electrospinning was first reported in
1934 (Anton 1934). Since then it has been widely used technique for making NFs. It is low cost,
handy, and high-speed technique to fabricate NFs with diameter ranging from nanometer to
micrometer. Different applications of NFs are given in Figure 1.13.

Chapter 1
29
Figure 1.13 Various applications of electrospun fibres.
Synthetic and natural polymers are being used for the fabrication of NFs. Synthetic polymers
such as poly(vinyl alcohol) (PVA) (Yang et al. 2007), poly (vinyl acetate) (PVAc) (Park et al.
2008), poly(ethylene glycol) (PEG) (Wang et al. 2012), poly(acrylonitrile) (PAN) (Liao et al.
2011), polyamide (PA) (Im et al. 2008), polyurethane (PU) (Ge et al. 2013), and poly(ether
sulfone) (PES) (Tang et al. 2009) and natural polymers like chitosan (Geng et al. 2005), chitin
(Noh et al. 2006), collagen (Ding et al. 2003), cellulose (Memarian et al. 2014) etc are the most
studied polymers. Catalysis is the most explored application among the various applications of
NFs. Encapsulating nanomaterials within the polymeric NFs in the form composite is an effective
technique. By synthesizing composite NFs, the aggregation, leaching and size distribution can be
controlled. Another way of controlling the size distribution is metallization on the surface of the
NFs by introducing functional groups on to NFs.
Electrospun nanofibers
Sensors
Catalysis
Filtration
Energy storage
Electronics
Bio medical
Protective clothing
Space applications

Chapter 1
30
1.5 Scope of the thesis
As discussed above, the noble metal nanoparticles exhibit exceptional catalytic activity originating
from their size reduction and shape variation. However, their recyclability and stability are major
issues in large scale viable applications. To address these problems, the present thesis is mainly
focused on the functionalization of microporous membranes and electrospun microfibers mat by
UV-initiator induced grafting/anchoring with subsequent chemical modifications to host the noble
metal nanoparticles such as Ag, Au, Pd, Ru and Rh. These noble metals are well known for their
catalytic activity in the organic/inorganic transformations. The choice of membrane as host has
been based on the egg shell membrane which self-reduces noble metal ions and stabilizes thus
formed nanoparticles. The nanoparticles hosted on the egg shell membrane exhibit very high
catalytic activity due to its fibrous structure and uncapped nanoparticles. Therefore, the polymer
membranes mimicking egg shell membrane in terms of physical and chemical architectures have
been synthesized and evaluated for their catalytic activity in the representative inorganic
reductions, degradation of organic dyes and Mizoroki-Heck coupling reactions. The reductions of
oxyions such as Cr(VI) and U(VI) have been studied not only due to their remediation point of
view but also their many technological applications, especially for reduction of U(VI) ions. The
functionalized polymeric host materials developed in this work can be dived into three parts i.e.
(i) self-reducing membranes/electrospun microfibers, (ii) cation-exchange membranes, and (iii)
amine/phosphate-functionalized membranes. The oxy-ions reductions have been carried out by in
situ hydrogen produced by formic acid decomposition. The decomposition of formic acid in the
presence of Pd is being studied extensively for the hydrogen production. Therefore, it is interesting
to use formic acid decomposition for the reduction of the oxy-ions.

EXPERIMENTAL
400 500 600 700
0.0
0.2
0.4
0.6
0.8
1.0
1.2
U4+
UO2
2+
U4+
Ab
so
rba
nc
e
Wavelength(nm)
300 350 400 450 500
0.0
0.2
0.4
0.6
0.8
1.0
1.2
66 Sec
0 Sec
Ab
so
rban
ce
Wavelength
300 350 400 450
0.0
0.2
0.4
0.6
0.8
1.0
1.2
Ab
so
rba
nc
e
Wavelength(nm)
0 time
1 min
5 min
15 min
30 min
45 min
60 min
500 550 600 650 700 750
0.0
0.2
0.4
0.6
0.8
1.0
20 Sec
0 Sec
As
orb
an
ce
Wavelength(nm)

Chapter 2
32
2.1 Nanoparticles synthesis
Size and shape of the nanomaterials have a strong influence on their physicochemical properties,
which affect the particular applications like catalysis, optical sensing, antibacterial activity,
biomedical field, and as molecular markers etc. Therefore, control over morphology, size and
distribution of nanoparticles (NPs) is very important. These can be controlled by different synthetic
routes, different reducing agents, stabilizers/ligands, and varying experimental conditions. The
appropriate advanced techniques would be needed to get the information regarding structural,
morphological, optical and chemical properties of these materials. The bottom up chemical
approach was adopted in the present work for the synthesis of noble metal nanoparticles in the
polymer membranes and on electrospun microfibers mats. In this chapter, therefore, the general
introduction related to principle, working, instrumentation and applications of different
characterization techniques used in the present work has been discussed. The methodologies
adopted for the synthesis of noble metal nanoparticles in the polymer membrane and on
electrospun microfibers mats have been described briefly from the experimental point of view.
The methods/methodology involved in the studies of the applications of these matrices supported
noble metals NPs in the reduction/transformation of organic, inorganic molecules/ions and
monitoring the progression of these reductions/transformations etc have also been described in this
chapter.
2.1.1 Experimental methods used for syntheses of noble metal NPs
2.1.1.1 Materials and reagents
Glycidyl methacrylate (GMA), ethylene glycol dimethacrylate (EGDM), α,α'-dimethoxy-α-
phenyl-acetophenone (DMPA), N-methyl-D-glutamine (NMDG), 2-acrylamido-2-methyl-1-
propane sulfonic acid (AMPS), spacer (3-acryloxypropyl)trimethoxysilane (APTMS), Pd/C (10

Chapter 2
33
w/w%), ethylene glycol methacrylate phosphate (EGMP), and polyethylenimine (PEI) (branched
polymer, Mn = 10,000) were purchased from Sigma-Aldrich. The noble metal salts AgNO3, PdCl2,
RuCl3, RhCl3 and H2PtCl6.xH2O, Hydrazine hydrate (99%), methanol, dimethyl acetamide
(DMAc), formic acid and HNO3 (69-70%) were obtained from S.D. Fine Chem. Ltd. India and
HAuCl4 from Pravat Chemicals, India. Acetone was procured from Sisco Research laboratories
Pvt. Ltd, India. Formic acid (98-100%) was obtained from BDH-Chemicals Ltd, Poole England.
PES (granules having 3 mm nominal size) were purchased from Good Fellow Cambridge Ltd.
(England). The microporous poly(propylene) (PP) membranes (AccurelR PP 1E) having 0.1 μm
pore-size and 90 μm thicknes were obtained from Membrana GmbH, Germany and also
poly(propylene) (PP) host membranes having 0.1 m pore-sizes, thickness 50 m and nominal
porosity 78% was obtained from Sterlitech corporation. The grafting was done in a multilamps
photo-reactor obtained from Heber Scientific, Chennai, India (model no. HML-SWMWLW-888).
All the reagents used in the present work were A.R. Grade.
2.1.1.2 General procedure for synthesis of pore-filled host membranes
The UV-initiator induced graft/homopolymerization method has been used for developing the
polymer grafted/anchored precursor membranes and sheets, followed by chemical modifications
to generate required functional groups in the polymeric host materials. Depending upon the
functionality required for hosting the noble metal nanoparticles, various functional groups were
grafted/anchored in the commercially available poly(propylene) (PP) membranes and on the home-
made poly(ether sulfone) (PES) fiber mats as described below:
To synthesize the various functionalized membranes/fiber mats, the commercially available
microporous PP sheets and microfibers mats were soaked in methanol for 3h before immersing in
the polymerizing solution. To saturate the pores of the host membranes/fibers with polymerizing

Chapter 2
34
solution, the substrates were immersed for overnight under ambient conditions. The excess of
polymerizing solution adhering on the surface was removed gently with Teflon rod. Then, the
resultant solution filled substrates were sandwiched between two gareware sheets and removed
trapped air bubbles in the sheets and substrate (membrane) and exposed to 365 nm UV light in a
multi-lamps photo-reactor for a period of optimized 20 min. After exposure in the photo-reactor,
the polymeric materials were removed and washed subsequently with the solvent to remove the
un-polymerized components.
The photo-reactor consisted of eighteen lamps (8 watt each) arranged in a circular geometry as
shown in Figure 2.1. These eighteen lamps were separated into six sets emitting a fixed wavelength
(λ) (254, 312 and 365 nm). After sandwiching the polymer membranes in polyester sheets, these
were fixed on to a glass plate and followed by UV-irradiation with desirable wavelength in the
photo-reactor. The irradiation time was optimized depending on the percentage grafting required,
and wavelength of the irradiation was chosen depending on the photo-initiator used in the
polymerizing solution. In the present work, 365 nm wavelength was used for all the irradiation
experiments. In the presence of UV-light, the initiator forms free radical which initiates the
graft/homo-polymerization in the membrane. The mechanism of formation of free radicals
produced from the photolysis of the initiator “’--dimethoxy--phenyl acetophenone (DMPA)”
in presence of UV-light (λ=365 nm) is shown in Scheme 2.1, similarly the free radicals production
from the poly(ether sulfone) (PES) upon exposure to UV irradiation is given in Scheme 2.2. The
general procedure for the synthesis of pore-filled membranes is given in Figure 2.1. and the
possibility of synthesizing various types of membranes by changing the monomer concentration,
exposure time and the way of exposure of the membrane to UV-light are shown in Figure 2.2,

Chapter 2
35
Figure 2.1 Schematic representation of the steps involved in synthesis of pore-filled precursor
membranes.
Cooling fan
UV lamps UV lamps
Polymerizing Solution in DMF
Monomer + Cross-linker + UV-initiator
Pore-filled Precursor Membranes
Membrane sandwiched between glass plates
UV-initiator induced grafting

Chapter 2
36
Photolysis of ’--dimethoxy--phenyl acetophenone (DMPA)
Scheme 2.1 Formation of free radicals (1R, 2R, 3R) from photolysis of ’--dimethoxy--phenyl
acetophenone (DMPA).
Photolysis of Photolysis of poly(ether sulfone) (PES)
Scheme 2.2 Mechanism of formation of free radicals from photolysis of poly (ether sulfone).
C C
OCH3
OCH3
O
C
OCH3
OCH3
C
O
C
O
OCH3
•CH3
h
+ ..
C
OCH3
OCH3
. +
1R 2R
3R
O S
O
O
O
* O S O *
O
O
+
UV-light
..
n
Low pore-filling Dense pore-filling Pore-grafting Surface-grafting
Figure 2.2 The different types of pore-filling membranes prepared by controlling the amount of
polymer anchored/grafted on the pore walls of the membrane.

Chapter 2
37
2.1.1.3 Self-reducing membranes as host matrix
The inspiration and motivation of synthesizing noble metal nanoparticles without using any
external reducing agents was attributed from the self-reducing biomaterials. Biomaterials like egg
shell membranes, sugars, vitamins, and agricultural extracts can be used for the reduction as well
as capping of the nanoparticles and these biomaterials are low cost, non-toxic, and may provide
control over shape and size distributions of NPs.
In the present work, a synthetic self-reducing polymer membrane was developed by anchoring
glycidyl methacrylate along with a cross linker in the pores of a poly(propylene) (PP) membrane
by UV-initiator induced polymerization. To this membrane, the self-reducing moieties N-methyl-
D-glucamine (NMDG) /or hydrazine were attached covalently by epoxy ring opening of glycidyl
units of grafted/anchored poly(glycidyl methacrylate) (GMA). The NMDG anchored PP
membrane was found to reduce and form Ag, Au, Pd, Rh and Ru nanoparticles by simply dipping
the membrane samples in the 0.1 mol L-1 solutions of AgNO3, HAuCl4, PdCl2, RhCl3 and RuCl3
solutions (Chapter 3). Similarly, the hydrazine anchored membrane was found to form Pd NPs
from PdCl2 salt solution without using any external reducing agent (Chapter 5).
2.1.1.4 Self-reducing PES microfibers mat as host matrix
Porous poly(ether sulfone) (PES) microfibers mat has been prepared by electrospinning technique.
This microfibers mat was functionalized with poly(glycidyl methacrylate) (poly(GMA)) by UV-
induced graft-polymerization. The reducing moiety hydrazine was anchored via epoxy ring
opening of poly(GMA). The grafted poly(GMA) shell around porous microfiber was found to
perform the reduction of precursor ions by anchored hydrazine leading to the nucleation and
growth of Pd NPs on the host matrix (Chapter 4).

Chapter 2
38
2.1.1.5 Ion-exchange membrane as host matrix
The cation-exchange membrane was prepared on the PP membrane by polymerizing 1:1mol
proportions of monomers acrylamido-2-methyl-1-propanesulfonic acid (AMPS) and (3-
acryloxypropyl) trimethoxysilane (APTMS) along with cross-linker ethylene glycol
dimethaycrylate (EGDM) and UV-initiator 2-2’-dimethoxy-2-phenylacetophenone (DMPA) in
pores of PP membrane. After anchoring, the membrane was conditioned in 0.1 mol L-1 NaCl
solution for 24 h, and then equilibrated with 0.01 mol L-1 PdCl2 solution to load Pd2+ ions by ion-
exchange. Then these Pd2+ loaded membrane samples were reduced to Pd0 by immersing in 10%
v/v aqueous hydrazine solution.
2.1.1.6 PEI functionalized membrane as host matrix
The host PP membrane was functionlized with poly(GMA) by UV-initiator induced
polymerization of GMA monomer. To this, high molecular weight (Mn=10,000) polyethylenimine
(PEI) was attached. The Pd2+ ions were loaded in to this PEI functionalized membrane fallowed
by reducing with 0.05 mol L-1 sodium borohydride (NaBH4). The loading capacity towards Pd0 of
these membranes were varied by varying the amount of PEI and was estimated using ICP-AES.
Similarly, another type of phosphate functionalized membrane was prepared by anchoring the
monomer ethylene glycol methacrylate phosphate (EGMP) in the host PP membrane using similar
methodology. The Pd2+ ions were loaded on to this membrane fallowed by reducing with 0.05 mol
L-1 sodium borohydride (NaBH4). The equation involving formation Pd NPs from borohydride
reduction is given below. The loading capacity towards Pd0 of this membrane was estimated using
ICP-AES. (Chapter 6)
𝑷𝒅𝟐+ +𝟐𝑩𝑯𝟒− +𝟖𝑯𝟐𝑶 → 𝑷𝒅𝟎 +𝟐𝑩(𝑶𝑯)𝟒
− +𝟕𝑯𝟐 +𝟐𝑯+

Chapter 2
39
2.2 Analytical techniques for characterization of nanoparticles
Surface and cross-sections of the nanopaticles containing host membranes were characterized
using the JSM-7600F field emission scanning electron microscopy (FE-SEM). Energy dispersive
spectrometer (EDS) (equipped with FE-SEM) was also used to obtain information about elemental
distributions across the host matrix. Inductively coupled plasma atomic emission spectroscopy
(ICP-AES) analysis was done using high resolution simultaneous atomic emission spectrometer
(Spectro Arcos, Germany) coupled with ICP. DC arc as the excitation source and charge coupled
device (CCD) as the detector were used to quantify the amount of nanoparticles formed on the host
matrices. Radiotracer technique was used to determine the ion-exchange capacity. To monitor the
catalytic redox reactions, UV-Visible spectrometer (USB4000-UV-VIS-ES, Ocean Optics) was
used. These experimental methods/techniques, instrumentations and principles involved are
discussed below.
2.2.1 Electron microscopy
Unlike optical microscope in which visible light (400-700nm) is used as light source, the electron
microscope uses a beam of accelerated electrons as a source in electron microscopy. Much lower
de Broglie wavelength of electrons makes electron microscope possible to get a spatial resolution
thousand times better than light microscope. Electron microscope has resolution of the order of a
few angstroms whereas, optical microscope is limited to about 200nm. The difference in the
resolution is mainly due to light diffraction limit. The optical resolution can be estimated as λ/2NA
(λ = wavelength) (NA is the numerical aperture of a lens. For an average white light wavelength
of 500nm, the best resolution is of few hundred nm. Thus decreasing the wavelength is only the
way to get better resolution. The wavelength of electron beam produced from a 20kV electron gun
is 0.06nm corresponds to resolution limit of λ/2=0.3 Ao (theoretically). The comparisons of

Chapter 2
40
schematic of optical/light microscope (LM), scanning electron microscope (SEM) along with
transmission electron microscope (TEM) are shown in Figure 2.3.
In electron microscopy, electrons are generated by thermionic emission i.e. electrons are generated
by heating of a tungsten filament by means of current and temperature for about 2800oC. In FE-
SEM, there is no heating involved but so called “cold” source is used. For cold source, an
extremely thin and sharp tungsten filament is used as electron source which functions as a cathode
in front of primary and secondary anode. The voltage between cathode and anode is kept in the
order of 0.5 to 30kV so that the electron beam produced in FE source is about 1000 times smaller
than the standard electron microscopes. If the vacuum is maintained stable, the filament tip last
theoretically for a life-time comparable to conventional tungsten filament. Two types of electron
microscopes are commonly used to probe the objects in nanoscale. They are (i) scanning electron
microscopes (SEM), and (ii) Transmission electron microscope (TEM).
Figure 2.3 Schematic comparison of optical/light microscope (LM), transmission electron
microscope (TEM) and scanning electron microscope (SEM).

Chapter 2
41
2.2.1.1 Field-emission scanning electron microscopy (FE-SEM)
In field-emission microscope electrons are used as light source and these electrons are produced
by field emission source. This technique is used to visualise very small topographic details on the
surface of an object. The electron beam diameter produced by FE source is about 1000 time smaller
compare to thermionic source used in SEM. To resolve a feature on the specimen surface, the beam
diameter must be smaller than the feature. The electron beam can lose energy after interaction with
matter. This loss of energy converts into many forms such as heat, emission of low energy
secondary electrons, high energy back scattered electrons, and X-rays emission, and all of this
carry information about surface structure of the object. There is no true image exists in this kind
of microscopes rather synthesized electronically.
The samples have to be prepared for SEM in such a way that it should withstand high vacuum
conditions and high energy beam of electrons. Nonconductive samples such as polymers are made
conductive because these specimens collect charge when scanned by an electron beam, resulting
to faults and other image artefacts. To minimize accumulation of electric charge, these specimens
are made conductive and electrically grounded. This is done by coating the samples by an
extremely thin layer (0.5-3nm) of gold or gold-palladium. Polymers, ceramics and crystals are
usually less problematic and retain their structures under SEM conditions as compare to biological
materials that require the pre-fixation. A typical FE-SEM image of porous poly(propylene)
membrane which was used in the present work is shown in Figure 2.4.

Chapter 2
42
Figure 2.4 A representative FE-SEM image of poly(propylene) membrane.
2.2.2 Inductively coupled plasma-atomic emission spectroscopy (ICP-AES)
Atomic emission spectroscopy coupled with ICP is used to determine the metal ions concentration
in solution phase. In this the liquid sample is introduced into the system via a nebulizer. The
injected liquid was made into plasma by torch, in which the temperature ranges from 6000 to
10000K. Argon gas was used as a carrier. The plasma is created when argon atoms are ionized
with a Tesla coil, while the RF induction coil produces a magnetic field. The atoms in the sample
are excited when the torch breaks up the molecules and ionizes them. When the ions are de-excited,
the photons of characteristic wavelength are emitted. The intensity of this emitted light is
proportional to the concentration of the elements in the sample. Diffraction grating is used to
separate the emitted light spectrum into individual wavelengths. The schematic representation of
the ICP-AES instrument was shown in Figure 2.5.

Chapter 2
43
Figure 2.5 The schematic representation of ICP-AES instrument.
2.2.3 Ultraviolet-Visible spectroscopy
This spectroscopic technique studies interaction of electromagnetic radiation with matter.
Ultraviolet-visible spectroscopy refers to absorption or reflectance in the ultraviolet-visible region.
When the energy from ultraviolet or visible light was absorbed by a molecule, one of its electrons
jumps from a lower energy to higher energy molecular orbital. This absorption of light utilized for
transfer of electron from the ground state to the excited state is measured by using this technique
(shown in Figure 2.6). This analytical technique is complimentary to the fluorescence
spectroscopy. In fluorescence spectroscopy the electronic transitions from excited states to the
ground states were measured.
E (excited)
ΔE=[E(excited)- E(ground)] =hυ
E (ground)
Figure 2.6 The excitation process.
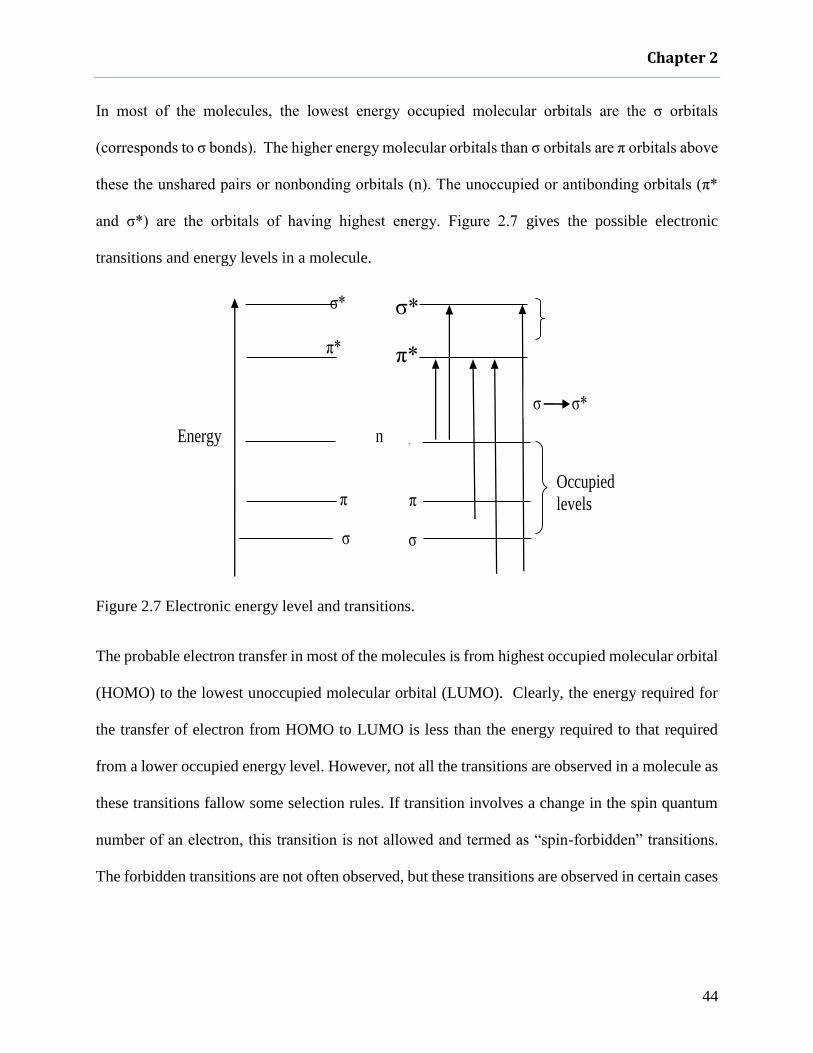
Chapter 2
44
In most of the molecules, the lowest energy occupied molecular orbitals are the σ orbitals
(corresponds to σ bonds). The higher energy molecular orbitals than σ orbitals are π orbitals above
these the unshared pairs or nonbonding orbitals (n). The unoccupied or antibonding orbitals (π*
and σ*) are the orbitals of having highest energy. Figure 2.7 gives the possible electronic
transitions and energy levels in a molecule.
Figure 2.7 Electronic energy level and transitions.
The probable electron transfer in most of the molecules is from highest occupied molecular orbital
(HOMO) to the lowest unoccupied molecular orbital (LUMO). Clearly, the energy required for
the transfer of electron from HOMO to LUMO is less than the energy required to that required
from a lower occupied energy level. However, not all the transitions are observed in a molecule as
these transitions fallow some selection rules. If transition involves a change in the spin quantum
number of an electron, this transition is not allowed and termed as “spin-forbidden” transitions.
The forbidden transitions are not often observed, but these transitions are observed in certain cases
σ*
π*
Energy n
n
π π
σ σ
Occupied
levels
σ σ*
π*
σ*
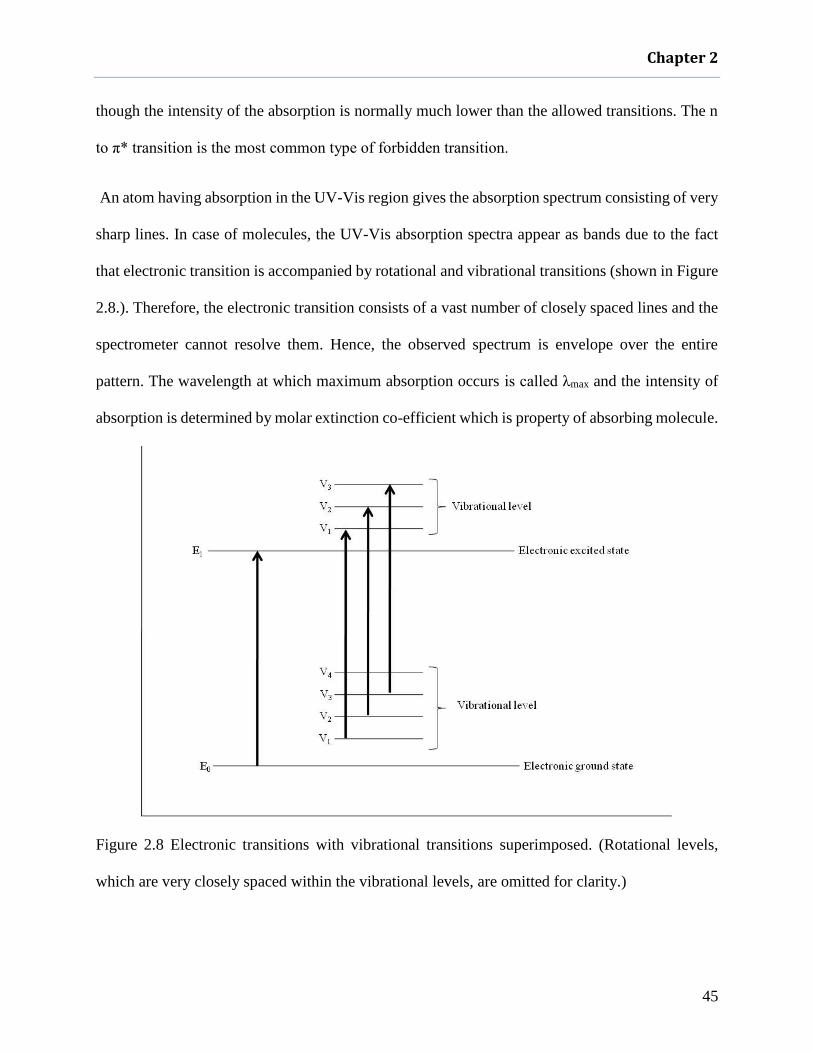
Chapter 2
45
though the intensity of the absorption is normally much lower than the allowed transitions. The n
to π* transition is the most common type of forbidden transition.
An atom having absorption in the UV-Vis region gives the absorption spectrum consisting of very
sharp lines. In case of molecules, the UV-Vis absorption spectra appear as bands due to the fact
that electronic transition is accompanied by rotational and vibrational transitions (shown in Figure
2.8.). Therefore, the electronic transition consists of a vast number of closely spaced lines and the
spectrometer cannot resolve them. Hence, the observed spectrum is envelope over the entire
pattern. The wavelength at which maximum absorption occurs is called λmax and the intensity of
absorption is determined by molar extinction co-efficient which is property of absorbing molecule.
Figure 2.8 Electronic transitions with vibrational transitions superimposed. (Rotational levels,
which are very closely spaced within the vibrational levels, are omitted for clarity.)

Chapter 2
46
Principles and instrumentation of absorption spectroscopy
Greater extent of light absorption is observed if a greater number of molecules are capable of
absorbing light of a given wavelength. The absorption phenomenon fallows Beer-Lambert law.
According to Beer’s law the absorption is proportional to the concentration of the absorbing
molecules. According to Lambert’s law, the fraction of radiation absorbed is independent of the
intensity of the incident radiation. The empirical expression of the Beer-Lambert law formulated
as (eq 1)
A = log10 (I0I) εcl(1)
A = Absorbance
Io= Intensity of the incident light
I = Intensity of the transmitted light
ε = molar absorptivity (mol-1 dm3 cm-1)
c = molar concentration of solute (mol dm-3)
l = length of sample cell (cm)
The term log (I0/I) is known as absorbance (or the optical density). The molar absorptivity (or
molar extinction coefficient) is a property of the molecule undergoing electronic transition. The
molar absorptivity ranges from 0 to 106. Values above 104 are termed as high-intensity absorptions,
while values below 103 are low-intensity absorptions. Forbidden transitions have absorptivities in
the range from 0 to 1000. Beer-Lambert law is obeyed when a single species gives rise to the
observed absorption. However, Beer-Lambert law is not obeyed when different forms of the
absorbing molecule are in equilibrium, solute and solvent form complexes through some sort of
association, thermal equilibrium exists between ground and low-lying excited electronic states or
when fluorescent compounds or compounds changed by irradiation of light are present.

Chapter 2
47
There are three general arrangements in single beam UV-Visible spectroscopy instrument (Figure
2.9). First, the incident beam passes through the monochromator/grating which segregates the
wavelengths. Then, the desegregated light goes through the sample and finally photo-detector and
amplifier. In single beam geometry, the reference spectrum is measured first, and then the sample
spectrum corrected by reference spectrum.
Figure 2.9 Schematic representation of a typical UV-Visible spectrophotometer.
2.2.4 X-ray diffraction (XRD)
XRD is a non-destructive technique. This is used to identify the crystalline phase, orientation,
lattice parameter, phase composition, strain, grain size, atomic arrangement, space group
symmetry, translational symmetry etc of an unknown sample. In this, a collimated beam of X-rays
interacts with the crystal and the angles at which the beam is diffracted are measured. Each
diffracted X-ray signal corresponds to a coherent reflection, which is known as Bragg reflection,
from successive planes of the crystal. The Bragg’s law is defined as (eq 2):
2𝑑 sin 𝜃 = 𝑛𝜆(2)
Samples are scanned through a range of 2𝜃 angles. For a powdered material, all diffraction
directions are possible due to random orientations. These diffraction peaks give d-spacing which
allows identification of sample by comparing with standard reference pattern because each has
unique set of d-spacing. A perfect crystal would extend in all directions to infinity but no crystal

Chapter 2
48
is perfect because of its finite size. Broadening in the diffraction peaks was observed because of
deviation from the perfect crystallinity. This broadening occurs from several sources like, finite
crystalline size, strain, extended defects and instrumental effects. However, this type of broadening
is negligible above 100-500 nm size of the crystal. XRD measures crystallite size which may not
be same as particle size. Techniques like dynamic light scattering, electron microscopy and atomic
force microscopy measures the particle size rather than crystallite size.
The XRD instrument consists of three basic elements: an x-ray tube, sample holder, and an X-ray
detector (Shown in Figure 2.10). When high energy electrons dislodge inner shell electrons of the
target material, the characteristic X-ray spectra is produced. This spectrum consists of several lines
but the most common are K and K. The specific wavelengths are characteristic of the target
material. Copper is the most common used material for single crystal diffraction technique which
has K radiation of 1.5418A0. During interaction with the sample, when these X-rays satisfy the
Bragg equation, constructive interference occurs and peak in intensity is observed. A detector
records, processes and converts the signal to count rate.
Figure 2.10 A typical XRD instrumental setup.
Chapter 2
49
2.2.5 Energy dispersive X-ray fluorescence (EDXRF)
EDXRF is similar as EDS or EDAX. Only difference is electrons beam causes excitation instead
of X-rays beam. This spectroscopic technique uses fluorescence to obtain elemental composition
of the material. It is based on the principle of measurement of the energies or wavelengths of the
X-ray spectral lines emitted from the sample, which are the characteristic or signature of the
elements present in the sample. H.G.J. Mosley in 1913 discovered the relationship of photon
energy and element, and laid down the basis of XRF. The characteristic X-rays are independent of
chemical state of the element, because X-ray spectra originate from the inner orbitals. Therefore,
Mosley deduced a relation which states the reciprocal of wavelength (1/λ) or frequencies (ν) of
characteristic X-rays are proportional to the atomic number (Z) of the element emitting the
characteristic X-rays. The sample interacts with the primary X-rays (from source) causing
emissions of the secondary X-ray spectral lines having their characteristic energies or wavelength.
The intensities of these emitted characteristic X-rays are proportional to the corresponding
elemental concentrations. Unlike WDXRF (Wavelength Dispersive X-Ray Fluorescence), the
florescent photons from the sample are not dispersed spatially prior to detection. These are detected
by multi-channel analyser which acts as the energy dispersive device, though no real dispersion
takes place. The detector receives the un-dispersed beam of different energies on the basis of their
average pulse heights. EDXRF consists of three basic units. Excitation source (X-ray tube), sample
holder, and semiconductor detector Si (Li). The optimum target thickness, current, and voltage are
needed to get the best data from EDXRF system.
In addition to this, a primary beam filters (Table 2.1) the secondary targets are also equally
important to get the best results. Because, the primary excitation source leads to both continuum
and characteristic peaks fall on the sample. The beam filters are thin metal foil placed between

Chapter 2
50
source and sample. These primary filters eliminate the scattered background and these are used
based on the fact that an element absorbs wavelength shorter than its absorption edge. As primary
X-ray source gives broad spectrum of bremsstrahlung along with characteristic line of the target
material and to eliminate this background and bremsstrahlung radiation, a secondary target is used
where the primary beam is allowed to strike it. EDXRF directly measures energies of X-rays using
semiconductor detector and multichannel analyser (MCA) with no physical discrimination of the
secondary radiation that leaves the sample and enters the detector.
Table 2.1 The primary beam filters used in EDXRF.
2.2.6 Nuclear magnetic resonance spectroscopy (NMR)
NMR spectroscopy is a supplementary technique to IR spectroscopy. IR spectroscopy gives
information about functional groups of a compound while NMR gives the exact nature of the
proton, carbon and its environment. This spectroscopy is based on the measurement of absorption
of electromagnetic radiation in the radio-frequency region of roughly 4 to 900 MHz. Nuclei of
atoms rather than outer electrons are involved in the absorption process. It is necessary to place
Primary beam filter element Suitable for analysis of elements
Fe Ni, Cu, Zn, Ga, Ge, As, Pb
Cu Ge, Ar, Se, Pd
Ti Cr, Mn, Fe, Co, Ni, Cu, Zn
Mo Pb, Ag, In, Cd

Chapter 2
51
the analyte in an intense magnetic field to induce nuclei for developing the energy states required
for absorption to occur.
NMR is a non-destructive technique and it needs less than one milligram of the sample to get the
spectral information. Proton NMR technique is mostly used to characterize the organic
compounds. It gives information about different kinds of environments of the hydrogen atoms in
the molecule and also gives information about number of protons of each type and the ratio of
different types of protons in the molecule. The nuclei behave like a tiny magnet. The spinning
nucleus of a hydrogen atom (1H or proton) is the simplest and is commonly encountered in the
organic compounds. The hydrogen nucleus has a magnetic moment, µ = 1/2. Hence, in an applied
external magnetic field, its magnetic moment may have two possible orientations. One is in
alignment with the external magnetic field called as α-spin state which is more stable (lower
energy) and the other is in opposite alignment called -spin state, the difference in energy (ΔE)
between the two states is equal to h (ΔE= h) as shown in Figure 2.11(a) and (b). In NMR
spectroscopy, the radiation frequency is kept constant, and the strength of magnetic field is varied.
At some value of the field strength, the energy required for flipping the proton matches with the
energy of the radiation. In this condition, absorption of radiation occurs and a signal is obtained.
Such a spectrum is called a nuclear magnetic resonance (NMR) spectrum. Tetramethylsilane
(TMS) is generally employed as internal standard for measuring the position of 1H, 13C, and 29Si
in the NMR spectrum because it gives a signal sharp peak, is chemically inert and miscible with a
large range of solvents.

Chapter 2
52
Figure 2.11 The direction of magnetic moment due to spinning of proton (a) and the difference in
energy of the two spin states (b).
2.2.7 X-ray photoelectron spectroscopy (XPS)
XPS is a surface sensitive technique, which measures the elemental composition up to parts per
thousand. This is also known as electron spectroscopy of chemical analysis (ESCA). This
technique was developed in the 1960s by the Swedish Kai Siegbahn for which he received the
Nobel Prize in 1981. XPS provides the information about the chemical composition, chemical
structure, electronic and valance state of the atoms in the material. Except hydrogen and helium,
it detects almost all the elements in the periodic table. XPS is a non-destructive technique, which
is routinely used to analyze organic material, bio-material, metal/metal oxide nanomaterial,
polymers, glasses, ceramics, paints, bones, viscous oils and many others materials.
Principle
The XPS spectra are obtained by irradiating the sample with beam of X-rays and measuring the
number of electrons that escape from the surface thickness about 0 to 10 nm of the materials and
their kinetic energies. The Mg Kα and Al Kα X-rays are generally used because of their limiting
penetrating power in a solid. XPS requires high vacuum (10-8 milli bar) conditions. The energy of
the ejected electrons without energy loss was measured in the range of 20 to 2000 eV. The
External Magnetic
field
Alpha-spin state Beta-spin state
Beta-spin state
Alpha-spin state
Increase in applied magnetic field
Relative energy (E)
0
ΔE
(a) (b)

Chapter 2
53
interaction between X-rays and surface atom is explained on the basis of photoelectric effect. Thus,
kinetic energy (KE) of the escaped electron can be obtained from the below equation (eq 3).
BE = hυ − KE − ϕs (3)
Where, h is the energy of the incident photon, BE is the binding energy of the orbital from which
the electron originates and ϕs is the work function of spectrometer. From above equation, all three
quantities are measurable by XPS. Therefore, information about elements can be obtained by the
binding energy of the electron.
In practice, the measurements of binding/kinetic energy is done by the control electronics or
data system accompanying with the spectrometer, and the analyst only choose the range of binding
energy whichever is considered the more possible. The determined binding energy is used to
produce the XPS spectrum which is a plot of number of electrons captured (intensity) vs. their
binding energy. The chemical environment of the elements results in shifting of the binding energy
of core level electron, which is known as chemical shift. This shift is generally observed in the
order of 1-10 eV.
Instrumentation
The main components in XPS instrument are source of X-rays, an ultra-high vacuum chamber with
pumps, an electron collection lens and an electron energy analyzer in addition to the vacuum
chamber, sample mounts and a data collection system. The Figure 2.12 represents the main
components of an XPS system.

Chapter 2
54
Figure 2.12 The schematic diagram of XPS.
In the present work, XPS measurements were carried out using Mg-K (1253.6 eV) source and
DESA-150 electron analyser (Staib Instruments, Germany). A typical XPS survey analysis spectra
taken for Pd NPs immobilized on to the PEI functionalized PP host membrane is given in Figure
2.13. The survey spectrum is the starting point in XPS analysis as it gives information about all
the elements present on the sample surface.
Figure 2.13 A representative survey spectrum of Pd NPs embedded in PEI functionalized PP host
membrane.
0 200 400 600 800 1000
0
1000
2000
3000
4000
5000
6000
Pd
-4p
N-1
s
I-3
d
Inte
nsity (
cp
s)
BE (eV)
C-1
s
Pd
-3d
O-1
s
O-A
ug
er

Chapter 2
55
2.2.8 Small angle X-ray scattering (SAXS)
Small angle X-ray scattering (SAXS) is non-destructive and provides information about size and
shape of nanostructured materials (particles, fractals, etc.), pore sizes, distance between scatters in
partially ordered materials etc. by measuring elastically scattered X-rays (λ= 0.1-0.2 nm) at very
small angles (typically 0.1-100) (Glatter and Kratky 1982; Porod 1982; Guinier et al. 1955). It can
be broadly used for the characterization of metals, polymers, oil, plastics, cements, proteins, food
and pharmaceuticals in fundamental research as well as in quality control. This experiment can
be performed using a laboratory X-ray source or synchrotron light source.
Principle of SAXS
When a collimated beam of monochromatic radiation is incident on an object, part of it undergoes
elastic scattering, which changes the direction of incident radiation. This scattering intensity is a
function of scattering angel (2) or a scattering vector (q). The difference between the incident
(Ki) and scattered (Ks) wave vector is called scattering vector. Ki and Ks are proportional to the
linear momentum of the scattered and incident photon respectively (p=hK). The scattering vector
p= Ks- Ki denotes the momentum transfer vector. The schematic representation of SAXS
experimental setup is shown in Figure 2.14. the scattering vector described as q=q=4sin()/λ,
2 is scattering angle.
Figure 2.14 Schematic representation of the experimental setup for a SAXS experiment and
representation of the scattering vector (q) on the detector surface (Kikhney and Svergun 2015).
Sample
Incident beam (Ki)
Scattered beam (Ks)
q

Chapter 2
56
A typical laboratory based SAXS experimental setup consists of X-ray source, monochromator,
collimator, and detector. Since 2 is small, a large sample to detector distance is maintained to
improve angular resolution. In SAXS, the non-scattered beam that merely travels through the
sample must be blocked without obstructing the closely adjacent scattered radiation. This problem
can be overcome by making beam parallel by a multilayer parabolic mirror in conjunction with
slit collimation.
2.2.9 Capillary flow porometry (CFP)
Capillary flow porometer measures the most constricted part of through pores. In this the the
pressure necessary to blow the gas through a liquid filled porous membrane was measured. As the
applied gas pressure increases, at certain point the pressure overcomes the surface tension of the
liquid and pushes the liquid out of the pore. Based on this, the pressure can be correlated with the
pore diameter of the membrane using Washburn equation. The schematic representation of this
method is shown in Figure 2.15.
∆𝑃 = 4𝛾 cos 𝜃 /𝐷(4)
ΔP = applied pressure
D = diameter of the most constricted part of pore
= air-liquid interface surface tension
= wetting angle with solid matrix of the membrane

Chapter 2
57
Figure 2.15 The schematic representation of principles of CFP of a membrane.
For membrane-based catalysis, the information regarding pore diameter distribution in a
membrane is necessary. To get the information on characteristics of pores in a membrane, the
methods such as microscopy, Brunauer-Emmentt-Teller (BET) gas adsorption method, bubble
pressure method (capillary flow porometry, liquid extrusion porosimetry, mercury intrusion
porosimetry), permeation methods (Gas/liquid flux variation with pressure) are used generally. If
the membrane pores are cylindrical and straight, then the microscopic methods such as scanning
electron microscopy (SEM), atomic force microscopy (AFM) are useful. However, the surface
views of the pores are not useful if the membrane pores are not perfectly cylindrical or well
defined. In BET surface area measurement, the nitrogen adsorption-desorption detects very small
pores, but it cannot distinguish dead-end pores. In mercury intrusion porosimetry, mercury is used
as a non-wetting liquid but mercury in the pores may distort the soft matrix. The molecular weight
cut-off method depends on solute type (proteins, polyethylene glycols, polystyrenes, dextrans etc.)
and test conditions like pressure, temperature, concentration, feed velocity, pH etc. In addition to
these, the concentration polarization makes the data obtained by this technique difficult to interpret
and compare. Capillary flow porometer (CFP) has several advantages compare to other techniques
N2 gas (Pn 1/Dn)
Largest Pore Neck(Bubble Point Pore Diameter)
Closed Pore Blind Pore
Smallest Pore Neck
P1 P2P3
D2
D3
D1
Wetting Liquid
Gas Flow Measurement as a Function of Applied Pressure

Chapter 2
58
as CFP is a non-destructive technique, easy to handle and, capable of providing pore diameter
distribution in a single operation.
The porometer model POROLUXTM1000 was used for the measurements. The standard operating
pressure range is 0-35 bar with flow rates up to 200 L per minute for this instrument, and sample
holder diameter was 25mm. The data acquisition and analysis was carried out using LabView
software which was supplied by the manufacturer. The wetting liquid used for the CFP
measurements was “porefil” liquid of = 0.016 Nm-1 supplied by Benelux scientific, Belgium.
The membrane sample was wetted in pore-filled liquid for 1h at room temperature and then
mounted on the sample holder after wiping out the excess liquid on the surface of the membrane.
To determine the pore size (diameter) distribution by CFP, the plots of N2 gas flow rates as a
function of applied pressure across the membrane with wetting liquid “Porefil” (wet run) and
without wetting liquid (dry run) were analysed. The curves of flow rates as a function of applied
pressure are shown in Figure 2.16. The portion of the wet run from a point where first flow of gas
was observed up to a point where it meets the dry run plot was used for determining the pore-neck
diameter distribution. By using the Washburn equation, the applied pressure was converted to
diameter using the experimentally measured surface tension of pore-filled liquid. The maximum
and minimum pore-diameters were determined by bubble point (pressure at which the first flow of
gas across wet membrane was observed) and from the pressure where wet and dry runs converged,
respectively. Mean flow pore diameter was calculated from the pressure at which wet flow is half
of dry flow (see Figure. 2.16). The measurements of mean flow pore-neck diameters by CFP were
found to be reproducible within 7-5% as obtained in the triplicate measurements. The measured
ratio (f) of flow rates through wet (Fw) and dry sample (Fd) can be used for obtaining the flow-
based pore-neck diameter distribution fF (D) as given in eq 5.

Chapter 2
59
∅ = FwFd
=∫ fF
∞
Dmin
(D)dD(5)
Dmin is a diameter of the smallest constriction of pores that has been opened by maximum applied
pressure. fF(D) has the property that it integrates to 1.0, and its unit is inverse of distance (m-1).
Figure 2.16 The plots showing flow rates as a function of applied pressure across dry and wet
poly(propylene) membrane.
The measurements by CFP are not expected to be affected either by tortuosity (ratio of pore length
to thickness) or thickness of the membrane. However, the membrane requires longer time period
for achieving constant gas flow rates with increasing tortuosity or thickness. The porometer used
in the present work was designed to record stabilized flow rates at every increment of applied
pressure.
2.2.10 Electrospinning technique
Electrospinning is an electrostatic fabrication technique. Because of its versatility and potential
applications in diverse fields, electrospinning has been given more attention in recent years. Some
of the most important applications include the preparation of NFS mat for filtration, nanocatalysis,

Chapter 2
60
wound dressing, biosensors, tissue engineering, drug delivery, defence and security, and
environmental engineering applications etc. The nano/micro fibers are generated by the application
of strong electric field on polymer solution or polymer melt. The fibers produced by this technique
have high surface to volume ratio, tuneable porosity, and properties the polymer composition can
be manipulated to get desired functionality and. This technique shares characteristics of both
electro spraying and conventional solution dry spinning of fibers.
Process
Electrospinning technique uses electrostatic force to produce fine fibers using polymers solution
or melt. A DC voltage used in this technique range from kV to several tens of kV. When a
sufficiently high voltage is applied to a liquid droplet, the body of liquid droplet becomes charged
and electrostatic repulsion counteracts the surface tension and the droplet is stretched. At a certain
point, the liquid droplet erupts from the surface and reaches the collector (grounded collector
usually a metal screen, plate, or a rotating cylinder). The point of eruption is known as Taylor
cone. When a charged liquid jet was ejected from tip of the Taylor cone, an unstable and rapid
whipping of the jet occurs in the space between the capillary tip and the collector. This leads to
evaporation of solvent and leaving the polymer behind. The uniform and nano/micro meter scale
diameter fibers are formed because of bending instability of polymer jet.
Apparatus
Electrospinning experiment was carried out at room temperature and at normal atmospheric
conditions. A typical electrospinning system consists of three major components: a high voltage
power supply, a spinneret (e.g, syringe needle tip), and a grounded collector. The experimental
setup is shown in Figure 2.17 and a SEM image of typical poly (ether sulfone) fiber mat produced
using electrospinning is given in Figure 2.18.

Chapter 2
61
Figure 2.17 A schematic representing the electrospinning apparatus.
Figure 2.18 A typical electrospun fiber mat produced by electrospinning technique.
2.3 Application of nanoparticles for catalysis
It is well known that catalytic activities of metal nanoparticles (MNPs) are dependent not only on
the size but also on the shape and surface of the nanoparticle as well. To evaluate the catalytic
activity and efficiency of MNPs, it is very important to find/choose a model reaction. The chosen
model reaction should have a universal appeal and studied with certainty using simple
experimental setup. The preferred model reaction should proceed only in the presence of catalyst

Chapter 2
62
and is easy to monitor. In the present work, the reductions of p-nitrophenol and methylene blue
were studied as the model reactions. The prepared catalysts have also been explored for the
reductions of U(VI) to U(IV) and Cr(VI) to Cr(III). The catalytic conversions of these reactions
were monitored by UV-Vis spectroscopy.
2.3.1 Reduction of p-nitrophenol (PNP)
The aqueous phase reduction of p-nitrophenol by sodium borohydride to p-aminophenol (PAP)
has been widely studied in different laboratories. Any metal nanoparticles can be used as a catalyst
for this reaction. The pioneering work carried out by Pradhan et al. 2002 and Esumi et al. 2002,
has made this reaction as a benchmark for studying the activity of metal nanoparticles. The PNP
reduction involves six electron transfer process (this is facilitated by the metal NPs) in the presence
of sodium borohydride (NaBH4) and produce only p-aminophenol (PAP) without any side product.
PNP has absorption at 317nm which shifts to 400 nm when the solution is made alkaline, while
the product PAP shows a weak absorption peak at 300 nm. Thus, the PNP reduction can be easily
monitored by UV-Vis spectroscopy. A pseudo first order reaction is assumed to fallow in the
presence of excess of reducing agent (borohydride) (Ghosh et al . 2004; Hayakawa et al. 2003). It
was also observed that, the reduction doesn’t proceed in the absence of a catalyst (Shine and
Mallory 1962). The reduction is not only a model reaction to evaluate the catalyst but also helps
in easy depletion of hazardous nitro phenol from environment. The reduced product PAP and its
derivatives have got applications in pharmaceuticals, herbicides, polymers etc. Figure 2.19 gives
reduction reaction scheme of PNP to PAP, the mechanism is shown in Figure 2.20 and the spectral
changes involved in the reduction are shown in Figure 2.21.

Chapter 2
63
Figure 2.19 Reduction scheme of p-nitrophenol to p-aminophenol.
Figure 2.20 The mechanism involved in PNP reduction with borohydride in presence of Ag NPs
(Baruah 2016).
Figure 2.21 The UV-Vis spectra of p-nitrophenol to p-amonophenol conversion.
OH
NO2
O-Na+
NO2
O-Na+
NH2
Excess NaBH4
Water
MNPs
Water
p-nitrophenol (PNP) p-aminophenol (PNP)p-nitrophenol ate
300 350 400 450 500
0.0
0.2
0.4
0.6
0.8
1.0
1.2
66 Sec
0 Sec
Ab
so
rban
ce
Wavelength
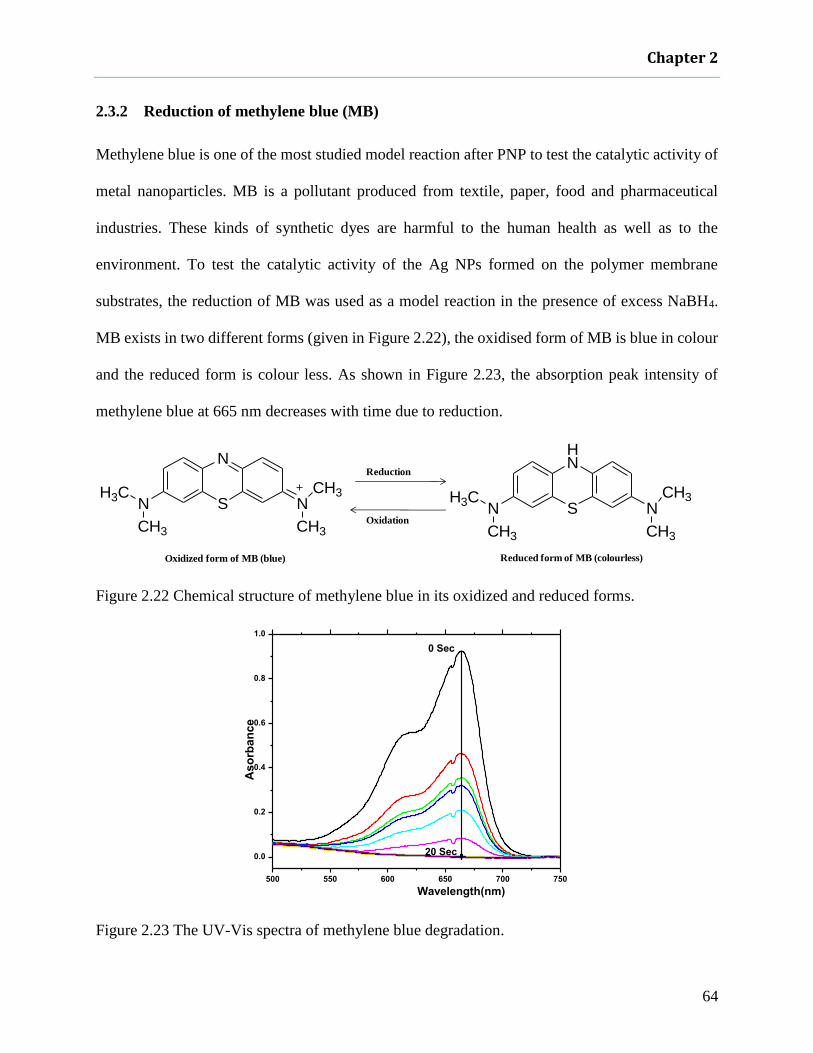
Chapter 2
64
2.3.2 Reduction of methylene blue (MB)
Methylene blue is one of the most studied model reaction after PNP to test the catalytic activity of
metal nanoparticles. MB is a pollutant produced from textile, paper, food and pharmaceutical
industries. These kinds of synthetic dyes are harmful to the human health as well as to the
environment. To test the catalytic activity of the Ag NPs formed on the polymer membrane
substrates, the reduction of MB was used as a model reaction in the presence of excess NaBH4.
MB exists in two different forms (given in Figure 2.22), the oxidised form of MB is blue in colour
and the reduced form is colour less. As shown in Figure 2.23, the absorption peak intensity of
methylene blue at 665 nm decreases with time due to reduction.
Figure 2.22 Chemical structure of methylene blue in its oxidized and reduced forms.
Figure 2.23 The UV-Vis spectra of methylene blue degradation.
S
HN
NNCH3
CH3
H3C
CH3
S
N
NNCH3
CH3
H3C
CH3
Reduction
Oxidation
Reduced form of MB (colourless)Oxidized form of MB (blue)
500 550 600 650 700 750
0.0
0.2
0.4
0.6
0.8
1.0
20 Sec
0 Sec
Aso
rban
ce
Wavelength(nm)

Chapter 2
65
2.3.3 Hexavalent chromium reduction
Heavy metals are harmful to the environment and chromium is one of the most toxic inorganic
pollutants among them. Cr (VI) is hazardous to the human health which has carcinogenic
properties by inducing oxidative stress, DNA damage and altered gene expression. Cr (VI) has
high mobility in ground water since it is not absorbed by the soils, while Cr (III) is relatively
nontoxic and it is an essential nutrient for humans in small quantities (Costa and Klein 2006; Kotas´
and Stasicka 2000; Bagchi et al. 2002). Cr (III) usually precipitates as hydroxides, oxides, or
oxyhydroxides (Bagchi et al. 2002) and, therefore, it does not migrate in ground water. Hence, the
chemical reduction of Cr (VI) to Cr (III) is the efficient method to eliminate the Cr (VI) pollutants.
In this work, the developed Pd NPs embedded membranes have been studied for the efficient
reduction of hexavalent chromium. The formic acid decomposition on Pd surface was used to
produce hydrogen gas which in situ reduces the hexavalent chromium. The progress of the
reduction was monitored by measuring the absorbance at 348nm by UV-Vis spectrophotometer
shown in Figure 2.24.
Figure 2.24 UV-Vis spectra showing reduction of Cr(VI) to Cr(III) with formic acid at 45 0C as a
function of time in the presence of Pd NPs loaded membrane.
300 350 400 450
0.0
0.2
0.4
0.6
0.8
1.0
1.2
Ab
so
rba
nc
e
Wavelength(nm)
0 time
1 min
5 min
15 min
30 min
45 min
60 min

Chapter 2
66
2.3.4 Reduction of uranium (VI to IV)
U (IV) is the best used reductant universally for plutonium partitioning by plutonium uranium
reduction extraction (PUREX) process. This process is most fallowed internationally to recover U
and Pu from spent nuclear fuels. Indian reprocessing plants mostly use electrochemical reduction
for the uranous (U(IV)) production from uranyl nitrate having 50-60% conversion rate. This
method increases the load on the uranium purification cycle. Therefore, an alternative method is
needed for the higher conversion of U (VI) to U (IV). In the present thesis, the developed Pd
catalyst embedded polymer membrane was studied to reduce uranyl ion in the presence of formic
acid (acts as hydrogen source), and nearly 97-100% conversion rate was obtained. The reaction
was monitored by UV-Vis spectrophotometer. The successive UV-Vis spectra of uranyl ion
reduction recorded for every 5 minutes are shown in Figure 2.25.
Figure 2.25 UV-Vis spectra showing reduction of U (VI) to U(IV).
400 450 500 550 600 650 700 750
0.0
0.2
0.4
0.6
0.8
1.0
1.2
U4+
UO2
2+
U4+
Ab
so
rba
nc
e
Wavelength(nm)

SELF-REDUCING ASYMMETRIC POLYMER MEMBRANE
FOR IN SITU FORMATION AND CONTAINMENT OF
NOBLE METAL NANOCATALYSTS

Chapter 3
68
3.1 Introduction
A synthetic polymer membrane mimicking eggshell membrane in terms of reduction and
stabilization of noble metal nanocatalysts (NCs) has been developed. The synthetic polymer
membrane developed in the present work not only provides a green route for synthesis of NCs in
a solid matrix by simply dipping it in the precursor ion solution for fixed period of time, but also
enhances the catalytic activity of thus formed NPs in the organic and inorganic redox reactions.
Thus, the self-reducing membrane developed in the present work offer a numerous possibilities as
a host for the single/bimettalic/core-shell noble metal catalysts for the organic and inorganic
reactions.
Technological and commercially important redox reactions can be advanced significantly by
employing the noble metal NCs. Despite of their advantageous such as high surface to volume
ratio, under-coordinated surface sites at the surface, high dispersion, desired shapes for exposing
reactive facets, and quantum confinement effects (Nguyen et al. 2015; Li and Shen 2014; Yan et
al. 2013; Zhang et al. 2013; Mahmoud et al. 2013), they have some key issues for utilizing as
heterogeneous catalysts. The major issues as their physical instability (agglomeration), chemical
instability (chemical corrosion), and difficulty in withdrawing them from the systems causing
problems in recyclability and product contamination. To address these problems, the NCs are
immobilized on solid supports like carbon nanomaterials (Yang et al. 2014; Su et al. 2013),
superparamagnetic Fe3O4 particles (Gawande et al. 2013), synthetic polymer membranes
(Troppmann et al. 2014; Soukup et al. 2014; Faria et al. 2014; Ruiz and Muñoz 2011), inorganic
particles (Corma and Garcia 2008; Hu et al. 2013), biopolymer matrices (Baig et al. 2014), porous
inorganic supports (Liu et al. 2013; Lin et al. 2015), and resins/polymers (Lei et al. 2015; Alonso
et al. 2012; Kao et al. 2013; Doménech et al. 2014]. Among these solid supports, NCs immobilized

Chapter 3
69
on the films/membranes and magnetic particles are easy to retrieve from the process in which these
material acts as catalyst.
Biomaterials are inexpensive, non-toxic, and may provide control over shape and size
distributions. Biomaterials like sugars, vitamins, agricultural extracts and residues etc can be used
for the reduction as well as capping of the nanoparticles (Nadagouda and varma 2008; Eising et
al. 2014; Jung et al. 2014). Chicken eggshell membrane (ESM) contains amino acids (glycine and
alanine) and uronic acid. The saccharides and aldehyde group of uronic acid reduces the surface
adsorbed metal ions to NPs. The other functional groups like –OH, -NH2 on the ESM stabilises the
NPs, which obviates the need for additional reagents like reducing and capping agents for NPs
synthesis. The NPs stabilized in ESM exhibit good catalytic activity due to the fibrous structure
which provides high accessibility to the NPs (Mallampati and Valiyaveettil 2014; Liang et al.
2014). Bacterial cells can also be utilized for the intracellular synthesis of NPs. These NPs are then
released due to rupture of the cell wall (Gaidhani et al. 2014). In most of the biomaterials, the
phenolic derivatives are responsible for the precursor ions reduction and sugars provide effective
capping for NP formation (Santos et al. 2014; Pestov et al. 2015). The polysaccharides are the
most studied class of natural polymers due to their multi-functionality. Among all the
polysaccharides, chitosan is the most studied polymer because of its polycation nature. The β-(1-
4)-linked D-glucosamine and N-acetyl-D-glucosamine group of chitosan can effectively bind
[AuCl4]- ions which helps in control the growth and nucleation of NPs (Pestov et al. 2015).
In the present work, a synthetic polymer membrane has been prepared by anchoring glycidyl
methacrylate (GMA) along with cross-linker in pores of a commercially available poly(propylene)
membrane by UV-initiator induced in situ polymerization in pores of the membrane. The

Chapter 3
70
poly(GMA) anchored membrane has a highly porous interior and dense at the surfaces which was
quite different from the homogenous micro-porous membrane.
3.2 Experimental
Details of materials and reagents used are given in chapter 2.
3.2.1 Synthesis of self-reducing membrane
The details of synthesis of pore-filled membranes are given in chapter 2. Briefly, the polymerizing
solution for anchoring GMA on to the host poly(propylene) membrane was prepared by dissolving
the monomer GMA 1.5g in a 2 mL of DMF (solvent), to this 2 wt% of UV-initiator (DMPA) and
5 mol% of cross-linker (EGDM) was added. To homogenize, the polymerizing solution was
sonicated for 20 min. The host PP membranes having 55 cm2 dimensions were soaked in
methanol for 4-5h prior to immersing in the polymerizing solution for overnight. Before exposing
the polymer solution filled PP membrane to UV light, the excess of solution adhering to surface
of the host substrates were removed gently and were sandwiched between two Garware polyester
sheets. These sandwiched membranes were exposed to 365nm UV light in a multi lamps photo-
reactor for a period of 20 min. To remove the un-polymerized components after exposing to UV
light, the poly(GMA) anchored membranes were washed with DMF and with water till the constant
weights were obtained. The anchoring yield obtained from the increase in weight of the membrane
with respect to pristine membrane was found to be 100 wt%. NMDG group was attached to the
poly(GMA)-anchored membrane samples by treating with 1 w/v% solution of NMDG in DMF at
60℃, maintained by a water bath for 4 h. The anchoring of NMDG occurred through opening
epoxy ring of GMA. After chemical treatment, the membrane samples were washed with methanol
and water, and dried at 45℃ under vacuum condition.

Chapter 3
71
3.2.2 Formation of noble metal NPs in self-reducing membrane
All the noble metal salts were dissolved in de-ionised water. The concentrations of these metal salt
solutions were 0.1 mol L-1, and pH of these solutions was adjusted to 2. The NMDG anchored
membrane samples (22 cm2) were equilibrated with 10 mL of each noble metal salt solution for
12 h at room temperature. To know the loading capacity of these membranes towards Ag0 and Pd0,
the known weighed samples of NMDG-anchored membrane (21 cm2) were equilibrated in the
0.05 mol L-1 AgNO3 and PdCl2 solutions separately for a predetermined time with constant stirring
at room temperature. After each time interval, the membrane samples were taken out and washed
thoroughly with de-ionized water. To leach out the Ag and Pd NPs loaded in the membrane, the
membrane samples were immersed in the 10 mL of 3 mol L-1 HNO3 solutions. The nearly complete
leaching of Ag and Pd was confirmed by EDXRF analysis and then the leach solutions were
subjected to ICP-AES analyses for determining the Ag and Pd content.
3.2.3 Reduction of p-nitrophenol (PNP) and methylene blue (MB)
The Ag0-loaded membrane was used to study the reductions of p-nitrophenol and methylene blue
(MB) with sodium borohydrate (NaBH4) as a reducing agent. To monitor reduction online, the
reductions were carried out in a standard quartz cell with path length of 1 cm. The reaction solution
having 0.1 mL of 2 mmol L-1 PNP, 0.1 mL of 200 mmol L-1 freshly prepared NaBH4 and 2.8mL
of de-ionised water were taken in a quartz cell. The Ag0 loaded membrane having 12 cm2
dimension was placed at opaque side of the quartz cell to avoid the light beam path. The solution
was stirred gently using micro-bar magnetic stirrer. The cuvette was placed in a portable UV-Vis
spectrophotometer (K-MAC Technology, South Korea) kept on a magnetic stirrer, and the
successive UV-Vis absorption spectra were recorded to monitor the reaction kinetics. The

Chapter 3
72
reduction of p-nitrophenolate anions was monitored by measuring the absorbance at 400 nm as a
function of reduction time.
The similar experiments were carried out for reduction of MB using BH4- as reducing agent.
The reaction solution contained 0.5mL of 0.2 mmol L-1 MB, 0.5 mL of 20 mmol L-1 of freshly
prepared NaBH4 solution, and 2 mL of de-ionised water. The progress of reduction was monitored
by measuring the absorbance at 665nm (λmax). The absorbance values at 665 nm (MB) and 400 nm
(PNP) were used to obtain the apparent reduction rate constant (k) using following equation.
𝐥𝐧 [𝐀𝐭
𝐀𝟎] = −𝐤𝐭
Where, A0 and At are the absorbance at time 0 and t, respectively.
3.2.4 Reduction of Cr(VI) ions
For the reductions of Cr(VI) ions, formic acid was used as the reducing agent and Pd NPs
embedded membrane used as the catalyst. The reduction process was studied by recording UV-
Vis spectra as a function of time at regular time interval. The absorbance was monitored by UV–
Vis spectrophotometer model V 53 from JASCO (Tokyo, Japan). The reaction solution consisted
of 5 mL of 7 mmol L-1 Cr(VI) solution and 5 mL of 70 mmol L-1 formic acid. The temperature for
reduction of Cr(VI) to Cr(III) solution maintained at 45℃ by using constant temperature water
bath and Pd loaded membrane (12 cm2) was immersed in this solution. The solution was stirred
with magnetic stirrer with constant 300 rpm. The decrease in absorbance at 350 nm corresponding
to Cr(VI) was monitored by taking out 0.5 mL of aliquot in a cuvette and diluted it to 3 mL for
measuring the absorbance.

Chapter 3
73
3.3 Results and discussion
The host poly(propylene) membrane provides a mechanical framework with soft microgel
anchored in its pores. The hydrogel-filled membranes were used for the separations, catalysis,
biomedical technologies, sensing and analytical applications etc (Yang et al. 2011; Pandey et al.
2001). These hydrogel-filled membranes were similar to the pore-filled membrane synthesized in
the present work. The microgel anchored in the pores of the membrane provided interlinked porous
structure leading to high accessibility of the functional groups. The physical architecture of the
pore-filled membrane synthesized in the present work is different from the homogenous pore-filled
membrane reported in the literature (Yang et al. 2011; Pandey et al. 2001). This may due to the
100% weight gain of the poly(GMA)-anchored pore-filled membrane tend to reorganize during
drying that would shrink the polymer chains to form dense surface and a fibrous interior (see Figure
3.1).
Figure 3.1 FE-SEM images showing surface (a) and cross-section (b) of the host poly(propylene)
membrane, and surface (c) cross-section (d) of the same host membrane after anchoring with
poly(GMA) and subsequent treatment with NMDG.
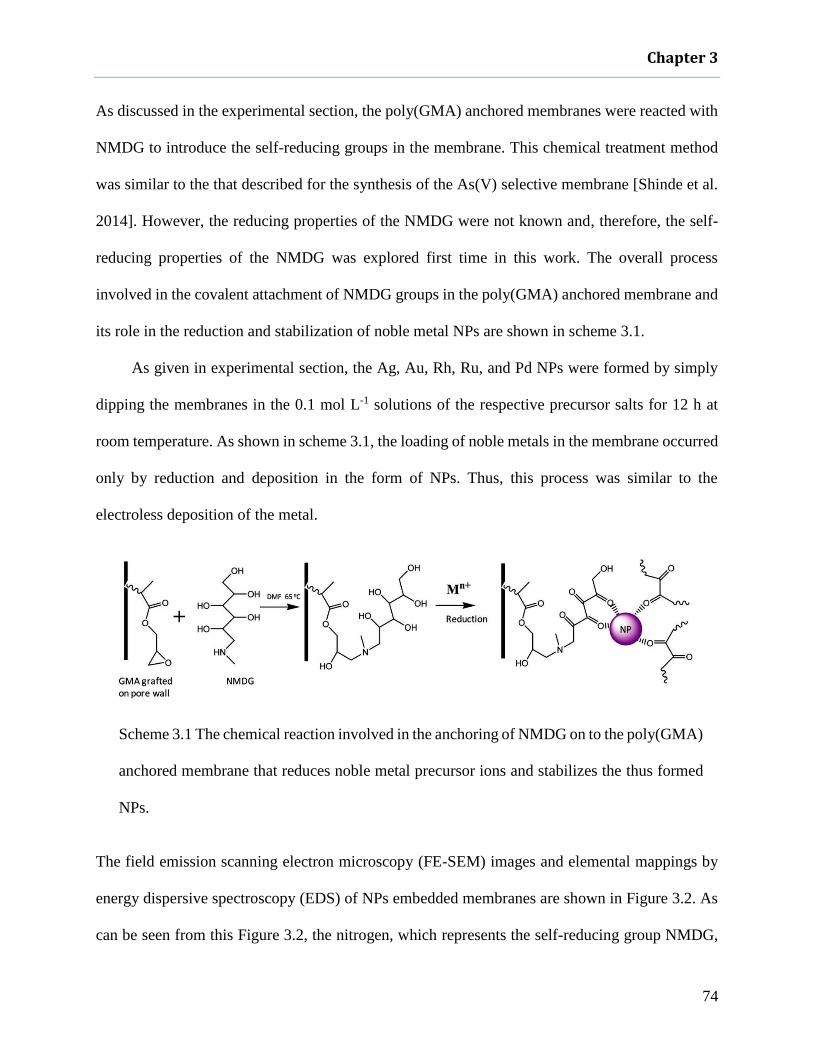
Chapter 3
74
As discussed in the experimental section, the poly(GMA) anchored membranes were reacted with
NMDG to introduce the self-reducing groups in the membrane. This chemical treatment method
was similar to the that described for the synthesis of the As(V) selective membrane [Shinde et al.
2014]. However, the reducing properties of the NMDG were not known and, therefore, the self-
reducing properties of the NMDG was explored first time in this work. The overall process
involved in the covalent attachment of NMDG groups in the poly(GMA) anchored membrane and
its role in the reduction and stabilization of noble metal NPs are shown in scheme 3.1.
As given in experimental section, the Ag, Au, Rh, Ru, and Pd NPs were formed by simply
dipping the membranes in the 0.1 mol L-1 solutions of the respective precursor salts for 12 h at
room temperature. As shown in scheme 3.1, the loading of noble metals in the membrane occurred
only by reduction and deposition in the form of NPs. Thus, this process was similar to the
electroless deposition of the metal.
The field emission scanning electron microscopy (FE-SEM) images and elemental mappings by
energy dispersive spectroscopy (EDS) of NPs embedded membranes are shown in Figure 3.2. As
can be seen from this Figure 3.2, the nitrogen, which represents the self-reducing group NMDG,
Scheme 3.1 The chemical reaction involved in the anchoring of NMDG on to the poly(GMA)
anchored membrane that reduces noble metal precursor ions and stabilizes the thus formed
NPs.

Chapter 3
75
and Rh NPs are uniformly distributed on the surface of the membrane. It is also seen from the FE-
SEM images given in Figure 3.3, the different shapes and sizes of NPs formed at the surface of the
membrane depending on the precursor metal ions and their concentrations.
(a) (b)
(c)
Figure 3.2 The representative FE-SEM image of the surface of Rh NPsloaded membrane (a), and
corresponding elemental mappings of nitrogen(b) and Rh (c) by EDS.
The self-reducing membrane developed in this work is capable of reducing all the noble metals
ions which are having redox potential of E0 ≥ 0.68V. However, Pt NPs could not be formed using
PtCl62- precursor at room temperature. Form the literature, it is known that the formation of Pt NPs
using reducing agents like ethylene glycol or BH4- requires high temperature and pressure from its
precursor salt H2PtCl6 (Stepanov et al. 2014). As shown in Figure 3.3, the Au cubes and prisms
were formed at the surfaces and spherical Au NPs were formed at porous surfaces.

Chapter 3
76
(a)
(b)
(c)
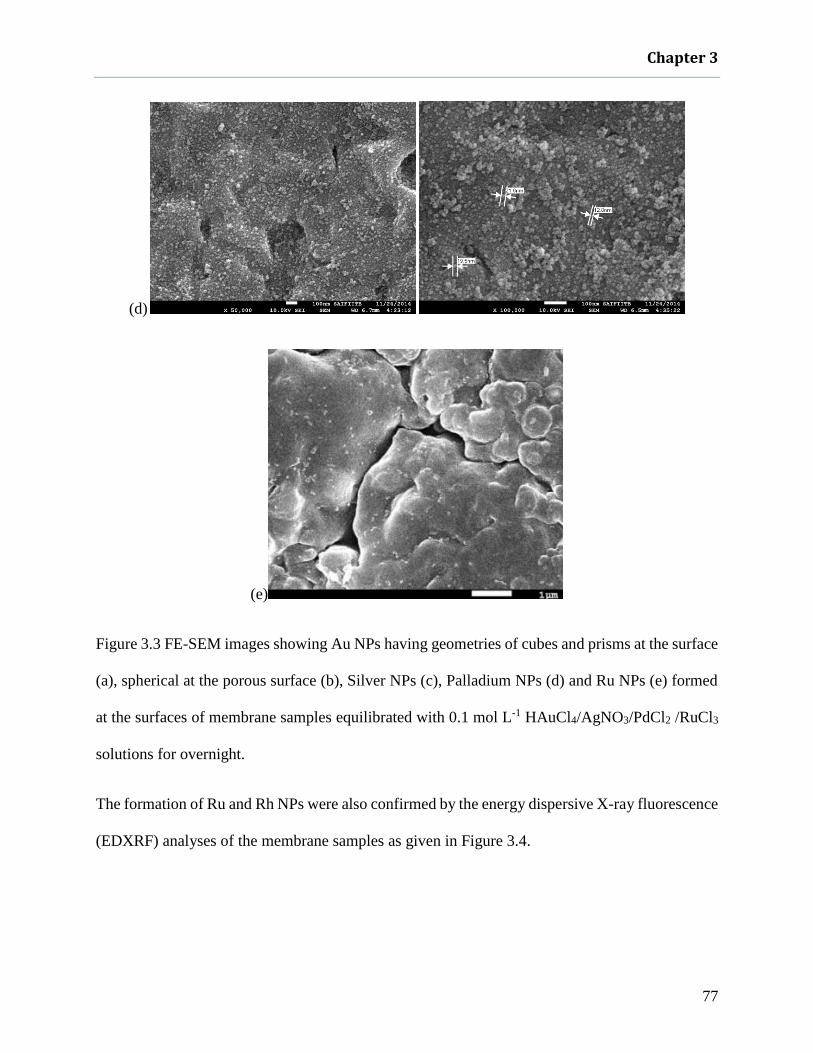
Chapter 3
77
(d)
(e)
Figure 3.3 FE-SEM images showing Au NPs having geometries of cubes and prisms at the surface
(a), spherical at the porous surface (b), Silver NPs (c), Palladium NPs (d) and Ru NPs (e) formed
at the surfaces of membrane samples equilibrated with 0.1 mol L-1 HAuCl4/AgNO3/PdCl2 /RuCl3
solutions for overnight.
The formation of Ru and Rh NPs were also confirmed by the energy dispersive X-ray fluorescence
(EDXRF) analyses of the membrane samples as given in Figure 3.4.

Chapter 3
78
(a)
(b)
Figure 3.4 EDXRF spectra of Rh (a) and Ru NPs (b) loaded membrane.
From cross-sectional FE-SEM images of the Ag NPs loaded membrane given in Figure 3.5, it was
observed that a negligible number of NPs were formed at the fibrous interior matrix. However, it
is clear from the FE-SEM image and elemental mapping that Ag0 was coated on the fibers at the
interior matrix of the membrane. The nitrogen mapping across the thickness of the membrane
indicated that NMDG was uniformly distributed at the interior matrix of the membrane.

Chapter 3
79
(a)
(b) (c)
(d)
Figure 3.5 FE-SEM images of cross-section of the Ag0 loaded membrane samples (a), elemental
mappings of nitrogen (b), Silver (c), and mixed elemental mapping image of nitrogen and silver
(d).

Chapter 3
80
To explore the possibility of controlled loading of noble metal NPs, the membrane samples were
equilibrated with 0.05 mol L-1 AgNO3 and PdCl2 solutions as a function of time. The loadings of
Ag0 and Pd0 as a function of equilibration time of the membrane samples are shown in Figure 3.6.
Figure 3.6 Variations in loading of Ag0 and Pd0 in the membrane as a function of equilibration
time at room temperature in 0.05 mol L-1 solutions of AgNO3 and PdCl2.
The amount of Ag and Pd NPs loaded in the membrane as a function of equilibration time was
determined by leaching the Ag and Pd NPs in 5 mL of 2 mol L-1 HNO3 solutions, which was
further diluted to 10 mL by adding 5 mL of deionised water and subjecting these leach solutions
to ICP-AES analyses. From Figure 3.6, it could be seen that the Ag loading reached 70 mg g-1
within 10 min, and then slowly approached a saturation loading capacity of 80 mg g-1. It is also
evident form Figure 3.6, the rate of Pd0 deposition was comparable to that of Ag0 though the
reduction of Pd2+ ions needed two electrons. And the saturation loading towards Pd0 in the
membrane was higher (120 mg g-1) than the Ag0 saturation loading in the same membrane. Thus,
the reduction efficiency of NMDG anchored membrane increased with an increase in a redox
potential of the precursor ions.

Chapter 3
81
These preliminary results suggest that the M0 content and particle size can be controlled by
equilibrating a membrane sample in the precursor salt solution for a predetermined time. The FE-
SEM images given in Figure 3.7 show that the size of Ag NPs decreased from 75 nm at saturation
loading to 15 nm in the membrane which was equilibrated for 1 min in AgNO3 0.05 mol L-1
solution. It was also observed that some clusters of Ag NPs also been formed at some places in the
membrane equilibrated for 1 min in AgNO3 solution. The loading of the metal content in the
membrane could also be controlled by controlling the amount of reducing moiety NMDG in the
membrane which is correlated to poly(GMA) anchoring. This is based on a fact that the
poly(GMA) anchoring yield was dependent upon the concentration of GMA monomer in the
solution used for in situ polymerization in pores of the host micro porous PP membrane (Shinde
et al. 2014).
Figure 3.7 FE-SEM images showing Ag NPs formed on the surfaces of the membrane after
1 min (a) and 60 min (b) equilibration in 0.05 mol L-1 AgNO3 solution.
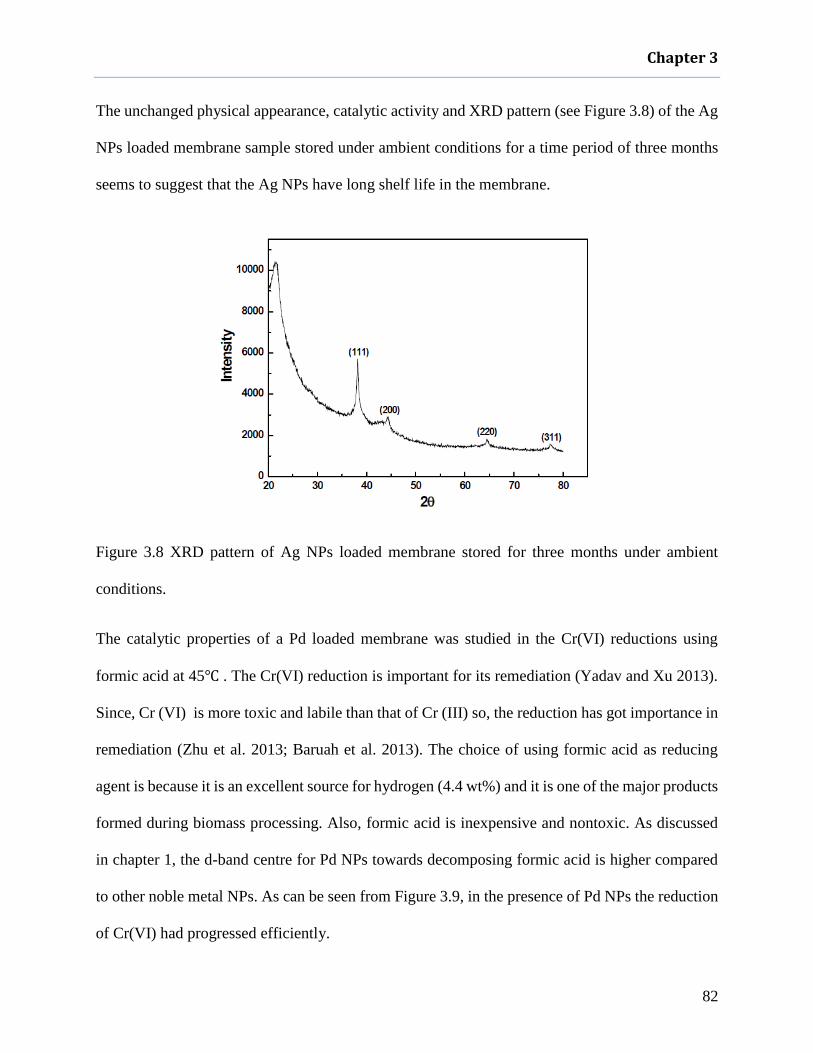
Chapter 3
82
The unchanged physical appearance, catalytic activity and XRD pattern (see Figure 3.8) of the Ag
NPs loaded membrane sample stored under ambient conditions for a time period of three months
seems to suggest that the Ag NPs have long shelf life in the membrane.
Figure 3.8 XRD pattern of Ag NPs loaded membrane stored for three months under ambient
conditions.
The catalytic properties of a Pd loaded membrane was studied in the Cr(VI) reductions using
formic acid at 45℃ . The Cr(VI) reduction is important for its remediation (Yadav and Xu 2013).
Since, Cr (VI) is more toxic and labile than that of Cr (III) so, the reduction has got importance in
remediation (Zhu et al. 2013; Baruah et al. 2013). The choice of using formic acid as reducing
agent is because it is an excellent source for hydrogen (4.4 wt%) and it is one of the major products
formed during biomass processing. Also, formic acid is inexpensive and nontoxic. As discussed
in chapter 1, the d-band centre for Pd NPs towards decomposing formic acid is higher compared
to other noble metal NPs. As can be seen from Figure 3.9, in the presence of Pd NPs the reduction
of Cr(VI) had progressed efficiently.

Chapter 3
83
(a) (b)
Figure 3.9 Successive UV-Vis spectra showing reduction of Cr(VI) to Cr(III) at 45℃ using formic
acid as a function of time in the presence of a Pd NPs loaded membrane (a), and corresponding
variation of logarithm of At/A0 as a function of reduction time (b). At and A0 represent absorbance
at 350 nm corresponding to concentration of Cr(VI) at time t and initial respectively.
It was observed that the reductions did not proceed under similar experimental conditions using
the blank NMDG-membrane (without Pd NPs) as shown in UV-Vis spectra given in Figure 3.10.
Figure 3.10 UV-Vis spectra showing the absence of significant reductions of Cr(VI) with formic
acid at 45℃ as a function of time in the presence of NMDG-membrane sample without Pd NPs.
Chapter 3
84
In the literature, p-nitrophenol (PNP) and methylene blue (MB) reductions by sodium borohydride
have been studied as a model reaction to evaluate the catalytic efficiencies of coinage metal NPs
(Corma and Garcia 2008; Hu et al. 2013; Lei et al. 2015; Alonso et al 2012; Kao et al. 2013;
Domenech et al. 2014; Pradhan et al. 2002; Esumi et al. 2002). These organic redox reactions
fallow generally a pseudo-first-order kinetics in the presence of an excess of NaBH4. In the present
work, Ag NPs loaded membrane was used for PNP and MB reduction in the presence excess of
BH4- ions. The membrane developed in the present work is neutral and hence, both anionic (p-
nitrophenol) and cationic (methylene blue) species would easily enter into the membrane matrix.
As shown in the UV-Vis spectra, the decrease in absorbance at 665 nm indicated degradation of
methyl blue dye with the time (Figure 3.11), and the growth of a product peak at 300 nm was
observed for p-nitrophenol reduction (see Figure 3.12). These suggested that the reduced products
were not retained in the membrane matrix. As expected, both the reductions followed pseudo-first-
order kinetics in the presence of excess BH4- ions. Both the reductions were completed within a
minute, and the apparent reduction rate constants (KPNP = 0.1 s-1, KMB = 1.5 s-1) thus obtained were
significantly higher as compared to those reported in the literature (Patra et al. 2014). There are
several reasons that may be responsible for the higher redox catalytic activity of the Ag NPs loaded
membrane in the present work. These are: (i) higher accessibility of NPs to the reactants, (ii)
absence of capping agents that retards the catalytic activity (Niu and Li 2014), and (iii)
nanoconfinement effects. In nanoconfined environment molecules/complexes behaves differently
than they are in the bulk. It has been shown that silver citrate complexes readily undergo redox
decomposition in the nanoscale confinement to form the Ag NPs (Patra et al. 2014). It has also
been reported that the catalytic behaviour of nanoporous materials is strongly influenced by the
confinement effects (Goettmann and sanchez 2007). These are related to geometrical constraints,
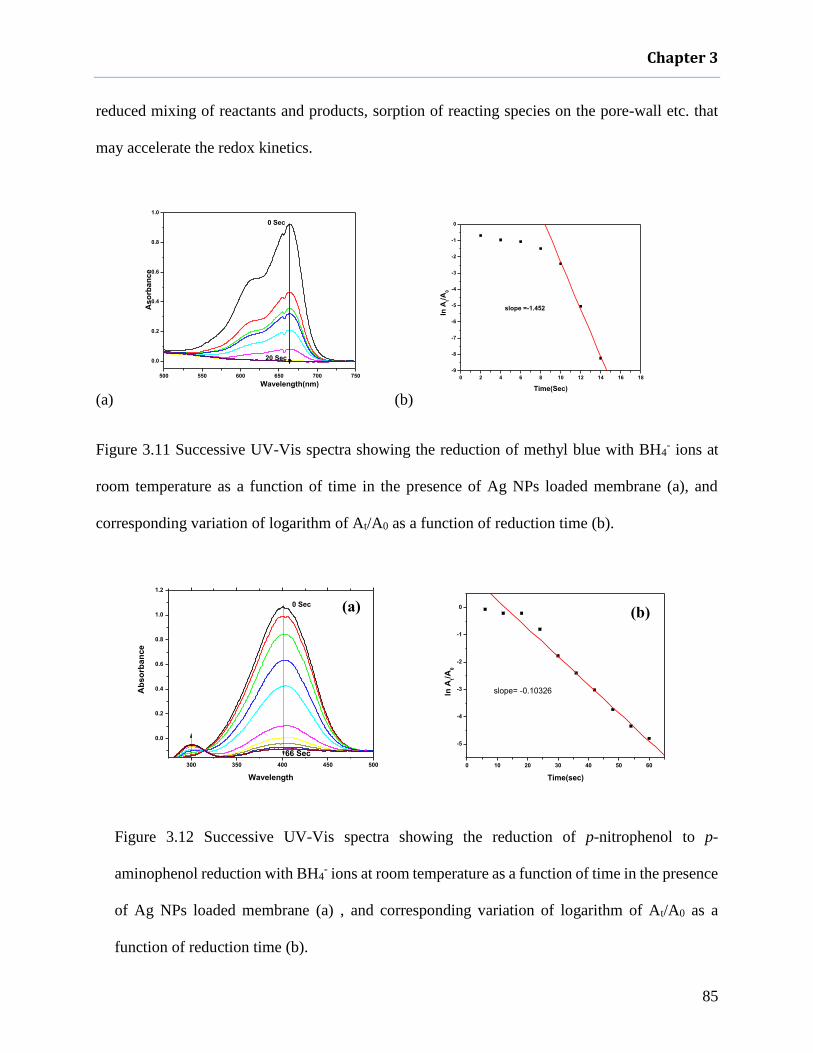
Chapter 3
85
reduced mixing of reactants and products, sorption of reacting species on the pore-wall etc. that
may accelerate the redox kinetics.
(a)
500 550 600 650 700 750
0.0
0.2
0.4
0.6
0.8
1.0
20 Sec
0 Sec
Aso
rban
ce
Wavelength(nm)
(b)
0 2 4 6 8 10 12 14 16 18
-9
-8
-7
-6
-5
-4
-3
-2
-1
0
slope =-1.452
ln A
t/A0
Time(Sec)
Figure 3.11 Successive UV-Vis spectra showing the reduction of methyl blue with BH4- ions at
room temperature as a function of time in the presence of Ag NPs loaded membrane (a), and
corresponding variation of logarithm of At/A0 as a function of reduction time (b).
300 350 400 450 500
0.0
0.2
0.4
0.6
0.8
1.0
1.2
66 Sec
0 Sec
Ab
so
rban
ce
Wavelength
0 10 20 30 40 50 60
-5
-4
-3
-2
-1
0
slope= -0.10326ln A
t/A
0
Time(sec)
Figure 3.12 Successive UV-Vis spectra showing the reduction of p-nitrophenol to p-
aminophenol reduction with BH4- ions at room temperature as a function of time in the presence
of Ag NPs loaded membrane (a) , and corresponding variation of logarithm of At/A0 as a
function of reduction time (b).
(a) (b)

Chapter 3
86
3.4 Conclusions
The synthetic polymer membrane developed in the present work not only provides a green route
for the synthesis of noble metal NPs in a solid matrix by simply dipping in the precursor salt
solution for a fixed period of time, but also shown enhanced catalytic activity in both the organic
and inorganic redox reactions. This membrane acts as a robust container of almost bare NPs
without affecting their accessibility to the reactants, and also these NPs have a long shelf-life. The
same synthetic route can also be applied for the synthesis of self-reducing materials such as
graphene oxide, silica particles and Fe3O4 particles etc.

PALLDIUM NANOPARTICLES HOSTD IN
HYDRAZINE/SULFONATE ANCHORED MEMBRANES
FOR CATALYZING REDUCTION OF URANYL(VI) IONS

Chapter 4
88
4.1 Introduction
As discussed in chapter 1, the matrix supported nanocatalysts (NC) have potential applications as
the heterogeneous catalysts. These matrix supports prevent the nanoparticles from agglomeration
and also makes them easy to withdraw from the system. Solid supports like carbon nanomaterials,
inorganic particles, superparamagnetic Fe3O4 particles, synthetic polymer membranes, and
resins/polymers are used. Among these supports, magnetic particles and films/membrane
immobilized NCs are retrievable easily from the process. The nanoparticles immobilized on
appropriate host matrices find potential applications in water treatment, remediation of toxic
oxidation state of ions, process chemistry, synthetic chemistry of metal complexes having
desirable oxidation state, sensor and for many other applications (Sharma et al. 2015; Omole et al.
2011; Moakhar et al. 2017; Liu et al. 2017; McCleskey et al. 2001). The nanocatalysts immobilized
on inorganic or polymer supports could be used to address the aromatic pollutants generated by
chemical industries, which causes serious environmental problem (Hu et al. 2015; Liu et al. 2016).
It is important to note that the redox reactions of oxyions are not feasible under ambient conditions.
One of such example is the reduction of UO22+ ions to U4+ ions. The U4+ ions has applications in
nuclear industry such as reduction and stripping of Pu4+ ions in PUREX process and also used in
the preparation of UO2 and UF4 (McCleskey et al 2001; Liu et al. 2016). In PUREX process, the
U4+ ions are preferred as the reductant to avoid contamination of the feed. The UO2 can be easily
precipitated at basic pH for its removal and remediation purposes (Lu et al. 2017). The catalytic
properties of U4+ complexes have not been explored but these complexes may catalyze the
reactions that are normally impossible with the widely used transition metal based catalysts due to
availability of f orbitals electrons (Lu et al. 2017; Fox et al. 2008).

Chapter 4
89
The reduction of UO22+ ions to U4+ ions has been explored by different methods such as
electrochemical reduction (Nogami et al. 2008), photocatalytic reductions (Hu et al. 2015;
Salomone et al. 2015), chemical reduction (Boltoeva et al. 2008; Tyumentsev et al. 2014), and
sonolysis reduction (Toraishi et al. 2007). An interesting approach has been reported by Sheng et
al. for the remediation objective of U(VI) ions. This approach involves the adsorption and
reduction of UO22+ to U4+, formation of UO2 particles and finally retention of the particles using
hosts such as haematite, titanate nanotubes, and nanoscale zero-valent iron immobilized on
diatomite or Na-Bentonite (Zhao et al. 2012.; Sheng et al. 2014, 2015, 2016). As discussed in
chapter 1&3, formic acid is not only good source for the hydrogen production but also generating
in situ hydrogen for carrying out the reductions. Formic acid is liquid at room temperature and can
be decomposed on NPs surface at amenable temperatures. The in situ generated hydrogen has been
used for catalyze reductions of Cr2O72-/CrO4- anions to Cr3+ ions (Yadav and Xu 2013; Huang et
al. 2013; Omole et al. 2007; Gong et al. 2015], destruction of nitrate ions in the aqueous discharges
(Ren et al. 2015; Soares et al. 2014; Mohamed et al. 2014), and nitrite reduction in water
(Dodouche and Epron 2007).
The Pd NPs are efficient catalyst for the decomposition of formic acid to produce hydrogen.
However, Pd NPs have tendency to agglomerate because of high surface area and under
coordinated sites, and also difficult to withdraw for recycle. Therefore, the Pd NPs need to be
immobilized on the solid supports such as Al2O3, SiO2, TiO2, Fe3O4 (Dodouche and Epron 2007;
Gawande et al. 2013; Pan and Xu 2014; Li et al. 2013), carbon nanomaterials (carbon nanotubes,
grapheme oxide, carbon spheres) (Su et al. 2013; Chang and Wu 2013; Ren et al. 2014), hydrogels
(Hapiot et al. 2013), resin beads (Mori et al. 2013; Trzeciak et al. 2008), electrospun fibers mats
(Huang et al. 2008; Demir et al. 2004), ploy(HIPE) (Desforges et al. 2005), and membranes

Chapter 4
90
(Alonso et al. 2012; Bonggotgetsakul et al. 2015; Zeng et al. 2014; Soukup et al. 2014). The Pd
NPs immobilized on to the poly(vinyl alcohol) and cellulose acetate films have been used as the
“dip catalysts” for the organic reactions (Hariprasad and Radhakrishnan 2012; Faria et al. 2014).
The hallmarks of supported Pd NPs not only include chemical and physical stabilities but also the
simplicity of fabrication, easy retrieval, recyclability and amenability for scale up. The porous
supports like membranes, poly(HIPE) and electrospun fibers mat provide high accessibility to the
heterogeneous nanocatalysts that enhances the catalytic activity (Sheng et al. 2016; Desforges et
al. 2005). Because of three dimensional fibrous structure and various functionalities of the eggshell
membrane, it holds and reduces the precursor metal ions, and also protect the metal nanoparticles
without affecting their catalytic activity (Nasrollahzadeh et al. 2016; Liang et al. 2014). As
discussed in chapter 3, we have synthesized an asymmetric poly(glycidyl methacylate)
poly(GMA) anchored polymeric membrane, and introduced subsequently N-methyl-D-glucamine
groups to reduce variety of precursor ions such as Ag+, Pd2+, Rh3+, Ru3+ and AuCl4- ions and
stabilizes thus formed NPs in the membrane.
In the present work, the Pd NCs have been formed in the hydrazine-grafted neutral polymer
membrane to mimic eggshell membrane with a better mechanical properties and highly
microporous architecture. This synthesized membrane reduces Pd2+ ions itself and provides
stability to Pd NCs. Thus, the reducing and capping agents could be avoided. This eggshell
mimicking membrane has been prepared by anchoring (poly(GMA)) by in situ UV-initiator
induced polymerization in the pores of PP membrane similar to that described in chapter 3. Instead
of N-methyl-D-glucamine groups, the poly(GMA)-anchored membranes have been reacted with
hydrazine to incorporate the reducing moiety. The Pd NCs are formed in these hydrazine grafted
membranes by equilibrating them in solutions containing Pd2+ precursor ions for a fixed period of

Chapter 4
91
time. The loading of Pd0 content in these host materials has been found to be dependent upon
equilibration time till saturation loading. These Pd NCs embedded materials have been tested for
the UO22+ ions reduction with formic acid under different conditions including high intensity
ultrasonication. The UO22+ ions reduction has been studied as an example of inorganic reduction
based on the fact that its reduction is difficult than Cr(VI) and nitrate reduction, and its reduction
product is not very stable at ambient conditions. In general, hydrazine is used for the catalytic
reduction of UO22+ ions. However, formic acid has been selected in the present work due to its
wide range of applications like nitrate and Cr(VI) reduction apart from hydrogen production as
discussed above. The cation-exchange membrane embedded with Pd NCs has also been studied
for UO22+ ions reduction under similar conditions. The UO2
2+ ions reduction to U(IV) have been
analyzed for pseudo-first-order, pseudo-second-order, and diffusion-controlled kinetics.
4.2 Experimental
The UV-initiator induced anchoring of precursor polymer in the poly(propylene) membranes were
carried out by using the procedure discussed in chapter 2&3. The FE-SEM imaging of the pristine
and the Pd NPs embedded membranes were done using FE-SEM (Model No. JSM-7600F) at SAIF,
IIT-Bombay, Mumbai, India. UV–Vis spectrophotometer model V 53 from JASCO (Tokyo,
Japan) was used to record successive UV-Vis absorption spectra during reduction of UO22+ to U4+
ions. On-line monitoring of UO22+ ions reduction was carried out by pumping reaction solution to
10 mm path length Z-cell (FIA-1000-Z, Ocean Optics) using peristaltic pump. The Z cell was
connected to light source (AvaLight-DH-S-BAL) and spectrometer (USB4000-UV-VIS-ES,
Ocean optics) at opposite sides with 400 m optical fibers. The photograph of this setup is shown
in Figure. 4.1.

Chapter 4
92
Figure 4.1 The experimental setup of Z-flow cell spectrophotometry used for on-line monitoring
of UV-Vis absorption spectra during U(VI) to U(IV) ions reduction.
4.2.1 Formation of Pd NPs embedded neutral membrane
The precursor pore-filled polymer membranes were prepared by UV-initiator (DMPA) induced in
situ polymerization of monomer (GMA) along with cross-linker (EGDM) in pores of the micro-
porous host membranes. The polymerizing solution was prepared by dissolving 1.5 g of GMA in
2 mL of DMF solvent along with 5 mol % of cross-linker (EGDM) and 2 mol % of UV-initiator
(DMPA). Before pore-filling, the polymerizing solution was sonicated for 15 min for
homogenization. The poly(propylene) membrane having dimensions of 5X5 cm2 area were soaked
first in methanol for a period of 3h and then immersed in the polymerizing solutions for overnight.
After pore-filling, solution adhering to surfaces of the host substrates was removed gently with
Teflon roller. The polymerizing solution filled membranes were sandwiched between two Garware
polyester sheets and irradiated with 365 nm light in a photo-reactor for a period of 20 min. After
polymerization (anchoring), to remove the un-polymerized components (monomers), the
membranes samples were washed thoroughly with DMF and water mixture at 40-500C till constant
weights were obtained.

Chapter 4
93
The poly(GMA)-anchored membranes were reacted with hydrazine hydrate (99 %) for 12 h with
constant stirring at room temperature. After treatment with hydrazine, the polymer membranes
were thoroughly washed with de-ionized water several times to remove un-reacted hydrazine, and
vacuum dried for further use. The hydrazine attachment with the glycidyl units anchored in the PP
membrane was monitored by nitrogen analysis. These hydrazine attached membranes were
equilibrated with the solutions containing 0.01 mol L-1 PdCl2 at pH=1 for the predetermined time
period to form controlled amount of Pd NPs in the membrane.
4.2.2 Formation of Pd NPs embedded cation-exchange membrane
The cation-exchange membrane was prepared using similar procedure described in chapter 2, and
as previously reported by Agarwal et al. (Agarwal et al. 2013). Briefly, the sulfonic acid monomer
AMPS and silane based monomer APTMS were taken in 1:1 mol proportion and were dissolved
in DMF solvent along with 2 wt % UV-initiator (DMPA) and 5 mol% of cross-linker (EGDM).
The silane monomer APTMS was used as filler to minimize dimensional changes and brittleness
in the dry state as observed in the cation-exchange membrane prepared without using APTMS.
The membranes were soaked in the polymerizing solution similar to the procedure described for
poly(GMA) anchoring, and exposed to 365 nm UV light for 30 min, un-polymerized monomers
were removed by washing with DMF and water. After anchoring, the membrane was conditioned
in 0.1 mol L-1 NaCl solution for 24 h, and then equilibrated with 0.01 mol L-1 PdCl2 solution
overnight to load Pd2+ ions by the ion-exchange mechanism. The Pd2+ ions loaded membrane
samples were immersed in 10% v/v hydrazine aqueous solution to reduce Pd2+ ions held at the ion-
exchange sites to Pd0.

Chapter 4
94
4.2.3 Determination of Pd0 content loaded in membranes
To know the amounts of Pd0 loaded in the membrane, the membrane samples having known
dimension (2x1 cm2) and weights were leached in aqua-regia solution for 12 h at room temperature.
The leach liquor was evaporated to dryness under IR heating and re-dissolved in 10 mL of 0.1 mol
L-1 HNO3. The complete leaching of Pd0 was confirmed by EDXRF analyses of the membrane
sample before and after leaching. These solutions were subjected to ICP-AES analyses for the
determination of concentration of Pd, which was used to calculate the amount of Pd-loaded in the
membrane sample. The ICP-AES analyses were done using high resolution simultaneous atomic
emission spectrometer (Spectro Arcos, Germany) with ICP and DC arc as the excitation sources
and a charge-coupled device (CCD) as the detector. It has continuous wavelength coverage of 130-
800 nm with resolution of 0.01 nm from 130-450 nm and 0.02 nm from 450-800nm (Adya et al.
2016). The experimental details are described in Chapter 2.
4.2.4 Characterizations of membranes
The void volumes (vol %) of the pristine, hydrazine grafted, and Pd NPs embedded membranes
were measured by using wetting liquid “porefil” liquid ( = 0.016Nm-1) supplied by Benelux
scientific, Belgium by using the following equation.
Void Volume = (wl−wd)
ρlVm x 100 (1)
Where wl, wd, l and Vm were weight of porefil liquid wetted sample, weight of the dry membrane,
density of porefil liquid, and volume of the membrane sample, respectively. The membrane
samples were immersed in porefil liquid of having known dimensions (Vm) and weight (wd) for
the period of 4-5h. After that the excess liquid clinging on the surface of the membrane removed
and weighed to obtain the weight of wetted membrane (wl). The dimensions of the membrane did

Chapter 4
95
not change after wetting in porefil liquid. The pore size distributions were measured by capillary
flow porometry (CFP) using porefil liquid as described in chapter 2. by using the equation 4,
Chapter 2
The surface morphologies of pristine and Pd NPs embedded membranes were obtained by FE-
SEM. The samples were coated with gold prior to microscopy to make them conducting. The
elemental mappings of Pd across the cross-section and surface were carried out by energy
dispersive spectroscopy (EDS). The acidity/basicity of the membrane samples were measured by
HCl-NaOH titrations and 137Cs radio tracer was used to measure the the ion-exchage capacity of
the cation-exchange membrane.
4.2.5 Reduction of U(VI) ions
The reduction of U(VI) ions was carried out in a double jacketed glass vessel kept at constant
temperature using thermostat bath as shown in Figure 4.1. The reaction solution contains equal
volumes (8mL each) of 0.1 mol L−1 UO2(NO3)2 solution at pH = 2 and 1 mol L−1 formicacid. This
solution was poured in the reaction vessel kept at a fixed temp. (25, 40, 50, and 60℃). The fixed
dimensions (1x2 cm2) or known weights having Pd NPs loaded membranes were immersed in to
the reaction vessel after attaining desired temperatures. The immersion time was taken as start
time. The UV–Vis spectra given in Figure 4.2, showing no characteristic absorption peaks of
U4+ions, indicates no reduction of U(VI) ions was observed without catalyst and with catalyst at
room temp. The progress of U(VI) ions reduction was monitored by taking 1 mL aliquot from the
reaction solution at a fixed time interval, and UV–Vis spectra of these samples were recorded after
diluting this to 3 mL by adding pH = 2 solution. Similar experiment was carried out using high
intensity ultrasonication by immersing SS horn in the reaction solution. This instrument was
obtained from, (Ultrasonic Laboratory Processor, model SONAPROS PR-500MP, SS Horn having

Chapter 4
96
12 mm dia., 203 KHz) Oscar Ultrasonics Pvt. Ltd., India. The reaction solution temp. at 150 W
power sonication was increased to 60℃. The Pd NPs embedded membrane was introduced after
achieving the required temperature.
Figure 4.2 Successive UV–Vis spectra showing reduction of UO22+to U4+ions using formic acid:
(a) in the presence of Pd NPs embedded hydrazine-grafted PP membrane at room temperature and
(b) in the presence of hydrazine-grafted membrane without Pd NPs at 50℃ as a function of time.
The reaction solution was circulated to Z flow cell with peristaltic pump with constant speed
(2 mL min-1) to monitor the reaction online and successive UV–Vis absorption spectra were
recorded at 5 min time intervals. The most intense peak of U(IV) ion at 665 nm was used for
kinetic experiments and was calibrated by measuring the U(IV) ions concentration by electro
analysis. To prevent back oxidation of U(IV) ions to U(VI) ions during long storage, the solution
350 400 450 500 550 600 650 700
0.00
0.02
0.04
0.06
0.08
0.10
0.12
0.14
0.16
Ab
so
rba
nc
e
Wavelength(nm)
0 Time
1 hr
4 hrs
6 hrs
10 hrs
24 hrs
(a)
400 500 600 700
0.00
0.02
0.04
0.06
0.08
0.10
0.12
0.14
0.16
Ab
so
rba
nc
e
Wavelength(nm)
o min
5 min
15 min
30 min
45 min
60 min
(b)

Chapter 4
97
was kept in a freezer and UV-Vis spectra was monitored again to ensure the extent of oxidation of
U4+ ions.
The quantification of formation of U(IV) ions was carried out by controlled potential coulometric
method using CHI 760D electrochemical work station. The working electrode was hollow
cylindrical platinum wire gauze of 0.07 m height and 0.032 m diameter. A thin platinum wire was
used as counter electrode. The reported potentials were with respect to the saturated Ag/AgCl. All
the experiments were carried out at room temperature. The concentration of U4+ ions was
determined employing controlled potential coulometry. The electrode was submerged in 1 mol L-
1 H2SO4 and was anodized at 1.4 V for 15 min to activate platinum electrode. This was immediately
followed by cathodization in the same electrolyte at 0.150 V vs. Ag/AgCl until the current reached
the background level of 25 A. The aqueous samples (25 mL of solution of U4+ ions in formic
acid) were subjected to the oxidation of U(IV) to U(VI) ions at potential of +1.4V. Electrolysis
was terminated at the background current level. The total charge obtained for the oxidation was
noted and the amount of U(IV) oxidized to U(VI) ions was calculated using Faraday’s first law of
electrolysis.
m =M×Q
n×f (2)
Where, ‘m’ is the mass of the analyte, ‘M’ is the molar mass of the analyte, ‘F’ (= 96487 C) is the
Faraday constant, ‘n’ is the number of electron changed in the redox process, ‘Q’ is the amount of
electrical charge consumed/produced.

Chapter 4
98
4.3 Results and discussion
4.3.1 Characterizations of Pd NPs embedded membranes
The self-reducing neutral membrane and cation-exchange membranes were the two membranes
prepared in the present work. This class of pore-filled membranes had two components i.e.
microporous base membrane that provided support to the cross-linked microgel (poly(GMA))
holding Pd NPs in pores of the host PP membrane and hydrazine which was anchored to the
poly(GMA) to induce self-reducing property. The mass-gains (anchoring yields) obtained from
the increase in weight of the pore-filled membrane with respect to pristine membrane was found
to be 85±5wt % (n = 3, where n is no. of exp). In pores of the PP membrane, the anchoring occurred
through hydrogen abstraction from base poly(propylene) chains and also cross-linked homo-
polymer poly(GMA) chains interpenetrating network structure was formed in pores of the
membrane. The hydrazine units were anchored via epoxy ring opening of poly(GMA). The Pd NPs
were formed by just dipping the hydrazine-grafted membrane in a PdCl2 solution. The nitrogen
contents of the hydrazine grafted PP based membrane samples were found to be 4.2 and 2.1 wt %
before and after saturation loading of Pd0 content, respectively. This seems to suggest that all
hydrazine units were not utilized for the reduction of Pd2+ ions. The possible reactions during
different chemical treatments involved in the formation of Pd NPs in the membrane are shown in
Scheme 4.1.
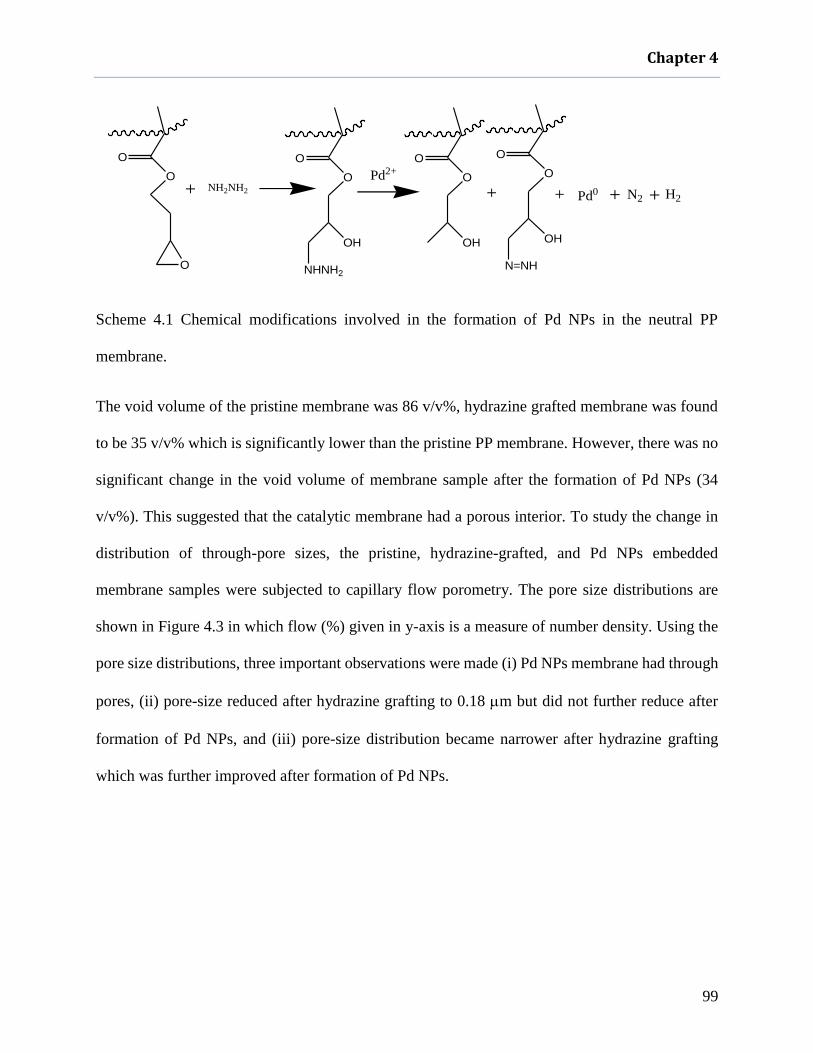
Chapter 4
99
O
O
+ NH2NH2
O
O
OH
O NHNH2
O
O
OH
Pd2+
+
O
O
OH
N=NH
+ Pd0 + N2 + H2
Scheme 4.1 Chemical modifications involved in the formation of Pd NPs in the neutral PP
membrane.
The void volume of the pristine membrane was 86 v/v%, hydrazine grafted membrane was found
to be 35 v/v% which is significantly lower than the pristine PP membrane. However, there was no
significant change in the void volume of membrane sample after the formation of Pd NPs (34
v/v%). This suggested that the catalytic membrane had a porous interior. To study the change in
distribution of through-pore sizes, the pristine, hydrazine-grafted, and Pd NPs embedded
membrane samples were subjected to capillary flow porometry. The pore size distributions are
shown in Figure 4.3 in which flow (%) given in y-axis is a measure of number density. Using the
pore size distributions, three important observations were made (i) Pd NPs membrane had through
pores, (ii) pore-size reduced after hydrazine grafting to 0.18 m but did not further reduce after
formation of Pd NPs, and (iii) pore-size distribution became narrower after hydrazine grafting
which was further improved after formation of Pd NPs.

Chapter 4
100
Figure 4.3 Comparison of pore-size distributions obtained by capillary flow porometry in the
pristine poly(propylene) membrane, hydrazine-grafted poly(propylene)membrane, and Pd NPs
embedded membrane samples.
As shown in Figure 4.4, the saturation Pd0 loading in the hydrazine grafted membrane was found
to be 1241 mg g-1 after equilibration with 0.01 mol L−1 PdCl2 solution at pH = 3 for 15h. From
the nitrogen analysis, the left-over nitrogen even after saturation loading suggests that all hydrazine
units were not utilized for the reduction of Pd2+ ions. This was also confirmed by the basicity of
the hydrazine-grafted membrane which was found to 1.55 ± 0.05 meq g−1 and was reduced to 0.5
± 1 meq g−1 after the formation of Pd NPs. The statistical uncertainty quoted is for duplicate
experiments (n = 2). The residual hydrazine could facilitate the formic acid decomposition (Li et
al. 2013). To explore the possibility of increasing saturation Pd0 loading capacity of the membrane.
The anchoring yield of poly(GMA) was increased by increasing its conc. in the polymerizing
solution, the mass gain was increased from 85 ± 5 wt% to 155 ± 5 wt%, similarly the Pd
saturation loading capacity was also increased from 124 ± 1 mg g−1 to 200 ± 5 mg g−1. However,
0
10
20
30
40
50
60
70
80
90
0.1 0.15 0.2 0.25 0.3 0.35
Pore diameter (m)
Flo
w(%
)
Pristine membrane
Hydrazine-graftedmembrane
Pd NPs embedded membrane

Chapter 4
101
the Pd NPs loaded membrane with 85 wt% mass-gain was used for further studies as the porosity
would be reduced and pores may be blocked in the membrane sample having higher mass gain.
As shown in Figure 4.4, the Pd0 loading was fast within 30 min equilibration (82 mg g−1) and
became very slow thereafter. This suggested that the Pd0 content in the membrane could be
controlled by its equilibration time in Pd2+ salt solution. The saturation Pd0 loading of hydrazine
grafted membrane was 124 ± 1 mg g−1. It is evident from the Figure 4.4 that the desirable amount
of Pd0 could be loaded as a function of equilibration time but could be loaded only up to the
saturation loading. The expected Pd0 saturation loading in the hydrazine grafted membrane was
152 mg g−1 based on 50% reduction of nitrogen content, which was comparable to the experimental
saturation loading 124 ± 1 mg g−1. Thus, the most of the Pd0 content (80%) was retained in the
membrane in the form of Pd NPs.
Figure 4.4 Variation of Pd0 content in the hydrazine-grafted membrane sample as a function of
equilibration times in the aqueous solution containing 0.01 mol L−1 PdCl2 at pH = 2.
The mass-gain of cation-exchange membrane was found to 170 ± 5 wt% in the same host PP
microporous membrane and the ion-exchange capacity (acidity) was found to be 1.6 ± 0.2 meq
0 10 20 30 40 50 60
0
10
20
30
40
50
60
70
80
90
100
mg
g-1
Time (min)

Chapter 4
102
g−1. The Pd NPs formation in this membrane fallowed two steps process as shown in Scheme 4.2.
First, the precursor Pd2+ ions were loaded in the membrane by the ion-exchange mechanism and
then reduced subsequently with hydrazine.
Scheme 4.2 Representative steps involved in the formation of Pd NPs in the cation-exchange
membrane.
The Pd0 saturation loading in the cation-exchange membrane sample was 13±2 mg g−1, which was
considerably lower than that in the hydrazine-grafted membrane sample. The loading capacity 6-
OO
HN NH
SS
OHHO
O
O
OO
HN NH
SS
O
O
O
Ion-exchange
Pd2+
Pd2+
O
OO
HN NH
SS
O
O
OO
Pd0
H+H+
N2H4
Reduction
O
OO
O
O
O

Chapter 4
103
7 times lower than expected saturation loading. This may be due to either inefficient reduction of
Pd2+ ions in the acidic environment or slow reduction process leading to a substantial loss of Pd0
seeds before locking as NPs in the membrane (Goia and Matijević 1998). The reduction of Pd2+
ions in hydrazine grafted membrane would be fast and dependent only on the diffusion of Pd2+
ions in the pores of membrane leading to a high Pd NPs content. However, in the case of cation-
exchange membranes the Pd0 loading could be improved by repeating cycle of loading of Pd2+
ions and subsequent reduction with hydrazine to form Pd0 and regenerating ion-exchange sites as
shown in Scheme 4.2.
FE-SEM imaging and elemental mapping of N and Pd by EDS were used to characterize the
Pd NPs formed on the surface as well as in the cross-section of the hydrazine grafted membrane.
The EDS images given in Figure 4.5 (i, j & k) suggest a uniform grafting of hydrazine and uniform
formation of Pd NPs throughout the membrane matrix. As shown in Figure 4.5 (a-h), the
comparison of the FE-SEM images of Pd NPs loaded hydrazine grafted PP membrane with that of
the pristine PP membrane indicated high porosity of the Pd NPs embedded neutral membrane as
expected from the experimentally measured void volume. The high porosity having Pd NPs
embedded membrane helps in improving the catalytic activity by easy accessible. From Figure.4.5
(e & f), it is seen that 17±4 nm size Pd NPs were formed on the surfaces of PP membrane after
saturation loading. However, the size of Pd NPs were much smaller (<5 nm) at the interior matrix
and could be distinguished from the polymer matrix only by EDS mappings, see Figure. 4.5 (i, j
& k). The sizes of Pd NPs were much smaller than pore size ≈180 nm that ensured possibility for
the reactants and catalyst to come in a contact.
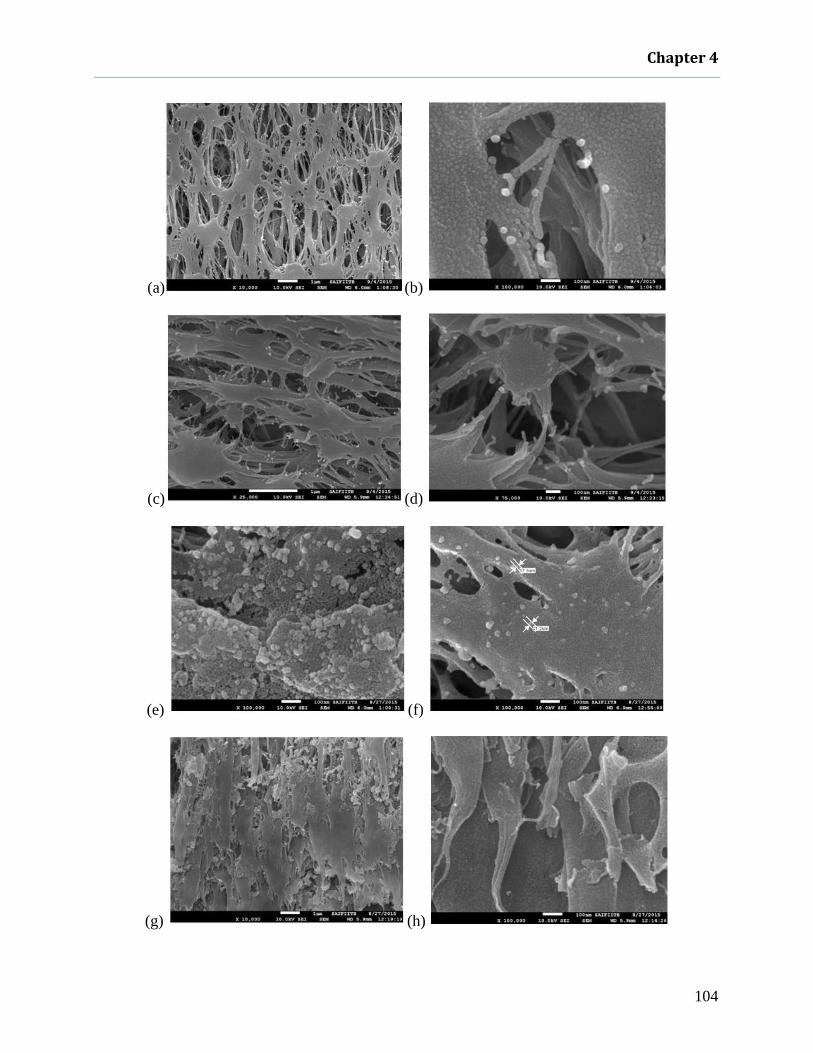
Chapter 4
104
(a) (b)
(c) (d)
(e) (f)
(g) (h)

Chapter 4
105
(i) (j)
(k)
Figure 4.5 The representative FE-SEM images of surface of pristine PP membrane (a & b), cross-
section of pristine PP membrane (c & d), surfaces of Pd NPs embedded hydrazine grafted
membrane (e & f), cross-section of Pd NPs embedded hydrazine-grafted membrane (g & h), and
EDS elemental mappings of nitrogen (i), Pd (j) and mixture of N and Pd at cross-sections (4×4
m) of the same Pd NPs embedded hydrazine-grafted membrane (k).
The physical structure of the membrane and distribution of Pd NPs in the cation-exchange
membrane was also studied using FE-SEM/EDS. It is seen from the FE-SEM images of surface
and cross-section of the PP based cation-exchange membrane shown in Figure 4.6 that this
membrane had a porous physical structure similar to hydrazine grafted PP membrane and Pd NPs
were uniformly distributed throughout the matrix as indicated by the Pd elemental mapping. Thus,
Pd NPs in both the membrane could be compared for their catalytic activity.

Chapter 4
106
(a) (b)
(c) (d)
(e) (f)
(g)
Figure 4.6 Representative FE-SEM images of surface (a & b), cross-section (c & d) of PP based
cation-exchange membrane, and elemental mappings of Pd (e), N (f), and mixture of Pd and N
along the cross-sections of the same PP membrane (g).

Chapter 4
107
4.3.2 Comparison of catalytic activities of Pd NPs embedded membrane.
Formic acid is used as a reducing agent for the UO22+ ions reduction on Pd NPs surface. Formic
acid is a two electron transfer reductant with a potential−0.199 V for HCOOH/CO2, 2H+ couple.
And the reduction potential for UO22++ 2e−→ U4+couple is 0.41 V vs. standard hydrogen electrode
(Toraishi et al. 2007). Therefore, the reduction should be feasible but it was observed that in
absence of Pd catalyst the reaction did not occur at room temperature, as shown in Figure 4.2(a).
This seems to suggest a high activation barrier in the UO22+ ions reduction. It was known from the
literature that, Pd NPs catalyze the decomposition of formic acid (Mori et al. 2013; Gralec and
Lewera 2016). As given below, the Pd NPs decomposes formic acid in two modes (Eq 3 & 4); the
carbon monoxide produced during dehydration of formic acid can deactivate the Pd surface.
Therefore, dehydrogenation is very important for improving the life time of the catalyst.
𝐻𝐶𝑂𝑂𝐻 → 𝐻2 +𝐶𝑂2 (3)
𝐻𝐶𝑂𝑂𝐻 → 𝐻2𝑂 + 𝐶𝑂 (4)
𝐻𝐶𝑂𝑂𝐻 → 𝐶𝑂2 + 2𝐻+ + 2𝑒− (5)
To understand the effect of temperature on reduction of UO22+ions by Pd NPs, the reaction was
carried out at three different temperatures (40℃, 50℃, and 60℃) and analysed the conc. of UO22+
ions as a function of reduction time with formic acid by pseudo-first-order kinetic equation that is
normally applicable in the presence of excess of reducing agent as discussed in chapter 3. As
shown in Figure.4.7 that the variations of ln[U(VI)]t/[U(VI)]o as a function of reduction time with
formic acid in the presence of Pd NPs embedded PP membrane at different temperatures is
reasonably linear as expected from first-order kinetic equation given below and could be used for
a qualitative comparison, though correlation coefficients (R2= ≈0.98) indicated not the best fits.

Chapter 4
108
ln[U(VI)]t
[U(VI)]0=−kt (6)
Where [U(VI)]t and [U(VI)]o represent conc. of UO22+ions at time t and initial, respectively, t is
reduction time, and k is apparent first-order reduction rate constant. As k is dependent on the
amount of Pd catalyst, the values of k were normalized with the amount of Pd0 to obtain catalytic
activity (s−1g−1) for studying the effect of variables involved in the reduction of UO22+ions with
formic acid.
Figure 4.7 Variation of logarithm of [U(VI)]t/[U(VI)]o as a function of reduction time with formic
acid in the presence of Pd embedded PP membrane at 40, 50, 60℃ temp.[U(VI)]t and [U(VI)]0
represent conc. of UO22+ ions at time t and initial, respectively.
The values of catalytic activities towards UO22+ions reduction of Pd NPs embedded on hydrazine
grafted membrane at three different temperatures 40, 50, and 60℃ were found to be 0.11, 0.39,
and 0.46 s−1g−1, respectively. The catalytic activities suggest that, there was a significant jump of
the catalytic activity at 50℃ and slowly increased thereafter. And it was also found from the
experiments that the critical amount of Pd (20 mg) needed for the reduction to take place at 50℃.
0 10 20 30 40 50 60
-2.5
-2.0
-1.5
-1.0
-0.5
0.0
ln[
U(V
I)t / U
(VI)
0]
PP@40
PP@50
PP@60
Time(min)

Chapter 4
109
As shown in Figure.4.8, the catalytic activity of Pd NPs in UO22+ reduction increased with increase
in amount of Pd NPs to attain optimum value 0.39 s−1g−1, but decreased subsequently on further
increase of the Pd NPs content. This could be indicative of the onset of formic acid decomposition
via unfavourable reactions 5&6 in the presence of high amount of Pd NPs catalyst. Thus, an
optimum amount of Pd NPs is required for the efficient reduction. For comparison, the catalytic
activity of Pd/C (5 wt%) was measured and found to be 0.13 s−1g−1 under similar conditions, which
was significantly lower than the 0.39 s−1g−1 obtained using the Pd NPs embedded hydrazine grafted
membrane.
Figure 4.8 Variation of catalytic activity of the Pd NPs embedded in hydrazine-grafted membrane
as a function of Pd0 content in the reduction of U(VI) ions by formic acid to U(IV) ions at 50℃.
Contrary to Pd NPs in the hydrazine grafted membrane, the Pd NPs in the cation exchange
membrane did not show any catalytic activity towards UO22+ ions reduction at any given
temperature with formic acid (Figure 4.9(a)). To ensure that the UO22+ ions reduction is not
affected by the conc. of Pd NPs in the cation-exchange membrane, the Pd content was boosted to
approximately four times by repeating a cycle of Pd2+ions loading and reduction in the cation-
0.0 0.5 1.0 1.5 2.0 2.5 3.0 3.5 4.0 4.5
0.00
0.05
0.10
0.15
0.20
0.25
0.30
0.35
0.40
Ac
tiv
ity
(S
-1 g
-1)
Pd amount (mg)

Chapter 4
110
exchange matrix four times. Even using this Pd NPs loaded membrane, the extent of
UO22+reduction was not very significant (less than 5% in 60 min) as shown in Figure 4.9(b).
Figure 4.9 UV–Vis spectra showing no reduction of U(VI) with formic acid in the presence of Pd
NPs immobilized in the cation-exchange membrane at 50℃. Figures. a & b present the experiments
carried out using the cation-exchange membrane loaded with Pd NPs in one cycle and four cycles,
respectively.
350 400 450 500 550 600 650 700 750
0.00
0.05
0.10
0.15
0.20
Abs
orba
nce
Wavelength(nm)
0 min
1 min
5 min
10 min
15 min
30 min
45 min
60 min
(a) (a)
(b)

Chapter 4
111
The absence of catalytic activity of Pd NPs in the cation-exchange membrane may be due to strong
interaction of uranyl ions (UO22+) with the fixed negative charge sites (-SO3
−) in cation-exchange
matrix which would hinder UO22+ ions interactions with Pd NPs required for the reduction with
formic acid as shown in Scheme 4.3. it is also important to note that, the uranyl ions reduction in
the presence of hydrazine grafted membrane would be enhanced due to basic local environment
(caused by residual hydrazine), which helps in the formic acid decomposition and efficient
reduction of UO22+ions.
Scheme 4.3 Preferential UO22+ ions interactions with sulfonic acid groups in a pore of Pd NPs
embedded cation-exchange membrane (a), and with Pd NPs in hydrazine-grafted membrane (b).
SO3-
SO3-
SO3-
SO3-
SO3-
SO3-
SO3
O3S
UO22+
UO22+
UO22+
H+
H+HCOOH
HCOOHPd NP
UO22+
U4+HCOOH
HCOOH
UO22+
U4+
Pd NP
(a) (a)
(b)

Chapter 4
112
4.3.3 Quantification of U(VI) ions reduction with formic acid
The catalytic conversion of UO22+ ions to U4+ ions by formic acid in presence of Pd NPs embedded
hydrazine grafted PP membrane at 50℃ was monitored by online spectrophotometry using the
setup shown in Figure. 4.1. The spectra recorded at each 5 min interval time was given in Figure
4.10. It is obvious from Figure 4.10 that the absorbance peaks of U4+ions increased continuously
as a function of reduction time and saturated at 70 min. It was observed that >99% UO22+ions were
reduced to U4+ ions during 70 min reduction time under the conditions stated in the experimental
section.
Figure 4.10 The successive UV–Vis spectra obtained online after every 5 min intervals during 70
min reduction of U(VI) ions with formic acid in the presence of Pd NPs embedded hydrazine-
grafted PP membrane at 50℃.
The comparison of absorption peaks of U4+ions given in Table 4.1, the red shift in absorption peaks
observed in solution with respect to that of expected in a solution having no complexing ions
400 500 600 700
0.0
0.2
0.4
0.6
0.8
1.0
1.2
U4+
UO2
2+
U4+
Ab
so
rba
nc
e
Wavelength(nm)

Chapter 4
113
(Misbah and Iftikhar 2013). This could be due to the formation of complex between un-used
formate ions with U4+ ions leading to red shifting of the absorption peaks corresponding to f-f
transitions in the UV-Vis spectrum. The formation of formate complex would provide stability to
U4+ ions against oxidation during storage under ambient conditions.
Table 4.1 Comparison of absorption energy levels for U(IV) ion in solution (Misbah and Iftikhar
2013) and observed in the present work due to its complex formation with formate.
The oxidation of U4+ ions occurs readily at ambient conditions in solution. Therefore, the storage
of solution is difficult and U4+ ions have to be precipitated as UO2 by adjusting pH to 9 with NaOH.
In the present work, the reaction solution was stored at −4 0C for a month. The UV–Vis spectra of
Transition
Expected λ
(nm)
Observed λ
(nm)
3H4-1G4 644 665
3H4-1D2 631 654.3
3H4-3P1 546 555
3H4-1I6 471 489.4
3H4-3P2 427 434.6

Chapter 4
114
freeze-stored solution indicated that U4+ ions did not oxidize back to UO22+ ions during one month
storage (see Figure 4.11(a)). However, the same reaction solution, U4+ions were oxidized back
completely to UO22+ ions kept at room temperature (25℃) for 7 days (see Figure 4.11(b)).
Figure 4.11 UV-Vis spectra showing the stability of absorbance peaks of U(IV) ions stored at-4℃
(a) and at room temperature (25℃) (b).
(b)
(a)

Chapter 4
115
The reusability and reproducibility are very important factors for synthesizing the catalyst. The
reusability of the Pd immobilized catalyst synthesized in this work was tested by repeating cycle
of UO22+ ions reductions at 50 0C under identical conditions for 1 h. UV–Vis spectra obtained after
the end of each cycle are compared in Figure. 4.12. It was seen from this comparison that the
catalytic activity of the Pd NPs embedded PP membrane did not deteriorate even after five cycles.
The Pd NPs embedded in the PP membrane was stored for three months under ambient conditions.
The experiments showed that the catalytic activity of this sample did not change significantly after
storing for three months.
Figure 4.12 UV–Vis spectra showing the absorbance peaks corresponding to U(IV) ions after 1 h
successive cycles of the reduction of U(VI) ions with formic acid in the presence of Pd embedded
PP membrane.
350 400 450 500 550 600 650 700 750
0.0
0.2
0.4
0.6
U(VI)
U(IV)
U(IV)
Ab
sorb
ance
Wavelength(nm)
blank
First cycle
Seconf cycle
Third cycle
Fourth cycle
Fifth cycle

Chapter 4
116
4.3.4 Kinetics of reduction
Pseudo-first-order kinetic model is used to analyze the kinetic of reduction processes in general,
using Eq. (7). However, it is known that the reaction/sorption kinetics obeys pseudo-first-order
kinetics at high initial conc. of solute and pseudo-second-order kinetics at lower initial
concentration of reactant/solute (Azizian 2004; Das et al. 2009). Also, the reduction would proceed
in the host polymer matrix having interconnecting tortuous pores. This may lead to a diffusion-
controlled reduction process. To understand the controlling mechanism operating in the reduction
process, the reduction profiles of theUO22+ions were analyzed in terms of pseudo-first-order,
pseudo-second-order, and inter-particle diffusion kinetics models using linearized Eqs. (7)-(8),
respectively (Das et al. 2009).
t
[U(VI)]t=
1
k2[U(VI)]e2 +
t
[U(VI)]e (7)
[U(VI)]t =kdt12⁄ (8)
Where [U(VI)]t and [U(VI)]e represent concentration of UO22+ ions at time t and at equilibrium,
respectively. k2 and kd are the apparent pseudo-second-order rate constant and apparent diffusion
rate constant, respectively, and t is the reduction time. The analyses of reduction kinetic using
these three kinetic models under identical conditions in the presence of Pd NPs in different hosts
are given in Table 4.2. The reduction of UO22+ ions with formic acid in the presence of Pd NPs
embedded membrane was fast and expected to follow the pseudo-first-order kinetics. Contrary to
this, the reduction profile followed a pseudo-second-order kinetics. The switching of UO22+ions
reduction kinetic to diffusion-controlled process was observed depending upon temperature of the
reacting solution and amount of Pd NPs loaded in the PP membrane. As can be seen from Table
4.2, the reduction followed the pseudo-second-order at lower temperature (40 0C) and switched to

Chapter 4
117
diffusion controlled kinetic with increase in temperature to 50 0C, which was again switched to
pseudo-first-order on increasing the content of Pd NPs from1.82 mg to 4.30 mg. However, high
amount of Pd NPs is not desirable as it would promote decomposition reactions shown in Eqs.(3)
& (4).
Table 4.2 Analyses of the kinetics of U(VI) ions reduction with formic acid in the presence of Pd
NPs hosted in the hydrazine-grafted PP membrane. The chemical conditions were kept constant
and varied either temperature or catalyst.
Temp. (Pd amount) Plot Correlation
coefficient (R2)
Kinetics of sorption
40 0C (1.15 mg) ln [(U(VI)]t/[U(VI)]0 vs. t 0.971 Pseudo-first-order
t/[U(VI)]t vs. t 0.998 Pseudo-second-order
[U(VI)]t vs. t1/2 0.968 Diffusion controlled
50 0C (1.15 mg) ln [(U(VI)]t/[U(VI)]0 vs. t 0.988 Pseudo-first-order
t/[U(VI)]t vs. t 0.869 Pseudo-second-order
[U(VI)]t vs. t1/2 0.999 Diffusion controlled
60 0C (1.15 mg) ln [(U(VI)]t/[U(VI)]0 vs. t 0.972 Pseudo-first-order
t/[U(VI)]t vs. t 0.759 Pseudo-second-order
[U(VI)]t vs. t1/2 0.999 Diffusion controlled
50 0C (0.51 mg) ln [(U(VI)]t/[U(VI)]0 vs. t 0.993 Pseudo-first-order
t/[U(VI)]t vs. t 0.993 Pseudo-second-order
[U(VI)]t vs. t1/2 0.999 Diffusion controlled
50 0C (1.82 mg) ln [(U(VI)]t/[U(VI)]0 vs. t 0.991 Pseudo-first-order
t/[U(VI)]t vs. t 0.948 Pseudo-second-order
[U(VI)]t vs. t1/2 0.992 Diffusion controlled
50 0C (4.30 mg) ln [(U(VI)]t/[U(VI)]0 vs. t 0.994 Pseudo-first-order
t/[U(VI)]t vs. t 0.877 Pseudo-second-order
[U(VI)]t vs. t1/2 0.977 Diffusion controlled
4.3.5 Enhancement of kinetics of reduction using sonication
High intensity ultrasound in water produces cavitation, heat and agitation, which are extremely
useful in a heterogeneous chemical system for improving mass transfer and reaction kinetics (Xu

Chapter 4
118
et al. 2013.; Adewuyi 2001). As reported in the literature (Nikitenko et al. 2010) that, high intensity
ultrasound accelerates the reduction of UO22+ ions with hydrazine catalyzed by Pt and in the
presence of 2-propanol as an inhibitor for H2O2 formation. Therefore, the effects of high intensity
ultrasonication on the UO22+ ions reduction was studied in this work by using Pd NPs embedded
hydrazine grafted membrane with formic acid. It was interesting to note that the kinetic of
reduction at same temperature was switched from the diffusion controlled kinetics to pseudo-first-
order kinetics. And also it was observed that, the catalytic activity of the Pd NPs was enhanced
two times during ultrasonication (0.93 s−1g−1from 0.46 s−1g−1) obtained at corresponding 60 0C
temp. This phenomenal enhancement in the catalytic activity of the Pd NPs by ultrasonication
could be due to improved mass transfer of the reactants to membrane matrix which is important in
such a heterogeneous system. Thus, the reduction process was no longer controlled by the diffusion
process in the host PP matrix.
4.4 Conclusions
In this work, a new method was developed to host Pd nanocatalysts in the through pores hydrazine-
grafted synthetic polymer membrane for the UO22+ ions reduction to U4+ ions with formic acid. It
was not possible to load high amount of precursor Pd2+ ions in the membrane in the absence of
ion-exchange and complexing groups. Therefore, the reducing agent hydrazine itself was grafted
in pores of the membrane that facilitated high amount of Pd0 loading, depending upon hydrazine
grafting and reduction solution pH, in the form of Pd NPs in membrane under ambient conditions.
The residual hydrazine in the membrane after formation of Pd NPs was found to be facilitate the
decomposition of formic acid there by increasing the reduction process of UO22+ ions to U4+ ions.
The Pd NPs embedded in the highly porous hydrazine grafted PP membrane exhibited a good
catalytic activity in the reduction of UO22+ ions with formic acid that could be further enhanced

Chapter 4
119
using high intensity sonication. The reusability of the catalyst has been tested and it was found
that, the catalytic activity of this Pd NPs embedded membrane did not deteriorate during successive
recycling. The analyses of reduction rate under different experimental conditions indicated that the
reductions of UO22+ with formic acid follow psesudo-second-order kinetics but switched to
diffusion controlled kinetics on increasing the amount of Pd NPs due to matrix effects. However,
the enhancement of the reduction of UO22+ with formic acid under ultrasonication switched the
kinetics from diffusion controlled to pseudo-first-order in the presence of lower amount of Pd NPs
due to improved mass transfer of reactants to the host membrane matrix. Thus, the hydrazine-
grafted membrane developed in the present work mimics egg-shell membrane in terms of
formation and stabilization of Pd NPs. In addition to this, it is robust, efficient, recyclable and
having a long shelf-life.

GRAFTED-ELECTROSPUN POLYMER MICROFIBER
SCAFFOLD HOSTED PALLADIUM NANOPARTICLES FOR
CATALYZING REDOX REACTIONS
HCOOH
O
NO2
OH
NH2
Pd NPs catalyzed reductions

Chapter 5
121
5.1 Introduction
The electrospinning technique is a simple and versitile method for synthesizing the microfibers of
various polymers, composites, and ceramics, and also this technique offers a simple route to
prepare the polymer fibers mimicking structures of biomaterials (Ke et al. 2014).The diameter of
the polymer fibers can be varied by the concentration of the polymer in solution or composition
used for electrospinning. In addition to these, the electrospinning conditions such as applied
electric field, tip to collector distance, flow rate, collector spinning rate, temperature and humidity
etc are also affect the elctrospinning process.To impart porosity to the fibers, the co-solvent having
low boiling point can be added (Sun et al. 2014; Bharadwaj and Kundu 2010; Li and Xia
2004).These polymer fibers possess several desirable features such as high porosity, large surface
area, easy separation and superior mechanical properties (Greiner and Wendorff 2007; Huang et
al. 2003).These features make the polymer fibers excellent host substrates for the applications such
as catalysis (Demir et al 2004; Panthi et al 2013; Chun and Jo 2014; Zhang et al 2010), antibacterial
(Liu et al. 2014), biomedical (Du et al. 2012; Shao et al. 2011), and sensing (Zheng and Liu 2014;
Yoon et al. 2012). Therefore, the electrospun nanofibres (NFs) are extensively used as a building
blocks of nanoscience, nanodevices, and nanomembranes (Wu et al. 2007; Kim et al. 2015; Suren
et al. 2014).
Catalysis is the most explored application among the various applications of NFs.
Fabrication of composite NFs consisting of inorganic nanostructured materials anchored in the
polymer matrix have been studied intensively in the field of catalysis because these host materials
form easily retrievable and recyclable heterogeneous catalysts without affecting catalytic activity
of the nanocatalysts (Greiner and Wendorff 2007; Zhang and Yu 2014; Lu et al. 2009; Dai et al.
2016; Patra et al. 2016; Neyertz et al. 2010; Lu et al. 2007).There are two possibilities to anchor

Chapter 5
122
nanoparticles (NPs) or NCs in the electrospun polymer fibers; one during electrospinning, and
second post processing of the fibers (Dai et al. 2016; Patra et al. 2016; Neyertz et al. 2010; Lu et
al. 2007; Higaki et al. 2015). In first case, the nanomaterials aggregation and leaching can be
controlled. The post processing of electrospun polymer fibers has advantage that the NPs can be
positioned on the surface to provide higher accessibility. In general, the methods used for the
incorporation of NPs on the electrospun polymer fibers are: (i) direct attachment of noble metal
NPs via electrostatic force, hydrogen bonding or binding through functional groups on NPs, (ii)
loading of precursor noble ions through ion-exchange/complexation with binding sites on the
fibers and subsequent in situ chemical reduction, and (iii) hydrothermal assisted methods mostly
used for the metal oxide NPs (Zhang and Yu 2014). The different electrospun fibers made up of
chitosan/poly(methacrylic acid) (Shao and Ren 2015), poly(ε-caprolactone) surface
functionalized with poly(dopamine) (Kim and Son 2015), porous carbon nanofibers formed by
precursor fibers of poly(styrene)/ poly(acrylonitrile) (PAN) (Guo and Bai 2015), polyacrylic acid
(PAA)/polyvinyl alcohol (PVA) (Hu and Huang 2014), polyethyleneimine (PEI)/PVA (Hu and
Huang 2014; Huang et al. 2012), poly(L-lactic acid)/ amino-functionalized silsesquioxane
(Gardella et al. 2013), nanoporous PVA mat (Shao et al. 2012), carbon nanofibers prepared from
electrospun PVA mat (Barakat et al. 2016) etc. have been used to host metal NCs for the organic
transformations and inorganic reductions. The sulfonic groups functionalized PAN fibers have
been found to be efficient heterogeneous catalysts for the acetalization and esterification organic
reactions (Shao et al. 2012). It is interesting to note that poly(vinyl pyrrolidone) (PVP) fibers act
as both reducing agent as well as capping agent (Jiang et al. 2016). It is also possible to graft the
reducing moiety on polymer matrix for the direct formation and deposition of noble metal NPs as
described in Chapter 3&4.

Chapter 5
123
The catalyzed inorganic and organic redox reactions are becoming increasingly important for the
objectives of environmental remediation and industrial importance such as: (i) reduction of Cr(VI)
to Cr(III) (Huang et al. 2012; Yadav and Xu 2013; Omole et al. 2007; Liang et al. 2014; Wang et
al. 2016; Dandapat et al. 2011), (ii) reduction of U(VI) to U(IV) (McCleskey et al. 2001; Salomone
et al. 2015; Shand and Anderson 2013), (iii) decompositions of nitrate and nitrites (Neyertz et al.
2010; Shand and Anderson 2013; Mishra et al. 2011; Ren et al. 2015; Dodouche and Epron 2007;
Wehbe et al. 2009), and (iv) reduction of organic pollutants (Niu et al. 2016; Zhang et al. 2012).
For developing a sustainable environmental remediation technology, it is important to have a
benign reductant along with a highly efficient and recyclable noble metal catalyst. The formic acid
decomposition catalyzed by the noble metal NPs immobilized on the support is being explored for
hydrogen production (Gao et al. 2016; Zhou et al. 2008; Wang et al. 2014). It is interesting to note
that thus in situ produced hydrogen can also be used for the inorganic and organic reductions
having technological and environmental importance.
In the present work, a porous poly(ether sulfone) (PES) microfibers mat has been prepared
by electrospinning technique using the optimized conditions. The reducing moiety has been
attached covalently to the PES microfibers mat by UV-graft polymerization of
glycidylmethacrylate, and reacting subsequently with hydrazine via epoxy ring opening. PES is
UV-active and thus free radicals can be generated directly on PES fibres under UV irradiation.
The grafted polymer shell around porous microfiber has been found to perform the reduction of
precursor ions by grafted hydrazine which leads to the nucleation and growth of Pd nanparticles
(NPs) on the host matrix itself. The as formed Pd Nps had been used to study the reductions of
U(VI)/Cr(VI) with formic acid, and p-nitrophenol with borohydride/hydrazine. The controlled
loading Pd NPs and catalyst reusability have also been examined.

Chapter 5
124
5.2 Experimental
Details of materials and reagents used are given in chapter 2.
5.2.1 Preparation of electrospun PES microfibers mat
The detailed experimental setup of electrospinning was given in Chapter 2. The experimental setup
contains syringe pump, high voltage source and a grounded collector. In this experiment an 11-
Elite syringe pump was used, which was procured from Harvard Apparatus Holliston, MA, USA.
High voltage DC source (Model MK30P02.5) from a Glassman High voltage (NJ, USA) was used
for applying a high voltage. The fibers were collected on a rotating drum wrapped with aluminum
foil. The Al foil was grounded to a negative -350 V using a high voltage DC source purchased
from Aplab high voltage DC source Pvt. Ltd, India. The working distance between needle and
collector was of 12 to 16 cm and operating voltage of 12-14kV were optimized after a series of
trial runs. The effects of different solvents and solvent to PES polymer ratio on the formation of
PES microfibers were studied and the solvents such as DMF, DMAc and NMP were used. After a
series of trials, DMF was selected as the suitable solvent. To form the uniform, beads free fibers,
the polymer to solvent ratio was optimized using different amount of PES granules dissolved in
DMAc. It was observed that 20 wt. % of PES in DMAc resulted in the formation of beads rather
than fibers as shown in FE-SEM images given in Figure. 5.1(a), that was attributed to lower
viscosity of the solution. On increasing PES concentration to 28 wt % in DMAc, the uniform bead
free fibers were formed (Figure.5.1(b)). On further increasing amount of PES, formations of non-
spherical beads and non-homogenous fibers were observed; see Figure.5.1(c).
To induce porosity in the microfibers, the lower boiling solvent was used generally as a co-solvent.
Here, in this experiment acetone was used along with DMAc with known v/v ratio. Acetone
evaporates faster than DMAc during Rayleigh instability region of electrospinning, leaving behind

Chapter 5
125
voids on the surface of the fibers. The optimized proportion of solvent to form porous fibers was
DMAc: acetone as 80 : 20 v/v as shown in Figure. 5.1(d).
(a)
(b)
(c)

Chapter 5
126
(d)
Figure 5.1 FE-SEM images of electrospun nanofiber mats formed by using the solutions having:
(a) 20 wt. % of PES in DMAc, (b) 28 wt. % of PES in DMAc, (c) 30 wt. % of PES in DMAc, and
(d) 28 wt. % of PES in DMAc: acetone in 80:20 ratio under lower and higher magnifications.
5.2.2 Chemical treatments
For anchoring poly(GMA) on PES microfibers mat, the monomer solution containing GMA was
prepared by dissolving 1.5 g of GMA in 2 mL of ethanol solvent and adding 2mol % of cross-
linker (EGDM) along with 1 wt. % of UV-initiator (DMPA). The PES polymer is UV-active and
GMA could be anchored without UV-initiator. However, UV-initiator and cross-linker were used
to obtain higher poly(GMA) grafting yield. The microfibers mat was soaked in the polymerizing
solution for about 3h prior to irradiate with 365 nm light in photo-reactor for a period of 20 min.
After polymerization, the microfibers mat samples were washed with ethanol and water mixture
to remove un-polymerized components. The choice of solution composition and UV-irradiation
time was based on the optimization of in situ grafting/polymerization methods in terms of optimum
yield [Chapter3 & 4]. The poly(GMA) anchored electrospun PES fibers mats were reacted with
hydrazine hydrate (99 %) for 12 h with a constant stirring at room temp. The hydrazine reacted
mats were thoroughly washed with deionized water several times to remove un-reacted hydrazine,

Chapter 5
127
and vacuum dried for the further use. These hydrazine attached microfibers mats were equilibrated
with the solutions containing 0.01 mol L-1 PdCl2 at pH=2 for 15 h to form Pd NPs.
5.2.3 Reductions of U(VI), Cr(VI) and p-nitrophenol
The reduction of UO22+ ions was carried out in a double jacketed glass vessel kept at constant
temperature using thermostat bath. For UO22+ ions reduction, equal volumes of (8 mL each) 0.1mol
L-1 UO2(NO3)2 solution at pH=2 and 1mol L-1 formic acid were taken and for Cr2O72-reduction, 5
mL of 10 mM CrVI and 5 mL of 0.1M formic acid were taken in a reaction vessel kept at a constant
50oC temp. The known weights of Pd NPs loaded PES microfibers mat samples were used to
calculate the catalytic activity. There was no reduction of UO22+ or Cr2O7
2- ions observed without
catalyst and with catalyst at room temperature. The progress of UO22+ ions reduction was
monitored by taking 1 mL aliquot from the reaction solution at a fixed time interval, and UV-Vis
spectra of these samples were recorded after diluting this to 3 mL by adding pH=2 solution.
Similarly, Cr2O72- ions reduction was monitored by taking 0.5 mL of solution at regular time
interval and diluted to 3 mL for recoding the UV-Vis spectrum. For kinetic experiments, the most
intense peak at 665 nm of U4+ ion was calibrated by measuring the U4+ concentration by electro-
analysis. To prevent oxidation of U4+ ions to UO22+ during long storage, the solution was kept in
a freezer and UV-Vis spectrum was recorded again to ensure the extent of oxidation of U4+.
Borohydride and hydrazine were used as reducing agents for the reduction of p-nitrophenol
(PNP) to p-aminophenol (PAP) in the presence of known weight of Pd NPs loaded PES microfibers
mat. For continuous monitoring, the reaction was carried in a cuvette kept in miniature
spectrophotometer and UV-Vis spectra were recorded with one min time interval. The reaction
solution was stirred with magnetic bar. The reaction solution contained 2 mM of 0.1 mL PNP and
0.1 mL of 200 mM of NaBH4 and 2.8 mL of deionized water was added to make 3 mL volume in

Chapter 5
128
cuvette. Similar conditions (2mM of 0.1 mL PNP , 0.1 mL of 200 mM N2H4 and 2.8 mL of
deionized water) were used for the hydrazine as a reducing agent for PNP.
5.3 Results and discussion
5.3.1 Formation of Pd NPs embedded PES fibers mat
The PES fiber mat produced in this work did not contain any functional groups to hold the
precursor Pd2+ ions and subsequently to reduce them to form the Pd NPs. The covalent attachment
of hydrazine onto the poly(GMA) anchored PES fibers mat made it dual-functional as shown in
Scheme 5.1.
Scheme 5.1 Chemical modifications involved in the covalent attachment of reducing hydrazine
groups on the electrospun PES microfibers mat.
O S
O
O
O
PES
+
OO
O
DMPA
UV-irradiation
O S
O
O
O
OO
O
+ CH3
InitiationO
O
O
O
O
O
O S
O
OO
O
O
OO
O
O
O
O
O
OPES Matrix
+ +
Solution
Photolysis of PES chain
GMA
Photolysis of initiator
propagation of polymerization & cross-linking with PES matrix
OO
O
O
O
O
O
O
O
NH2NH2
OO
OH
O
O
HO
O
O
HO
NH2NH
NH2NH
NHNH2

Chapter 5
129
PES used in the fibermat formed free radicals on photolysis under UV-light irradiation, and
initiated graft-polymerization of GMA as shown in Scheme 5.1 (Paul et al. 2015; Susanto and
Ulbricht 2007). However, the poly(GMA) anchored (2-5 wt%) on to the electrospun PES fibers
mat did not give higher extent of the hydrazine-grafting required for higher reduction of Pd2+ ions.
To improve loading of Pd on fibers mat, UV-initiator DMPA and cross-linker EGDM were
used to increase the poly(GMA) anchoring on the PES fibers mat. During UV-irradiation, the
photolysis of DMPA in polymerizing solution also occurred to form free radicals (Tehfe et al.
2013; Szablan et al. 2007), which could initiate homo-polymerization of GMA. The poly(GMA)
chains in solution were linked with poly(GMA) anchored on PES fibers either by terminating chain
reaction or cross-linking of the poly(GMA). This resulted in the anchoring of poly(GMA) on the
PES fibers to 300 wt.%. The reducing moiety hydrazine was attached to poly(GMA) anchored
PES fibers covalently. The hydrazine modified PES fibers mat found to reduce Pd2+ ions readily
at ambient conditions to Pd0 atoms that nucleated on the PES microfiber itself to form Pd NPs.
The saturation loading of Pd0 on the electrospun fibers mat was found to be 22±3 mg g-1.
The morphology change after chemical modification of the microfibers mat was studied by
FE-SEM. As shown in Figure. 5.2, the PES fibers lengths were shortened after the attachment of
hydrazine via anchored poly(GMA) and the porous surface became smoother. The stiffening of
the PES microfibers and increase in the diameter of fibers from 2 m in the pristine PES
microfibers to 4m were because of the higher grafting and cross-linking (300 wt.%). It was also
clear from the Figure. 5.2 that there was no cross-linking between the fibers or retention of the
homo-poly(GMA) gel that might had formed by UV-initiator. The Pd NPs were embedded in the
grafted layer on PES microfibers that could be seen as white spots in the FE-SEM image given in
Figure. 5.2(d). The uniform distribution of Pd NPs in the fibers mat was shown by EDS mapping

Chapter 5
130
(Figure 5.3). The left-over nitrogen shown in EDS mapping after saturation loading of Pd0suggest
that hydrazine was not utilized fully for the reduction of Pd2+ ions. Thus, the Pd NPs embedded
microfibers mat also had basic groups that would enhance the formic acid oxidation as reported in
the literature (Mori et al.2013).
(a) (b)
(c) (d)
Figure 5.2 FE-SEM images of the pristine PES nanofibers mat (a,b), and same nanofibers mat after
the chemical modifications shown in Scheme 1 (c,d) under higher and lower magnifications.
The morphology changes after grafting with poly(GMA) on the pristine micro fibers mat along the
cross-section was studied using FE-SEM. As given in Figure 5.4 that, the grafted polymer shell of
thickness 0.680.20 m was formed on porous core having 1.570.30 m diameter. This core
diameter is similar to the diameter of the pristine electrospun microfibers (1.47 0.60 m)

Chapter 5
131
indicating the growth of grafted polymer on their outer surface. The cross-section of bunch of
microfibers showed uniform distributions of these elements Figure 5.5.
(a)
(b)
(c)
(d)
Figure 5.3 The C, N, Pd elemental mappings of Pd NPs loaded PES microfibers mat (70x70 m)
by EDS showing the presence of nitrogen from residual hydrazine and Pd NPs.
(a)
(b)
Figure 5.4 Cross-sectional FE-SEM image of Pd NPs loaded microfiber.

Chapter 5
132
(a)
(b)
(c)
(d)
Figure 5.5 Elemental mappings of Pd and N on the cross-section of Pd NPs loaded PES microfibers
Fiber@Pd using FE-SEM/EDS.
Nitrogen analysis was carried out to know that extent of reaction of anchored poly(GMA) with
hydrazine. The nitrogen content of hydrazine reacted fibers was found to be 11.14 wt.% which
corresponded to 70 % reaction of glycidyl units with hydrazine. The amount of glycidyl units was
obtained by gravimetrically (mass-gain after anchoring). The nitrogen content of the microfibers
after Pd NPs loading was found to be 6.98 wt.% indicating 50% utilization of grafted hydrazine
for the reduction of Pd2+ ions. Assuming one hydrazine was required for the reduction of one Pd2+
ion, the comparison of nitrogen amount consumed (4.16 wt.%) and Pd content loaded (22 mg g-
1) seems to suggest that only 20 wt.% of Pd0 was locked as Pd NPs in the microfibers; and rest of
the Pd0 content might had been lost to the solution used for providing precursor Pd2+ ions.
However, the ICP-AES analysis of solution after 3 cycles of reductions did not show any loss of

Chapter 5
133
Pd content from the fibers. Thus, the Pd0 locked as Pd NPs had high stability and adherence in the
microfibers.
5.3.2 Catalytic reduction of U(VI) ions
The UO22+ ions reduction with formic acid in presence of Pd NPs formed on fibres mat was tested.
The reduction of UO22+ ions with formic acid involves two electron transfer and this reaction in
presence of catalyst was represented as (eq(1))
O2HCO)U(NO2HNO HCOOH)(NOUO 2243
Catalyst
3232 (1)
To evaluate catalytic activity of Pd NPs embedded PES microfibers (Fiber@Pd), the linear
variation of ln [U(VI)]t/[U(VI)]0 vs. t during UO22+-reduction with formic acid at 500C was
analyzed using pseudo-first-order kinetic equation given below:
ktU
UVI
tVI
0][
][ln (2)
Where [UVI]t and [UVI]0 represent concentrations of UO22+ ions at time t and initial, respectively,
t is reduction time, and K is apparent reduction rate constant. The pseudo-first-order kinetic
equation was used here because formic acid was used in excess. The concentration of U4+ ions was
monitored from absorbance at 665 nm which was calibrated by electro-analysis. The choice of 665
nm for monitoring was based on the fact that it is the most intense peak of f-f transitions in U4+ as
can be seen from the successive UV-Vis spectra recorded during reduction, see Figure.5.6.

Chapter 5
134
Figure 5.6 The increase in the concentration of U(IV) ions as a function of reduction time of U(VI)
ions with formic acid at 50℃ was monitored from the f-f transition peaks in successive UV-Vis
spectra recorded from the samples taken from reaction solution.
The UO22+ ions conc. at time t was obtained from the mass-balance. Commercially available Pd/C
(10 wt%) was also used for the reduction of UO22+ ions with formic acid, to compare the catalytic
activity with Pd NPs immobilized fibers mat. The kinetic data analysis given in Table 5.1 seems
to indicate that the catalytic activity of Fiber@Pd (0.22 s-1g-1) is considerably higher than that of
Pd/C (0.16 s-1g-1) under the identical conditions of reduction of UO22+ ions with formic acid at
50℃.
Table 5.1 Comparison of the catalytic activities of Fiber@Pd with Pd/C during the reduction of
UO22+ ions with formic acid at 50℃ temp. The conditions were kept same in all the experiments
as 0.1 mol L-1 UO2(NO3)2 at pH=2 and 1 mol L-1 formic acid.
Host Catalyst wt.
(mg)
Pd wt.
(mg)
k
( 10-3 s-1)
Catalytic activity
(s-1 g-1)
Fiber@Pd 53.0 1.16 0.25 0.220.02
Pd/C (10 wt.%) 6.0 0.60 0.10 0.160.02

Chapter 5
135
5.3.3 Catalytic reduction of Cr(VI) anions
The Cr2O72- ions reduction with formic acid in the presence of Pd NPs formed on microfibers mat
was studied at 25℃ and 50℃ and was analyzed by monitoring the absorbance at 348 nm
corresponding to conc. of Cr(VI). Since absorbance (A) at 348 nm represents conc. of Cr(VI) ions,
the conc. in equation 2 was replaced by absorbance for analyzing the kinetics of reduction.The
successive UV-Vis spectra is given in Figure. 5.7. As shown in Fig. 5.7(a), the complete
disappearence of absorption peak at 348 nm was observed during 60 min reduction time indicating
complete reduction of Cr(VI) with formic acid at 50℃ in the presence of Fiber@Pd. It is also seen
from Figure. 5.7(b) that the Cr(VI)-reduction also occurred at 25℃ with a slower rate under the
similar conditions; but did not occur in the absence of the catalyst (Figure. 5.7(c)). The successive
UV–Vis spectra obtained as a function of reduction time and the corresponding variations of [A]t
/ [A]0 versus t were also given Figure5.7.
The apparent pseudo-first-order reduction rate constants and catalytic activities obtained at 250C
and 50 0C were compared with that reported in the literature in Table 5.2. It is seen from Table 5.2
that the catalytic activity towards Cr(VI) ions in the presence of fiber@Pd found to be higher than
the Pd NPs supported on other host materials reported in the literature. The higher catalytic activity
of fiber@Pd may due to accessibility of Pd NPs, the presence of basic groups left after reduction
of Pd2+ ions (Mori et al. 2013), and uncapped surface of the Pd NPs. The catalytic activity of
fiber@Pd in the reduction of Cr(VI) with formic acid (0.79 s-1g-1) was higher than that in the
reduction of U(VI) (0.22 s-1g-1) under similar conditions. This was attributed to higher redox
potential for Cr(VI)/Cr(III) (1.33 V) than that for UVI/UIV couple (0.41V). Although both these
couple potentials are convenient for the reduction with formic acid (HCOOH /CO2, 2H+ couple is
-0.199 V), the lower redox potential of U(VI)/U(IV) couple and high activation barrier, due to

Chapter 5
136
strongly bound oxygen in UO22+ ions, lowered the catalytic activity of Fiber@Pd with respect to
Cr(VI)/Cr(III) couple under similar conditions. The lower activation barrier also resulted in the
reduction of Cr(VI) in the presence of Fiber@Pd at room temp.
(a)
(b)
(c)
Figure 5.7 Successive UV-Vis spectra obtained during reductions of Cr(VI) with formic acid at
50℃ (a) and 25℃ (b) and corresponding variation of ln [A]t/[A]0 vs reduction time (t) in the
presence of Fiber@Pd. The UV-Vis spectra shown in (c) indicate no reduction of Cr(VI) under
300 350 400 450
0.0
0.2
0.4
0.6
0.8
1.0
1.2
Ab
so
rba
nc
e
Wavelength(nm)
0 time
1 min
5 min
15 min
30 min
45 min
60 min
0 10 20 30 40 50 60
-4.0
-3.5
-3.0
-2.5
-2.0
-1.5
-1.0
-0.5
0.0
Slope=0.055
ln(A
t/A0)
Time (min)
300 350 400 450 500
0.2
0.4
0.6
0.8
1.0
1.2
Ab
so
rba
nc
e
Wavelength(nm)
0 Time
1 min
5 min
10 min
15 min
30 min
45 min
60 min
0 10 20 30 40 50 60
-0.6
-0.5
-0.4
-0.3
-0.2
-0.1Slope=-0.0066
ln(A
t/A0)
Time (min)
250 300 350 400 450 500
0.0
0.2
0.4
0.6
0.8
1.0
1.2
1.4
1.6
1.8
2.0
Ab
so
rba
nc
e
Wavelength(nm)
0 time
5 min
10 min
15 min
30 min
45 min
60 min
0 10 20 30 40 50 60
-4.0
-3.5
-3.0
-2.5
-2.0
-1.5
-1.0
-0.5
0.0
ln(A
t/A0)
Time (min)
500C
RT

Chapter 5
137
similar conditions (50℃) in absence of the catalyst along with comparisons of reduction rate
profiles at room temperature and at 50℃.
Table 5.2 Comparison of catalytic activity of Pd NPs hosted in different matrices for the reduction
of Cr(VI) anions with formic acid.
Catalyst Chemical
conditions
Catalytic
Activity
(s-1 g-1)
Ref.
Poly(vinylpyrrolidone)-
stabilized NPs
Formic acid, 45℃ 0.37
Tu et al. 2013
Pd NPs on Fe3O4 Formic acid, 45℃ 0.124 Tu et al. 2013
Viral-templatedPd NP Formic acid, 25℃ 0. 46x10-3 Yang et al. 2014
Pd NPs in polym. grafted Fe3O4 Formic acid, 50℃ 0.517 Shrivastava et al.
2016
Pd NPs in polym. grafted SiO2 Formic acid, 50℃ 0.138 Shrivastava et al.
2016
Fiber@Pd Formic acid, 50℃ 0.79 Present work
Fiber@Pd Formic acid, 25℃ 0.095 Present work
5.3.4 Catalytic reduction of p-nitrophenol
The reduction of p-nitrophenol (PNP) to p-aminophenol (PAP) with borohydride at room
temperature in the presence of coinage metal nanocatalysts (Aditya et al. 2015; Patra et al. 2014),
including the Pd NPs (Komathi et al. 2010) was used as a model reaction to evaluate the catalytic

Chapter 5
138
activity. Therefore, the catalytic performance of the Fiber@Pd in this redox system was also
studied. The successive UV-Vis spectra taken during reduction of PNP with borohydride in the
presence of Fiber@Pd showed that PNP was quantitatively reduced to PAP, see Figure. 5.8.
Hydrazine was also used in the presence of borohydride for PNP reduction. It was observed that
the PNP reduction with borohydride and hydrazine did not occur significantly in the absence of
the catalyst as can be seen from UV-Vis spectra given in Figure. 5.9. Figure 5.8(b) showed, there
were two slopes suggesting that the initial reduction process was slower and accelerated as reaction
proceeded. The similar observation was reported earlier with borohydride in the presence of Ag
NPs embedded poly(styrene) beads at room temp, and was attributed to nanoconfinement effect
(Patra et al. 2014). However, the lag time in onset of reduction was not observed in the present
case.
(a) (b)
Figure 5.8 The successive UV-Vis spectra showing quantitative conversion of PNP to PAP with
borohydride in the presence of Fiber@Pd (a) and corresponding variation of ln [A]t/[A]0 vs.
reduction time (b).
From the kinetic plot given Figure. 5.8(b), it was observed that the Pd NPs on the surface had
lower catalytic activity compared to Pd NPs embedded in the hydrazine-grafted PES microfibers.
250 300 350 400 450 500
0.0
0.2
0.4
0.6
0.8
1.0
1.2
1.4
1.6
1.8
2.0
PAP
PNP
16 mins
0
Ab
so
rban
ce
Wavelength(nm)
0 2 4 6 8 10 12 14 16 18
-3.5
-3.0
-2.5
-2.0
-1.5
-1.0
-0.5
0.0
slope2= -0.58
slope1= -0.11
ln A
t/A0
Time(min)
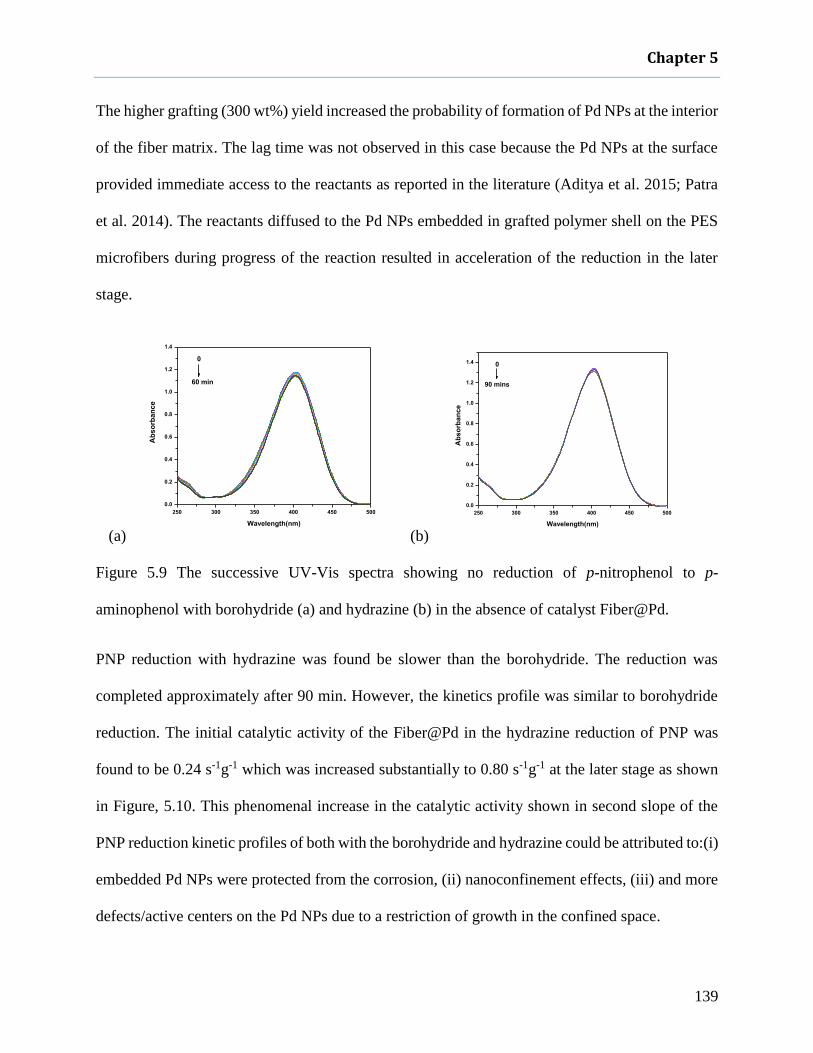
Chapter 5
139
The higher grafting (300 wt%) yield increased the probability of formation of Pd NPs at the interior
of the fiber matrix. The lag time was not observed in this case because the Pd NPs at the surface
provided immediate access to the reactants as reported in the literature (Aditya et al. 2015; Patra
et al. 2014). The reactants diffused to the Pd NPs embedded in grafted polymer shell on the PES
microfibers during progress of the reaction resulted in acceleration of the reduction in the later
stage.
(a) (b)
Figure 5.9 The successive UV-Vis spectra showing no reduction of p-nitrophenol to p-
aminophenol with borohydride (a) and hydrazine (b) in the absence of catalyst Fiber@Pd.
PNP reduction with hydrazine was found be slower than the borohydride. The reduction was
completed approximately after 90 min. However, the kinetics profile was similar to borohydride
reduction. The initial catalytic activity of the Fiber@Pd in the hydrazine reduction of PNP was
found to be 0.24 s-1g-1 which was increased substantially to 0.80 s-1g-1 at the later stage as shown
in Figure, 5.10. This phenomenal increase in the catalytic activity shown in second slope of the
PNP reduction kinetic profiles of both with the borohydride and hydrazine could be attributed to:(i)
embedded Pd NPs were protected from the corrosion, (ii) nanoconfinement effects, (iii) and more
defects/active centers on the Pd NPs due to a restriction of growth in the confined space.
250 300 350 400 450 500
0.0
0.2
0.4
0.6
0.8
1.0
1.2
1.4
60 min
0
Ab
so
rba
nc
e
Wavelength(nm)
250 300 350 400 450 500
0.0
0.2
0.4
0.6
0.8
1.0
1.2
1.4
90 mins
0
Ab
so
rba
nc
e
Wavelength(nm)

Chapter 5
140
Figure 5.10 The kinetic rate profile showing variation ofln [A]t/[A]0 vs. time in the reduction of p-
nitrophenol to p-aminophenol with hydrazine at room temp.
The catalytic activities of Pd NPs synthesized in this work were compared with Ag and Au NPs
reported in the literature towards the PNP reduction. From Table 5.3, it is seen that catalytic
activity (ki) of Fiber@Pd is in comparable with the values reported in the literature in the reduction
of PNP with borohydride. However, the catalytic activity in the later stage (kl) was considerably
higher than those listed in Table 5.3. It was reported based on the theoretical modeling of binding
of nitrophenolate with surfaces of the coinage metal NPs that Au and Ag NPs would have better
catalytic activity than other coinage metal such as Cu, Pt and Pd (Pozun et al. 2013).

Chapter 5
141
Table 5.3 Comparison of the catalytic activity of Fiber@Pd in the reduction of p-nitrophenol with
borohydride at room temp. with the catalytic activities of Pd, Au and Ag NPs reported in literature
under similar conditions.
Catalyst k
(x 10-3 s-1)
Catalytic
activity
(s-1g-1)
Ref.
Biogenic Ag 4.06 - Gangula et al. 2011
Biogenic Au 9.19 - Gangula et al. 2011
Ag/C 1.69 1.69 Tang et al. 2010
Ag NPs aggregate 2.10 2.00 Liu at al. 2013
Ag NPs coral like dendrite 5.19 1.30 Rashid and Mandal. 2007
Ag NPs banana leaf like
dendrite
1.65 0.41 Rashid and Mandal. 2007
Capped Ag NPs 0.36 0.09 Rashid and Mandal. 2007
Au NPs in Amyloid -
Carbon hybrid membrane
0.03 - Bolisetty and Mezzenga. 2016
Pd NPs in grafted
membrane
- 3.6 Emin et al. 2014
Fiber@Pd ki=1.83
kl=9.67
1.54
8.41
This work
To check the shelf-life of the Pd NPs on the fibers mat, the Fiber@Pd stored for 3-4 months and
then tested its catalytic activity, it was observed no deterioration in the catalytic activity. However,

Chapter 5
142
the catalytic activity of Fiber@Pd decreased on successive reuses in the reduction of PNP with
borohydride as well as hydrazine as shown in Figure. 5.11. As no Pd losses from the microfibers
were observed, the reduction of catalytic activity of Pd NPs was attributed to the poisoning of their
surfaces by hydrogen sorption produced during reduction process.
(a) (b)
Figure 5.11 The kinetic rate profiles showing variations of ln [A]t/[A]0 vs. time in the reductions
of p-nitrophenol to p-aminophenol with borohydride (a) and hydrazine (b) at room temperature in
recycles of catalyst Fiber@Pd.
5.4 Conclusions
A new method has been developed in the present work to form the dual functional high surface
area polymer scaffold on the porous electrospun PES fibers for hosting Pd nanocatalysts, which
may find extensive applications as the heterogeneous catalysts. This is similar to that reported in
chapter 4. The synthesis of this polymer scaffold involves grafting of reducing agent hydrazine on
the porous surface of electrospun PES microfibers mat. Thus formed polymer scaffold reduces
Pd2+ ions readily and provide support for nucleation and growth of Pd NPs. The Pd NPs on
electrospun PES microfibers mat exhibit higher catalytic activity in the inorganic ion reductions
(UVI and CrVI with formic acid) and organic reduction (PNP with borohydride and hydrazine). The
0 2 4 6 8 10 12 14 16 18 20 22 24
-3.5
-3.0
-2.5
-2.0
-1.5
-1.0
-0.5
0.0
ln A
t/A0
Time(min)
I cycle
V cycle
0 5 10 15 20 25 30
-3.0
-2.5
-2.0
-1.5
-1.0
-0.5
0.0
ln A
t/A0
Time(min)
II cycle
I cycle

Chapter 5
143
reduction rate profiles of PNP with borohydride and hydrazine revealed two reduction kinetics i.e.
initially slower reduction which was accelerated significantly during later stage of the reduction.
This was attributed to remarkable higher catalytic activity of the Pd NPs embedded at interior
matrix of the grafted electrospun microfiber. The studies carried out in the present work seems to
suggest that the heterogeneous nanocatalyst based on the Pd NPs embedded electrospun PES
microfibers mat is recyclable and efficient in catalyzing the inorganic and organic redox reactions.
However, the catalytic activity of Pd NPs loaded membrane described in chapter 4 was better than
that obtained with the Pd NPs embedded microfibers mat. This could be related to dense grafting
on microfibers that retarded the accessibility to Pd NPs embedded in the interior matrix.
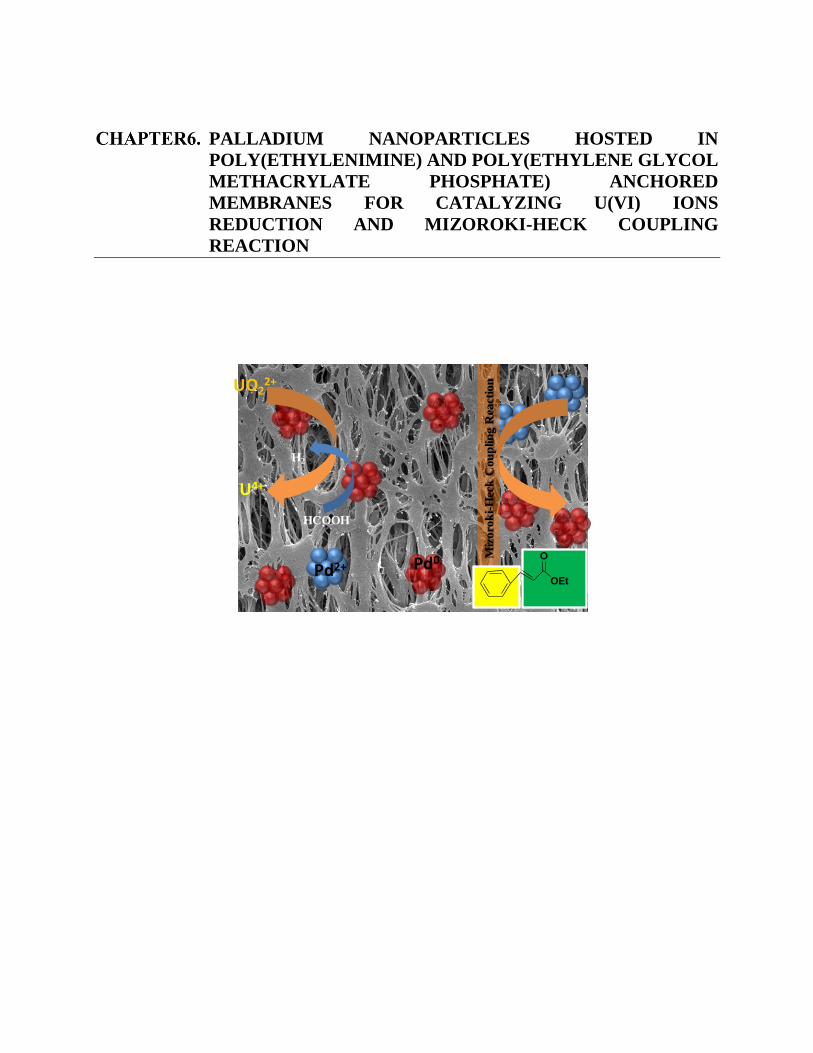
PALLADIUM NANOPARTICLES HOSTED IN
POLY(ETHYLENIMINE) AND POLY(ETHYLENE GLYCOL
METHACRYLATE PHOSPHATE) ANCHORED
MEMBRANES FOR CATALYZING U(VI) IONS
REDUCTION AND MIZOROKI-HECK COUPLING
REACTION
Miz
oro
ki-
Hec
k C
ou
plin
g R
eact
ionUO2
2+
U4+
Pd2+ Pd0
OEt
O
HCOOH
H2

Chapter 6
145
6.1 Introduction
In general, the physical instability of NPs could be avoided by using appropriate surfactants during
NPs syntheses (Drinkel et al. 2014; Xu et al. 2017; Mirzaei et al. 2017; Tejamaya et al. 2012).
However, these NPs suspended in colloidal solutions are difficult to handle/withdraw, and also
surfactants coatings on NPs may block the catalytic sites. This would lead to slower reaction
kinetics by hindering the interaction of reactants with the catalyst surface. These problems can be
addressed by immobilizing the NPs on insoluble solid supports such as synthetic polymer
membrane as given in Chapter 3, 4 and 5, silica (SiO2) (Boudjahem et al. 2010; Tyumentsev et al.
2014; Boltoeva et al. 2008), alumina (Al2O3) (Li et al. 2013), carbon nanomaterials (carbon
nanotubes, grapheme oxide) (Krittayavathananon et al. 2014; Huang et al. 2014),
superparamagnetic materials (Fe3O4) (Gawande et al. 2013; Sobhani and Pakdin-Parizi 2014) etc.
Among the solid supports, the porous polymeric membrane provides not only better physical and
chemical stability but also high accessibility of the NPs to reactants. It is also possible to tune the
size and shape of the NPs and have added advantage of ease of handling/withdrawing for recycling.
However, the major issue is uniform distribution of NPs across the thickness of the pristine
polymeric membrane. Therefore, these polymer supports need to be functionalized for uniform
formation of NPs at interior matrix and loading high amount of NPs without compromising
physical and chemical stability. The charge (cationic/anionic) on the membrane is also important
for mass transfer of reactants to the membrane phase embedded with NPs, and some cases
adversely affect the interactions of reactants with the surface of NPs. It has been reported that the
neutral weak basic (no ion-exchange sites) membrane not only provides the optimum interactions
with the nanocatalyst but also holds high amount of the metal NPs (Chapter 4&5).

Chapter 6
146
Among the noble metals, palladium (Pd) NPs has been studied extensively as a prime catalyst for
the applications in industrial and biological important coupling reactions involving carbon-carbon
and carbon-heteroatom coupling reactions (Narayanan 2010; Cheong et al. 2010), remediation of
toxic ions including nitrite reduction (Dodouche and Epron 2007), reduction of Cr2O72-/CrO4
2-
anions to Cr3+ ions (Yadav and Xu 2013), and reduction of UO22+ to U4+ ions (Chapter 4 & 5)
having applications in nuclear industries. Palladium and Pd NPs supported on solid matrices
(heterogeneous) have been extensively used in many organic coupling reactions (Nabid et al. 2011;
Sobhani and Pakdin-Parizi 2014) and inorganic transformations, and exhibit better catalytic
activity compare to their traditional homogeneous analogues such as Pd(OAc)2 and PdCl2. The
palladium catalyzed Mizoroki–Heck reaction was most explored C-C bond coupling reaction
industrially, provides efficient route for the vinylation of aryl/vinyl halides or triflates. The most
studied soluble phosphine complexes are difficult to separate and also these are expensive,
sensitive to air and moisture, and toxic in nature (Cho and Shaughnessy 2011).
In the present work, the microporous poly(propylene) (PP) membrane functionalized with
poly(ethylenimine) (PEI) and poly(ethylene glycol methacrylate phosphate) (poly(EGMP)) have
been synthesized to host the Pd NPs. The membranes have been formed by in situ UV-initiator
induced polymerization in the pores of host PP membranes. Thus formed membranes have been
characterized for size distribution of Pd NPs, loading capacity toward Pd0, physical structures, and
Pd elemental mapping across the membrane. These characterized membranes have been studied
for their catalytic activities in the representative inorganic reduction (UO22+ to U4+) and Mizoroki-
Heck coupling reaction between iodobenzene and ethy acrylate. This reaction has been studied in
the presence of Pd0 (Pd NPs) or Pd2+ (palladium salt) loaded PEI/poly(EGMP)-membranes with

Chapter 6
147
and without triethylamine at 100 0C. The change in oxidation state of Pd2+ to Pd0 during reaction
has been monitored by X-ray photoelectron spectroscopy (XPS).
6.2 Experimental
Details of materials and reagents used are given in chapter 2.
6.2.1 Synthesis of Pd NPs on polyethylenimine (PEI) anchored membrane
The PEI functionalized membrane was prepared by UV-light induced in situ polymerization of
monomers in pores of the host PP membrane matrix under the optimized conditions based on our
previous work. UV-polymerization was carried out in a photoreactor described in the experimental
section. The pore-filling polymerizing solution was prepared by dissolving different amounts of
monomer GMA (1.5, 0.75, 0.5, and 0.2g) in a 3 mL DMF solvent along with 5 mol% cross-linker
(EGDM) and 2 wt% UV-initiator (DMPA). To homogenize, the polymerizing solution was
sonicated for 15 min. The PP membranes having dimensions of 55 cm2 area were first soaked in
methanol and then immersed for 6 h in polymerizing solution. After pore-filling, the excess
solution adhering on host PP membrane was removed gently and the pore-filled membranes were
sandwiched between two Garware polyester sheets and irradiated with 365 nm light in a
photoreactor for a period of 20 min. After UV irradiation, the membrane samples were washed
thoroughly with DMF to remove the un-polymerized components. This washing was continued till
constant weights were obtained.
The poly(GMA)-anchored membrane samples were reacted with a 10 (w/v %) solution of PEI in
DMF at 60℃ for a period of 4h to anchor PEI (Mn=10,000, branched polymer) by opening epoxy
ring of GMA units. The constant temperature was maintained by using water bath. The membrane
samples were washed extensively with water after chemical treatment and dried at 45℃ under
Chapter 6
148
vacuum condition. Then these PEI anchored membranes were equilibrated with the solutions
containing 0.01 mol L−1 PdCl2 at pH = 2 for 12 h. After loading with Pd2+ ions, the membranes
were washed several times with de-ionized water and reduced with 0.05 mol L−1 NaBH4 solution,
washed and dried for further use.
6.2.2 Synthesis of Pd NPs in poly(ethylene glycol methacrylate phosphate) (EGMP)
anchored membrane
Similar to the PEI functionalized membrane, a phosphate-anchored membrane was prepared by
polymerizing monomer ethylene glycol methacrylate phosphate (EGMP) dissolved in DMF
solvent along with 5 mol% cross-linker (EGDM) and 2 wt% UV-initiator (DMPA) in pores of the
host PP membrane using similar conditions. After anchoring cross-linked poly(EGMP), the
membrane was conditioned in 0.1 mol L-1 NaCl solution for 24 h, and then equilibrated with 0.01
mol L-1 PdCl2 solution to load Pd2+ ions by ion-exchange. These Pd2+ loaded poly(EGMP)-
membrane samples were reduced to Pd0 with 0.05 mol L-1 sodium borohydride (NaBH4) as
described above for the PEI-membrane.
6.2.3 Characterizations of membranes
The loading capacities of these functionalized membranes toward Pd0 were determined by ICP-
AES. For this, the known dimension (2×1 cm2) and weight of the Pd0-loaded membranes were
leached completely in aqua-regia solution for overnight. To confirm the complete leaching, the
membrane samples were analyzed by EDXRF for residual Pd content, if any. After complete
leaching, the liquor was evaporated and re-dissolved in 10 mL of 0.1 mol L−1 HNO3. These re-
dissolved solutions were subjected to ICP-AES analyses to determine Pd concentration and were
used to calculate the amount of Pd content loaded in the membrane sample. The ICP-AES analyses

Chapter 6
149
were done using high resolution simultaneous atomic emission spectrometer (Spectro Arcos,
Germany). The details of the instrument and procedures were discussed in Chapter 2.
The porosity of the PEI functionalized membranes along with pristine PP membranes were
measured by using wetting “porefil” liquid. The void volume/porosity was measured by using the
fallowing equation.
Void Volume = (𝒘𝒍−𝒘𝒅)
𝝆𝒍𝑽𝒎 x 100 (1)
Where wl, wd, l and vm were weight of porefil liquid wetted membrane sample, weight of the dry
membrane, density of porefil liquid, and volume of the membrane sample, respectively. The
procedures for obtaining these values were described in Chapter 4 in detail. The pore size
distributions of the PEI and EGMP functionalized PP membranes were also measured by capillary
flow porometry (CFP) using porefil liquid as described in chapter 2.
The ionic state of palladium was measured by using X-ray Photoelectron Spectroscopy (XPS). The
XPS analysis was carried out using Mg K (1253.6 eV) X-ray source and a DESA-150 electron
analyzer (M/s. Staib Instuments, Germany). The binding energy scale was calibrated to Au-4f7/2
line of 83.95 eV. The XPS spectra are fitted using XPSPEAK41 software and elements chemical
states were obtained by the binding energies from the literature. FE-SEM image analysis was done
to know the surface morphology of the pristine, PEI functionalized and EGMP functionalized PP
membranes. The elemental mappings of Pd across the cross-section and surface were carried out
by energy dispersive spectroscopy (EDS). The size distribution of Pd NPs formed in the PEI-
functionalized membrane was analyzed using Small-Angle X-ray Scattering (SAXS). SAXS
experiments were performed using a laboratory-based SAXS instrument with Cu Kα as probing
radiation. Radial averaged scattering intensity (I(q)) was obtained within a wave vector transfer

Chapter 6
150
q = 4π sin(θ)/λ, where λ is the wavelength and 2θ is the scattering angle) range from ∼0.1 to 2.5
nm-1. The sample to detector distance was nearly 1 m. One dimensional scattering profiles were
obtained through radial averaging of the scattering data. The details of SAXS data analysis are
given in chapter 2.
6.2.4 Mizoroki-Heck coupling reaction
The Pd2+/Pd NPs immobilized on PEI and EGMP functionalized membranes were studied for their
catalytic activities in Mizoroki-Heck coupling reaction. In a typical experiment, 1mmol of
iodobenzene, 1.1 mmol of ethyl acrylate and 3 mmol of triethylamine were added to double
jacketed glass vessel. To this reaction mixture, known weight of the membrane having palladium
catalyst was added and then heated to 100 0C without any solvent for 1h. Due to volatile nature,
the ethyl acrylate was taken in slightly excess to that of iodobenzene in this reaction. The reaction
was tested in the presence of the PEI/poly(EGMP)-membrane containing Pd0 or Pd2+, with and
without external base (triethylamine). The progress of the reaction was monitored by thin-layer
chromatography (TLC). After completion of the reaction, the mixture was cooled to room
temperature and the catalytic membrane was removed, and then the mixture was washed with ethyl
acetate and dried using rotavapor. In the next step, the product and excess (un-reacted)
iodobenzene were separated by column chromatography using 1-10% (v/v %) of ethyl acetate to
hexane mixture. Finally, the product was concentrated by evaporating the solvent and dried for
further characterizations. The final product was characterized by nuclear magnetic resonance
(NMR) spectroscopy and liquid chromatography attached to mass spectrometry (LC-MS). The
recovered catalyst was washed with water and ethanol several times and dried for further use. The
purity and identification of the compounds were carried out using 1H, 13C NMR and HRMS. Based
on NMR the minimum purity of the compound is ~95%. The NMR spectrum was recorded by
Chapter 6
151
using Varian, 500MHz, Inc, USA and the sample was prepared by dissolving 5 mg of product
sample in CDCl3 and transferred into NMR tube. The LC-MS spectrometry was carried out by
using model number 410 Prostar Binary LC with 500 MS IT PDA Detectors supplied by Varian,
Inc. USA.
6.2.5 Reduction of U(VI) ions
The UO22+ions reduction was carried out in a double jacketed glass vessel which was kept at
constant temperature using thermostat bath. The experimental setup is shown in chapter 4. The
reduction was carried out 50℃ by mixing 8 mL of 0.1 mol L−1 UO2(NO3)2 solution at pH = 2 and
8 mL of 1 mol L−1 formic acid in a beaker. The known weights of Pd NPs loaded membranes were
immersed in to the reaction vessel after attaining desired temperatures. The immersion time was
taken as start time. The UV–Vis spectra showed no reduction of UO22+ ions without catalyst and
also with catalyst at room temp. The reduction of UO22+ions was monitored time to time by taking
1 mL aliquot from the reaction solution at a fixed time interval, and UV–Vis spectra of these
samples were recorded after diluting this to 3 mL by adding pH = 2 solution.
To study the reduction kinetics, the most intense peak of U4+ ion at 665 nm was used and calibrated
by measuring the U4+ ions concentration by electro-analysis. To prevent back oxidation of U4+ ions
to UO22+ ions during long storage, the solution was kept in a freezer and UV-Vis spectra was
monitored again to ensure the extent of oxidation of U4+ ions. The detailed electro-analysis is
discussed in chapter 4.
6.3 Results and discussion
The PEI-functionalized membrane is a neutral membrane with weak basic amine groups. It is
known that weak basic amine groups play an important role in many catalyzed reactions such

Chapter 6
152
Mizoroki-Heck coupling reactions. Apart from chemical composition, the physical architecture of
host substrate is also important for providing accessibility to Pd nanocatalysts embedded at interior
matrix. Therefore, the microporous membrane was selected to host the Pd NPs in weak basic local
environment. Also, the amine groups in PEI have strong coordination towards Pd2+ ions, which
would result to high amount of Pd2+ ions loading. The Pd NPs have been formed by reducing the
Pd2+ ions loaded PEI membrane with sodium borohydride aqueous solution. The detailed
mechanism involved in the formation of Pd NPs on the membrane is given in Scheme 6.1.
Scheme 6.1 Chemical modifications involved in formation of Pd NPs on the PEI anchored PP
membrane.
The anchoring of PEI was likely to affect the porous network of the membrane. To control the
porosity, the anchoring of the precursor poly(GMA) was controlled by varying its concentration
in the polymerizing solution filled in the pores of the membranes. Thus formed membranes were
characterized for their porosity and pore-size distributions by using capillary flow porometry
O
O
O
H2NN
NH
NN
NH2
HN
NH2
NNH2H2N
HN NH2
O
O
HO NNH
NN
NH2
HN
NH2
NNH2H2N
HN NH2
NH2
O
O
HO NNH
NN
NH2
HN
NH2
NNH2H2N
HN NH2
NH2
O
O
HO NNH
NN
NH2
HN
NH2
NNH2H2N
HN NH2
NH2
Glycidyl methacrylate Polyethylenimine (PEI)
+DMF, 650C
0.01M PdCl2 Soln
0.01M NaBH4 Soln
Pd2+Pd0
n n
nn

Chapter 6
153
(CFP). The variation of % mass-gain, porosity and percentage of water uptake of thus formed
membranes are given in Table 6.1. To compare the catalytic activity in acidic complexing
environment, the acidic phosphate bearing membrane was also prepared by anchoring
poly(EGMP) in the same host PP membrane.
Table 6.1The comparisons of the amount of polymer anchored, percentage of water uptake
(hydrophilicity) and amount of Pd0 loading in PEI and poly(EGMP) anchored PP membranes.
It is seen from Table 6.1 that the amount of Pd NPs loading on to the PEI functionalized membrane
was higher than self-reducing membranes given in the previous chapters. As shown in Table 6.1,
the Pd0 saturation loading capacity of the membrane increased with the increasing the monomer
GMA concentration in the polymerizing solution, which provide precursor epoxy groups to link
PEI. Depending on the mass gain of the membranes by GMA and PEI, membranes are denoted as
PP1, PP2, PP3, and PP4 as given in Table 1 (PP1 to PP4 decreasing in mass gain). The void volume
of the membrane decreased with the increase in percentage of polymer anchored in the membrane.
Pristine PP membrane was having void volume of 83 (v/v%). While, the higher percentage of
polymer fillings in both PP1 and poly(EGMP) membranes resulted to almost non-porous physical
architecture having void volume of <6 (v/v%), see Table 6.1. Similarly, the water uptakes of the
membranes were decreased with the increasing in the pore-filling percentage. The change in
Membrane Type Amount of Monomer Pore-filling (wt%)
Water Uptake (wt%)
Pd Loading Capacity (mg g - 1 )
Porosity (%)
PP1 1.5g (GMA) 240 10 40 2 350 5 < 6
PP2 0.75g ( GMA) 91 5 114 5 162 5 45
PP3 0.5g (GMA) 23 3 168 5 64 2 72
PP4 0.2g (GMA) 12 3 214 5 31 2 78
Poly(EGMP) 1.5g (EGMP) 200 10 35 2 14 2 < 6
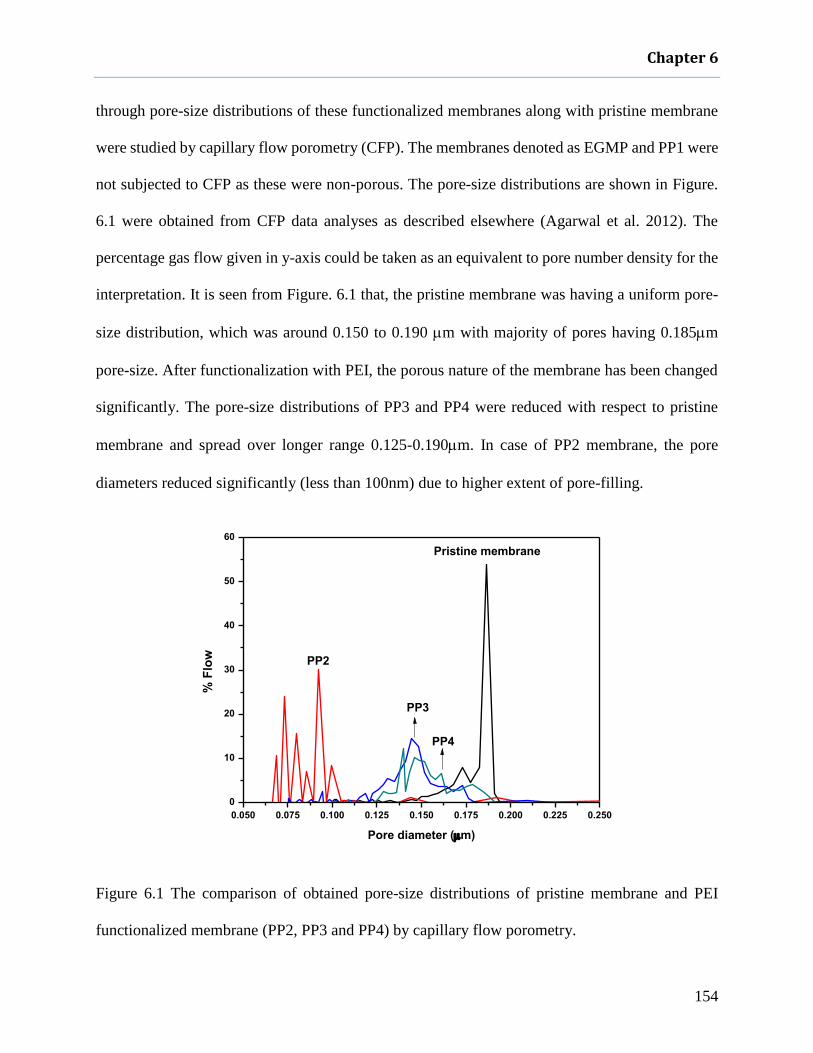
Chapter 6
154
through pore-size distributions of these functionalized membranes along with pristine membrane
were studied by capillary flow porometry (CFP). The membranes denoted as EGMP and PP1 were
not subjected to CFP as these were non-porous. The pore-size distributions are shown in Figure.
6.1 were obtained from CFP data analyses as described elsewhere (Agarwal et al. 2012). The
percentage gas flow given in y-axis could be taken as an equivalent to pore number density for the
interpretation. It is seen from Figure. 6.1 that, the pristine membrane was having a uniform pore-
size distribution, which was around 0.150 to 0.190 m with majority of pores having 0.185m
pore-size. After functionalization with PEI, the porous nature of the membrane has been changed
significantly. The pore-size distributions of PP3 and PP4 were reduced with respect to pristine
membrane and spread over longer range 0.125-0.190m. In case of PP2 membrane, the pore
diameters reduced significantly (less than 100nm) due to higher extent of pore-filling.
Figure 6.1 The comparison of obtained pore-size distributions of pristine membrane and PEI
functionalized membrane (PP2, PP3 and PP4) by capillary flow porometry.
0.050 0.075 0.100 0.125 0.150 0.175 0.200 0.225 0.250
0
10
20
30
40
50
60
PP4
% F
low
Pore diameter (m)
Pristine membrane
PP2
PP3

Chapter 6
155
The physical architectures of the membranes formed by varying the amount of polymer on the
membrane are shown in Figure 6.2.
(a) (b)
(c) (d)
(e) (f)
Figure 6.2 A representative SEM images of the PP membranes anchored with different amounts
of polymer PP2 (a & b), PP3 (c & d) and PP4 (e & f), respectively, under two different
magnifications.

Chapter 6
156
As the amount of polymer pore-filling in the membrane increased, the porosity decreased
accordingly. It is clear from Figure. 6.2 that the SEM images for PP2 (a & b) are denser than that
for PP3 (c & d), whereas the images for PP4 (e & f) seems to have the similar physical architecture.
These results are in agreement with the void volume data given in Table 6.1 and through pore size
distribution shown in Figure 6.1. The uniform distribution of Pd NPs formed on the membrane
PP2 by EDS elemental mapping given in Figure 6.3.
(a) (b)
(c)
Figure 6.3 The representative SEM image of the Pd NPs formed on the PP2 membrane (a), and
corresponding elemental mappings of nitrogen (b) and Pd (c) by EDS.
The surface morphology of Pd NPs embedded densely filled PP1 membrane was also analyzed by
FE-SEM imaging. As shown in Figure 6.4, the membrane having fibrous interior and dense at the
surface is because of the change in physical structure during drying that resulted to formation of
dense surface and fibrous interior. From the SEM images shown in Figure. 6.4, the Pd NPs formed

Chapter 6
157
in the membrane were not visible indicating very small size. However, the resolution of FE-SEM
images could not be improved further due to charging of non-conductive polymer matrix.
(a) (b)
Figure 6.4 The surface morphology of Pd NPs embedded membrane (PP1) (a) and cross-sectional
image of the same membrane (b) under same magnification.
The small angle X-ray scattering (SAXS) experiments and EDS elemental mappings of the
membrane samples were carried out. The scattering contribution of the PEI anchored (denoted as
PP1 blank), Pd2+ ions loaded, and Pd NPs loaded membranes were plotted and the scattering
contributions from blank membrane was subtracted from Pd NPs embedded membrane as shown
in Figure 6.5 (a)&(b). Poly-disperse spherical particle model, assuming a standard lognormal size
distribution of the particles, was fitted to the data using non-linear least square. A Porod type (q-4)
of scattering contribution, arising from larger length scale (probably the agglomerates), was also
considered to explain the increasing trend of intensity in low q regime. The size distributions of
the Pd NPs formed in the membrane is shown in Figure 6.6. It is evident from size distribution of
Pd NPs shown in Figure 6.6, that the very small diameter Pd NPs (2 nm) were formed with slight
right side tailing in Pd NPs’ size distribution extending up to 6 nm and also from Figure 6.5(a) it
was observed that, there is a small scattering contribution from the Pd2+ ions loaded membrane

Chapter 6
158
this may due to a small amount of Pd2+ ions getting reduced by PEI, and size of it was similar to
PP3 membrane but number of particles are less. The reduction of Pd2+ ions with PEI without
reducing agent was also confirmed by XPS. Similarly, the size distributions of Pd NPs on PP3 and
PP4 were analyzed by SAXS. Unlike the Pd NPS on PP1 membrane, the size distributions were
found to be two types of distributions. For PP3 membrane, the average radius distribution was 1.18
and 7.58nm (shown Figure 6.6(b)) and for PP4 membrane 1.36 and 12.03nm (shown Figure 6.6(c))
with standard deviation of 0.05nm. It was observed size of the NPs decreased with the increase in
the amount of PEI. This may due to more number of nuclei formed in a short period of time (due
to high amount of PEI) fallowed by growth without additional nucleation. In addition to smaller
NPs bigger NPs also formed but number is less comparatively.
(a) 0.1 1
10-3
10-2
10-1
100
101
102
103
PP1 Blank
PP1 @ Pd2+
ions loaded
PP1@Pd NPs loaded
Inte
ns
ity
(a
rb. u
nit
)
q (nm-1) (b)
0.1 1
10-1
100
101
102 Contribution from Nps
Fit
Inte
ns
ity
(a
rb. u
nit
)
q (nm-1)
Median=2.06 nm
Polydispersity index=0.47
Figure 6.5 (a) Scattering profile from blank membrane, Pd2+ ions loaded and Pd NPs loaded
membrane, (b) Scattering contribution solely from the nanoparticles as obtained from the
subtraction of scattering profile of blank and Pd2+ ions loaded membrane.

Chapter 6
159
(a)
(b)
(c)
Figure 6.6. Size distribution of the Pd NPs in the PEI-membrane PP1 (a), PP3 (b), and PP4
(c) as obtained from the SAXS data analysis.
0 2 4 6 8 10 12 14 16 18 20 22 24 26
0.0
0.2
0.4
0.6
0.8
1.0
1.2
Siz
e D
istr
ibu
tio
n (
arb
. u
nit
)
Radius (nm)
0 2 4 6 8 10 12 14 16 18 20 22 24 26
0.0
0.2
0.4
0.6
0.8
1.0
1.2
0 2 4 6 8 10 12 14 16 18 20 22 24 26
0.000
0.005
0.010
0.015
0.020
0.025
0.030
Siz
e d
istr
ibution (arb
.unit)
Radius (nm)
Radius (nm)
Siz
e d
istr
ibu
tio
n (
arb
.un
it)
0 2 4 6 8 10 12 14 16 18 20 22 24 26
0.0
0.2
0.4
0.6
0.8
1.0
1.2
0 2 4 6 8 10 12 14 16 18 20 22 24 26
0.000
0.005
0.010
0.015
0.020
0.025
0.030
Siz
e d
istr
ibution (arb
.unit)
Radius (nm)
Siz
e d
istr
ibu
tio
n (
arb
.un
it)
Radius (nm)

Chapter 6
160
From EDS analysis, the N and Pd elemental mappings across PP1 membrane sample given in
Figure 6.7. The uniform N and Pd distribution along cross-section of the elemental mapping
suggested a uniform anchoring of PEI across the membrane.
(a) (b)
Figure 6.7 The EDS elemental mappings of nitrogen (a), palladium (b) across the cross-section of
the PP1 membrane.
In addition to the PEI anchored membrane, acidic phosphate bearing cation-exchange membrane
was also prepared by anchoring poly(EGMP) in the same PP host matrix as described in the
experimental section. As shown in Table 6.1, the saturation loading capacity of this cation-
exchange membrane towards Pd0 was found to be 142 mg g-1, which was much lesser than the
Pd0 loading capacity of the PEI-functionalized membrane. During reduction of Pd2+ ions to Pd0,
there might be substantial loss of palladium before locking as NPs in the poly(EGMP) membrane
matrix. The formation of Pd NPs in the poly(EGMP) membrane is shown in Scheme 6.2.

Chapter 6
161
Scheme 6.2 Formation of Pd NPs in the poly(EGMP)-membrane.
The physical architecture of the poly(EGMP) membrane was dense due to high amount of polymer
content. The elemental distribution of this membrane was found to be uniform by EDS mapping.
The surface morphology and EDS elemental mapping was shown in Figure 6.8.
(a) (b)
(c) (d)
Figure 6.8 Representative FE-SEM images of surface (a & b) and corresponding elemental
mappings of phosphorus (c) and palladium (d) by EDS of poly(EGMP)- membrane.
OO
O O
O O
P PHO
HOOH
OO
HO
OO
O O
O O
P P-O
-OO-
OO
-O
OO
O O
O O
P PO-
O- O-
OO
O-
Pd2+Pd2+
Pd0
Pd0
Pd2+
Ion-exchange
NaBH4
Reduction

Chapter 6
162
6.3.1 Catalytic activities of Pd NPs embedded PEI and poly(EGMP) in U(VI) ions reduction
The conversion of UO22+ to U4+ was used to test the catalytic activities of the Pd NPs embedded
in PEI and EGMP anchored membranes. The reaction was carried out in the presence of Pd NPs
at 50℃ using formic acid as a source of reducing agent as described in the previous chapter. The
in situ generated H2 gas during decomposition of formic acid on the Pd NPs surface used as
electron source for reducing the UO22+ ions. Because of high activation barrier the reduction of
UO22+ ions (As described in Chapter 5), was found to be not successful in the absence of Pd catalyst
or with catalyst at room temp.
If decomposition of formic acid on Pd NPs surface fallows dehydration process, the released CO
gas gets adsorbed on to Pd surface and subsequently makes the catalyst inactive. Among the noble
metals Pd has strong adsorption tendency towards CO. For noble metals, the adsorption trend
towards CO fallows as Pd > Cu > Ag > Au (Abild-Pedersen and Andersson 2007). Therefore, one
way to avoid CO adsorption is to synthesize Pd core shell nanoparticles with Ag, Au and Cu. Since
Ag, Cu and Au did not have strong adsorption towards CO, so the occupied active sites are released
due to desorption of CO from the Pd surface. However, controlled synthesis of core shell
nanoparticles is not an easy process. Another way to avoid this complicated process is formation
of Pd NPs in weak basic groups containing platform for the formic acid decomposition (Mori et
al. 2013). By using basic groups, the decomposition process occurs preferentially through
dehydrogenation. A cooperative action between active Pd NPs and weakly basic groups (–NR2) of
the membrane platform could play an important role in achieving efficient catalytic performance.
Firstly, the basic groups (-NR2) de-protonate the formic acid (acts as a proton scavenger) and forms
Pd-formate complex which subsequently undergoes -hydride elimination to produce CO2 and
palladium hydride species. The reaction of hydride species with –+HN(R2) produce molecular

Chapter 6
163
hydrogen along with regeneration of the Pd0 species. In this work, this strategy was adapted by
forming Pd NPs in the PEI-functionalized membrane. To compare the enhancement in the
reduction, Pd NPs embedded in the poly(EGMP) anchored membrane was also prepared.
The UO22+ ions reduction reaction was analyzed by monitoring the conc. of U4+ ions as a function
of reduction time. The reduction profiles of Pd embedded PP membranes plotted with
ln[U(VI)t/U(VI )o] as a function of reduction time found to be linear in the presence of excess of
formic acid concentration as expected from first-order kinetic equation given below and could be
used for the comparison.
ln[U(VI)]t
[U(VI)]0=−kt
Where [U(VI)]t and [U(VI)]o represent conc. of UO22+ ions at time t and initial respectively, t is
reduction time, and k is apparent first-order reduction rate constant. As k is dependent on the
amount of Pd catalyst, the values of k were normalized with the amount of Pd0 to obtain catalytic
activity (s−1g−1) for studying the effect of variables involved in the reduction of UO22+ions with
formic acid. The successive UV-Vis spectra of UO22+ions reduction with Pd NPs embedded PP3
membrane and its first order kinetic fitting graphs are given Figure. 6.8. In the absence of catalyst
the reaction did not proceede under similar conditions for 2h, as observed from the successive UV-
Vis spectra are shown in Figure 6.9(c).
The comparisons of catalytic activities towards UO22+ ions reduction of Pd NPs embedded
membranes are given Table 6.2. It is clear from Table 6.2 that the catalytic activity increased with
increase in the porosity of the membrane for the same amount Pd under similar experimental
conditions. Even though the porosity of the PP3 and PP4 membrane were almost same, there was
significant difference in the catalytic activity with same Pd amount. This was mainly due to

Chapter 6
164
difference in the amount of PEI in \ membrane i.e. higher formic acid decomposition with higher
PEI content in the membrane leading to higher catalytic activity. In case of PP1 membrane, even
though PEI content was higher, the catalytic activity was not that higher as expected. This could
be due to higher amount of polymer content on PP1 membrane caused diffusion resistance in
catalytic reaction at interior matrix due to restricted accessibility of the Pd NPs embedded in dense
interior matrix.
(a) (b)
(c)
Figure 6.9. UV– Vis spectra showing growth of U(IV) ions absorption peaks (a), variation of
logarithm of [U(VI)]t/[U(VI)]o as a function of reduction time with formic acid in the presence of
Pd NPs embedded PEI (PP3) membrane at 50℃, (b) and no reduction of U(VI) ions with formic
acid in absence of Pd catalyst (c).
400 450 500 550 600 650 700 750
0.0
0.2
0.4
0.6
0.8
1.0
Ab
so
rba
nc
e
Wavelength (nm)
0 90 min
0 10 20 30 40 50 60 70 80 90 100
-4.0
-3.5
-3.0
-2.5
-2.0
-1.5
-1.0
-0.5
0.0
ln[
U(V
I)t / U
(VI)
0]
Time (min)
350 400 450 500 550 600 650 700
0.00
0.02
0.04
0.06
0.08
0.10
0.12
0.14
0.16
Ab
so
rba
nc
e
Wavelength(nm)
0 2h

Chapter 6
165
Table 6.2 The comparisons in catalytic activities of Pd NPs immobilized on PEI functionalized PP
membranes.
It was observed that Pd NPs immobilized in the poly(EGMP) membrane did not show
significant catalytic activity towards UO22+ ions reduction. The conversion was found to be less
than 20-30% even after 2 h. The less efficient reduction could be the preferential binding of UO22+
ions with phosphate group (-RPO32-) on the poly(EGMP) which hindered the interaction with Pd
NPs. The UV- Vis spectra of UO22+ ions reduction in the presence of Pd NPs embedded EGMP
anchored membrane is given in Figure 6.10. As described in the experimental section, the
percentage conversion of UO22+ to U4+ was obtained by measuring the concentration of U4+ ions
in the solution by oxidizing it to UO22+ by electro-analysis.
Substrate Temperature Pd amount
(mg)
K(min-1) K(S-1) Activity (K/Pd)
S-1 g-1
Poly(propylene)
PP1 500C 1.19 -0.005 9.16X10⁻⁵ 0.08
500C 1.82 -0.012 1.95X10⁻⁴ 0.11
PP2 500C 1.13 -0.027 4.48X10⁻⁴ 0.39
PP3 500C 1.03 -0.040 6.76X10⁻⁴ 0.65
PP4 500C 1.04 -0.028 4.66X10⁻⁴ 0.45

Chapter 6
166
Figure 6.10 UV–Vis spectra showing less efficient growth of absorption peaks of U(IV) ions
during reduction of U(VI) ions with formic acid in the presence of Pd NPs immobilized in the
EGMP anchored membrane at 50℃.
6.3.2 Catalytic activities of Pd2+/Pd NPs loaded membranes for Mizoroki-Heck coupling
reaction
Palladium is widely recognized as very important metal among noble metals for catalyzing carbon-
carbon, carbon-heteroatom coupling reactions. Initially, soluble palladium salts such as PdCl2,
Pd(OAc)2 were used in the coupling reactions as a homogeneous catalysts. In 1971, Mizoroki et
al. published a preliminary result for arylation of alkenes by iodobenzene catalyzed by PdCl2 in
the presence of potassium acetate as a base. They found that the Pd0 particles formed in situ in the
reaction acts as active catalyst. Thereafter, the extensive studies had been carried out to understand
the nature of the ligand, the base and the catalyst precursor in Mizoroki-Heck reactions. To
understand the effect of ligand, the reaction was carried out by using Pd(OAc)2 as precursor
without any phosphine ligand which showed the reduction of Pd(OAc)2 to Pd0 in situ by the
reagents used in this coupling reaction. Thus formed Pd0 initiated the catalytic cycle by an
400 450 500 550 600 650 700 750
0.00
0.05
0.10
0.15
0.20
0.25
Ab
so
rba
nc
e
Wavelength (nm)
Initial
1 min
5 min
10 min
15 min
30 min
45 min
60 min
120 min

Chapter 6
167
oxidative addition to the aryl iodide because some of the alkenes proposed by Heck (Heck 1969)
played a role in reducing the palladium acetate. Briefly, the alkene reacted with the acetate in
Pd(OAc)2 by intra-molecular nucleophilic attack followed by a β-hydride elimination leading to
HPdOAc and subsequent formation of Pd0 in the presence of a base (Heck 1969.; Tsuji 1995 and
2012; Kitching et al. 1966). In addition to this, amines used as a base in Mizoroki-Heck coupling
reaction have also been found to reduce Pd(II). Here β-hydride elimination take place in the amine
coordinated to the Pd(II) centre, leading to HPdOAc and then to Pd(0) in the presence of the amine
as reported by Collman 1987. The expected mechanism of formation of Pd NPs from Pd2+ ions by
the PEI-functionalized membrane developed in this work is shown in Scheme 6.3. These
membranes were found to hold high amount of Pd2+ ions and can acts as in situ reducing agent for
conversion of Pd2+ ions Pd0 nanoparticles.
Scheme 6.3 Formation of Pd NPs from Pd2+ ions by the amine groups in the PEI functionalized
membrane.
O
O
HO NNH
NN
NH2
HN
NH2
NNH2H2N
HN NH2
NH2
O
O
HO NNH
NN
NH2
HN
NH2
NNH2H2N
HN NH2
NH2
Pd Cl
Cl
H
O
O
HO NNH
NN
NH2
HN
NH2
NNH2H2N
HN NH2
NH2
+ PdCl2
HPdCl+
HPdCl + Amine Pd0 Amine H+ Cl-+

Chapter 6
168
In the present work, different conditions for Mizoroki-Heck coupling used are listed in Table 6.3.
As shown in Table 6.3, the reaction was found to be successful with both Pd2+ ions and Pd
nanoparticles embedded in EGMP and PEI anchored membranes in the presence of an external
base (triethylamine). However, the reaction was not found to be successful with Pd2+ ions loaded
membrane in the absence of an external base.
Table 6.3 The outcome of Mizoroki-Heck coupling reaction examined in different experimental
conditions. Triethylamine was used as external base.
The reaction was also tried with Pd nanoparticles but in the absence of an external base. In this
case, the reaction was successful to some extent by Pd nanoparticles embedded in the PEI-
membrane but failed with Pd nanoparticles embedded in the poly(EGMP)-membrane. This
suggested that the external base can be avoided by using this amine functionalized membrane with

Chapter 6
169
high concentration of amine groups in the membrane. Also, the yield of the reaction was found to
be higher (76%) in case of the PEI -membranes compared to poly(EGMP)-membrane (62%). This
may due to the amine groups in the PEI-membrane that facilitate the reaction. These yields were
relatively less compared with the literature reported Table 6.4 but in most of these reactions time
consumed for the reaction was very high and needed a solvent. Whereas, in this work the reactions
were found to be completed in 1h time without need of any solvent.
Table 6.4 Comparison of Mizoroki-Heck coupling reaction yield carried out with Pd NPs hosted
in different matrices and conditions.
The formation of Pd nanoparticles was studied by the X-ray photoelectron spectroscopy (XPS)
after completion of the reaction. First, the PEI-membranes were loaded with Pd2+ ions by
equilibrating in PdCl2 solution and subjected to XPS. The deconvoluted XPS spectra reveals that
there are two types of palladium species. The binding energy peaks at 336.9eV (3d5/2) and at 342.3
eV (3d3/2) were corresponded to Pd2+ ions, whereas, the binding energies at 335.9eV (3d5/2) and at
340.9 eV (3d3/2) see Figure 6.11(a). this indicates that a small amounts of Pd2+ ions gets reduced
Catalyst
% Yield Solvent Time References
Pd(II) 45-94 DMF 20h Kantam et al. 2009
Pd Immobilized on
Silica
81-95 DMF 6h Karimi and Enders
2006
Pd/MgLaO 17-95 DMF 10h Cwik et al. 2006
Pd Nanoparticles
Supported on
Polyaniline
67-90 DMF 24h Yu et al. 2015
Pd(OAc)2 68-99 triethanolamine 10h Li and Wang 2006
Pd2+ on PEI 70
No solvent
1h
Present work Pd0 on PEI 76
Pd2+ on EGMP 47
Pd0 on EGMP 62

Chapter 6
170
to Pd NPs in presence of amines groups in PEI. These binding energies matches with the earlier
results (Liu et al. 2015). During the Mizoroki-Heck coupling reaction, the Pd2+ ions were reduced
to Pd NPs by the external base (triethylamine in this work) in addition to Pd NPs, the un-reduced
form of palladium also present (Pd2+ ions) along with the oxidized Pd (PdO2) as shown in the
binding energy spectrum shown in Figure 6.11(b).
(a) (b)
Figure 6.11 Deconvoluted XPS spectra of binding energies peaks of 3d5/2 and 3d3/2 obtained
before using Pd2+ ions loaded PEI-membrane (a), and after coupling reaction (b).
As mentioned in the experimental section, the coupling reaction was carried out between
iodobenzene and ethyl acrylate. The product ethyl cinnamate was characterized by using NMR,
LC-MS and IR spectroscopy. The reaction scheme is given in Scheme 6.4.
Scheme 6.4. Mizoroki-Heck coupling reaction between iodobenzene and ethyl acrylate.
The characteristic signal peaks in 1H and 13C NMR confirms the product formation (given in Figure
6.12). For 1H NMR (500 MHz, CDCl3) the signals observed at δ 7.71-7.68 (d, J = 16 Hz, 1H),
7.53-7.52 (d, 2 H),7.39-7.38 (d,2H), 6.46-6.43 (d, J = 16 Hz, 1H), 4.29-4.25 (q, J = 7.5 Hz,
332 334 336 338 340 342 344 346 348
13600
13800
14000
14200
14400
14600
14800
BE FWHM Area
335.9 1.63 1594
336.9 1.55 1047
340.9 1.33 1153
342.3 1.59 989
Inte
nsity (
cp
s)
Pd-3d5/2 Pd-3d
3/2Pd0
Pd2+
BE (eV)
330 332 334 336 338 340 342 344 346 348
9500
10000
10500
11000
11500
12000
12500
Inte
nsity (
cp
s)
BE (eV)
Pd-3d5/2
Pd-3d3/2Pd
0
BE FWHM Area
335.4 1.64 3815
336.9 1.63 2193
338.0 1.57 2367
340.2 1.52 2454
341.8 1.65 1754
343.2 1.78 1818
Pd2+
PdO2
Pd Nanoparticles
1000C+
lodobenzene Ethyl acrylate Ethyl cinnamate
I
OEt
O
OEt
O

Chapter 6
171
2H),1.36-1.33 (t, J = 7.5 Hz, 3H) and for 13C NMR (126 MHz, CDCl3) δ 167.0,144.6, 134.5, 130.2,
128.9, 128.0, 118.3, 60.5, 14.3. RF: 0.66 ( 10% ethyl acetate +Hexane).HR-MS:177.0876[M+H].
The product ethyl cinnamte was also characterized by the LC-MS. The characteristic peak at
177.0876 (m/z) confirms the product. The LC-MS spectra of ethyl cinnamate given in Figure 6.13.
Figure 6.12 The 1H NMR (a) and 13C NMR spectra of ethyl cinnamate (b).

Chapter 6
172
Figure 6.13 The LC-MS spectra of ethyl cinnamate
The reusability of the catalyst was tested for five consecutive cycles, see Figure 6.14, showed that
there was slightly decrease in the yield. This could be formation of oxidized surface on the Pd NPs
as observed form XPS of the stored Pd NPs embedded PEI membrane.
Figure 6.14 The bar diagram of catalyst (Pd NPs embedded PEI-membrane) cycle with yield (%).
Yie
ld (
%)
Cycle

Chapter 6
173
6.4 Conclusions
The PEI-membrane developed in this work was found to hold higher amount of Pd NPs. The
tertiary, secondary, and primary amine groups of PEI in the membrane was found to be facilitate
the decomposition the formic acid on Pd surface to produce H2, which was used in situ to reduce
UO22+ ions to U4+ ions. The success of Mizoroki-Heck coupling reaction to some extent in the
absence of external base with Pd NPs embedded PEI-membrane showed the possibility of
elimination need of the external base. The effect of porosity of PEI-membrane host on the catalytic
activity of Pd nanoparticles studied in the UO22+ ions reduction with formic acid showed that there
would be an optimum amount of porosity, amine functional groups, and Pd NPs are required for
the efficient reduction of the UO22+ ions to U4+ ions. For comparison, the UO2
2+ ions reduction
was also studied using the Pd NPs immobilized in the poly(EGMP) -membrane. The poly(EGMP)-
membrane hosted Pd nanoparticles were found to be less efficient in reducing UO22+ ions as
compared to Pd NPs hosted in the PEI-membrane. Also, the Pd nanoparticles embedded PEI-
membrane gave better yield (76%) in comparison with the poly(EGMP) membrane (65%) in
Mizoroki-Heck coupling reaction with the same amount of Pd NPs and under similar conditions.
This could be due to the amine groups in the PEI-grafted membrane facilitating the reaction. The
poly(EGMP) anchored membrane can be used as a sorbent for actinides and toxic elements like
arsenic, fluoride ions etc.

SUMMARY AND FUTURE SCOPE

Chapter 7
175
The work carried out in this thesis were aimed to explore some novel routes for the synthesis of
noble metal nanoparticles in the porous polymer scaffolds and evaluate their catalytic activities in
the representative inorganic and organic reductions. These porous polymer scaffolds were neutral
and did not have any functional moieties to host the noble metal nanoparticles. Therefore, these
polymeric materials were appropriately functionalized. These functionalized polymeric host
materials developed in this work could be divided into three parts i.e. (i) self-reducing
membranes/electrospun microfibers, (ii) cation-exchange membranes, and (iii) amine/phosphate-
functionalized membranes. Among these functionalized membranes, the self-reducing membranes
were found to reduce Ag, Au, Pd, Rh, and Ru without need of external reducing agent while,
hydrazine hydrate and sodium borohydride were used as external reducing agents to form
nanoparticles in the cation-exchange and amine/phosphate-functionalized membranes. The
appropriate characterization techniques such as small angel X-ray scattering (SAXS), field
emission electron microscopy (FE-SEM) and elemental mappings by EDAX were used to analyse
the size and morphology of nanoparticles formed in these polymer platforms. The role of charge
on the membrane towards the catalytic activity has been studied. The factors involved in
controlling the particle size and uniform distribution across the entire polymer matrix, matrix effect
on the catalytic activity and how such nanoporous polymer matrix hosted nanoparticles would act
as the catalytic nanoreactor with enhanced activity were studied.
7.1 Summary of the present study and major conclusions
The study involved in the present thesis had focused on two aspects:
(i) Chemical synthesis involved in the formation of noble metal nanoparticles in porous
appropriately functionalized polymer matrices.

Chapter 7
176
(ii) Catalytic applications of the metal nanoparticles hosted in the polymer matrices.
The major conclusions/findings derived from the above mentioned two parts are summarized
below separately.
7.1.1 Chemical synthesis involved in synthesis of noble metal nanoparticles in polymer
matrices
The supported polymer matrices used in the present thesis are poly(propylene) membranes and
poly(ether sulfone) microfiber mats. Based on functionalization, these polymer matrices can be
divided as self-reducing matrices, ion-exchange membranes, and amine/phosphate- functionalized
membranes. The self-reducing membranes developed in this work provided an easy route to host
noble metal nanocatalysts without using any external reducing agents. These membranes mimic
the egg-shell membrane in terms of formation and stabilization of nanoparticles. The membranes
developed in the present work had an asymmetric structure, dense at the surface and fibrous
interior. The nanoparticles formed in the interior of the matrix exhibited remarkable enhancement
in the catalytic activity as compared to surface immobilized nanoparticles. These functionalized
membranes also provided control over nanoparticles growth/size. This could be achieved by
controlling the amount of monomers anchored in the membranes or keeping the functionalized
membranes in a precursor salt solution for a predetermined time.
7.1.2 Catalytic applications of the metal nanoparticles hosted on polymer matrices
The nanocatalysts synthesized on the polymer matrices were evaluated for their catalytic activities
in different inorganic and organic transformations. The redox reactions were divided into two parts
one is involved in organic transformations which included BH4- reduction of methylene blue, p-
nitrophenol (PNP), and Mizoroki-Heck coupling reaction. The reduction of MB and PNP were

Chapter 7
177
used as some model reactions using silver nanoparticles as catalysts. The second one is reduction
of inorganic ions which include (i) reduction of Cr(VI) to Cr(III), and (ii) reduction of U(VI) to
U(IV) using formic acid as reducing agent and palladium nanoparticles as catalyst. In these, the in
situ generated hydrogen gas during the decomposition of formic acid on palladium surface was
used as a electron source. The catalytic activities of these nanocatalysts embedded nanoporous
polymer matrices were found to be significantly higher compared to earlier works reported in the
literature. The higher redox catalytic activity of the nanoparticles in the membrane could be
attributed to (i) high accessibility of NPs to the reactants, (ii) absence of capping that retards the
catalytic activity, and (iii) nanoconfinement effects. These are also related to geometrical
constraints, reduced mixing of reactants and products, sorption of reacting species on the pore-
wall etc. that may accelerate the redox kinetics.
It was observed that, the reduction profile of PNP using palladium nanoparticles embedded
microfibers mat showed two slopes in the kinetic of reductions. This suggested initial slower
reduction process that was accelerated at later stage. The significant increase in the catalytic
activity in the later stage was due to confined growth of nanoparticles leading to more
defects/active centers on the Pd NPs. The palladium nanoparticles embedded on cation exchange
membrane did not show any catalytic activity towards uranyl(VI) ion reduction. This was
attributed to binding of UO22+ions with the fixed negative charge sites (-SO3−) in cation-exchange
matrix which would hinder UO22+ions interactions with Pd NPs required for the reduction with
formic acid.
The Pd nanoparticles embedded PEI-membrane gave better yield (76%) in comparison with the
poly(EGMP) membrane (65%) in Mizoroki-Heck coupling reaction with the same amount of Pd
NPs and under similar conditions. This could be due to the amine groups in the PEI-grafted

Chapter 7
178
membrane facilitating the reaction. The success of Mizoroki-Heck coupling reaction to some
extent in the absence of external base with Pd NPs showed the possibility of elimination need of
the external base.
7.2 Future scope
Synthesis, mechanism of formation, and applications of nanoparticles as catalysts have been
explored worldwide. But, there was not much literature available for the synthetic polymer
membrane and electrospun polymer fibers mat hosted metal nanoparticles as the catalysts.
Therefore, the exceptional catalytic activities of these metal nanoparticles in the confined
nanoprorous matrix remain unexplored. The present thesis aimed to explore the novel ways to
synthesis metal nanoparticles on the polymer matrices which would help in the future studies to
achieve best in the area of nanocatalysts. The work carried out in the present thesis is in its very
early developmental stage in terms of understanding and knowledge. The future studies may
include controlled synthesis of core-shell nanoparticles and study their catalytic properties under
nanoconfined spaces which enables the atomic level interaction and fallowed by characterization
with more advanced techniques. Development of flow through catalytic reactors may also be
carried out in future.

REFERENCES

References
180
A
Abdur-Rashid K, Clapham SE, Hadzovic A, et al (2002) Mechanism of the hydrogenation of
ketones catalyzed by trans-dihydrido (diamine) ruthenium (II) complexes. J Am Chem Soc
124:15104–15118.
Abild-Pedersen F, Andersson MP (2007) CO adsorption energies on metals with correction for
high coordination adsorption sites–A density functional study. Surf Sci 601:1747–1753.
Adewuyi YG (2001) Sonochemistry: Environmental Science and Engineering Applications. Ind
Eng Chem Res 40:4681–4715.
Aditya T, Pal A, Pal T (2015) Nitroarene reduction: a trusted model reaction to test nanoparticle
catalysts. Chem Commun 51:9410–9431.
Adya VC, Sengupta A, Thulasidas SK, Natarajan V (2016) Direct Determination of S and P at
Trace Level in Stainless Steel by CCD-based ICP-AES and EDXRF: A Comparative Study. At
Spectrosc 37:19–24.
Agarwal C, Pandey AK, Chaudhury S, et al (2013) Ionic transport in polyelectrolyte-filled cation-
exchange membranes. J Memb Sci 446:125–131.
Agarwal C, Pandey AK, Das S, et al (2012) Neck-size distributions of through-pores in polymer
membranes. J Memb Sci 415:608–615.
Akiya N, Savage PE (1998) Role of water in formic acid decomposition. AIChE J 44:405–415.
Alonso A, Shafir A, Macanás J, et al (2012) Recyclable polymer-stabilized nanocatalysts with
enhanced accessibility for reactants. Catal today 193:200–206.

References
181
Anton F (1934) Process and apparatus for preparing artificial threads.
Azizian S (2004) Kinetic models of sorption: a theoretical analysis. J Colloid Interface Sci 276:47–
52.
B
Bagchi D, Stohs SJ, Downs BW, et al (2002) Cytotoxicity and oxidative mechanisms of different
forms of chromium. Toxicology 180:5–22.
Baig RBN, Nadagouda MN, Varma RS (2014) Ruthenium on chitosan: a recyclable heterogeneous
catalyst for aqueous hydration of nitriles to amides. Green Chem 16:2122–2127.
Barakat NAM, El-Newehy MH, Yasin AS, et al (2016) Ni&Mn nanoparticles-decorated carbon
nanofibers as effective electrocatalyst for urea oxidation. Appl Catal A Gen 510:180–188.
Baruah B (2016) In situ and facile synthesis of silver nanoparticles on baby wipes and their
applications in catalysis and SERS. RSC Adv 6:5016–5023.
Baruah B, Gabriel GJ, Akbashev MJ, Booher ME (2013) Facile Synthesis of Silver Nanoparticles
Stabilized by Cationic Polynorbornenes and Their Catalytic Activity in 4-Nitrophenol Reduction.
Langmuir 29:4225–4234.
Becker R, Döring W (1935) Kinetische behandlung der keimbildung in übersättigten dämpfen.
Ann Phys 416:719–752.
Bhardwaj N, Kundu SC (2010) Electrospinning: a fascinating fiber fabrication technique.
Biotechnol Adv 28:325–347.
Bolisetty S, Mezzenga R (2016) Amyloid–carbon hybrid membranes for universal water

References
182
purification. Nat Nanotechnol 11:365–371.
Boltoeva MY, Shilov VP, Anan’ev A V (2008) Catalytic reduction of U (VI) with formic acid in
acid solutions on palladium catalysts. Radiochemistry 50:46–51.
Bonggotgetsakul YYN, Cattrall RW, Kolev SD (2015) A method for coating a polymer inclusion
membrane with palladium nanoparticles. React Funct Polym 97:30–36.
Boudjahem A-G, Mokrane T, Redjel A, Bettahar MM (2010) Silica supported nanopalladium
prepared by hydrazine reduction. Comptes Rendus Chim 13:1433–1439.
C
Cai Y, Xu X, Gao C, et al (2012) Structural morphology and thermal performance of composite
phase change materials consisting of capric acid series fatty acid eutectics and electrospun
polyamide6 nanofibers for thermal energy storage. Mater Lett 89:43–46.
Camargo PHC, Rodrigues TS, da Silva AGM, Wang J (2015) Controlled Synthesis: Nucleation
and Growth in Solution. In: Metallic Nanostructures. Springer, pp 49–74.
Cao G (2004) Nanostructures & nanomaterials: synthesis, properties & applications. Imperial
college press.
Chang H, Wu H (2013) Graphene-based nanocomposites: preparation, functionalization, and
energy and environmental applications. Energy Environ Sci 6:3483–3507.
Cheong S, Watt JD, Tilley RD (2010) Shape control of platinum and palladium nanoparticles for
catalysis. Nanoscale 2:2045–2053.
Cho JH, Shaughnessy KH (2011) Aqueous-phase heck coupling of 5-iodouridine and alkenes

References
183
under phosphine-free conditions. Synlett 2011:2963–2966.
Choi B-S (2014) Transformation of CaCO3 to single crystalline micro/nanowires. J Ind Eng Chem
20:96–99.
Chun H-H, Jo W-K (2014) Polymer material-supported titania nanofibers with different
polyvinylpyrrolidone to TiO2 ratios for degradation of vaporous trichloroethylene. J Ind Eng
Chem 20:1010–1015.
Coffey RS (1967) The decomposition of formic acid catalysed by soluble metal complexes. Chem
Commun 923b–924.
Collman JP (1987) Priciples and Applications of Organotransition Metal Chemistry.
Corma A, Garcia H (2008) Supported gold nanoparticles as catalysts for organic reactions. Chem
Soc Rev 37:2096–2126.
Costa M, Klein CB (2006) Toxicity and carcinogenicity of chromium compounds in humans. Crit
Rev Toxicol 36:155–163.
Cwik A, Hell Z, Figueras F (2006) Palladium/Magnesium‐ Lanthanum mixed oxide catalyst in
the Heck reaction. Adv Synth Catal 348:523–530.
D
Dai Y, Formo E, Li H, et al (2016) Surface‐ Functionalized Electrospun Titania Nanofibers for
the Scavenging and Recycling of Precious Metal Ions. ChemSusChem 9:2912–2916.
Dandapat A, Jana D, De G (2011) Pd nanoparticles supported mesoporous γ-Al2O3 film as a
reusable catalyst for reduction of toxic CrVI to CrIII in aqueous solution. Appl Catal A Gen

References
184
396:34–39.
Das S, Pandey AK, Athawale AA, Manchanda VK (2009) Exchanges of uranium (VI) species in
amidoxime-functionalized sorbents. J Phys Chem B 113:6328–6335.
Demir MM, Gulgun MA, Menceloglu YZ, et al (2004) Palladium Nanoparticles by
Electrospinning from Poly(acrylonitrile-co-acrylic acid)−PdCl2 Solutions. Relations between
Preparation Conditions, Particle Size, and Catalytic Activity. Macromolecules 37:1787–1792.
Desforges A, Backov R, Deleuze H, Mondain-Monval O (2005) Generation of Palladium
Nanoparticles within Macrocellular Polymeric Supports: Application to Heterogeneous Catalysis
of the Suzuki–Miyaura Coupling Reaction. Adv Funct Mater 15:1689–1695.
Ding B, Kim H, Kim C, et al (2003) Morphology and crystalline phase study of electrospun TiO2–
SiO2 nanofibres. Nanotechnology 14:532.
Dodouche I, Epron F (2007) Promoting effect of electroactive polymer supports on the catalytic
performances of palladium-based catalysts for nitrite reduction in water. Appl Catal B Environ
76:291–299.
Domènech B, Vigués N, Mas J, et al (2014) Polymer-Metal Nanocomposites Containing Dual-
Function Metal Nanoparticles: Ion-Exchange Materials Modified with Catalytically-Active and
Bactericide Silver Nanoparticles. Solvent Extr Ion Exch 32:301–315.
Drinkel EE, Campedelli RR, Manfredi AM, et al (2014) Zwitterionic-surfactant-stabilized
palladium nanoparticles as catalysts in the hydrogen transfer reductive amination of
benzaldehydes. J Org Chem 79:2574–2579.

References
185
Du F, Wang H, Zhao W, et al (2012) Gradient nanofibrous chitosan/poly ɛ-caprolactone scaffolds
as extracellular microenvironments for vascular tissue engineering. Biomaterials 33:762–770.
E
Edelstein AS, Cammaratra RC (1998) Nanomaterials: synthesis, properties and applications. CRC
press.
Eising R, Elias WC, Albuquerque BL, et al (2014) Synthesis of Silver Glyconanoparticles from
New Sugar-Based Amphiphiles and Their Catalytic Application. Langmuir 30:6011–6020.
Emin C, Remigy J-C, Lahitte J-F (2014) Influence of UV grafting conditions and gel formation on
the loading and stabilization of palladium nanoparticles in photografted polyethersulfone
membrane for catalytic reactions. J Memb Sci 455:55–63.
Esumi K, Isono R, Yoshimura T (2004) Preparation of PAMAM− and PPI− metal (silver,
platinum, and palladium) nanocomposites and their catalytic activities for reduction of 4-
nitrophenol. Langmuir 20:237–243.
Esumi K, Miyamoto K, Yoshimura T (2002) Comparison of PAMAM–Au and PPI–Au
nanocomposites and their catalytic activity for reduction of 4-nitrophenol. J Colloid Interface Sci
254:402–405.
F
Faria VW, Oliveira DGM, Kurz MHS, et al (2014) Palladium nanoparticles supported in a
polymeric membrane: an efficient phosphine-free “green” catalyst for Suzuki-Miyaura reactions
in water. RSC Adv 4:13446–13452.

References
186
Fox AR, Bart SC, Meyer K, Cummins CC (2008) Towards uranium catalysts. Nature 455:341.
Freestone I, Meeks N, Sax M, Higgitt C (2007) The Lycurgus cup—a roman nanotechnology.
Gold Bull 40:270–277.
G
Gaidhani S V, Yeshvekar RK, Shedbalkar UU, et al (2014) Bio-reduction of hexachloroplatinic
acid to platinum nanoparticles employing Acinetobacter calcoaceticus. Process Biochem 49:2313–
2319.
Gangula A, Podila R, Karanam L, et al (2011) Catalytic reduction of 4-nitrophenol using biogenic
gold and silver nanoparticles derived from Breynia rhamnoides. Langmuir 27:15268–15274.
Gao S-T, Liu W, Feng C, et al (2016) A Ag–Pd alloy supported on an amine-functionalized UiO-
66 as an efficient synergetic catalyst for the dehydrogenation of formic acid at room temperature.
Catal Sci Technol 6:869–874.
Gardella L, Basso A, Prato M, Monticelli O (2013) PLA/POSS nanofibers: a novel system for the
immobilization of metal nanoparticles. ACS Appl Mater Interfaces 5:7688–7692.
Gawande MB, Branco PS, Varma RS (2013) Nano-magnetite (Fe3O4) as a support for recyclable
catalysts in the development of sustainable methodologies. Chem Soc Rev 42:3371–3393.
Gawande MB, Rathi AK, Nogueira ID, et al (2013) Magnetite-supported sulfonic acid: a
retrievable nanocatalyst for the Ritter reaction and multicomponent reactions. Green Chem
15:1895–1899.
Ge J, Si Y, Fu F, et al (2013) Amphiphobic fluorinated polyurethane composite microfibrous

References
187
membranes with robust waterproof and breathable performances. Rsc Adv 3:2248–2255.
Geng X, Kwon O-H, Jang J (2005) Electrospinning of chitosan dissolved in concentrated acetic
acid solution. Biomaterials 26:5427–5432.
Ghosh SK, Mandal M, Kundu S, et al (2004) Bimetallic Pt–Ni nanoparticles can catalyze reduction
of aromatic nitro compounds by sodium borohydride in aqueous solution. Appl Catal A Gen
268:61–66.
Goettmann F, Sanchez C (2007) How does confinement affect the catalytic activity of mesoporous
materials? J Mater Chem 17:24–30.
Goia D V, Matijević E (1998) Preparation of monodispersed metal particles. New J Chem
22:1203–1215.
Gong K, Wang W, Yan J, Han Z (2015) Highly reduced molybdophosphate as a noble-metal-free
catalyst for the reduction of chromium using formic acid as a reducing agent. J Mater Chem A
3:6019–6027.
Gralec B, Lewera A (2016) Catalytic activity of unsupported Pd-Pt nanoalloys with low Pt content
towards formic acid oxidation. Appl Catal B Environ 192:304–310.
Greiner A, Wendorff JH (2007) Electrospinning: a fascinating method for the preparation of
ultrathin fibers. Angew Chem Int Ed Engl 46:5670–703.
Guo L, Bai J, Wang J, et al (2015) Fabricating series of controllable-porosity carbon nanofibers-
based palladium nanoparticles catalyst with enhanced performances and reusability. J Mol Catal
A Chem 400:95–103.

References
188
H
Hammer B, Norskov JK (1995) Why gold is the noblest of all the metals. Nature 376:238.
Hammer B, Nørskov JK (1995) Electronic factors determining the reactivity of metal surfaces.
Surf Sci 343:211–220.
Hapiot F, Menuel S, Monflier E (2013) Thermoresponsive Hydrogels in Catalysis. ACS Catal
3:1006–1010.
Hariprasad E, Radhakrishnan TP (2012) Palladium Nanoparticle-Embedded Polymer Thin Film
“Dip Catalyst” for Suzuki–Miyaura Reaction. ACS Catal 2:1179–1186.
Hart A, Omajali JB, Murray AJ, et al (2016) Comparison of the effects of dispersed noble metal
(Pd) biomass supported catalysts with typical hydrogenation (Pd/C, Pd/Al2O3) and hydrotreatment
catalysts (CoMo/Al2O3) for in-situ heavy oil upgrading with Toe-to-Heel Air Injection (THAI).
Fuel 180:367–376.
Hayakawa K, Yoshimura T, Esumi K (2003) Preparation of gold− dendrimer nanocomposites by
laser irradiation and their catalytic reduction of 4-nitrophenol. Langmuir 19:5517–5521.
Heck RF (1969) Mechanism of arylation and carbomethoxylation of olefins with organopalladium
compounds. J Am Chem Soc 91:6707–6714.
Higaki Y, Kabayama H, Tao D, Takahara A (2015) Surface functionalization of electrospun poly
(butylene terephthalate) fibers by surface‐ initiated radical polymerization. Macromol Chem Phys
216:1103–1108.
Hill SP, Winterbottom JM (1988) The conversion of polysaccharides to hydrogen gas. Part I: The

References
189
palladium catalysed decomposition of formic acid/sodium formate solutions. J Chem Technol
Biotechnol 41:121–133.
Hu D, Huang Y, Liu H, et al (2014) The assembly of dendrimer-stabilized gold nanoparticles onto
electrospun polymer nanofibers for catalytic applications. J Mater Chem A 2:2323–2332.
Hu H, Xin JH, Hu H, et al (2015) Synthesis and stabilization of metal nanocatalysts for reduction
reactions - a review. J Mater Chem A 3:11157–11182.
Hu W, Liu B, Wang Q, et al (2013) A magnetic double-shell microsphere as a highly efficient
reusable catalyst for catalytic applications. Chem Commun 49:7596–7598.
Huang J, Wang D, Hou H, You T (2008) Electrospun Palladium Nanoparticle-Loaded Carbon
Nanofibers and Their Electrocatalytic Activities towards Hydrogen Peroxide and NADH. Adv
Funct Mater 18:441–448.
Huang X, Yu H, Tan H, et al (2014) Carbon Nanotube‐ Encapsulated Noble Metal Nanoparticle
Hybrid as a Cathode Material for Li‐ Oxygen Batteries. Adv Funct Mater 24:6516–6523.
Huang Y, Ma H, Wang S, et al (2012) Efficient catalytic reduction of hexavalent chromium using
palladium nanoparticle-immobilized electrospun polymer nanofibers. ACS Appl Mater Interfaces
4:3054–3061.
Huang Z-M, Zhang Y-Z, Kotaki M, Ramakrishna S (2003) A review on polymer nanofibers by
electrospinning and their applications in nanocomposites. Compos Sci Technol 63:2223–2253.
Hunter RJ (2001) Foundations of colloid science. Oxford university press
Hyde JR, Poliakoff M (2004) Supercritical hydrogenation and acid-catalysed reactions “without

References
190
gases.” Chem Commun 1482–1483.
I
Im JS, Park S-J, Kim TJ, et al (2008) The study of controlling pore size on electrospun carbon
nanofibers for hydrogen adsorption. J Colloid Interface Sci 318:42–49.
J
Jiang C, Nie J, Ma G (2016) A polymer/metal core–shell nanofiber membrane by electrospinning
with an electric field, and its application for catalyst support. RSC Adv 6:22996–23007.
Johánek V, Tsud N, Matolın V, Stará I (2001) TPD and XPS study of the CO adsorption on
transition-SP metal systems: Pd and Al. Vacuum 63:15–22.
Judai K, Abbet S, Wörz AS, et al (2003) Interaction of Ag, Rh, and Pd atoms with MgO thin films
studied by the CO probe molecule. J Phys Chem B 107:9377–9387.
Jung J, Park S, Hong S, et al (2014) Synthesis of gold nanoparticles with glycosides: Synthetic
trends based on the structures of glycones and aglycones. Carbohydr Res 386:57–61.
K
Kantam ML, Srinivas P, Yadav J, et al (2009) Trifunctional N, N, O-terdentate amido/pyridyl
carboxylate ligated Pd (II) complexes for Heck and Suzuki reactions. J Org Chem 74:4882–4885.
Kao J, Thorkelsson K, Bai P, et al (2013) Toward functional nanocomposites: taking the best of
nanoparticles, polymers, and small molecules. Chem Soc Rev 42:2654–2678.
Karimi B, Enders D (2006) New N-heterocyclic carbene palladium complex/ionic liquid matrix

References
191
immobilized on silica: Application as recoverable catalyst for the Heck reaction. Org Lett 8:1237–
1240.
Karski S, Witońska I, Rogowski J, Gołuchowska J (2005) Interaction between Pd and Ag on the
surface of silica. J Mol Catal A Chem 240:155–163.
Ke P, Jiao X-N, Ge X-H, et al (2014) From macro to micro: structural biomimetic materials by
electrospinning. RSC Adv 4:39704–39724.
Khajeh M, Dastafkan K (2014) Removal of molybdenum using silver nanoparticles from water
samples: particle swarm optimization–artificial neural network. J Ind Eng Chem 20:3014–3018.
Kikhney AG, Svergun DI (2015) A practical guide to small angle X‐ ray scattering (SAXS) of
flexible and intrinsically disordered proteins. FEBS Lett 589:2570–2577.
Kim I, Son HY, Yang MY, Nam YS (2015) Bioinspired Design of an Immobilization Interface for
Highly Stable, Recyclable Nanosized Catalysts. ACS Appl Mater Interfaces 7:14415–14422.
Kitching W, Rappoport Z, Winstein S, Young WG (1966) Allylic Oxidation of Olefins by
Palladium Acetate1. J Am Chem Soc 88:2054–2055.
Komathi S, Palaniappan S, Manisankar P, et al (2010) Large Scale Preparation of Palladium
Nanoparticles Loaded Polyaniline Nanostructures through Seed Induced Bulk Polymerization.
Macromol Chem Phys 211:1330–1338.
Kotaś J, Stasicka Z (2000) Chromium occurrence in the environment and methods of its speciation.
Environ Pollut 107:263–283.
Krittayavathananon A, Srimuk P, Luanwuthi S, Sawangphruk M (2014) Palladium nanoparticles
References
192
decorated on reduced graphene oxide rotating disk electrodes toward ultrasensitive hydrazine
detection: effects of particle size and hydrodynamic diffusion. Anal Chem 86:12272–12278.
L
Lavrich DJ, Wetterer SM, Bernasek SL, Scoles G (1998) Physisorption and chemisorption of
alkanethiols and alkyl sulfides on Au (111). J Phys Chem B 102:3456–3465.
Lei Y, Wu L, Zhang X, et al (2015) Palladium supported on triphenylphosphine functionalized
porous organic polymer: A highly active and recyclable catalyst for alkoxycarbonylation of aryl
iodides. J Mol Catal A Chem 398:164–169.
Li D, Xia Y (2004) Electrospinning of nanofibers: reinventing the wheel? Adv Mater 16:1151–
1170.
Li HJ, Wang L (2006) Triethanolamine as an Efficient and Reusable Base, Ligand and Reaction
Medium for Phosphane‐ Free Palladium‐ Catalyzed Heck Reactions. European J Org Chem
2006:5099–5102.
Li R, Zhang P, Huang Y, et al (2013) Facile Approach to Prepare Pd Nanoarray Catalysts within
Porous Alumina Templates on Macroscopic Scales. ACS Appl Mater Interfaces 5:12695–12700.
Li Y, Shen W (2014) Morphology-dependent nanocatalysts: Rod-shaped oxides. Chem Soc Rev
43:1543–1574.
Liang M, Su R, Qi W, et al (2014) Reduction of Hexavalent Chromium Using Recyclable Pt/Pd
Nanoparticles Immobilized on Procyanidin-Grafted Eggshell Membrane. Ind Eng Chem Res
53:13635–13643.

References
193
Liao C-C, Wang C-C, Chen C-Y, Lai W-J (2011) Stretching-induced orientation of
polyacrylonitrile nanofibers by an electrically rotating viscoelastic jet for improving the
mechanical properties. Polymer (Guildf) 52:2263–2275.
Lin H-L, Sou N-L, Huang GG (2015) Single-step preparation of recyclable silver nanoparticle
immobilized porous glass filters for the catalytic reduction of nitroarenes. RSC Adv 5:19248–
19254.
Liu F, Yu J, Tu G, et al (2017) Carbon nitride coupled Ti-SBA15 catalyst for visible-light-driven
photocatalytic reduction of Cr (VI) and the synergistic oxidation of phenol. Appl Catal B Environ
201:1–11.
Liu J, Ma S, Wei Q, et al (2013) Parallel array of nanochannels grafted with polymer-brushes-
stabilized Au nanoparticles for flow-through catalysis. Nanoscale 5:11894–11901.
Liu K, Wang Y, Chen P, et al (2016) Noncrystalline nickel phosphide decorated poly (vinyl
alcohol-co-ethylene) nanofibrous membrane for catalytic hydrogenation of p-nitrophenol. Appl
Catal B Environ 196:223–231.
Liu W, Wang D, Duan Y, et al (2015) Palladium supported on poly (ionic liquid) entrapped
magnetic nanoparticles as a highly efficient and reusable catalyst for the solvent-free Heck
reaction. Tetrahedron Lett 56:1784–1789.
Liu Y, Park M, Shin HK, et al (2014) Facile preparation and characterization of poly (vinyl
alcohol)/chitosan/graphene oxide biocomposite nanofibers. J Ind Eng Chem 20:4415–4420.
Liu Y, Zhang Y, Ding H, et al (2013b) Self-assembly of noble metallic spherical aggregates from
monodisperse nanoparticles: their synthesis and pronounced SERS and catalytic properties.

References
194
Lu C, Zhang P, Jiang S, et al (2017) Photocatalytic reduction elimination of UO22+ pollutant
under visible light with metal-free sulfur doped g-C3N4 photocatalyst. Appl Catal B Environ
200:378–385.
Lu X, Wang C, Wei Y (2009) One‐ Dimensional Composite Nanomaterials: Synthesis by
Electrospinning and Their Applications. Small 5:2349–2370.
Lu Y, Spyra P, Mei Y, et al (2007) Composite hydrogels: robust carriers for catalytic nanoparticles.
Macromol Chem Phys 208:254–261.
M
Mahmoud MA, Narayanan R, El-Sayed MA (2013) Enhancing Colloidal Metallic Nanocatalysis:
Sharp Edges and Corners for Solid Nanoparticles and Cage Effect for Hollow Ones. Acc Chem
Res 46:1795–1805.
Maier J (1987) Defect chemistry and ionic conductivity in thin films. Solid State Ionics 23:59–67.
Mallampati R, Valiyaveettil S (2014) Eggshell Membrane-Supported Recyclable Catalytic Noble
Metal Nanoparticles for Organic Reactions. ACS Sustain Chem Eng 2:855–859.
Mazumder V, Sun S (2009) Oleylamine-mediated synthesis of Pd nanoparticles for catalytic
formic acid oxidation. J Am Chem Soc 131:4588–4589.
McCleskey TM, Foreman TM, Hallman EE, et al (2001) Approaching zero discharge in uranium
reprocessing: photochemical reduction of uranyl. Environ Sci Technol 35:547–551.
Memarian F, Latifi M, Amani-Tehran M (2014) Innovative method for electrospinning of
continuous TiO2 nanofiber yarns: Importance of auxiliary polymer and solvent selection. J Ind

References
195
Eng Chem 20:1886–1891.
Meng L-Y, Rhee KY, Park S-J (2014) Enhancement of superhydrophobicity and conductivity of
carbon nanofibers-coated glass fabrics. J Ind Eng Chem 20:1672–1676.
Mer VK La (1952) Nucleation in phase transitions. Ind Eng Chem 44:1270–1277.
Mirzaei A, Janghorban K, Hashemi B, et al (2017) Characterization and optical studies of PVP-
capped silver nanoparticles. J Nanostructure Chem 7:37–46.
Mishra T, Mahato M, Aman N, et al (2011) A mesoporous WN co-doped titania nanomaterial with
enhanced photocatalytic aqueous nitrate removal activity under visible light. Catal Sci Technol
1:609–615.
Mizoroki T, Mori K, Ozaki A (1971) Arylation of olefin with aryl iodide catalyzed by palladium.
Bull Chem Soc Jpn 44:581.
Moakhar RS, Goh GKL, Dolati A, Ghorbani M (2017) Sunlight-driven photoelectrochemical
sensor for direct determination of hexavalent chromium based on Au decorated rutile TiO2
nanorods. Appl Catal B Environ 201:411–418.
Mohamed RM, Baeissa ES (2014) Environmental remediation of aqueous nitrate solutions by
photocatalytic reduction using Pd/NaTaO3 nanoparticles. J Ind Eng Chem 20:1367–1372.
Mori K, Dojo M, Yamashita H (2013) Pd and Pd–Ag nanoparticles within a macroreticular basic
resin: an efficient catalyst for hydrogen production from formic acid decomposition. ACS Catal
3:1114–1119.

References
196
N
Nabid MR, Bide Y, Rezaei SJT (2011) Pd nanoparticles immobilized on PAMAM-grafted
MWCNTs hybrid materials as new recyclable catalyst for Mizoraki–Heck cross-coupling
reactions. Appl Catal A Gen 406:124–132.
Nadagouda MN, Varma RS (2008) Green synthesis of silver and palladium nanoparticles at room
temperature using coffee and tea extract. Green Chem 10:859–862.
Nakano T, Ikawa NI, Ozimek L (2003) Chemical composition of chicken eggshell and shell
membranes. Poult Sci 82:510–514.
Napper DH (1983) Polymeric stabilization of colloidal dispersions. Academic Pr
Narayanan R (2010) Recent advances in noble metal nanocatalysts for Suzuki and Heck cross-
coupling reactions. Molecules 15:2124–2138.
Nasrollahzadeh M, Sajadi SM, Hatamifard A (2016) Waste chicken eggshell as a natural valuable
resource and environmentally benign support for biosynthesis of catalytically active Cu/eggshell,
Fe3O4/eggshell and Cu/Fe3O4/eggshell nanocomposites. Appl Catal B Environ 191:209–227.
Nazir M, Naqvi II (2013) Synthesis, spectral and electrochemical studies of complex of uranium
(IV) with pyridine-3-carboxylic acid. Am J Anal Chem 4:134.
Neyertz C, Marchesini FA, Boix A, et al (2010) Catalytic reduction of nitrate in water: promoted
palladium catalysts supported in resin. Appl Catal a Gen 372:40–47.
Nguyen T-D, Dinh C-T, Do T-O (2015) Tailoring the assembly, interfaces, and porosity of
nanostructures toward enhanced catalytic activity. Chem Commun 51:624–635.

References
197
Nikitenko SI, Venault L, Pflieger R, et al (2010) Potential applications of sonochemistry in spent
nuclear fuel reprocessing: a short review. Ultrason Sonochem 17:1033–1040.
Niu J, Yin L, Dai Y, et al (2016) Design of visible light responsive photocatalysts for selective
reduction of chlorinated organic compounds in water. Appl Catal A Gen 521:90–95.
Niu Z, Li Y (2014) Removal and Utilization of Capping Agents in Nanocatalysis. Chem Mater
26:72–83.
Nogami M, Hirose Y, Arai T, et al (2008) Reduction of U (VI) and some fission products in HNO3
media by galvanostatic electrolysis. J Alloys Compd 451:358–360.
Noh HK, Lee SW, Kim J-M, et al (2006) Electrospinning of chitin nanofibers: degradation
behavior and cellular response to normal human keratinocytes and fibroblasts. Biomaterials
27:3934–3944.
O
Omole MA, K’Owino IO, Sadik OA (2007) Palladium nanoparticles for catalytic reduction of Cr
(VI) using formic acid. Appl Catal B Environ 76:158–167.
Omole MA, Okello VA, Lee V, et al (2011) Catalytic Reduction of Hexavalent Chromium Using
Flexible Nanostructured Poly(amic acids). ACS Catal 1:139–146.
Overbeek JTG, Verwey EJW (1948) Theory of the Stability of Lyophobic Colloids: The
interaction of Sol Particles Having an Electric Double Layer.

References
198
P
Pan X, Xu Y-J (2014) Efficient Thermal- and Photocatalyst of Pd Nanoparticles on TiO2 Achieved
by an Oxygen Vacancies Promoted Synthesis Strategy. ACS Appl Mater Interfaces 6:1879–1886.
Pandey AK, Childs RF, West M, et al (2001) Formation of pore-filled ion-exchange membranes
with in situ crosslinking: Poly(vinylbenzyl ammonium salt)-filled membranes. J Polym Sci Part A
Polym Chem 39:807–820.
Panthi G, Yousef A, Barakat NAM, et al (2013) Mn2O3/TiO2 nanofibers with broad-spectrum
antibiotics effect and photocatalytic activity for preliminary stage of water desalination. Ceram Int
39:2239–2246.
Park JY, Lee IH, Bea GN (2008) Optimization of the electrospinning conditions for preparation of
nanofibers from polyvinylacetate (PVAc) in ethanol solvent. J Ind Eng Chem 14:707–713.
Patra S, Naik AN, Pandey AK, et al (2016) Silver nanoparticles stabilized in porous polymer
support: A highly active catalytic nanoreactor. Appl Catal A Gen 524:214–222.
Patra S, Pandey AK, Sarkar SK, Goswami A (2014) Wonderful nanoconfinement effect on redox
reaction equilibrium. RSC Adv 4:33366–33369.
Patra S, Pandey AK, Sen D, et al (2014) Redox Decomposition of Silver Citrate Complex in
Nanoscale Confinement: An Unusual Mechanism of Formation and Growth of Silver
Nanoparticles. Langmuir 30:2460–2469.
Patra S, Sen D, Pandey AK, et al (2013) Local Conditions Influencing In Situ Formation of
Different Shaped Silver Nanostructures and Subsequent Reorganizations in Ionomer Membrane.

References
199
J Phys Chem C 117:12026–12037.
Paul S, Pandey AK, Shah R V, Aggarwal SK (2015) Chemically selective polymer substrate based
direct isotope dilution alpha spectrometry of Pu. Anal Chim Acta 878:54–62.
Pestov A, Nazirov A, Modin E, et al (2015) Mechanism of Au (III) reduction by chitosan:
Comprehensive study with 13C and 1H NMR analysis of chitosan degradation products.
Carbohydr Polym 117:70–77.
Polte J (2015) Fundamental growth principles of colloidal metal nanoparticles–a new perspective.
CrystEngComm 17:6809–6830.
Pomogailo AD, Kestelman VN (2006) Metallopolymer nanocomposites. Springer Science &
Business Media
Pozun ZD, Rodenbusch SE, Keller E, et al (2013) A systematic investigation of p-nitrophenol
reduction by bimetallic dendrimer encapsulated nanoparticles. J Phys Chem C 117:7598–7604.
Pradhan N, Pal A, Pal T (2002) Silver nanoparticle catalyzed reduction of aromatic nitro
compounds. Colloids Surfaces A Physicochem Eng Asp 196:247–257.
Puddephatt R, Yap GA (1998) An efficient binuclear catalyst for decomposition of formic acid.
Chem Commun 2365–2366.
R
Ramakrishna W-ET and RI and S (2011) Technological advances in electrospinning of nanofibers.
Sci Technol Adv Mater 12:13002.
Rashid MH, Mandal TK (2007) Synthesis and catalytic application of nanostructured silver

References
200
dendrites. J Phys Chem C 111:16750–16760.
Reiss H (1951) The growth of uniform colloidal dispersions. J Chem Phys 19:482–487.
Ren H-T, Jia S-Y, Zou J-J, et al (2015) A facile preparation of Ag2O/P25 photocatalyst for
selective reduction of nitrate. Appl Catal B Environ 176:53–61.
Ren L, Yang F, Wang C, et al (2014) Plasma synthesis of oxidized graphene foam supporting Pd
nanoparticles as a new catalyst for one-pot synthesis of dibenzyls. RSC Adv 4:63048–63054.
Ruban A, Hammer B, Stoltze P, et al (1997) Surface electronic structure and reactivity of transition
and noble metals1. J Mol Catal A Chem 115:421–429.
Ruiz P, Muñoz M, Macanás J, Muraviev DN (2011) Intermatrix synthesis of polymer-stabilized
PGM@ Cu core–shell nanoparticles with enhanced electrocatalytic properties. React Funct Polym
71:916–924.
Ruthven DM, Upadhye RS (1971) The catalytic decomposition of aqueous formic acid over
suspended palladium catalysts. J Catal 21:39–47.
S
Safari J, Zarnegar Z, Masoule SF, Najafabadi AE (2014) Aqueous dispersions of iron oxide
nanoparticles with linear-dendritic copolymers. J Ind Eng Chem 20:2389–2393.
Salomone VN, Meichtry JM, Zampieri G, Litter MI (2015) New insights in the heterogeneous
photocatalytic removal of U (VI) in aqueous solution in the presence of 2-propanol. Chem Eng J
261:27–35.
Santos SAO, Pinto RJB, Rocha SM, et al (2014) Unveiling the Chemistry behind the Green

References
201
Synthesis of Metal Nanoparticles. ChemSusChem 7:2704–2711.
Shahgaldi S, Yaakob Z, Khadem DJ, Daud WRW (2012) Characterization and the hydrogen
storage capacity of titania-coated electrospun boron nitride nanofibers. Int J Hydrogen Energy
37:11237–11243.
Shand M, Anderson JA (2013) Aqueous phase photocatalytic nitrate destruction using titania based
materials: routes to enhanced performance and prospects for visible light activation. Catal Sci
Technol 3:879–899.
Shao L, Ji W, Dong P, et al (2012a) Coupling reactions of aromatic halides with palladium catalyst
immobilized on poly (vinyl alcohol) nanofiber mats. Appl Catal A Gen 413:267–272.
Shao L, Ren Y, Wang Z, et al (2015) Developing chitosan-based composite nanofibers for
supporting metal catalysts. Polymer (Guildf) 75:168–177.
Shao L, Xing G, He L, et al (2012b) Sulfonic groups functionalized preoxidated polyacrylonitrile
nanofibers and its catalytic applications. Appl Catal A Gen 443:133–137.
Shao S, Zhou S, Li L, et al (2011) Osteoblast function on electrically conductive electrospun
PLA/MWCNTs nanofibers. Biomaterials 32:2821–2833.
Sharma VK, Zboril R, Varma RS (2015) Ferrates: Greener Oxidants with Multimodal Action in
Water Treatment Technologies. Acc Chem Res 48:182–191.
Sheng G, Hu J, Alsaedi A, et al (2015) Interaction of uranium (VI) with titanate nanotubes by
macroscopic and spectroscopic investigation. J Mol Liq 212:563–568.
Sheng G, Shao X, Li Y, et al (2014) Enhanced Removal of Uranium(VI) by Nanoscale Zerovalent

References
202
Iron Supported on Na–Bentonite and an Investigation of Mechanism. J Phys Chem A 118:2952–
2958.
Sheng G, Yang P, Tang Y, et al (2016) New insights into the primary roles of diatomite in the
enhanced sequestration of UO22+ by zerovalent iron nanoparticles: an advanced approach
utilizing XPS and EXAFS. Appl Catal B Environ 193:189–197.
Shinde RN, Chavan V, Acharya R, et al (2014) Selective removal of arsenic (V) from natural water
using N-methyl-d-glucamine functionalized poly (propylene) membranes. J Environ Chem Eng
2:2221–2228.
Shine HJ, Mallory HE (1962) The Reduction of Aromatic Nitro Compounds by Potassium
Borohydride1. J Org Chem 27:2390–2391.
Shrivastava KC, Chappa S, Sengupta A, et al (2016) Palladium Nanoparticles Hosted on
Hydrazine-Grafted Magnetite and Silica Particles to Catalyze the Reduction of Oxymetal Ions with
Formic Acid. ChemCatChem.
Siegel RW (1993) Synthesis and properties of nanophase materials. Mater Sci Eng A 168:189–
197.
Simo A, Polte J, Pfander N, et al (2012) Formation mechanism of silver nanoparticles stabilized
in glassy matrices. J Am Chem Soc 134:18824–18833.
Soares O, Pereira MFR, Órfão JJM, et al (2014) Photocatalytic nitrate reduction over Pd–Cu/TiO2.
Chem Eng J 251:123–130.
Sobhani S, Pakdin-Parizi Z (2014) Palladium-DABCO complex supported on γ-Fe2O3 magnetic

References
203
nanoparticles: A new catalyst for CC bond formation via Mizoroki- Heck cross-coupling reaction.
Appl Catal A Gen 479:112–120.
Soukup K, Topka P, Hejtmánek V, et al (2014) Noble metal catalysts supported on nanofibrous
polymeric membranes for environmental applications. Catal Today 236:3–11.
Stepanov AL, Golubev AN, Nikitin SI, Osin YN (2014) A review on the fabrication and properties
of platinum nanoparticles. Rev Adv Mater Sci 38:160–175.
Su DS, Perathoner S, Centi G (2013) Nanocarbons for the Development of Advanced Catalysts.
Chem Rev 113:5782–5816.
Sugimoto T (1987) Preparation of monodispersed colloidal particles. Adv Colloid Interface Sci
28:65–108.
Sun B, Long YZ, Zhang HD, et al (2014) Advances in three-dimensional nanofibrous
macrostructures via electrospinning. Prog Polym Sci 39:862–890.
Suren S, Pancharoen U, Kheawhom S (2014) Simultaneous extraction and stripping of lead ions
via a hollow fiber supported liquid membrane: Experiment and modeling. J Ind Eng Chem
20:2584–2593.
Susanto H, Ulbricht M (2007) Photografted Thin Polymer Hydrogel Layers on PES Ultrafiltration
Membranes: Characterization, Stability, and Influence on Separation Performance. Langmuir
23:7818–7830.
Szablan Z, Junkers T, Koo SPS, et al (2007) Mapping Photolysis Product Radical Reactivities via
Soft Ionization Mass Spectrometry in Acrylate, Methacrylate, and Itaconate Systems.

References
204
Macromolecules 40:6820–6833.
T
Tang S, Vongehr S, Meng X (2010) Controllable incorporation of Ag and Ag–Au nanoparticles in
carbon spheres for tunable optical and catalytic properties. J Mater Chem 20:5436–5445.
Tang Z, Qiu C, McCutcheon JR, et al (2009) Design and fabrication of electrospun
polyethersulfone nanofibrous scaffold for high‐ flux nanofiltration membranes. J Polym Sci Part
B Polym Phys 47:2288–2300.
Tedsree K, Li T, Jones S, et al (2011) Hydrogen production from formic acid decomposition at
room temperature using a Ag–Pd core–shell nanocatalyst. Nat Nanotechnol 6:302.
Tehfe M-A, Dumur F, Graff B, et al (2013) Design of new Type I and Type II photoinitiators
possessing highly coupled pyrene-ketone moieties. Polym Chem 4:2313–2324.
Tejamaya M, Romer I, Merrifield RC, Lead JR (2012) Stability of citrate, PVP, and PEG coated
silver nanoparticles in ecotoxicology media. Environ Sci Technol 46:7011–7017.
Toraishi T, Kimura T, Arisaka M (2007) A remote valency control technique: catalytic reduction
of uranium(vi) to uranium(iv) by external ultrasound irradiation. Chem Commun 240–241.
Troppmann S, König B (2014) Functionalized Membranes for Photocatalytic Hydrogen
Production. Chem – A Eur J 20:14570–14574.
Trzeciak AM, Mieczyńska E, Ziółkowski JJ, et al (2008) Palladium (0) nanoparticles encapsulated
in diamine-modified glycidyl methacrylate polymer (GMA-CHDA) applied as catalyst of Suzuki–
Miyaura cross-coupling reaction. New J Chem 32:1124–1130.

References
205
Tsuji J (1995) Palladium Reagents in Organic Synthesis.
Tsuji J (2012) Organic synthesis with palladium compounds. Springer Science & Business Media
Tu W, Li K, Shu X, William WY (2013) Reduction of hexavalent chromium with colloidal and
supported palladium nanocatalysts. J nanoparticle Res 15:1–9.
Tüzüner Ş, Demir MM (2015) Dispersion of organophilic Ag nanoparticles in PS-PMMA blends.
Mater Chem Phys 162:692–699.
Tyumentsev MS, Zubavichus Y V, Shiryaev AA, Anan’ev A V (2014) Catalytic reduction of
U(VI) in H2SO4 solutions with hydrazine and formic acid in the presence of bimetallic platinum-
ruthenium catalysts. Radiochemistry 56:150–155.
V
V. Goia D, Matijevic E (1998) Preparation of monodispersed metal particles. New J Chem
22:1203–1215.
W
Wang H, Feng Y, Fang Z, et al (2012) Co-electrospun blends of PU and PEG as potential
biocompatible scaffolds for small-diameter vascular tissue engineering. Mater Sci Eng C 32:2306–
2315.
Wang X, Yang J, Ma S, et al (2016) In situ fabrication of AgI/AgVO3 nanoribbon composites with
enhanced visible photocatalytic activity for redox reactions. Catal Sci Technol 6:243–253.
Wang Y, Choi S, Zhao X, et al (2014) Polyol synthesis of ultrathin Pd nanowires via attachment‐

References
206
based growth and their enhanced activity towards formic acid oxidation. Adv Funct Mater 24:131–
139.
Wehbe N, Jaafar M, Guillard C, et al (2009) Comparative study of photocatalytic and non-
photocatalytic reduction of nitrates in water. Appl Catal A Gen 368:1–8.
Wu H, Lin D, Zhang R, Pan W (2007) Facile synthesis and assembly of Ag/NiO nanofibers with
high electrical conductivity. Chem Mater 19:1895–1897.
X
Xu H, Zeiger BW, Suslick KS (2013) Sonochemical synthesis of nanomaterials. Chem Soc Rev
42:2555–2567.
Xu Y (2005) Synthesis and characterization of silica coated CdSe/CdS core/shell quantum dots.
Xu Z, Lu G, Cai C (2017) Palladium nanoparticles stabilized by aqueous vesicles self-assembled
from a PEGylated surfactant ionic liquid for the chemoselective reduction of nitroarenes. Catal
Commun 99:57–60.
Y
Yadav M, Xu Q (2013) Catalytic chromium reduction using formic acid and metal nanoparticles
immobilized in a metal–organic framework. Chem Commun 49:3327–3329.
Yan N, Yuan Y, Dyson PJ (2013) Nanometallic chemistry: deciphering nanoparticle catalysis from
the perspective of organometallic chemistry and homogeneous catalysis. Dalt Trans 42:13294–
13304.

References
207
Yang C, Meldon JH, Lee B, Yi H (2014a) Investigation on the catalytic reduction kinetics of
hexavalent chromium by viral-templated palladium nanocatalysts. Catal Today 233:108–116.
Yang D, Li Y, Nie J (2007) Preparation of gelatin/PVA nanofibers and their potential application
in controlled release of drugs. Carbohydr Polym 69:538–543.
Yang Q, Adrus N, Tomicki F, Ulbricht M (2011) Composites of functional polymeric hydrogels
and porous membranes. J Mater Chem 21:2783–2811.
Yang W, Zhai Y, Yue X, et al (2014) From filter paper to porous carbon composite membrane
oxygen reduction catalyst. Chem Commun 50:11151–11153.
Yoon J-W, Choi J-K, Lee J-H (2012) Design of a highly sensitive and selective C2H5OH sensor
using p-type Co3O4 nanofibers. Sensors Actuators B Chem 161:570–577.
Yu L, Huang Y, Wei Z, et al (2015) Heck reactions catalyzed by ultrasmall and uniform Pd
nanoparticles supported on polyaniline. J Org Chem 80:8677–8683.
Z
Zeng M, Yuan X, Yang Z, Qi C (2014) Novel macroporous palladium cation crosslinked chitosan
membranes for heterogeneous catalysis application. Int J Biol Macromol 68:189–197.
Zhang C-L, Yu S-H (2014) Nanoparticles meet electrospinning: recent advances and future
prospects. Chem Soc Rev 43:4423–4448.
Zhang S, Nguyen L, Zhu Y, et al (2013) In-Situ Studies of Nanocatalysis. Acc Chem Res 46:1731–
1739.
Zhang Z, Shao C, Li X, et al (2010) Electrospun nanofibers of p-type NiO/n-type ZnO
References
208
heterojunctions with enhanced photocatalytic activity. ACS Appl Mater Interfaces 2:2915–2923.
Zhang Z, Yu Y, Wang P (2012) Hierarchical top-porous/bottom-tubular TiO2 nanostructures
decorated with Pd nanoparticles for efficient photoelectrocatalytic decomposition of synergistic
pollutants. ACS Appl Mater Interfaces 4:990–996.
Zhao D, Wang X, Yang S, et al (2012) Impact of water quality parameters on the sorption of U
(VI) onto hematite. J Environ Radioact 103:20–29.
Zheng B, Liu G, Yao A, et al (2014) A sensitive AgNPs/CuO nanofibers non-enzymatic glucose
sensor based on electrospinning technology. Sensors Actuators B Chem 195:431–438.
Zheng B, Qian L, Yuan H, et al (2010) Preparation of gold nanoparticles on eggshell membrane
and their biosensing application. Talanta 82:177–183.
Zhou X, Huang Y, Xing W, et al (2008) High-quality hydrogen from the catalyzed decomposition
of formic acid by Pd–Au/C and Pd–Ag/C. Chem Commun 3540–3542.
Zhu M, Wang C, Meng D, Diao G (2013) In situ synthesis of silver nanostructures on magnetic
Fe3O4@C core-shell nanocomposites and their application in catalytic reduction reactions. J
Mater Chem A 1:2118–2125.
Zohoori S, Karimi L, Ayaziyazdi S (2014) A novel durable photoactive nylon fabric using
electrospun nanofibers containing nanophotocatalysts. J Ind Eng Chem 20:2934–2938.