Full Year 2020/21
44
Full Year 2020/21 Arnd Kaldowski, CEO Hartwig Grevener, CFO Thomas Bernhardsgrüttter, IR Stäfa, May 18, 2021
Transcript of Full Year 2020/21

Full Year 2020/21Arnd Kaldowski, CEOHartwig Grevener, CFOThomas Bernhardsgrüttter, IR
Stäfa, May 18, 2021

Disclaimer
2
This presentation contains forward-looking statements, which offer no guarantee with regard to future performance. These statements aremade on the basis of management’s views and assumptions regarding future events and business performance at the time the statements aremade. They are subject to risks and uncertainties including, but not confined to, future global economic conditions, exchange rates, legalprovisions, market conditions, activities by competitors and other factors outside Sonova’s control. Should one or more of these risks oruncertainties materialize or should underlying assumptions prove incorrect, actual outcomes may vary materially from those forecasted orexpected. Each forward-looking statement speaks only as of the date of the particular statement, and Sonova undertakes no obligation topublicly update or revise any forward-looking statements, except as required by law.
This presentation constitutes neither an offer to sell nor a solicitation to buy any securities. This presentation does not constitute an offeringprospectus within the meaning of Article 652a of the Swiss Code of Obligations nor a listing prospectus within the meaning of the listing rulesof SIX Swiss Exchange.

Strengthening our market position in a challenging year
− Sustained positive momentum during the recovery, resulting in strong 2H sales and FY earnings growth
− Continued market share gains in HI, reflecting strong execution and success of Phonak Paradise
− CI business rebounding towards the year-end, supported by innovative product launches
− Stepped up growth investments despite the short-term challenges from the COVID-19 pandemic
− Return to cash dividends and share buyback
− Well positioned to participate in the recovery,expecting significant growth in FY 2021/22
Sonova Group
4

Sonova Group
5
Key highlights
CHF 2,602m-6.8% in LC
(2H: +6.6% in LC)
+24-28%growth in LC
in FY 2021/22
CHF 603m+5.6% in LC
(2H: +33.6% in LC)
Sales EPS (adj.)
EBITA (adj.)
Sales outlook
Phonak Paradisesuccessful launch & market share gains
Innovation
CHF 7.71 per share+4.3% in CHF
+34-42%*growth in LC
in FY 2021/22
EBITA outlook
Note: adj. refers to adjusted figures; for details, please refer to Appendix – Non-GAAP adjustments; * refers to adjusted adj. EBITA growth in LC

Sonova Group
6
Performance history
► Solid growth in recent years with FY 2020/21 affected by COVID – Strong margin progression despite FX
FY 2016/17 FY 2017/18 FY 2018/19 FY 2019/20 FY 2020/21
Sales growth reported +15.6% +10.4% +4.4% +5.6% -10.8%
Sales growth in LC +15.3% +9.0% +4.1% +8.7% -6.8%
Organic sales growth in LC +4.3% +3.8% +4.9% +8.1% -7.1%
EBITA Margin (adj.) 20.1% 20.8% 21.5% 21.2% 23.2%
Salesin CHF million
EBITA (adj.)in CHF million
+5.5% +16.9% +2.1% +12.0%-20.9%
+24.5%+2.7% +5.9%
+6.5%
+6.6%
+15.3%+9.0%
+4.1% +8.7%-6.8%
0
1,000
2,000
3,000
16/17 17/18 18/19 19/20 20/21
19.2% 19.2% 19.3% 19.6%16.3%
20.8%22.3% 23.5%
22.7%28.0%
20.1%20.8%
21.5% 21.2% 23.2%
0
200
400
600
0
200
400
600
16/17 17/18 18/19 19/20 20/21
◼ 1H ◼ 2H(percentages represent LC growth rate)
◼ 1H ◼ 2H(percentages represent adj. EBITA margin)

Sonova’s strategy
7
Strategic pillars
► Our strategy remains unchanged and has proven to be effective throughout the COVID-19 pandemic
Continuous process improvement & structural
optimization
Leverage M&Ato accelerate growth
strategically
Lead innovation in audiological performance & consumer experience
Expand and optimize omni-channel audiological care
network
Extend reach through multi-channel, value-adding partnerships &
commercial excellence
Invest in high growth developing markets

Lead innovation Our most recent product launches
Lorem ipsum
PhonakAudéo™ Paradise
2Q 20/21
HansatonSTRATOS platform 1Q 21/22
Advanced BionicsNaída™ CI Marvel and Sky CI™ Marvel sound processors3Q 20/21
UnitronBLU platform1Q 21/22

Leverage M&A to accelerate growth strategically
9
Strategic rationale of the Sennheiser Consumer Division acquisition
► Expanding Sonova’s reach along the consumer journey leveraging Sennheiser’s well established platform
Consumer Division
Traditional HI market
CI market
Consumer device focus Medical device focusPrimary product focus
High
None
Ne
ed
for a
mp
lifica
tion
Premium & audiophile headphones
Hearables with amplification
− Joining forces in rapidly developing segment of hearables with amplification, jump-starting Sonova’s own efforts
− Adding an additional growth vector by entering the fast-growing market of True Wireless headsets
− Expanding reach by capturing potential hearing instrument consumers earlier on their journey
− Gaining access to new channels and leveraging the strong Sennheiser brand
− Leveraging the combined strengths of Sonova’s audiological expertise and Sennheiser’s know-how in premium sound delivery
− Exploiting significant synergies in production, R&D and channel access
Consumer journey
True Wireless
Note: The acquisition remains subject to regulatory approval and other conditions; it is not reflected in the FY 2021/22 guidance

Sonova Group
10
IntACT – Sonova’s ESG Strategy
► Advanced ESG strategy clustered around four strategic areas
We constantly innovate in hearing health care, improve access for people in under-served areas
and engage actively with our communities.
We foster our employees’ development, well-being and engagement in an inclusive work environment that embraces diversity.
We behave ethically and apply the highest quality and safety standards to everything we do.
We drive the transition to a resource-efficient and low-carbon future of our operations throughout the
lifecycle of our products and services.
Serving society Advancing our people
Acting with integrityProtecting the planet

Sonova Group
11
Elevated ESG commitments for Sonova
► Tangible, impactful and measurable ESG commitments
We reduce our emissions through energy savings and the transition to renewable energy and align our
long-term targets with the ambitious 1.5°C scenario
We achieve carbon-neutral operations by the end of 2021
We reduce packagingwaste by 20% by 2023
We integrate ESG in supply chain risk assessments and audits
We strive for 40% women in key positions by 2025
We aim for >95% of employees* to have a
development plan by 2022We train and certify 250 HCPs in low- and middle-income countries through the SIHA 12-month HCP program by 2022
We implement human rights due diligence aligned with international frameworks and train all relevant employees by 2022
We improve the product reliability rate >20% YOY for HI and CI
We increase our support for children through
the Hear the World Foundation by 10% YOY
*excluding job roles in production/assembly

Sonova Group
12
Summary FY 2020/21
► Returning to growth in 2H – Strong margin expansion while maintaining high level of growth investments
− Sales of CHF 2,601.9 million down -6.8% in LC (organic -7.1%), -10.8% in CHF – growth of +6.6% in LC in 2H
− EBITA (adj.) of CHF 603.0 million, up +5.6% in LC, +33.6% in LC in 2H – structural optimization fully delivering to plan
− EBITA margin (adj.) of 23.2%, up +290bps in LC – strong margin improvement in 2H (+600bps in LC)
− EPS (adj.) up +15.5% in LC to CHF 7.71
− Sales of CHF 1,463.9 million (-4.7% in LC) – returning to positive growth in 2H with sales up +6.1% in LC
− Successful launch of Phonak Paradise platform – strong market response driving broad-based market share gains
− Advancing excellence in commercial execution to drive sustained market outperformance and profitable growth
− Sales of CHF 953.5 million (-8.1% in LC) – good momentum in 2H with sales up +6.9% in LC
− Advancing omni-channel strategy – stepping up online lead generation while entering new markets and channels
− Network streamlining on track – combining store locations to improve efficiency while protecting sales
− Sales of CHF 184.5 million (-15.9% in LC) – strong recovery towards year-end supported by new processor launches
− Strong headwind from COVID-19 pandemic and residual impact from Feb 2020 voluntary field corrective action
− Good initial market response from launch of Naída™ CI Marvel for adults and Sky CI™ Marvel sound processors
Cochlear Implants
Audiological Care
Hearing Instruments
Group
Note: adj. refers to adjusted figures; for details, please refer to Appendix – Non-GAAP adjustments

Sonova Group
13
Key financials – As reported and adjusted
13
► Sustained market share gains – Strong profitability and solid cash flow despite FX and COVID-19 headwind
FY 2019/20 FY 2020/21
∆ % in CHF ∆ % in LCCHF m Margin CHF m Margin
Sales (reported) 2,916.9 2,601.9 -10.8% -6.8%
Gross profit (adj.) 2,106.9 72.0% 1,880.2 72.3% -10.8% -6.4%
OPEX (adj.) 1,486.2 1,277.1 -14.1% -11.4%
EBITA (adj.) 620.8 21.2% 603.0 23.2% -2.9% +5.6%
Adjustments -66.4 60.3
EBITA (reported) 554.3 19.0% 663.3 25.5% +19.7% +30.5%
EPS (adj. in CHF) 7.39 7.71 +4.3% +15.5%
EPS (reported in CHF) 7.61 9.23 +21.3% +33.7%
Operating free cash flow (reported) 638.5 602.4 -5.7%
ROCE (reported) 18.2% 22.3%
Note: adj. refers to adjusted figures; for details, please refer to Appendix – Non-GAAP adjustments

Sonova Group
14
Key financials – As reported and adjusted
FY 2020/21 Adjustments FY 2020/21
in CHF million Reported HI segment CI segment Other Total Adjusted
Sales 2,601.9 - - - - 2,601.9
Cost of sales -728.3 5.5 1.1 - 6.6 -721.7
Gross profit 1,873.5 5.5 1.1 - 6.6 1,880.2
Research & Development -203.9 0.5 25.5 - 26.0 -177.9
Sales & Marketing -881.2 22.1 0.5 - 22.6 -858.6
General & Administration -250.9 8.3 0.6 - 8.9 -242.0
Other income/(expenses) 125.8 - -124.4 - -124.4 1.4
Total OPEX -1,210.3 31.0 -97.8 - -66.9 -1,277.1
EBITA 663.3 36.5 -96.7 - -60.3 603.0
EPS (in CHF) 9.23 0.46 -1.54 -0.45 -1.53 7.71
‒ HI segment: restructuring costs (CHF 36.5 million) related to further improving the operating structure and AC streamlining
‒ CI segment: restructuring costs (CHF 2.3 million), award in patent infringement lawsuit to AB (CHF 124.4 million) and impairment of capitalized development costs (CHF 25.3 million)
‒ Other: positive transition impacts from the Swiss tax reform (CHF 28.0 million)
1 2
1
2
3
3

Sonova Group
15
Sales Components
► Solid sales momentum in light of market headwinds – Sustained market outperformance
Growth
components-7.1% -4.0% -10.8%-6.8%
OPERATIONAL FX
+0.3%
2,600
200
2,400
0
2,900
2,800
2,500
2,700
100
3,000
FY 20/21Reported
FX impact
2,601.9
FY 19/20Reported
Organic
2,717.6-207.5
2,916.9
M&A
8.2
FY 20/21LC
-115.7
-6.8%
in CHF million

1H 2020/21 2H 2020/21 FY 2020/21
CHF m Δ % in LC CHF m Δ % in LC CHF m Δ % in LC
EMEA 572.9 -19.1% 843.7 +5.9% 1'416.6 -6.0%
USA 302.3 -26.0% 429.9 +3.8% 732.2 -10.8%
Americas (excl. USA) 71.7 -26.7% 106.4 +7.4% 178.2 -9.7%
Asia / Pacific 122.8 -10.5% 152.2 +19.9% 275.0 +3.7%
Total Sonova 1,069.6 -20.9% 1,532.2 +6.6% 2,601.9 -6.8%
Sonova Group
16
Reported sales by regions and key markets – Half-year view
► Market recovery led by APAC – All regions returning to positive growth in 2H
− HI business: 2H rebound in APAC led by CN, KR and NZ, development in Americas muted by impacts from the pandemic in BR, MX
− AC business: APAC lifted by strong momentum in NZ, Americas held back by lock-down in CA, partly offset by bolt-ons in BR
− CI business: Strong DD growth throughout the year in CN offsetting sharp declines in other markets
− HI business: Significant market share gains across all sales channels driven by Phonak Paradise – faster recovery with independent channel
− AC business: Dynamic recovery across the network, partially held back by temporary lockdowns in 2H
− CI business: Business affected by strict lockdowns and voluntary field corrective action – faster recovery in 4Q supported by product launch
− HI business: Solid recovery led by positive growth in FR, DE, Nordics and CH
− AC business: Good momentum in major markets in continental Europe, held back by lagging recovery in the UK and 2H slowdown in DE
− CI business: Sales supported by upgrade sales – system sales impacted by postponement of elective surgeries due to the pandemic
Other
US
EMEA

Sonova Group
17
EBITA components
► Strong margin development –Increase of investments in growth initiatives & structural optimization
ADJUSTMENTSin CHF million
Margin 25.5%-1.1%21.2% +3.5% 24.1%-0.6%
OPERATIONAL FX
+2.5% 26.6%
50.4
67.4680
700
740
720
0
660
620
640
FY 20/21reported in LC
FX
723.2
-59.9
M&A net of divestments
FY20/21adj. in LC
FY 20/21reported
FY 19/20adjusted
655.8663.3
Organic
-15.4
Adjustmentsin LC
620.8
+5.6%
AB patent award, restructuring & impairment of
CI development costs
Note: adj. refers to adjusted figures; for details, please refer to Appendix – Non-GAAP adjustments

Sonova Group
18
Key financials – Half-year view
► Returning to growth and significant profitability expansion – Structural optimizations fully delivering to plan
CHF m 1H 2020/21 Δ % in LC 2H 2020/21 Δ % in LC FY 2020/21 Δ % in LC
Sales 1,069.6 -20.9% 1,532.2 +6.6% 2,601.9 -6.8%
Gross profit (adj.) 740.3 -22.0% 1,139.8 +8.0% 1,880.2 -6.4%
- Gross profit margin (adj.) 69.2% 74.4% 72.3%
OPEX (adj.) 566.0 -19.5% 711.1 -3.6% 1,277.1 -11.4%
EBITA (adj.) 174.3 -28.5% 428.7 +33.6% 603.0 +5.6%
- EBITA margin (adj.) 16.3% 28.0% 23.2%
- Δ EBITA margin (adj.) -330bps -190bps +530bps +600bps +200bps +290bps
Note: adj. refers to adjusted figures; for details, please refer to Appendix – Non-GAAP adjustments

Hearing Instruments segment
19

Hearing Instruments segment
20
− Return to growth in 2H, driven both by HI and AC business
− Structural optimization initiatives announced in June 2020 well on track with attractive payback
− Margin improvement driven by sustainable cost savings, lower COVID-related marketing and travel spend as well as 1H government support
− Additional savings from structural optimization initiatives expected in FY 2021/22
Key financials – Half-year view
► Sustained market outperformance – Strong execution and structural optimization initiatives lift margin
1H 2020/21 2H 2020/21 FY 2020/21
CHF m Δ % in CHF Δ % in LC CHF m Δ % in CHF Δ % in LC CHF m Δ % in CHF Δ % in LC
Sales 986.5 -23.8% -19.6% 1,430.8 +2.8% +6.5% 2,417.3 -10.0% -6.1%
Δ organic -256.9 -19.9% 86.0 +6.2% -170.9 -6.4%
Δ acquisitions 3.8 +0.3% 4.3 +0.3% 8.2 +0.3%
Δ disposals - - - - - -
Δ FX -54.5 -4.2% -51.6 -3.7% -106.1 -3.9%
EBITA (adj.) 184.3 -32.0% -22.6% 432.8 +24.0% +32.2% 617.1 -0.5% +8.3%
EBITA margin (adj.) 18.7% -230bps -80bps 30.2% +510bps +600bps 25.5% +240bps +350bps
Note: adj. refers to adjusted figures; for details, please refer to Appendix – Non-GAAP adjustments

Hearing Instruments segment
21
Hearing Instruments business
► Market share gains across channels and geographies driven by Paradise and strong commercial execution
− Successful launch of Phonak Audéo™ Paradise platform in August 2020 supporting market share gains across channels and geographies
− Continued market outperformance driven further by progress in elevating commercial execution
− ASP lift from launches and temporary shift in channel mix – pressure from normalization and French reimbursement change towards year end
− Further market share gains in the VA, reaching highest level in over seven years in March 2021 (exit-rate)
− Renewed private label contract with large US hearing aid retailer to support growth in the US going forward
− Introduction of new platforms at Unitron and Hansaton in 1Q 2021/22, powered by the Sonova PRISM™ chip
1H 2020/21 2H 2020/21 FY 2020/21
CHF m Δ % in CHF Δ % in LC CHF m Δ % in CHF Δ % in LC CHF m Δ % in CHF Δ % in LC
Sales 607.8 -21.1% -16.7% 856.0 +1.6% +6.2% 1,463.9 -9.2% -4.7%
Δ organic -129.6 -16.8% 51.7 +6.1% -77.8 -4.8%
Δ acquisitions 0.9 +0.1% 0.7 +0.1% 1.6 +0.1%
Δ FX -33.8 -4.4% -39.1 -4.6% -72.9 -4.5%
1H 2020/21 2H 2020/21 FY 2020/21
CHF m Δ % in CHF Δ % in LC CHF m Δ % in CHF Δ % in LC CHF m Δ % in CHF Δ % in LC
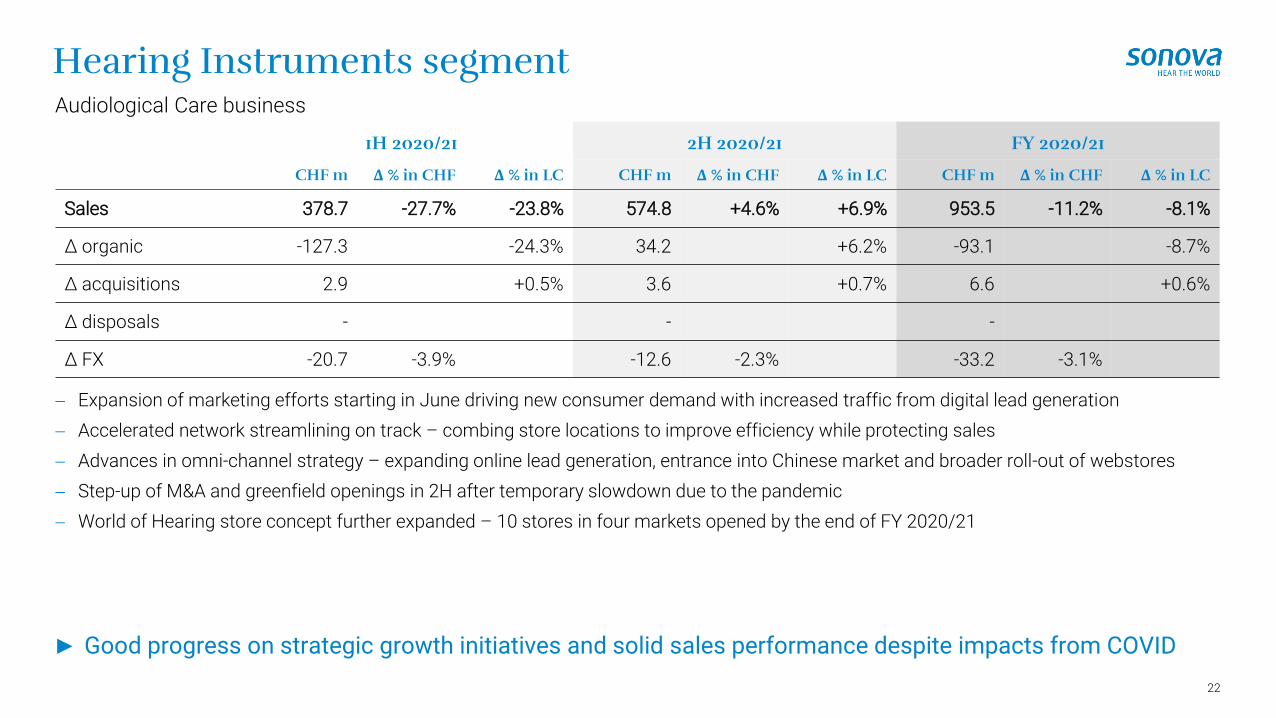
Sales 378.7 -27.7% -23.8% 574.8 +4.6% +6.9% 953.5 -11.2% -8.1%
Δ organic -127.3 -24.3% 34.2 +6.2% -93.1 -8.7%
Δ acquisitions 2.9 +0.5% 3.6 +0.7% 6.6 +0.6%
Δ disposals - - -
Δ FX -20.7 -3.9% -12.6 -2.3% -33.2 -3.1%
Hearing Instruments segment
22
Audiological Care business
► Good progress on strategic growth initiatives and solid sales performance despite impacts from COVID
− Expansion of marketing efforts starting in June driving new consumer demand with increased traffic from digital lead generation
− Accelerated network streamlining on track – combing store locations to improve efficiency while protecting sales
− Advances in omni-channel strategy – expanding online lead generation, entrance into Chinese market and broader roll-out of webstores
− Step-up of M&A and greenfield openings in 2H after temporary slowdown due to the pandemic
− World of Hearing store concept further expanded – 10 stores in four markets opened by the end of FY 2020/21

Cochlear Implants segment
23

Cochlear Implants segment
24
Key financials – half-year view
► Gradual improvement in sales and profitability supported by product launch and engagement initiatives
1H 2020/21 2H 2020/21 FY 2020/21
CHF m Δ % in CHF Δ % in LC CHF m Δ % in CHF Δ % in LC CHF m Δ % in CHF Δ % in LC
Sales 83.1 -37.2% -33.8% 101.4 +3.0% +8.2% 184.5 -20.0% -15.9%
Δ organic -44.7 -33.8% +8.1 +8.2% --36.6 -15.9%
Δ FX -4.4 -3.3% -5.2 -5.2% -9.6 -4.1%
EBITA (adj.) -10.1 NM NM -4.2 NM NM -14.3 NM NM
EBITA margin (adj.) -12.2% NM NM -4.1% NM NM -7.8% NM NM
− Development significantly restricted by reduction in the number of elective surgeries as hospitals focused on the pandemic
− Good progress in reducing impact from voluntary field corrective action through targeted customer engagement
− Launch of new sound processors based on proven Marvel technology driving interest and supporting momentum towards year-end
− Structural savings with 4% ROS benefit in product cost and OPEX, continuous improvement momentum accelerating
Note: adj. refers to adjusted figures; for details, please refer to Appendix – Non-GAAP adjustments

Cochlear Implants segment
25
Sales by product groups
► Sequential improvement driven by expansion in hospital capacity in 2H and launch of new sound processors
System sales− Good sequential progress after sharp decline in 1H from pandemic headwinds and impact of voluntarily field corrective action
− YOY sales comparison in 2H distorted by returns for credit related to the voluntary field corrective action in the prior year period
Upgrade sales− Reduced audiology counselling capacity as hospitals focused on COVID-19 patients affecting upgrade volumes throughout the year
− Introduction of two new sound processors towards the end of the period – Naída™ CI Marvel for adults and Sky CI™ Marvel for children
− CI Marvel processors based on proven Marvel technology – bringing leading sound processing and wireless connectivity to CI recipients
− Strong market reception of new sound processors by both consumers and clinicians, expected to help AB regain market share
1H 2020/21 2H 2020/21 FY 2020/21
CHF m Δ % in LC CHF m Δ % in LC CHF m Δ % in LC
Cochlear implant systems 60.6 -35.4% 68.7 +10.5% 129.3 -17.1%
Upgrades and accessories 22.5 -29.1% 32.7 +3.7% 55.2 -12.8%
Total CI segment 83.1 -33.8% 101.4 +8.2% 184.5 -15.9%
Financial information
26

Financial information
27
Highlights
TSR & Balance Sheet
OpFCF
Profitability
Sales
− Sales of CHF 2,601.9 million
− Growth of -6.8% in LC (organic -7.1%), -10.8% in CHF (FX headwind: CHF 115.7 million)
− Return to growth in 2H with sales up +6.6% in LC
− Gross profit margin (adj.) of 72.3%, margin up +60bps in LC
− EBITA (adj.) of CHF 603.0 million, up +5.6% in LC, margin up +290bps in LC and up +600bps in LC in 2H
− EPS (adj.) of CHF 7.71, up +15.5% in LC reflecting earnings growth
− Operating free cash flow (OpFCF) at CHF 602.4 million, down -5.7%
− YOY development in working capital distorted by pandemic-driven volatility
− Continued strong cash conversion (OpFCF/adj. EBITA) of 100%
− Dividend of CHF 3.20 proposed – up 10% vs. FY 2018/19 and representing a payout ratio of 42% (adj.)
− Board of Directors approved a new share buyback program of up to CHF 700 million for FY 2021/22
− Limited leverage (net debt/EBITDA ratio of 0.8x) providing financial flexibility
Note: adj. refers to adjusted figures; for details, please refer to Appendix – Non-GAAP adjustments

Financial information
28
Key financials – As reported and adjusted
► Sustained market share gains – Strong profitability and solid cash flow despite FX and COVID-19 headwind
FY 2019/20 FY 2020/21
∆ % in CHF ∆ % in LCCHF m Margin CHF m Margin
Sales (reported) 2,916.9 2,601.9 -10.8% -6.8%
Gross profit (adj.) 2,106.9 72.0% 1,880.2 72.3% -10.8% -6.4%
OPEX (adj.) 1,486.2 1,277.1 -14.1% -11.4%
EBITA (adj.) 620.8 21.2% 603.0 23.2% -2.9% +5.6%
Adjustments -66.4 60.3
EBITA (reported) 554.3 19.0% 663.3 25.5% +19.7% +30.5%
EPS (adj. in CHF) 7.39 7.71 +4.3% +15.5%
EPS (reported in CHF) 7.61 9.23 +21.3% +33.7%
Operating free cash flow (reported) 638.5 602.4 -5.7%
ROCE (reported) 18.2% 22.3%
Note: adj. refers to adjusted figures; for details, please refer to Appendix – Non-GAAP adjustments

FY 2019/20 FY 2020/21
CommentsCHF m CHF m Δ % in CHF Δ % in LC
Research & Development (adj.)
- in % of sales (adj.)
-163.25.6%
-177.96.8%
+9.0% +10.3% ‒ Increased level of investment in innovation despite COVID‒ Earn out expenses from recent technology acquisition
Sales & Marketing (adj.)
- in % of sales (adj.)
-1,023.835.0%
-858.633.0%
-16.1% -13.0% ‒ Increased investment in customer-facing resources‒ Otherwise strict cost control and COVID-related savings‒ Benefits from structural initiatives, in particular in AC
General & Administration (adj.)
- in % of sales (adj.)
-299.310.2%
-242.09.3%
-19.1% -16.6% ‒ Ongoing investment in IT platform for AC business‒ Benefits from ongoing back office consolidation‒ Release of bad debt provision (CHF 16.3 million), largely
offset by higher legal provisions
Other income/expenses (adj.) 0.1 1.4 n/a n/a
Total OPEX (adj.)
- in % of sales (adj.)
-1,486.250.8%
-1,277.149.1%
-14.1% -11.4% ‒ Government support of CHF 42.5 million, largely in 1H
Adjustments -43.1 66.9 ‒ FY 2019/20: restructuring and voluntary field action‒ FY 2020/21: restructuring, AB award and impairment of
capitalized development costs
Total OPEX (reported)
- in % of sales (reported)
-1,529.352.4%
-1,210.346.5%
-20.9% -18.8%
Financial information
29
Operating expenses excluding acquisition-related amortization
► Strict cost control and benefits from optimization initiatives supporting sustained investments in growth
Note: adj. refers to adjusted figures; for details, please refer to Appendix – Non-GAAP adjustments
30
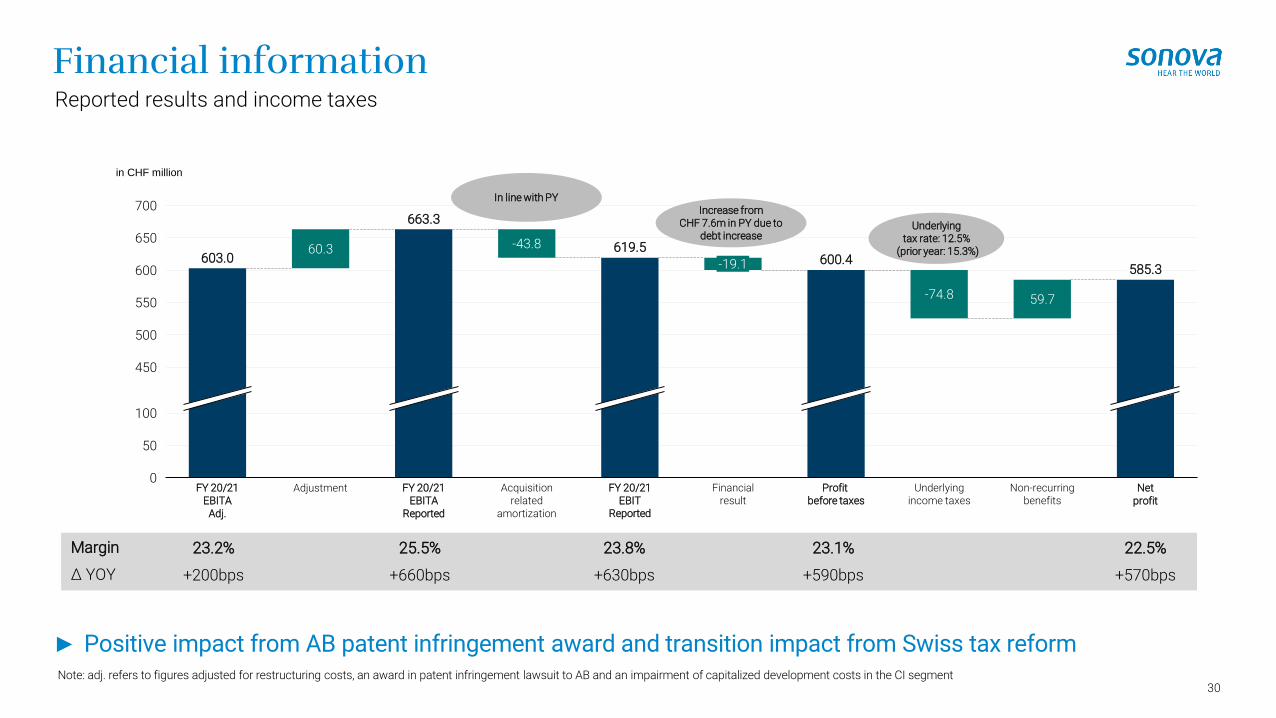
Reported results and income taxes
60.3
59.7
650
550
500
700
100
450
50
0
600
Netprofit
663.3
603.0-43.8
Adjustment Acquisitionrelated
amortization
619.5
-19.1 600.4585.3
FY 20/21EBITA
Adj.
Profit before taxes
FY 20/21EBITA
Reported
Non-recurring benefits
FY 20/21EBIT
Reported
Financialresult
-74.8
Underlying income taxes
in CHF million
Margin
Δ YOY
23.2%
+200bps
25.5%
+660bps
23.8%
+630bps
22.5%
+570bps
23.1%
+590bps
Underlying tax rate: 12.5%
(prior year: 15.3%)
► Positive impact from AB patent infringement award and transition impact from Swiss tax reform
Financial information
Note: adj. refers to figures adjusted for restructuring costs, an award in patent infringement lawsuit to AB and an impairment of capitalized development costs in the CI segment
In line with PYIncrease from
CHF 7.6m in PY due to debt increase

Financial information
31
Operating free cash flow (OpFCF)
► NWC change distorted by pandemic-driven volatility – Strong cash conversion (OpFCF/adj. EBITA) of 100%
Growthcomponents
+3.5% -5.7%-28.2%-2.5%+15.3%
in CHF million
98.0
22.6
39.6
680
640
560
720
520
40
0
760
600
FY 20/21OpFCF
Depreciation & Amortization Incometaxes paid
Profit before tax
602.4
-180.1
FY 19/20OpFCF
Δ NWC &Other items
-16.2
CAPEX
638.5
+6.2%
Affected by COVID related sales phasing &
safety stock
Reflecting liquidity protection measures

Financial information
32
Balance sheet
► Strong balance sheet provides strategic flexibility
CHF m 31 Mar 2020 31 Mar 2021 Comments
Days sales outstanding (DSO) 56 56‒ Strong collection management throughout the pandemic
Days inventory outstanding (DIO) 133 154‒ Targeted stock increases to mitigate supply chain risks
Capital employed 2,692.5 2,855.7‒ Higher receivables due to strong March vs. PY‒ Increased safety stock
ROCE (reported) 18.2% 22.3%‒ Improvement driven by operating performance and
AB patent infringement award
Net debt 663.0 83.3‒ Driven by solid cash flow ‒ Supported by suspension of cash dividend and SBB
Net debt/EBITDA 0.8x 0.1x
Note: DSO and DIO calculated on a 90 day basis

Outlook
33

Outlook
34
Monthly unit market development and short-term trends
► Recovery underway, supported by vaccination programs – Strong base effect starting in March 2021
− Overall situation still remains dynamic
− Strong rebound in several major markets in March, supported by pent-up demand and benefiting from vaccinations
− Strong unit growth in FR in YTD 2021, driven by reimbursement change
− Commercial market leading the recovery
− Some large markets (e.g. UK) are lagging as more restrictive lockdown measures are persisting longer
Sep.Jun.Apr. May Jul. Aug. Oct. Nov. Dec. Jan. Feb. Mar. Apr.
Actual Same period of the prior year 2019
May Nov.Sep.Jul.Jun.Apr. Aug. Oct. Dec. Jan. Feb. Mar. Apr.
Jul.Apr. Aug. Oct.May Sep.Jun. Nov. Dec. Jan. Feb. Mar. Apr.
Mar.- Apr. 2Y CAGR: + 9%
Apr.2020 - Feb.2021: - 22% (vs. same period of the prior year)
Mar.- Apr. 2Y CAGR: + 7%
Apr.2020 - Feb.2021: -17% (vs. same period of the prior year)
Mar.- Apr. 2Y CAGR: -1%
Apr.2020 - Feb.2021: - 4% (vs. same period of the prior year)
Source: Official Industry Reports (HIA, CAEA, BVHI)
Outlook
35
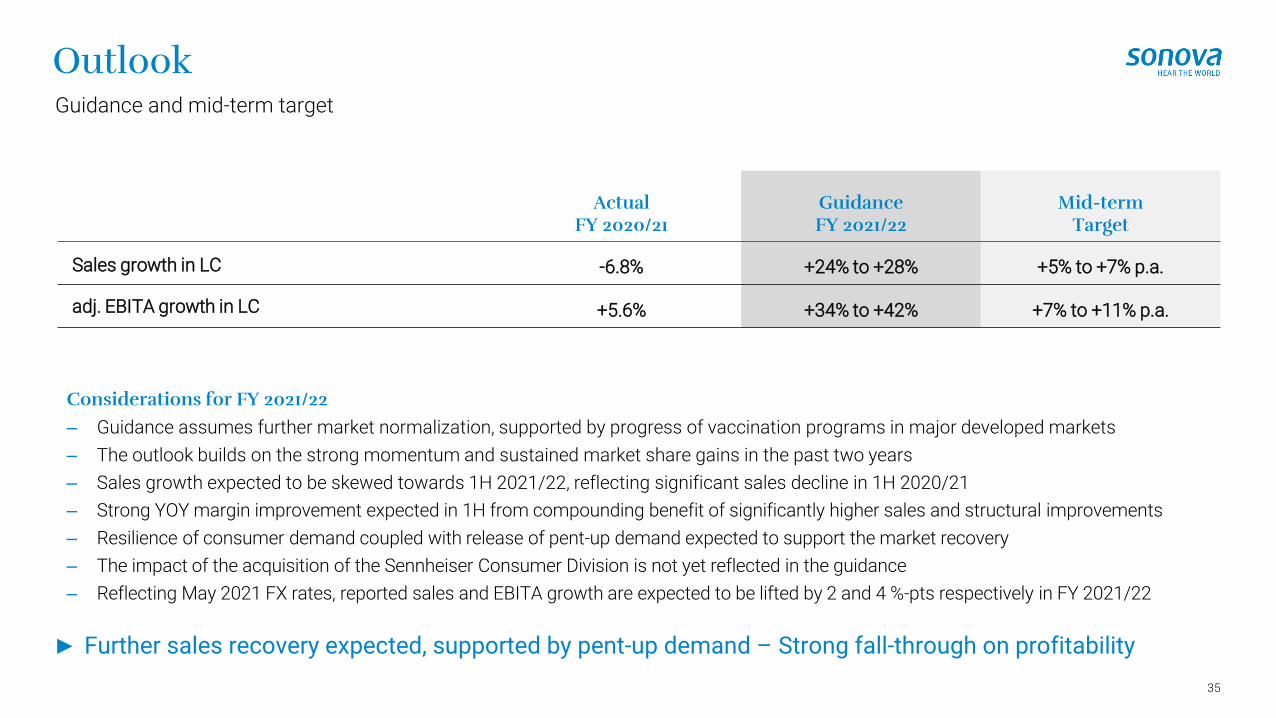
Guidance and mid-term target
► Further sales recovery expected, supported by pent-up demand – Strong fall-through on profitability
Considerations for FY 2021/22‒ Guidance assumes further market normalization, supported by progress of vaccination programs in major developed markets
‒ The outlook builds on the strong momentum and sustained market share gains in the past two years
‒ Sales growth expected to be skewed towards 1H 2021/22, reflecting significant sales decline in 1H 2020/21
‒ Strong YOY margin improvement expected in 1H from compounding benefit of significantly higher sales and structural improvements
‒ Resilience of consumer demand coupled with release of pent-up demand expected to support the market recovery
‒ The impact of the acquisition of the Sennheiser Consumer Division is not yet reflected in the guidance
‒ Reflecting May 2021 FX rates, reported sales and EBITA growth are expected to be lifted by 2 and 4 %-pts respectively in FY 2021/22
ActualFY 2020/21
GuidanceFY 2021/22
Mid-termTarget
Sales growth in LC -6.8% +24% to +28% +5% to +7% p.a.
adj. EBITA growth in LC +5.6% +34% to +42% +7% to +11% p.a.

Outlook
36
Total shareholder return (TSR) – Cash deployment strategy
► TSR strategy aimed at creating shareholder value – Re-initiation of share buyback program decided
1. Acquisitions
2. Attractive dividend
3. Healthy balance sheet
4. Share buyback program
− Acceleration of bolt-on acquisitions – CHF 70-100 million p.a.
− Strategic and technology acquisitions
Sonova TSR
strategy
− Restarting cash dividends worth more than CHF 200 million
− Maintain payout ratio of around 40%
− Preserving financial and strategic flexibility
− Restarting buyback program
− Targeting up to CHF 700 million in FY 2021/22
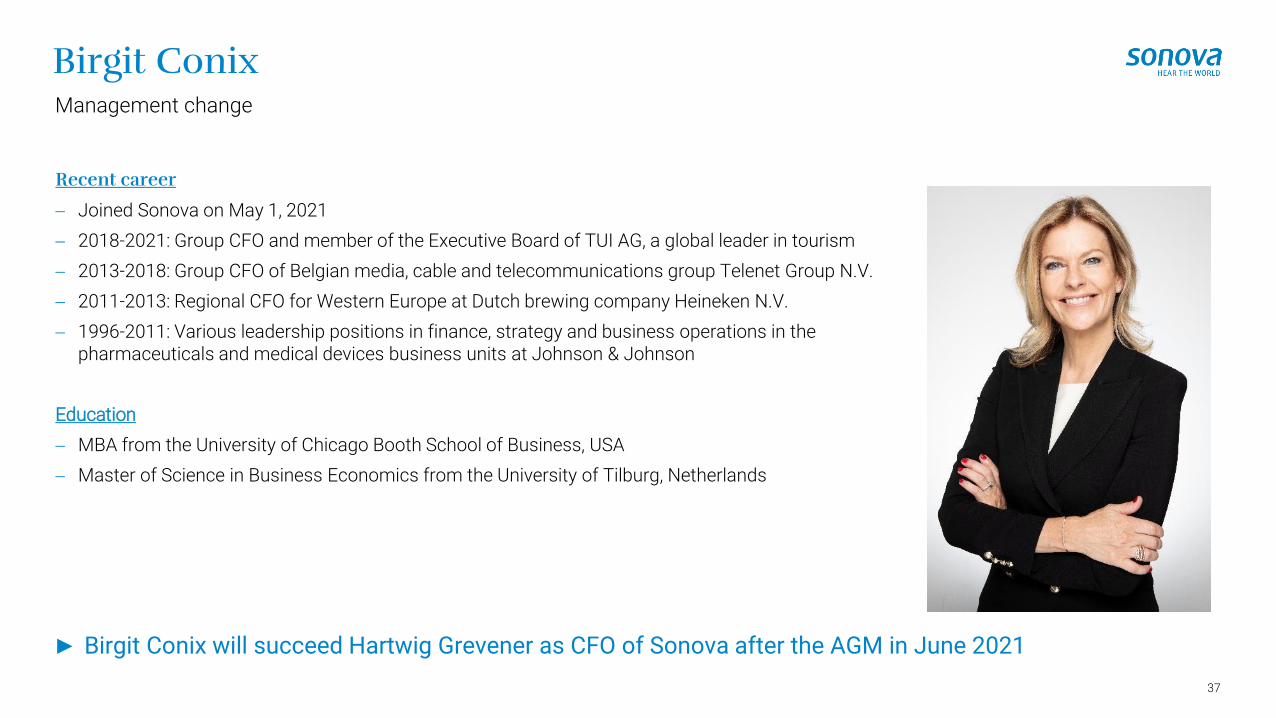
Birgit Conix
37
Recent career
− Joined Sonova on May 1, 2021
− 2018-2021: Group CFO and member of the Executive Board of TUI AG, a global leader in tourism
− 2013-2018: Group CFO of Belgian media, cable and telecommunications group Telenet Group N.V.
− 2011-2013: Regional CFO for Western Europe at Dutch brewing company Heineken N.V.
− 1996-2011: Various leadership positions in finance, strategy and business operations in the pharmaceuticals and medical devices business units at Johnson & Johnson
Education
− MBA from the University of Chicago Booth School of Business, USA
− Master of Science in Business Economics from the University of Tilburg, Netherlands
Management change
► Birgit Conix will succeed Hartwig Grevener as CFO of Sonova after the AGM in June 2021

Q&A
38

39
Thank you!

Appendix
40
Appendix
41
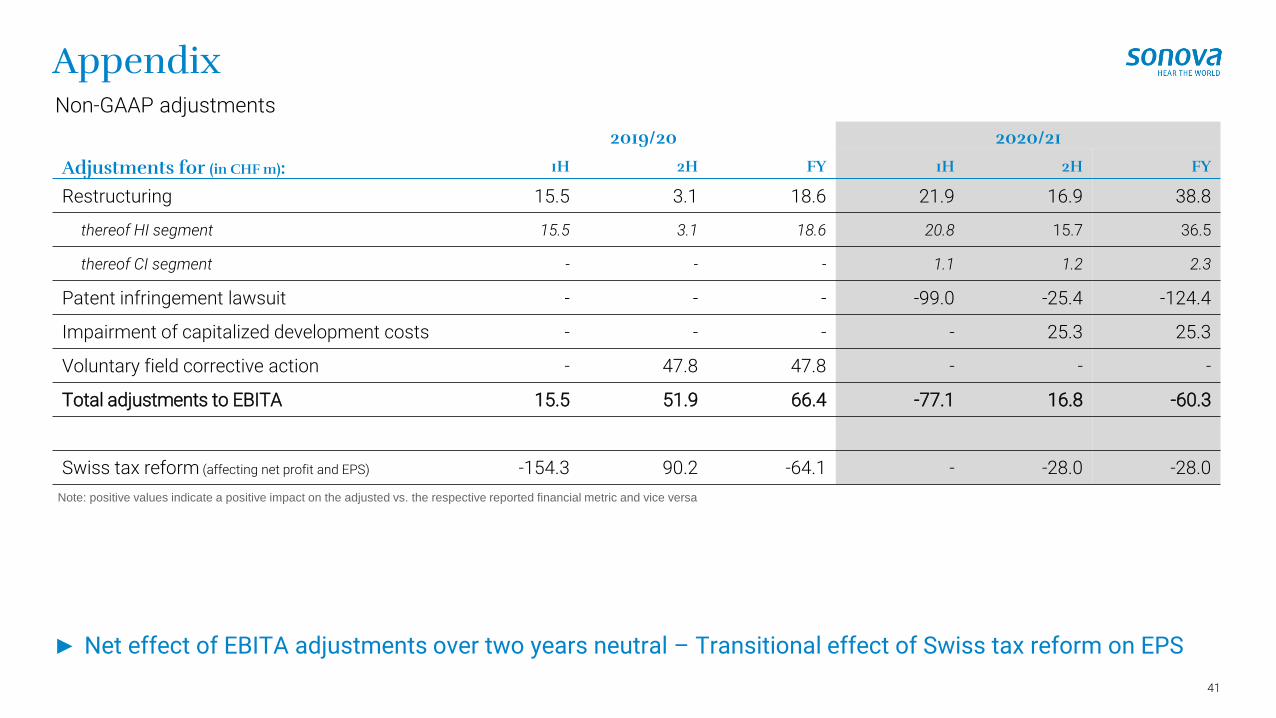
Non-GAAP adjustments
► Net effect of EBITA adjustments over two years neutral – Transitional effect of Swiss tax reform on EPS
2019/20 2020/21
Adjustments for (in CHF m): 1H 2H FY 1H 2H FY
Restructuring 15.5 3.1 18.6 21.9 16.9 38.8
thereof HI segment 15.5 3.1 18.6 20.8 15.7 36.5
thereof CI segment - - - 1.1 1.2 2.3
Patent infringement lawsuit - - - -99.0 -25.4 -124.4
Impairment of capitalized development costs - - - - 25.3 25.3
Voluntary field corrective action - 47.8 47.8 - - -
Total adjustments to EBITA 15.5 51.9 66.4 -77.1 16.8 -60.3
Swiss tax reform (affecting net profit and EPS) -154.3 90.2 -64.1 - -28.0 -28.0
Note: positive values indicate a positive impact on the adjusted vs. the respective reported financial metric and vice versa

Appendix
42
Sonova Group – Half-year view
1H 2020/21 2H 2020/21 FY 2020/21CHF m Δ % in CHF Δ % in LC CHF m Δ % in CHF Δ % in LC CHF m Δ % in CHF Δ % in LC
HI segment 986.5 -23.8% -19.6% 1,430.8 +2.8% +6.5% 2,417.3 -10.0% -6.1%
CI segment 83.1 -37.2% -33.8% 101.4 +3.0% +8.2% 184.5 -20.0% -15.9%
Total Sonova 1,069.6 -25.0% -20.9% 1,532.2 +2.8% +6.6% 2,601.9 -10.8% -6.8%
Δ organic -301.6 -21.1% 94.1 +6.3% -207.5 -7.1%
Δ acquisitions 3.8 +0.3% 4.3 +0.3% 8.2 +0.3%
Δ disposals - - - - -
Δ FX -58.9 -4.1% -56.8 -3.8% -115.7 -4.0%

Appendix
43
Sonova Group – FX impact on sales and margins
► USD and EUR account for roughly two thirds of the overall FX exposure
USD/CHF EUR/CHF
Rate Sales EBITA
USD/CHF +/- 5% +/- CHF 49 million +/- CHF 19 million
EUR/CHF +/- 5% +/- CHF 63 million +/- CHF 30 million

Appendix
44
Sonova Group – FX impact on sales and margins
► Seven main currencies account for over 80% of Group sales
FY-19/20 1H-20/21 2H-20/21 FY-20/21Effect
FY-20/21Spot
May-2021
USD 0.99 0.94 0.90 0.92 - 0.90
EUR 1.10 1.07 1.08 1.08 - 1.10
GBP 1.25 1.19 1.22 1.21 - 1.27
CAD 0.74 0.69 0.70 0.70 - 0.75
AUD 0.67 0.65 0.68 0.66 - 0.70
BRL 0.24 0.18 0.17 0.17 - 0.17
JPY 100 0.91 0.88 0.86 0.87 - 0.83
USD
EUR
GBP, CAD, BRL, AUD and JPY
Other