Full-year results 2017 Conference - Nestlé · 16 | February 15, 2018 | Nestlé full-year results...
22
Full-year results 2017 Conference | February 15, 2018 | Nestlé full-year results 2017 1
Transcript of Full-year results 2017 Conference - Nestlé · 16 | February 15, 2018 | Nestlé full-year results...

Full-yearresults 2017Conference
| February 15, 2018 | Nestlé full-year results 20171

Disclaimer
This presentation contains forward looking statements which reflect
Management’s current views and estimates.
The forward looking statements involve certain risks and uncertainties that
could cause actual results to differ materially from those
contained in the forward looking statements. Potential risks and uncertainties
include such factors as general economic conditions, foreign exchange
fluctuations, competitive product and pricing pressures and regulatory
developments.
| February 15, 2018 | Nestlé full-year results 20172
Mark Schneider, CEO
| February 15, 2018 | Nestlé full-year results 20173
Full-yearresults 2017
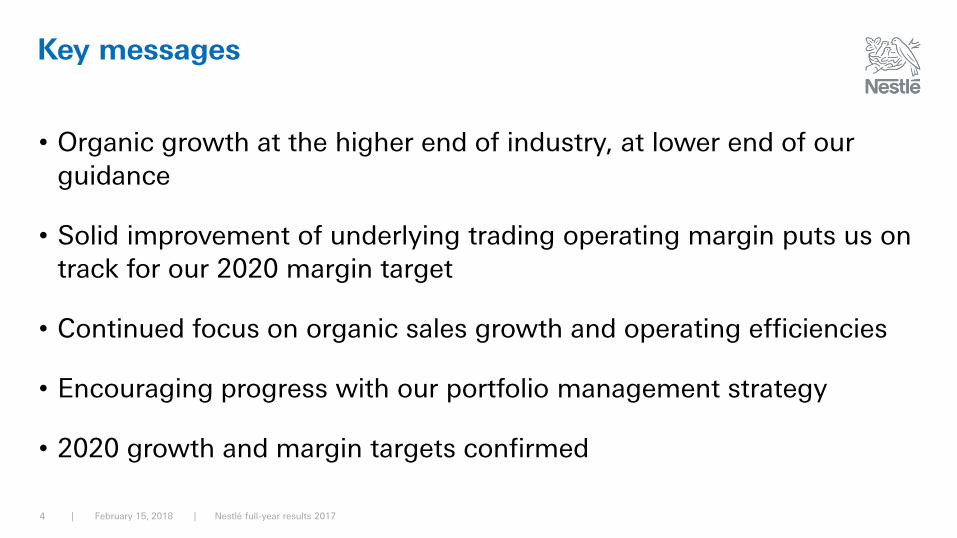
Key messages
| February 15, 2018 | Nestlé full-year results 20174
• Organic growth at the higher end of industry, at lower end of our
guidance
• Solid improvement of underlying trading operating margin puts us on track for our 2020 margin target
• Continued focus on organic sales growth and operating efficiencies
• Encouraging progress with our portfolio management strategy
• 2020 growth and margin targets confirmed
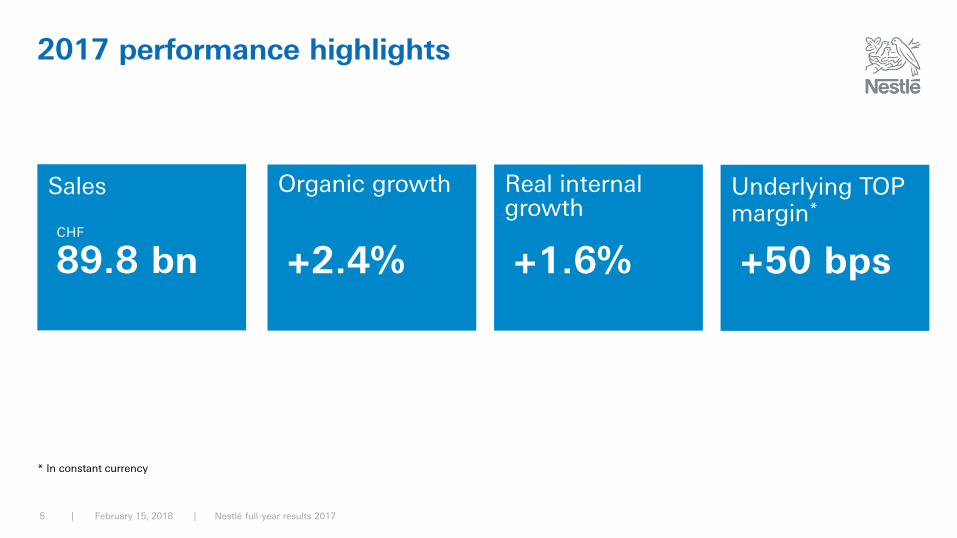
Underlying TOP margin*
+50 bps
2017 performance highlights
Sales
89.8 bn
Organic growth
+2.4%
| February 15, 2018 | Nestlé full-year results 20175
CHF
Real internalgrowth
+1.6%
* In constant currency

• Industry-leading volume growth; all categories with positive sales growth; UTOP +50 bps*
• U.S. Confectionery, Atrium, Blue Bottle Coffee…
• Adjustment of management structures (Nestlé Nutrition, Nestlé Professional)
• 18.2% TSR improvement in 2017**
Delivering on our commitments
| February 15, 2018 | Nestlé full-year results 20176
Commitments 2017 Achievements
* In constant currency ** In CHF (Source: Bloomberg)
• Deliver balanced growth with margin improvement
• Optimize portfolio
• Drive speed and simplicity in our global organization
• Commitment to long-term value creation

| February 15, 2018 | Nestlé full-year results 20177
Actual 2017 OG
(+x)
2.4%
Mid-single digit
2020 OG TargetPortfolio management
Fixing base business
High-growthcategories
2017 examples:
• Yinlu stabilized
• Gerber baby foodline relaunched in U.S.
2017 examples:
Acquisitions:Atrium, Blue BottleCoffee, Sweet Earth, Chameleon
Disposals:U.S. Confectionery
2017 examples:
• E-commerce sales: +32%* OG
• Nespresso U.S.: mid-teens OG
• Petcare in emerging markets: +17% OG
• Perrier & S. Pellegrino: +7% OG
* Excluding Nespresso
Clear path to achieving mid-single digit growth by 2020

18.7%
19.2%
19.6%
19.2%
Operating efficiencies driving margin improvement
| February 15, 2018 | Nestlé full-year results 20178
FY structural costs* as a % of sales (Manufacturing, Procurement, G&A)
2014 2015 2016 2017
* On comparable basis, excluding Froneri
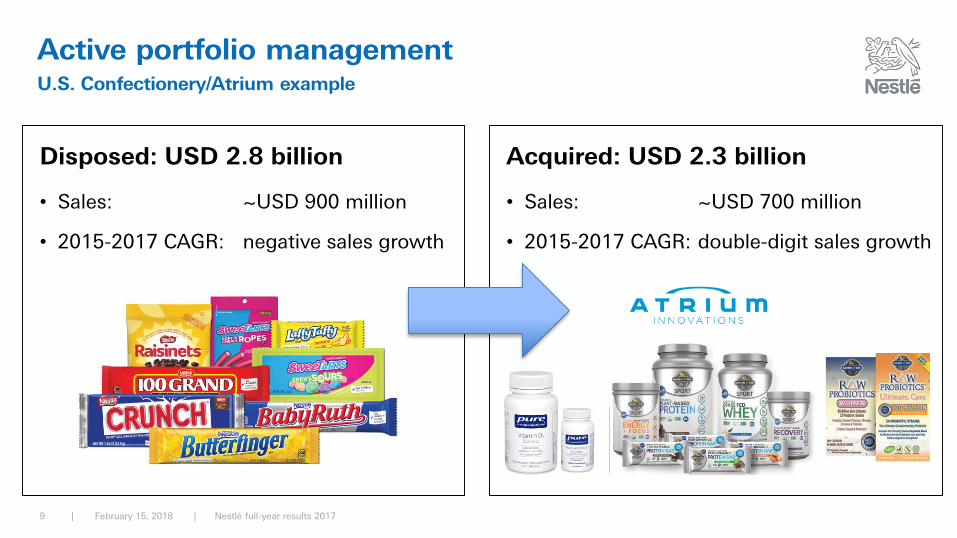
Active portfolio management U.S. Confectionery/Atrium example
| February 15, 2018 | Nestlé full-year results 20179
Acquired: USD 2.3 billion
• Sales: ~USD 700 million
• 2015-2017 CAGR: double-digit sales growth
Disposed: USD 2.8 billion
• Sales: ~USD 900 million
• 2015-2017 CAGR: negative sales growth
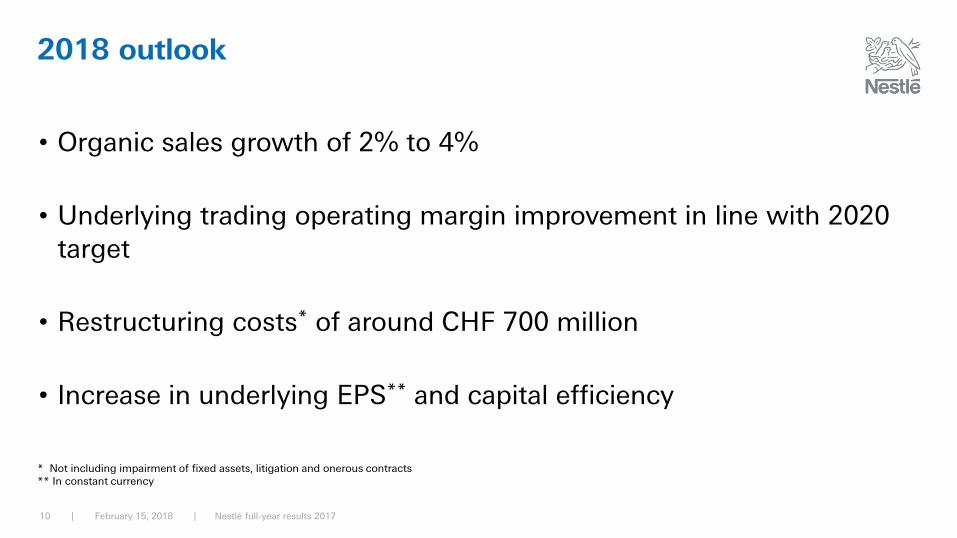
2018 outlook
| February 15, 2018 | Nestlé full-year results 201710
• Organic sales growth of 2% to 4%
• Underlying trading operating margin improvement in line with 2020 target
• Restructuring costs* of around CHF 700 million
• Increase in underlying EPS** and capital efficiency
* Not including impairment of fixed assets, litigation and onerous contracts ** In constant currency

François-Xavier Roger, CFO
| February 15, 2018 | Nestlé full-year results 201711
Full-yearresults 2017
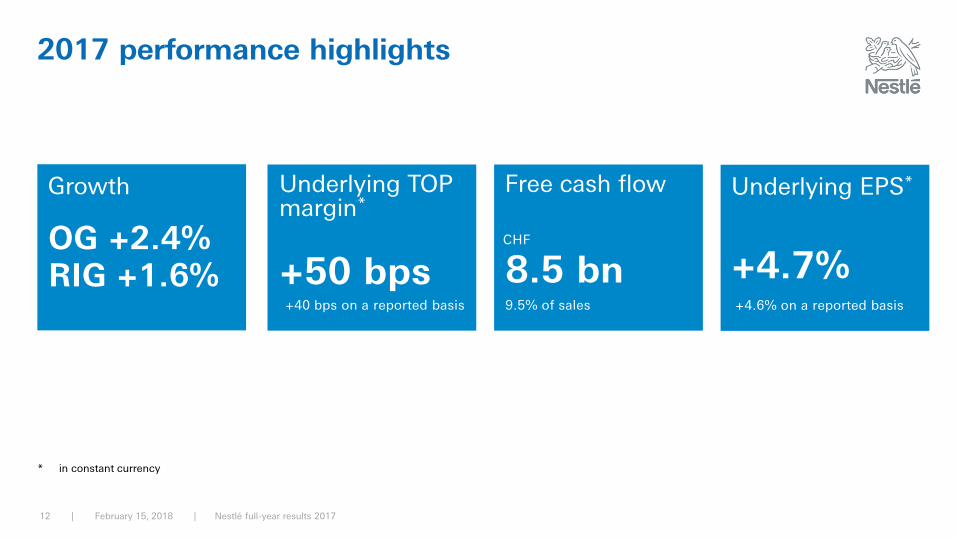
Underlying EPS*
+4.7%
2017 performance highlights
Growth
OG +2.4%RIG +1.6%
+40 bps on a reported basis +4.6% on a reported basis
| February 15, 2018 | Nestlé full-year results 2017
9.5% of sales
Free cash flow
8.5 bn
Underlying TOP margin*
+50 bpsCHF
* in constant currency
12
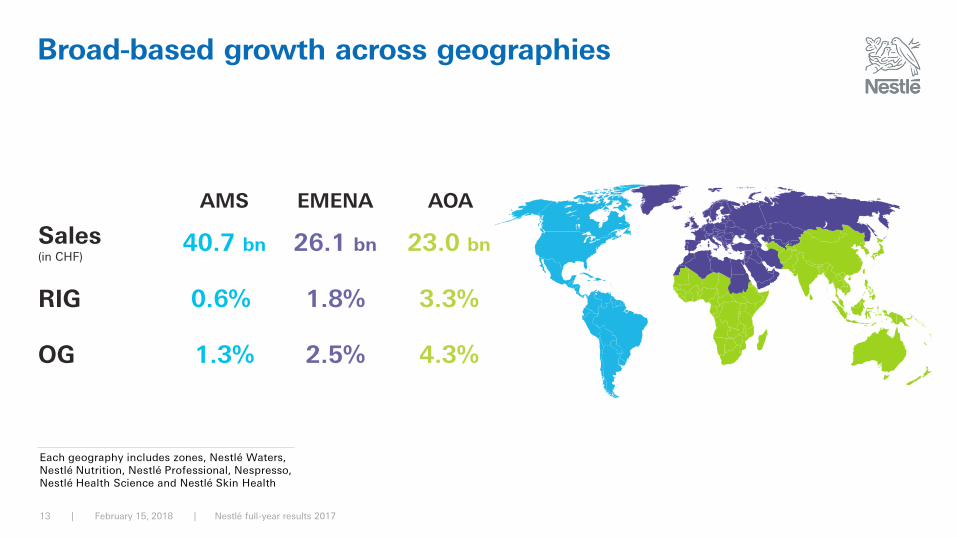
Broad-based growth across geographies
Each geography includes zones, Nestlé Waters,Nestlé Nutrition, Nestlé Professional, Nespresso,Nestlé Health Science and Nestlé Skin Health
AMS EMENA AOA
Sales (in CHF)
40.7 bn 26.1 bn 23.0 bn
RIG 0.6% 1.8% 3.3%
OG 1.3% 2.5% 4.3%
| February 15, 2018 | Nestlé full-year results 201713

Accelerated RIG in emerging markets
Developed Emerging
Sales (in CHF)
% of group sales
51.3 bn57%
38.5 bn43%
RIG 0.7% 3.0%
OG 0.7% 4.8%
| February 15, 2018 | Nestlé full-year results 201714
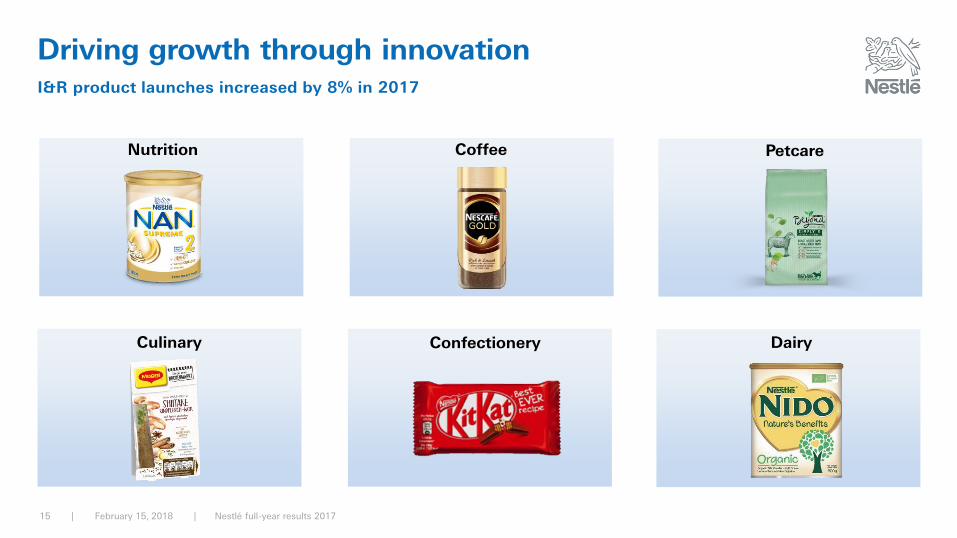
Driving growth through innovation
| February 15, 2018 | Nestlé full-year results 201715
I&R product launches increased by 8% in 2017
Nutrition
Culinary Confectionery
Coffee
Dairy
Petcare
| February 15, 2018 | Nestlé full-year results 201716
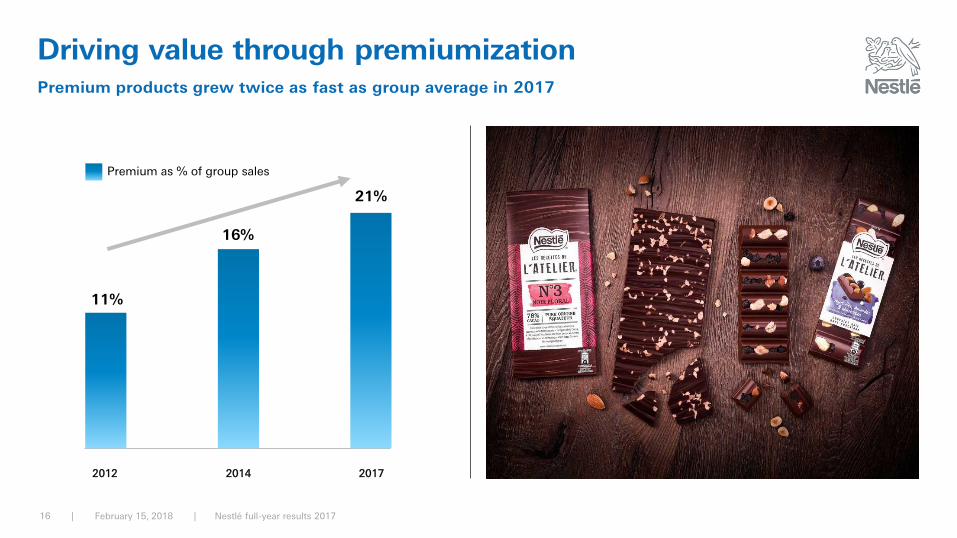
2012 2014 2017
11%
16%
21%
Premium as % of group sales
Driving value through premiumizationPremium products grew twice as fast as group average in 2017
| February 15, 2018 | Nestlé full-year results 201717
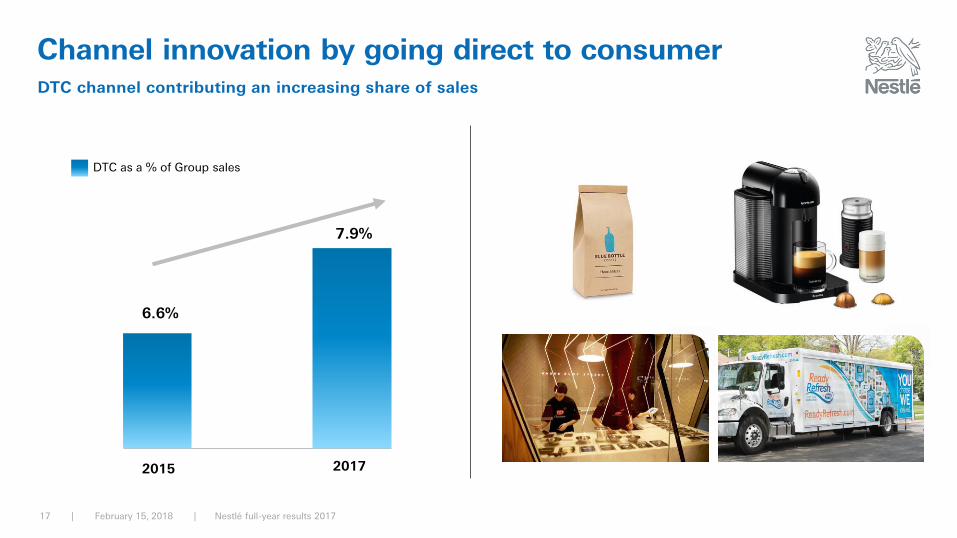
Channel innovation by going direct to consumerDTC channel contributing an increasing share of sales
2015 2017
6.6%
7.9%
DTC as a % of Group sales
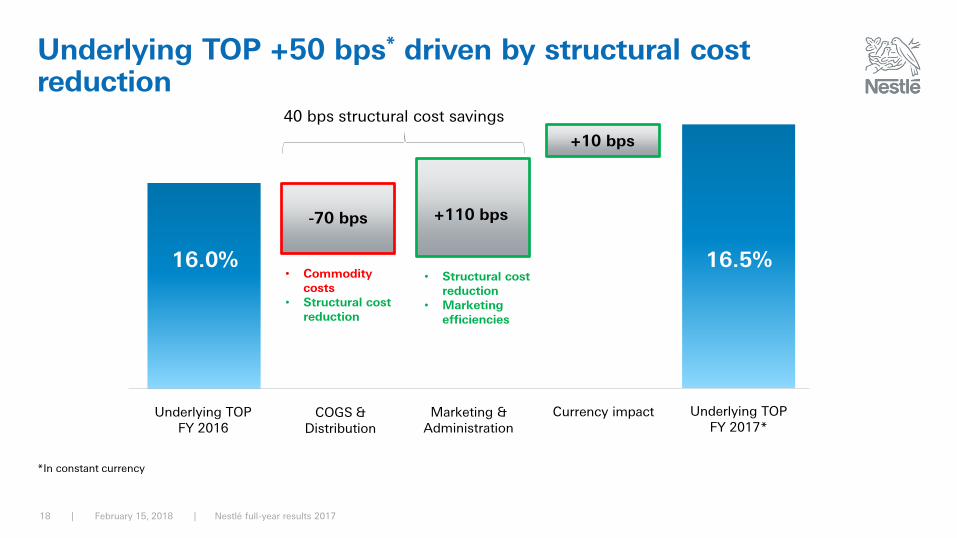
Underlying TOP +50 bps* driven by structural cost reduction
| February 15, 2018 | Nestlé full-year results 201718
Underlying TOPFY 2016
COGS &Distribution
Marketing & Administration
Underlying TOPFY 2017*
-70 bps +110 bps
16.0%
-30
16.5%
Currency impact
• Commodity costs
• Structural cost reduction
• Structural cost reduction
• Marketing efficiencies
+10 bps
*In constant currency
40 bps structural cost savings
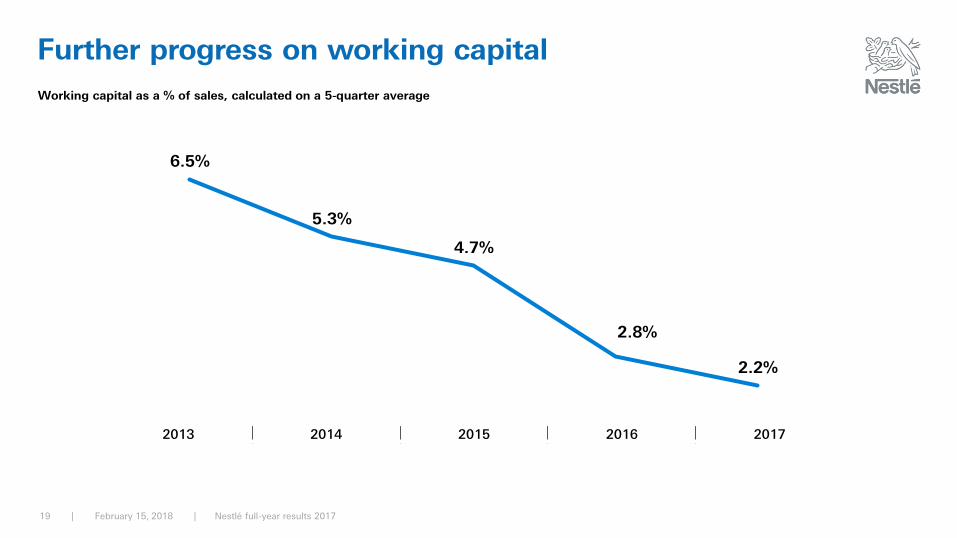
6.5%
5.3%
4.7%
2.8%
2.2%
| February 15, 2018 | Nestlé full-year results 201719
2013 2014 2015 2016 2017
Further progress on working capital
Working capital as a % of sales, calculated on a 5-quarter average
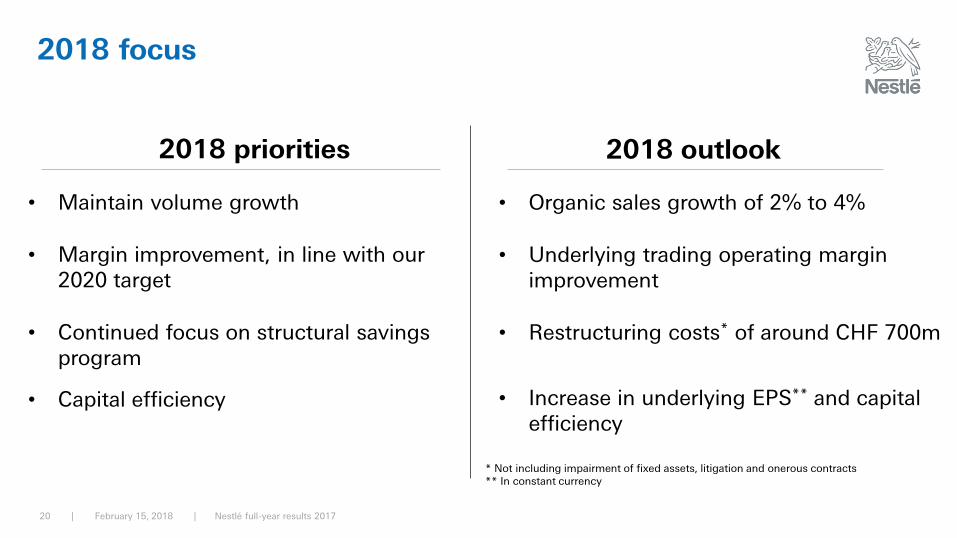
2018 focus
| February 15, 2018 | Nestlé full-year results 201720
2018 priorities 2018 outlook
• Maintain volume growth
• Margin improvement, in line with our 2020 target
• Continued focus on structural savings program
• Capital efficiency
• Organic sales growth of 2% to 4%
• Underlying trading operating margin improvement
• Restructuring costs* of around CHF 700m
• Increase in underlying EPS** and capital efficiency
* Not including impairment of fixed assets, litigation and onerous contracts ** In constant currency

Full-yearresults 2017
| February 15, 2018 | Nestlé full-year results 201721
Discussion
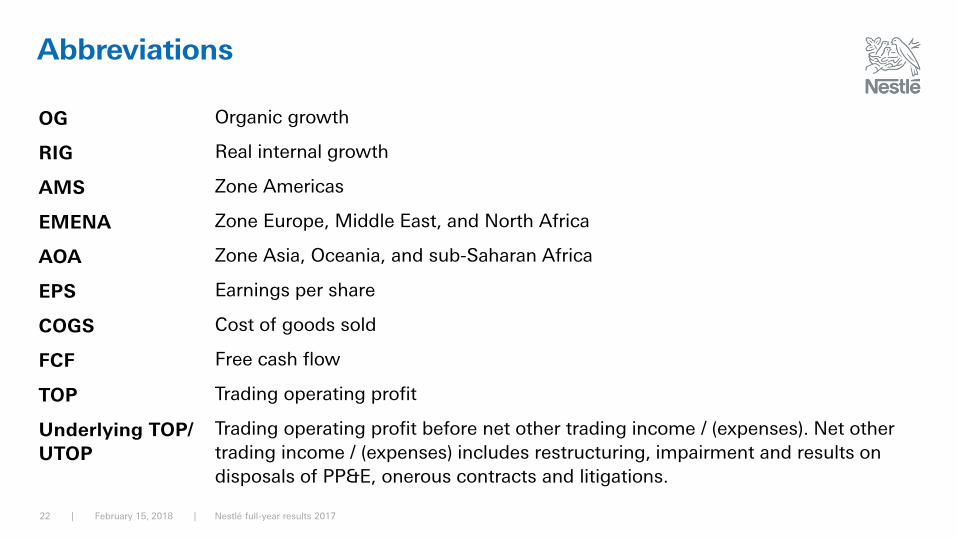
Abbreviations
OG
RIG
AMS
EMENA
AOA
EPS
COGS
FCF
TOP
Underlying TOP/
UTOP
Organic growth
Real internal growth
Zone Americas
Zone Europe, Middle East, and North Africa
Zone Asia, Oceania, and sub-Saharan Africa
Earnings per share
Cost of goods sold
Free cash flow
Trading operating profit
Trading operating profit before net other trading income / (expenses). Net other
trading income / (expenses) includes restructuring, impairment and results on
disposals of PP&E, onerous contracts and litigations.
| February 15, 2018 | Nestlé full-year results 201722