Fuel mass and stand structure after post-fire logging of a severely ...
12
Fuel mass and stand structure after post-fire logging of a severely burned ponderosa pine forest in northeastern Oregon J.D. McIver a, * , R. Ottmar b a Forestry and Range Sciences Laboratory, Pacific Northwest Research Station, La Grande, OR, USA b Forestry Sciences Laboratory, Pacific Northwest Research Station, Seattle, WA, USA Received 12 August 2006; received in revised form 20 October 2006; accepted 20 October 2006 Abstract Stand structure and fuel mass were measured before and after a post-fire logging operation conducted 2 years after the 1996 Summit Wildfire (Malheur National Forest), in a ponderosa pine-dominated forest in northeastern Oregon. Variables were measured both pre- and post-logging in four replicate units for each of three treatments [un-logged control, commercial harvest (most dead merchantable trees removed), fuel reduction harvest (most dead merchantable trees removed plus most dead trees >10 cm diameter)]. Post-fire logging resulted in a significant decrease in mean basal area, down to 46% pre-treatment level in commercial units, and down to 25% in fuel reduction units. Logging significantly reduced tree density, especially for the smallest (<22 cm diameter) and intermediate (23–41 cm) diameter classes. Fuel reduction units also had significantly fewer snags (dead trees >30 cm diameter—4 ha 1 ), compared to both commercial (23 ha 1 ) units and to un-logged controls (64 ha 1 ) in the year following timber harvest. Logging did not change ladder height or tree species composition (% ponderosa pine, Douglas-fir and grand fir). Total woody fuel mass increased significantly in fuel reduction units when compared to controls, with the greatest difference among treatments occurring in the slash fuel (<7.6 cm diameter) component (mean of 6.2 Mg/ha for fuel reduction stands versus 1.3 Mg/ha for un-logged stands). Logging activity caused no change in the mass of the forest floor (litter or duff). Model projections of the fuel bed using the fire and fuels extension of the forest vegetation simulator (FVS–FFE) indicate that the disparity in slash fuel mass between fuel reduction and un-logged units would be sustained until about 15 years post-logging, but a re-burn of moderate intensity occurring during this time would likely kill all young trees, even in un-logged units, because of the influence of other components of the fuel bed, such as grasses and shrubs. Model projections of 1000-h fuels (woody fuels >7.6 cm diameter) indicate that standing structure in all stands would collapse quickly, with the result that un-logged stands would contain two- or three-fold greater masses at 25 and 50 years post-logging, leading to much higher consumption rates of fuel in the event of a re-burn in the same place. Variation in dead tree fall and decay rates did not change the relationship among treatments in 1000-h fuel loads, but changed the time at which treatment differences were projected to disappear. Despite treatment differences in heavy fuel accumulations over time however, FVS–FFE predicts no differences among treatments in mortality of young trees due to either moderate or high intensity fire occurring in the same place at 25, 50, or 100 years post-fire logging. The lack of a re-burn effect is in part due to the reliance on flame length as the primary mechanism leading to tree death in the fire effect models used by FVS–FFE. If tree death turns out to be caused more by root burning or cambial heating, the observed variations in 1000-h fuel loadings among treatments could be significant in the event of a future re-burn. # 2006 Elsevier B.V. All rights reserved. Keywords: Salvage logging; Re-burn hypothesis; Restoration 1. Introduction After stand replacement fires in the western United States, standard policy on most lands has been to salvage fire-killed trees as quickly as possible to recoup their economic value before decay (USDA, 1996; Aho and Cahill, 1984). Consider- able public debate has focused on the merits of post-fire logging on federal lands, as evidenced from extensive public comment received on both the east-side and interior Columbia River basin environment impact statements (USDA and USDI, 1997a, b). Proponents of post-fire logging argue that the practice is one of a suite of rehabilitation methods, designed to mitigate the adverse environmental effects of the wildfire itself (Amman and Ryan, 1991; Poff, 1989), that removal of large woody structure reduces the risk of a severe re-burn (the ‘‘re-burn hypothesis’’; www.elsevier.com/locate/foreco Forest Ecology and Management 238 (2007) 268–279 * Corresponding author at: P.O. Box E, Eastern Oregon Agricultural Research Center, Oregon State University, Union, OR 97883, USA. Tel.: +1 541 562 5129; fax: +1 541 562 5348. E-mail address: [email protected] (J.D. McIver). 0378-1127/$ – see front matter # 2006 Elsevier B.V. All rights reserved. doi:10.1016/j.foreco.2006.10.021
Transcript of Fuel mass and stand structure after post-fire logging of a severely ...

www.elsevier.com/locate/foreco
Forest Ecology and Management 238 (2007) 268–279
Fuel mass and stand structure after post-fire logging of a severely
burned ponderosa pine forest in northeastern Oregon
J.D. McIver a,*, R. Ottmar b
a Forestry and Range Sciences Laboratory, Pacific Northwest Research Station, La Grande, OR, USAb Forestry Sciences Laboratory, Pacific Northwest Research Station, Seattle, WA, USA
Received 12 August 2006; received in revised form 20 October 2006; accepted 20 October 2006
Abstract
Stand structure and fuel mass were measured before and after a post-fire logging operation conducted 2 years after the 1996 Summit Wildfire
(Malheur National Forest), in a ponderosa pine-dominated forest in northeastern Oregon. Variables were measured both pre- and post-logging in
four replicate units for each of three treatments [un-logged control, commercial harvest (most dead merchantable trees removed), fuel reduction
harvest (most dead merchantable trees removed plus most dead trees >10 cm diameter)]. Post-fire logging resulted in a significant decrease in
mean basal area, down to 46% pre-treatment level in commercial units, and down to 25% in fuel reduction units. Logging significantly reduced tree
density, especially for the smallest (<22 cm diameter) and intermediate (23–41 cm) diameter classes. Fuel reduction units also had significantly
fewer snags (dead trees >30 cm diameter—4 ha�1), compared to both commercial (23 ha�1) units and to un-logged controls (64 ha�1) in the year
following timber harvest. Logging did not change ladder height or tree species composition (% ponderosa pine, Douglas-fir and grand fir). Total
woody fuel mass increased significantly in fuel reduction units when compared to controls, with the greatest difference among treatments occurring
in the slash fuel (<7.6 cm diameter) component (mean of 6.2 Mg/ha for fuel reduction stands versus 1.3 Mg/ha for un-logged stands). Logging
activity caused no change in the mass of the forest floor (litter or duff). Model projections of the fuel bed using the fire and fuels extension of the
forest vegetation simulator (FVS–FFE) indicate that the disparity in slash fuel mass between fuel reduction and un-logged units would be sustained
until about 15 years post-logging, but a re-burn of moderate intensity occurring during this time would likely kill all young trees, even in un-logged
units, because of the influence of other components of the fuel bed, such as grasses and shrubs. Model projections of 1000-h fuels (woody fuels
>7.6 cm diameter) indicate that standing structure in all stands would collapse quickly, with the result that un-logged stands would contain two- or
three-fold greater masses at 25 and 50 years post-logging, leading to much higher consumption rates of fuel in the event of a re-burn in the same
place. Variation in dead tree fall and decay rates did not change the relationship among treatments in 1000-h fuel loads, but changed the time at
which treatment differences were projected to disappear. Despite treatment differences in heavy fuel accumulations over time however, FVS–FFE
predicts no differences among treatments in mortality of young trees due to either moderate or high intensity fire occurring in the same place at 25,
50, or 100 years post-fire logging. The lack of a re-burn effect is in part due to the reliance on flame length as the primary mechanism leading to tree
death in the fire effect models used by FVS–FFE. If tree death turns out to be caused more by root burning or cambial heating, the observed
variations in 1000-h fuel loadings among treatments could be significant in the event of a future re-burn.
# 2006 Elsevier B.V. All rights reserved.
Keywords: Salvage logging; Re-burn hypothesis; Restoration
1. Introduction
After stand replacement fires in the western United States,
standard policy on most lands has been to salvage fire-killed
trees as quickly as possible to recoup their economic value
* Corresponding author at: P.O. Box E, Eastern Oregon Agricultural Research
Center, Oregon State University, Union, OR 97883, USA.
Tel.: +1 541 562 5129; fax: +1 541 562 5348.
E-mail address: [email protected] (J.D. McIver).
0378-1127/$ – see front matter # 2006 Elsevier B.V. All rights reserved.
doi:10.1016/j.foreco.2006.10.021
before decay (USDA, 1996; Aho and Cahill, 1984). Consider-
able public debate has focused on the merits of post-fire logging
on federal lands, as evidenced from extensive public comment
received on both the east-side and interior Columbia River
basin environment impact statements (USDA and USDI, 1997a,
b). Proponents of post-fire logging argue that the practice is one
of a suite of rehabilitation methods, designed to mitigate the
adverse environmental effects of the wildfire itself (Amman and
Ryan, 1991; Poff, 1989), that removal of large woody structure
reduces the risk of a severe re-burn (the ‘‘re-burn hypothesis’’;

J.D. McIver, R. Ottmar / Forest Ecology and Management 238 (2007) 268–279 269
Poff, 1989), and that the sale of burned timber can be used to
offset the cost of post-fire rehabilitation (Barker, 1989).
Opponents argue that post-fire logging causes increases in
erosion and sediment transport to streams as a result of the
harvest operations themselves (Beschta et al., 2004; Minshall
et al., 1994), and removes structure that has important
ecological functions (Maser, 1996; Stone, 1993).
The debate has taken place in the context of relatively little
scientific information on the ecological effects of post-fire
logging. McIver and Starr (2000, 2001) found only 21 studies
worldwide that have examined the environmental effects of
post-fire logging, 14 of which had an un-logged control, and
just seven of which were replicated experiments. In particular,
few studies have explored the extent to which post-fire logging
significantly changes forest structure. Exceptions are three
recent studies on cavity-nesting birds of the northern Rocky
Mountains, in which most cavity nesters are less common and
build fewer nests in post-fire logged stands (Caton, 1996;
Hitchcox, 1996; Saab and Dudley, 1998). Importantly, no
studies have documented that post-fire logging reduces the risk
of a severe re-burn (McIver and Starr, 2000, 2001) despite the
conventional wisdom that removal of dead large woody
structure would be expected to reduce ground fuels at some
point in the future (Poff, 1989; the ‘‘re-burn’’ hypothesis).
This study was designed to evaluate the change due to
logging in stand structure and fuels after a typical post-fire
logging operation, and to predict future re-burn severity. The
16,000 ha Summit Fire was caused by a lightning storm on 13
August 1996, on the North Fork John Day Ranger District
(Umatilla National Forest), burned south onto the Long Creek
Ranger District of the Malheur National Forest, and was
declared officially controlled on 16 September 1996 (Fig. 1). In
the summer of 1997, three treatments (un-logged control,
Fig. 1. Map showing location of the 12 experimental units within the southern
commercial, and fuel reduction) were applied to 12 experi-
mental units on the Malheur National Forest. Trees (both living
and dead) and fuels (down wood and the forest floor) were
measured to test the ‘‘re-burn’’ hypothesis, or the extent to
which removal of dead large woody structure changed the
present and future fuel complex and its influence on fire severity
should a re-burn occur. We also compare post-logging structure
at Summit to recent studies that have examined post-fire
logging effects on cavity-nesting birds.
2. Study area and treatments
The study area is located on lands in the southern portion of
the burned area (Fig. 1: 4484004900–4484205700N; 11884104000–11884505500W), at relatively low elevations (1250–1400 m).
The forests of the study area are considered to be in the ‘warm/
dry’ biophysical type, historically dominated by ponderosa
pine (Pinus ponderosa) in the overstory (with some representa-
tion of Pseudotsuga menziesii and Abies grandis), and pine
grass (Calamagrostis rubescens) in the under-story. Soils are
stony, clay loam to clay soils with moderate to high surface
erosion and compaction hazard, and low displacement hazard
(McIver and McNeil, 2006). Soils are derived from Clarno
breccia parent material, but some soils have up to a 25 cm cap
of Mt. Mazama ash, especially on their lower boundaries
(USDA, 1997). Like most of the Blue Mountains of
northeastern Oregon, management activities of the last 80
years, namely fire suppression and the harvest of large pines,
have had significant effects on vegetation and fire regimes
within the Summit Fire project area (Agee, 1996). During pre-
settlement times, the fire regime for ponderosa pine forests
growing in the project area consisted of low severity fires
(<20% mortality of large trees) occurring at intervals of
portion of the Summit Fire, Malheur National Forest, northeastern Oregon.

J.D. McIver, R. Ottmar / Forest Ecology and Management 238 (2007) 268–279270
between about 10 and 35 years (Agee, 1996). As a consequence
of fire suppression over the past 80 years, these forests have
therefore missed between two and eight wildfires in recent times,
with the result that surface fuels have accumulated and become
more continuous, and tree species such as grand fir and Douglas
fir have become more prevalent. Coupled with the widespread
removal of large pines over the same time period, these forest
management practices have led to a shift toward higher wildfire
severity compared to pre-settlement times (Agee et al., 1994).
Not surprisingly, therefore, within the Malheur Forest portion of
the Summit Fire, 8103 ha (72%) were judged to have burned at
high severity (>80% large trees killed), including much of the
area in the lower elevation dry forests, which typically
experience lower severity fires (USDA, 1997).
Twelve experimental units ranging in size from 6 to 16 ha
were established in four blocks in August 1997 (Fig. 1). Each
block was located in a separate drainage, with perennial streams
that flow past each block (Elk, Coyote, Wray Creeks) emptying
into the Middle Fork of the John Day River. Nine of the study
units (three complete blocks) were dominated by ponderosa pine,
ranging from 64 to 100% overstory dominance in stem number
(Table 1). The fourth block (West Coyote) had one unit about
equally dominated by ponderosa pine and Douglas-fir (421), and
two units (422 and 424) dominated by Douglas-fir or grand fir.
Within each block, three treatments (control, commercial,
fuel reduction) were assigned randomly to units, for a complete
randomized block design. Control units received no logging
treatment. The prescription for commercial units was to remove
most (about 2/3) of dead merchantable trees, leaving at least
17 snags/ha, greater than 30 cm DBH. The prescription for fuel
reduction units was to remove most dead merchantable trees
(leaving minimum 6 snags/ha), and to remove most non-
merchantable trees down to 10 cm diameter. The logging
prescriptions were conceived such that the commercial treatment
would reflect the results of a typical modern logging operation,
while the fuel reduction treatment would result in sufficient fuel
mass reduction such that the severity of a future re-burn might be
significantly diminished. All logging was required to take place
on frozen or dry ground, to minimize soil disturbance. A total of
Table 1
Key features of Summit Fire experimental units in September 1997 (Elk Ck, W. C
Unit Rx Block Area
(ha)
# Grid
points
Elev
(m)
%
a
1 U Unlog Elk Ck 8 20 1353 2
1 C Comm Elk Ck 15 35 1347 2
1 F Fuel Elk Ck 19 47 1311 1
2 U Unlog W Coyote 6 15 1372 2
2 C Comm W Coyote 5 16 1402 2
2 F Fuel W Coyote 7 19 1402 1
3 U Unlog E Coyote 16 29 1372 1
3 C Comm E Coyote 6 16 1402 2
3 F Fuel E Coyote 10 14 1387 2
4 U Unlog Wray Ck 7 15 1250 2
4 C Comm Wray Ck 9 18 1271 1
4 F Fuel Wray Ck 13 29 1274 2
Summit Fire occurred between 13 August and 16 September 1996.
88 ha were logged between October 1998 and August 1999
(Table 1). Each commercial unit was entered once, while fuel
reduction units were entered twice, once to remove the largest
boles as part of a timber sale contract, and a second time to
remove smaller boles as part of a service contract. While logs
from all commercial units and the first entry of fuel reduction
units were removed from the site and sold, logs from the second
fuel reduction entry were stacked on the landings and left on site.
Trees were felled by hand, whole trees (with limbs still attached)
were cable-winched into skid trails with a tracked D6 Crawler-
tractor, and retrieved to landings with a Caterpillar 518 rubber-
tire grapple-skidder. No additional treatment of the material left
after logging (slash) occurred on any of the treated units. Pine
seedlings were planted within each of the twelve experimental
units, within two years after logging, at a density of 960 stems/ha.
3. Methods and materials
All variables were measured pre- and post-logging from the
same permanently established grid points. A total of 273 grid
points were laid out in the 12 experimental units in August
1997, between 14 and 47 points per unit (Table 1). Grid points
were positioned 50 m apart, and at least 50 m from unit
boundaries. Pre-treatment data were taken in the nine units of
the Elk Ck, W. Coyote, and Wray Ck blocks between August
and October 1997; the three units of the E. Coyote block were
sampled in September 1998. All post-treatment data were taken
from July to September 1999, immediately following the
termination of logging.
Trees (DBH > 10 cm) were tallied from within a 200 m2
circular plot centered on each grid point. We recorded species,
status (dead or alive), diameter at breast height, total height, and
ladder fuel height (height to the lowest stem) for each tree.
Basal area (m2/ha) was calculated from tree diameter data.
Dead and down woody fuel was measured using the planar
intercept method (Brown, 1974). Three 30.5 m transects were
originated from each grid point, the first selected randomly, and
the other established at 1208 and 2408 from the first. Dead and
down woody fuel less than 2.5 cm diameter was tallied for the
oyote, Wray Ck blocks), and September 1998 (E. Coyote block)
Slope/
spect
% Pond
pine
% Trees
killed
Forest floor
(Mg/ha)
Woody fuel
(Mg/ha)
0/W 90 66 3.58 1.12
5/SW 96 96 0.90 2.91
5/W 98 55 3.36 3.36
0/W 14 92 1.77 6.98
0/W 22 100 0.57 6.50
5/S 43 98 1.45 7.51
0/SW 64 86 5.42 3.80
0/S 65 100 3.49 6.26
0/S 86 100 1.49 7.63
0/S 100 100 0.67 1.34
5/S 97 97 0.67 3.36
0/W 99 100 0.90 2.24

J.D. McIver, R. Ottmar / Forest Ecology and Management 238 (2007) 268–279 271
first 1.9 m of each transect, and fuel between 2.5 and 7.6 cm
was tallied along the full 30.5 m. Fuel >7.6 cm diameter was
tallied along the full transect and recorded as to species, decay
class, and diameter at intersection point. Woody fuel masses
were calculated using standard equations (Brown, 1974).
Litter and duff (forest floor) was measured to the nearest
0.25 cm depth at the 12, 18, and 24 m points on the transect.
Depths were converted to mass using standard bulk density
values (2.9 Mg/ha cm for litter, and 11.8 Mg/ha cm for duff;
Ottmar et al., 1993).
Snag, fuel bed, and tree response variables were analyzed
with analysis of variance (SPSS, 2001), as a complete
randomized block design (Hinklemann and Kempthorne
(1994), with four blocks for each of the three treatments,
and p = 0.05 as the standard significance level. For the four size
classes of snags, and the nine components of the fuel bed,
treatment type was analyzed as the only main factor for each
year (1997 – pre-treatment; 1999 – post-treatment) and for the
change from 1997 to 1999. For trees, each of six variables
(basal area, density, % ponderosa pine, % Douglas Fir, % Grand
Fir, and ladder height) was analyzed for each combination of
year (1997, 1999, change) and status (dead, live, total), with
treatment as the only main factor. The issue of multiplicity was
dealt with by making a Bonferroni adjustment for each family
of variables in which multiple ANOVAs were run (snags, fuel
Table 2
Decay and fall rates used for the ‘intermediate’ class, and weather conditions for ligh
and ‘Slow’ decay and fall rates were �50% of ‘intermediate’ class)
Surface fuel decay Ponderosa pine Douglas-
Duff 0.0008 0.0008
Litter 0.2000 0.2000
Wood <2.5 cm diameter 0.1000 0.1000
Wood 2.6–7.6 cm 0.0900 0.0800
Wood >7.6 cm 0.0300 0.0200
Snag decay—all Sizes 0.0150 0.0100
Snag fall, <25 cm diameter 0.1260 0.0680
Snag fall, 26–75 cm 0.0780 0.0430
Snag fall, >75 cm 0.0300 0.0180
Weather conditions Fire intensity
Light
Fuel moisture
Duff 75%
Wood, <2.5 cm diameter 12%
Wood, 2.6–7.6 cm 15%
Wood, >7.6 cm 20%
Live fuel 150%
Wind speed 5 km/h
Temperature 22 8C
Information source used for setting ‘intermediate’ fall and decay rates
Litter: litter bag decomposition data (McIver, unpublished data)
Duff: 1/250th of litter decay rate (Reinhardt and Crookston, 2003)
Woody fuel: <2.5 cm diameter (Abbot and Crossley, 1982)
Woody fuel: 2.5–7.5 cm diameter (Mellona and Harmonb, unpublished data)
Woody fuel, >7.5 cm diameter (Busse, 1994; Harmon et al., 1996, 2004, Mello
Snag decay (Mellon and Harmon, unpublished data)
Snag fall (Mellon and Harmon, unpublished data, Landram et al., 2002).
a Kim Mellon, Regional Wildlife Ecologist, USDA Forest Service, PNW Regionb Mark Harmon, Forest Ecologist, Department of Forest Science, Oregon State U
bed, trees) (Westfall et al., 1999). All variables were normally
distributed, and thus no transformations were made. Three pair-
wise comparisons (un-logged versus commercial; un-logged
versus fuel reduction, commercial versus fuel reduction) were
planned apriori for each analyzed variable, and were examined
by least-significant difference (Hinklemann and Kempthorne,
1994).
3.1. Fuel simulation model inputs
To perform a model test of the re-burn hypothesis, post-
treatment tree and fuels data for all stands were input into the
FVS–FFE program (Forest Vegetation Simulator-Fire and Fuel
Effects Extension; Reinhardt and Crookston, 2003). The FVS–
FFE model starts with existing stands, consisting of both living
and dead trees, and a fuel bed, described by masses of the forest
floor and various sizes of woody material. Living trees grow,
age and die, according to growth and yield equations. Dead
trees decay slowly, and fall down at rates dependent on DBH
(Landram et al., 2002; Mellon and Harmon, unpublished data).
The fuel bed changes in accordance with the fall and decay of
various stand components. For the purposes of this study,
simulations were run to: (1) grow new stands of ponderosa pine
in each experimental unit for 100 years, starting with the
960 stems/ha planted within two years after the fire; and (2)
t, moderate, and high intensity wildfires in FVS–FFE model simulations (‘Fast’
Fir W. Larch Grand Fir W. Juniper
0.0008 0.0008 0.0008
0.2000 0.2000 0.2000
0.1000 0.1000 0.1000
0.0800 0.0950 0.0800
0.0200 0.0350 0.0200
0.0100 0.0180 0.0090
0.0620 0.0730 0.0245
0.0450 0.0485 0.0245
0.0280 0.0240 –
Moderate High
50% 15%
8% 4%
10% 5%
15% 10%
110% 70%
10 km/h 36 km/h
22 8C 22 8C
n and Harmon, unpublished data)
, Portland, Oregon.
niversity, Corvallis, Oregon.
J.D. McIver, R. Ottmar / Forest Ecology and Management 238 (2007) 268–279272
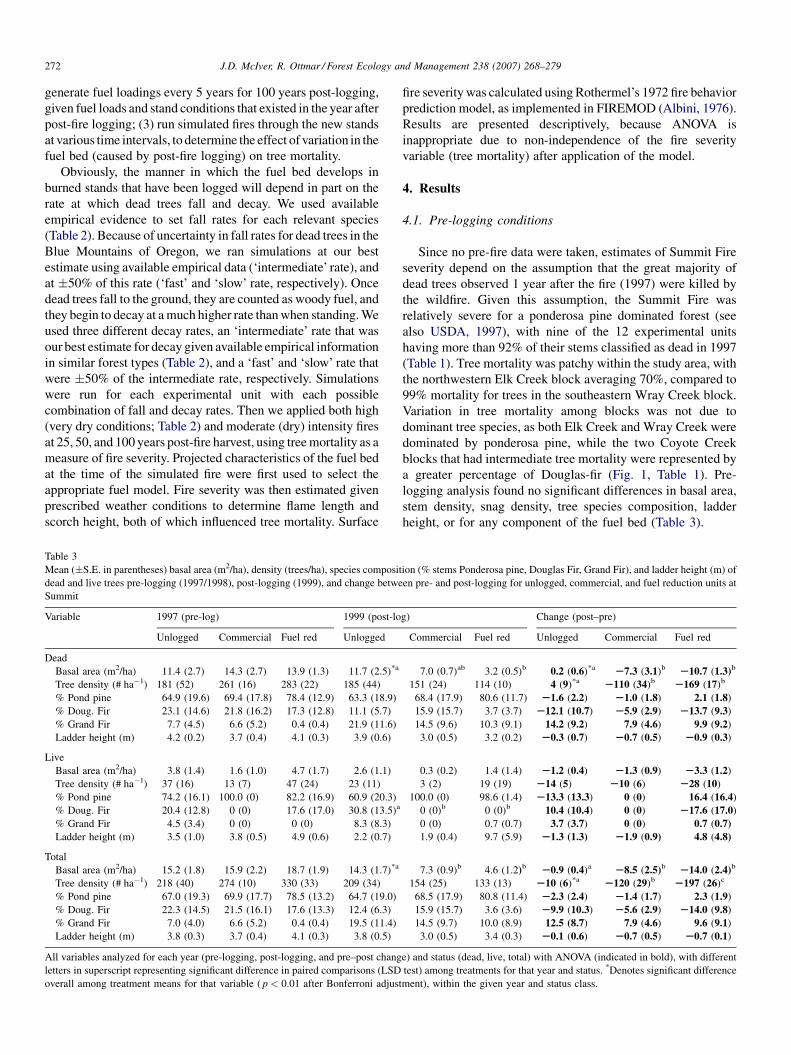
generate fuel loadings every 5 years for 100 years post-logging,
given fuel loads and stand conditions that existed in the year after
post-fire logging; (3) run simulated fires through the new stands
at various time intervals, to determine the effect of variation in the
fuel bed (caused by post-fire logging) on tree mortality.
Obviously, the manner in which the fuel bed develops in
burned stands that have been logged will depend in part on the
rate at which dead trees fall and decay. We used available
empirical evidence to set fall rates for each relevant species
(Table 2). Because of uncertainty in fall rates for dead trees in the
Blue Mountains of Oregon, we ran simulations at our best
estimate using available empirical data (‘intermediate’ rate), and
at �50% of this rate (‘fast’ and ‘slow’ rate, respectively). Once
dead trees fall to the ground, they are counted as woody fuel, and
they begin to decay at a much higher rate than when standing. We
used three different decay rates, an ‘intermediate’ rate that was
our best estimate for decay given available empirical information
in similar forest types (Table 2), and a ‘fast’ and ‘slow’ rate that
were �50% of the intermediate rate, respectively. Simulations
were run for each experimental unit with each possible
combination of fall and decay rates. Then we applied both high
(very dry conditions; Table 2) and moderate (dry) intensity fires
at 25, 50, and 100 years post-fire harvest, using tree mortality as a
measure of fire severity. Projected characteristics of the fuel bed
at the time of the simulated fire were first used to select the
appropriate fuel model. Fire severity was then estimated given
prescribed weather conditions to determine flame length and
scorch height, both of which influenced tree mortality. Surface
Table 3
Mean (�S.E. in parentheses) basal area (m2/ha), density (trees/ha), species composit
dead and live trees pre-logging (1997/1998), post-logging (1999), and change betwe
Summit
Variable 1997 (pre-log) 1999 (post-lo
Unlogged Commercial Fuel red Unlogged
Dead
Basal area (m2/ha) 11.4 (2.7) 14.3 (2.7) 13.9 (1.3) 11.7 (2.5)*a
Tree density (# ha�1) 181 (52) 261 (16) 283 (22) 185 (44)
% Pond pine 64.9 (19.6) 69.4 (17.8) 78.4 (12.9) 63.3 (18.9)
% Doug. Fir 23.1 (14.6) 21.8 (16.2) 17.3 (12.8) 11.1 (5.7)
% Grand Fir 7.7 (4.5) 6.6 (5.2) 0.4 (0.4) 21.9 (11.6)
Ladder height (m) 4.2 (0.2) 3.7 (0.4) 4.1 (0.3) 3.9 (0.6)
Live
Basal area (m2/ha) 3.8 (1.4) 1.6 (1.0) 4.7 (1.7) 2.6 (1.1)
Tree density (# ha�1) 37 (16) 13 (7) 47 (24) 23 (11)
% Pond pine 74.2 (16.1) 100.0 (0) 82.2 (16.9) 60.9 (20.3)
% Doug. Fir 20.4 (12.8) 0 (0) 17.6 (17.0) 30.8 (13.5)a
% Grand Fir 4.5 (3.4) 0 (0) 0 (0) 8.3 (8.3)
Ladder height (m) 3.5 (1.0) 3.8 (0.5) 4.9 (0.6) 2.2 (0.7)
Total
Basal area (m2/ha) 15.2 (1.8) 15.9 (2.2) 18.7 (1.9) 14.3 (1.7)*a
Tree density (# ha�1) 218 (40) 274 (10) 330 (33) 209 (34)
% Pond pine 67.0 (19.3) 69.9 (17.7) 78.5 (13.2) 64.7 (19.0)
% Doug. Fir 22.3 (14.5) 21.5 (16.1) 17.6 (13.3) 12.4 (6.3)
% Grand Fir 7.0 (4.0) 6.6 (5.2) 0.4 (0.4) 19.5 (11.4)
Ladder height (m) 3.8 (0.3) 3.7 (0.4) 4.1 (0.3) 3.8 (0.5)
All variables analyzed for each year (pre-logging, post-logging, and pre–post chang
letters in superscript representing significant difference in paired comparisons (LSD
overall among treatment means for that variable ( p < 0.01 after Bonferroni adjust
fire severity was calculated using Rothermel’s 1972 fire behavior
prediction model, as implemented in FIREMOD (Albini, 1976).
Results are presented descriptively, because ANOVA is
inappropriate due to non-independence of the fire severity
variable (tree mortality) after application of the model.
4. Results
4.1. Pre-logging conditions
Since no pre-fire data were taken, estimates of Summit Fire
severity depend on the assumption that the great majority of
dead trees observed 1 year after the fire (1997) were killed by
the wildfire. Given this assumption, the Summit Fire was
relatively severe for a ponderosa pine dominated forest (see
also USDA, 1997), with nine of the 12 experimental units
having more than 92% of their stems classified as dead in 1997
(Table 1). Tree mortality was patchy within the study area, with
the northwestern Elk Creek block averaging 70%, compared to
99% mortality for trees in the southeastern Wray Creek block.
Variation in tree mortality among blocks was not due to
dominant tree species, as both Elk Creek and Wray Creek were
dominated by ponderosa pine, while the two Coyote Creek
blocks that had intermediate tree mortality were represented by
a greater percentage of Douglas-fir (Fig. 1, Table 1). Pre-
logging analysis found no significant differences in basal area,
stem density, snag density, tree species composition, ladder
height, or for any component of the fuel bed (Table 3).
ion (% stems Ponderosa pine, Douglas Fir, Grand Fir), and ladder height (m) of
en pre- and post-logging for unlogged, commercial, and fuel reduction units at
g) Change (post–pre)
Commercial Fuel red Unlogged Commercial Fuel red
7.0 (0.7)ab 3.2 (0.5)b 0.2 (0.6)*a S7.3 (3.1)b S10.7 (1.3)b
151 (24) 114 (10) 4 (9)*a S110 (34)b S169 (17)b
68.4 (17.9) 80.6 (11.7) S1.6 (2.2) S1.0 (1.8) 2.1 (1.8)
15.9 (15.7) 3.7 (3.7) S12.1 (10.7) S5.9 (2.9) S13.7 (9.3)
14.5 (9.6) 10.3 (9.1) 14.2 (9.2) 7.9 (4.6) 9.9 (9.2)
3.0 (0.5) 3.2 (0.2) S0.3 (0.7) S0.7 (0.5) S0.9 (0.3)
0.3 (0.2) 1.4 (1.4) S1.2 (0.4) S1.3 (0.9) S3.3 (1.2)
3 (2) 19 (19) S14 (5) S10 (6) S28 (10)
100.0 (0) 98.6 (1.4) S13.3 (13.3) 0 (0) 16.4 (16.4)
0 (0)b 0 (0)b 10.4 (10.4) 0 (0) S17.6 (17.0)
0 (0) 0.7 (0.7) 3.7 (3.7) 0 (0) 0.7 (0.7)1.9 (0.4) 9.7 (5.9) S1.3 (1.3) S1.9 (0.9) 4.8 (4.8)
7.3 (0.9)b 4.6 (1.2)b S0.9 (0.4)a S8.5 (2.5)b S14.0 (2.4)b
154 (25) 133 (13) S10 (6)*a S120 (29)b S197 (26)c
68.5 (17.9) 80.8 (11.4) S2.3 (2.4) S1.4 (1.7) 2.3 (1.9)
15.9 (15.7) 3.6 (3.6) S9.9 (10.3) S5.6 (2.9) S14.0 (9.8)
14.5 (9.7) 10.0 (8.9) 12.5 (8.7) 7.9 (4.6) 9.6 (9.1)
3.0 (0.5) 3.4 (0.3) S0.1 (0.6) S0.7 (0.5) S0.7 (0.1)
e) and status (dead, live, total) with ANOVA (indicated in bold), with different
test) among treatments for that year and status. *Denotes significant difference
ment), within the given year and status class.
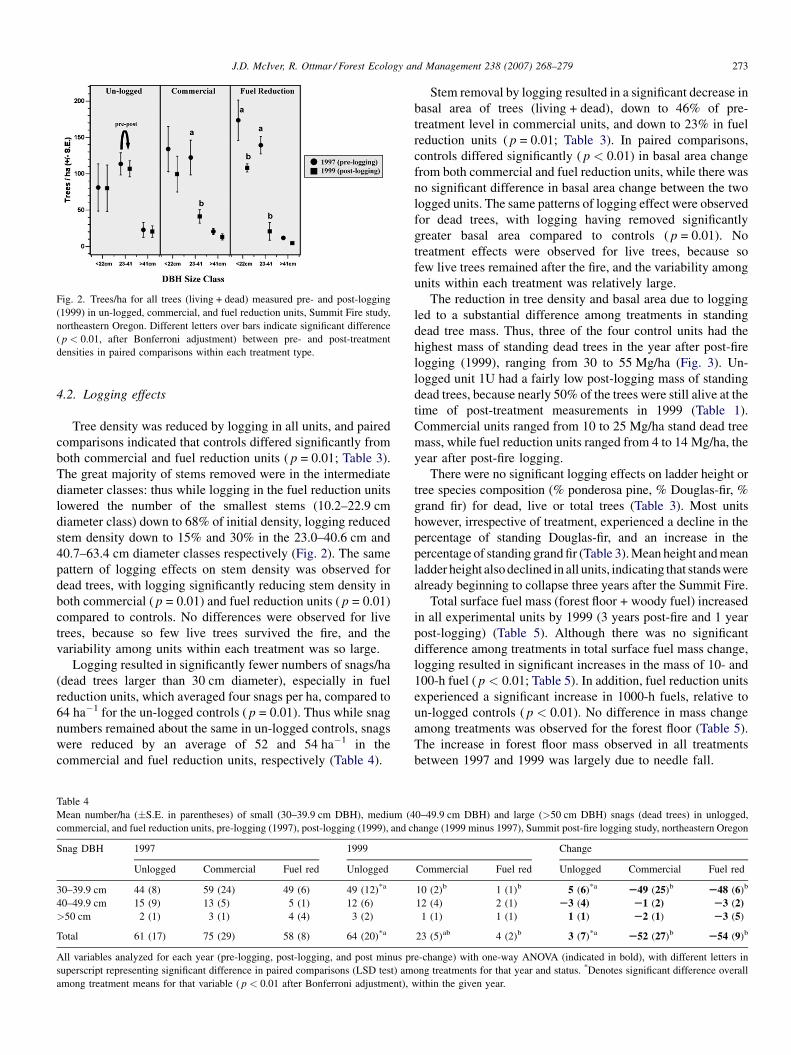
Fig. 2. Trees/ha for all trees (living + dead) measured pre- and post-logging
(1999) in un-logged, commercial, and fuel reduction units, Summit Fire study,
northeastern Oregon. Different letters over bars indicate significant difference
( p < 0.01, after Bonferroni adjustment) between pre- and post-treatment
densities in paired comparisons within each treatment type.
J.D. McIver, R. Ottmar / Forest Ecology and Management 238 (2007) 268–279 273
4.2. Logging effects
Tree density was reduced by logging in all units, and paired
comparisons indicated that controls differed significantly from
both commercial and fuel reduction units ( p = 0.01; Table 3).
The great majority of stems removed were in the intermediate
diameter classes: thus while logging in the fuel reduction units
lowered the number of the smallest stems (10.2–22.9 cm
diameter class) down to 68% of initial density, logging reduced
stem density down to 15% and 30% in the 23.0–40.6 cm and
40.7–63.4 cm diameter classes respectively (Fig. 2). The same
pattern of logging effects on stem density was observed for
dead trees, with logging significantly reducing stem density in
both commercial ( p = 0.01) and fuel reduction units ( p = 0.01)
compared to controls. No differences were observed for live
trees, because so few live trees survived the fire, and the
variability among units within each treatment was so large.
Logging resulted in significantly fewer numbers of snags/ha
(dead trees larger than 30 cm diameter), especially in fuel
reduction units, which averaged four snags per ha, compared to
64 ha�1 for the un-logged controls ( p = 0.01). Thus while snag
numbers remained about the same in un-logged controls, snags
were reduced by an average of 52 and 54 ha�1 in the
commercial and fuel reduction units, respectively (Table 4).
Table 4
Mean number/ha (�S.E. in parentheses) of small (30–39.9 cm DBH), medium (4
commercial, and fuel reduction units, pre-logging (1997), post-logging (1999), and c
Snag DBH 1997 1999
Unlogged Commercial Fuel red Unlogged
30–39.9 cm 44 (8) 59 (24) 49 (6) 49 (12)*a
40–49.9 cm 15 (9) 13 (5) 5 (1) 12 (6)
>50 cm 2 (1) 3 (1) 4 (4) 3 (2)
Total 61 (17) 75 (29) 58 (8) 64 (20)*a
All variables analyzed for each year (pre-logging, post-logging, and post minus pr
superscript representing significant difference in paired comparisons (LSD test) am
among treatment means for that variable ( p < 0.01 after Bonferroni adjustment),
Stem removal by logging resulted in a significant decrease in
basal area of trees (living + dead), down to 46% of pre-
treatment level in commercial units, and down to 23% in fuel
reduction units ( p = 0.01; Table 3). In paired comparisons,
controls differed significantly ( p < 0.01) in basal area change
from both commercial and fuel reduction units, while there was
no significant difference in basal area change between the two
logged units. The same patterns of logging effect were observed
for dead trees, with logging having removed significantly
greater basal area compared to controls ( p = 0.01). No
treatment effects were observed for live trees, because so
few live trees remained after the fire, and the variability among
units within each treatment was relatively large.
The reduction in tree density and basal area due to logging
led to a substantial difference among treatments in standing
dead tree mass. Thus, three of the four control units had the
highest mass of standing dead trees in the year after post-fire
logging (1999), ranging from 30 to 55 Mg/ha (Fig. 3). Un-
logged unit 1U had a fairly low post-logging mass of standing
dead trees, because nearly 50% of the trees were still alive at the
time of post-treatment measurements in 1999 (Table 1).
Commercial units ranged from 10 to 25 Mg/ha stand dead tree
mass, while fuel reduction units ranged from 4 to 14 Mg/ha, the
year after post-fire logging.
There were no significant logging effects on ladder height or
tree species composition (% ponderosa pine, % Douglas-fir, %
grand fir) for dead, live or total trees (Table 3). Most units
however, irrespective of treatment, experienced a decline in the
percentage of standing Douglas-fir, and an increase in the
percentage of standing grand fir (Table 3). Mean height and mean
ladder height also declined in all units, indicating that stands were
already beginning to collapse three years after the Summit Fire.
Total surface fuel mass (forest floor + woody fuel) increased
in all experimental units by 1999 (3 years post-fire and 1 year
post-logging) (Table 5). Although there was no significant
difference among treatments in total surface fuel mass change,
logging resulted in significant increases in the mass of 10- and
100-h fuel ( p < 0.01; Table 5). In addition, fuel reduction units
experienced a significant increase in 1000-h fuels, relative to
un-logged controls ( p < 0.01). No difference in mass change
among treatments was observed for the forest floor (Table 5).
The increase in forest floor mass observed in all treatments
between 1997 and 1999 was largely due to needle fall.
0–49.9 cm DBH) and large (>50 cm DBH) snags (dead trees) in unlogged,
hange (1999 minus 1997), Summit post-fire logging study, northeastern Oregon
Change
Commercial Fuel red Unlogged Commercial Fuel red
10 (2)b 1 (1)b 5 (6)*a S49 (25)b S48 (6)b
12 (4) 2 (1) S3 (4) S1 (2) S3 (2)1 (1) 1 (1) 1 (1) S2 (1) S3 (5)
23 (5)ab 4 (2)b 3 (7)*a S52 (27)b S54 (9)b
e-change) with one-way ANOVA (indicated in bold), with different letters in
ong treatments for that year and status. *Denotes significant difference overall
within the given year.

Fig. 3. Estimated mass (Mg/ha) of woody fuel (1000 and 10 + 100-hr) <1, 25, 50, and 100 years post-fire logging, for un-logged, commercial, and fuel reduction
units at Summit. *Masses at <1 years post-fire logging are actual measurements from Brown’s transects; masses at 25, 50, and 100 years are projections using FVS–
FFE.
J.D. McIver, R. Ottmar / Forest Ecology and Management 238 (2007) 268–279274
4.3. Fuel and fire simulations
The general effect of variation in fall and decay rates can be
seen by simulating fuel loadings for a representative un-logged
unit (4U) for a 100-year time span (Fig. 4). A glance at surface
fuel mass projections for intermediate fall and decay rates
(middle curve of the nine-curve set) indicates a steep rise to a
peak mass at about 25 years post-logging, a leveling out
between 25 and 50 years, and then a steady increase to 100
years. The shape of this curve is due primarily to the fall of dead
tree mass for the first 25 years, a balance between tree fall and
decay for the next 25 years, and then an accumulation of fuel
Table 5
Mean mass (Mg/ha, S.E. in parentheses) forest floor and woody fuel pre-logging, po
post-fire logging study, northeastern Oregon, 1997–1999
Fuel class 1997 (pre-log) 1999 (p
Unlogged Commercial Fuel Unlogge
Forest floor (litter + duff) 2.9 (1.0) 1.4 (0.7) 1.8 (0.5) 6.2 (1.
Woody fuel 3.3 (1.4) 4.8 (0.9) 5.2 (1.4) 4.7 (0.
<2.5 cm 0.1 (0.1) 0.1 (0.1) 0.2 (0.1) 0.6 (0.
2.6–7.6 cm 0.4 (0.1) 0.3 (0.1) 0.5 (0.1) 0.9 (0.
7.7–15.2 cm 0.6 (0.2) 0.7 (0.1) 0.8 (0.2) 0.9 (0.
15.3–22.9 cm 0.9 (0.4) 0.7 (0.2) 0.6 (0.2) 1.3 (0.
23–50.8 cm 1.1 (0.6) 1.9 (0.6) 2.2 (0.9) 0.9 (0.
>50.8 cm 0.1 (0.1) 1.1 (0.4) 1.0 (0.5) 0.1 (0.
Total fuel (forest floor + woody) 6.2 (1.7) 6.2 (1.4) 7.0 (1.4) 10.9 (1.
All variables analyzed with ANOVA (indicated in bold), with different letters in
treatments (LSD test) within each sampling year (1997, 1999), and for change. *D
( p < 0.005 after Bonferroni adjustment) within each sampling year and for chang
due to the increasing dominance of the new stand for the final
50 years of the simulation. Thus, under conditions of
intermediate fall and decay rate (our best estimates using
available empirical data; Table 2), the influence of factors
affecting the original stand becomes negligible after about 50
years post-logging. Differences in fall rate simply change the
rate at which the stand peaks in mass (15 years versus 45 years
for fast and slow fall rates, respectively), while differences in
decay rate change the magnitude of mass in the surface fuel
bed, especially after about 50 years post-logging. These
simulations suggest that it would be most informative to
compare how fuel beds develop for the three treatments over the
st-logging, and change in control, commercial and fuel treatment units, Summit
ost-log) Change (pre–post)
d Commercial Fuel Unlogged Commercial Fuel
7) 4.8 (1.5) 5.5 (1.2) +3.3 (2.1) +3.4 (1.9) +3.7 (0.8)
8)a* 9.3 (1.5)b 11.4 (1.0)b +1.3 (1.7)a* +4.5 (0.9)ab +6.2 (1.3)b
1)a* 1.3 (0.5)ab 1.8 (0.2)b +0.5 (0.1)a* +1.2 (0.5)ab +1.6 (0.1)b
1)a* 3.0 (0.6)b 3.6 (0.3)b +0.4 (0.2)a* +2.7 (0.5)b +3.2 (0.3)b
1)a* 1.5 (0.1)a 2.8 (0.3)b +0.3 (0.2)a* +0.8 (0.1)a +2.0 (0.2)b
3) 1.8 (0.3) 1.8 (0.6) +0.4 (0.7) +1.1 (0.1) +1.2 (0.3)
3) 1.4 (0.3) 1.2 (0.4) S0.2 (0.8) S0.5 (0.5) S1.0 (0.6)
1) 0.3 (0.2) 0.2 (0.2) 0.0 (0.0) S0.8 (0.6) S0.8 (0.4)
2) 14.1 (2.9) 16.9 (1.9) +4.7 (1.2) +7.9 (2.8) +9.9 (2.0)
superscript representing significant difference in paired comparisons among
enotes significant difference overall among treatment means for that variable
e.

Fig. 4. Estimated mean mass of surface fuel (Mg/ha � S.E.) in 100-year
simulation for un-logged unit 520, given variation in fall and decay rates
(see Table 2 for specifications).Fig. 5. Mean mass (Mg/ha) of slash fuel (<7.6 cm diameter wood) in un-
logged, commercial, and fuel reduction units pre-logging (years = �1), imme-
diately post-logging (years = 0), and in ten-year increments up to 30 years post-
logging, and mean tree height (m) of the new developing stand projected for
each experimental unit. *Pre-logging and immediate post-logging data are
actual measurement using Brown’s transects; masses for post-logging years
10–30 are projections (intermediate decay rates) using FVS–FFE.
J.D. McIver, R. Ottmar / Forest Ecology and Management 238 (2007) 268–279 275
first 50 years post-logging. For the most part, we will use
intermediate fall and decay rates for the simulations, because
they represent our best estimates using available data. Variation
in fall and decay rate would likely change only the absolute
estimates of fuel mass and tree mortality in the simulations, not
the relative patterns that we see among treatments. Finally,
since the principal differences among treatments immediately
after logging were higher slash fuel masses in logged units, and
higher standing fuel masses in un-logged units, we will present
simulations first of how the slash component (10 + 100-h fuel)
of the fuel bed develops through time, followed by projections
of how the log component (1000-h fuel) develops.
Given intermediate decay rates, the initial post-logging
difference in slash fuel mass among treatments is projected to
disappear by 20 years post-logging, with the maximum
divergence among treatments occurring at about 10 years
(Fig. 5). Because the developing stands at 10 years post-logging
are composed of a high density of very small trees (mean height
2.7 m), the effects of even a moderate wildfire will tend to be
relatively severe. For example, a moderate wildfire at 10 years
post-logging would generate scorch heights exceeding mean
tree height, and would be projected to kill over 95% of all
young trees, regardless of post-fire logging treatment. A light
intensity wildfire at 10 years post-logging would be expected to
kill about half of the trees in the developing stand, with no
difference expected among logging treatments. This is because
other components of the fuel bed (live fuels such as grasses and
shrubs) are similar in both logged and un-logged stands at 10
years post-logging, and thus the logging-induced disparity in
slash fuels is not great enough to result in differences in tree
mortality. At 20 years post-logging, the logging-induced
disparity in slash fuels has disappeared (Fig. 5), and so
projections of tree mortality among stands are equivalent
beyond this point in time. In conclusion, FVS–FFE predicts that
the slash fuels generated in the 1998/1999 logging operation
would have no fire severity consequences for the developing
stand.
While the slash component of the fuel bed converges among
treatments by 25 years post-logging, temporal patterns of the
log component differ markedly among treatments (Fig. 3), and
differences persist for a longer period of time. First, total dead
tree fuel mass (standing + down) just after logging (year 0) is
much higher in the un-logged controls compared to the logged
stands. The only exception to this pattern is un-logged unit 1U,
a stand that initially experienced only 66% mortality of trees
due to the 1996 Summit Fire (Table 1). For this stand, total dead
tree masses shown in Fig. 3 are substantially lower compared to
other un-logged controls for year 0, because a much higher
proportion of trees in this stand survived the 1996 wildfire, and
were alive at the time the stands were measured in 1999. Thus,
given the objectives of this study, we compare only results of
un-logged control stands 2, 3, and 4U, with the logged stands.
By year 25, most of the dead trees are projected to fall and
become surface fuel, and un-logged control stands (2, 3, and
4U) have double the log mass of commercial stands (28 Mg/ha
versus 14 Mg/ha) and triple the log mass of fuel reduction
stands (28 Mg/ha versus 9 Mg/ha). These differences still
persist at 50 years post-logging, with un-logged stands having
15 Mg/ha of log mass, compared to 9 and 6 Mg/ha for
commercial and fuel reduction stands, respectively (Fig. 3).
When a moderate fire (see Table 2 for specifications) at post-fire
year 25 is simulated to occur, log masses are projected to
consume proportionately, with the three un-logged units (2, 3,

J.D. McIver, R. Ottmar / Forest Ecology and Management 238 (2007) 268–279276
and 4U) having the highest consumption rates. In fact, for each
fire simulation, fuel consumptions are closely related to
loadings of 1000-h fuels, for both moderate and high intensity
fires. Despite these much higher consumptions of 1000-h fuel in
the un-logged units however, the proportion of small stems (10–
22 cm DBH) projected to be killed in a moderate re-burn at 25
years did not differ according to treatment, with mortality of
these trees ranging from 60 to 85%, regardless of initial logging
treatment. In the event of a high intensity fire at 25 years post-
logging, all trees, regardless of size and treatment, are projected
to be killed. Similar patterns of tree mortality are projected to
occur in the event of a re-burn 50 years post-logging, with the
proportion of medium stems (23–41 cm DBH) killed by a
moderate fire ranging from 14 to 25% among units, and with
mortality ranges among units evenly distributed within each
logging treatment type. If a high intensity fire were to occur 50
years post-logging, mortality of medium sized trees ranges
from 80–90%, and again ranges of mortality within each
treatment are nearly identical. These results, in which mortality
of trees is unrelated to loadings of 1000-hr fuels, are due to the
simple fact that the fire behavior and effects models used by
FVS–FFE (BEHAVE and FOFEM), predict tree mortality due
to the extent of crown scorch and bole char, which vary in
accordance with loadings of 10 and 100 fuels, not 1000-h fuels.
Thus, despite two- or three-fold differences among units in
1000-h fuels at each time period, the fuel models [primarily fuel
models 2 (trees with grass under-story), and 9 (moderate
surface fuels), Anderson, 1982], that are assigned to these
stands are closely similar for all units at each point in time post-
treatment, for both moderate and high intensity fires. Results
Fig. 6. Number of snags per ha (mean � S.E.) in un-logged, commercial, and
fuel reduction units at Summit, from immediately post-logging (<1 year) to 25
years post-fire logging. Immediate post-logging data from Brown’s transects;
densities from 5 to 25 years estimated using FVS–FFE Model (intermediate fall
rates).
using FVS–FFE therefore do not support the hypothesis that
post-fire logging will result in lower mortality of trees in the
event of a future re-burn.
Given intermediate snag fall rates (see Table 2), snag
numbers are projected to decline to near zero by 25 years post-
logging. Logging treatments however, are projected to cause
lower numbers of snags through 15 years post-logging (Fig. 6).
By 20 years, this treatment effect is projected to disappear.
5. Discussion
The 1996 Summit Fire was relatively severe for a forest
dominated by ponderosa pine. In the year following the fire, the
average stand consisted of between 200 and 300 stems/ha of
largely dead, charred tree boles, standing above a forest floor
with a substantial amount of exposed mineral soil. By 1999,
three years after the fire, un-logged control units had already
begun to change. About 10% of standing dead trees had fallen
over, increasing woody fuels from about three to five Mg/ha.
Forest floor mass had more than doubled, and consisted of
needles that had fallen from dead trees, and grasses that had
either sprouted or planted themselves after the fire. Exposed
mineral soil had declined from 17 to 1%, due largely to litterfall
from dead trees, and to the development of the grass and forb
community. These changes in control units demonstrate that in
the absence of post-fire management activities, the standing
structure of a severely burned forest can be expected to
collapse quickly. On the other hand, the accumulation of forest
floor and woody fuel mass, and the re-establishment of the
under-story quickly mask the initial ground-level effects of the
burn.
Post-fire logging had significant effects on this process of
stand collapse. On average, logged units had about half the
density of trees and less than half the basal area compared to
pre-harvest levels. Logging activity doubled the mass of woody
fuels, particularly in the smaller size classes. The increase in
total woody fuel was the result both of logging activity creating
slash, and the natural fall-down of dead trees. Forest floor mass
also doubled, to an extent similar to controls, and was largely a
consequence of needle fall. Exposed mineral soil fell off
precipitously, from 42 to 3% in commercial units, and from 23
to 0.5% in fuel reduction units. Given these results, how has
post-fire logging of stands burned by the Summit Fire changed
the likely progression of forest function and structure in the
study area, for the short- and long-term? We will discuss
possible implications of post-fire logging at Summit including:
(1) the potential effects of tree removal on fire-dependent bird
species; (2) the effects of logging activity and tree bole removal
on short and long-term fuel loadings, and on potential severity
of wildfires that may burn in the future.
On average, fuel reduction units had about two-thirds as
many trees and about one-third as much basal area as un-logged
control units after the logging of 1998. Much of the difference
between fuel reduction and un-logged units was in the
intermediate and larger size classes of trees, most of which
were dead, and it is these larger snags that are considered to be
critical habitat for fire-associated bird species (Hutto, 1995;

J.D. McIver, R. Ottmar / Forest Ecology and Management 238 (2007) 268–279 277
Kotliar et al., 2002). In particular, many fire-associated birds are
cavity-nesters, and use large fire-killed snags for primary
nesting habitat. Many of these same bird species also find
burned forests excellent foraging habitat, especially those
species that feed primarily on insects. Several recent bird
studies in post-fire logged mixed-conifer stands similar to
Summit suggest that despite some idiosyncrasies among sites,
in most cases cavity-nesting birds that use burned forests tend to
select nesting sites that have higher densities of the larger snags
(Caton, 1996; Hitchcox, 1996; Saab and Dudley, 1998;
Haggard and Gaines, 2001). Thus, postfire logging prescrip-
tions that require significant retention of the largest snags will
generally provide higher quality nesting and foraging habitat
for cavity-nesting bird species. For example, the ‘partial’ cut of
Caton (1996) (retention of �10 m2/ha basal area trees), the
‘wildlife’ treatment of Saab and Dudley (1998) (retention of
�1/2 of snags >30 cm DBH), and the ‘medium’ treatment of
Haggard and Gaines (2001) (retention of 15–35 snags/ha), each
produced conditions that were relatively more favorable to
cavity-nesting birds, while still allowing some level of tree
harvest. By comparison, the ‘commercial’ treatment of the
present study produced stands that averaged �17 large snags/
ha, and thus likely provided higher quality habitat for cavity-
nesting birds, compared to stands that experienced the fuel
reduction treatment.
In general, the process of felling trees and retrieving them to
landings generates slash, composed of relatively small
diameter woody debris (<7.6 cm diameter). Slash is created
even in thinning operations that remove only a portion of the
overstory (Weatherspoon, 1996; McIver et al., 2003), and tends
to increase short-term fire risk by providing the kind of fuel
necessary to introduce ground fires into the canopy, thereby
increasing the probability of tree-killing crown fires (Weath-
erspoon and Skinner, 1995). The positive relationship between
slash and short-term fire risk is of special concern in cases
where it is desirable to protect either a residual or a developing
stand. For thinning operations designed to create growing
space for residual trees, it is obviously desirable to minimize
the risk of future crown fire, by treating slash fuels left by the
thinning activities. In the case of post-fire logging, it is
similarly desirable to protect the developing stand, whether it
has been planted or has regenerated naturally. For this reason,
Donato et al. (2006) argued that the significant increase in slash
fuels generated by logging after the 2002 Biscuit Fire in
southwest Oregon (mean of �6.7 Mg/ha for logged stands
versus �1.3 Mg/ha for un-logged stands) created an undesir-
able fire risk hazard for the developing stand. At Summit, we
measured closely similar post-logging masses of slash fuels as
those measured for the Biscuit Fire (mean of 6.2 Mg/ha for
logged stands versus 1.3 Mg/ha for un-logged stands; Table 5).
Yet the projected risk of the greater mass of slash fuels in our
logged stands was likely no higher than for the un-logged
stands, for two reasons. First, because slash decays so quickly,
the period of time during which un-logged and logged units
have meaningfully different slash fuel masses is short,
somewhat less than 20 years. Thus, a wildfire would have to
re-occur at the same place during this relatively short period of
time, in order for the difference between logged and un-logged
stands to be expressed in terms of tree mortality. Second, and
most importantly, the developing stand that is at risk in the
short-term would initially be composed of very small trees,
many of which would not survive even a relatively light
intensity fire (see Table 2 for specifications used in our
analysis), let alone a moderate wildfire. In particular, a
moderate wildfire burning in either un-logged or logged stands
10 years post-logging at Summit would be projected to
generate scorch heights higher than the mean height of trees in
the developing stand, with the result that all of these small trees
would be killed. These scorch heights would likely be
generated even in un-logged control stands that have very
low masses of slash fuels, due to the influence of other
components of the fuel bed such as grasses and shrubs. As for
the conclusions drawn in the Biscuit Fire study (Donato et al.,
2006), it is possible that the conditions in southwest Oregon
that drive rates of slash fuel decay and tree growth are different
enough from those at Summit in northeast Oregon, such that
the observed slash fuel masses in logged units could
conceivably create relatively greater fire risk problems in
the short term. For example, higher annual precipitation in the
Biscuit Fire ecosystem could drive more rapid re-growth and
colonization of live fuels such as shrubs, which could interact
with slash fuels in such a way as to create significantly higher
short-term fire risks. Of course, higher precipitation would also
drive higher decay rates of the slash fuels, thus decreasing the
window of time during which risk would be a significant issue.
In general, how logging-generated slash fuels influence future
stand development will tend to vary from site to site, in
accordance with a wide variety of factors. For this reason, real-
time experimental studies such as those of Donato et al. (2006),
as well as the current study, will always need to be interpreted
in the context of these factors, in order for us to fully
understand the range of possible outcomes of postfire logging.
At the present time, probably our best alternative means of
understanding how slash fuels generated by postfire logging
influence short-term fire risk is to conduct retrospective studies
in forests that have burned twice within a 25-year time period,
in which we can measure fire severity in stands that were either
logged or un-logged after the first burn. An excellent
opportunity is the Bisquit Fire itself, where a portion of the
fire burned over the Silver Fire of 1988.
Model projections of post-logging fuels at Summit indicate
that post-fire logging is likely to have a significant effect on
heavy fuel loadings for about 50 years after the initial fire. The
time it takes for residual heavy fuels to become incorporated
into the forest floor depends on both tree fall and wood decay
rate, but the among-treatment patterns projected by the FVS–
FFE model are consistent regardless of these rates, with un-
logged controls having significantly higher masses of 1000-hr
fuel for several decades after harvest. While fuel consumption
correlates closely with 1000-hr fuel loadings for fire simula-
tions conducted at 25, 50, and 100 years, mortality of trees
planted in 1999 does not correlate with fuel consumption. This
is because FVS–FFE uses a fire-effects model (FOFEM) that
may not fully capture long duration smoldering effects that

J.D. McIver, R. Ottmar / Forest Ecology and Management 238 (2007) 268–279278
would be expected to result from the consumption of large
woody fuel on the forest floor. While FOFEM does use bark
thickness, calculated from DBH, as a measure of resistance to
cambial heating from fuel burning on the forest floor, the model
may not be sensitive enough to trigger differences in tree
mortality, even given our observed two-fold differences in
1000-hr fuel mass between un-logged and fuel reduction stands
at 25–50 years post-logging. A similar result was reported by
Reinhardt and Ryan (1998) in their simulations of the effects of
postfire logging in a high density ponderosa pine/Douglas fir
stand in the Bitterroot Valley. While postfire logging would be
expected to generate a stand having about triple the mass of
large woody fuel for four decades after harvest, compared to an
un-logged control, projected flame lengths (and presumably
tree mortality), would be only marginally higher through the
same time period. Yet it is generally known that even large trees
can also be damaged or killed by fire through cambial heating
that results from smoldering combustion of litter and duff that
accumulates at their base over time (Sackett, 1980; Haase and
Sackett, 1998; Agee, 1993). It stands to reason that smoldering
combustion of large woody debris could also damage or kill
trees growing nearby. Thus a fire-effects model that incorpo-
rated the effects of the smoldering combustion of large woody
debris on tree mortality could demonstrate that the un-logged
units at Summit were at somewhat greater risk in the future due
to much higher accumulations of large woody fuel. Until we
know more about the mechanisms of fire-induced tree
mortality, and incorporate this knowledge into fire-effects
models, we will remain uncertain on the extent to which post-
fire logging reduces re-burn severity, at least with respect to
experimental studies that involve the use of fire behavior
models. On the other hand, retrospective studies (e.g. Weath-
erspoon and Skinner, 1995; Omi and Martinson, 2002), in
which twice-burned forests are compared with or without
postfire logging after the first burn, could potentially provide
valuable information on the re-burn issue.
Acknowledgements
Stephanie Rebain (USDA Forest Service, Washington
Office) performed the final FVS–FFE simulations; Kylie
Kramer (Missoula Fire Lab), and Morris Johnson (PNW
Research Station) conducted preliminary simulations. We
thank Glen Fisher, Barb Boaz, Hugh Snook, and Pam Uebler
for working with field crews, and for planning and supervising
the logging operations. Karen Scharf (Malhuer National
Forest), Karen Erickson, and Colette Coiner (Oregon State
University) prepared the map for Fig. 1. Funding for the study
was provided by the Malheur National Forest (Region 6) and
the Blue Mountains Natural Resources Institute (USDA Forest
Service, PNW Research Station). The paper was improved by
comments from Jim Agee (University of Washington), Carl
Skinner, Sally Haase, John Szymoniak (USDA Forest Service,
PSW Research Station), Vicky Saab (USDA Forest Service
Rocky Mt. Station), Jane Hayes, Clint Wright (USDA Forest
Service, PNW Research Station), and four anonymous
reviewers.
References
Abbot, D.T., Crossley, D.A., 1982. Woody litter decomposition following clear-
cutting. Ecology 63, 35–42.
Agee, J.K., 1996. Fire in the Blue Mountains: a history, ecology, and research
agenda. In: Jaindl, R.G., Quigley, T.M. (Eds.), Search for a Solution:
Sustaining the Land, People and Economy of the Blue Mountains. American
Forests, Washington, D.C., pp. 119–145.
Aho, P.E., Cahill, J.M., 1984. Deterioration rates of blowndown timber and
potential problems associated with product recovery. USDA For. Serv. Gen.
Tech. Rep. PNW-167, 11 pp.
Albini, F.A., 1976. Computer-based Models of Wildland Fire Behavior: A
User’s Manual. USDA Forest Service, Intermountain Forest and Range
Experiment Station, Ogden, UT, 68 pp.
Amman, G.D., Ryan, K.C., 1991. Insect infestation of fire-injured trees
in the greater Yellowstone area. USDA For. Serv. Res. Note INT-398,
9 pp.
Anderson, H., 1982. Aids to determining fuel models for estimating fire
behavior. USDA Forest Service General Technical Report, INT-122, Inter-
mountain Forest and Range Experiment Station, Ogden, UT.
Barker, P.F., 1989. Timber salvage operations and watershed resource values.
In: Proceedings of the Symposium on Fire and Watershed Management,
Berg, NH (Tech. Coord.). USDA For. Serv. Gen. Tech. Rep. PSW-109, pp.
1–2.
Beschta, R.L., Rhodes, J.J., Kauffman, J.B., Gresswell, R.E., Minshall, G.W.,
Karr, J.R., Perry, D.A., Hauer, F.R., Frissell, C.A., 2004. Post-fire manage-
ment on forested public lands of the western United States. Conserv. Biol.
18, 957–967.
Brown, J., 1974. Handbook for inventorying downed woody material. General
Technical Report, USDA Forest Service Intermountain Station, GTR-INT-
16, 24 pp.
Busse, M.D., 1994. Downed bole-wood decomposition in lodgepole pine forests
of central Oregon. Soil Sci. Soc. Am. J. 58, 221–227.
Caton, E.L., 1996. Effects of fire and salvage logging on the cavity-nesting bird
community in northwestern Montana. Ph.D. Dissertation. University of
Montana, Missoula, 115 pp.
Donato, D.C., Fontaine, J.B., Campbell, J.L., Robinson, W.D., Kauffman, J.B.,
Law, B.E., 2006. Post-wildfire logging hinders regeneration and increases
fire risk. Science 311, 352.
Haggard, M., Gaines, W.L., 2001. Effects of stand-replacement fire and salvage-
logging on a cavity-nesting bird community in Eastern Cascades, Washing-
ton. Northwest Sci. 75, 387–396.
Haase, S.M., Sackett, S.S., 1998. Effects of prescribed fire in giant sequoia-
mixed conifer stands in Sequoia and Kings Canyon National Parks. In:
Pruden, T.L., Brennan, L.A. (Eds.), Fire in Ecosystem Management:
Shifting the Paradigm from Suppression to Prescription. Tall Timbers Fire
Ecology Conference Proceedings, No. 20, Tall Timbers Research Stations,
Tallahassee, FL, pp. 236–243.
Hinklemann, K., Kempthorne, O., 1994. Design and Analysis of Experiments.
vol. I. Introduction to Experimental Design. John Wiley and Sons, Inc., New
York, 495 p.
Hitchcox, S.M., 1996. Abundance and nesting success of cavity-nesting birds in
un-logged and salvage-logged burned forest in northwestern Montana.
M.Sc. Thesis. University of Montana, Missoula, 89 pp.
Hutto, R.L., 1995. Composition of bird communities following stand-replace-
ment fires in northern Rocky Mountain (USA) conifer forests. Conserv.
Biol. 9 (5), 1041–1058.
Kotliar, N.B., Hejl, S.J., Hutto, R.L., Saab, V.A., Melchier, C.P., McFadzen,
M.E., 2002. Effects of fire and post-fire salvage logging on avian commu-
nities in conifer-dominated forests of the western United States. Stud. Avian
Biol. 25, 49–64.
Landram, F.M., Laudenslayer, W.F., Atzet, T., 2002. Demography of snags in
eastside pine forests of California. In: Proceedings of the Symposium on the
Ecology and Management of Dead Wood in Western Forests, November 2–
4, 1999. Reno, NV. General Technical Report, USDA Forest Service Pacific
Southwest Research Station, PSW-GTR-181, pp. 605–620.
Maser, C., 1996. Salvage logging: the loss ecological reason and moral restraint.
J. Ecofor. 12, 176–178.

J.D. McIver, R. Ottmar / Forest Ecology and Management 238 (2007) 268–279 279
McIver, J.D., McNeil, R., 2006. Soil disturbance and hill-slope sediment
transport after logging of a severely burned site in northeastern Oregon.
Western J. Appl. For. 21 (3), 123–133.
McIver J.D., Starr, L., 2000. Environmental effects of postfire salvage: literature
review and annotated bibliography. USDA Forest Service General Tech-
nical Report, PNW-GTR-486, Portland, OR.
McIver, J.D., Starr, L., 2001. A literature review on the environmental effects of
post-fire logging. Western J. Appl. For. 16, 159–168.
McIver, J.D., Adams, P.W., Doyal, J.A., Drews, E.S., Hartsough, B.R., Kellogg,
L.D., Niwa, C.G., Ottmar, R., Peck, R., Taratoot, M., Torgersen, T.,
Youngblood, A., 2003. Economics and environmental effects of mechanized
logging for fuel reduction in northeastern Oregon mixed-conifer stands.
Western J. Appl. For. 18, 238–249.
Minshall, G.W., Meyer, J.L., Stanford, J.A., Karr, J.A., Frissell, C.A., 1994.
Letter dated 19 September 1994 to President Clinton on fire and salvage
logging. File with Pacific Rivers Council, Eugene, OR, p. 2.
Omi, P., Martinson, E.J., 2002. Effect of fuels treatment on wildfire severity.
Final Report to the Governing Board, Joint Fire Science Program.
Ottmar, R.D., Burns, M.G., Hanson, A.D., Hall, J.N., 1993. CONSUME users
guide. Gen. Tech. Rep. PNW-GTR-304. USDA, Forest Service, PNW
Research Station, Portland, OR, 137 pp.
Poff, R.J., 1989. Compatibility of timber salvage operations with watershed
values. In: Berg, N.H. (Tech. Coord.), Proceedings of the Symposium on
Fire and Watershed Management. USDA For. Serv. Gen. Tech. Rep. PSW-
109, pp. 137–140.
Reinhardt, E.D., Crookston, N.L., 2003. The fire and fuels extension
to the forest vegetation simulator. USDA Forest Service Rocky Mt.
Research Station, General Technical Report, RMRS-GTR-116,
220 pp.
Reinhardt, Elizabeth D., Ryan, Kevin C., 1998. Analyzing effects of manage-
ment actions including salvage, fuel treatment, and prescribed fire on fuel
dynamics and fire potential. In: Teresa, L., Pruden, Leonard, A., Brennan,
(Eds.), Fire in Ecosystem Management: Shifting the Paradigm from
Suppression to Prescription. Tall Timbers Fire Ecology Conference Pro-
ceedings, No. 20, Tall Timbers Research Station, Tallahassee, FL.
Saab, V., Dudley, J., 1998. Responses of cavity-nesting birds to stand-replace-
ment fire and salvage logging in ponderosa pine/Douglas-fir forests of
southwestern Idaho. USDA For. Serv. Res. Pap. RMRS-RP-11, 17 pp.
Sackett, S.S., 1980. Reducing Natural Ponderosa Pine Fuels Using Prescribed
Fire: Two Case Studies. Research Note RM-392. U.S. Department of
Agriculture, Forest Service, Pacific Southwest Research Station, Albany, CA.
SPSS, 2001. SPSS Professional Statistics, Version 10.0. Chicago, Illinois.
Stone, R., 1993. Spotted owl plan kindles debate on salvage logging. Science
261, 287.
USDA, 1996. Forest health and salvage. Forest health issue paper, USDA Forest
Service Washington Office (Available from Dave Hessel, Director, Forest
Management, P.O. Box 96090, Washington, DC).
USDA, 1997. Summit Fire Recovery Project Final Environmental Impact
Statement. R6-MAL-97-0003a, USDA Forest Service, Region 6, Malheur
National Forest.
USDA and USDI, 1997a. Eastside Draft Environmental Impact Statement, vol.
1. USDA Forest Service, USDI Bureau of Land Management, Portland, OR.
USDA and USDI, 1997b. Upper Columbia River Basin Draft Environmental
Impact Statement, vol. 1. USDA Forest Service, USDI Bureau of Land
Management, Portland, OR.
Weatherspoon, C.P., Skinner, C.N., 1995. An assessment of factors associated
with damage to tree crowns from the 1987 wildfires in northern California.
For. Sci. 41, 430–451.
Weatherspoon, C.P., 1996. Fire–silviculture relationships in Sierra forests. In:
Sierra Nevada Ecosystem Project: Final Report to Congress. vol. II.
Assessments and Scientific Basis for Management Options. University of
California, Centers for Water and Wildland Resources, Davis, CA, pp.
1167–1176.
Westfall, P., Tobias, R.D., Rom, D., Wolfinger, R.D., Hochberg, Y., 1999.
Multiple Comparisons and Multiple Tests Using SAS. SAS Institute Inc.,
Cary, NC, 397 pp.