Fuel Cell Technologies Office Webinar - Department of … · Fuel Cell Technologies Office Webinar...
63
Fuel Cell Technologies Office Webinar Total Cost of Ownership Modeling for Stationary Fuel Cell Systems Max Wei Program Manager in Sustainable Energy Systems, Energy Analysis and Environmental Impacts Division Lawrence Berkeley National Lab December 13, 2016
Transcript of Fuel Cell Technologies Office Webinar - Department of … · Fuel Cell Technologies Office Webinar...

Fuel Cell Technologies Office | 1 Fuel Cell Technologies Office Webinar
Total Cost of Ownership Modeling for Stationary Fuel Cell Systems
Max Wei Program Manager in Sustainable Energy Systems, Energy Analysis and Environmental Impacts Division Lawrence Berkeley National Lab
December 13, 2016

Fuel Cell Technologies Office | 2 Question and Answer
• Please type your questions into the question box
2

Page 3
Research Team Partners University of California, Berkeley Laboratory for Manufacturing and Sustainability, Dept. of Mechanical Engineering:
— Manufacturing process analysis, DFMA analysis University of California, Berkeley Transportation Sustainability Research Center and DOE Pacific Region Clean Energy
Application Center: — System and BOP design, functional specs, BOM definition, parametric relationships — CHP applications and functional requirements
Strategic Analysis
— SOFC system design and functional specifications
Other Collaborators
— No other funded subcontracts, but many industry contacts and expert reviewers.
Page 4
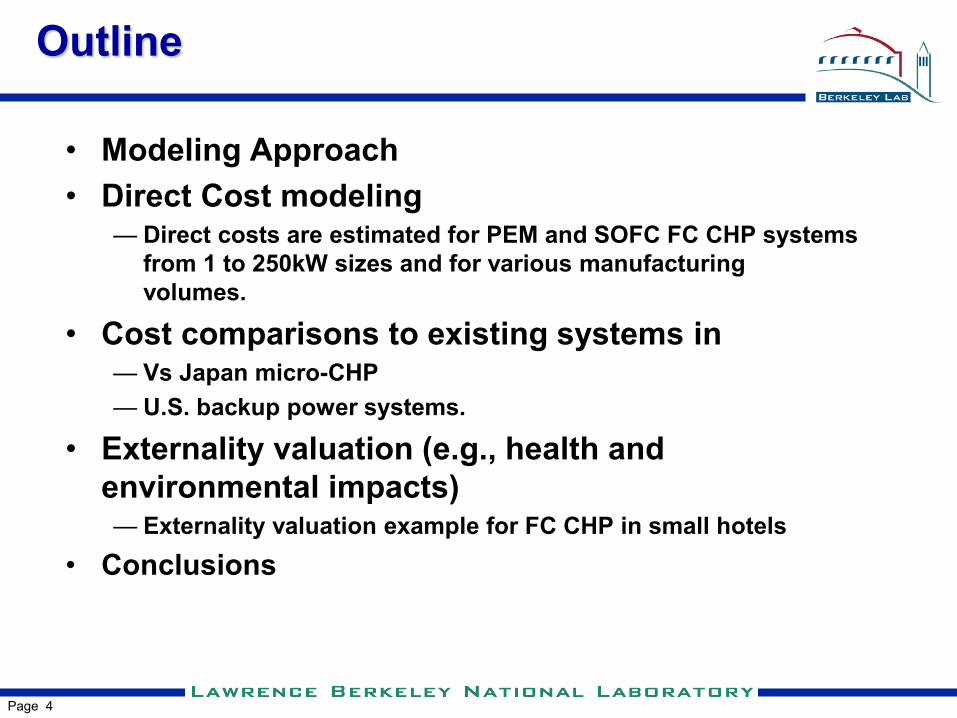
Outline
• Modeling Approach • Direct Cost modeling
— Direct costs are estimated for PEM and SOFC FC CHP systems from 1 to 250kW sizes and for various manufacturing volumes.
• Cost comparisons to existing systems in — Vs Japan micro-CHP — U.S. backup power systems.
• Externality valuation (e.g., health and environmental impacts) — Externality valuation example for FC CHP in small hotels
• Conclusions

Page 5
Relevance & Goals
Total-cost-of-ownership (TCO) modeling tool for design and manufacturing of fuel cells in stationary and materials-handling systems in emerging markets Expanded framework to include life-cycle analysis (LCA) and possible ancillary financial benefits, including: • carbon credits, health/environmental externalities, end-of-life recycling,
reduced costs for building operation Identify system designs that meet lowest manufacturing cost and TCO goals as a function of application requirements, power capacity, and production volume Provide capability for sensitivity analysis to key cost assumptions
BARRIERS • High capital and installation costs with a failure to address reductions in
externalized costs and renewable energy value • Potential policy and incentive programs may not value fuel cell (FC) total
benefits.
DivRev05 page 6
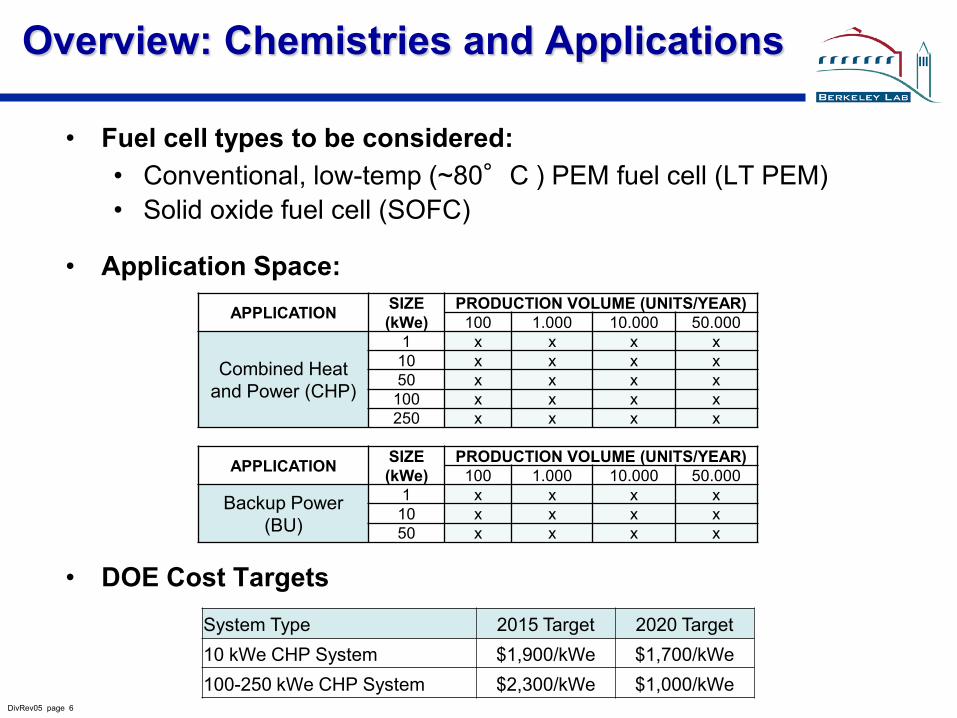
Overview: Chemistries and Applications
• Fuel cell types to be considered: • Conventional, low-temp (~80°C ) PEM fuel cell (LT PEM) • Solid oxide fuel cell (SOFC)
• Application Space:
• DOE Cost Targets
APPLICATION SIZE (kWe)
PRODUCTION VOLUME (UNITS/YEAR) 100 1.000 10.000 50.000
Combined Heat and Power (CHP)
1 x x x x 10 x x x x 50 x x x x
100 x x x x 250 x x x x
APPLICATION SIZE (kWe)
PRODUCTION VOLUME (UNITS/YEAR) 100 1.000 10.000 50.000
Backup Power (BU)
1 x x x x 10 x x x x 50 x x x x
System Type 2015 Target 2020 Target 10 kWe CHP System $1,900/kWe $1,700/kWe 100-250 kWe CHP System $2,300/kWe $1,000/kWe

Page 7
Approach: TCO Model Structure and Key Outputs
Page 7
Total Cost of Ownership (TCO) Model
Assumptions: Application/ Size Mfg Volume/Yr
Location (mfg, op) Prices
Policies Fuel input
Outages/Lifetimes
Manufacturing Cost Model Direct mfg costs Indirect mfg costs
Lifecycle Cost Model Capital/installation Fuel and operations Maintenance Stack replacements End of life
Life Cycle Impact Assessment Models Monetized health and GHG impacts
Key Outputs: 1) System manufacturing costs and “factory gate” prices 2) TCO Metrics: Levelized costs (/kWh), Total costs/yr 3) TCO including broader social costs
Page 8
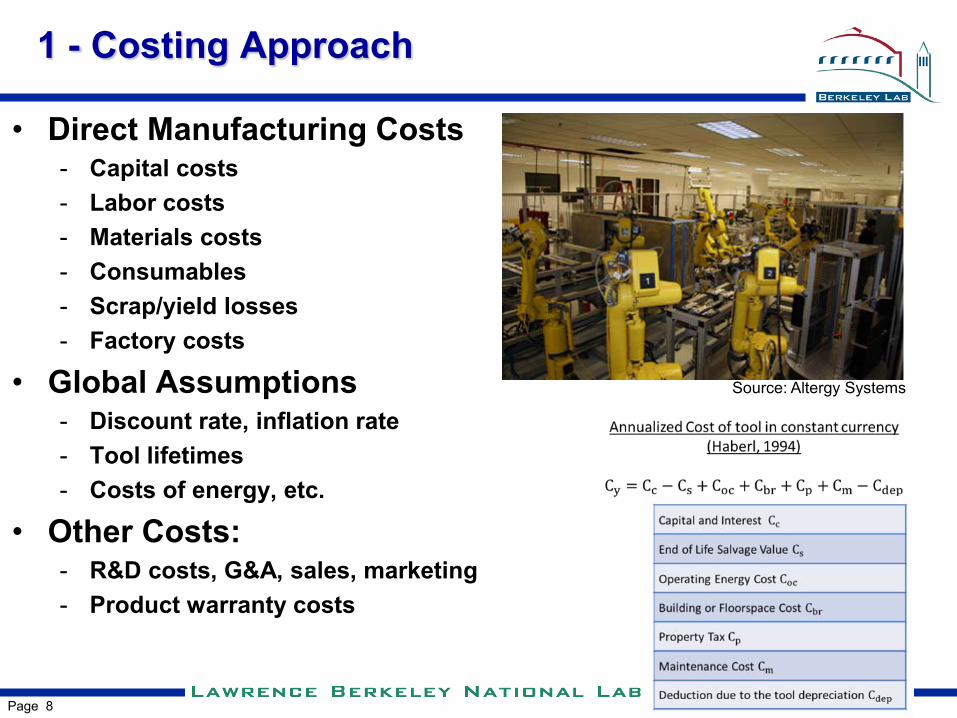
1 - Costing Approach
• Direct Manufacturing Costs - Capital costs - Labor costs - Materials costs - Consumables - Scrap/yield losses - Factory costs
• Global Assumptions - Discount rate, inflation rate - Tool lifetimes - Costs of energy, etc.
• Other Costs: - R&D costs, G&A, sales, marketing - Product warranty costs
Source: Altergy Systems
Page 9
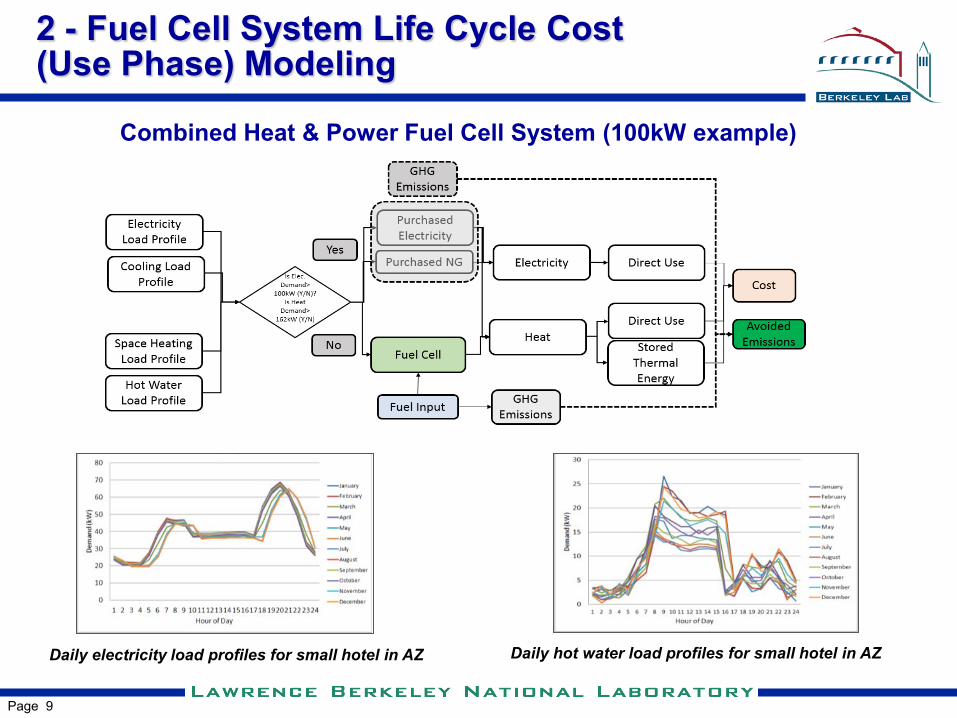
2 - Fuel Cell System Life Cycle Cost (Use Phase) Modeling
Combined Heat & Power Fuel Cell System (100kW example)
Daily electricity load profiles for small hotel in AZ Daily hot water load profiles for small hotel in AZ
Page 10
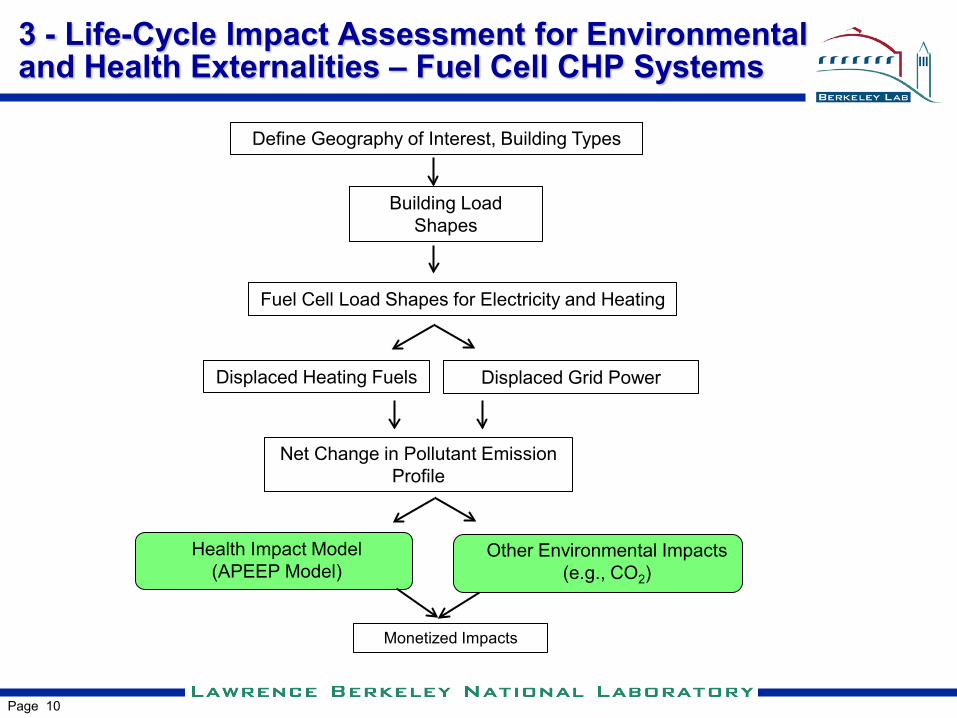
Define Geography of Interest, Building Types
Building Load Shapes
3 - Life-Cycle Impact Assessment for Environmental and Health Externalities – Fuel Cell CHP Systems
Fuel Cell Load Shapes for Electricity and Heating
Displaced Heating Fuels Displaced Grid Power
Net Change in Pollutant Emission Profile
Health Impact Model (APEEP Model)
Monetized Impacts
Other Environmental Impacts (e.g., CO2)

Page 11
PEM AND SOFC FC SYSTEM DIRECT MANUFACTURING COSTS

Page 12
100 kW PEM Stationary (CHP) Reformate Fuel
Subsystem A
Inverter/ Conditioning
Subsystem F
Controls/Meters Subsystem G
H2O Makeup
Subsystem D
H2O Pump
Exhaust Air
Air Humidif.
Air Filter
Reactant Air Supply
Subsystem C
Vent Air Supply
Subsystem H
Reformer+ WGS
NG Supply
Pre-treat
Clean-up
Subsystem B
Burner
Coolant Pumps
Subsystem E
Thermal Host
Fuel
H2O Coolant Power
Air
Blower
Exhaust H2O Blower
T. Lipman - DOE FC TCO Project
Clean syn-gas
Air slip 4 kW
Gross stack power 116 kW
65 °C

Page 13
Component Primary Approach Reference
Membrane Purchase Nafion Patent review, Industry input
CCM* Dual Decal, slot die coating
Literature, patents, industry input
GDL* Spray coat MPL Literature, industry input
Bipolar Plates* Injection molded graphite –carbon composite (and Metal Plates)
Literature, patents, industry input
Seal/Frame MEA*
Framed MEA Patents, industry input
Stack Assembly* Partial to fully automated
Patents, Industry input
Endplate/ Gaskets
Graphite composite/ Screen printed
Industry input, literature
Test/Burn-in Post Assembly 3 hrs Industry input
Parameter Value Unit Gross system power 124 kW
Net system power 100 kW
Electrical output 480V AC Volts AC or DC
Waste heat grade 65 Temp. °C Fuel utilization 80-95 % Avg. System Net Electrical efficiency
32 % LHV
Thermal efficiency 51 % LHV
Total efficiency 83 Elect.+thermal (%)
Stack power 9.5 kW Total plate area 360 cm2
CCM coated area 232 cm2
Single cell active area 198 cm2
Cell amps 111 A Current density 0.56 A/cm2
Reference voltage 0.7 V
Power density 0.392 W/cm2
Single cell power 78 W Cells per stack 122 Cells Stacks per system 13 Stacks
DFMA Manufacturing approaches for LT-PEM FC CHP and backup power systems
Functional specs for 100kW CHP system operating with reformate fuel, 0.5mg/cm2 Pt
PEM CHP System Designs and Functional Specs
*Full DFMA Costing analysis was performed

Page 14
Manufacturing Cost Model – CCM, Metal Plates CCM Process Flow-Cathode Coating Line

Page 15
System Cost for 10/100kW CHP LTPEM
• Stack cost dominated by CCM then GDL and plate • BOP_Non-FP and BOP_Fuel processor are 70%-85% of overall cost • System direct cost < $900/kW at high volumes
10 kW
100 kW

Page 16
PEM BOP Components Cost Breakdown
• Balance of plant: about 27% power subsystem, 26% fuel processing, 17% misc.

LT PEM Stack Cost Sensitivity
• Process yield and Power density dominate the cost sensitivity at all production levels
• Stack material cost more at high production volumes • Stack capital cost less sensitive at high production volumes
LOW VOL.
HIGH VOL.

Page 18
Fuel
H2O Coolant Power
Air
Inverter/ Conditioning
Liquid Pumps
T. Lipman - DOE FC TCO Project
NG/reformate
Air Filter
Reactant Air Supply
Exhaust Air
Compressor Subsystem A
Subsystem C
Subsystem E
Subsystem F
Controls/Meters Subsystem G
Thermal Host
Vent Air
Burner
NG Supply
Pre-treat
Subsystem B
1 kW Gross stack
power 54.9 kW 600 °C 50 °C
React. Air Heat
600 °C
Burner Exhaust 660 °C
25°C
180°C
200 °C
700 °C
50 kW (net AC)
650 °C
75% NG
Fan
Reformer
3-way valve
50 kW SOFC CHP System with Reformate Fuel

Page 19
Component Primary Approach Reference
Anode* Ni / YSZ Tape casting Patent review, Industry input
Interlayer* Ni 50% / YSZ 50% Screen printing Patent review, Industry input
Electrolyte* YSZ – Screen printing Literature, patents, industry input
Interlayer* LSM 50 %/ YSZ 50% - Screen printing Literature, patents, industry input
Cathode* Conducting Ceramic– Screen printing Literature, industry input
Plates* Stamped metal plates with SS441 Literature, patents, industry input
Seal/Frame MEA*
Framed EEA Patents, industry input
Stack Assembly* Partial to fully automated Patents, Industry input
Endplate/ Seals* Metal endplate Industry input, literature
Test/Burn-in Post Assembly 3 hrs Industry input
DFMA Manufacturing approaches for SOFC CHP and Power systems, anode-supported cell
SOFC CHP System Designs and Functional Specs
*Full DFMA Costing analysis was performed

Page 20
Functional Specs 50kW
CHP with Reformate
Fuel
50 kW Size Best. Ests. Source Unique Properties: Units: System Gross system power 54.9 kW DC Net system power 50 kW AC
Physical size 2x3x3 meter x meter x meter
Based on Bloom ES-5700 - Not incl. CHP eqpt
Physical weight 3600 kg Based on Bloom ES-5700 - Not incl. CHP eqpt
Electrical output 480V AC Volts AC or DC DC/AC inverter effic. 95.5% % FCE 2013
Waste heat grade 220 Temp. °C From ~800 C. stack after air pre-heat
Fuel utilization % (first pass) 85% % CFCL 2014
Fuel input power (LHV) 84.23 kW Stack voltage effic. 64% % LHV function of cell voltage Gross system electr. effic. 65.1% % LHV
Avg. system net electr. effic. 59.4% % LHV CFCL 2014 60% electr. Eff.
Thermal efficiency 24.4% % LHV 70% recovery of avail. Heat
Total efficiency 83.8% Elect.+thermal (%) FCE = 83.4% LHV; CFCL 82% Stack Stack power 54.86 kW
Total plate area 540 cm^2 Nextech for 10 kW: active=300 cm2 ; VersaPower 25x25 cm2
Actively catalyzed area 329 cm^2 Est. 61% of tot. plate area Single cell active area 299 cm^2 10% less than CCM area Gross cell inactive area 45 % Cell amps 105 A Current density 0.35 A/cm^2 James 2012: 0.364mA/cm2 Reference voltage 0.8 V From James 2012 DOE Power density 0.282 W/cm^2 James 2012: 0.291 W/cm2 Single cell power 84 W Nextech: 103 W/cell Cells per stack 130 cells Percent active cells 100 % Stacks per system 5 stacks

Page 21
Manufacturing Cost Model – EEA, Metal Plates
EEA Cost Plot - 100kW System
EEA Process Flow-Cathode Coating Line Metal Plate Process Flow
Plates Cost Plot - 100kW System

Page 22
System Cost for 10/100kW CHP SOFC
• Stack cost dominated by EEA then seal/frame at high volumes • BOP are 60%-85% of overall cost • System direct cost < $600/kW at high volumes
10 kW
100 kW

Page 23
SOFC BOP Components Cost Breakdown
• Balance of plant: about 40% power subsystem, 20% controls/metering, 15% fuel processing
Page 24
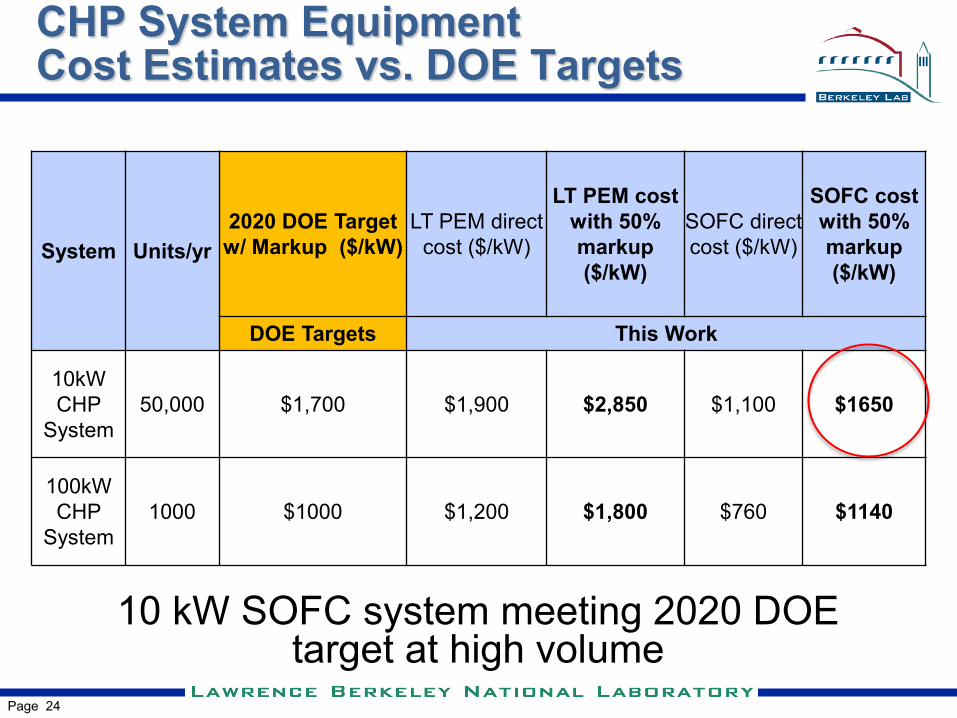
10 kW SOFC system meeting 2020 DOE target at high volume
System Units/yr 2020 DOE Target w/ Markup ($/kW)
LT PEM direct cost ($/kW)
LT PEM cost with 50% markup ($/kW)
SOFC direct cost ($/kW)
SOFC cost with 50% markup ($/kW)
DOE Targets This Work
10kW CHP
System 50,000 $1,700 $1,900 $2,850 $1,100 $1650
100kW CHP
System 1000 $1000 $1,200 $1,800 $760 $1140
CHP System Equipment Cost Estimates vs. DOE Targets
Page 25
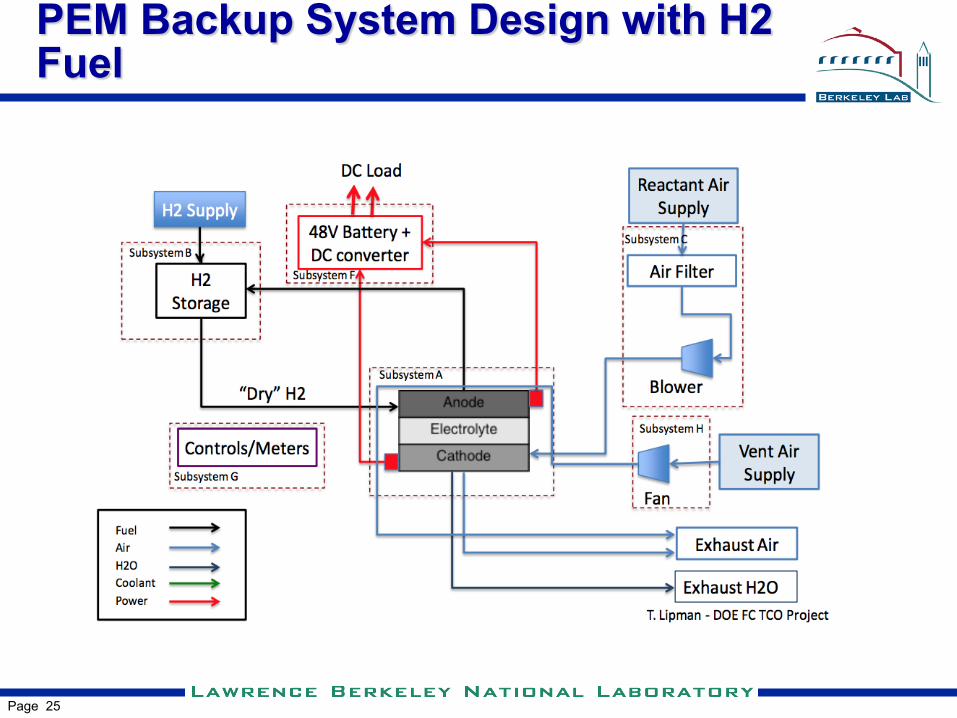
PEM Backup System Design with H2 Fuel
Page 26
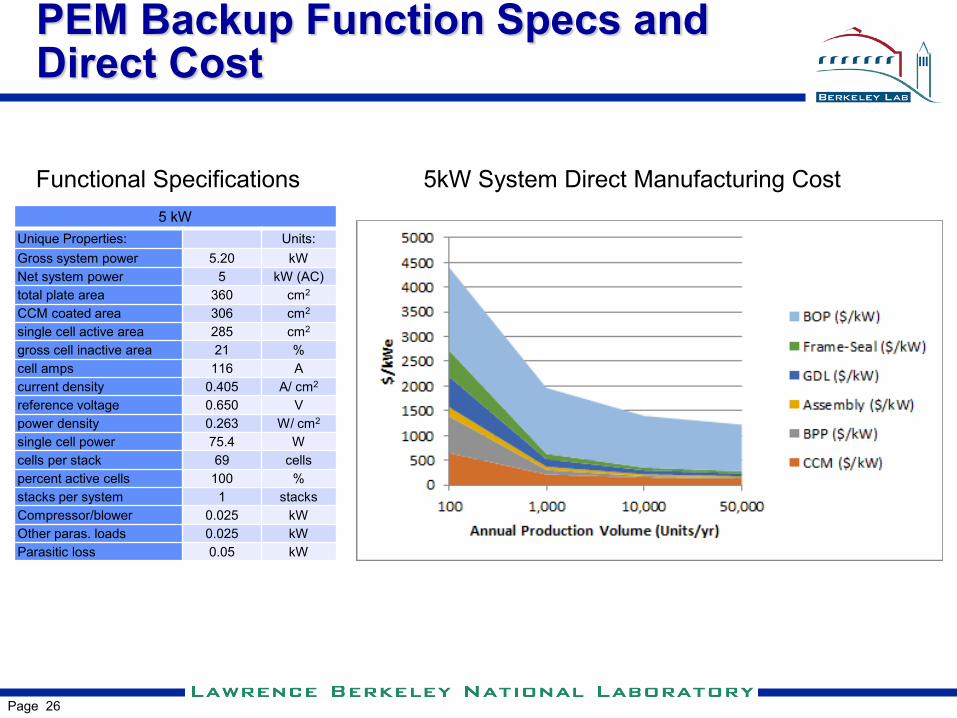
PEM Backup Function Specs and Direct Cost
5 kW Unique Properties: Units: Gross system power 5.20 kW Net system power 5 kW (AC) total plate area 360 cm2 CCM coated area 306 cm2 single cell active area 285 cm2 gross cell inactive area 21 % cell amps 116 A current density 0.405 A/ cm2 reference voltage 0.650 V power density 0.263 W/ cm2 single cell power 75.4 W cells per stack 69 cells percent active cells 100 % stacks per system 1 stacks Compressor/blower 0.025 kW Other paras. loads 0.025 kW Parasitic loss 0.05 kW
Functional Specifications 5kW System Direct Manufacturing Cost

Page 27
COST COMPARISONS TO MARKET DATA AND OTHER MODELS

Page 28
Japan Micro CHP (LT PEM) – LBNL cost modeling can help disaggregate cost reductions
• 17% Learning curve from 2009-2014, nominal 0.7kW system • 50% cost reduction observed from 2009 to 2014
• LBNL Cost model implies about 23% cost reduction from economies of scale (estimate ~1300 units/yr, 2009 to about 20,000 units/yr in 2014)
• About 19% cost reduction estimated based on publically announced design and performance improvements; about 20% cost reduction attributed to other factors.
• These three factors give the observed 50% cost reduction from 2009-2013.
LEARNING CURVE (2009-2015) LBNL DIRECT COST MODEL
2009
2015
2014 Price/kW $21,800

Page 29
Cost Modeling Comparison –10kW Low Temp. PEM CHP
Source Year System Size and Annual Production
Volume
Pt Loading (mg/cm2)
Stack Direct Manufacturing
Cost ($/kW)
Yield CHP Direct System Cost
($/kW)
Manhattan Project
2011 10kW, 5000 units/yr.
0.5 $850 $480
60% 80%
Na
Strategic Analysis
2012 10kW, 5000 units/yr.
0.4 $370 99% ~$2100
This Work 2016 10kW, 5000 units/yr.
0.5 $860 $600 $450
60% 80% 99%
$2800 $2550 $2400
Page 30
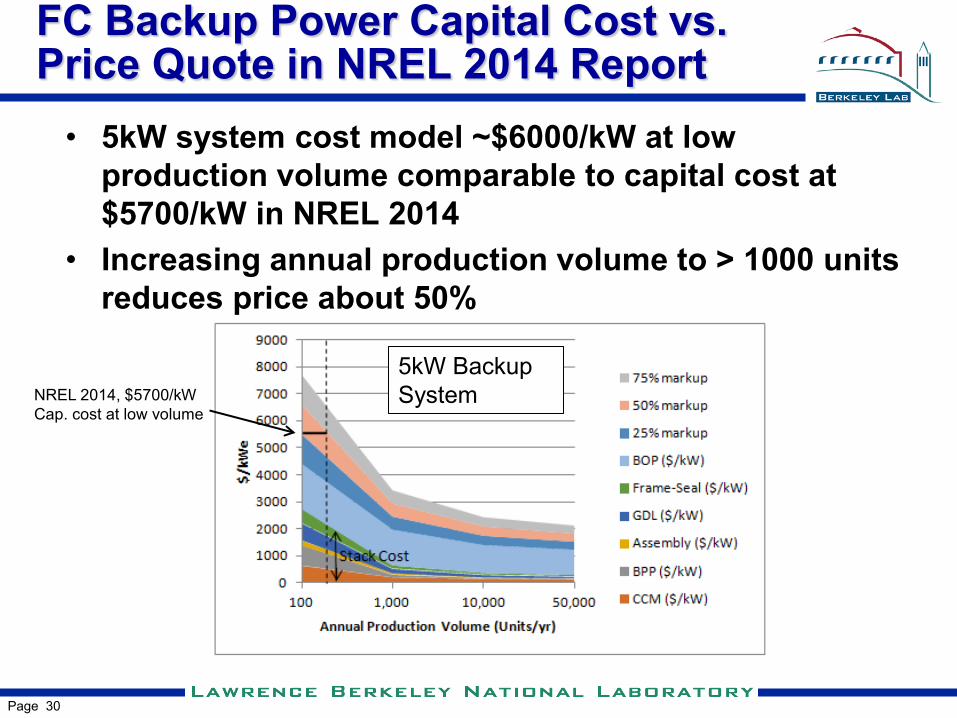
FC Backup Power Capital Cost vs. Price Quote in NREL 2014 Report
• 5kW system cost model ~$6000/kW at low production volume comparable to capital cost at $5700/kW in NREL 2014
• Increasing annual production volume to > 1000 units reduces price about 50% NREL 2014, $5700/kW
Cap. cost at low volume
5kW Backup System

Page 31
Total system cost data from California Self-Generation Incentive Program (SGIP)
SOFC Installed Price MCFC/ PAFC Installed Price
y = 13020x-0.056 R² = 0.0278
y = 40068x-0.2 R² = 0.2492
1000
10000
100000
100 1000 10000 100000C
ost i
n /k
W
Molten Carbonate FCPhosphoric Acid FCPower (Molten Carbonate FC)Power (Phosphoric Acid FC)
• Cost reduction not seen in CA SGIP database • SOFC: Estimate annual volume of hundreds of units per year (40-50kW modules)
• Difficult to estimate system manufacturing cost without further information • Possibly much higher cost than LBNL and other cost models
• Due to lower automation, lower yield, material costs, “engineering” labor costs?

Page 32
EXTERNAL VALUATION MODELING

Page 33
Define Geography of Interest, Building Types
Building Load Shapes
3 - Life-Cycle Impact Assessment for Environmental and Health Externalities – Fuel Cell CHP Systems
Fuel Cell Load Shapes for Electricity and Heating
Displaced Heating Fuels Displaced Grid Power
Net Change in Pollutant Emission Profile
Health Impact Model (APEEP Model)
Monetized Impacts
Other Environmental Impacts (e.g., CO2)
Page 34
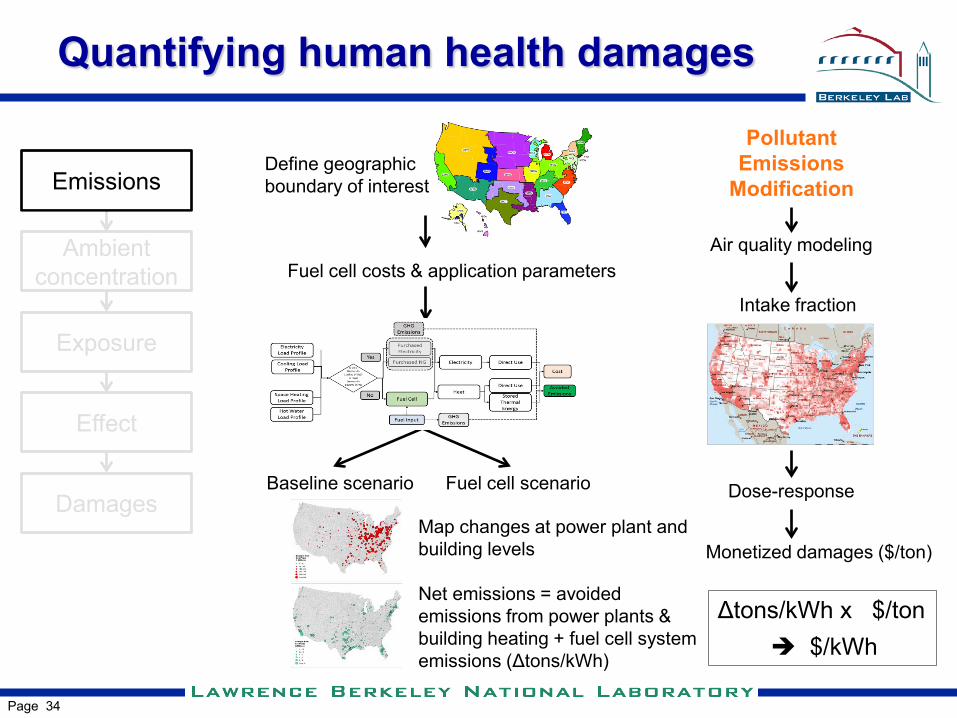
Quantifying human health damages
Emissions
Ambient concentration
Exposure
Effect
Damages
Fuel cell costs & application parameters
Baseline scenario Fuel cell scenario
Define geographic boundary of interest
Map changes at power plant and building levels Net emissions = avoided emissions from power plants & building heating + fuel cell system emissions (Δtons/kWh)
Pollutant Emissions
Modification
Air quality modeling
Intake fraction
Dose-response
Monetized damages ($/ton)
Δtons/kWh x $/ton $/kWh

Page 35
Marginal benefits of abatement valuation from AP2 model and updated eGRID subregion emission factors
• 50kW small hotel CHP example shown (LT PEM)
Overall externality benefits
Health and Environmental Savings
GHG benefits
Page 36
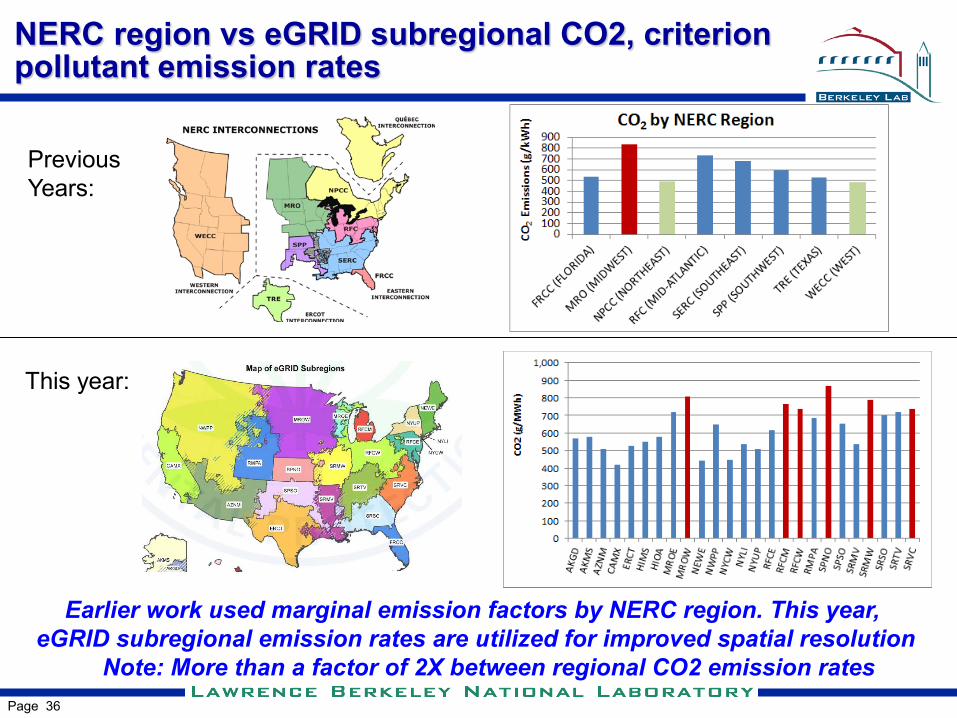
NERC region vs eGRID subregional CO2, criterion pollutant emission rates
Earlier work used marginal emission factors by NERC region. This year, eGRID subregional emission rates are utilized for improved spatial resolution
Note: More than a factor of 2X between regional CO2 emission rates
Previous Years:
This year:

Page 37
Levelized cost of electricity with TCO credits
• Example of 50kW LT PEM CHP in hotel at $2900/kWe installed cost (2000 units annual production)
LCOE with TCO Credits
Page 38
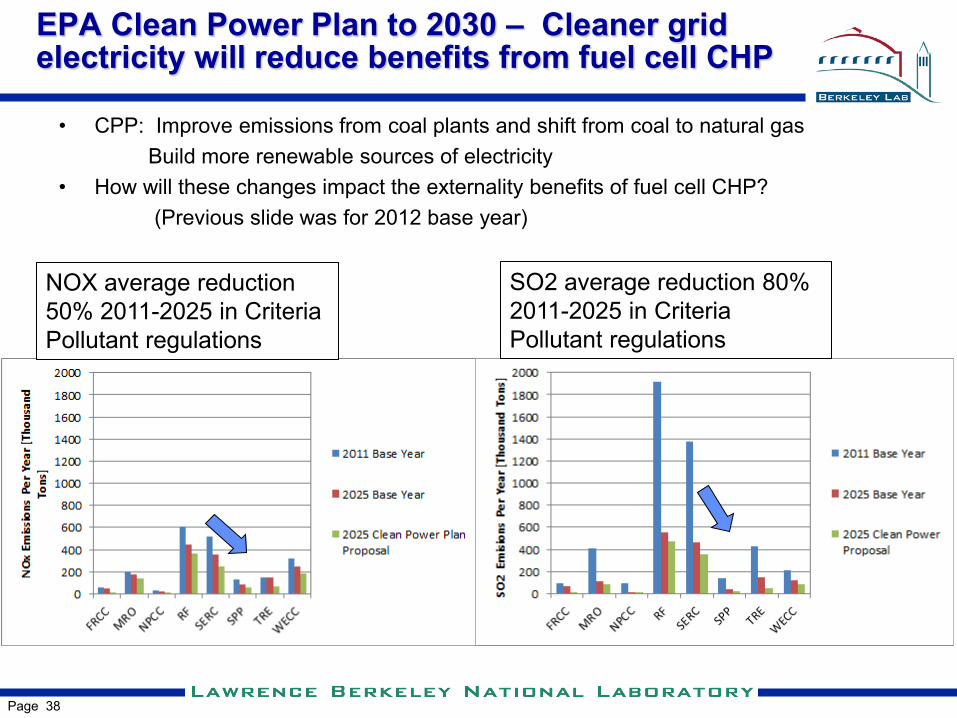
EPA Clean Power Plan to 2030 – Cleaner grid electricity will reduce benefits from fuel cell CHP
• CPP: Improve emissions from coal plants and shift from coal to natural gas Build more renewable sources of electricity
• How will these changes impact the externality benefits of fuel cell CHP? (Previous slide was for 2012 base year)
• Sensitivity to 2025: 50%+/-20% reduction in NOX • 80% +/-20% reduction in SO2
NOX average reduction 50% 2011-2025 in Criteria Pollutant regulations
SO2 average reduction 80% 2011-2025 in Criteria Pollutant regulations
Page 39
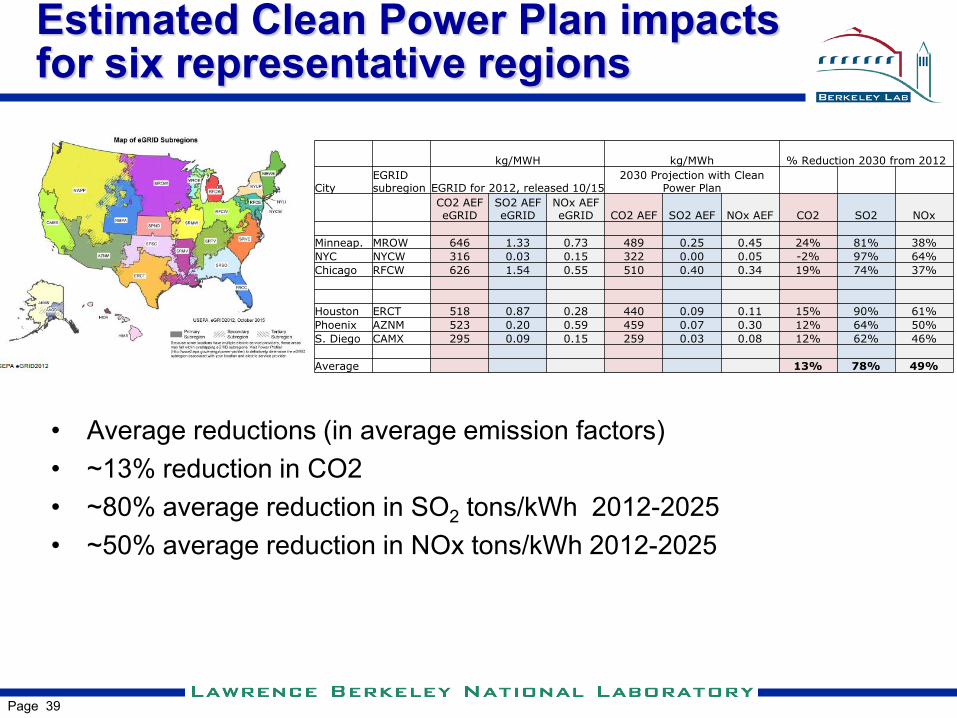
Estimated Clean Power Plan impacts for six representative regions
• Average reductions (in average emission factors) • ~13% reduction in CO2 • ~80% average reduction in SO2 tons/kWh 2012-2025 • ~50% average reduction in NOx tons/kWh 2012-2025
kg/MWH kg/MWh % Reduction 2030 from 2012
City EGRID subregion EGRID for 2012, released 10/15
2030 Projection with Clean Power Plan
CO2 AEF eGRID
SO2 AEF eGRID
NOx AEF eGRID CO2 AEF SO2 AEF NOx AEF CO2 SO2 NOx
Minneap. MROW 646 1.33 0.73 489 0.25 0.45 24% 81% 38% NYC NYCW 316 0.03 0.15 322 0.00 0.05 -2% 97% 64% Chicago RFCW 626 1.54 0.55 510 0.40 0.34 19% 74% 37% Houston ERCT 518 0.87 0.28 440 0.09 0.11 15% 90% 61% Phoenix AZNM 523 0.20 0.59 459 0.07 0.30 12% 64% 50% S. Diego CAMX 295 0.09 0.15 259 0.03 0.08 12% 62% 46% Average 13% 78% 49%
Page 40
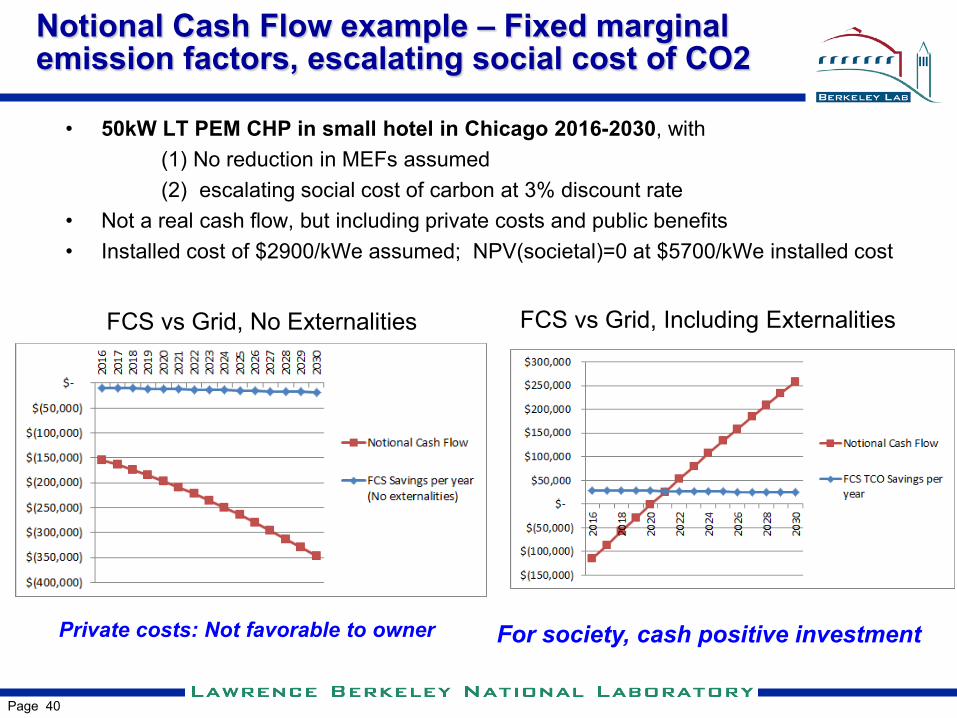
Notional Cash Flow example – Fixed marginal emission factors, escalating social cost of CO2
• 50kW LT PEM CHP in small hotel in Chicago 2016-2030, with (1) No reduction in MEFs assumed (2) escalating social cost of carbon at 3% discount rate • Not a real cash flow, but including private costs and public benefits • Installed cost of $2900/kWe assumed; NPV(societal)=0 at $5700/kWe installed cost
FCS vs Grid, No Externalities FCS vs Grid, Including Externalities
Private costs: Not favorable to owner For society, cash positive investment
Page 41
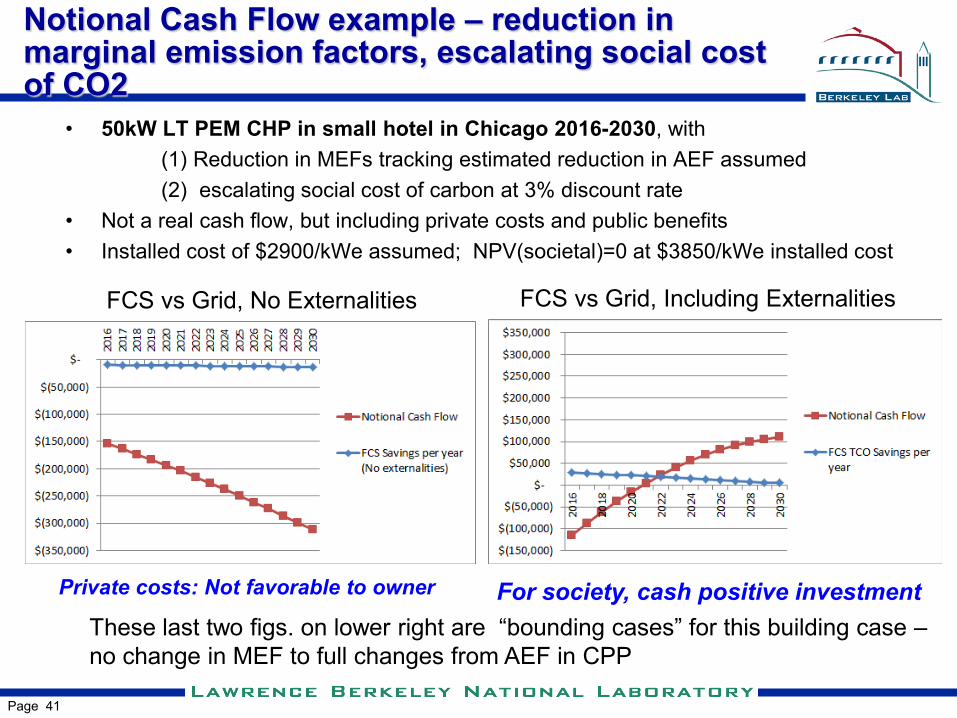
• 50kW LT PEM CHP in small hotel in Chicago 2016-2030, with (1) Reduction in MEFs tracking estimated reduction in AEF assumed (2) escalating social cost of carbon at 3% discount rate • Not a real cash flow, but including private costs and public benefits • Installed cost of $2900/kWe assumed; NPV(societal)=0 at $3850/kWe installed cost
FCS vs Grid, No Externalities FCS vs Grid, Including Externalities
Private costs: Not favorable to owner For society, cash positive investment These last two figs. on lower right are “bounding cases” for this building case –
no change in MEF to full changes from AEF in CPP
Notional Cash Flow example – reduction in marginal emission factors, escalating social cost of CO2

Page 42
Conclusions
• Stack, system costs for PEM to $220/kW, $900/kW at hi-volume • Stack, system costs for SOFC to $170/kW, $600/kW at hi-volume • For CHP systems, BOP costs higher than stack costs for the
manufacturing assumptions here • Modeled price comparisons within range to PEM prices for Japan
micro-CHP and backup power, but SOFC harder to compare • Including externalities, FC CHP economic applicability identified for a
subset of commercial buildings in some regions of country with high carbon intensity electricity from grid
• Spatial dependency of externality benefits suggests regional incentives tied to grid electricity and heating fuel type may be appropriate

Page 43
LT PEM and SOFC Reports online
LT PEM Report (updated report to be posted soon): • https://eetd.lbl.gov/publications/a-total-cost-of-
ownership-model-for-l
SOFC Report: • http://energy.gov/sites/prod/files/2016/06/f32/fcto_
lbnl_total_cost_ownership_sofc_systems.pdf
Page 44
Acknowledgments
Funding and support of this work by the U.S. Department of Energy, Fuel Cells Technologies Office
is gratefully acknowledged.
Thanks also to:
Brian Borglum, Fuel Cell Energy; SolidPower, Mezzolombardo, Italy; Minh Nguyen, University of California, San Diego; Professor Massimo Santarelli, Polytechnic University of Turin, Italy; Professor Jack Brouwer, University of California, Irvine; Patricia Irving, InnovaTek; Jim W. Dennis, HED international, Inc.; Dixita Bhat, Bionics Scientific Technologies Pvt. Ltd.; Mathias Rachau, FuelCon AG; Alexey Peshkovsky, Industrial Sonomechanics, LLC; Martin De Moya, Haiku Tech, Inc.; Edward Stone, Manncorp; Charles H. Birks, Keith Company; Fabio Pagnotta, Aurel Automation S.p.A; Donald Wang, Ph.D., Inframat Advanced Materials; Nickle Shang, Qingdao Terio Corporation; Dick Wildman, Dowd and Guild Inc.; Chris Betz, CHEMPOINT Inc.; Matthew Dickerson, American Chemical Inc.; Christian Ames, Univar USA
Page 45
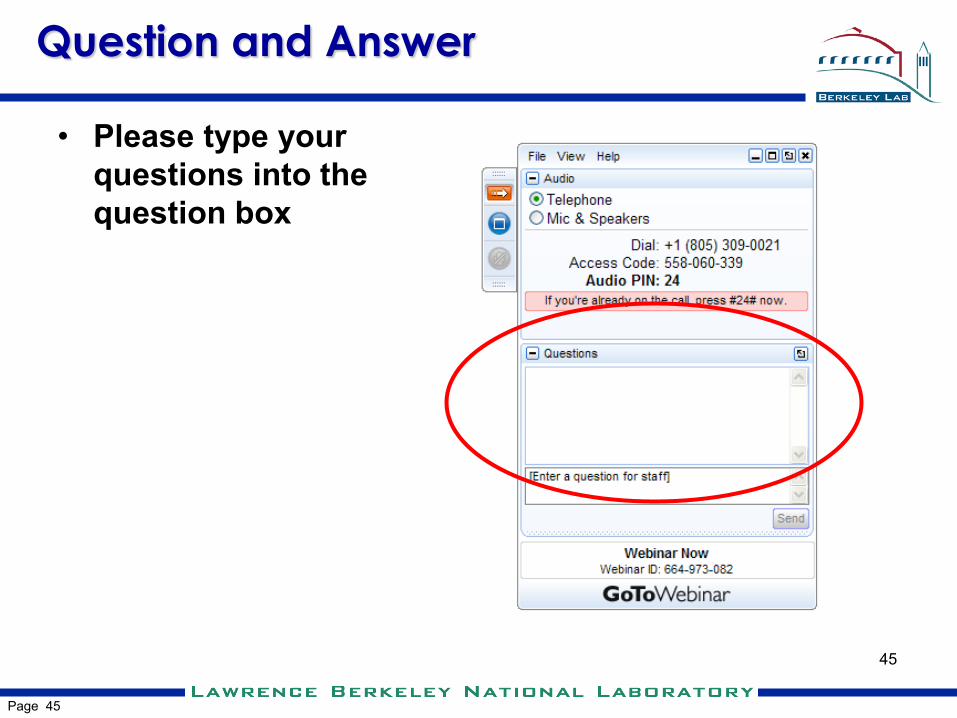
Question and Answer
• Please type your questions into the question box
45
Page 46
Thank you
hydrogenandfuelcells.energy.gov
Donna Ho [email protected]
Max Wei [email protected]

Total Cost of Ownership Modeling for Stationary Fuel Cell Systems
Department of Energy
Fuel Cell Technologies Office Webinar Washington, D.C.
December 13, 2016
Max Wei ([email protected]) Lawrence Berkeley National Laboratory

Page 48
Back-Up Slides

Page 49
Global DFMA Costing assumptions
Page 50
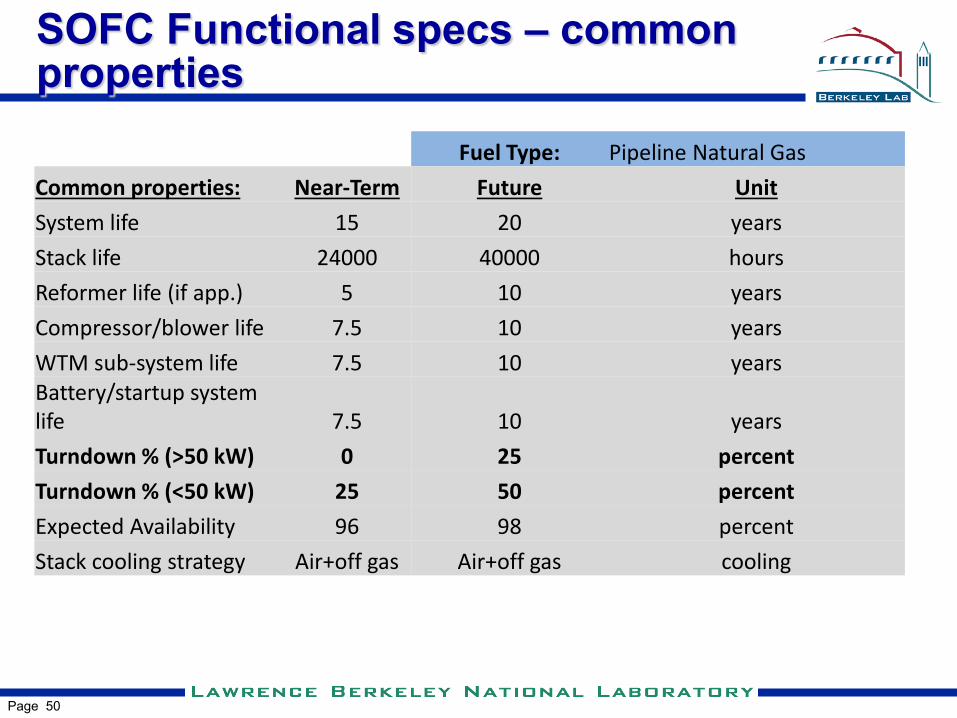
SOFC Functional specs – common properties Fuel Type: Pipeline Natural Gas Common properties: Near-Term Future Unit System life 15 20 years Stack life 24000 40000 hours Reformer life (if app.) 5 10 years Compressor/blower life 7.5 10 years WTM sub-system life 7.5 10 years Battery/startup system life 7.5 10 years Turndown % (>50 kW) 0 25 percent Turndown % (<50 kW) 25 50 percent Expected Availability 96 98 percent Stack cooling strategy Air+off gas Air+off gas cooling

SOFC Materials Prices: Updates from 2015 to lower prices at high volumes
Key updates from 2015: 8YSZ price 50% lower at high volume ($60/kg 2015 value to $29.80/kg) LSM powder price 60% lower price at high volume ($150/kg value to $60/kg)

Page 52
SOFC Binders, platicizers, pore formers and solvent prices
Page 53
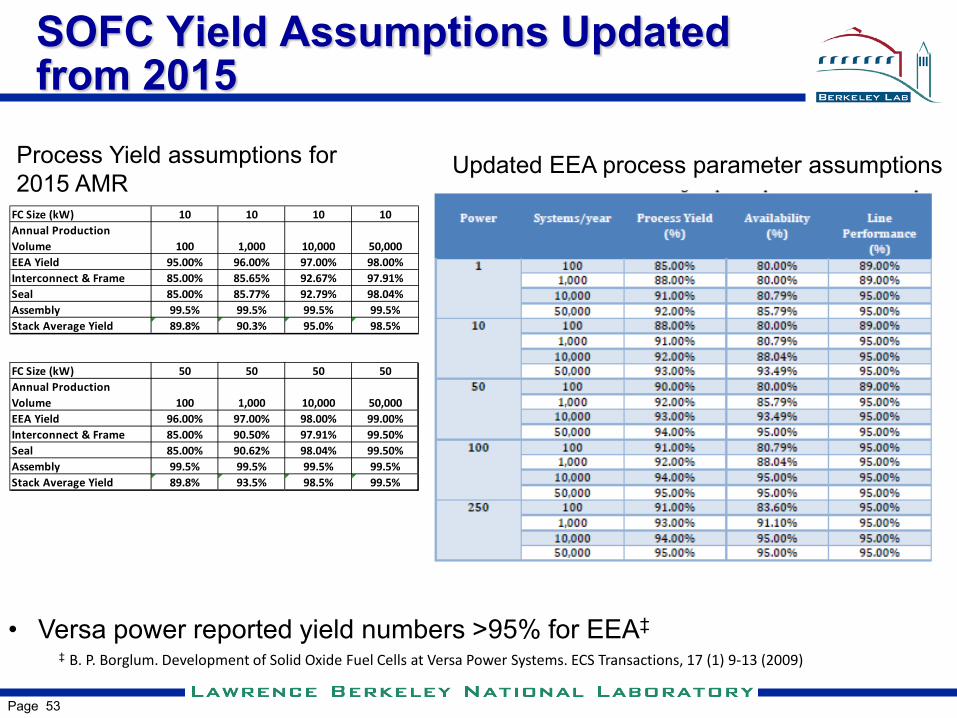
SOFC Yield Assumptions Updated from 2015
• Versa power reported yield numbers >95% for EEA‡
‡ B. P. Borglum. Development of Solid Oxide Fuel Cells at Versa Power Systems. ECS Transactions, 17 (1) 9-13 (2009)
FC Size (kW) 50 50 50 50Annual Production Volume 100 1,000 10,000 50,000EEA Yield 96.00% 97.00% 98.00% 99.00%Interconnect & Frame 85.00% 90.50% 97.91% 99.50%Seal 85.00% 90.62% 98.04% 99.50%Assembly 99.5% 99.5% 99.5% 99.5%Stack Average Yield 89.8% 93.5% 98.5% 99.5%
FC Size (kW) 10 10 10 10Annual Production Volume 100 1,000 10,000 50,000EEA Yield 95.00% 96.00% 97.00% 98.00%Interconnect & Frame 85.00% 85.65% 92.67% 97.91%Seal 85.00% 85.77% 92.79% 98.04%Assembly 99.5% 99.5% 99.5% 99.5%Stack Average Yield 89.8% 90.3% 95.0% 98.5%
Updated EEA process parameter assumptions Process Yield assumptions for 2015 AMR

Page 54
SOFC – LBNL 2015 vs SA 2012
• At higher volume and power levels ≥ 25kW, and annual volume ≥ 1000 units/yr, agreement within 20% and within ~10% at very high volume
• At lower volume LBNL is 2-3X more - due to higher capital costs

Page 55
Schematic Diagram of EEA Casting Line (SOFC)

Page 56
Air Pollution Emissions Experiments and Policy Analysis Model (APEEP and AP2)
Dose-Response:
Human Health Agriculture
Timber Visibility
Recreation Materials
Emissions Air Quality Model
National Ambient Concentrations
National Exposures
EconomicValuation
• Focus on ambient concentrations of PM2.5 and O3 (dominant health and environmental externalities)
• Model adopted by U.S. National Academy of Sciences for “Hidden Cost of Energy” study (2010)
External Damages from all Pollutants by County
Nicholas Muller
Page 57
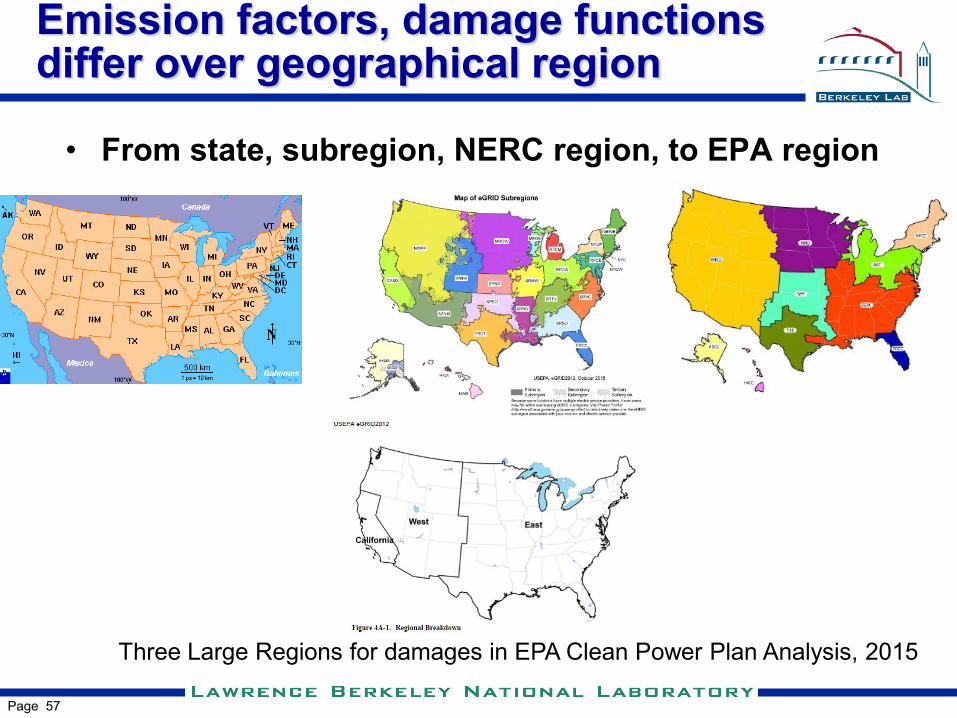
Emission factors, damage functions differ over geographical region
• From state, subregion, NERC region, to EPA region
Three Large Regions for damages in EPA Clean Power Plan Analysis, 2015

Page 58
Marginal benefits of abatement valuation for APEEP and AP2 (APEEP2) model
• 50kW small hotel CHP example shown (LT PEM)
AP2: Health, Environmental benefits are increased by a factor of 3-5X over previous APEEP estimates New marginal benefits of abatement are more commensurate with latest estimates from the EPA.

Page 59
eGRID emission rates vs NERC-level MEF: reasonable CO2 agreement but local differences in SO2, NOX
• For each pair- first bar is larger NERC region (Old value); 2nd bar eGRID sub-region (updated value)
• Reasonably matched except: SOX much lower in NYC; SOX much higher in Texas (ERCT)

DivRev05 page 60
Cost of Energy Service with FC CHP
Grid electricity Fuel Cell LCOE Heating Cost w/o and w/ FCS Cost
Grid electricity Fuel Cell LCOE Heating Cost cost w/ TCO Credits
Take heat savings as a credit to FC cost of electricity, and similarly with other TCO credits. Then compare Fuel Cell “Levelized Cost of Electricity With TCO credits” to Grid Electricity cost ($/kWh)

Page 61
• 50kW LT PEM CHP in small hotel in Minneapolis 2016-2030, with (1) No reduction in MEFs assumed (2) escalating social cost of carbon at 3% discount rate • Not a real cash flow, but including private costs and public benefits • Installed cost of $2900/kWe assumed; NPV(societal)=0 at $7200/kWe installed cost
FCS vs Grid, No Externalities FCS vs Grid, Including Externalities
Private costs: Not favorable to owner For society, cash positive investment
Notional Cash Flow example – Fixed marginal emission factors, escalating social cost of CO2

Page 62
• 50kW LT PEM CHP in small hotel in Minneapolis 2016-2030, with (1) Reduction in MEFs tracking estimated reduction in AEF assumed (2) escalating social cost of carbon at 3% discount rate • Not a real cash flow, but including private costs and public benefits • Installed cost of $2900/kWe assumed; NPV(societal)=0 at $5900/kWe installed cost
FCS vs Grid, No Externalities FCS vs Grid, Including Externalities
Private costs: Not favorable to owner For society, cash positive investment
Notional Cash Flow example – reduction in marginal emission factors, escalating social cost of CO2
These last two figs. on lower right are “bounding cases” for this building case – no change in MEF to full changes from AEF in CPP

Page 63
Social Cost of CO2, 2015-2050 (2014$ per tonne)
Disc. Rate=> 5% avg 3% avg 2.5% avg 3% (95th %-tile)
2015 $13 $41 $63 $116 2020 $14 $46 $70 $139 2025 $15 $51 $75 $151 2030 $17 $56 $81 $174 2035 $20 $61 $87 $186 2040 $23 $67 $94 $209 2045 $26 $72 $100 $220 2050 $29 $77 $106 $232
Social Cost of carbon, EPA Clean Power Plan
• Clean Power Plan Regulatory Impact Analysis, Oct. 2015 – we take 3% DR values for 2015, 2025, 2030