
FSU-CAPS Experiences with Large - NREL · FSU-CAPS Experiences with Large Scale Power...
23
FSU-CAPS Experiences with Large Scale Power Hardware-in-the-Loop (PHIL) Testing (PHIL) Testing Michael “Mischa” Steurer Leader Power Systems Research Group at FSU CAPS Leader Power Systems Research Group at FSU-CAPS Email: [email protected], phone: 850-644-1629 1st International Workshop on 1st International Workshop on Grid Simulator Testing of Wind Turbine Drivetrains June 13, 2013, Boulder, CO
Transcript of FSU-CAPS Experiences with Large - NREL · FSU-CAPS Experiences with Large Scale Power...
FSU-CAPS Experiences with Large Scale Power Hardware-in-the-Loop
(PHIL) Testing(PHIL) Testing Michael “Mischa” Steurer
Leader Power Systems Research Group at FSU CAPSLeader Power Systems Research Group at FSU-CAPS Email: [email protected], phone: 850-644-1629
1st International Workshop on1st International Workshop on Grid Simulator Testing of Wind Turbine
Drivetrains
June 13, 2013, Boulder, CO

FSU Center for Advanced Power Systems
• Established at Florida State University in 2000 under a grant from the Office of Naval Research
i d d h• Organized under FSU VP ffor Research
• Affiliated with FAMU‐FSU College of Engineering
•• Lead Member of ONR Electric Ship R&D Lead Member of ONR Electric Ship R&D Consortium
• Focusing on research and education related to application of new pp technologies to electric power systems
• ~$8 million annual research funding from ONR, DOE, Industry
• DOD cleared facility at Secret level
Research Groups • Electric Power Systems • Advanced Modeling and Simulation • Ad d C t l S t Advanced Control Systems • Power Electronics Integration and Controls • Thermal management • High Temperature Superconductivity • Electrical Insulation/Dielectrics
Staffing E l i 102 i l di Employing 102, including • 54 Full‐time staff of scientists, engineers and technicians, post‐doc.’s and supporting personnel
• 6 FAMU‐FSU College of Engineering faculty • 41 Students
Facility • 44,000 square feet, laboratories and offices, located in Innovation Park Tallahassee;located in Innovation Park, Tallahassee;
• Over $35 million specialized power and energy capabilities funded by ONR, DOE

Overview
• FSU-CAPS 5 MW PHIL test facility – 0 4 16 kV AC “amplifieramplifier”0…4.16 kV AC – 0…1.1 kV DC “amplifier”
• De-risking of PHIL experimentsexperiments – Controller HIL of “amplifier” – Protection elements in RT
simulatorsimulator • Past and future PHIL
experiments – Superconducting faultSuperconducting fault
current limiter – High speed generator FSU-CAPS High Bay PHIL Lab – 500 kW PV converter – Active rectifier for Naval
applications 3
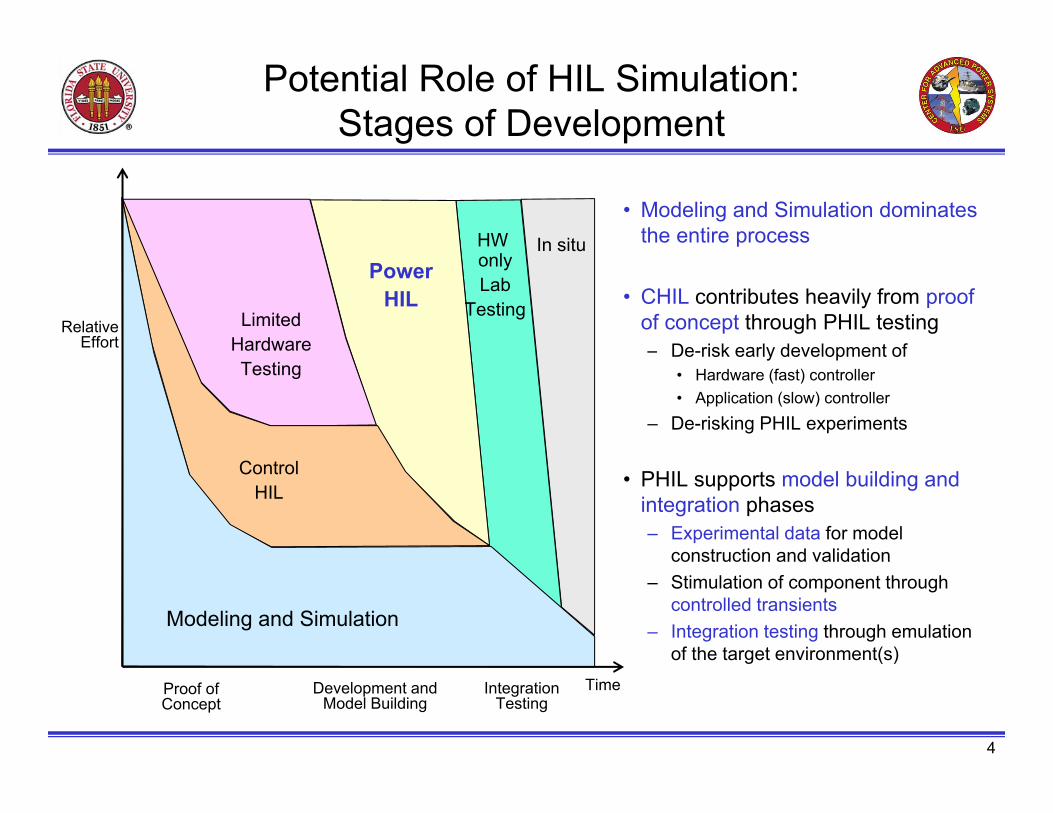
Potential Role of HIL Simulation: Stages of Development
HW In situ
Limited Hardware
Power HIL
only Lab
Testing
Testing
Control HIL
Modeling and Simulation
• Modeling and Simulation dominates the entire process
• CHIL contributes heavily from proof Relative of concept through PHIL testing
Effort – De-risk early development of risk early development ofDe • Hardware (fast) controller • Application (slow) controller
– De-risking PHIL experiments
• PHIL supports model building and integration phases – Experimental data for model
construction and validation construction and validation – Stimulation of component through
controlled transients – Integration testing through emulation
of the targget environment((s))
Proof of Development and Integration Time Concept Model Building Testing
4
t t t
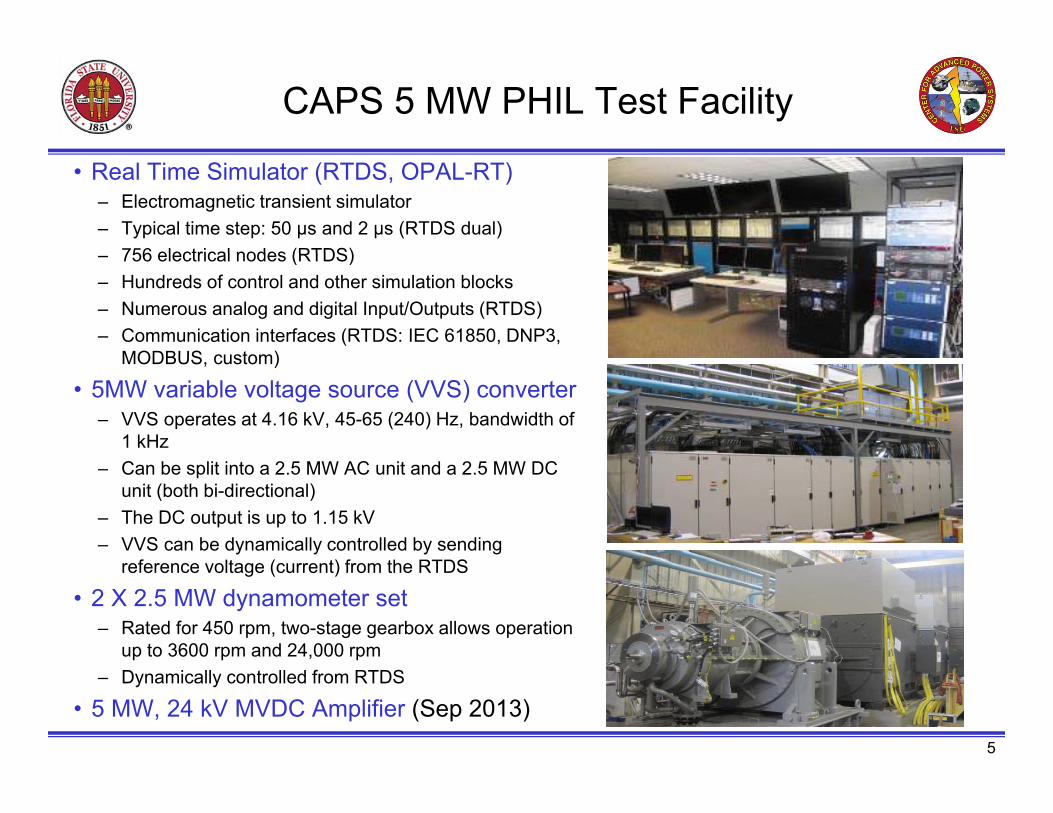
CAPS 5 MW PHIL Test Facility
• Real Time Simulator (RTDS, OPAL-RT) – Electromagnetic transient simulator – Typical time step: 50 µs and 2 µs (RTDS dual) – 756 electrical nodes (RTDS) 756 electrical nodes (RTDS) – Hundreds of control and other simulation blocks – Numerous analog and digital Input/Outputs (RTDS) – Communication interfaces (RTDS: IEC 61850, DNP3,
MODBUS custom)MODBUS, custom)
• 5MW variable voltage source (VVS) converter – VVS operates at 4.16 kV, 45-65 (240) Hz, bandwidth of
1 kHz – Can be split into a 2.5 MW AC unit and a 2.5 MW DC
unit (both bi-directional) – The DC output is up to 1.15 kV – VVS can be dynamically controlled by sending
f l ( ) f h RTDS reference voltage (current) from the RTDS
• 2 X 2.5 MW dynamometer set – Rated for 450 rpm, two-stage gearbox allows operation
up to 3600 rpm and 24,000 rpm – Dynamically controlled from RTDS
• 5 MW, 24 kV MVDC Amplifier (Sep 2013) 5
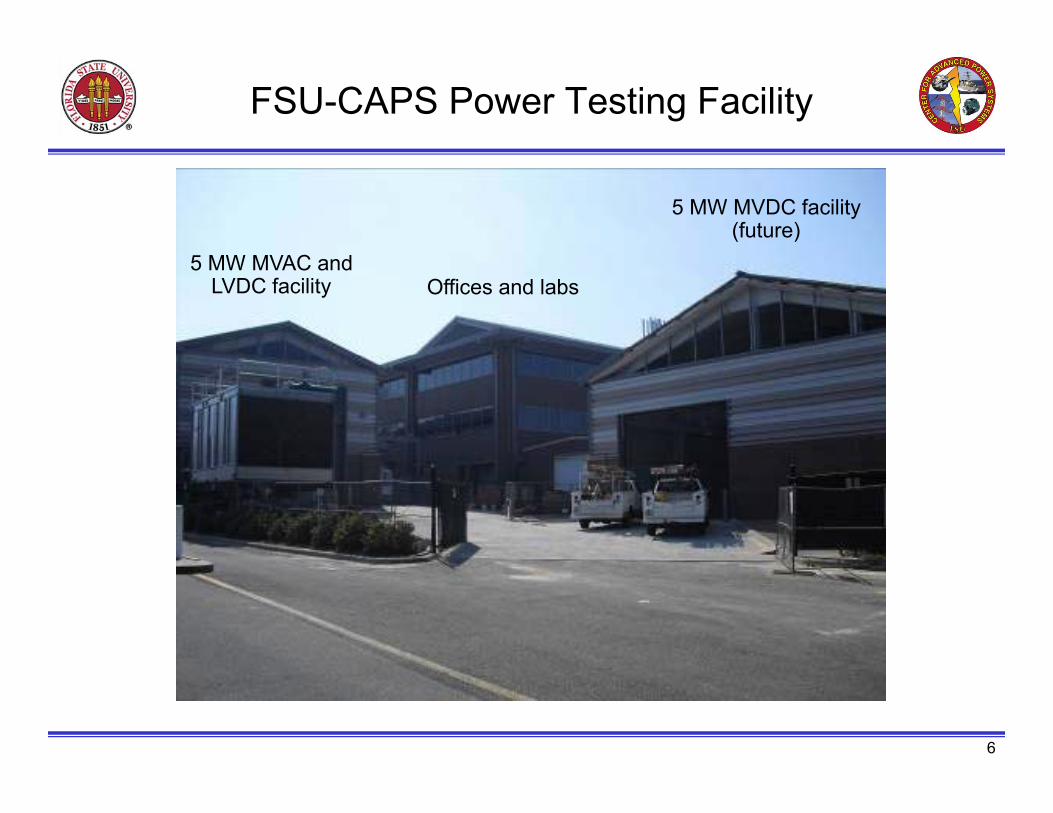
FSU-CAPS Power Testing Facility
5 MW MVDC facility (future)
Offices and labs 5 MW MVAC and
LVDC facility
6
4.16 kV Exp. Bus (Port)
Future
S4 S5
SP2 SP4 SP
~ ~
=
~
=
=
~
=
=
~
=
~
==
=
~
=
=
~
=
~~ ~~
5 MWMax
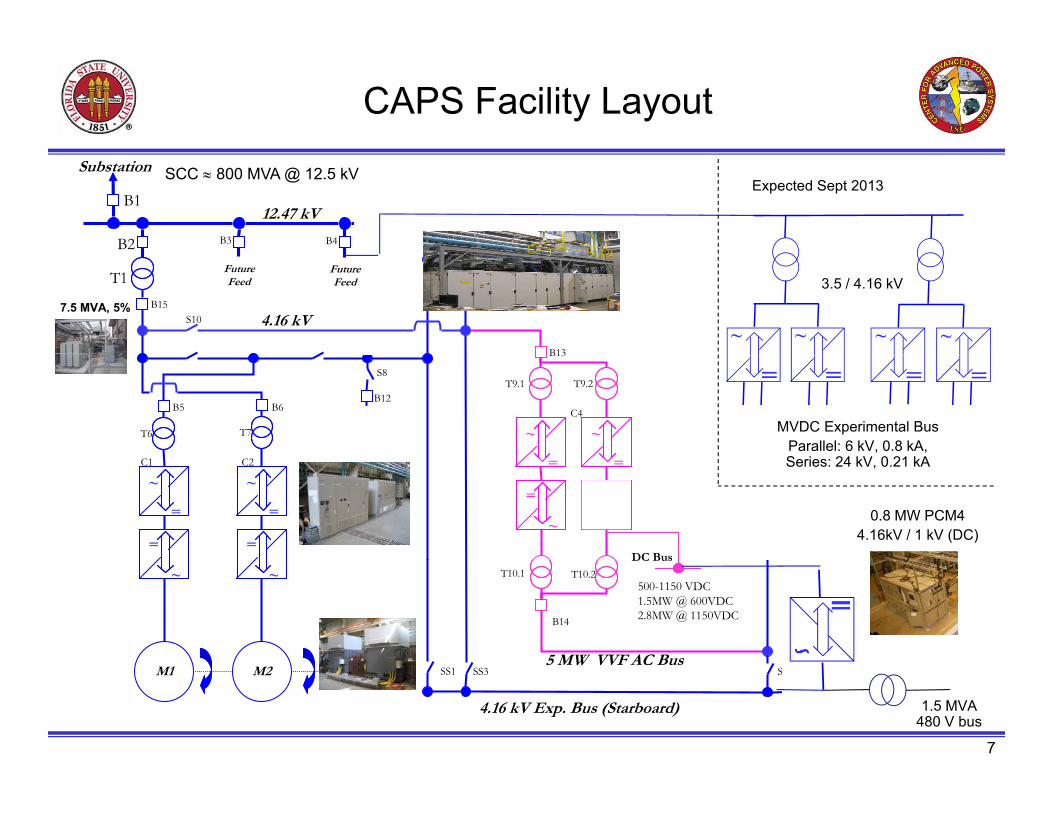
CAPS Facility Layout Substation
B1
B2
12.47 kV
B3 B4
SCC 800 MVA @ 12.5 kV Expected Sept 2013
T1
4.16 kV
Future Feed
p ( ) Future Feed
S10 B15
B13
7.5 MVA, 5%
~~ ~ ~
3.5 / 4.16 kV
T7T6
B5 B6
S8
B12
~ C4
T9.1
~
B13
T9.2 == = =
MVDC Experimental Bus Parallel: 6 kV, 0.8 kA, S i 24 kV 0 21 kA
=
~
=
=
~
=
C1 C2
5 MW M2M1
~~
Series: 24 kV, 0.21 kA=
~
=
=
~
=
DC B u s
B14
DC Bu s
500-1150 VDC 1.5MW @ 600VDC 2.8MW @ 1150VDC
0.8 MW PCM4 4.16kV / 1 kV (DC)
T10.1 T10.2
5 MW VVF AC Bus 5 MW VVF AC Bus SS1 SS3 S
1.5 MVA 4.16 kV Exp. Bus (Starboard) 480 V bus
7

5 MW VVS AC – Main Circuit Diagram 4 16 k 60 Hz 700 A T9.1
B13
T9.2 4.16 k, 60 Hz, 700 A
=
~
=
~
~
=
~
=
C4
=
~
=
~
~
=
~
=
DC Bus
fS =
approx. 400 V T10.1 500-1150 VD 1.5MW @ 600
T10.2
fS 2 kHz
fS = “2 x 5”
kHz
Design drawing
0…400 V
8
Design drawing by ABB
0…4.16 / 8.2 kV AC, 850 / 425 A40…65 (400) Hz
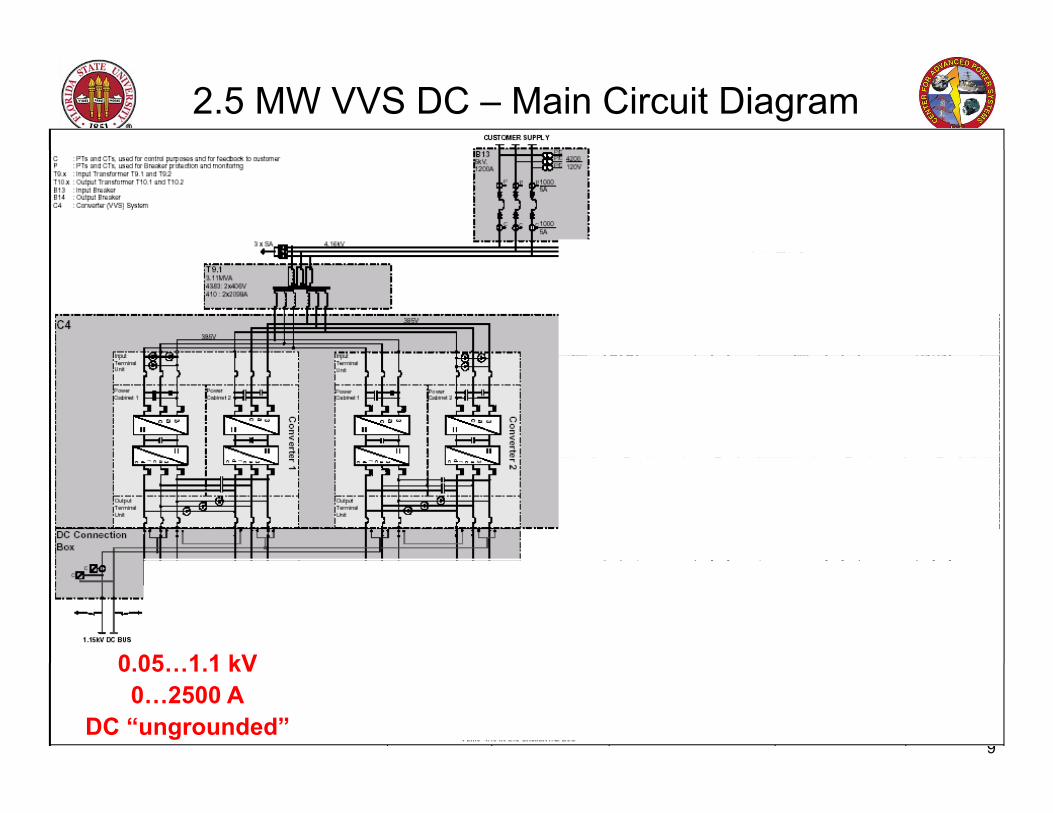
2.5 MW VVS DC – Main Circuit Diagram
0 05 1 1 kV
9
0.05…1.1 kV 0…2500 A
DC “ungrounded”
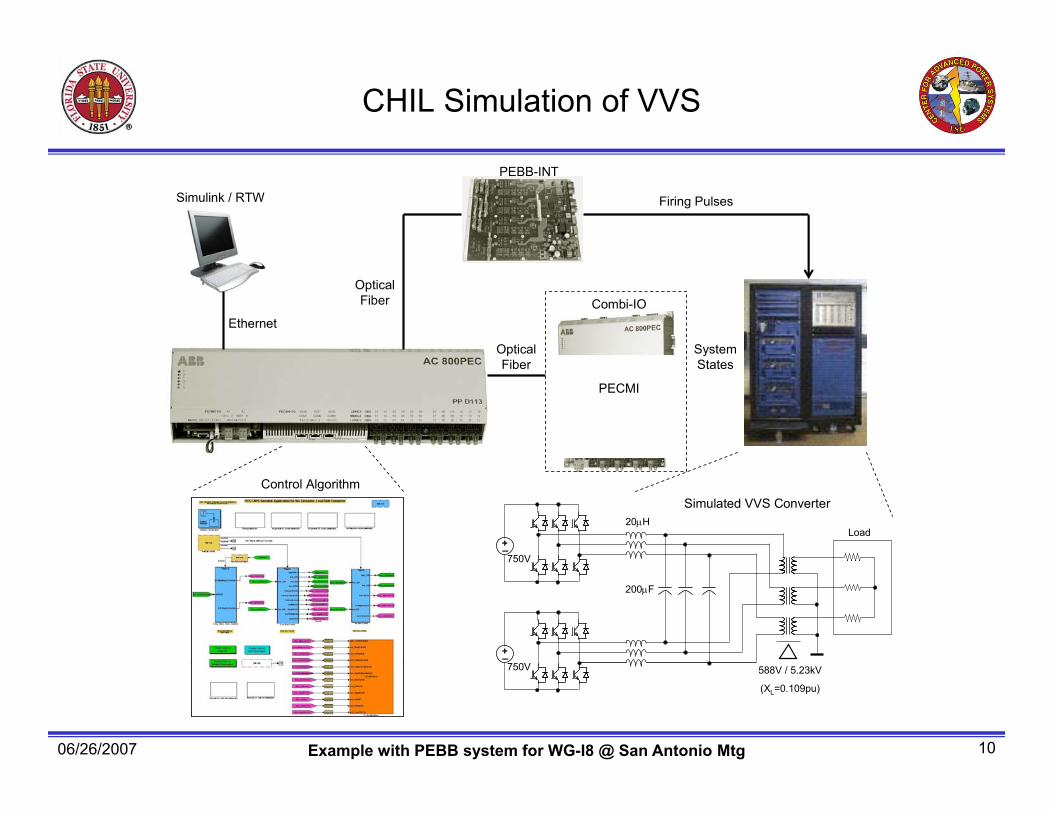
CHIL Simulation of VVS
PEBB-INT
Simulink / RTW Firing Pulses
Ethernet
Optical Fiber
Optical System
Combi-IO
p Fiber
y States
PECMI
+_+ _
20H
750V
Load
Control Algorithm Simulated VVS Converter
+_+ _
200F
750V
750V750V 588V / 5.23kV
(XL=0.109pu)
Example with PEBB system for WG-I8 @ San Antonio Mtg 06/26/2007 10

a e s a d actuato s
Challenges: Accuracy, Stability, Protection
Flexible Protection of experiment
Interface Component
Rest of System
AmplifierDevice Under Test
PHIL Interface Controls
Amplifier Controls
DUT Controller
Real Time Simulator
PHIL Interface Simulator
• Interfaces – Time delays
– Input/Output – Controllers
– Limited bandwidth of ampplifiers and actuators
• Real-time simulation – Fixed time-step with minimum
achievable time-step size
– Limitations on the size and complexity of simulated systems
– Protection of experiment
• Amplifiers and actuators Amplifiers and actuators • Maximum power, torque, speed, etc. • Assessment of the impact of HIL interfaces
A f d l d f di • Accuracy of models used for surroundings – Common issue – establishing confidence in the models
4/2013 11
=
sim
)Virtual test circuit scircuit
eren
ce (I
• Possible dif• Possible diff • Flexible • Several
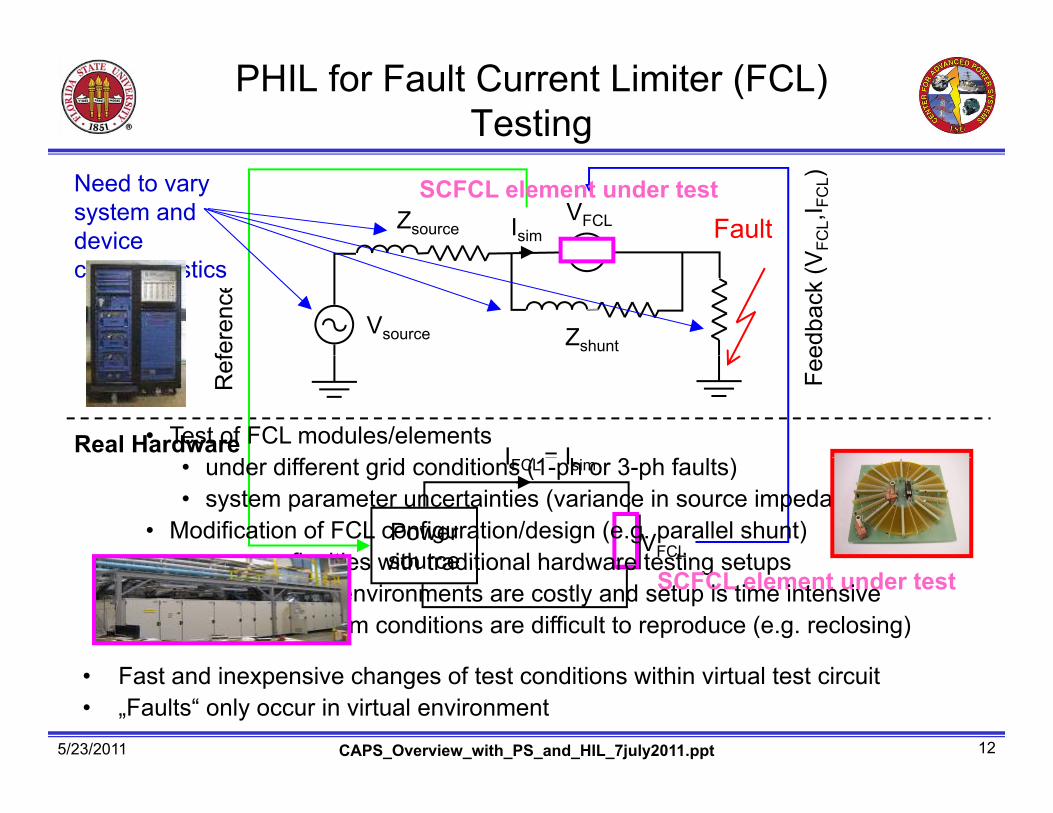
PHIL for Fault Current Limiter (FCL) Testing
V FC
L,I FC
L)
Zsource VFCLIsim Fault
SCFCL element under test
edba
ck (V
f Zshunt Vsource
Fee
IReal Hardware
Ref
= I• Test of FCL modules/elements
d diff id di i (1 h 3 h f l )
Need to vary system and device characteristics
• und
Powersource
IFCLer Isim
ficulties with traditional hardware testing setupssourceiculties with traditional hardware testing setups
different grid conditions (1-ph or 3-ph faults) • system parameter uncertainties (variance in source impedance)
• Modification of FCL configuration/design (e.g. parallel shunt) VFCL
SCFCL element under test test environments are costly and setup is time intensive system conditions are difficult to reproduce (e.g. reclosing)
• Fast and inexpensive changes of test conditions within virtual test circuit • „Faults“ only occur in virtual environment
5/23/2011 12CAPS_Overview_with_PS_and_HIL_7july2011.ppt

Results from PHIL Experiment with FCL
Vsource=1 kV, Ip=15 kA Ip,lim = 0.7 kA
FCL
Cryostat (77K)
Vp,lim = 1.8 kV
FCL voltage (inverted)
C. Schacherer, J. Langston, M. Steurer, M. Noe, “Power Hardware-in-the-Loop Testing of a YBCO Coated Conductor Fault Current Limiting Module”, IEEE Trans. on Applied Superconductivity, Volume 19, Issue 3, Part 2, June 2009 Page(s):1801 - 1805
5/23/2011 13CAPS_Overview_with_PS_and_HIL_7july2011.ppt
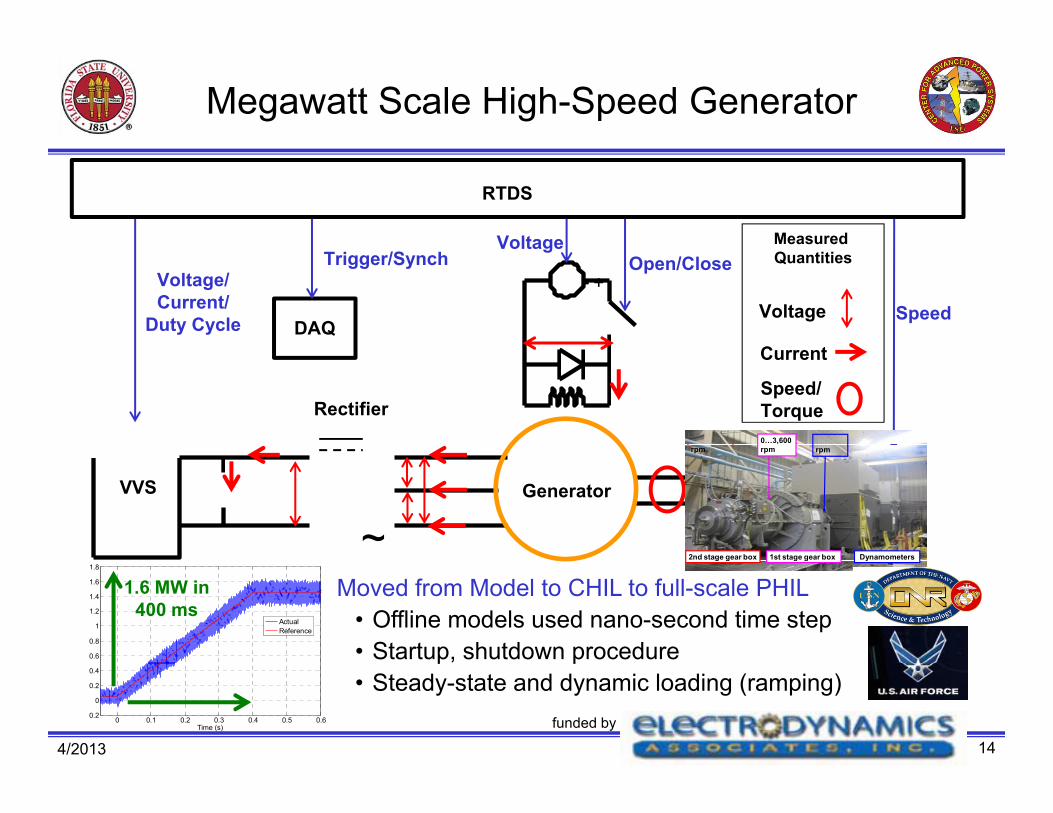
Gearbox Dyno
Megawatt Scale High-Speed Generator
RTDS
VoltageT i /S h
Measured Q titi
+-
DAQ
Open/CloseTrigger/Synch Voltage/ Current/
Duty Cycle SpeedVoltage
Current
Quantities
Rectifier
Current
Speed/ Torque
0…24,000 0…4500…3,600 rpm rpm rpm
VVS Generator
~ 2nd stage gear box Dynamometers 1st stage gear box
1.8
1.6 Moved from Model to CHIL to full-scale PHIL 1.4
1.2
1 • Offline models used nano-second time step 0.8
0.6 • Startupp, shutdown pprocedure 0.4
0.2 • Steady-state and dynamic loading (ramping) 0
0 0.1 0.2 0.3 0.4 0.5 0.6
Actual Reference
1.6 MW in 400 ms
-0.2 funded byTime (s)
4/2013 14
yg gg g
tttt
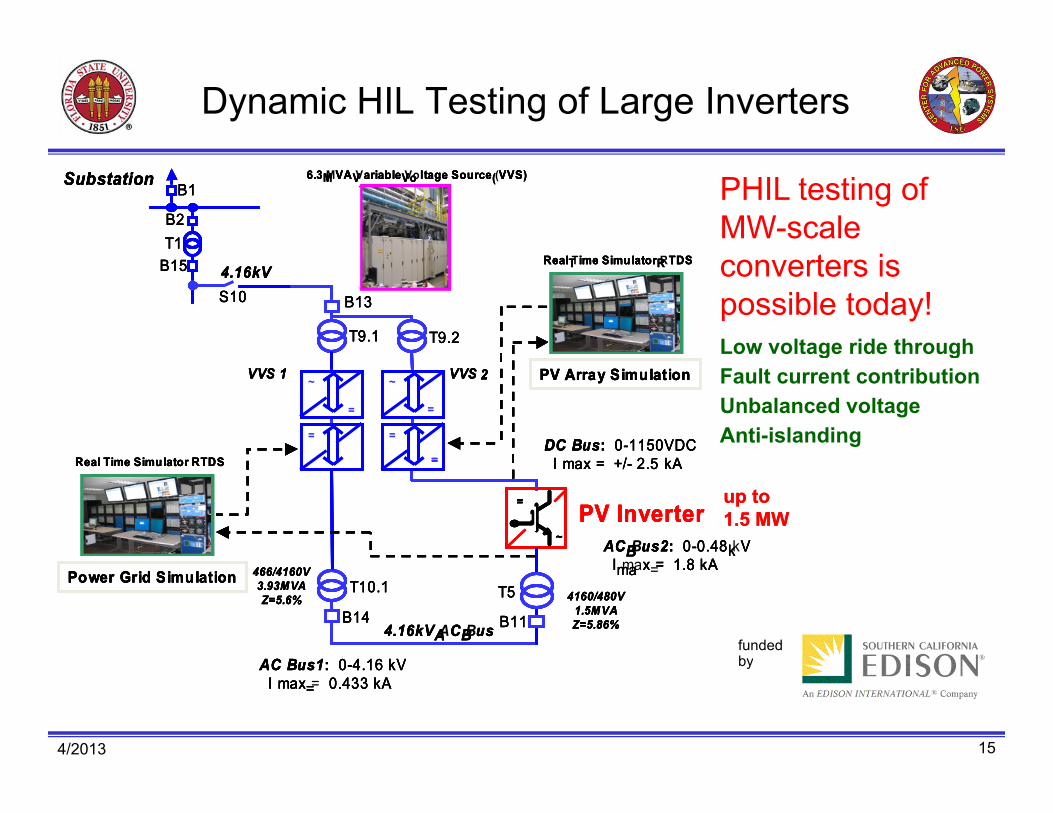
Dynamic HIL Testing of Large Inverters
6666....3333 MMMM VVVVAAAA VVVV aaaarrrriiiiaaaabbbblllleeee VoVoVoVo llllttttaaaaggggeeee SoSoSoSouuuurrrrcccceeee (((( VVS)VVS)VVS)VVS)SuSuSuSubbbbssssttttaaaattttiiiioooonnnn B1B1B1B1 PHIL testing of
B2B2B2B2 MW-scaleT1T1T1T1
RRRReeeealalalal TTTT iiiime Sme Sme Sme Siiiimumumumullllaaaattttoooorrrr RRRR TTTTDDDDSSSSB1B1B1B15555 converters is4.4.4.4.16k16k16k16kVVVV S10S10S10S10 possible today!
Low voltagge ride througgh VVVVVVVVS 1S 1S 1S 1 Fault current contribution
Unbalanced voltage Anti-islanding
RRRR llll TTTTiiii SSSSiiii llll RTRTRTRTDSDSDSDSRRRReaeaeaeallll TiTiTiTimemememe SiSiSiSimumumumullllaaaattttorororor RTRTRTRTDSDSDSDS
up toup to 1.5 MW1.5 MW
Power Grid SimulationPower Grid SimulationPower Grid SimulationPower Grid Simulation 1111....8888 kAkAkAkA464646466/6/6/6/4141414160V60V60V60V
3.3.3.3.93939393MMMMVVVVAAAA ZZZZ====5.5.5.5.6%6%6%6%
funded by
T9.1
B13
T9.2T9.1
B13
T9.2T9.1
B13
T9.2T9.1
B13
T9.2
DC Bus: 0-1150VDCI / 2 5 kA
=
~
=
=
~
=
PV Array SimulationVVS 2
=DC Bus: 0-1150VDC
I / 2 5 kA
=
~
=
=
~
=
PV Array SimulationVVS 2
=DC Bus: 0-1150VDC
I / 2 5 kA
=
~
=
=
~
=
PV Array SimulationVVS 2
=DC Bus: 0-1150VDC
I / 2 5 kA
=
~
=
=
~
=
PV A
I max = +/- 2.5 kA+++
rray SimulationVVS 2
= ~~~~
==== PV IPV IPV IPV Innnnvvvveeeerrrrtttteeeerrrr
====
~~~~ ACACACAC BBBB uuuussss2222:::: 0-0-0-0-0.0.0.0.44448888 kkkk VVVV IIII 1 8 k1 8 k1 8 k1 8 kA
I max = /- 2.5 kA
A
I max = /- 2.5 kA
A
I max = /- 2.5 kA
A
4.4.4.4.16161616kkkkVVVV AAAA CCCC BBBB uuuussss
TTTT10.10.10.10.1111
B1B1B1B14444 4141414160/60/60/60/484848480V0V0V0V
1.1.1.1.5M5M5M5MVVVVAAAA ZZZZ====5.5.5.5.86868686%
T5
B1B1B1B11111
IIII mamamama xxxx =
%
T5
=
%
T5
=
%
T5 =
by ACACACAC BBBBACACACAC BuBuBuBussssuuuu 1111ssss1111:::: 0000:::: 4 14 14 14 16 k6 k6 k6 kVVVV0000----4444....16161616 kVkVkVkV I mI mI mI maaaaxxxx ==== 0000....444433333333 kkkkAAAA
4/2013 15
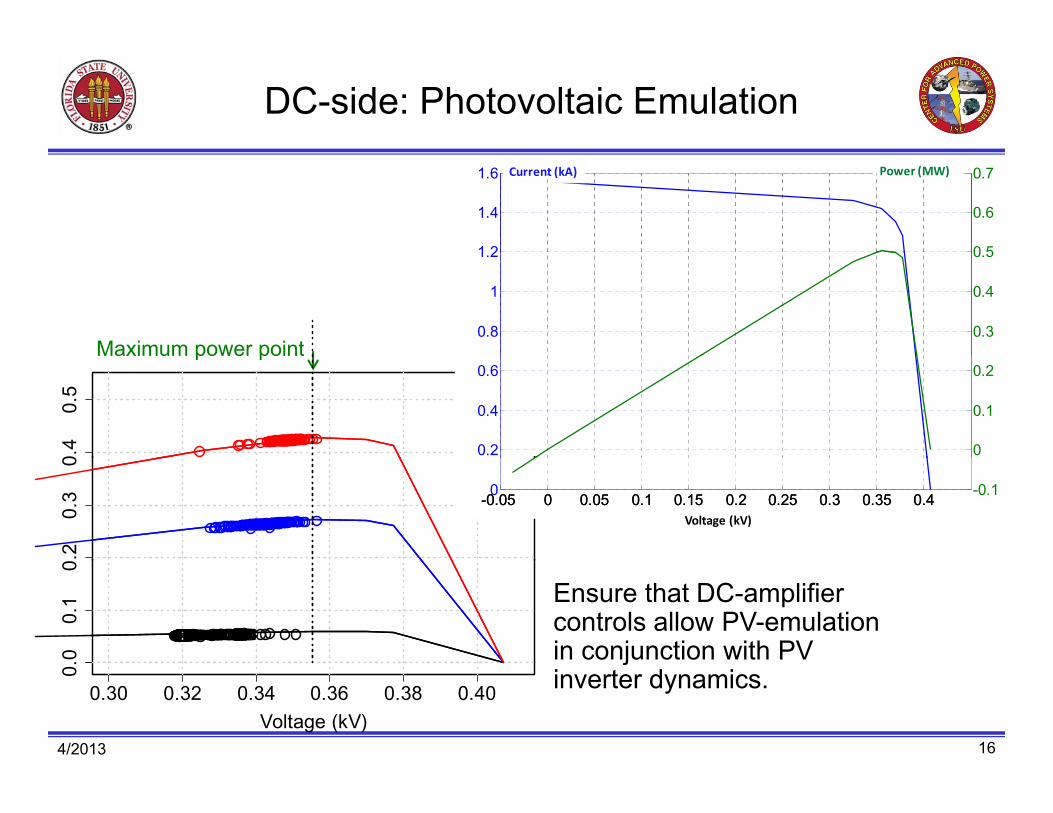
DC-side: Photovoltaic Emulation 0..
00.
1 0.
2 0.
3 00.
4 0.
5
1.6 Current (kA) Power (MW) 0.7
1.4 0.6
1 21.2 0 50.5
1 0.4
Maximum power pointMaximum power point 0.8
0.6
0.3
0.2
0.4 0.1
0.2 0
0-0-0..0055 00 0.0.0505 0.0.11 0.0.1515 0.0.22
Voltage (kV)
0.0.2525 0.0.33 0.0.3535 0.0.44 -0.1
0.30 0.32 0.34 0.36 Voltage (kV)
0.38 0.40
Ensure that DC-amplifiercontrols allow PV-emulation in conjunction with PVj inverter dynamics.
4/2013 16

Full PHIL Testing of 500 kW PV Inverter
funded• Collaboration between Quanta Technology, Satcon, SCE and FSU gy CAPS sponsored by NREL.
• Test and evaluate the capability of inverter implementing advanced functions (PF control, volt/Var control)
• Simulate PV array and utility grid
• Quantifyy in a laborator yy settingg the mitigation of high-penetration PV impacts using advanced inverter functions.
• A possible operational issue with VAr fold-back control was identified.
• Constant PF control worked flawlessly. 500 kW PV converter in
FSU CAPS l bFSU-CAPS lab
by
4/2013 17

-10
0.005
Challenges: Grounding can be tricky…
• PHIL testing of a 500 kW solar inverter • RTDS + VVS simulates solar ungrounded panels • Inverter grounds the DC rail through a 10 A fuse Inverter grounds the DC rail through a 10 A fuse • Fuse blew when VVS was energized (w/o DUT energized)
Transformer DUT (Inverter)
10 A 0.03
Current Magnitude (kA)
0.01
0.015
0.02
0.025
55 kHz Component
0 1 2 3 4 5 6 x 10
4Frequency (Hz)
34 A Current at 55 kHz (1.4% of 2500 A)
4/2013 18
PIPI Controller+
‐Σ
Id, IqVmag
T5
Trans-former
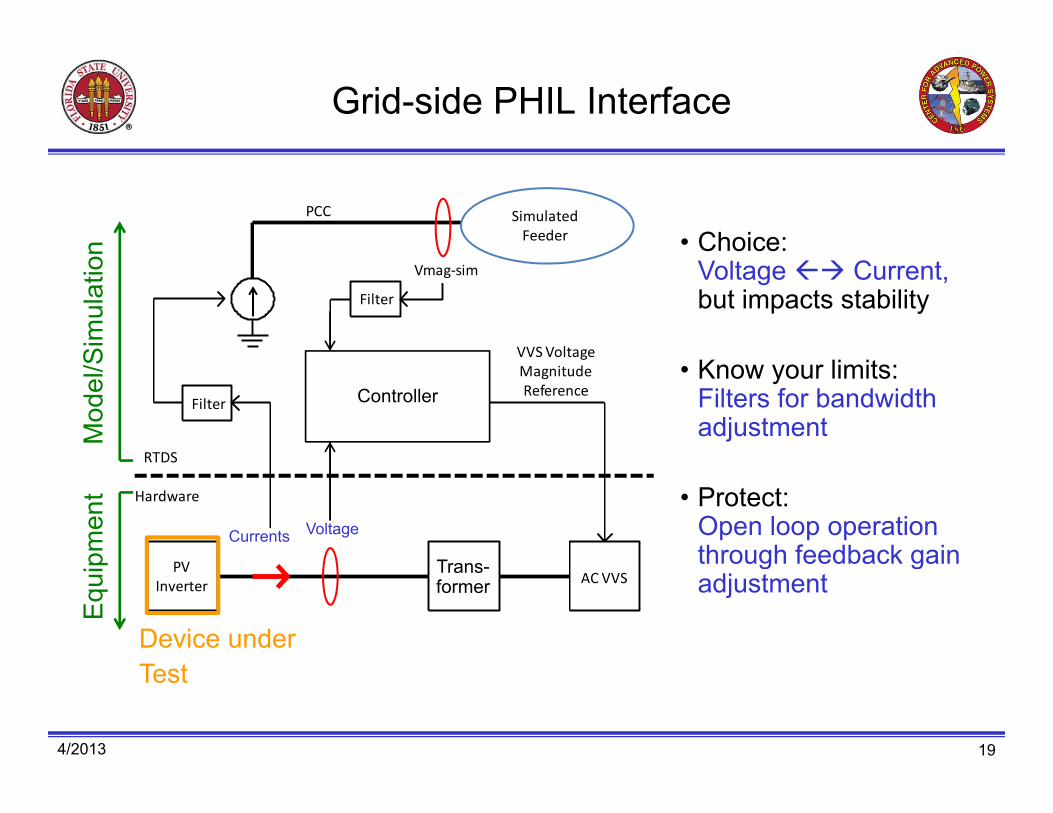
Grid-side PHIL Interface
PCC Simulated Feeder n
Vmag‐sim
VVS Voltage
Filter
Sim
ulat
ion
VVS Voltage Magnitude Reference
RTDS
Filter
Mod
el/S
Controller
RTDS
Hardware
Currents Voltage
pmen
t
TPV Inverter AC VVS
Device under
Equ
ip Trans-former
Test
• Choice: Voltage Current, but impacts stability
• Know your limits:Filters for bandwidth adjustment
• Protect: Open loop operation through feedback gain through feedback gain adjustment
4/2013 19
I mI mI mI m
4 5Time (min)
4T5 4T5 4T5 4T5
V
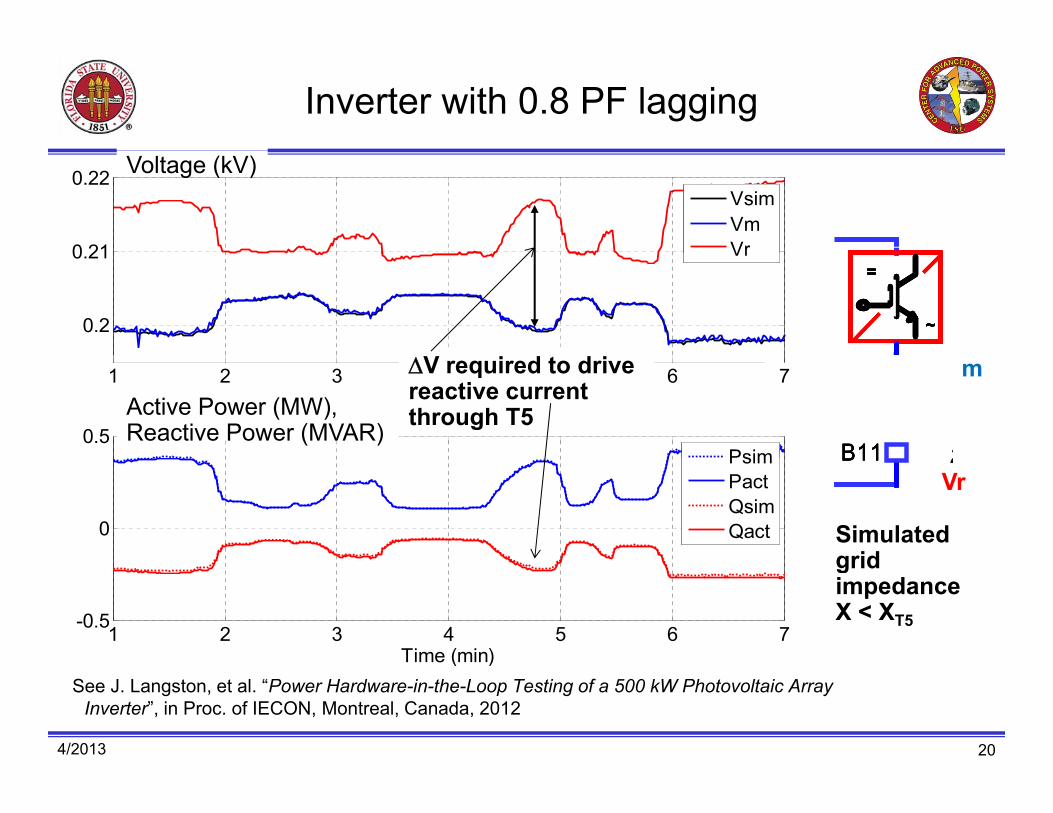
Inverter with 0.8 PF lagging
0 21
0.22 Vsim Vm Vr
Voltage (kV)
0.2
0.21 Vr =
~
=
~
=
~
=
~
V required to drive m
1 B1 Z
1 2 3 6 7reactive current
1 2 3 4 5 6 7 Time ((min))
See J. Langston, et al. “Power Hardware-in-the-Loop Testing of a 500 kW Photovoltaic Array Inverter”, in Proc. of IECON, Montreal, Canada, 2012
0.5 Psim
Active Power (MW),Reactive Power (MVAR)
ZB11 ZB11 ZB11through T5
0
Psim Pact Qsim Qact
Vr ZB11 ZB11 ZB11 ZB11
Simulated grid
-0.5
grid impedanceX < XT5
4/2013 20
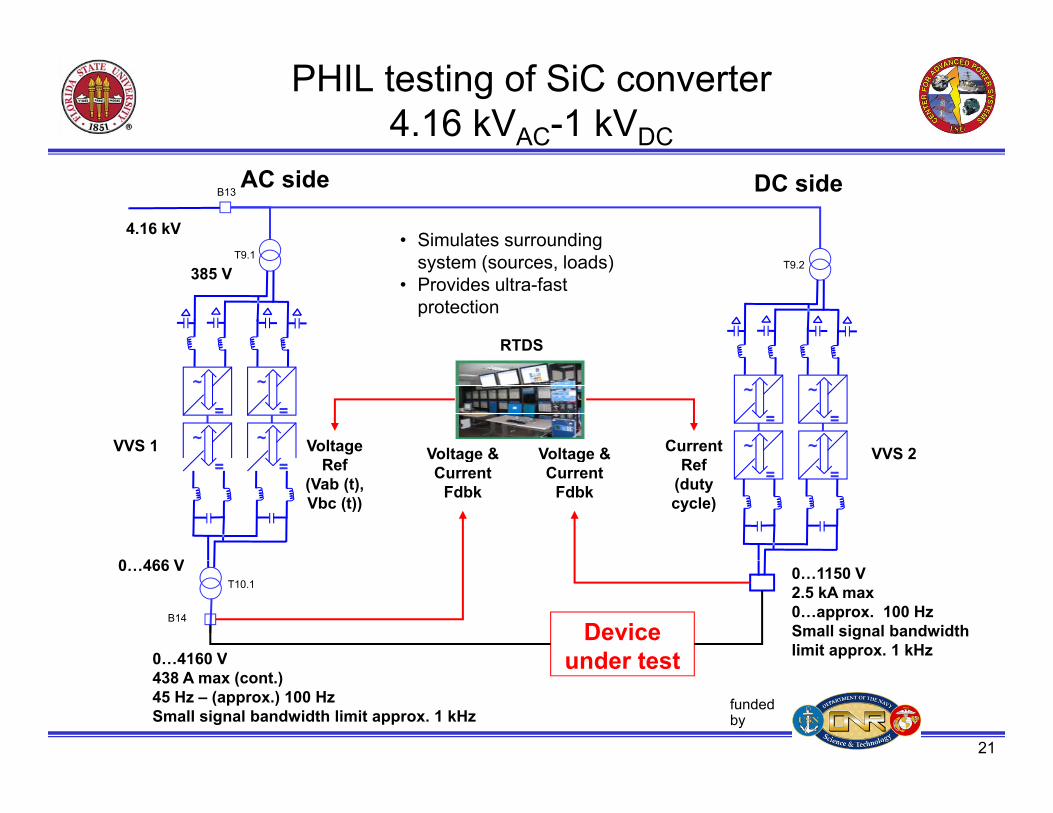
PHIL testing of SiC converter 4.16 kVAC-1 kVDC
AC side DC sideB13
4.16 kV T9 1
VVS 1 VVS 2 VVS 2
0 466 V 0…466 V
0…approx. 100 Hz Small signal bandwidth limit approx. 1 kHz 0…4160 V
438 A max (cont.)
• Simulates surrounding T9.1
T9.2385 V
RTDS
system (sources, loads) • Provides ultra-fast
protection
=
~
~ =
~
~ =
~
Voltage Current ~ =
~
~ Voltage & Voltage & Voltage & = = Ref Ref = =Current
Fdbk Current
(Vab (t), Vbc (t))
(duty
Voltage &
Fdbk cycle)
B14
T10.1
0…4160 V
0…1150 V 2.5 kA max
Device under test under test
45 Hz – (approx.) 100 Hz fundedSmall signal bandwidth limit approx. 1 kHz by
21
–
Concluding Remarks
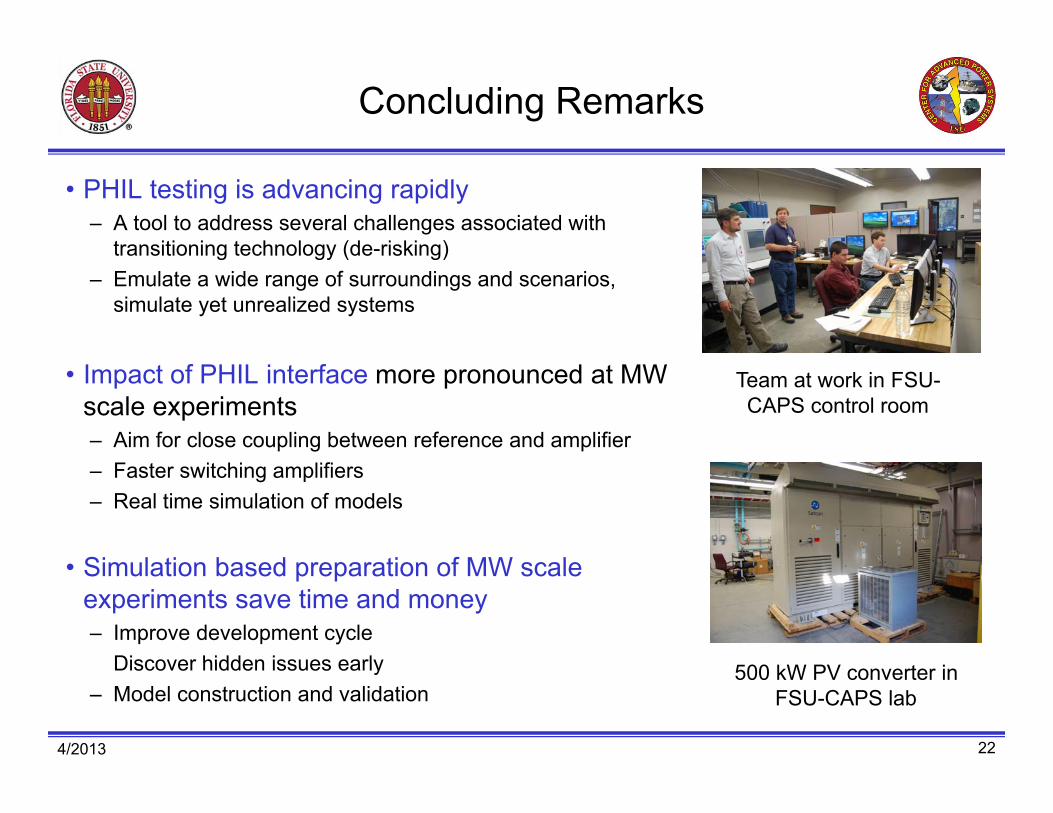
• PHIL testing is advancing rapidly – A tool to address several challenges associated with
transitioning technology (de-risking)transitioning technology (de risking) – Emulate a wide range of surroundings and scenarios,
simulate yet unrealized systems
• Impact of PHIL interface more pronounced at MW Team at work in FSU-scale experiments CAPS control room – Aim for close coupling between reference and amplifier – Faster switching amplifiers – Real time simulation of models
Si l b ti f MW l• Simulati tion basedd preparation of MW scale experiments save time and money – Improve development cycle
Discover hidden issues early Discover hidden issues early 500 kW PV converter in – Model construction and validation FSU-CAPS lab
4/2013 22