FSAE Tire Test Consortium -- ROUND 6 - Milliken Research ... · PDF fileFormula SAE Tire Test...
17
Formula SAE Tire Test Consortium – Round 6 1 FSAE Tire Test Consortium -- ROUND 6 From: Edward M. Kasprzak, FSAE TTC Co-Director To: FSAE TTC members Date: 11 August 2015 This document describes the tests, data and files provided for Round 6 by the FSAE Tire Test Consortium. Please read this document carefully before using the FSAE TTC data. Contents: 1. Introduction 2. Acknowledgements 3. Overview -- Round 6 4. Run Guide & Summary Tables 5. Data Files & Channels 6. Transient Test Plan 7. Cornering Test Plan 8. Drive/Brake Test Plan 9. Test Comments 10. Tire Models 11. Suggestions for Analysis 12. Questions/Comments 1. INTRODUCTION Round 6 of FSAE TTC testing was conducted in May 2015 at the Calspan Tire Research Facility. All data is available to FSAE TTC members via the private server at: http://sae.wsu.edu/ttc/ . The public, introductory FSAE TTC website can be found at www.millikenresearch.com/fsaettc.html . TTC members are reminded of the terms of their membership. The participant agreement (data license) is included as the last page of this document. The TTC private forum, http://sae.wsu.edu/ttc/ , exists for students to openly discuss the data without violating the terms of TTC membership. All TTC members are strongly encouraged to display the Calspan logo on their vehicle—several options are available in the “fromCalspan.zip” download. Calspan has given the TTC a considerable price break, and you should consider them one of your sponsors. Note: While two of the three Directors are affiliated with Milliken Research Associates, Inc. and the public webpage is hosted at an MRA web address, the FSAE TTC is not part of Milliken Research Associates, Inc.
Transcript of FSAE Tire Test Consortium -- ROUND 6 - Milliken Research ... · PDF fileFormula SAE Tire Test...

Formula SAE Tire Test Consortium – Round 6 1
FSAE Tire Test Consortium -- ROUND 6 From: Edward M. Kasprzak, FSAE TTC Co-Director To: FSAE TTC members Date: 11 August 2015 This document describes the tests, data and files provided for Round 6 by the FSAE Tire Test Consortium. Please read this document carefully before using the FSAE TTC data. Contents:
1. Introduction 2. Acknowledgements 3. Overview -- Round 6 4. Run Guide & Summary Tables 5. Data Files & Channels 6. Transient Test Plan
7. Cornering Test Plan 8. Drive/Brake Test Plan 9. Test Comments 10. Tire Models 11. Suggestions for Analysis 12. Questions/Comments
1. INTRODUCTION Round 6 of FSAE TTC testing was conducted in May 2015 at the Calspan Tire Research Facility. All data is available to FSAE TTC members via the private server at: http://sae.wsu.edu/ttc/. The public, introductory FSAE TTC website can be found at www.millikenresearch.com/fsaettc.html. TTC members are reminded of the terms of their membership. The participant agreement (data license) is included as the last page of this document. The TTC private forum, http://sae.wsu.edu/ttc/, exists for students to openly discuss the data without violating the terms of TTC membership. All TTC members are strongly encouraged to display the Calspan logo on their vehicle—several options are available in the “fromCalspan.zip” download. Calspan has given the TTC a considerable price break, and you should consider them one of your sponsors. Note: While two of the three Directors are affiliated with Milliken Research Associates, Inc. and the public webpage is hosted at an MRA web address, the FSAE TTC is not part of Milliken Research Associates, Inc.

Formula SAE Tire Test Consortium – Round 6 2
2. ACKNOWLEDGEMENTS The FSAE Tire Test Consortium has been founded, organized and lead by three co-Directors since its inception in December 2004: Dr. Edward M. Kasprzak, EMK Vehicle Dynamics, LLC
Milliken Research Associates, Inc. and University at Buffalo, SUNY
Mr. Doug Milliken, Milliken Research Associates, Inc. Dr. Bob Woods, University of Texas, Arlington Since Round 3, Brian Seater of Washington State University has contributed greatly to the FSAE TTC. He established and maintains the TTC private forum where students can openly discuss the tire data. He has also provided a means for electronic distribution of the tire data. Denny Trimble (University of Washington) helped establish the FSAE TTC during his student days and moved-on prior to Round 4. The FSAE TTC has received support from the following people and organizations: Hoosier Racing Tire once again donated tires and shipped them to Calspan at no cost to the FSAE TTC. Continental AG likewise once again donated tires and shipped them to Calspan at no cost. In past rounds, The Goodyear Tire and Rubber Company, Michelin and Dunlop Motorsport have donated tires and shipped them to Calspan at no cost to the FSAE TTC. Keizer Aluminum Wheels, http://keizerwheels.com, provided 10 inch wheels at a discounted price. Diamond Racing Wheels, http://www.diamondracingwheels.com, produced the steel 13 inch wheels. Calspan Tire Research Facility (TIRF), http://www.calspan.com/transportation/tire-research . Thanks to Dave Gentz, Greg Campbell, and everyone at Calspan for making another round of tire tests possible. Calspan continues to support the FSAE TTC and are always interested to hear of schools applying the data to their FSAE entries. This is the sixth time Calspan has provided the consortium a price break for the testing (once again, they didn’t turn a profit on this project). Everyone worked just as hard on this project as they do with their corporate and professional racing customers, and the staff went out of their way to accommodate FSAE students who attended the test. The Calspan Tire Research Facility is a top-notch operation—display your Calspan decal with pride and be sure to reference Calspan and the FSAE TTC properly when using the data. Calspan has also provided a cover letter, a presentation and a capabilities report describing the Tire Research Facility. These are included in the distribution—see fromCalspan.zip.

Formula SAE Tire Test Consortium – Round 6 3
3. OVERVIEW -- ROUND 6 The sixth round of FSAE TTC tests was conducted in early May 2015. The bulk of the test plan is similar to Round 5, with “traditional sweeps” for cornering tests (free-rolling, slip angle sweeps) and drive-brake-combined tests (slip ratio sweeps). New in Round 6 are low speed transient tests and traditional sweeps at various roadway speeds. To make room for these tests, the number of inclination angles used for the traditional sweeps has been reduced from five to three. Four new tire constructions were tested, each on two different rim widths:
• Continental 205/510R13 (4914)
• Hoosier 20.5 x 6.0 13 R25B A2500 (Item 43127)
• Hoosier 20.5 x 7.0 13 R25B A2500 (Item 43163)
• Hoosier 18.0 x 7.5 10 R25B (Item 43105) Additionally, two constructions from Round 5 were partially re-tested, each on two different rim widths. A limited set of traditional sweeps (1 inflation pressure) was run on these tires, plus all the new transient and roadway speed tests:
• Hoosier 18.0 x 6.0 10 R25B (Item 43101)
• Hoosier 6.0 / 18.0 10 LCO C2000 (Item 41100) All 10 inch tires were tested on aluminum wheels purchased from Keizer Aluminum Wheels, http://keizerwheels.com . All 13 inch tires were tested on steel wheels purchased from Diamond Racing Wheels, http://www.diamondracingwheels.com . Wheels are the same as used in Round 5 except for a few replacements (for wheels damaged in Round 5) and one new size, the 8 inch wide 10. Regardless of rim width or diameter, all wheels have the appropriate backspacing to align the wheel center with the center of the tire tread. The tests went very smoothly. See the test comments section (Section 9) for details. Posting of the Round 6 data was delayed a few months for several reasons—we appreciate everyone’s patience.

Formula SAE Tire Test Consortium – Round 6 4
4. RUN GUIDE & SUMMARY TABLES The test plan and the resulting test data is described as a series of runs. Data for each tire is spread across multiple runs. There are two documents which provide information on the contents of each run: RunGuide_Round6.pdf provides a one-page summary of the tire/rim combination and test type for each test run. You are strongly encouraged to make good use of this document. Note that a single tire was used for each row in this table. Thus, the tire used for run 1 was also used for runs 2-4, as the runs were conducted back-to-back. 1654 Summary Tables.xls is provided by Calspan. It contains more detailed information on each run. While understanding this document is not essential, it contains some post-processed metrics which may be useful. This spreadsheet includes the following pages:
• Cornering Test Schedule – description of the free-rolling test runs
• Braking Test Schedule – description of the drive-brake-combined test runs
• Tire ID Schedule – list of tires, including compounds and other sidewall codes
• Spring Rate, CS – Calspan-calculated cornering stiffness, cornering stiffness coefficient, lateral force at zero slip angle and spring rates from the main data sweeps.
• Pyrometer Reading – list of carcass temperatures taken with needle probe immediately after the end of each run. Probe temperatures were taken across the tread in three locations—inner edge, centerline and outer edge. Locations roughly correspond to the IR sensor locations.
• Pre- Post- Spring Rates – spring rates from the numerous spring rate tests throughout the runs The summary tables are found in the fromCalspan.zip download.
Formula SAE Tire Test Consortium – Round 6 5
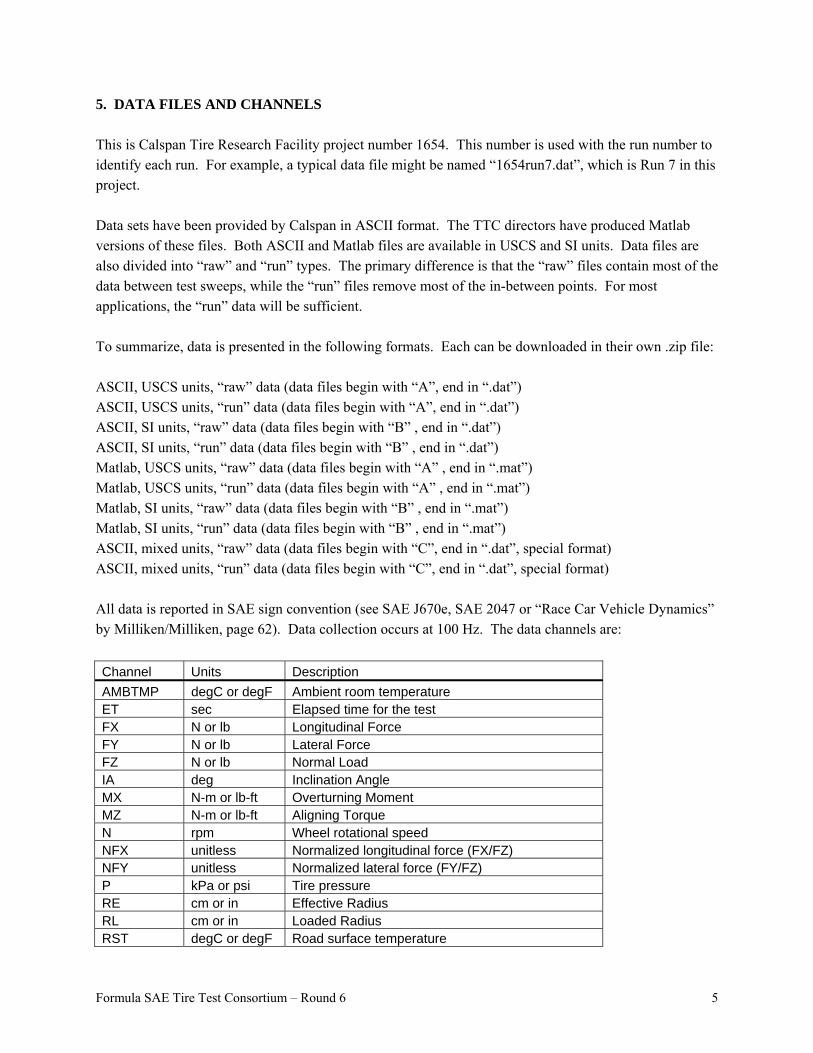
5. DATA FILES AND CHANNELS This is Calspan Tire Research Facility project number 1654. This number is used with the run number to identify each run. For example, a typical data file might be named “1654run7.dat”, which is Run 7 in this project. Data sets have been provided by Calspan in ASCII format. The TTC directors have produced Matlab versions of these files. Both ASCII and Matlab files are available in USCS and SI units. Data files are also divided into “raw” and “run” types. The primary difference is that the “raw” files contain most of the data between test sweeps, while the “run” files remove most of the in-between points. For most applications, the “run” data will be sufficient. To summarize, data is presented in the following formats. Each can be downloaded in their own .zip file: ASCII, USCS units, “raw” data (data files begin with “A”, end in “.dat”) ASCII, USCS units, “run” data (data files begin with “A”, end in “.dat”) ASCII, SI units, “raw” data (data files begin with “B” , end in “.dat”) ASCII, SI units, “run” data (data files begin with “B” , end in “.dat”) Matlab, USCS units, “raw” data (data files begin with “A” , end in “.mat”) Matlab, USCS units, “run” data (data files begin with “A” , end in “.mat”) Matlab, SI units, “raw” data (data files begin with “B” , end in “.mat”) Matlab, SI units, “run” data (data files begin with “B” , end in “.mat”) ASCII, mixed units, “raw” data (data files begin with “C”, end in “.dat”, special format) ASCII, mixed units, “run” data (data files begin with “C”, end in “.dat”, special format) All data is reported in SAE sign convention (see SAE J670e, SAE 2047 or “Race Car Vehicle Dynamics” by Milliken/Milliken, page 62). Data collection occurs at 100 Hz. The data channels are:
Channel Units Description
AMBTMP degC or degF Ambient room temperature ET sec Elapsed time for the test FX N or lb Longitudinal Force FY N or lb Lateral Force FZ N or lb Normal Load IA deg Inclination Angle MX N-m or lb-ft Overturning Moment MZ N-m or lb-ft Aligning Torque N rpm Wheel rotational speed NFX unitless Normalized longitudinal force (FX/FZ) NFY unitless Normalized lateral force (FY/FZ) P kPa or psi Tire pressure RE cm or in Effective Radius RL cm or in Loaded Radius RST degC or degF Road surface temperature
Formula SAE Tire Test Consortium – Round 6 6
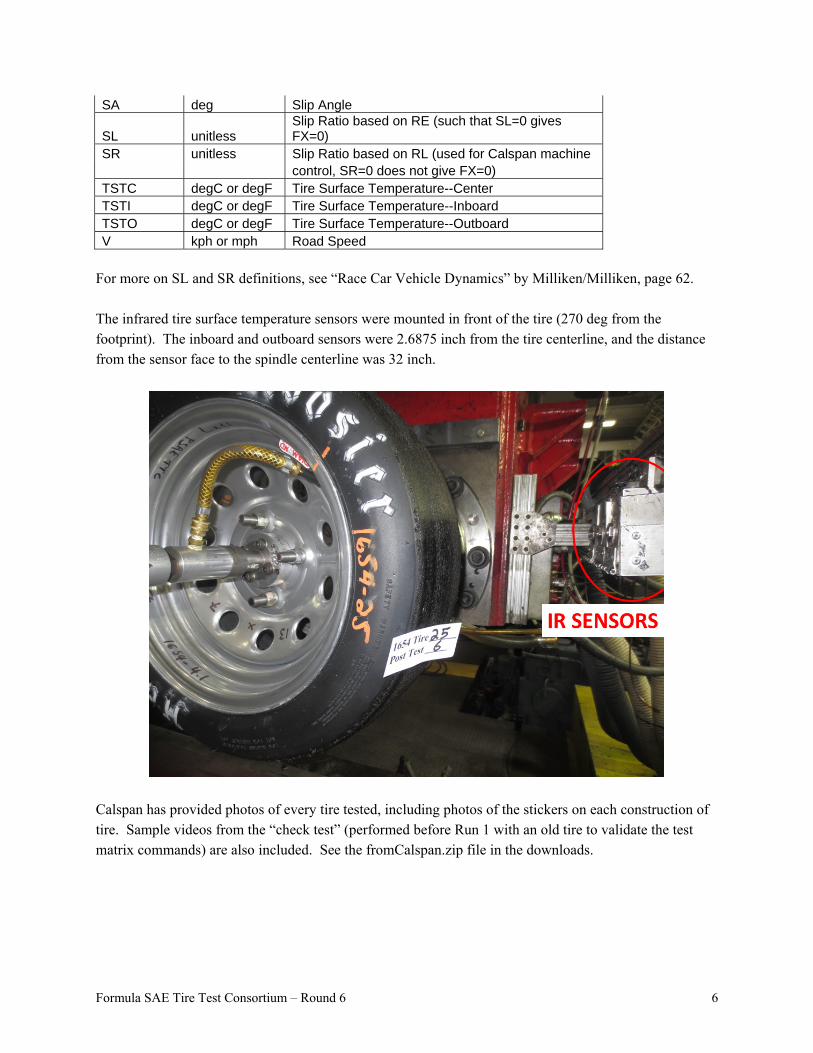
SA deg Slip Angle
SL unitless Slip Ratio based on RE (such that SL=0 gives FX=0)
SR unitless Slip Ratio based on RL (used for Calspan machine control, SR=0 does not give FX=0) TSTC degC or degF Tire Surface Temperature--Center TSTI degC or degF Tire Surface Temperature--Inboard TSTO degC or degF Tire Surface Temperature--Outboard V kph or mph Road Speed
For more on SL and SR definitions, see “Race Car Vehicle Dynamics” by Milliken/Milliken, page 62. The infrared tire surface temperature sensors were mounted in front of the tire (270 deg from the footprint). The inboard and outboard sensors were 2.6875 inch from the tire centerline, and the distance from the sensor face to the spindle centerline was 32 inch.
Calspan has provided photos of every tire tested, including photos of the stickers on each construction of tire. Sample videos from the “check test” (performed before Run 1 with an old tire to validate the test matrix commands) are also included. See the fromCalspan.zip file in the downloads.

Formula SAE Tire Test Consortium – Round 6 7
6. TRANSIENT TEST PLAN The transient test runs begin with the same initial spring rate tests as seen in the cornering tests from Round 5. Then, several low-speed transient tests are performed, all at zero inclination angle. See Figure 1. Note that all subplots in Figure 1 have the same x-axis time scale. Transient tests at each operating condition (load and inflation pressure) involve stopping the tire, steering to a new slip angle at zero speed and then rolling the tire forward slowly. Steer angles of −1, +1 and +6 deg are used, with a return to 0 deg for each step steer. As the tire rolls slowly forward, the force and moment channels respond as the tire seeks a new equilibrium condition, see Figure 2. This response distance, sometimes characterized by a “relaxation length” metric, is an indication of tire transient response. Figures appear on the next page.

Formula SAE Tire Test Consortium – Round 6 8
Figure 1. Transient test plan.
Figure 2. Lateral force (FY) transient due to step steer in slip angle (SA), with velocity (V) shown.
This is one steer out, steer back cycle at one operating condition.

Formula SAE Tire Test Consortium – Round 6 9
7. CORNERING TEST PLAN The cornering test was run immediately after the transient test using the same tire. Cornering tests are broken in to two runs due to the length of the test and the resulting size of the data files. Figure 3 presents the first half, while Figure 4 presents the second half. Cornering tests begin with a “cold to hot” series of twelve slip angle sweeps at the same load. This helps bring the tire up to temperature and gives an indication of how a new tire changes as it breaks-in and heats up. There are multiple spring rate blocks in the cornering tests. The initial spring rate test occurs immediately following the cold-to-hot sweeps. The remainder occur at the end of each pressure block. There is a break-in block before the main slip angle sweeps start. This further exercises the tire before the main force and moment data is taken. The main sweeps involve sweeping slip angle through ±12 deg at each operating condition (load, inclination and inflation pressure). The first slip angle sweep block is longer than the rest because it contains a few “conditioning sweeps”. These are a last attempt to exercise the tire and stabilize its performance before taking the main block of force and moment data. In all cornering tests the SAE slip ratio (SL) is zero. The tire is free-rolling. The first three pressures are completed in the first half of the cornering test, see Figure 3. After a short pause for data collection the test resumes, see Figure 4. Before returning to the main sweeps, another cold-to-hot block is run in an attempt to restore the thermal state of the tire. Figure 4 shows an 8 psi block. For 13 inch wheels the highest load was reduced at 8 psi from 350 lb to 300 lb to prevent debeading. Unlike Round 5, no tires were debeaded during Round 6. For 10 inch tires, the 350 lb load was replaced with a 200 lb load at all pressures. Figure 4 also includes a 12 psi block. This block is identical to the first 12 psi block in Figure 3. This is an opportunity to compare the two blocks for any changes in performance due to wear or heating. Next are slip angle sweeps at 15 and 45 mph. These are only run at zero inclination angle and 12 psi. Compare this data with the standard test data at 25 mph to see how velocity affects tire performance. The end of the cornering test data contains a test artifact that was not part of the original test plan. These two sweeps at 5 deg inclination angle were added to help clean the belt (roadway) in preparation for the next run. These sweeps can be ignored, or perhaps you’ll find them interesting!

Formula SAE Tire Test Consortium – Round 6 10
For the 10 inch tires that were tested in Round 5, the test follows Figure 3 through the end of the initial 12 psi slip angle sweeps. It then skips all the other inflation pressures and the second 12 psi block. The test continues with the 15 and 45 mph slip angle sweeps. The resulting cornering test is combined into a single data file (that is, it is not broken into two separate files). Figures appear on the next page.

Formula SAE Tire Test Consortium – Round 6 11
Figure 3. Cornering Test Plan, first half.
Figure 4. Cornering test plan, second half.

Formula SAE Tire Test Consortium – Round 6 12
8. DRIVE/BRAKE TEST PLAN Unlike the Cornering tests where slip angle was swept, the drive-brake-combined tests use slip ratio sweeps. Slip angle is held constant during the main portion of the test. The term “combined” is often used to describe simultaneous non-zero slip angle and slip ratio. The only time slip angle is not held constant is during the warmup run. This warmup is similar to the warmup used in the cornering tests, and would be identical if the transient tests were removed. The warmup run plan can be seen in Figure 5. Like the cornering tests, the main portion of the drive-brake-combined tests are split across two data files. The first half is seen in Figure 6. Here, the first three pressure blocks are conducted. There are no spring rate tests in this run—the entire run is composed of slip ratio sweeps at fixed slip angles. The data in Figure 6 appears to show a range of slip angles, but the only values used during slip ratio sweeps are 0, 2 and 4 deg. Transitions between these set points, occurring between sweeps, are captured in the data. Figure 7 completes the drive/brake tests. It includes a 12 psi block. This block is identical to the first 12 psi block in Figure 6. This is an opportunity to compare the two blocks for any changes in performance due to wear or heating. The test concludes with slip ratio sweeps at 15 and 45 mph, conducted at zero inclination and 12 psi. Compare this data with the standard test data at 25 mph to see how velocity affects tire performance. For the 10 inch tires that were tested in Round 5, the test follows Figure 6 through the end of the initial 12 psi slip ratio sweeps. It then skips all the other inflation pressures and the second 12 psi block. The test continues with the 15 and 45 mph slip ratio sweeps. The resulting test is combined into a single data file (that is, it is not broken into two separate files). Figures appear on the next page.

Formula SAE Tire Test Consortium – Round 6 13
Figure 5. Drive/brake Warm-up Run Plan.
Figure 6. Drive/Brake/Combined, first half.

Formula SAE Tire Test Consortium – Round 6 14
Figure 7. Drive/Brake/Combined, second half.

Formula SAE Tire Test Consortium – Round 6 15
9. TEST COMMENTS A few important thoughts on the Round 6 tests: Round 6 proceeded very smoothly at the Calspan Tire Research Facility. There was one component failure during Run 3 (a part in the pressure regulation system failed, leading to a test abort), otherwise the test machine behaved well and the test plan was executed accurately. Tire wear was very good for all tires and tests. No tires were worn out during testing. Referring to RunGuide_Round6.pdf, each row of the table began with a brand new tire. The cornering tests contain two extra sweeps at 5 deg inclination angle at the very end of the test. These were not part of the original test plan, and were added by Calspan to help clean the belt surface in preparation for the next run. A few of the drive-brake tests deposited spent rubber (“marbles”) on the roadway belt which then grew in size as the test progressed. The tire would hit this “bump in the road” once per belt revolution. This has some effect on the resulting data. For example, normalized lateral force spikes over 4.0 in some cases as the bump is encountered and the test machine tries to servo back to the specified condition. Sometimes these rubber clumps dissipated, but Run 36 is a run where they persisted. While repeatedly running over a clump of rubber is not ideal, it happened infrequently enough that we did not consider stopping the test to remove the clump. No rubber clumps accumulated on the belt during the cornering tests. The roadway belt on the test machine at Calspan is typically very clean and very smooth, so the peak friction values in the test data can be higher than what is seen on a typical racing surface (or parking lot). In past Rounds the “real world” peak lateral and longitudinal forces reported by FSAE teams are roughly 2/3 of those seen at Calspan. Such disagreement is always an issue with laboratory tire testing—how well or poorly the magnitudes agree are a strong function of tire construction and compound. As with all laboratory test data, correlation with real world performance is very important. The TTC directors do their best to select tires and define test matrices which will benefit as many TTC members as possible. We also know we cannot make everyone happy. We talked with other tire manufacturers beyond those tested in Round 6, and we considered many other possibilities for the test plan.
10. TIRE MODELS Various tire models or modeling tools may be posted on the FSAE TTC private forum. These are often donated by TTC sponsors. The FSAE TTC does not provide tire models.

Formula SAE Tire Test Consortium – Round 6 16
11. SUGGESTIONS FOR ANALYSIS A few items which you might find interesting when analyzing the data: Crossplot the data several different ways. Start with the “traditional” plots: lateral force vs. slip angle and longitudinal force vs. slip ratio. Then plot vs. normal load, inclination, pressure or even tread surface temperature. There are many, many ways to visualize and analyze the tire data. Compare the 12 psi runs taken at the start and end of each tire’s test. What differences do you see between a new tire and a used tire operating at a nominal thermal equilibrium?
Plot the lateral force vs. slip angle data during the “cold to hot” sweeps. How does the tire change with temperature and break-in? Look at the tire spring rate tests, and the variation of the rates with load, inflation pressure, inclination angle, rim width and speed. Study the data at different rim widths to establish its effect on tire performance. During the transient tests, look at the distance a tire needs to roll to reach a new steady-state after a step steer. Look at the response in all force and moment channels. After a step steer at zero speed the force and moment data does not stay constant until the tire starts rolling. Why? Compare tire force and moment performance at different speeds.
12. QUESTIONS/COMMENTS Please direct your questions to Dr. Edward M. Kasprzak, [email protected]

Formula SAE Tire Test Consortium – Round 6 17
FORMULA SAE TIRE TEST CONSORTIUM — PARTICIPANT AGREEMENT Thank you for your participation in the Formula SAE Tire Test Consortium (FSAE TTC). Membership in the TTC is granted to schools that have paid the one-time US$500 registration fee. Individuals (students, faculty, etc.) from member schools who make use of the TTC membership agree to the following terms: 1. Your school’s membership entitles you to all data collected by the FSAE TTC (2005-present).
Access to this data is through the FSAE TTC secure forum at http://sae.wsu.edu/ttc/. Individual username requests require a valid university-domain e-mail address.
2. You may use this data within your school (Formula SAE, Senior Design Projects, research, etc.).
You may also share this data with industry supporters who are helping your Formula SAE team make use of the data. Those in industry may not make any use of the data except to assist your Formula SAE team.
3. You may not use this data outside of your school (e.g., summer jobs, post-graduation positions). You
are prohibited from donating or selling the data to any other individual, group, team or university, or posting it on the internet. Commercial use of this data is prohibited.
4. Presentation/publication of the data in de-identified graphical or tabular form is permitted, provided
the author acknowledges the “Formula SAE Tire Test Consortium (FSAE TTC)” and the “Calspan Tire Research Facility (TIRF)”.
5. Your school’s FSAE/FS car will display the Calspan TIRF decal in every year the data contributes to
the design of the car. If you do not agree to the terms of this agreement you should ask for your personal secure forum username to be terminated and you should stop using the data. Your school’s membership will remain in effect. Direct any questions to FSAE TTC co-Director Dr. Edward M. Kasprzak, [email protected] FSAE Tire Test Consortium public website: http://www.millikenresearch.com/fsaettc.html FSAE Tire Test Consortium secure forum: http://sae.wsu.edu/ttc/