FS10-3015
4
Figure 1. Locations of 23 provinces of southeast Asia assessed in this study. Thai Basin Penyu-West Natuna Basin Malay Basin Sulu Sea Basin Palawan Shelf Basin Khorat Plateau Thai Cenozoic Basins Cuu Long Basin Nam Con Son Basin BaramDelta/ Brunei-Sabah Basin South China Sea Platform Greater Sarawak Basin Kutei Basin North Sumatra Basin Central Sumatra Basin South Sumatra Basin Song Hong Basin Phu Khanh Basin Northwest Java Basin East Java Basin Barito Basin Tarakan Basin Hanoi Manila Jakarta Bangkok Rangoon Singapore Vientiane Phnom Penh Kuala Lumpur 120°E 110°E 100°E 20°N 10°N 0° 10°S Sulu Sea Gulf of Thailand Java Sea Andaman Sea South China Sea Celebes Sea Indian Ocean MALAYSIA BRUNEI PHILIPPINES BORNEO SULAWESI MALAYSIA SUMATRA JAVA AUSTRALIA CHINA THAILAND BURMA VIETNAM CAMBODIA LAOS Indian Ocean Southeast Asia Assessment Area I N D O N E S I A 0 250 500 Kilometers 0 125 250 Miles Explanation AssessedProvinces CHINA Pearl River Mouth Basin U.S. Department of the Interior U.S. Geological Survey Fact Sheet 2010–3015 June 2010 World Petroleum Resources Assessment Proj ect Assessment of Undiscovered Oil and Gas Resources of Southeast Asia, 2010 Printed on recycled paper Using a geology-based assessment methodology, the U.S. Geological Survey estimated a mean of 21.6 billion barrels of oil and a mean of 299 trillion cubic feet of undiscovered natural gas in 23 provinces of southeast Asia. Introduction The U.S. Geological Survey (USGS) assessed the potential for undiscovered conventional oil and gas elds within geologic provinces of southeast Asia as part of the USGS World Petroleum Resources Assessment Project (g. 1). Twenty-three provinces were assessed in this study (table 1), including provinces entirely or partially within Thailand, Laos, Cambodia, Vietnam, Myanmar, Malaysia, Indonesia, Brunei, China, and Philippines. Many of the oil and gas basins within these geologic prov inces originated as extensional basins that evolved into a post-rift thermal subsid- ence phase, which is characterized by carbonate platform deposits or prograd- ing clastic wedges typical of passive mar- gins. This simple sketch does not reect the complexity of the tectonic history in southeast Asia, which has included rift- ing and attenuation of continental crust, opening and closing of ocean basins, development of regional fault systems and associated structures, collision and suturing of terranes, formation of accre- tionary prisms and local uplifts (Morley , 2001, 2002; Hutchinson, 2004; Hall and others, 2008). Petroleum systems in provinces of southeast Asia reect the complex tectonic evolution, but generalities can be made concernin g the origin of oil and gas in what are mainly Cenozoic basins (T odd and others, 1997; Doust and Sum- ner, 2007; Hall, 2009). Petroleum source rocks mainly are synrift deep-basin lacustrine and marginal lacustrine shales; post-rift marginal marine to marine coaly mudstones, coals, and marine shales (Todd and others, 1997). Oil predominantly is gen- erated from synrift lacustrine shales, whereas gas is generated from the post-rift coaly mudstones, coals, and shales, and by cracking of earlier-formed oil. As gas generation
-
Upload
paolo-conforti -
Category
Documents
-
view
223 -
download
1
Transcript of FS10-3015

7/31/2019 FS10-3015
http://slidepdf.com/reader/full/fs10-3015 1/4
Figure 1. Locations of 23 provinces of southeast Asia assessed in this study.
Thai Basin
Penyu-West NatunaBasin
Malay Basin
Sulu Sea Basin
Palawan ShelfBasin
Khorat Plateau
ThaiCenozoic
Basins
Cuu Long Basin
Nam Con Son Basin
BaramDelta/Brunei-Sabah
Basin
South China Sea Platform
GreaterSarawak Basin
Kutei Basin
NorthSumatra Basin
CentralSumatra Basin
SouthSumatra
Basin
Song
Hong Basin
PhuKhanhBasin
NorthwestJava Basin East Java Basin
BaritoBasin
Tarakan
Basin
Hanoi
Manila
Jakarta
Bangkok
Rangoon
Singapore
Vientiane
Phnom Penh
Kuala Lumpur
120°E110°E100°E
20°N
10°N
0°
10°S
Sulu
Sea
Gulf of
Thailand
Java Sea
Andaman
Sea
South
China
Sea
Celebes Sea
Indian Ocean
MALAYSIA
BRUNEI
PHILIPPINES
BORNEO
SULAWESI
MALAYSIA
SUMATRA
JAVA
AUSTRALIA
CHINA
THAILAND
BURMA
VIETNAM
CAMBODIA
LAOS
Indian
Ocean
Southeast
Asia
Assessment
Area
I N D O N E S I A
0 250 500 Kilometers
0 125 250 Miles
Explanation
Assessed Provinces
CH INA
Pearl RiverMouth Basin
U.S. Department of the InteriorU.S. Geological Survey
Fact Sheet 2010–3015June 2010
World Petroleum Resources Assessment Project
Assessment of Undiscovered Oil and Gas Resources of
Southeast Asia, 2010
Printed on recycled paper
Using a geology-based assessment
methodology, the U.S. Geological Survey
estimated a mean of 21.6 billion barrels
of oil and a mean of 299 trillion cubic
feet of undiscovered natural gas in
23 provinces of southeast Asia.
Introduction
The U.S. Geological Survey (USGS)assessed the potential for undiscovered
conventional oil and gas elds within
geologic provinces of southeast Asia
as part of the USGS World Petroleum
Resources Assessment Project (g. 1).
Twenty-three provinces were assessed in
this study (table 1), including provinces
entirely or partially within Thailand,
Laos, Cambodia, Vietnam, Myanmar,
Malaysia, Indonesia, Brunei, China, and
Philippines. Many of the oil and gas
basins within these geologic provinces
originated as extensional basins that
evolved into a post-rift thermal subsid-
ence phase, which is characterized by
carbonate platform deposits or prograd-
ing clastic wedges typical of passive mar-
gins. This simple sketch does not reect
the complexity of the tectonic history in
southeast Asia, which has included rift-
ing and attenuation of continental crust,
opening and closing of ocean basins,
development of regional fault systems
and associated structures, collision and
suturing of terranes, formation of accre-tionary prisms and local uplifts (Morley,
2001, 2002; Hutchinson, 2004; Hall and
others, 2008).
Petroleum systems in provinces
of southeast Asia reect the complex
tectonic evolution, but generalities can
be made concerning the origin of oil and
gas in what are mainly Cenozoic basins
(Todd and others, 1997; Doust and Sum-
ner, 2007; Hall, 2009). Petroleum source
rocks mainly are synrift deep-basin
lacustrine and marginal lacustrine shales; post-rift marginal marine to marine coaly
mudstones, coals, and marine shales (Todd and others, 1997). Oil predominantly is gen-
erated from synrift lacustrine shales, whereas gas is generated from the post-rift coaly
mudstones, coals, and shales, and by cracking of earlier-formed oil. As gas generation
7/31/2019 FS10-3015
http://slidepdf.com/reader/full/fs10-3015 2/4
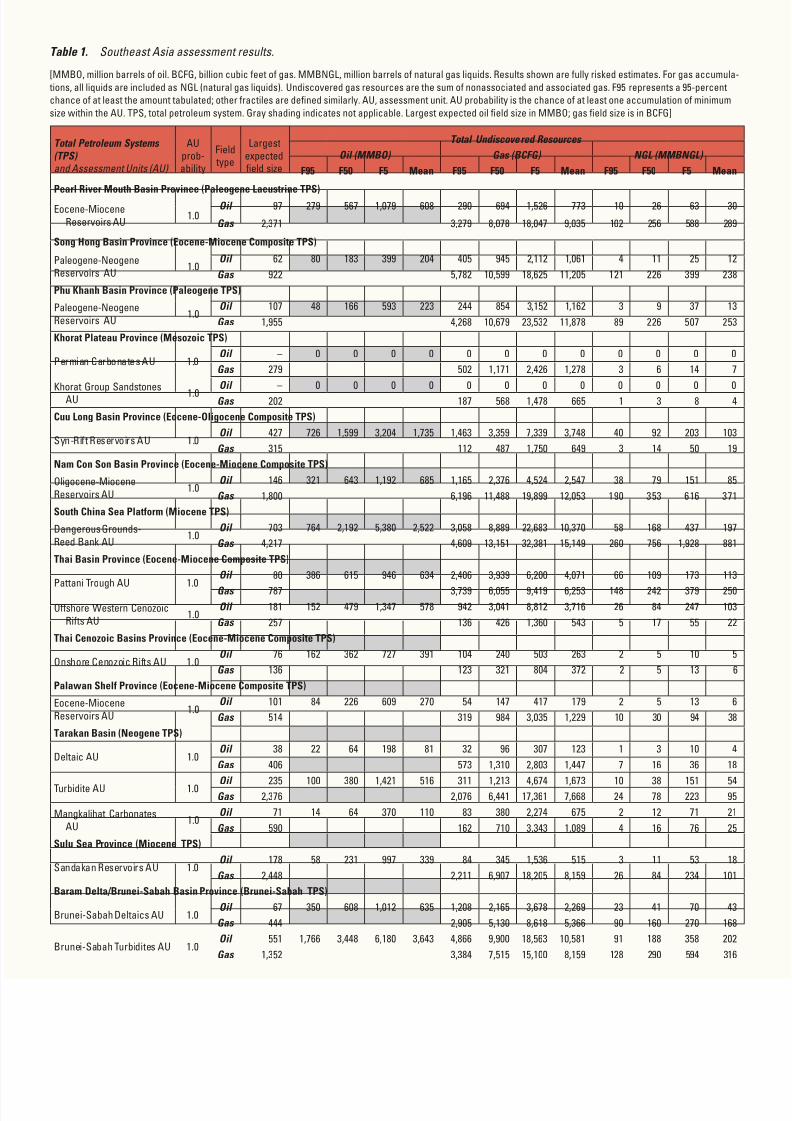
Table 1. Southeast Asia assessment results.
[MMBO, million barrels of oil. BCFG, billion cubic feet of gas. MMBNGL, million barrels of natural gas liquids. Results shown are fully risked estimates. For gas accumula-
tions, all liquids are included as NGL (natural gas liquids). Undiscovered gas resources are the sum of nonassociated and associated gas. F95 represents a 95-percent
chance of at least the amount tabulated; other fractiles are dened similarly. AU, assessment unit. AU probability is the chance of at least one accumulation of minimum
size within the AU. TPS, total petroleum system. Gray shading indicates not applicable. Largest expected oil eld size in MMBO; gas eld size is in BCFG]
Total Petroleum Systems
(TPS) and Assessment Units (AU)
AU
prob-ability
Field type
Largest
expectedeld size
Total Undiscovered Resources
Oil (MMBO) Gas (BCFG) NGL (MMBNGL)
F95 F50 F5 Mean F95 F50 F5 Mean F95 F50 F5 Mean
Pearl River Mouth Basin Province (Paleogene Lacustrine TPS)
Eocene-Miocene
Reservoirs AU1.0
Oil 97 279 567 1,079 608 290 694 1,526 773 10 26 63 30
Gas 2,371 3,279 8,078 18,047 9,035 102 256 588 289
Song Hong Basin Province (Eocene-Miocene Composite TPS)
Paleogene-Neogene
Reservoirs AU1.0
Oil 62 80 183 399 204 405 945 2,112 1,061 4 11 25 12
Gas 922 5,782 10,599 18,625 11,205 121 226 399 238
Phu Khanh Basin Province (Paleogene TPS)
Paleogene-Neogene
Reservoirs AU1.0
Oil 107 48 166 593 223 244 854 3,152 1,162 3 9 37 13
Gas 1,955 4,268 10,679 23,532 11,878 89 226 507 253
Khorat Plateau Province (Mesozoic TPS)
Permian Carbonates AU 1.0Oil – 0 0 0 0 0 0 0 0 0 0 0 0
Gas 279 502 1,171 2,426 1,278 3 6 14 7
Khorat Group Sandstones
AU 1.0Oil – 0 0 0 0 0 0 0 0 0 0 0 0
Gas 202 187 568 1,478 665 1 3 8 4
Cuu Long Basin Province (Eocene-Oligocene Composite TPS)
Syn-Rift Reservoirs AU 1.0Oil 427 726 1,599 3,204 1,735 1,463 3,359 7,339 3,748 40 92 203 103
Gas 315 112 487 1,750 649 3 14 50 19
Nam Con Son Basin Province (Eocene-Miocene Composite TPS)
Oligocene-Miocene
Reservoirs AU1.0
Oil 146 321 643 1,192 685 1,165 2,376 4,524 2,547 38 79 151 85
Gas 1,800 6,196 11,488 19,899 12,053 190 353 616 371
South China Sea Platform (Miocene TPS)
Dangerous Grounds-
Reed Bank AU1.0
Oil 703 764 2,192 5,380 2,522 3,058 8,889 22,683 10,370 58 168 437 197
Gas 4,217 4,609 13,151 32,381 15,149 260 756 1,928 881
Thai Basin Province (Eocene-Miocene Composite TPS)
Pattani Trough AU 1.0Oil 80 386 615 946 634 2,406 3,939 6,200 4,071 66 109 173 113
Gas 787 3,739 6,055 9,419 6,253 148 242 379 250
Offshore Western Cenozoic
Rifts AU1.0
Oil 181 152 479 1,347 578 942 3,041 8,812 3,716 26 84 247 103
Gas 257 136 426 1,360 543 5 17 55 22
Thai Cenozoic Basins Province (Eocene-Miocene Composite TPS)
Onshore Cenozoic Rifts AU 1.0Oil 76 162 362 727 391 104 240 503 263 2 5 10 5
Gas 136 123 321 804 372 2 5 13 6
Palawan Shelf Province (Eocene-Miocene Composite TPS)
Eocene-Miocene
Reservoirs AU1.0
Oil 101 84 226 609 270 54 147 417 179 2 5 13 6
Gas 514 319 984 3,035 1,229 10 30 94 38
Tarakan Basin (Neogene TPS)
Deltaic AU 1.0Oil 38 22 64 198 81 32 96 307 123 1 3 10 4
Gas 406 573 1,310 2,803 1,447 7 16 36 18
Turbidite AU 1.0 Oil 235 100 380 1,421 516 311 1,213 4,674 1,673 10 38 151 54Gas 2,376 2,076 6,441 17,361 7,668 24 78 223 95
Mangkalihat Carbonates
AU1.0
Oil 71 14 64 370 110 83 380 2,274 675 2 12 71 21
Gas 590 162 710 3,343 1,089 4 16 76 25
Sulu Sea Province (Miocene TPS)
Sandakan Reservoirs AU 1.0Oil 178 58 231 997 339 84 345 1,536 515 3 11 53 18
Gas 2,448 2,211 6,907 18,205 8,159 26 84 234 101
Baram Delta/Brunei-Sabah Basin Province (Brunei-Sabah TPS)
Brunei-Sabah Deltaics AU 1.0Oil 67 350 608 1,012 635 1,208 2,165 3,678 2,269 23 41 70 43
Gas 444 2,905 5,130 8,618 5,366 90 160 270 168
Brunei-Sabah Turbidites AU 1.0Oil 551 1,766 3,448 6,180 3,643 4,866 9,900 18,563 10,581 91 188 358 202
Gas 1,352 3,384 7,515 15,100 8,159 128 290 594 316

7/31/2019 FS10-3015
http://slidepdf.com/reader/full/fs10-3015 3/4
Total Petroleum Systems(TPS)and Assessment Units (AU)
AU
prob-ability
Field
type
Largest
expectedeld size
Total Undiscovered Resources
Oil (MMBO) Gas (BCFG) NGL (MMBNGL)
F95 F50 F5 Mean F95 F50 F5 Mean F95 F50 F5 Mean
Greater Sarawak Basin Province (Sarawak Basin TPS)
Central Luconia AU 1.0Oil – 0 0 0 0 0 0 0 0 0 0 0 0
Gas 2,492 11,849 20,048 32,212 20,759 318 542 878 562
Balingian AU 1.0Oil 80 361 618 1,013 643 1,435 2,529 4,233 2,641 27 48 81 50
Gas 687 2,340 4,189 7,169 4,392 132 243 425 256
East Natuna Carbonate AU 1.0Oil – 0 0 0 0 0 0 0 0 0 0 0 0
Gas 1,913 4,729 9,646 18,038 10,281 126 260 494 278
Malay Basin Province (Oligocene-Miocene Composite TPS)
Main Malay-Tho Chu AU 1.0Oil 71 240 430 732 450 893 1,658 2,945 1,756 11 21 37 22
Gas 1,158 4,200 7,661 13,049 8,008 87 160 275 167
Khmer Trough AU 1.0Oil 82 60 179 493 214 215 681 1,974 835 3 8 25 10
Gas 535 415 1,259 3,346 1,489 8 26 71 31
Barito Basin (Eocene-Miocene Composite TPS)
Barito Foredeep StructuresAU
1.0 Oil 84 20 94 460 146 32 160 816 256 1 3 16 5Gas 997 589 2,108 6,444 2,617 9 32 100 40
Central Sumatra Basin Province (Brown Shale-Sihapas TPS)
Pematang/Sihapas
Siliciclastics AU1.0
Oil 14 84 142 233 148 70 133 240 141 6 12 23 13
Gas 99 85 222 562 259 2 5 12 6
East Java Basin (Eocene-Miocene Composite TPS)
East Java Carbonates AU 1.0Oil 190 173 435 1,146 514 1,031 2,639 7,128 3,154 32 82 224 99
Gas 1,742 3,049 6,319 12,670 6,879 68 142 288 155
East Java Siliciclastics AU 1.0Oil 294 633 1,400 2,816 1,522 1,310 2,925 5,984 3,192 67 151 311 165
Gas 2,358 8,286 17,078 32,285 18,264 613 1,291 2,471 1,381
Kutei Basin TPS
Kutei Basin Deltaics AU 1.0Oil 32 91 160 269 168 471 847 1,464 892 5 9 16 10
Gas 952 1,299 3,056 6,652 3,401 58 143 331 162
Kutei Basin Turbidites AU 1.0Oil 615 1,371 2,851 5,393 3,047 9,643 20,104 38,035 21,478 101 216 423 233
Gas 2,471 11,212 19,416 31,896 20,230 187 328 546 342
North Sumatra Basin (Bampo-Cenozoic TPS)
North Sumatra AU 1.0Oil 12 48 77 119 79 288 478 763 495 5 10 17 10
Gas 183 534 934 1,570 977 36 66 121 71
Mergui Basin AU 1.0Oil 169 71 280 1,018 374 423 1,711 6,434 2,338 8 33 137 48
Gas 1,493 2,796 6,486 13,524 7,096 188 461 1,031 516
Northwest Java Basin (Eocene-Miocene Composite TPS)
Sunda-Asri Basins AU 1.0Oil 31 90 161 274 169 152 279 495 296 5 9 16 9
Gas 100 80 224 581 262 0 1 3 1
Ardjuna Basin AU 1.0Oil 46 73 152 310 166 326 692 1,487 772 12 28 64 32
Gas 378 625 1,350 2,729 1,474 15 33 71 36
Biliton-Vera Basins AU 1.0Oil 116 136 348 797 391 606 1,588 3,818 1,819 23 63 163 74
Gas 90 8 41 408 106 0 1 10 3
Penyu-West Natuna Basin Province (Oligocene-Miocene Composite TPS)
Gabus-Udang-Urang
Sandstones AU1.0
Oil 24 27 66 150 74 109 284 699 329 1 4 10 5
Gas 153 598 1,048 1,754 1,094 24 43 72 45
South Sumatra Basin (Lahat/Talang Akar-Cenozoic TPS)
South Sumatra AU 1.0Oil 82 133 321 681 353 537 1,338 2,967 1,491 11 28 65 32
Gas 639 1,398 3,112 6,194 3,367 48 110 228 120
Total ConventionalResources 8,922 19,541 41,558 21,632 128,908 272,848 557,051 298,761 3,828 8,270 17,216 9,099
Table 1. Southeast Asia assessment results.—Continued
[MMBO, million barrels of oil. BCFG, billion cubic feet of gas. MMBNGL, million barrels of natural gas liquids. Results shown are fully risked estimates. For gas accumula-
tions, all liquids are included as NGL (natural gas liquids). Undiscovered gas resources are the sum of nonassociated and associated gas. F95 represents a 95-percent
chance of at least the amount tabulated; other fractiles are dened similarly. AU, assessment unit. AU probability is the chance of at least one accumulation of minimum
size within the AU. TPS, total petroleum system. Gray shading indicates not applicable. Largest expected oil eld size in MMBO; gas eld size is in BCFG]

7/31/2019 FS10-3015
http://slidepdf.com/reader/full/fs10-3015 4/4
is later than oil, gas is focused into the
younger, post-rift clastic and carbonate
reservoirs. Volumetrically, gas would be
expected to be more prevalent than oil in
these provinces where post-rift sources
have achieved the appropriate thermal
maturity for generation (Doust and
Sumner, 2007).
The methodology for the assessmentincluded a complete geologic framework
description for each province mainly
based on published literature and deni-
tion of petroleum systems and assessment
units within these systems. Exploration
and discovery history was a critical part
of the methodology used to estimate
sizes and numbers of undiscovered
accumulations. In areas where there are
no discoveries (for example, Phu Khanh
Basin) geologic analogs were used as a
basis for volumes of undiscovered oil
and gas resources. Each assessment unitwas assessed for undiscovered oil and
nonassociated gas accumulations, and
coproduct ratios were used to calculate
the volumes of associated gas (gas in oil
elds) and natural gas liquids.
Resource Summary
The USGS assessed undiscovered
conventional oil and gas resources in
assessment units within 23 geologic
provinces (table 1). For conventional oil
resources, the mean total is 21,632 mil-lion barrels of oil (MMBO), with a
range from 8,922 to 41,558 MMBO;
for undiscovered conventional gas the
mean total is 298,761 billion cubic feet
(BCFG), with a range from 128,908
BCFG to 557,051 BCFG; and a mean
total of 9,099 million barrels of natural
gas liquids (MMBNGL), with a range
from 3,828 to 17,216 MMBNGL.
Of the mean oil total of
21,632 MMBO, about 70 percent is
estimated to be in six provinces—Baram
Delta/Brunei-Sabah Basin (mean of
4,278 MMBO), Kutei Basin (mean of
3,215 MMBO), South China Sea Plat-
form (mean of 2,522 MMBO), East Java
Basin (mean of 2,036 MMBO), Cuu
Long Basin (mean of 1,735 MMBO), and
Thai Basin (mean of 1,212 MMBO). In
addition, several provinces are estimated
to have potential oil volumes greater than500 MMBO—Northwest Java Basin
(mean of 726 MMBO), Tarakan Basin
(mean of 707 MMBO), Nam Con Son
Basin (mean of 685 MMBO), Malay
Basin (mean of 664 MMBO), Greater
Sarawak Basin (mean of 643 MMBO),
and Pearl River Mouth Basin (mean of
608 MMBO).
For the mean undiscovered gas total
of 298,761 BCFG, about 60 percent is
estimated to be in six provinces—Kutei
Basin (mean of 46,001 BCFG), Greater Sarawak Basin (mean of 38,073 BCFG),
East Java Basin (mean of 31,489 BCFG),
Baram Delta/Brunei-Sabah Basin (mean
of 26,375 BCFG), South China Sea Plat-
form (mean of 25,519 BCFG), and Nam
Con Son Basin (mean of 14,600 BCFG).
Several other provinces are estimated
to have potential gas volumes greater
than 10,000 BCFG—Thai Basin (mean
of 14,583 BCFG), Phu Khanh Basin
(mean of 13,040 BCFG), Tarakan Basin
(mean of 12,675 BCFG), Song Hong
Basin (mean of 12,266 BCFG), and
Malay Basin (mean of 12,088 BCFG).
Overall, the assessment indicates that
(1) more than 90 percent of the undis-
covered oil and gas resources are
offshore, and (2) there is more than
twice as much undiscovered gas resource
(298,761 BCFG, or 49,794 MMBOE)
than undiscovered oil resource
(21,632 MMBO) in the provinces of
southeast Asia using a barrels of oil
equivalent conversion.
References
Doust, H., and Sumner, H.S., 2007,
Petroleum systems in rift basins—a
collective approach in southeast Asia
basins: Petroleum Geoscience, v. 13,
p. 127–144.
Hall, R., 2009, Hydrocarbon basins in
SE Asia: understanding why they are
there: Petroleum Geoscience, v. 15, p. 131–146.
Hall, R., van Hattum, M.W.A., and Spak-
man, Wim, 2008, Impact of India—
Asia collision on SE Asia: the record
in Borneo: Tectonophysics, v. 451,
p. 366–389.
Hutchinson, C.S., 2004, Marginal basin
evolution: the southern South China
Sea: Marine and Petroleum Geology,
v. 21, p. 1129–1148.
Morley, C.K., 2001, Combined escape
tectonics and subduction roll-back-
backarc extension: a model for the
Tertiary rift basins in Thailand, Malay-
sia, and Laos: Journal of Geological
Society of London, v. 158, p. 461–474.
Morley, C.K., 2002, A tectonic model
for the Tertiary evolution of strike-slip
faults and rift basins in SE Asia: Tecto-
nophysics, v. 347, p. 89–215.
Todd, S.P., Dunn, M.E., and Barwise,
A.J.G., 1997, Characterizing petroleumcharge systems in the Tertiary of SE
Asia, in Fraser, A.J., Matthews, S.J.,
and Murphy, R.W., eds., Petroleum
geology of Southeast Asia: Geological
Society of London Special Publication
v. 126, p. 25–47.
For Further Information
Supporting studies of the geologic
models and the methodology used in
the assessment of Southeast Asia Basins
are in progress. Assessment results areavailable at the USGS Energy Program
website, http://energy.cr.usgs.gov/oilgas/ .
Southeast Asia ProvincesAssessment Team:
Christopher J. Schenk (Task Leader;
[email protected]), Michael E. Brown-
eld, Ronald R. Charpentier, Troy A.
Cook, Timothy R. Klett, Mark A. Kirsch-
baum, Janet K. Pitman, and Richard M.
Pollastro.