Front cover - Hong Kong Baptist University · Front cover. Student Exercises ... processing...
276
DB2 for Linux, UNIX, and Windows Performance Tuning and Monitoring Workshop (Course Code CF41) Student Exercises ERC 9.0 IBM Certified Course Material V2.0.0.1 cover
Transcript of Front cover - Hong Kong Baptist University · Front cover. Student Exercises ... processing...
V2.0.0.1
cover
���
Front coverDB2 for Linux, UNIX, and Windows Performance Tuning and Monitoring Workshop (Course Code CF41)
Student ExercisesERC 9.0
IBM Certified Course Material
Student Exercises
Trademarks
IBM® is a registered trademark of International Business Machines Corporation.
The following are trademarks of International Business Machines Corporation in the United States, or other countries, or both:
Alerts® is a registered trademark of Alphablox Corporation in the United States, other countries, or both.
Java and all Java-based trademarks are trademarks of Sun Microsystems, Inc. in the United States, other countries, or both.
Microsoft, Windows, Windows NT, and the Windows logo are trademarks of Microsoft Corporation in the United States, other countries, or both.
Intel, Intel logo, Intel Inside, Intel Inside logo, Intel Centrino, Intel Centrino logo, Celeron, Intel Xeon, Intel SpeedStep, Itanium, and Pentium are trademarks or registered trademarks of Intel Corporation or its subsidiaries in the United States and other countries.
UNIX® is a registered trademark of The Open Group in the United States and other countries.
Linux® is a registered trademark of Linus Torvalds in the United States, other countries, or both.
Other company, product, or service names may be trademarks or service marks of others.
AIX DB2 DB2 Universal DatabaseDRDA Informix MVSMVS/ESA OS/2 OS/390z/OS
The information contained in this document has not been submitted to any formal IBM test and is distributed on an “as is” basis withoutany warranty either express or implied. The use of this information or the implementation of any of these techniques is a customerresponsibility and depends on the customer’s ability to evaluate and integrate them into the customer’s operational environment. Whileeach item may have been reviewed by IBM for accuracy in a specific situation, there is no guarantee that the same or similar results willresult elsewhere. Customers attempting to adapt these techniques to their own environments do so at their own risk.
© Copyright International Business Machines Corporation 2001, 2006. All rights reserved.This document may not be reproduced in whole or in part without the prior written permission of IBM.Note to U.S. Government Users — Documentation related to restricted rights — Use, duplication or disclosure is subject to restrictionsset forth in GSA ADP Schedule Contract with IBM Corp.
December 2006 Edition
Student ExercisesV1.2.2
TOC
ContentsTrademarks . . . . . . . . . . . . . . . . . . . . . . . . . . . . . . . . . . . . . . . . . . . . . . . . . . . . . . . v
Exercises Description . . . . . . . . . . . . . . . . . . . . . . . . . . . . . . . . . . . . . . . . . . . . . . vii
Exercise 1. Database Performance and Monitoring . . . . . . . . . . . . . . . . . . . . . . . . . 1-1
Exercise 2. Tablespace and I/O Performance . . . . . . . . . . . . . . . . . . . . . . . . . . . . . . 2-1
Exercise 3. DB2 Memory Management . . . . . . . . . . . . . . . . . . . . . . . . . . . . . . . . . . . . 3-1
Exercise 4. DB2 Automated Memory Management . . . . . . . . . . . . . . . . . . . . . . . . . . 4-1
Exercise 5. DB2 Explain Tools . . . . . . . . . . . . . . . . . . . . . . . . . . . . . . . . . . . . . . . . . . 5-1
Exercise 6. DB2 Optimizer . . . . . . . . . . . . . . . . . . . . . . . . . . . . . . . . . . . . . . . . . . . . . . 6-1
Exercise 7. Using Indexes for Performance . . . . . . . . . . . . . . . . . . . . . . . . . . . . . . . . 7-1
Exercise 8. Complex SQL Performance . . . . . . . . . . . . . . . . . . . . . . . . . . . . . . . . . . . 8-1
Exercise 9. Using DB2 Utilities for Performance . . . . . . . . . . . . . . . . . . . . . . . . . . . . 9-1
Exercise 10. Monitoring Database Health and Activity . . . . . . . . . . . . . . . . . . . . . . 10-1
Exercise 11. Application Performance . . . . . . . . . . . . . . . . . . . . . . . . . . . . . . . . . . . 11-1
Exercise 12. Event Monitoring . . . . . . . . . . . . . . . . . . . . . . . . . . . . . . . . . . . . . . . . . 12-1
Appendix A. UNIX vi Editor Command Summary . . . . . . . . . . . . . . . . . . . . . . . . . . A-1
Course materials may not be reproduced in whole or in part without the prior written permission of IBM.
© Copyright IBM Corp. 2001, 2006 Contents iii

Student Exercises
Course materials may not be reproduced in whole or in part without the prior written permission of IBM.
iv DB2 for Linux, UNIX, and Windows © Copyright IBM Corp. 2001, 2006
Student ExercisesV2.0
TMK
TrademarksThe reader should recognize that the following terms, which appear in the content of this training document, are official trademarks of IBM or other companies:
IBM® is a registered trademark of International Business Machines Corporation.
The following are trademarks of International Business Machines Corporation in the United States, or other countries, or both:
Alerts® is a registered trademark of Alphablox Corporation in the United States, other countries, or both.
Java and all Java-based trademarks are trademarks of Sun Microsystems, Inc. in the United States, other countries, or both.
Microsoft, Windows, Windows NT, and the Windows logo are trademarks of Microsoft Corporation in the United States, other countries, or both.
Intel, Intel logo, Intel Inside, Intel Inside logo, Intel Centrino, Intel Centrino logo, Celeron, Intel Xeon, Intel SpeedStep, Itanium, and Pentium are trademarks or registered trademarks of Intel Corporation or its subsidiaries in the United States and other countries.
UNIX® is a registered trademark of The Open Group in the United States and other countries.
Linux® is a registered trademark of Linus Torvalds in the United States, other countries, or both.
Other company, product, or service names may be trademarks or service marks of others.
AIX® DB2® DB2 Universal Database™DRDA® Informix® MVS™MVS/ESA™ OS/2® OS/390®z/OS®
Course materials may not be reproduced in whole or in part without the prior written permission of IBM.
© Copyright IBM Corp. 2001, 2006 Trademarks v

Student Exercises
Course materials may not be reproduced in whole or in part without the prior written permission of IBM.
vi DB2 for Linux, UNIX, and Windows © Copyright IBM Corp. 2001, 2006
Student ExercisesV2.0
pref
Exercises DescriptionExercise 1: This exercise allows the student to begin analyzing the database performance characteristics for an application using SNAPSHOT monitoring.
Exercise 2: This exercise allows the student to begin analyzing the database performance characteristics for an application. The impact of increased bufferpool size, using separate data and index DMS table spaces and implementing row compression will be measured.
Exercise 3: This exercise allows the student to analyze the performance impact of implementing multiple database buffer pools. The database performance statistics will be collected to adjust the sortheap size to improve sort efficiency.
Exercise 4: This exercise allows the student to configure a DB2 database to implement the Self Tuning Memory Management function to automatically adjust the database memory configuration.
Exercise 5: This exercise allows the student to become familiar with the DB2 explain tools. These tools can be used to understand the processing required to execute SQL statements.
Exercise 6: This exercise allows the student to use the DB2 Explain tools to better understand access plan selections of the DB2 Optimizer.
Exercise 7: This exercise allows the student to analyze the performance impact of indexes to improve the efficiency of processing SQL statements.
Exercise 8: This exercise allows the student to use the DB2 explain tools to better understand access strategies of the DB2 Optimizer, including use of indexes for joining tables. A Materialized Query Table (MQT), will be used to improve query performance. The use of partition elimination in access plans for range partitioned tables will be explored.
Exercise 9: This exercise allows the student to use the DB2 UDB utilities to analyze and improve query performance. The DB2BATCH tool will be used to gather performance statistics. The REORG command will be used to change the sequence of rows in a table to improve query efficiency. The RUNSTATS command will be used update the DB2 Catalog statistics to provide accurate input to the DB2 Optimizer. The REORGCHK command will be used to report on index efficiency.
Course materials may not be reproduced in whole or in part without the prior written permission of IBM.
© Copyright IBM Corp. 2001, 2006 Exercises Description vii
Student Exercises
Exercise 10: This exercise allows the student to use the DB2 Health Center, and Activity Monitor tools to view the status of an active DB2 database.
Exercise 11: This exercise allows the student to analyze the performance impact of using different application development techniques, including Static SQL and Dynamic SQL.
Exercise 12: This exercise allows the student to use Event Monitors to collect performance statistics for transactions, SQL statements and application connections executing in the DB2 UDB database. The event monitoring will use files and database tables to store the monitor data.
Course materials may not be reproduced in whole or in part without the prior written permission of IBM.
viii DB2 for Linux, UNIX, and Windows © Copyright IBM Corp. 2001, 2006

Student ExercisesV1.2.2.2
EXempty
Exercise 1. Database Performance and MonitoringWhat This Exercise Is About
This exercise is an online lab which allows the student to begin analyzing the database performance characteristics for an application.
What You Should Be Able to Do
At the end of the lab, you should be able to:
• Use the DB2 GET SNAPSHOT command to collect statistics for performance analysis.
• Configure the DB2 Database Manager Configuration to collect detailed performance statistics.
• Use the DB2EXPLN utility to examine the explain information for an application that uses static SQL.
• Perform SQL queries using the SNAPSHOT table functions and Administrative views to collect selected database performance information.
• Use a db2pd command to view information about an active DB2 database.
Course materials may not be reproduced in whole or in part without the prior written permission of IBM.
© Copyright IBM Corp. 2001, 2006 Exercise 1. Database Performance and Monitoring 1-1

Student Exercises
Exercise Instructions
Section 1 - New Application Performance Analysis
Introduction:
A new database TP1 was created to test a new OLTP application. The TP1 database is using the defaults for all configuration options.
The application uses four tables:
1. ACCT - With information for 1000000 accounts. 2. BRANCH - With information for 100 bank branches.3. TELLER - With information for 1000 banks.4. HISTORY - Empty table to hold transaction history data.
An application MULTI was created to generate application transactions for performance testing.
The tables were created in an SMS table space TP1SMS. The tables have been loaded with test data and the required indexes were created.
__ 1. You will be using the DB2 GET SNAPSHOT command to collect performance statistics. Check the Database Manager configuration to determine if the snapshot monitor switches are on by default.
Logon to your Linux workstation with a userid of inst411 and the password provided by the instructor (ibm2blue).
From your Linux workstation, start a new terminal session.
In the terminal session, issue the command:
db2 get database manager monitor switches
The output will look similar to:
DBM System Monitor Information Collected
Switch list for db partition number 0Buffer Pool Activity Information (BUFFERPOOL) = OFFLock Information (LOCK) = OFFSorting Information (SORT) = OFFSQL Statement Information (STATEMENT) = OFFTable Activity Information (TABLE) = OFFTake Timestamp Information (TIMESTAMP) = ON 06-08-2003 15:04:21.000041Unit of Work Information (UOW) = OFF
All of the SNAPSHOT monitor switches are off except for the TIMESTAMP option.
__ 2. Issue the DB2 command to have all of the snapshot monitor statistics available when the instance is started.
In a terminal session, issue the commands:
Course materials may not be reproduced in whole or in part without the prior written permission of IBM.
1-2 DB2 for Linux, UNIX, and Windows © Copyright IBM Corp. 2001, 2006
Student ExercisesV3.1.0.1
EXempty
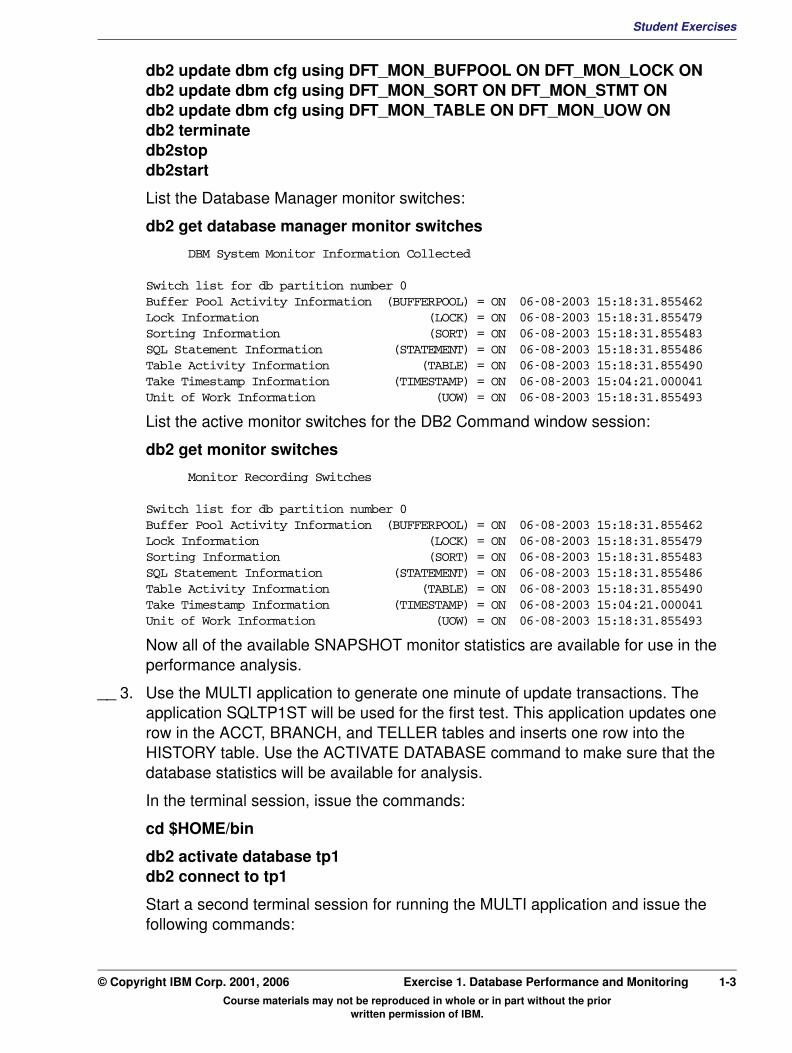
db2 update dbm cfg using DFT_MON_BUFPOOL ON DFT_MON_LOCK ON db2 update dbm cfg using DFT_MON_SORT ON DFT_MON_STMT ON db2 update dbm cfg using DFT_MON_TABLE ON DFT_MON_UOW ON db2 terminate db2stop db2startList the Database Manager monitor switches:
db2 get database manager monitor switches
DBM System Monitor Information Collected
Switch list for db partition number 0Buffer Pool Activity Information (BUFFERPOOL) = ON 06-08-2003 15:18:31.855462Lock Information (LOCK) = ON 06-08-2003 15:18:31.855479Sorting Information (SORT) = ON 06-08-2003 15:18:31.855483SQL Statement Information (STATEMENT) = ON 06-08-2003 15:18:31.855486Table Activity Information (TABLE) = ON 06-08-2003 15:18:31.855490Take Timestamp Information (TIMESTAMP) = ON 06-08-2003 15:04:21.000041Unit of Work Information (UOW) = ON 06-08-2003 15:18:31.855493
List the active monitor switches for the DB2 Command window session:
db2 get monitor switches
Monitor Recording Switches
Switch list for db partition number 0Buffer Pool Activity Information (BUFFERPOOL) = ON 06-08-2003 15:18:31.855462Lock Information (LOCK) = ON 06-08-2003 15:18:31.855479Sorting Information (SORT) = ON 06-08-2003 15:18:31.855483SQL Statement Information (STATEMENT) = ON 06-08-2003 15:18:31.855486Table Activity Information (TABLE) = ON 06-08-2003 15:18:31.855490Take Timestamp Information (TIMESTAMP) = ON 06-08-2003 15:04:21.000041Unit of Work Information (UOW) = ON 06-08-2003 15:18:31.855493
Now all of the available SNAPSHOT monitor statistics are available for use in the performance analysis.
__ 3. Use the MULTI application to generate one minute of update transactions. The application SQLTP1ST will be used for the first test. This application updates one row in the ACCT, BRANCH, and TELLER tables and inserts one row into the HISTORY table. Use the ACTIVATE DATABASE command to make sure that the database statistics will be available for analysis.
In the terminal session, issue the commands:
cd $HOME/bin
db2 activate database tp1 db2 connect to tp1
Start a second terminal session for running the MULTI application and issue the following commands:
Course materials may not be reproduced in whole or in part without the prior written permission of IBM.
© Copyright IBM Corp. 2001, 2006 Exercise 1. Database Performance and Monitoring 1-3
Student Exercises
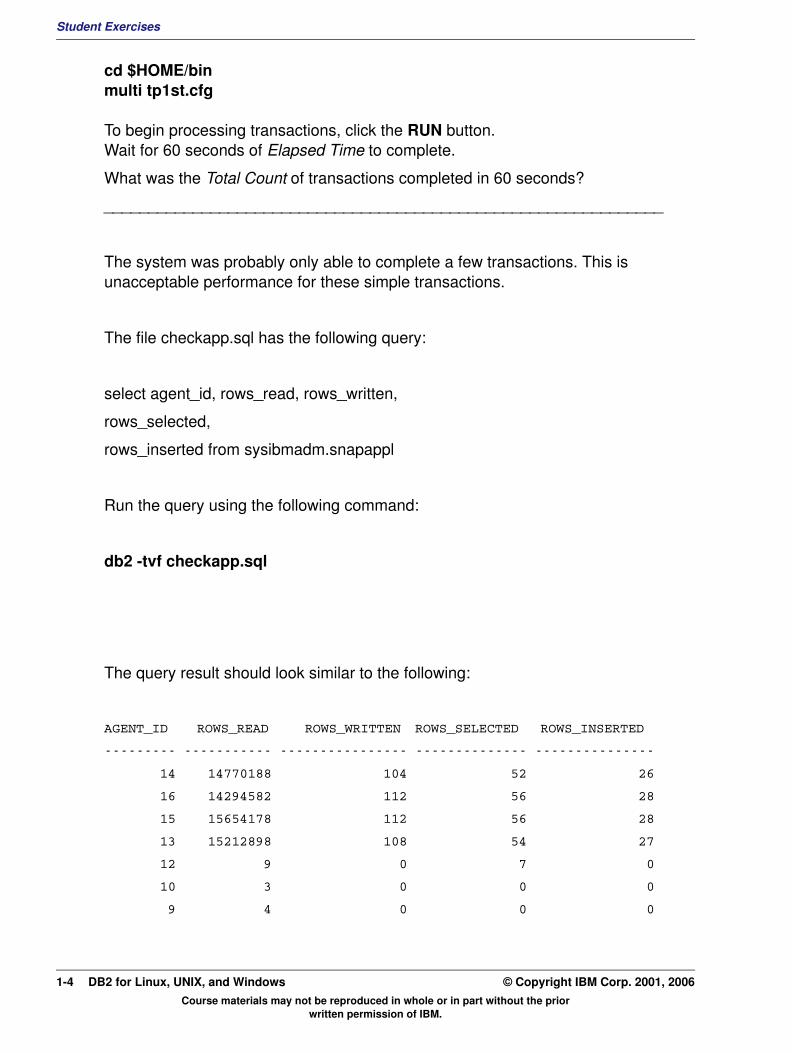
cd $HOME/bin multi tp1st.cfg
To begin processing transactions, click the RUN button. Wait for 60 seconds of Elapsed Time to complete.
What was the Total Count of transactions completed in 60 seconds?
_______________________________________________________________
The system was probably only able to complete a few transactions. This is unacceptable performance for these simple transactions.
The file checkapp.sql has the following query:
select agent_id, rows_read, rows_written,
rows_selected,
rows_inserted from sysibmadm.snapappl
Run the query using the following command:
db2 -tvf checkapp.sql
The query result should look similar to the following:
AGENT_ID ROWS_READ ROWS_WRITTEN ROWS_SELECTED ROWS_INSERTED
--------- ----------- ---------------- -------------- ---------------
14 14770188 104 52 26
16 14294582 112 56 28
15 15654178 112 56 28
13 15212898 108 54 27
12 9 0 7 0
10 3 0 0 0
9 4 0 0 0
Course materials may not be reproduced in whole or in part without the prior written permission of IBM.
1-4 DB2 for Linux, UNIX, and Windows © Copyright IBM Corp. 2001, 2006
Student ExercisesV3.1.0.1
EXempty
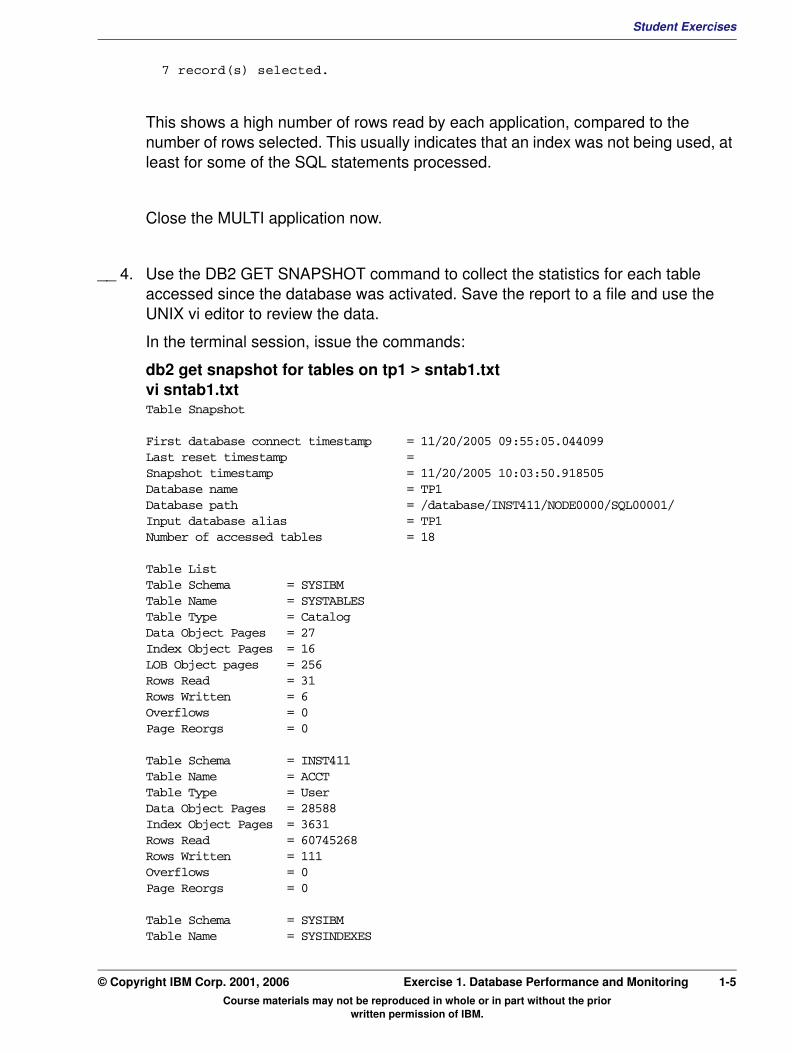
7 record(s) selected.This shows a high number of rows read by each application, compared to the number of rows selected. This usually indicates that an index was not being used, at least for some of the SQL statements processed.
Close the MULTI application now.
__ 4. Use the DB2 GET SNAPSHOT command to collect the statistics for each table accessed since the database was activated. Save the report to a file and use the UNIX vi editor to review the data.
In the terminal session, issue the commands:
db2 get snapshot for tables on tp1 > sntab1.txt vi sntab1.txt Table Snapshot
First database connect timestamp = 11/20/2005 09:55:05.044099Last reset timestamp =Snapshot timestamp = 11/20/2005 10:03:50.918505Database name = TP1Database path = /database/INST411/NODE0000/SQL00001/Input database alias = TP1Number of accessed tables = 18
Table ListTable Schema = SYSIBMTable Name = SYSTABLESTable Type = CatalogData Object Pages = 27Index Object Pages = 16LOB Object pages = 256Rows Read = 31Rows Written = 6Overflows = 0Page Reorgs = 0
Table Schema = INST411Table Name = ACCTTable Type = UserData Object Pages = 28588Index Object Pages = 3631Rows Read = 60745268Rows Written = 111Overflows = 0Page Reorgs = 0
Table Schema = SYSIBMTable Name = SYSINDEXES
Course materials may not be reproduced in whole or in part without the prior written permission of IBM.
© Copyright IBM Corp. 2001, 2006 Exercise 1. Database Performance and Monitoring 1-5
Student Exercises
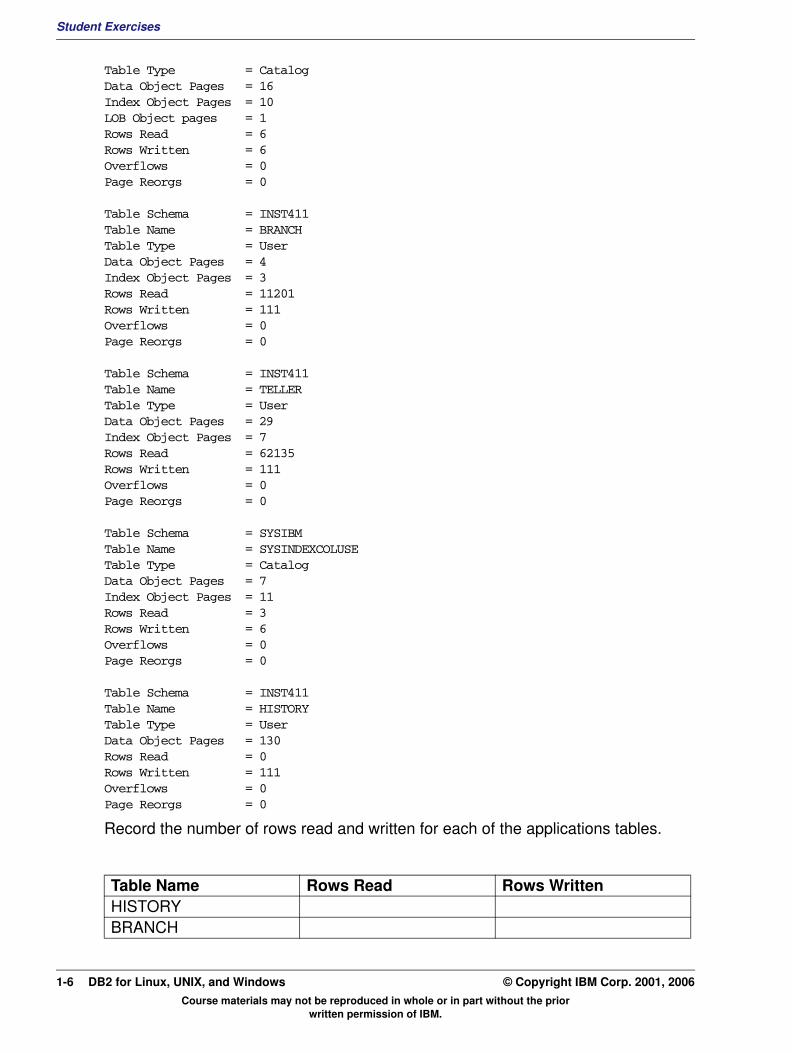
Table Type = CatalogData Object Pages = 16Index Object Pages = 10LOB Object pages = 1Rows Read = 6Rows Written = 6Overflows = 0Page Reorgs = 0
Table Schema = INST411Table Name = BRANCHTable Type = UserData Object Pages = 4Index Object Pages = 3Rows Read = 11201Rows Written = 111Overflows = 0Page Reorgs = 0
Table Schema = INST411Table Name = TELLERTable Type = UserData Object Pages = 29Index Object Pages = 7Rows Read = 62135Rows Written = 111Overflows = 0Page Reorgs = 0
Table Schema = SYSIBMTable Name = SYSINDEXCOLUSETable Type = CatalogData Object Pages = 7Index Object Pages = 11Rows Read = 3Rows Written = 6Overflows = 0Page Reorgs = 0
Table Schema = INST411Table Name = HISTORYTable Type = UserData Object Pages = 130Rows Read = 0Rows Written = 111Overflows = 0Page Reorgs = 0
Record the number of rows read and written for each of the applications tables.
Table Name Rows Read Rows WrittenHISTORYBRANCH
Course materials may not be reproduced in whole or in part without the prior written permission of IBM.
1-6 DB2 for Linux, UNIX, and Windows © Copyright IBM Corp. 2001, 2006
Student ExercisesV3.1.0.1
EXempty
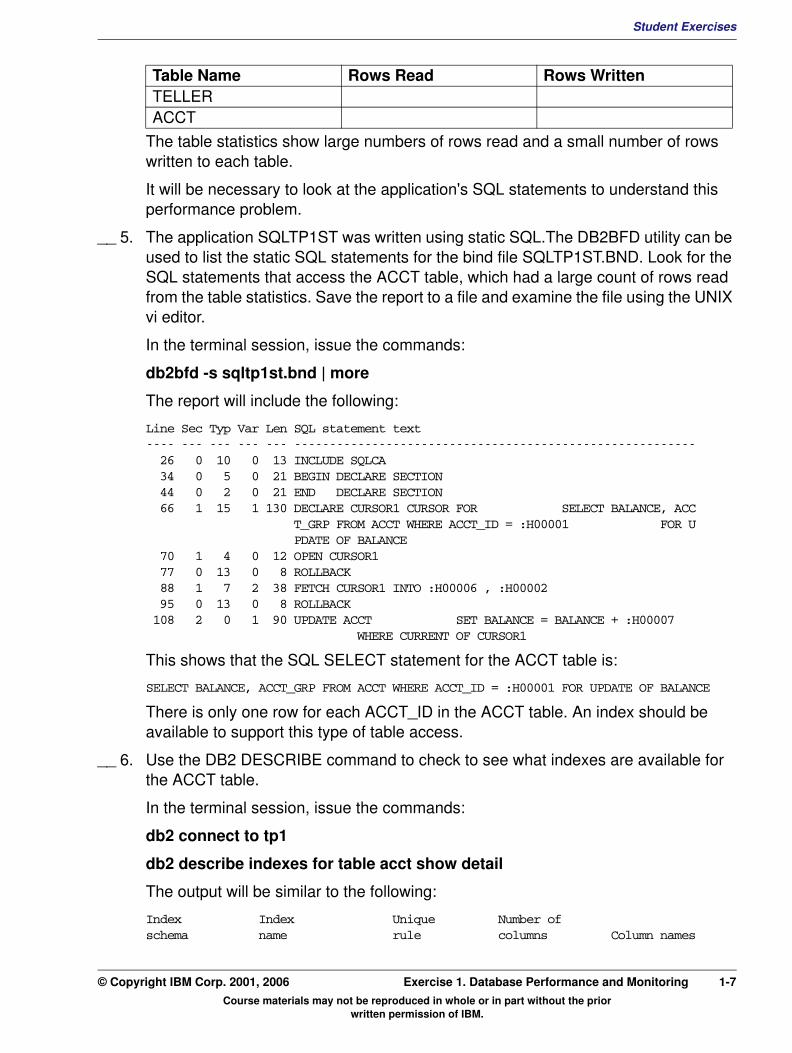
The table statistics show large numbers of rows read and a small number of rows written to each table.
It will be necessary to look at the application's SQL statements to understand this performance problem.
__ 5. The application SQLTP1ST was written using static SQL.The DB2BFD utility can be used to list the static SQL statements for the bind file SQLTP1ST.BND. Look for the SQL statements that access the ACCT table, which had a large count of rows read from the table statistics. Save the report to a file and examine the file using the UNIX vi editor.
In the terminal session, issue the commands:
db2bfd -s sqltp1st.bnd | more
The report will include the following:
Line Sec Typ Var Len SQL statement text---- --- --- --- --- --------------------------------------------------------- 26 0 10 0 13 INCLUDE SQLCA 34 0 5 0 21 BEGIN DECLARE SECTION 44 0 2 0 21 END DECLARE SECTION 66 1 15 1 130 DECLARE CURSOR1 CURSOR FOR SELECT BALANCE, ACC T_GRP FROM ACCT WHERE ACCT_ID = :H00001 FOR U PDATE OF BALANCE 70 1 4 0 12 OPEN CURSOR1 77 0 13 0 8 ROLLBACK 88 1 7 2 38 FETCH CURSOR1 INTO :H00006 , :H00002 95 0 13 0 8 ROLLBACK 108 2 0 1 90 UPDATE ACCT SET BALANCE = BALANCE + :H00007 WHERE CURRENT OF CURSOR1
This shows that the SQL SELECT statement for the ACCT table is:
SELECT BALANCE, ACCT_GRP FROM ACCT WHERE ACCT_ID = :H00001 FOR UPDATE OF BALANCE
There is only one row for each ACCT_ID in the ACCT table. An index should be available to support this type of table access.
__ 6. Use the DB2 DESCRIBE command to check to see what indexes are available for the ACCT table.
In the terminal session, issue the commands:
db2 connect to tp1
db2 describe indexes for table acct show detail
The output will be similar to the following:
Index Index Unique Number of schema name rule columns Column names
TELLERACCT
Table Name Rows Read Rows Written
Course materials may not be reproduced in whole or in part without the prior written permission of IBM.
© Copyright IBM Corp. 2001, 2006 Exercise 1. Database Performance and Monitoring 1-7
Student Exercises
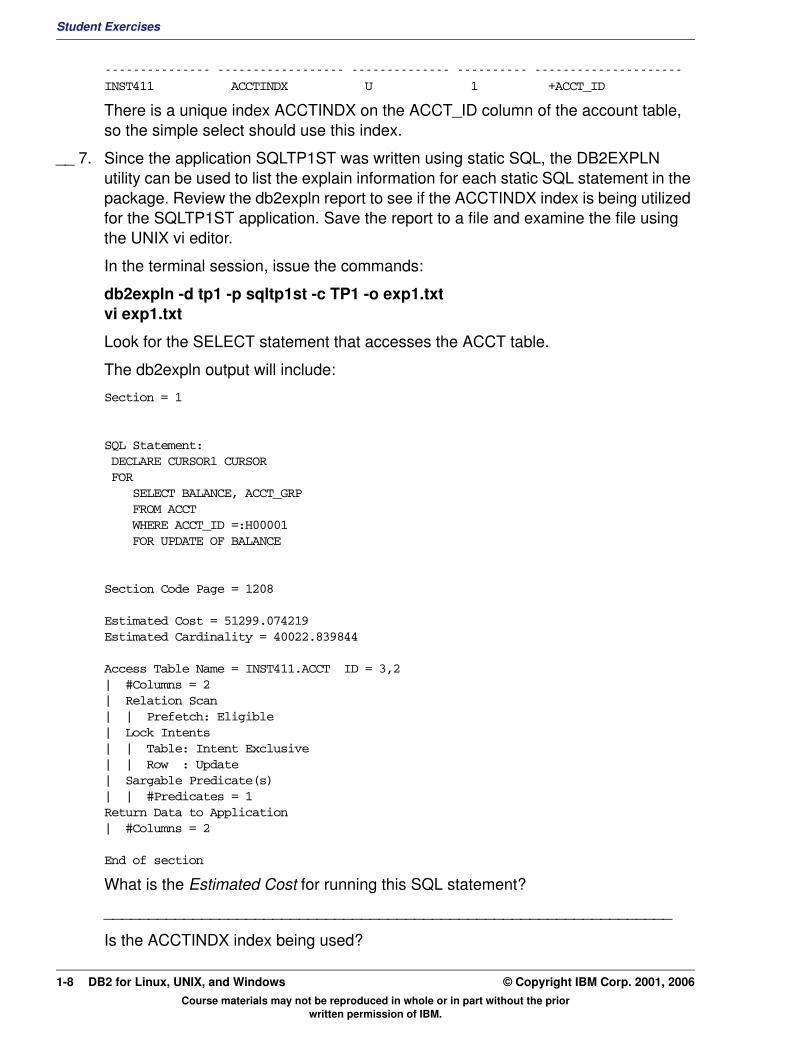
--------------- ------------------ -------------- ---------- ---------------------INST411 ACCTINDX U 1 +ACCT_ID
There is a unique index ACCTINDX on the ACCT_ID column of the account table, so the simple select should use this index.
__ 7. Since the application SQLTP1ST was written using static SQL, the DB2EXPLN utility can be used to list the explain information for each static SQL statement in the package. Review the db2expln report to see if the ACCTINDX index is being utilized for the SQLTP1ST application. Save the report to a file and examine the file using the UNIX vi editor.
In the terminal session, issue the commands:
db2expln -d tp1 -p sqltp1st -c TP1 -o exp1.txt vi exp1.txt
Look for the SELECT statement that accesses the ACCT table.
The db2expln output will include:
Section = 1
SQL Statement: DECLARE CURSOR1 CURSOR FOR SELECT BALANCE, ACCT_GRP FROM ACCT WHERE ACCT_ID =:H00001 FOR UPDATE OF BALANCE
Section Code Page = 1208
Estimated Cost = 51299.074219Estimated Cardinality = 40022.839844
Access Table Name = INST411.ACCT ID = 3,2| #Columns = 2| Relation Scan| | Prefetch: Eligible| Lock Intents| | Table: Intent Exclusive| | Row : Update| Sargable Predicate(s)| | #Predicates = 1Return Data to Application| #Columns = 2
End of section
What is the Estimated Cost for running this SQL statement?
________________________________________________________________
Is the ACCTINDX index being used?
Course materials may not be reproduced in whole or in part without the prior written permission of IBM.
1-8 DB2 for Linux, UNIX, and Windows © Copyright IBM Corp. 2001, 2006

Student ExercisesV3.1.0.1
EXempty
________________________________________________________________The table ACCT was accessed using a relational scan. This is the primary reason that the application performance is poor.
__ 8. The DBA that created the database and set up the application remembered that the indexes were created AFTER the BINDs were done for the applications, including SQLTP1ST. Rebind the applications now that the indexes have been created for the tables and check to see if the new package uses the existing indexes. A command file, TP1BIND contains all the necessary BIND commands.
In the terminal session, issue the commands:
db2 connect to tp1
First collect the current statistics:
tp1stats
db2 -tvf tp1bind
The DB2EXPLN utility can be used to check the revised explain information for the SQLTP1ST package. Review the db2expln report to see if the ACCTINDX index is being utilized for the SQLTP1ST application. Save the report to a file and examine the file using the UNIX vi editor.
Check the same SELECT statement from the ACCT table.
In the terminal session, issue the commands:
db2expln -d tp1 -p sqltp1st -c TP1 -o exp2.txt vi exp2.txt
The db2expln output will include:
Section = 1
SQL Statement: DECLARE CURSOR1 CURSOR FOR SELECT BALANCE, ACCT_GRP FROM ACCT WHERE ACCT_ID =:H00001 FOR UPDATE OF BALANCE
Section Code Page = 1208
Estimated Cost = 38.581802Estimated Cardinality = 1.000000
Access Table Name = INST411.ACCT ID = 3,2| Index Scan: Name = INST411.ACCTINDX ID = 1| | Regular Index (Not Clustered)
Course materials may not be reproduced in whole or in part without the prior written permission of IBM.
© Copyright IBM Corp. 2001, 2006 Exercise 1. Database Performance and Monitoring 1-9
Student Exercises
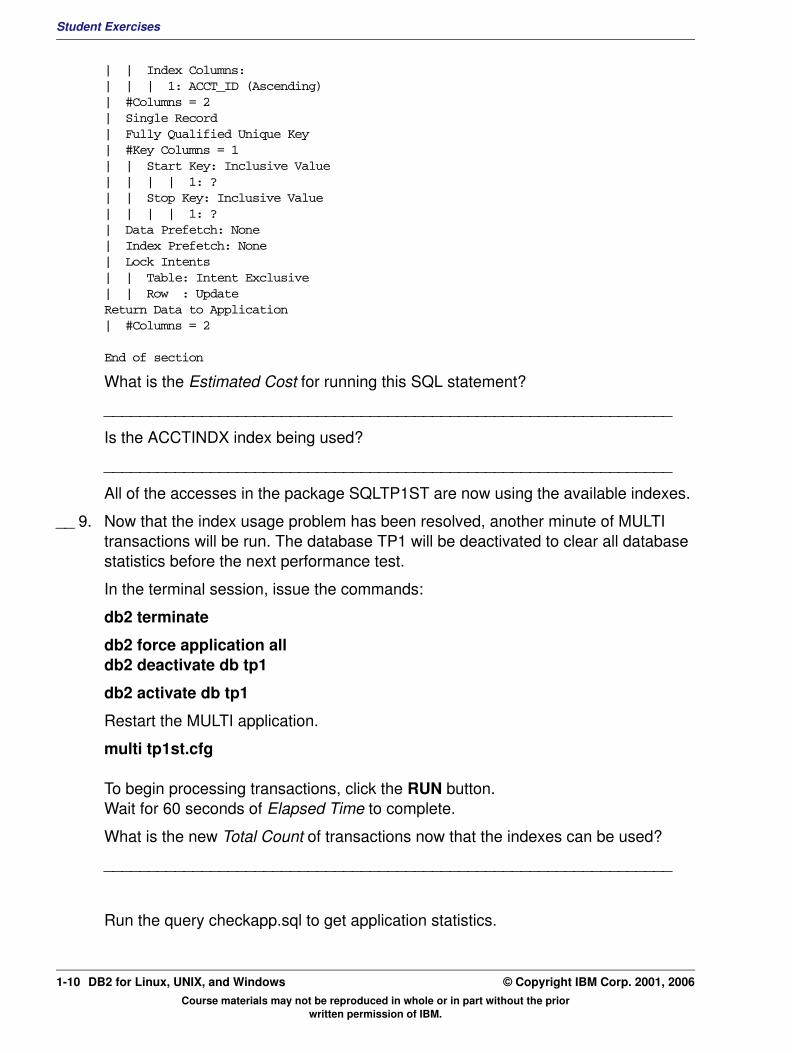
| | Index Columns:| | | 1: ACCT_ID (Ascending)| #Columns = 2| Single Record| Fully Qualified Unique Key| #Key Columns = 1| | Start Key: Inclusive Value| | | | 1: ?| | Stop Key: Inclusive Value| | | | 1: ?| Data Prefetch: None| Index Prefetch: None| Lock Intents| | Table: Intent Exclusive| | Row : UpdateReturn Data to Application| #Columns = 2
End of section
What is the Estimated Cost for running this SQL statement?
________________________________________________________________
Is the ACCTINDX index being used?
________________________________________________________________
All of the accesses in the package SQLTP1ST are now using the available indexes.
__ 9. Now that the index usage problem has been resolved, another minute of MULTI transactions will be run. The database TP1 will be deactivated to clear all database statistics before the next performance test.
In the terminal session, issue the commands:
db2 terminate
db2 force application all db2 deactivate db tp1
db2 activate db tp1
Restart the MULTI application.
multi tp1st.cfg
To begin processing transactions, click the RUN button. Wait for 60 seconds of Elapsed Time to complete.
What is the new Total Count of transactions now that the indexes can be used?
________________________________________________________________
Run the query checkapp.sql to get application statistics.
Course materials may not be reproduced in whole or in part without the prior written permission of IBM.
1-10 DB2 for Linux, UNIX, and Windows © Copyright IBM Corp. 2001, 2006
Student ExercisesV3.1.0.1
EXempty
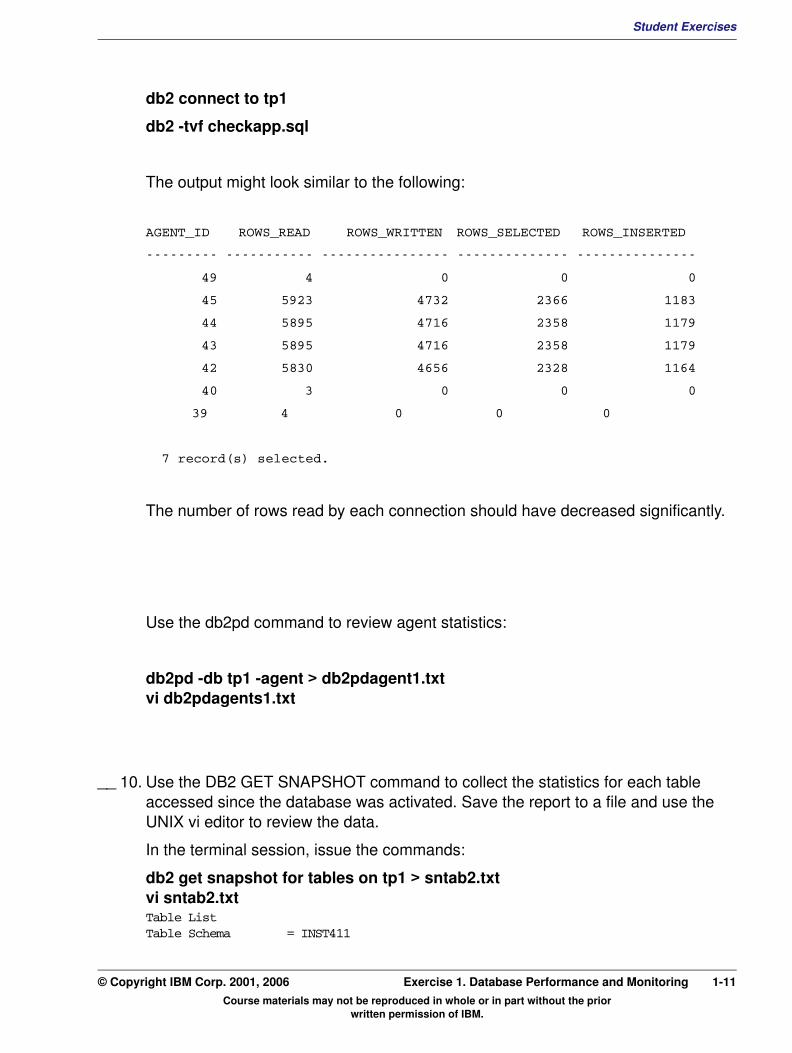
db2 connect to tp1
db2 -tvf checkapp.sql
The output might look similar to the following:
AGENT_ID ROWS_READ ROWS_WRITTEN ROWS_SELECTED ROWS_INSERTED
--------- ----------- ---------------- -------------- ---------------
49 4 0 0 0
45 5923 4732 2366 1183
44 5895 4716 2358 1179
43 5895 4716 2358 1179
42 5830 4656 2328 1164
40 3 0 0 0
39 4 0 0 0
7 record(s) selected.
The number of rows read by each connection should have decreased significantly.
Use the db2pd command to review agent statistics:
db2pd -db tp1 -agent > db2pdagent1.txt vi db2pdagents1.txt
__ 10. Use the DB2 GET SNAPSHOT command to collect the statistics for each table accessed since the database was activated. Save the report to a file and use the UNIX vi editor to review the data.
In the terminal session, issue the commands:
db2 get snapshot for tables on tp1 > sntab2.txt vi sntab2.txt Table ListTable Schema = INST411
Course materials may not be reproduced in whole or in part without the prior written permission of IBM.
© Copyright IBM Corp. 2001, 2006 Exercise 1. Database Performance and Monitoring 1-11
Student Exercises
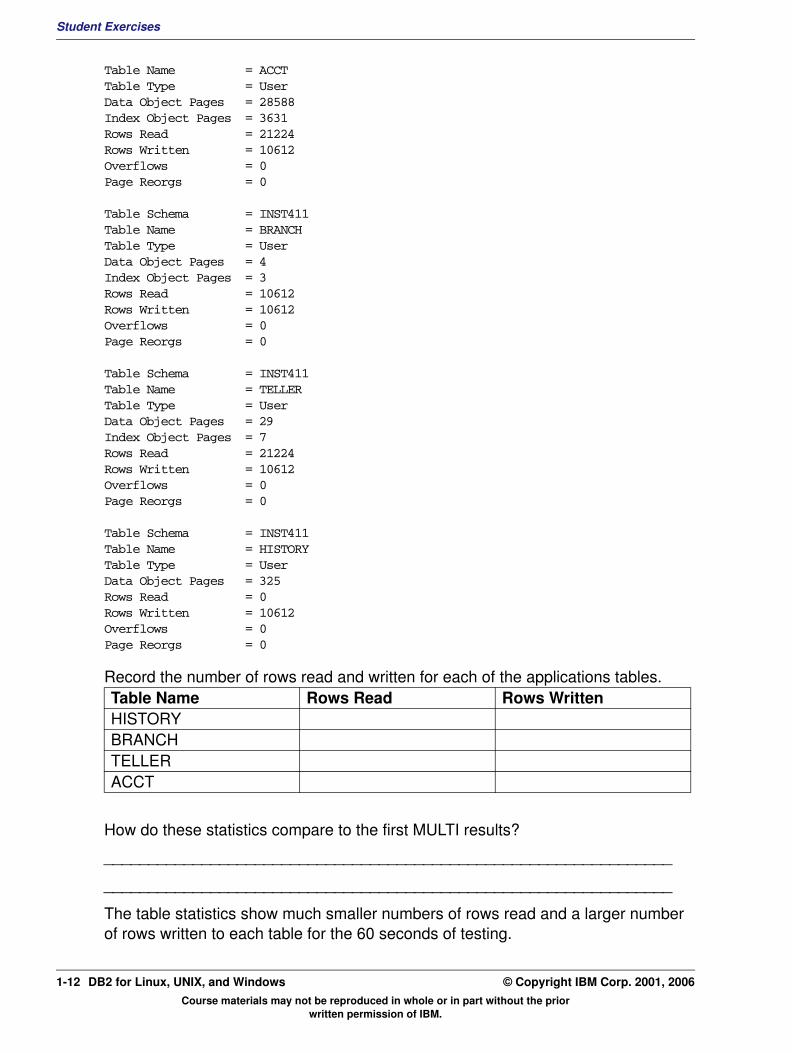
Table Name = ACCTTable Type = UserData Object Pages = 28588Index Object Pages = 3631Rows Read = 21224Rows Written = 10612Overflows = 0Page Reorgs = 0
Table Schema = INST411Table Name = BRANCHTable Type = UserData Object Pages = 4Index Object Pages = 3Rows Read = 10612Rows Written = 10612Overflows = 0Page Reorgs = 0
Table Schema = INST411Table Name = TELLERTable Type = UserData Object Pages = 29Index Object Pages = 7Rows Read = 21224Rows Written = 10612Overflows = 0Page Reorgs = 0
Table Schema = INST411Table Name = HISTORYTable Type = UserData Object Pages = 325Rows Read = 0Rows Written = 10612Overflows = 0Page Reorgs = 0
Record the number of rows read and written for each of the applications tables.
How do these statistics compare to the first MULTI results?
________________________________________________________________
________________________________________________________________
The table statistics show much smaller numbers of rows read and a larger number of rows written to each table for the 60 seconds of testing.
Table Name Rows Read Rows WrittenHISTORYBRANCHTELLERACCT
Course materials may not be reproduced in whole or in part without the prior written permission of IBM.
1-12 DB2 for Linux, UNIX, and Windows © Copyright IBM Corp. 2001, 2006

Student ExercisesV3.1.0.1
EXempty
__ 11. The SNAPSHOT statistics for tables can be retrieved with a SQL SELECT using the SNAPSHOT_TABLE function provided by DB2. Create a query to retrieve the table statistics from the TP1 database. The DESCRIBE statement can be used to get the column names so that the query can request specific performance elements.
In the terminal session, issue the commands:
db2 connect to tp1 db2 "describe select * from table(snap_get_tab_v91('tp1',-1)) as tab1"
The output will look like:
SQLDA Information
sqldaid : SQLDA sqldabc: 896 sqln: 20 sqld: 17
Column Information
sqltype sqllen sqlname.data sqlname.length
-------------------- ------ ------------------------------ --------------
393 TIMESTAMP 26 SNAPSHOT_TIMESTAMP 18
449 VARCHAR 128 TABSCHEMA 9
449 VARCHAR 128 TABNAME 7
493 BIGINT 8 TAB_FILE_ID 11
449 VARCHAR 14 TAB_TYPE 8
493 BIGINT 8 DATA_OBJECT_PAGES 17
493 BIGINT 8 INDEX_OBJECT_PAGES 18
493 BIGINT 8 LOB_OBJECT_PAGES 16
493 BIGINT 8 LONG_OBJECT_PAGES 17
493 BIGINT 8 XDA_OBJECT_PAGES 16
493 BIGINT 8 ROWS_READ 9
493 BIGINT 8 ROWS_WRITTEN 12
493 BIGINT 8 OVERFLOW_ACCESSES 17
493 BIGINT 8 PAGE_REORGS 11
501 SMALLINT 2 DBPARTITIONNUM 14
493 BIGINT 8 TBSP_ID 7
497 INTEGER 4 DATA_PARTITION_ID 17
Use a SQL statement to retrieve the table names, and the counts for rows read and written.
db2 " select tabname, rows_read, rows_written from table(snap_get_tab_v91('tp1',-1)) as tab1 where tabschema = user "
The output will look similar to this:
TABNAME ROWS_READ ROWS_WRITTEN
Course materials may not be reproduced in whole or in part without the prior written permission of IBM.
© Copyright IBM Corp. 2001, 2006 Exercise 1. Database Performance and Monitoring 1-13
Student Exercises
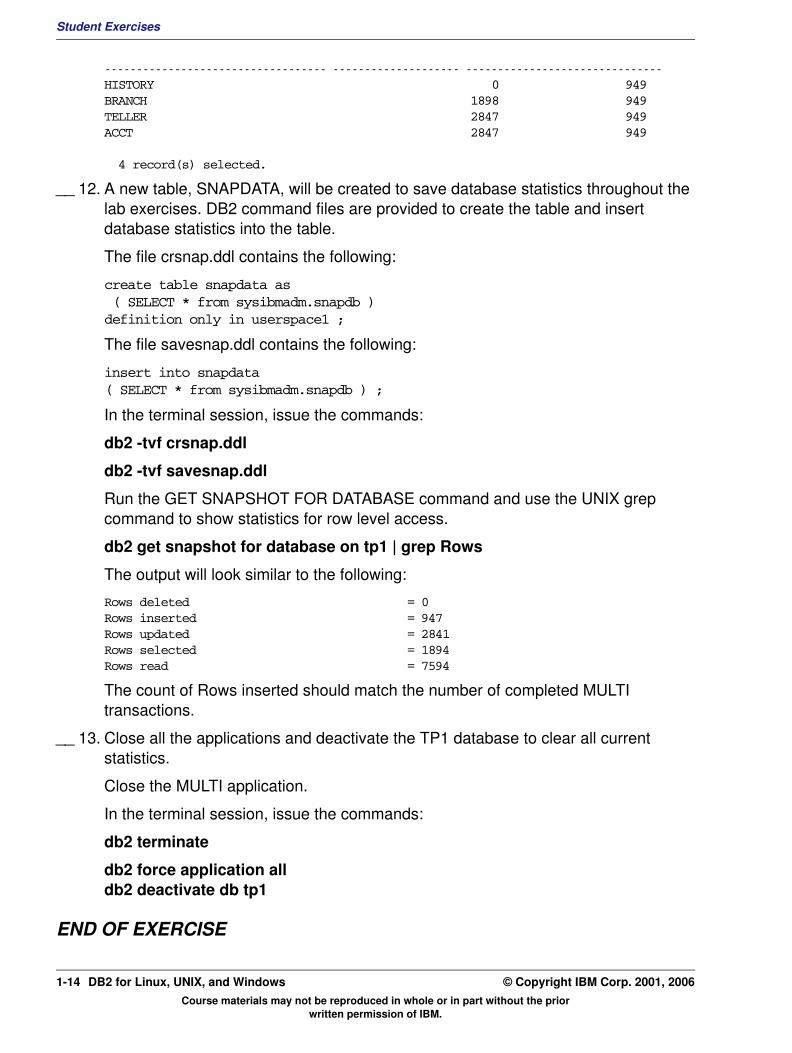
----------------------------------- -------------------- -------------------------------HISTORY 0 949BRANCH 1898 949TELLER 2847 949ACCT 2847 949
4 record(s) selected.
__ 12. A new table, SNAPDATA, will be created to save database statistics throughout the lab exercises. DB2 command files are provided to create the table and insert database statistics into the table.
The file crsnap.ddl contains the following:
create table snapdata as( SELECT * from sysibmadm.snapdb )definition only in userspace1 ;
The file savesnap.ddl contains the following:
insert into snapdata( SELECT * from sysibmadm.snapdb ) ;
In the terminal session, issue the commands:
db2 -tvf crsnap.ddl
db2 -tvf savesnap.ddl
Run the GET SNAPSHOT FOR DATABASE command and use the UNIX grep command to show statistics for row level access.
db2 get snapshot for database on tp1 | grep Rows
The output will look similar to the following:
Rows deleted = 0Rows inserted = 947Rows updated = 2841Rows selected = 1894Rows read = 7594
The count of Rows inserted should match the number of completed MULTI transactions.
__ 13. Close all the applications and deactivate the TP1 database to clear all current statistics.
Close the MULTI application.
In the terminal session, issue the commands:
db2 terminate
db2 force application all db2 deactivate db tp1
END OF EXERCISE
Course materials may not be reproduced in whole or in part without the prior written permission of IBM.
1-14 DB2 for Linux, UNIX, and Windows © Copyright IBM Corp. 2001, 2006

Student ExercisesV3.1.0.1
EXempty
Exercise 2. Tablespace and I/O PerformanceWhat This Exercise Is About
This exercise is an online lab which allows the student to begin analyzing the database performance characteristics for an application. The impact of increased bufferpool size, using separate data and index DMS tablespaces and implementing row compression will be measured.
What You Should Be Able to Do
At the end of the lab, you should be able to:
• Use DB2 GET SNAPSHOT commands and SQL queries to collect database statistics for analysis of database I/O performance.
• Implement multiple DMS table spaces to separate the data and index components.
• Plan and implement Row Compression to reduce I/O costs and improve buffer pool efficiency.
Course materials may not be reproduced in whole or in part without the prior written permission of IBM.
© Copyright IBM Corp. 2001, 2006 Exercise 2. Tablespace and I/O Performance 2-1
Student Exercises
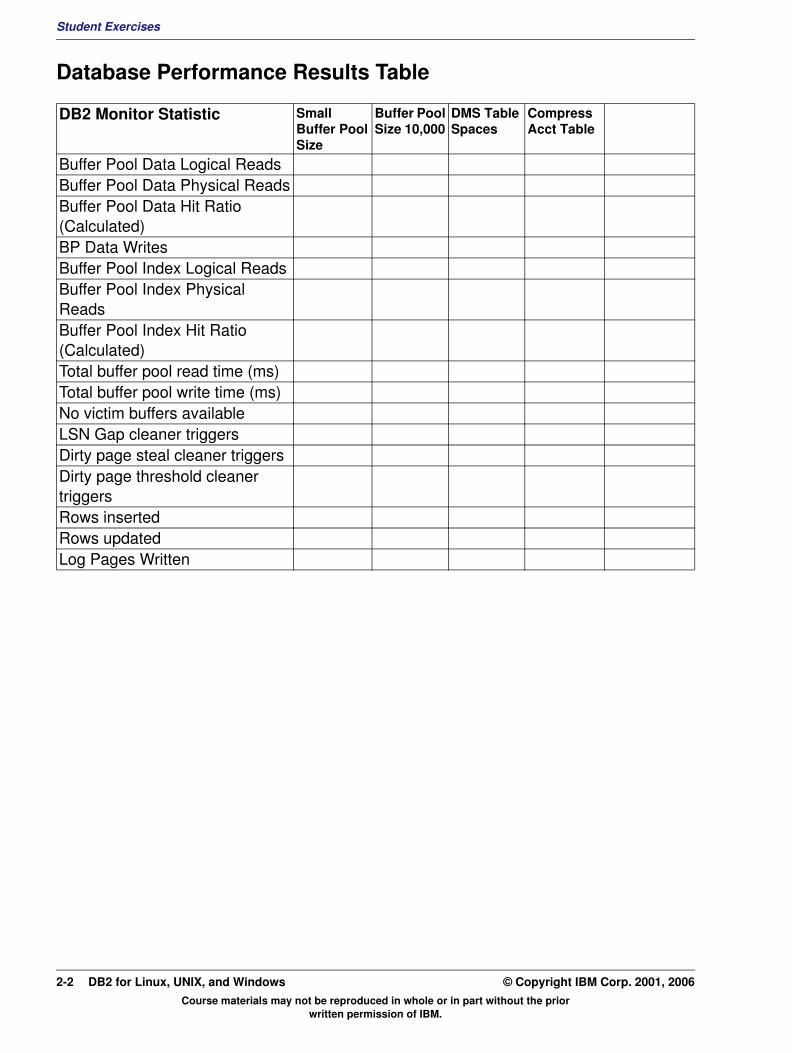
Database Performance Results Table
DB2 Monitor Statistic Small Buffer Pool Size
Buffer Pool Size 10,000
DMS Table Spaces
Compress Acct Table
Buffer Pool Data Logical ReadsBuffer Pool Data Physical ReadsBuffer Pool Data Hit Ratio (Calculated)BP Data WritesBuffer Pool Index Logical ReadsBuffer Pool Index Physical ReadsBuffer Pool Index Hit Ratio (Calculated)Total buffer pool read time (ms)Total buffer pool write time (ms)No victim buffers availableLSN Gap cleaner triggersDirty page steal cleaner triggersDirty page threshold cleaner triggersRows insertedRows updatedLog Pages Written
Course materials may not be reproduced in whole or in part without the prior written permission of IBM.
2-2 DB2 for Linux, UNIX, and Windows © Copyright IBM Corp. 2001, 2006
Student ExercisesV3.1.0.1
EXempty
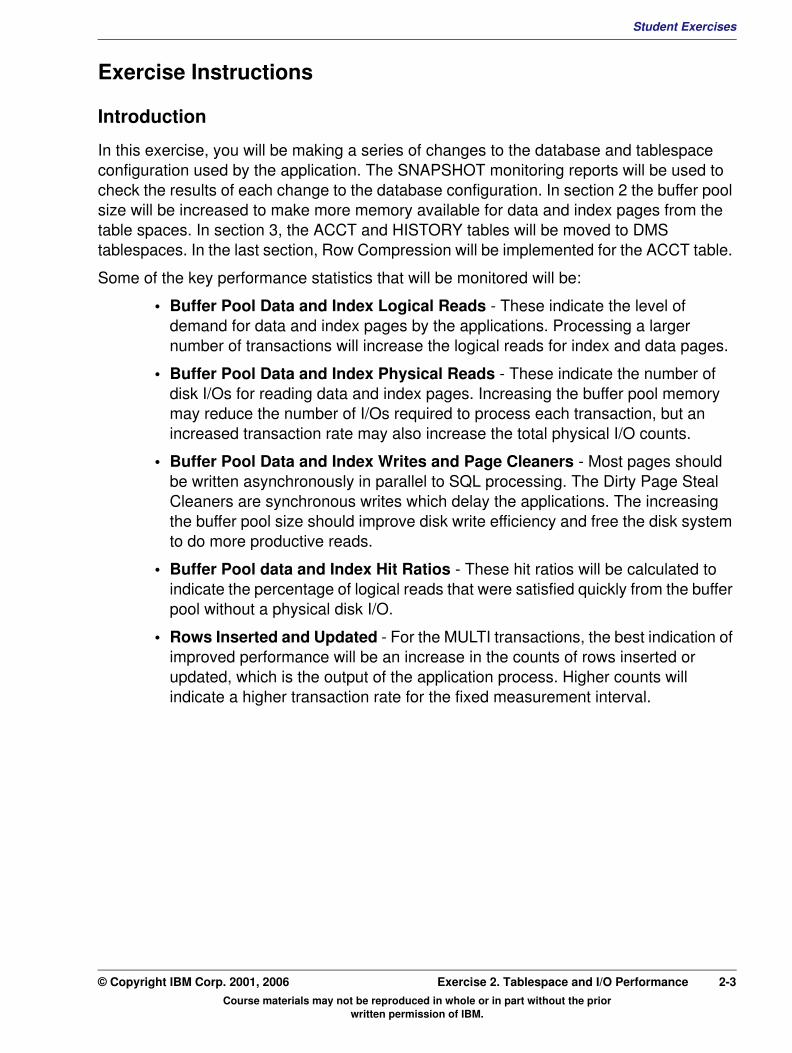
Exercise InstructionsIntroduction
In this exercise, you will be making a series of changes to the database and tablespace configuration used by the application. The SNAPSHOT monitoring reports will be used to check the results of each change to the database configuration. In section 2 the buffer pool size will be increased to make more memory available for data and index pages from the table spaces. In section 3, the ACCT and HISTORY tables will be moved to DMS tablespaces. In the last section, Row Compression will be implemented for the ACCT table.
Some of the key performance statistics that will be monitored will be:
• Buffer Pool Data and Index Logical Reads - These indicate the level of demand for data and index pages by the applications. Processing a larger number of transactions will increase the logical reads for index and data pages.
• Buffer Pool Data and Index Physical Reads - These indicate the number of disk I/Os for reading data and index pages. Increasing the buffer pool memory may reduce the number of I/Os required to process each transaction, but an increased transaction rate may also increase the total physical I/O counts.
• Buffer Pool Data and Index Writes and Page Cleaners - Most pages should be written asynchronously in parallel to SQL processing. The Dirty Page Steal Cleaners are synchronous writes which delay the applications. The increasing the buffer pool size should improve disk write efficiency and free the disk system to do more productive reads.
• Buffer Pool data and Index Hit Ratios - These hit ratios will be calculated to indicate the percentage of logical reads that were satisfied quickly from the buffer pool without a physical disk I/O.
• Rows Inserted and Updated - For the MULTI transactions, the best indication of improved performance will be an increase in the counts of rows inserted or updated, which is the output of the application process. Higher counts will indicate a higher transaction rate for the fixed measurement interval.
Course materials may not be reproduced in whole or in part without the prior written permission of IBM.
© Copyright IBM Corp. 2001, 2006 Exercise 2. Tablespace and I/O Performance 2-3
Student Exercises
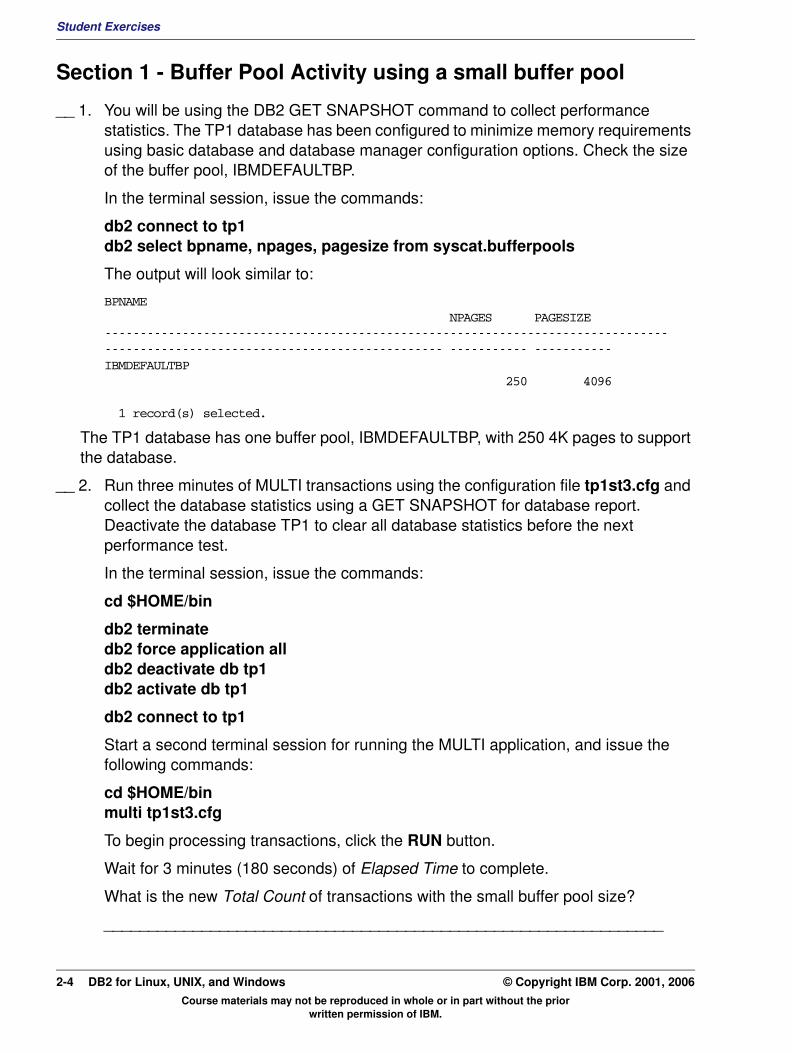
Section 1 - Buffer Pool Activity using a small buffer pool
__ 1. You will be using the DB2 GET SNAPSHOT command to collect performance statistics. The TP1 database has been configured to minimize memory requirements using basic database and database manager configuration options. Check the size of the buffer pool, IBMDEFAULTBP.
In the terminal session, issue the commands:
db2 connect to tp1 db2 select bpname, npages, pagesize from syscat.bufferpools
The output will look similar to:
BPNAME NPAGES PAGESIZE-------------------------------------------------------------------------------------------------------------------------------- ----------- -----------IBMDEFAULTBP 250 4096
1 record(s) selected.
The TP1 database has one buffer pool, IBMDEFAULTBP, with 250 4K pages to support the database.
__ 2. Run three minutes of MULTI transactions using the configuration file tp1st3.cfg and collect the database statistics using a GET SNAPSHOT for database report. Deactivate the database TP1 to clear all database statistics before the next performance test.
In the terminal session, issue the commands:
cd $HOME/bin
db2 terminate db2 force application all db2 deactivate db tp1 db2 activate db tp1
db2 connect to tp1
Start a second terminal session for running the MULTI application, and issue the following commands:
cd $HOME/bin multi tp1st3.cfg
To begin processing transactions, click the RUN button.
Wait for 3 minutes (180 seconds) of Elapsed Time to complete.
What is the new Total Count of transactions with the small buffer pool size?
_______________________________________________________________
Course materials may not be reproduced in whole or in part without the prior written permission of IBM.
2-4 DB2 for Linux, UNIX, and Windows © Copyright IBM Corp. 2001, 2006
Student ExercisesV3.1.0.1
EXempty
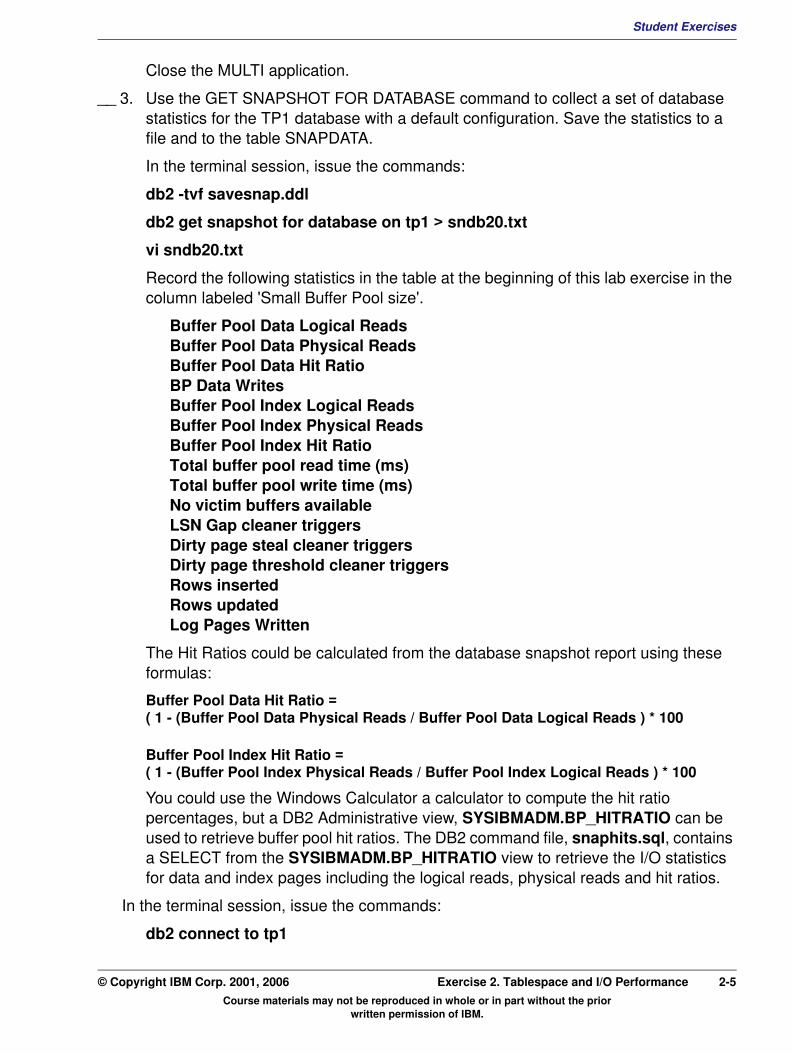
Close the MULTI application.__ 3. Use the GET SNAPSHOT FOR DATABASE command to collect a set of database statistics for the TP1 database with a default configuration. Save the statistics to a file and to the table SNAPDATA.
In the terminal session, issue the commands:
db2 -tvf savesnap.ddl
db2 get snapshot for database on tp1 > sndb20.txt
vi sndb20.txt
Record the following statistics in the table at the beginning of this lab exercise in the column labeled 'Small Buffer Pool size'.
Buffer Pool Data Logical Reads Buffer Pool Data Physical Reads Buffer Pool Data Hit Ratio BP Data Writes Buffer Pool Index Logical Reads Buffer Pool Index Physical Reads Buffer Pool Index Hit Ratio Total buffer pool read time (ms) Total buffer pool write time (ms) No victim buffers available LSN Gap cleaner triggers Dirty page steal cleaner triggers Dirty page threshold cleaner triggers Rows inserted Rows updated Log Pages Written
The Hit Ratios could be calculated from the database snapshot report using these formulas:
Buffer Pool Data Hit Ratio = ( 1 - (Buffer Pool Data Physical Reads / Buffer Pool Data Logical Reads ) * 100
Buffer Pool Index Hit Ratio = ( 1 - (Buffer Pool Index Physical Reads / Buffer Pool Index Logical Reads ) * 100
You could use the Windows Calculator a calculator to compute the hit ratio percentages, but a DB2 Administrative view, SYSIBMADM.BP_HITRATIO can be used to retrieve buffer pool hit ratios. The DB2 command file, snaphits.sql, contains a SELECT from the SYSIBMADM.BP_HITRATIO view to retrieve the I/O statistics for data and index pages including the logical reads, physical reads and hit ratios.
In the terminal session, issue the commands:
db2 connect to tp1
Course materials may not be reproduced in whole or in part without the prior written permission of IBM.
© Copyright IBM Corp. 2001, 2006 Exercise 2. Tablespace and I/O Performance 2-5

Student Exercises
cat snaphits.sql
The output will look similar to:
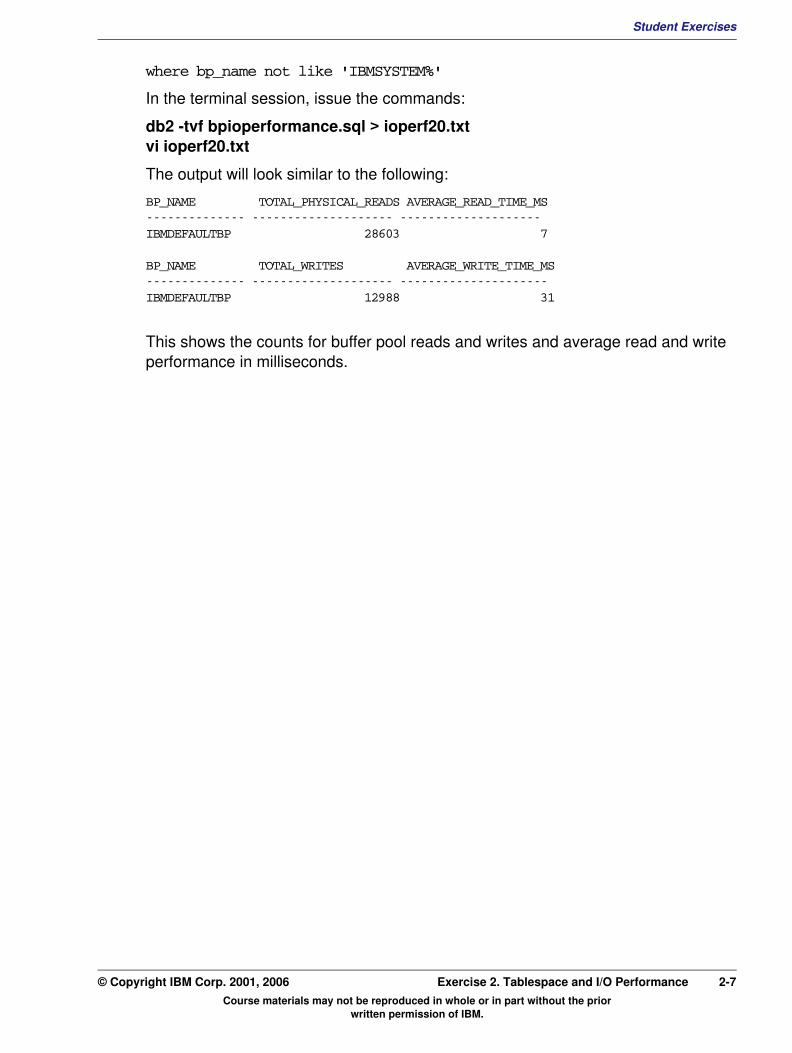
SELECT data_physical_reads, index_physical_reads, total_physical_reads, bp_name from sysibmadm.bp_hitratio where bp_name not like 'IBMSYSTEM%'
SELECT data_logical_reads, index_logical_reads, total_logical_reads, bp_name from sysibmadm.bp_hitratio where bp_name not like 'IBMSYSTEM%'
SELECT data_hit_ratio_percent, index_hit_ratio_percent ,total_hit_ratio_percent, bp_name from sysibmadm.bp_hitratio where bp_name not like 'IBMSYSTEM%'
Run the DB2 command file, snaphits.sql, and record the results in the table at the beginning of this exercise.
db2 -tf snaphits.sql
The output will have the following format:
DATA_PHYSICAL_READS INDEX_PHYSICAL_READS TOTAL_PHYSICAL_READS BP_NAME ------------------- -------------------- -------------------- --------
15867 19584 35451 IBMDEFAULTBP
DATA_LOGICAL_READS INDEX_LOGICAL_READS TOTAL_LOGICAL_READS BP_NAME ------------------- -------------------- -------------------- -----------
131235 86827 218062 IBMDEFAULTBP
DATA_HIT_RATIO_PERCENT INDEX_HIT_RATIO_PERCENT TOTAL_HIT_RATIO_PERCENT BP_NAME --------------------- ----------------------- ----------------------- ---
87.90 77.44 83.74 IBMDEFAULTBP
Record the data and index hit ratios in the Database performance results table.
__ 4. The Administrative views SYSIBMADM.BP_READ_IO and SYSIBMADM.BP_WRITE_IO provide additional buffer pool I/O performance statistics. The command file bpioperformance.sql uses these views to show key I/O performance statistics.
The SQL text is the following:
select substr(bp_name,1,15) as bp_name, total_physical_reads, average_read_time_ms from sysibmadm.bp_read_io where bp_name not like 'IBMSYSTEM%'
select substr(bp_name,1,15) as bp_name, total_writes, average_write_time_ms from sysibmadm.bp_write_io
Course materials may not be reproduced in whole or in part without the prior written permission of IBM.
2-6 DB2 for Linux, UNIX, and Windows © Copyright IBM Corp. 2001, 2006
Student ExercisesV3.1.0.1
EXempty
where bp_name not like 'IBMSYSTEM%'In the terminal session, issue the commands:
db2 -tvf bpioperformance.sql > ioperf20.txt vi ioperf20.txt
The output will look similar to the following:
BP_NAME TOTAL_PHYSICAL_READS AVERAGE_READ_TIME_MS-------------- -------------------- --------------------IBMDEFAULTBP 28603 7
BP_NAME TOTAL_WRITES AVERAGE_WRITE_TIME_MS-------------- -------------------- ---------------------IBMDEFAULTBP 12988 31
This shows the counts for buffer pool reads and writes and average read and write performance in milliseconds.
Course materials may not be reproduced in whole or in part without the prior written permission of IBM.
© Copyright IBM Corp. 2001, 2006 Exercise 2. Tablespace and I/O Performance 2-7

Student Exercises
Section 2 - Buffer Pool Activity with a 10,000 Page Buffer Pool
__ 1. Increase the size of the buffer pool IBMDEFAULTBP to 10,000 pages. Run three minutes of MULTI transactions and collect the database statistics using GET SNAPSHOT for database. Deactivate the database TP1 to clear all database statistics before the next performance test.
In the terminal session, issue the commands:
cd $HOME/bin db2 connect to tp1 db2 alter bufferpool ibmdefaultbp size 10000 db2 terminate
db2 force application all db2 deactivate db tp1 db2 activate db tp1 db2 connect to tp1
Start the MULTI application in a second terminal session using the following commands:
cd $HOME/bin multi tp1st3.cfg
To begin processing transactions, click the RUN button.
Wait for 3 minutes (180 seconds) of Elapsed Time to complete.
Close MULTI now.
__ 2. Use the GET SNAPSHOT FOR DATABASE command to collect a second set of database statistics for the TP1 database with a 10,000 page buffer pool. Save the statistics to a file and the table SNAPDATA.
In the terminal session, issue the commands:
db2 -tvf savesnap.ddl db2 get snapshot for database on tp1 > sndb21.txt
vi sndb21.txt
Record the following statistics in the table at the beginning of this lab exercise in the column labeled Buffer Pool Size 10,000.
Buffer Pool Data Logical Reads Buffer Pool Data Physical Reads Buffer Pool Data Hit Ratio BP Data Writes Buffer Pool Index Logical Reads Buffer Pool Index Physical Reads Buffer Pool Index Hit Ratio
Course materials may not be reproduced in whole or in part without the prior written permission of IBM.
2-8 DB2 for Linux, UNIX, and Windows © Copyright IBM Corp. 2001, 2006

Student ExercisesV3.1.0.1
EXempty
Total buffer pool read time (ms) Total buffer pool write time (ms) No victim buffers available LSN Gap cleaner triggers Dirty page steal cleaner triggers Dirty page threshold cleaner triggers Rows inserted Rows updated Log Pages WrittenRun the DB2 command file snaphits.sql and write the results in the table at the beginning of this exercise.
In the terminal session, issue the commands:
db2 connect to tp1
db2 -tf snaphits.sql
The output will have the following format:
DATA_PHYSICAL_READS INDEX_PHYSICAL_READS TOTAL_PHYSICAL_READS BP_NAME ------------------- -------------------- -------------------- ------------
10036 3792 13828 IBMDEFAULTBP
DATA_LOGICAL_READS INDEX_LOGICAL_READS TOTAL_LOGICAL_READS BP_NAME ------------------- -------------------- -------------------- ------------
106856 70766 177622 IBMDEFAULTBP
DATA_HIT_RATIO_PERCENT INDEX_HIT_RATIO_PERCENT TOTAL_HIT_RATIO_PERCENT --------------------- ----------------------- -----------------------
90.60 94.64 92.21
__ 3. Compare the statistics for the two performance tests of the SQLTP1ST application.
What were the results of increasing the buffer pool size to 10,000 pages?
_______________________________________________________________
_______________________________________________________________
Was there an increase in the number of rows updated and inserted during the 180 seconds of transaction processing?
_______________________________________________________________
Did the number of Logical Reads for Index and Data pages increase? This is an indication of the application demand for data.
_______________________________________________________________
_______________________________________________________________
Did the number of Physical Reads for Index and Data pages increase?
Course materials may not be reproduced in whole or in part without the prior written permission of IBM.
© Copyright IBM Corp. 2001, 2006 Exercise 2. Tablespace and I/O Performance 2-9

Student Exercises
_______________________________________________________________
_______________________________________________________________
Did the number of Data Writes increase or decrease with a larger buffer pool?
_______________________________________________________________
_______________________________________________________________
What is triggering the page cleaners write activity with the 10,000 page buffer pool?
_______________________________________________________________
_______________________________________________________________
_______________________________________________________________
Use the command file bpioperformance.sql to show key I/O performance statistics.
In the terminal session, issue the commands:
db2 -tvf bpioperformance.sql > ioperf21.txt
vi ioperf21.txt
Course materials may not be reproduced in whole or in part without the prior written permission of IBM.
2-10 DB2 for Linux, UNIX, and Windows © Copyright IBM Corp. 2001, 2006
Student ExercisesV3.1.0.1
EXempty
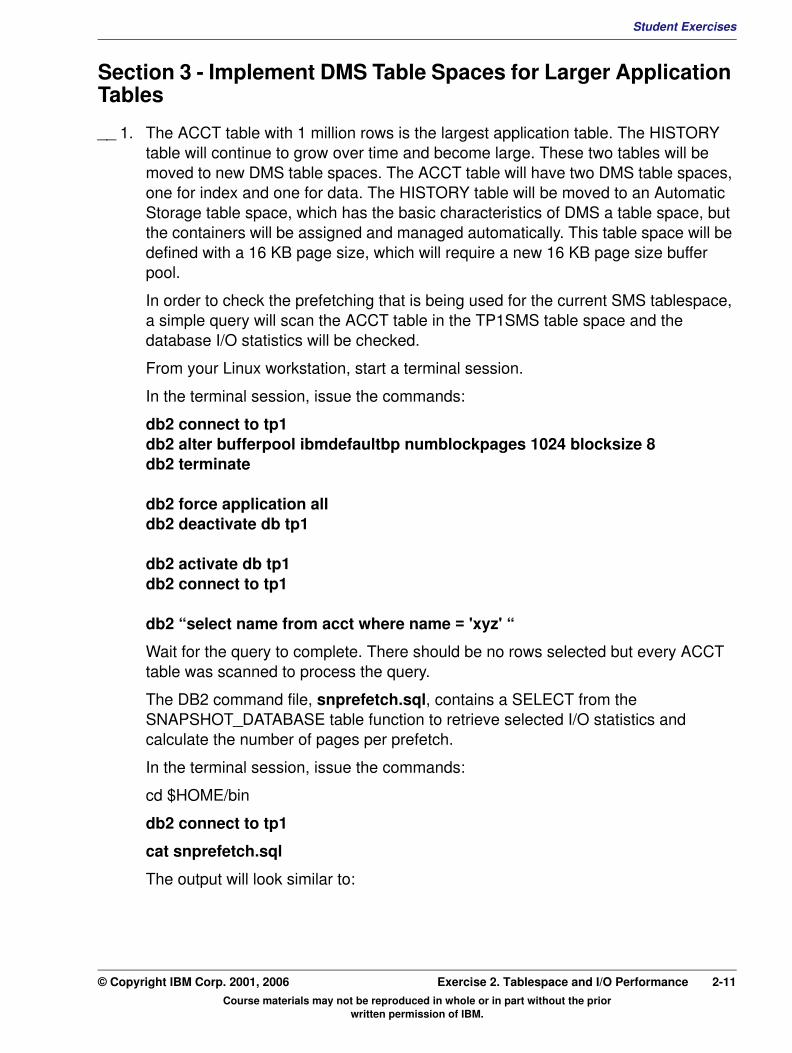
Section 3 - Implement DMS Table Spaces for Larger Application Tables__ 1. The ACCT table with 1 million rows is the largest application table. The HISTORY table will continue to grow over time and become large. These two tables will be moved to new DMS table spaces. The ACCT table will have two DMS table spaces, one for index and one for data. The HISTORY table will be moved to an Automatic Storage table space, which has the basic characteristics of DMS a table space, but the containers will be assigned and managed automatically. This table space will be defined with a 16 KB page size, which will require a new 16 KB page size buffer pool.
In order to check the prefetching that is being used for the current SMS tablespace, a simple query will scan the ACCT table in the TP1SMS table space and the database I/O statistics will be checked.
From your Linux workstation, start a terminal session.
In the terminal session, issue the commands:
db2 connect to tp1 db2 alter bufferpool ibmdefaultbp numblockpages 1024 blocksize 8db2 terminate
db2 force application all db2 deactivate db tp1
db2 activate db tp1 db2 connect to tp1
db2 “select name from acct where name = 'xyz' “
Wait for the query to complete. There should be no rows selected but every ACCT table was scanned to process the query.
The DB2 command file, snprefetch.sql, contains a SELECT from the SNAPSHOT_DATABASE table function to retrieve selected I/O statistics and calculate the number of pages per prefetch.
In the terminal session, issue the commands:
cd $HOME/bin
db2 connect to tp1
cat snprefetch.sql
The output will look similar to:
Course materials may not be reproduced in whole or in part without the prior written permission of IBM.
© Copyright IBM Corp. 2001, 2006 Exercise 2. Tablespace and I/O Performance 2-11
Student Exercises
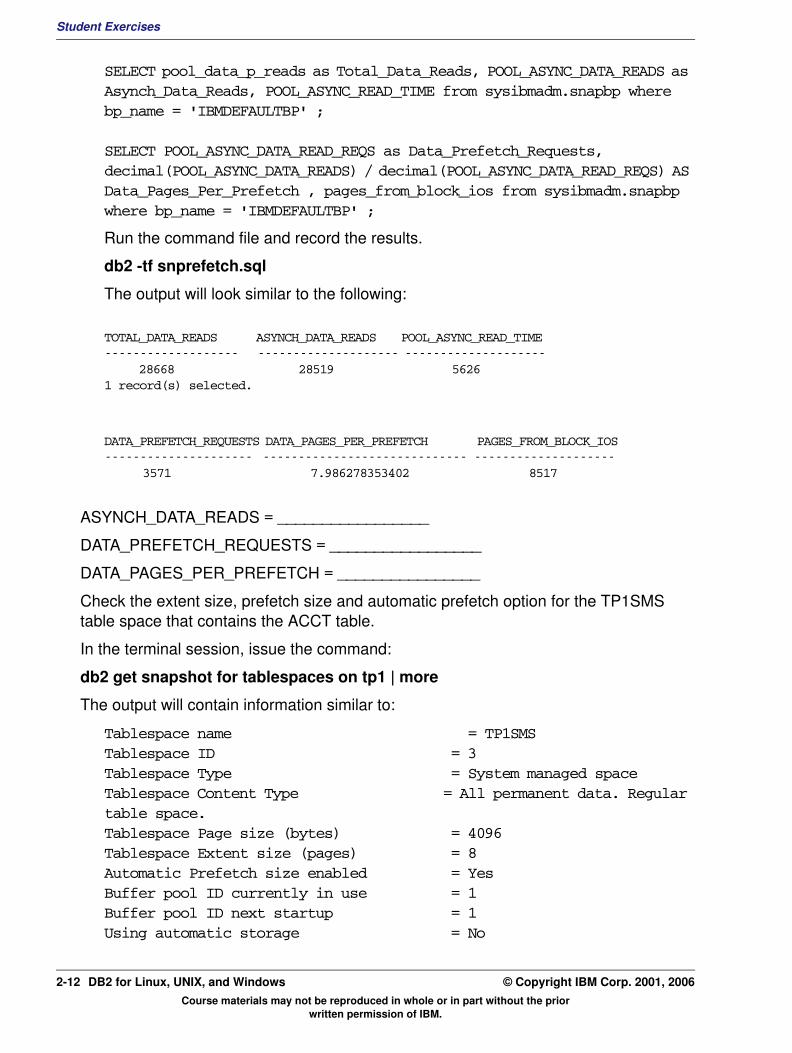
SELECT pool_data_p_reads as Total_Data_Reads, POOL_ASYNC_DATA_READS as Asynch_Data_Reads, POOL_ASYNC_READ_TIME from sysibmadm.snapbp where bp_name = 'IBMDEFAULTBP' ;
SELECT POOL_ASYNC_DATA_READ_REQS as Data_Prefetch_Requests, decimal(POOL_ASYNC_DATA_READS) / decimal(POOL_ASYNC_DATA_READ_REQS) AS Data_Pages_Per_Prefetch , pages_from_block_ios from sysibmadm.snapbp where bp_name = 'IBMDEFAULTBP' ;
Run the command file and record the results.
db2 -tf snprefetch.sql
The output will look similar to the following:
TOTAL_DATA_READS ASYNCH_DATA_READS POOL_ASYNC_READ_TIME------------------- -------------------- --------------------
28668 28519 56261 record(s) selected.
DATA_PREFETCH_REQUESTS DATA_PAGES_PER_PREFETCH PAGES_FROM_BLOCK_IOS--------------------- ----------------------------- --------------------
3571 7.986278353402 8517
ASYNCH_DATA_READS = _________________
DATA_PREFETCH_REQUESTS = _________________
DATA_PAGES_PER_PREFETCH = ________________
Check the extent size, prefetch size and automatic prefetch option for the TP1SMS table space that contains the ACCT table.
In the terminal session, issue the command:
db2 get snapshot for tablespaces on tp1 | more
The output will contain information similar to:
Tablespace name = TP1SMSTablespace ID = 3Tablespace Type = System managed spaceTablespace Content Type = All permanent data. Regular table space.Tablespace Page size (bytes) = 4096Tablespace Extent size (pages) = 8Automatic Prefetch size enabled = YesBuffer pool ID currently in use = 1Buffer pool ID next startup = 1Using automatic storage = No
Course materials may not be reproduced in whole or in part without the prior written permission of IBM.
2-12 DB2 for Linux, UNIX, and Windows © Copyright IBM Corp. 2001, 2006

Student ExercisesV3.1.0.1
EXempty
File system caching = YesTablespace State = 0x'00000000'Detailed explanation:NormalTablespace Prefetch size (pages) = 8Total number of pages = 32807Number of usable pages = 32807Number of used pages = 32807Minimum Recovery Time =Number of quiescers = 0Number of containers = 1The number of data pages read per prefetch request should match the extent size of the TP1SMS table space, which is 8 pages. Automatic Prefetch setting is enabled for this table space.
The database configuration options NUM_IOSERVERS and NUM_IOCLEANERS is set to AUTOMATIC. Check the current setting for these options/
In the terminal session, issue the command:
db2 get db cfg show detail | grep NUM_IO
Both NUM_IOSERVERS and NUM_IOCLEANERS are set to AUTOMATIC. What are the current system selected values for each of these?
NUM_IOSERVERS : _______
NUM_IOCLEANERS : ________
__ 2. Create the new table spaces and a new buffer for the table space that will contain the HISTORY table. The DB2 command file, tp1tblspace, can be used to create the new buffer pool TP1H16K, and the table spaces TP1DMSH for the HISTORY table and TP1DMSAD and TP1DMSAI for the ACCT table.
In the terminal session, issue the command:
db2 -tvf tp1tblspace
The output will look similar to the following:
CREATE Bufferpool TP1H16K IMMEDIATE SIZE 1000 PAGESIZE 16 KDB20000I The SQL command completed successfully.
CREATE REGULAR TABLESPACE TP1DMSH PAGESIZE 16 K MANAGED BY AUTOMATIC STORAGE INITIALSIZE 40 M EXTENTSIZE 8 PREFETCHSIZE AUTOMATIC BUFFERPOOL TP1H16K DB20000I The SQL command completed successfully.
CREATE REGULAR TABLESPACE TP1dmsad PAGESIZE 4 K MANAGED BY DATABASE USING (FILE 'tp1dms/dmsad1' 10000, FILE 'tp1dms/dmsad2' 10000, FILE 'tp1dms/dmsad3' 10000, FILE 'tp1dms/dmsad4' 10000 ) EXTENTSIZE 64 PREFETCHSIZE AUTOMATIC AUTORESIZE YESDB20000I The SQL command completed successfully.
Course materials may not be reproduced in whole or in part without the prior written permission of IBM.
© Copyright IBM Corp. 2001, 2006 Exercise 2. Tablespace and I/O Performance 2-13
Student Exercises
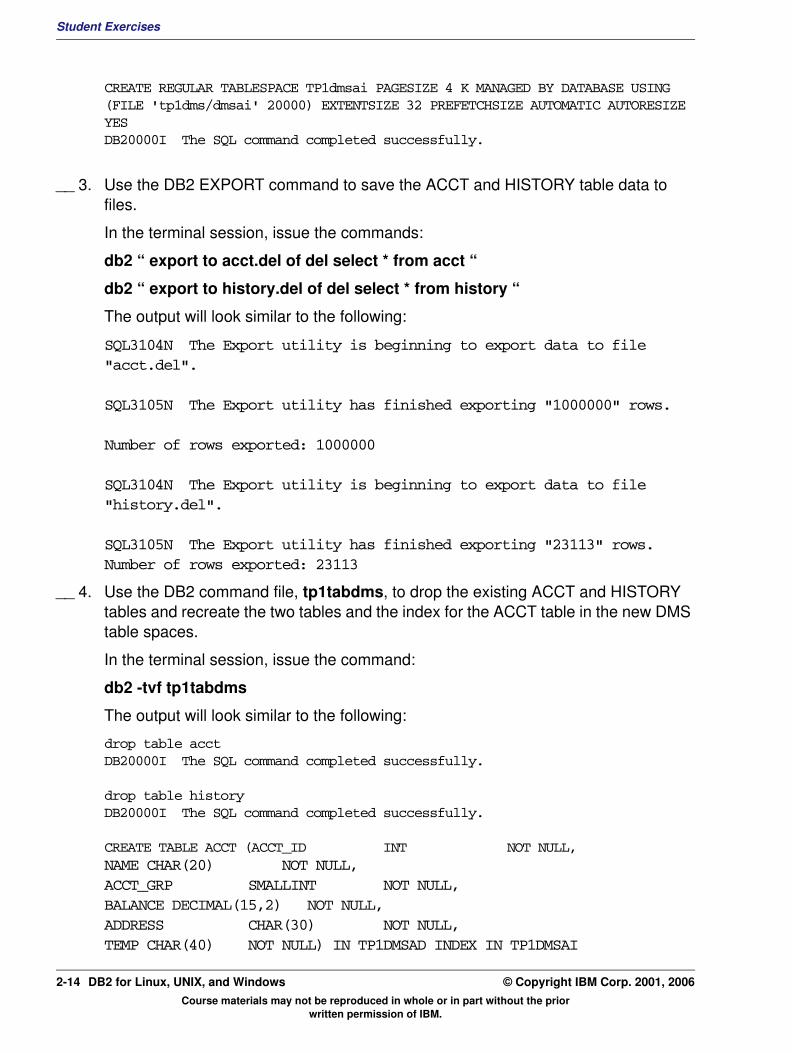
CREATE REGULAR TABLESPACE TP1dmsai PAGESIZE 4 K MANAGED BY DATABASE USING (FILE 'tp1dms/dmsai' 20000) EXTENTSIZE 32 PREFETCHSIZE AUTOMATIC AUTORESIZE YESDB20000I The SQL command completed successfully.
__ 3. Use the DB2 EXPORT command to save the ACCT and HISTORY table data to files.
In the terminal session, issue the commands:
db2 “ export to acct.del of del select * from acct “
db2 “ export to history.del of del select * from history “
The output will look similar to the following:
SQL3104N The Export utility is beginning to export data to file "acct.del".
SQL3105N The Export utility has finished exporting "1000000" rows.
Number of rows exported: 1000000
SQL3104N The Export utility is beginning to export data to file"history.del".
SQL3105N The Export utility has finished exporting "23113" rows.Number of rows exported: 23113
__ 4. Use the DB2 command file, tp1tabdms, to drop the existing ACCT and HISTORY tables and recreate the two tables and the index for the ACCT table in the new DMS table spaces.
In the terminal session, issue the command:
db2 -tvf tp1tabdms
The output will look similar to the following:
drop table acctDB20000I The SQL command completed successfully.
drop table historyDB20000I The SQL command completed successfully.
CREATE TABLE ACCT (ACCT_ID INT NOT NULL, NAME CHAR(20) NOT NULL, ACCT_GRP SMALLINT NOT NULL, BALANCE DECIMAL(15,2) NOT NULL, ADDRESS CHAR(30) NOT NULL, TEMP CHAR(40) NOT NULL) IN TP1DMSAD INDEX IN TP1DMSAI
Course materials may not be reproduced in whole or in part without the prior written permission of IBM.
2-14 DB2 for Linux, UNIX, and Windows © Copyright IBM Corp. 2001, 2006

Student ExercisesV3.1.0.1
EXempty
DB20000I The SQL command completed successfully.CREATE UNIQUE INDEX ACCTINDX ON ACCT(ACCT_ID)DB20000I The SQL command completed successfully.
CREATE TABLE HISTORY (ACCT_ID INTEGER NOT NULL, TELLER_ID SMALLINT NOT NULL, BRANCH_ID SMALLINT NOT NULL, BALANCE DECIMAL(15,2) NOT NULL, DELTA INTEGER NOT NULL, PI INTEGER NOT NULL, TSTMP TIMESTAMP NOT NULL WITH DEFAULT, ACCTNAME CHAR(20) NOT NULL,TEMP CHAR (6) NOT NULL) IN TP1DMSHDB20000I The SQL command completed successfully.
__ 5. Use the DB2 LOAD command to reload the ACCT and HISTORY tables data from the export files.
In the terminal session, issue the commands:
db2 " load from acct.del of del messages loadacct.msg replace into acct " db2 " load from history.del of del messages loadhist.msg replace into history "
The output will look similar to the following:
Number of rows read = 1000000Number of rows skipped = 0Number of rows loaded = 1000000Number of rows rejected = 0Number of rows deleted = 0Number of rows committed = 1000000
Number of rows read = 23113Number of rows skipped = 0Number of rows loaded = 23113Number of rows rejected = 0Number of rows deleted = 0Number of rows committed = 23113
__ 6. Use the DB2 command file, tp1stats, to invoke the RUNSTATS utility for each of the four tables. Use the command file, tp1bind, to rebind the application programs that use these tables.
In the terminal session, issue the command:
tp1stats
The output will look similar to the following:
RUNSTATS ON TABLE INST411.ACCT AND INDEXES ALL
Course materials may not be reproduced in whole or in part without the prior written permission of IBM.
© Copyright IBM Corp. 2001, 2006 Exercise 2. Tablespace and I/O Performance 2-15

Student Exercises
DB20000I The RUNSTATS command completed successfully.
RUNSTATS ON TABLE INST411.BRANCH AND INDEXES ALLDB20000I The RUNSTATS command completed successfully.
RUNSTATS ON TABLE INST411.TELLER AND INDEXES ALLDB20000I The RUNSTATS command completed successfully.
RUNSTATS ON TABLE INST411.HISTORYDB20000I The RUNSTATS command completed successfully.
db2 -tf tp1bind
The output will look similar to the following:
LINE MESSAGES FOR SQLTP1ST.BND------ -------------------------------------------------------------------- SQL0061W The binder is in progress. SQL0091N Binding was ended with "0" errors and "0" warnings.
LINE MESSAGES FOR SQLTP1DY.BND------ -------------------------------------------------------------------- SQL0061W The binder is in progress. SQL0091N Binding was ended with "0" errors and "0" warnings.
LINE MESSAGES FOR SQLTP1CP.BND------ -------------------------------------------------------------------- SQL0061W The binder is in progress. SQL0091N Binding was ended with "0" errors and "0" warnings.
LINE MESSAGES FOR SQLTP1RI.BND------ -------------------------------------------------------------------- SQL0061W The binder is in progress. SQL0091N Binding was ended with "0" errors and "0" warnings.
LINE MESSAGES FOR SQLTP1DL.BND------ -------------------------------------------------------------------- SQL0061W The binder is in progress. SQL0091N Binding was ended with "0" errors and "0" warnings.
LINE MESSAGES FOR SQLTP1DS.BND------ -------------------------------------------------------------------- SQL0061W The binder is in progress. SQL0091N Binding was ended with "0" errors and "0" warnings.
DB20000I The SQL command completed successfully.
Course materials may not be reproduced in whole or in part without the prior written permission of IBM.
2-16 DB2 for Linux, UNIX, and Windows © Copyright IBM Corp. 2001, 2006
Student ExercisesV3.1.0.1
EXempty
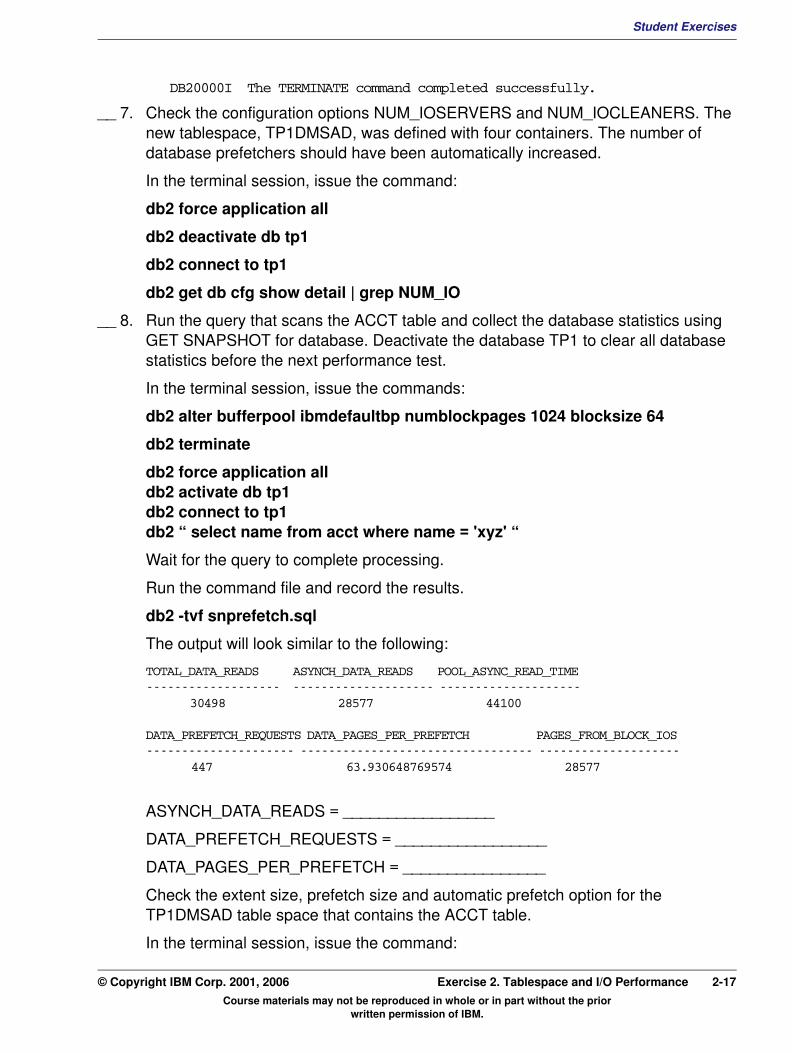
DB20000I The TERMINATE command completed successfully.__ 7. Check the configuration options NUM_IOSERVERS and NUM_IOCLEANERS. The new tablespace, TP1DMSAD, was defined with four containers. The number of database prefetchers should have been automatically increased.
In the terminal session, issue the command:
db2 force application all
db2 deactivate db tp1
db2 connect to tp1
db2 get db cfg show detail | grep NUM_IO
__ 8. Run the query that scans the ACCT table and collect the database statistics using GET SNAPSHOT for database. Deactivate the database TP1 to clear all database statistics before the next performance test.
In the terminal session, issue the commands:
db2 alter bufferpool ibmdefaultbp numblockpages 1024 blocksize 64
db2 terminate
db2 force application all db2 activate db tp1 db2 connect to tp1 db2 “ select name from acct where name = 'xyz' “
Wait for the query to complete processing.
Run the command file and record the results.
db2 -tvf snprefetch.sql
The output will look similar to the following:
TOTAL_DATA_READS ASYNCH_DATA_READS POOL_ASYNC_READ_TIME------------------- -------------------- --------------------
30498 28577 44100
DATA_PREFETCH_REQUESTS DATA_PAGES_PER_PREFETCH PAGES_FROM_BLOCK_IOS--------------------- --------------------------------- --------------------
447 63.930648769574 28577
ASYNCH_DATA_READS = _________________
DATA_PREFETCH_REQUESTS = _________________
DATA_PAGES_PER_PREFETCH = ________________
Check the extent size, prefetch size and automatic prefetch option for the TP1DMSAD table space that contains the ACCT table.
In the terminal session, issue the command:
Course materials may not be reproduced in whole or in part without the prior written permission of IBM.
© Copyright IBM Corp. 2001, 2006 Exercise 2. Tablespace and I/O Performance 2-17
Student Exercises
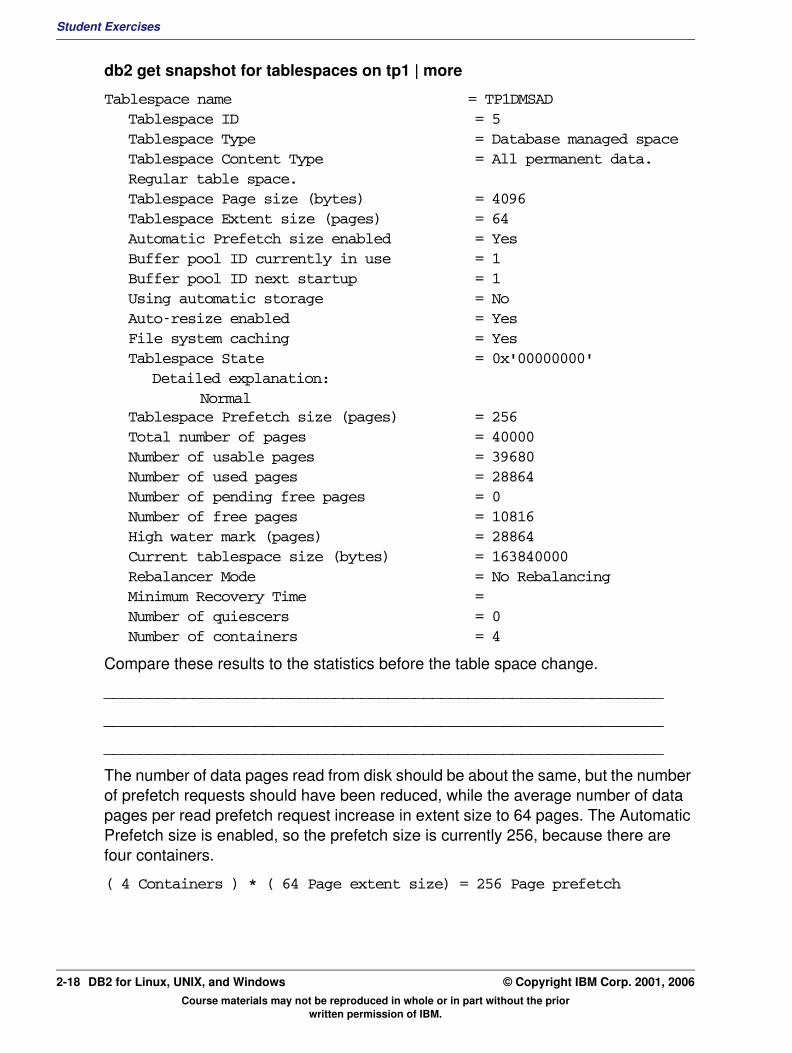
db2 get snapshot for tablespaces on tp1 | more
Tablespace name = TP1DMSADTablespace ID = 5Tablespace Type = Database managed spaceTablespace Content Type = All permanent data. Regular table space.Tablespace Page size (bytes) = 4096Tablespace Extent size (pages) = 64Automatic Prefetch size enabled = YesBuffer pool ID currently in use = 1Buffer pool ID next startup = 1Using automatic storage = NoAuto-resize enabled = YesFile system caching = YesTablespace State = 0x'00000000'
Detailed explanation:Normal
Tablespace Prefetch size (pages) = 256Total number of pages = 40000Number of usable pages = 39680Number of used pages = 28864Number of pending free pages = 0Number of free pages = 10816High water mark (pages) = 28864Current tablespace size (bytes) = 163840000Rebalancer Mode = No RebalancingMinimum Recovery Time =Number of quiescers = 0Number of containers = 4
Compare these results to the statistics before the table space change.
_______________________________________________________________
_______________________________________________________________
_______________________________________________________________
The number of data pages read from disk should be about the same, but the number of prefetch requests should have been reduced, while the average number of data pages per read prefetch request increase in extent size to 64 pages. The Automatic Prefetch size is enabled, so the prefetch size is currently 256, because there are four containers.
( 4 Containers ) * ( 64 Page extent size) = 256 Page prefetch
Course materials may not be reproduced in whole or in part without the prior written permission of IBM.
2-18 DB2 for Linux, UNIX, and Windows © Copyright IBM Corp. 2001, 2006
Student ExercisesV3.1.0.1
EXempty
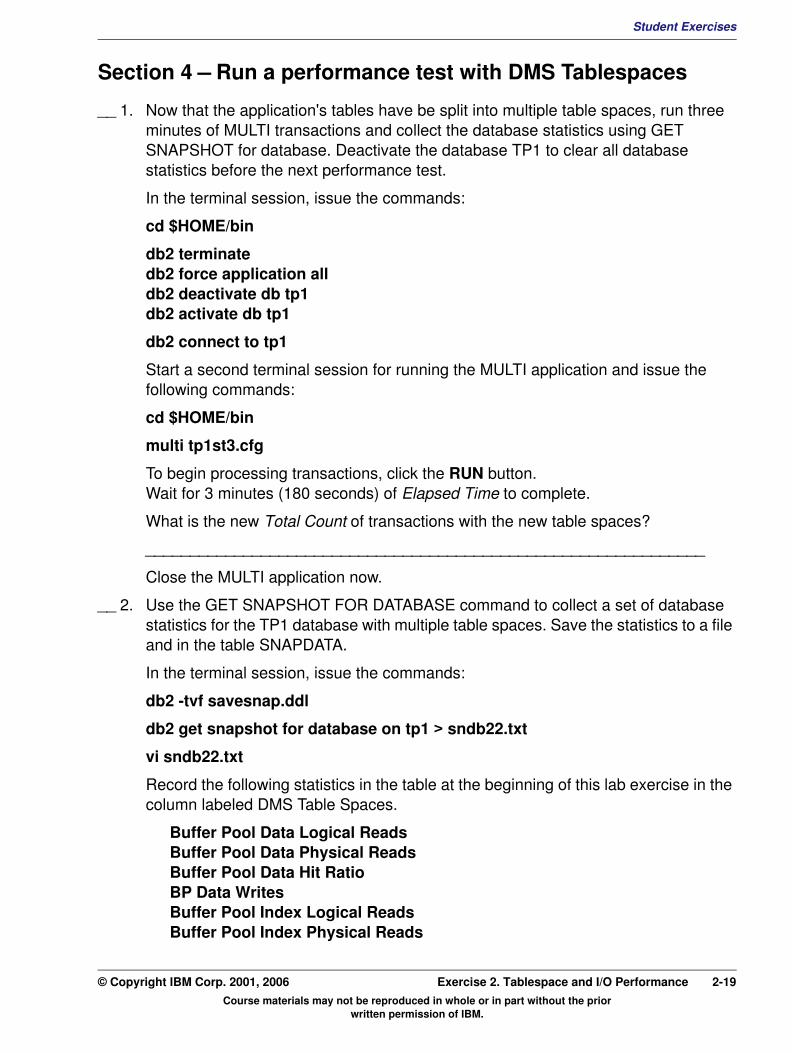
Section 4 – Run a performance test with DMS Tablespaces__ 1. Now that the application's tables have be split into multiple table spaces, run three minutes of MULTI transactions and collect the database statistics using GET SNAPSHOT for database. Deactivate the database TP1 to clear all database statistics before the next performance test.
In the terminal session, issue the commands:
cd $HOME/bin
db2 terminate db2 force application all db2 deactivate db tp1 db2 activate db tp1
db2 connect to tp1
Start a second terminal session for running the MULTI application and issue the following commands:
cd $HOME/bin
multi tp1st3.cfg
To begin processing transactions, click the RUN button. Wait for 3 minutes (180 seconds) of Elapsed Time to complete.
What is the new Total Count of transactions with the new table spaces?
_______________________________________________________________
Close the MULTI application now.
__ 2. Use the GET SNAPSHOT FOR DATABASE command to collect a set of database statistics for the TP1 database with multiple table spaces. Save the statistics to a file and in the table SNAPDATA.
In the terminal session, issue the commands:
db2 -tvf savesnap.ddl
db2 get snapshot for database on tp1 > sndb22.txt
vi sndb22.txt
Record the following statistics in the table at the beginning of this lab exercise in the column labeled DMS Table Spaces.
Buffer Pool Data Logical Reads Buffer Pool Data Physical Reads Buffer Pool Data Hit Ratio BP Data Writes Buffer Pool Index Logical Reads Buffer Pool Index Physical Reads
Course materials may not be reproduced in whole or in part without the prior written permission of IBM.
© Copyright IBM Corp. 2001, 2006 Exercise 2. Tablespace and I/O Performance 2-19
Student Exercises
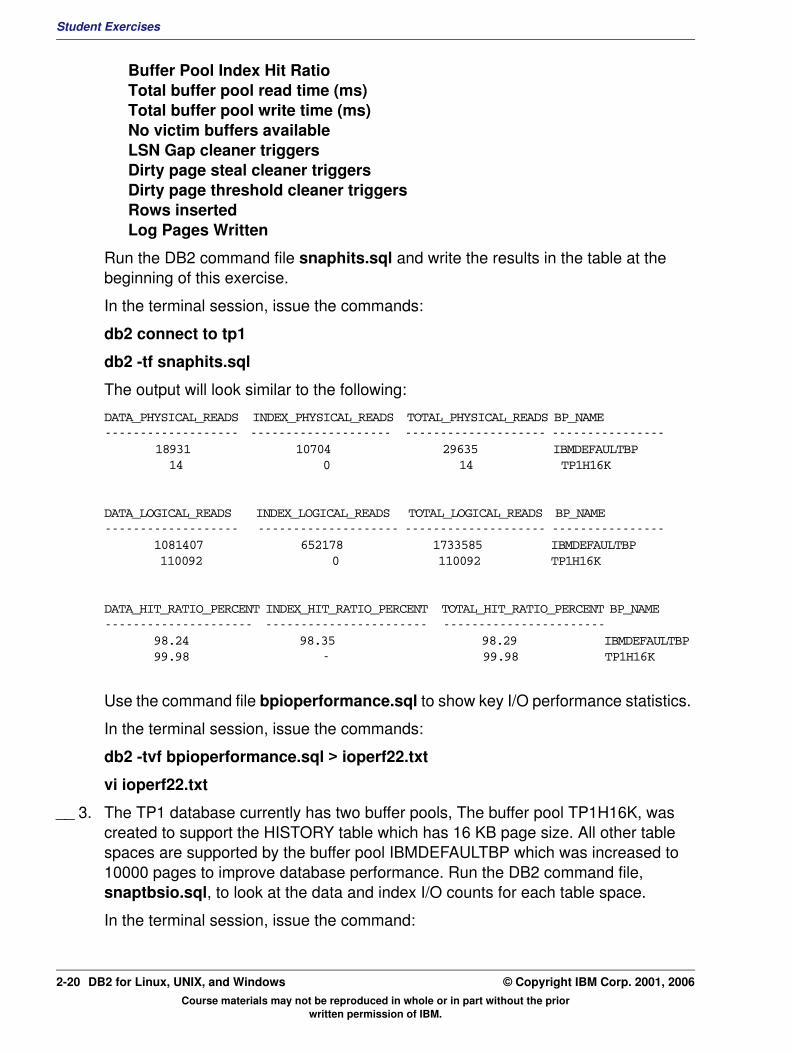
Buffer Pool Index Hit Ratio Total buffer pool read time (ms) Total buffer pool write time (ms) No victim buffers available LSN Gap cleaner triggers Dirty page steal cleaner triggers Dirty page threshold cleaner triggers Rows inserted Log Pages Written
Run the DB2 command file snaphits.sql and write the results in the table at the beginning of this exercise.
In the terminal session, issue the commands:
db2 connect to tp1
db2 -tf snaphits.sql
The output will look similar to the following:
DATA_PHYSICAL_READS INDEX_PHYSICAL_READS TOTAL_PHYSICAL_READS BP_NAME ------------------- -------------------- -------------------- ----------------
18931 10704 29635 IBMDEFAULTBP 14 0 14 TP1H16K
DATA_LOGICAL_READS INDEX_LOGICAL_READS TOTAL_LOGICAL_READS BP_NAME ------------------- -------------------- -------------------- ----------------
1081407 652178 1733585 IBMDEFAULTBP 110092 0 110092 TP1H16K
DATA_HIT_RATIO_PERCENT INDEX_HIT_RATIO_PERCENT TOTAL_HIT_RATIO_PERCENT BP_NAME --------------------- ----------------------- -----------------------
98.24 98.35 98.29 IBMDEFAULTBP 99.98 - 99.98 TP1H16K
Use the command file bpioperformance.sql to show key I/O performance statistics.
In the terminal session, issue the commands:
db2 -tvf bpioperformance.sql > ioperf22.txt
vi ioperf22.txt
__ 3. The TP1 database currently has two buffer pools, The buffer pool TP1H16K, was created to support the HISTORY table which has 16 KB page size. All other table spaces are supported by the buffer pool IBMDEFAULTBP which was increased to 10000 pages to improve database performance. Run the DB2 command file, snaptbsio.sql, to look at the data and index I/O counts for each table space.
In the terminal session, issue the command:
Course materials may not be reproduced in whole or in part without the prior written permission of IBM.
2-20 DB2 for Linux, UNIX, and Windows © Copyright IBM Corp. 2001, 2006

Student ExercisesV3.1.0.1
EXempty
db2 -tvf snaptbsio.sqlThe output will look similar to the following:
SELECT POOL_DATA_P_READS as DATA_Reads, POOL_INDEX_P_READS as INDEX_Reads, POOL_DATA_WRITES, substr(tbsp_name,1,16) as Table_space from sysibmadm.snaptbs
DATA_READS INDEX_READS POOL_DATA_WRITES TABLE_SPACE ------------------- -------------------- -------------------- ----------------
221 206 36 SYSCATSPACE 0 0 0 TEMPSPACE1 39 0 0 USERSPACE1 35 10 66 TP1SMS 14 0 27 TP1DMSH
7918 0 4954 TP1DMSAD 35 3349 0 TP1DMSAI 1 0 59 SYSTOOLSPACE 0 0 0 SYSTOOLSTMPSPACE
9 record(s) selected.
Most of the buffer pool reads and writes are associated with the ACCT table. Implementing row compression may reduce the I/O demand for ACCT table pages and improve buffer pool efficiency.
Course materials may not be reproduced in whole or in part without the prior written permission of IBM.
© Copyright IBM Corp. 2001, 2006 Exercise 2. Tablespace and I/O Performance 2-21

Student Exercises
Section 5 – Implement Row Compression for the ACCT table
__ 1. The ACCT table is currently the largest table used by the MULTI application. Implementing Row Compression may be able to reduce the number of pages that will need to be read and written during processing and also reduce the number of buffer pool pages needed to hold the rows processed. There will be CPU overhead for compressing and uncompressing rows, but there may be adequate CPU resource available. The INSPECT command can be used to estimate the row compression results for an existing table. First, use a query to find the current table size for the ACCT table.
In the terminal session, issue the commands:
db2 connect to tp1
db2 “select npages, fpages from syscat.tables where tabname = ‘ACCT' andtabschema = ‘INST411' “
How many pages currently have data in the ACCT table (npages) ?: ________
db2 inspect rowcompestimate table name acct schema inst411 results keep inspect1.dat
db2inspf $HOME/sqllib/db2dump/inspect1.dat inspect1.txt
vi inspect1.txt
The output will look similar to the following:
DATABASE: TP1 VERSION : SQL09010 2006-11-02-11.27.02.584154
Action: ROWCOMPESTIMATE TABLESchema name: INST411 Table name: ACCTTablespace ID: 5 Object ID: 4Result file name: inspect1.dat
Table phase start (ID Signed: 4, Unsigned: 4; Tablespace ID: 5) : INST411.ACCT
Data phase start. Object: 4 Tablespace: 5Row compression estimate results:Percentage of pages saved from compression: 78Percentage of bytes saved from compression: 78Percentage of rows ineligible for compression due to small row size: 0Compression dictionary size: 74112 bytes.Expansion dictionary size: 32768 bytes.Data phase end.
Course materials may not be reproduced in whole or in part without the prior written permission of IBM.
2-22 DB2 for Linux, UNIX, and Windows © Copyright IBM Corp. 2001, 2006
Student ExercisesV3.1.0.1
EXempty
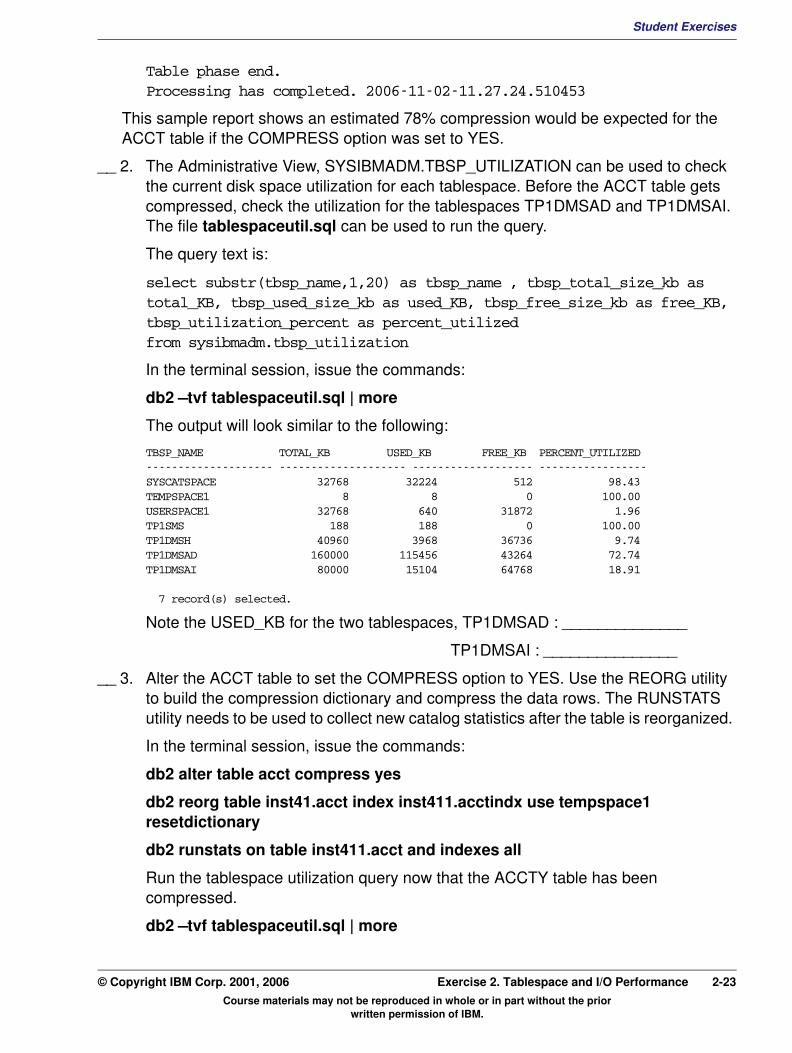
Table phase end.Processing has completed. 2006-11-02-11.27.24.510453This sample report shows an estimated 78% compression would be expected for the ACCT table if the COMPRESS option was set to YES.
__ 2. The Administrative View, SYSIBMADM.TBSP_UTILIZATION can be used to check the current disk space utilization for each tablespace. Before the ACCT table gets compressed, check the utilization for the tablespaces TP1DMSAD and TP1DMSAI. The file tablespaceutil.sql can be used to run the query.
The query text is:
select substr(tbsp_name,1,20) as tbsp_name , tbsp_total_size_kb as total_KB, tbsp_used_size_kb as used_KB, tbsp_free_size_kb as free_KB, tbsp_utilization_percent as percent_utilized from sysibmadm.tbsp_utilization
In the terminal session, issue the commands:
db2 –tvf tablespaceutil.sql | more
The output will look similar to the following:
TBSP_NAME TOTAL_KB USED_KB FREE_KB PERCENT_UTILIZED-------------------- -------------------- ------------------- -----------------SYSCATSPACE 32768 32224 512 98.43TEMPSPACE1 8 8 0 100.00USERSPACE1 32768 640 31872 1.96TP1SMS 188 188 0 100.00TP1DMSH 40960 3968 36736 9.74TP1DMSAD 160000 115456 43264 72.74TP1DMSAI 80000 15104 64768 18.91
7 record(s) selected.
Note the USED_KB for the two tablespaces, TP1DMSAD : ______________
TP1DMSAI : _______________
__ 3. Alter the ACCT table to set the COMPRESS option to YES. Use the REORG utility to build the compression dictionary and compress the data rows. The RUNSTATS utility needs to be used to collect new catalog statistics after the table is reorganized.
In the terminal session, issue the commands:
db2 alter table acct compress yes
db2 reorg table inst41.acct index inst411.acctindx use tempspace1 resetdictionary
db2 runstats on table inst411.acct and indexes all
Run the tablespace utilization query now that the ACCTY table has been compressed.
db2 –tvf tablespaceutil.sql | more
Course materials may not be reproduced in whole or in part without the prior written permission of IBM.
© Copyright IBM Corp. 2001, 2006 Exercise 2. Tablespace and I/O Performance 2-23

Student Exercises
The output will look similar to the following:
TBSP_NAME TOTAL_KB USED_KB FREE_KB PERCENT_UTILIZED------------------- -------------------- -------------------- ---------------SYSCATSPACE 32768 32224 512 98.43TEMPSPACE1 8 8 0 100.00USERSPACE1 32768 640 31872 1.96TP1SMS 188 188 0 100.00TP1DMSH 40960 3968 36736 9.74TP1DMSAD 160000 25344 133376 15.96TP1DMSAI 80000 15104 64768 18.91
7 record(s) selected.
Note the USED_KB for the two tablespaces, TP1DMSAD : ______________
TP1DMSAI : _______________
The space required for the data in TP1DMSAD should have decreased significantly. The space required for the index on the ACCT table, in the TP1DMSAI tablespace has not decreased. Row compression does not affect the size of the indexes for a table. The tablespace TP1DMSAD can now be reduced in size.
In the terminal session, issue the commands:
db2 “alter tablespace TP1DMSAD RESIZE (all containers 3000) “
Run the query checkcomp.sql to show the catalog statistics for the ACCT table that provide information about compressed tables.
db2 –tvf checkcomp.sql
The output will look similar to the following:
select avgrowsize, pctpagessaved, pctrowscompressed, avgrowcompressionratio, tabname from syscat.tables where tabname = 'ACCT'
AVGROWSIZE PCTPAGESSAVED PCTROWSCOMPRESSED AVGROWCOMPRESSIONRATIO TABNAME --------- ------------- ------------------ ------------------------ ----
24 78 +1.00000E+002 +4.70006E+000 ACCT
1 record(s) selected.
__ 4. Rebind the applications following the changes for the ACCT table, using the tp1bind command file.
In the terminal session, issue the commands:
db2 –tf tp1bind
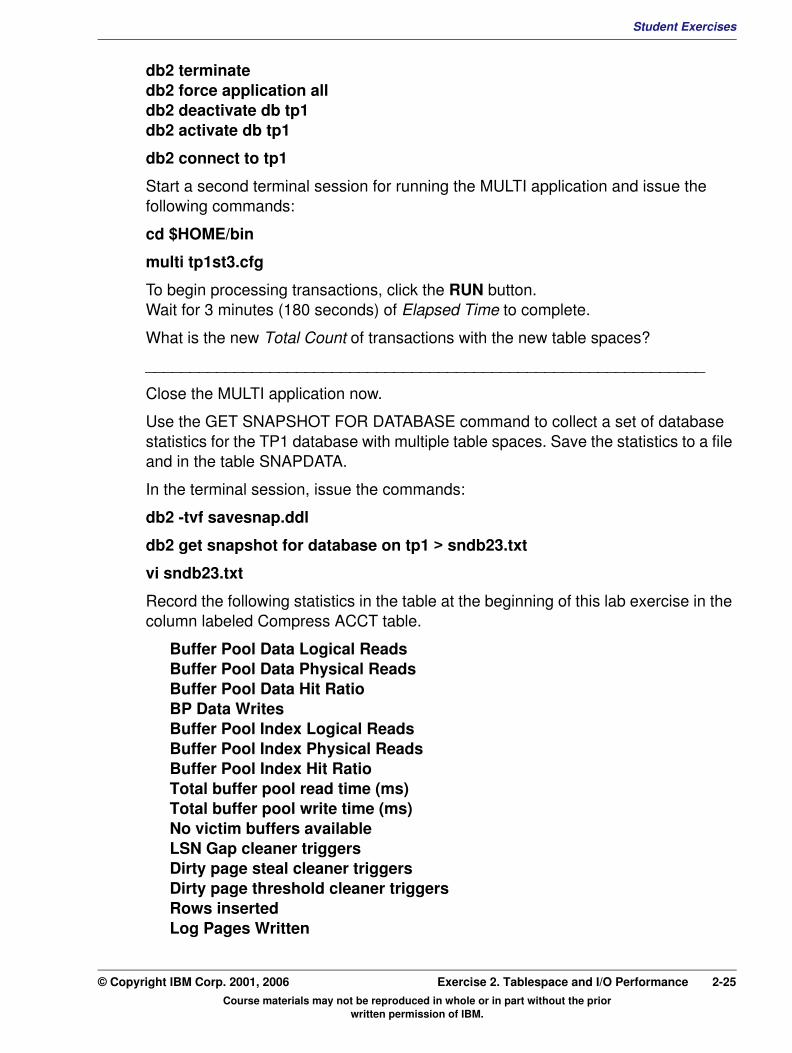
__ 5. Now that Row Compression has been implemented for the ACCT table, run three minutes of MULTI transactions and collect the database statistics using GET SNAPSHOT for database. Deactivate the database TP1 to clear all database statistics before the next performance test.
In the terminal session, issue the commands:
cd $HOME/bin
Course materials may not be reproduced in whole or in part without the prior written permission of IBM.
2-24 DB2 for Linux, UNIX, and Windows © Copyright IBM Corp. 2001, 2006
Student ExercisesV3.1.0.1
EXempty
db2 terminate db2 force application all db2 deactivate db tp1 db2 activate db tp1db2 connect to tp1
Start a second terminal session for running the MULTI application and issue the following commands:
cd $HOME/bin
multi tp1st3.cfg
To begin processing transactions, click the RUN button. Wait for 3 minutes (180 seconds) of Elapsed Time to complete.
What is the new Total Count of transactions with the new table spaces?
_______________________________________________________________
Close the MULTI application now.
Use the GET SNAPSHOT FOR DATABASE command to collect a set of database statistics for the TP1 database with multiple table spaces. Save the statistics to a file and in the table SNAPDATA.
In the terminal session, issue the commands:
db2 -tvf savesnap.ddl
db2 get snapshot for database on tp1 > sndb23.txt
vi sndb23.txt
Record the following statistics in the table at the beginning of this lab exercise in the column labeled Compress ACCT table.
Buffer Pool Data Logical Reads Buffer Pool Data Physical Reads Buffer Pool Data Hit Ratio BP Data Writes Buffer Pool Index Logical Reads Buffer Pool Index Physical Reads Buffer Pool Index Hit Ratio Total buffer pool read time (ms) Total buffer pool write time (ms) No victim buffers available LSN Gap cleaner triggers Dirty page steal cleaner triggers Dirty page threshold cleaner triggers Rows inserted Log Pages Written
Course materials may not be reproduced in whole or in part without the prior written permission of IBM.
© Copyright IBM Corp. 2001, 2006 Exercise 2. Tablespace and I/O Performance 2-25
Student Exercises
Run the DB2 command file snaphits.sql and write the results in the table at the beginning of this exercise.
In the terminal session, issue the commands:
db2 connect to tp1
db2 -tf snaphits.sql
Use the command file bpioperformance.sql to show key I/O performance statistics.
In the terminal session, issue the commands:
db2 -tvf bpioperformance.sql > ioperf23.txt
vi ioperf23.txt
Compare the statistics for the last performance test to the previous results:
Was there an increase in the number of rows updated and inserted during the 180 seconds of transaction processing?
_______________________________________________________________
Did the number of Logical Reads for Index and Data pages increase? This is an indication of the application demand for data.
_______________________________________________________________
_______________________________________________________________
_______________________________________________________________
Did the buffer pool hit ratios increase or decrease? (If row compression was effective the buffer pool hit ratio for data should have increased.
_______________________________________________________________
_______________________________________________________________
__ 6. Close all the applications and deactivate the TP1 database to clear all current statistics.
In the terminal session, issue the commands:
db2 terminate
db2 force application all db2 deactivate db tp1
END OF EXERCISE
Course materials may not be reproduced in whole or in part without the prior written permission of IBM.
2-26 DB2 for Linux, UNIX, and Windows © Copyright IBM Corp. 2001, 2006

Student ExercisesV3.1.0.1
EXempty
Exercise 3. DB2 Memory ManagementWhat This Exercise Is About
This exercise is an online lab which allows the student to analyze the performance impact of implementing multiple database buffer pools. The database performance statistics will be collected to adjust the sortheap size to improve sort efficiency.
What You Should Be Able to Do
At the end of the lab, you should be able to:
• Use the DB2 command db2mtrk to collect information about the current status of database memory heaps.
• Configure multiple buffer pools to improve database performance.
• Use db2pd command options to retrieve statistics about database memory usage.
• Review database and database manager snapshot statistics and use explain output adjust database sortheap size to improve sort efficiency.
Course materials may not be reproduced in whole or in part without the prior written permission of IBM.
© Copyright IBM Corp. 2001, 2006 Exercise 3. DB2 Memory Management 3-1

Student Exercises
Database Performance Results Table
DB2 Monitor Statistic Multiple Buffer Pools
Buffer Pool Data Logical Reads
Buffer Pool Data Physical Reads
BP Data Writes
Buffer Pool Index Logical Reads
Buffer Pool Index Physical Reads
Total buffer pool read time (ms)
Total buffer pool write time (ms)
No victim buffers available
Rows inserted
Log Pages Written
Course materials may not be reproduced in whole or in part without the prior written permission of IBM.
3-2 DB2 for Linux, UNIX, and Windows © Copyright IBM Corp. 2001, 2006
Student ExercisesV3.1.0.1
EXempty
Exercise InstructionsIntroduction
In this exercise, you will be implementing two new buffer pools. The new buffer pools will be created to separate the data and index portions of the large ACCT table. A query that performs a large sort will be analyzed to adjust the size of the sortheap for the database to avoid a sort overflow during query processing. The db2mtrk and db2pd commands will be used to collect statistics about buffer pool and database memory heap sizes.
Course materials may not be reproduced in whole or in part without the prior written permission of IBM.
© Copyright IBM Corp. 2001, 2006 Exercise 3. DB2 Memory Management 3-3

Student Exercises
Section 1 – Examine DB2 Database Memory allocations
__ 1. The Database shared memory heaps are allocated when the database becomes active. Activate the TP1 database and use the command db2mtrk to list the size of the database buffer pools and other memory allocations.
From your Linux workstation, start a terminal session.
In the terminal session, issue the commands:
db2 terminate
db2stop force
db2start
db2 activate db tp1 db2 connect to tp1
db2mtrk -d -v
The output will look similar to:
Tracking Memory on: 2006/11/02 at 16:53:39
Memory for database: TP1
Backup/Restore/Util Heap is of size 65536 bytesPackage Cache is of size 131072 bytesCatalog Cache Heap is of size 65536 bytesBuffer Pool Heap (2) is of size 16646144 bytesBuffer Pool Heap (1) is of size 42401792 bytesBuffer Pool Heap (System 32k buffer pool) is of size 720896 bytesBuffer Pool Heap (System 16k buffer pool) is of size 458752 bytesBuffer Pool Heap (System 8k buffer pool) is of size 327680 bytesBuffer Pool Heap (System 4k buffer pool) is of size 262144 bytesShared Sort Heap is of size 0 bytesLock Manager Heap is of size 393216 bytesDatabase Heap is of size 4849664 bytesOther Memory is of size 131072 bytesTotal: 66453504 bytes
What does the db2mtrk report show for the size of these areas?
Backup/Restore/Util Heap : __________ (65,536)
Buffer Pool Heap (1) : _________________ (42,401,792)
Buffer Pool Heap (2) : _________________ (16,646,144)
Shared Sort Heap : _________________ (0)
Lock Manager Heap : _________________ (393,216)
Course materials may not be reproduced in whole or in part without the prior written permission of IBM.
3-4 DB2 for Linux, UNIX, and Windows © Copyright IBM Corp. 2001, 2006
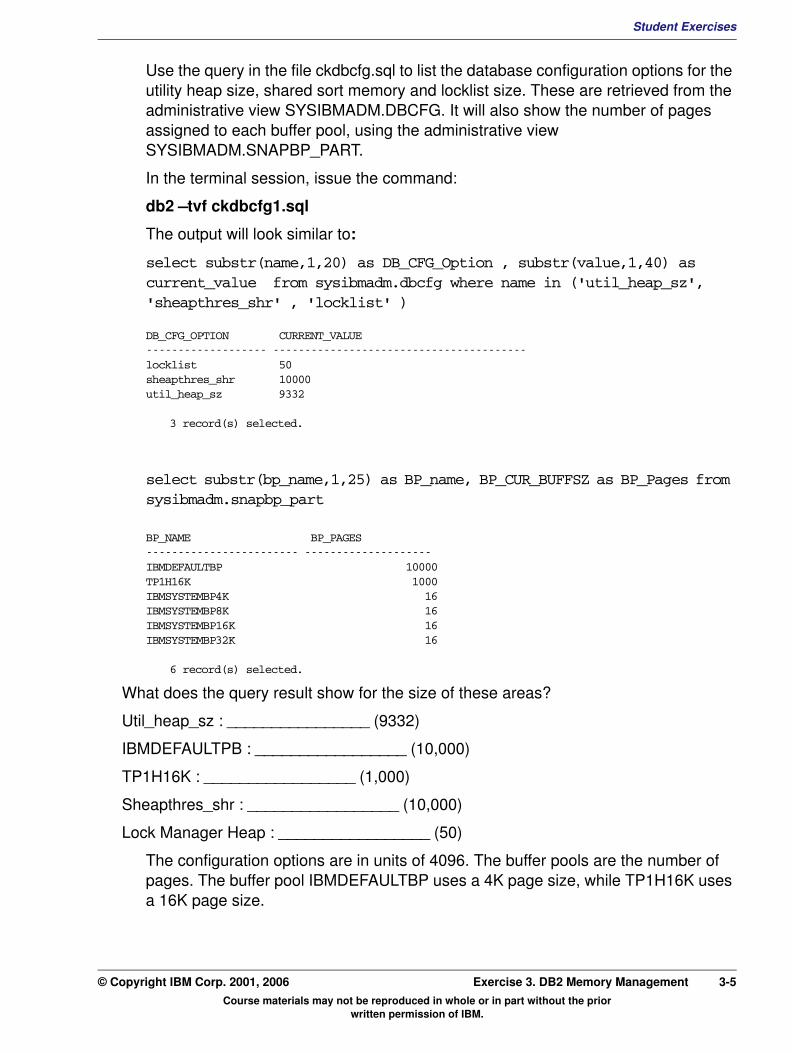
Student ExercisesV3.1.0.1
EXempty
Use the query in the file ckdbcfg.sql to list the database configuration options for the utility heap size, shared sort memory and locklist size. These are retrieved from the administrative view SYSIBMADM.DBCFG. It will also show the number of pages assigned to each buffer pool, using the administrative view SYSIBMADM.SNAPBP_PART.In the terminal session, issue the command:
db2 –tvf ckdbcfg1.sql
The output will look similar to:
select substr(name,1,20) as DB_CFG_Option , substr(value,1,40) as current_value from sysibmadm.dbcfg where name in ('util_heap_sz', 'sheapthres_shr' , 'locklist' )
DB_CFG_OPTION CURRENT_VALUE ------------------- ----------------------------------------locklist 50 sheapthres_shr 10000 util_heap_sz 9332
3 record(s) selected.
select substr(bp_name,1,25) as BP_name, BP_CUR_BUFFSZ as BP_Pages from sysibmadm.snapbp_part
BP_NAME BP_PAGES ------------------------ --------------------IBMDEFAULTBP 10000TP1H16K 1000IBMSYSTEMBP4K 16IBMSYSTEMBP8K 16IBMSYSTEMBP16K 16IBMSYSTEMBP32K 16
6 record(s) selected.
What does the query result show for the size of these areas?
Util_heap_sz : ________________ (9332)
IBMDEFAULTPB : _________________ (10,000)
TP1H16K : _________________ (1,000)
Sheapthres_shr : _________________ (10,000)
Lock Manager Heap : _________________ (50)
The configuration options are in units of 4096. The buffer pools are the number of pages. The buffer pool IBMDEFAULTBP uses a 4K page size, while TP1H16K uses a 16K page size.
Course materials may not be reproduced in whole or in part without the prior written permission of IBM.
© Copyright IBM Corp. 2001, 2006 Exercise 3. DB2 Memory Management 3-5

Student Exercises
Notice that both the db2mtrk report and the query show four extra buffer pools, which DB2 allocates for handling of some special cases. These are sometimes referred to as the ‘hidden' buffer pools.
The standard db2mtrk report shows the current memory usage for each memory heap. For buffer pools and the lock list, DB2 has allocated the full defined size when the database was activated. The utility heap and shared sort memory heap do not allocate much memory until it is needed for processing.
__ 2. Use the db2pd command to show memory usage for the active TP1 database.
In the terminal session, issue the command:
db2pd –db tp1 –mempools > mempool1.txt
Look at the portion of the report that shows ‘PhySz' and ‘PhyUpBnd' for each memory heap. The ‘PhySZ' is the current physical size, that is similar to the number in the db2mtrk report. The ‘PhyUpBnd' shows the upper bound for each area based on the configured limits.
The output will include information similar to the following:
Memory Pools:Address MemSet PoolName Id PhySz PhyUpBnd PhyHWM 0x134B0B14 TP1 utilh 5 65536 38273024 65536 0x134B09B4 TP1 pckcacheh 7 262144 Unlimited 262144 0x134B0904 TP1 xmlcacheh 93 131072 20971520 131072 0x134B0854 TP1 catcacheh 8 65536 Unlimited 65536 0x134B07A4 TP1 bph 16 16646144 Unlimited 16646144 0x134B06F4 TP1 bph 16 42401792 Unlimited 42401792 0x134B0644 TP1 bph 16 720896 Unlimited 720896 0x134B0594 TP1 bph 16 458752 Unlimited 458752 0x134B04E4 TP1 bph 16 327680 Unlimited 327680 0x134B0434 TP1 bph 16 262144 Unlimited 262144 0x134B0384 TP1 shsorth 18 0 40960000 0 0x134B02D4 TP1 lockh 4 393216 458752 393216 0x134B0224 TP1 dbh 2 4849664 16056320 4849664
__ 3. The database configuration option DATABASE_MEMORY can be used to set the overall size of database shared memory. Use the command, GET DB CFG SHOW DETAIL to display the current setting for DATABASE_MEMORY.
In the terminal session, issue the commands:
db2 connect to tp1
db2 get db cfg show detail | grep MEMORY
The output will look similar to the following:
Course materials may not be reproduced in whole or in part without the prior written permission of IBM.
3-6 DB2 for Linux, UNIX, and Windows © Copyright IBM Corp. 2001, 2006
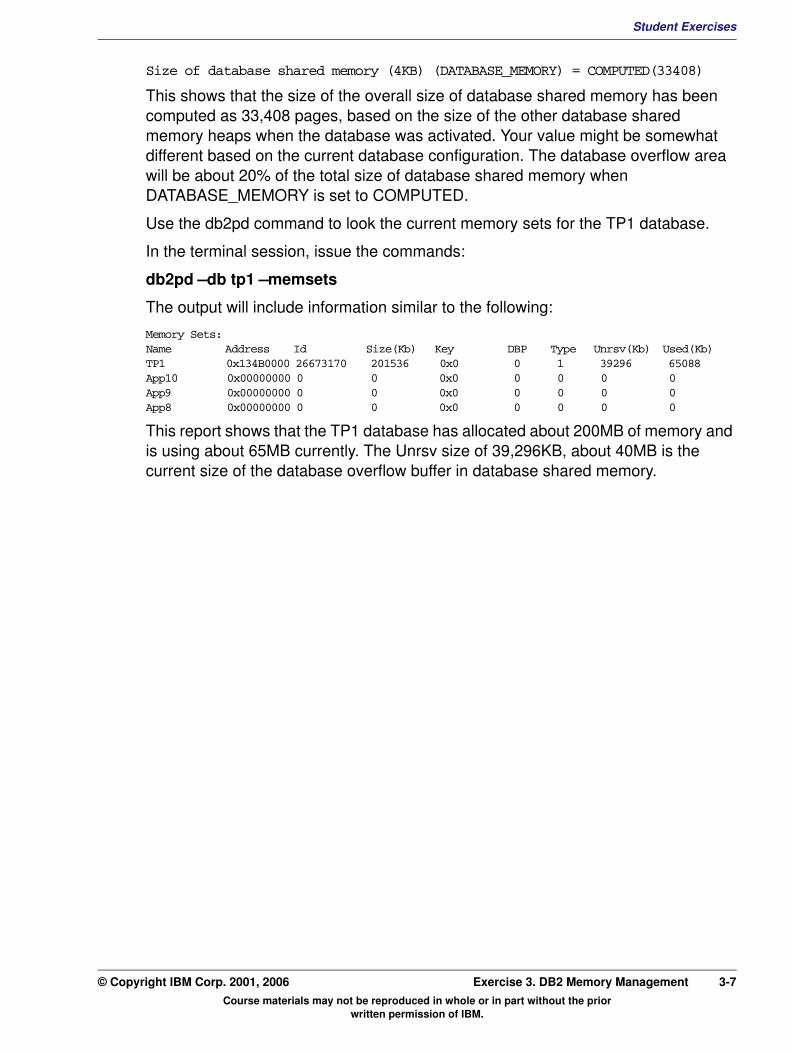
Student ExercisesV3.1.0.1
EXempty
Size of database shared memory (4KB) (DATABASE_MEMORY) = COMPUTED(33408)This shows that the size of the overall size of database shared memory has been computed as 33,408 pages, based on the size of the other database shared memory heaps when the database was activated. Your value might be somewhat different based on the current database configuration. The database overflow area will be about 20% of the total size of database shared memory when DATABASE_MEMORY is set to COMPUTED.
Use the db2pd command to look the current memory sets for the TP1 database.
In the terminal session, issue the commands:
db2pd –db tp1 –memsets
The output will include information similar to the following:
Memory Sets:Name Address Id Size(Kb) Key DBP Type Unrsv(Kb) Used(Kb) TP1 0x134B0000 26673170 201536 0x0 0 1 39296 65088 App10 0x00000000 0 0 0x0 0 0 0 0 App9 0x00000000 0 0 0x0 0 0 0 0 App8 0x00000000 0 0 0x0 0 0 0 0
This report shows that the TP1 database has allocated about 200MB of memory and is using about 65MB currently. The Unrsv size of 39,296KB, about 40MB is the current size of the database overflow buffer in database shared memory.
Course materials may not be reproduced in whole or in part without the prior written permission of IBM.
© Copyright IBM Corp. 2001, 2006 Exercise 3. DB2 Memory Management 3-7
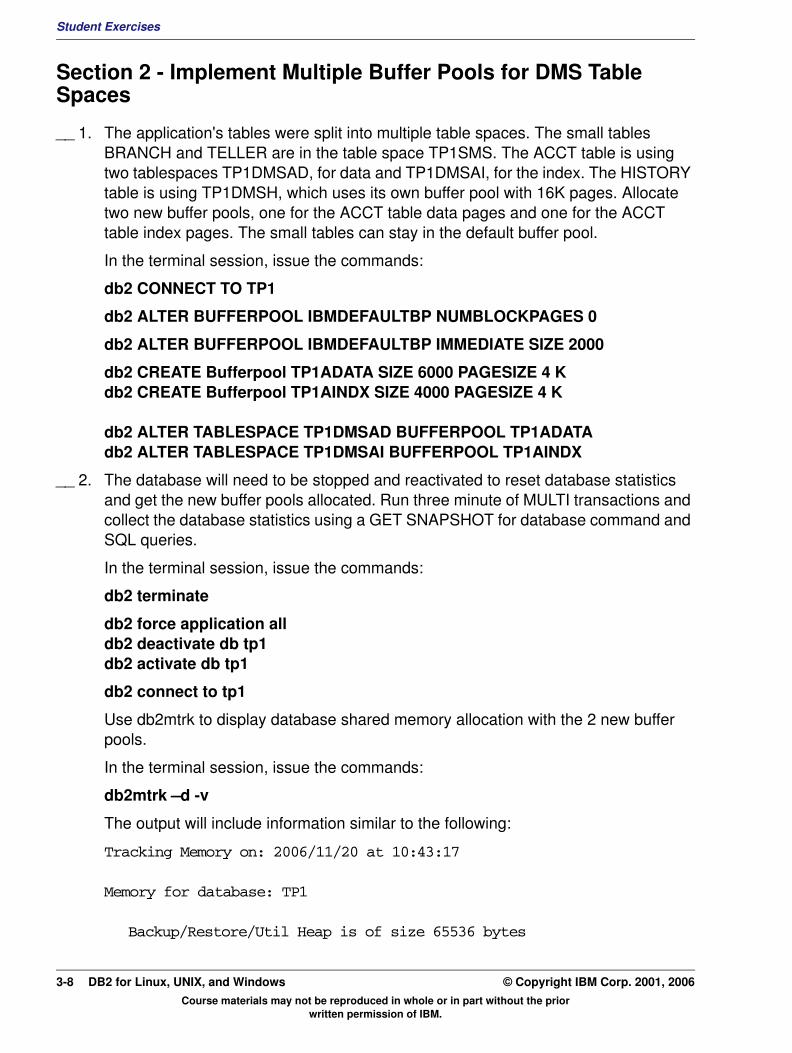
Student Exercises
Section 2 - Implement Multiple Buffer Pools for DMS Table Spaces
__ 1. The application's tables were split into multiple table spaces. The small tables BRANCH and TELLER are in the table space TP1SMS. The ACCT table is using two tablespaces TP1DMSAD, for data and TP1DMSAI, for the index. The HISTORY table is using TP1DMSH, which uses its own buffer pool with 16K pages. Allocate two new buffer pools, one for the ACCT table data pages and one for the ACCT table index pages. The small tables can stay in the default buffer pool.
In the terminal session, issue the commands:
db2 CONNECT TO TP1
db2 ALTER BUFFERPOOL IBMDEFAULTBP NUMBLOCKPAGES 0
db2 ALTER BUFFERPOOL IBMDEFAULTBP IMMEDIATE SIZE 2000
db2 CREATE Bufferpool TP1ADATA SIZE 6000 PAGESIZE 4 K db2 CREATE Bufferpool TP1AINDX SIZE 4000 PAGESIZE 4 K
db2 ALTER TABLESPACE TP1DMSAD BUFFERPOOL TP1ADATA db2 ALTER TABLESPACE TP1DMSAI BUFFERPOOL TP1AINDX
__ 2. The database will need to be stopped and reactivated to reset database statistics and get the new buffer pools allocated. Run three minute of MULTI transactions and collect the database statistics using a GET SNAPSHOT for database command and SQL queries.
In the terminal session, issue the commands:
db2 terminate
db2 force application all db2 deactivate db tp1 db2 activate db tp1
db2 connect to tp1
Use db2mtrk to display database shared memory allocation with the 2 new buffer pools.
In the terminal session, issue the commands:
db2mtrk –d -v
The output will include information similar to the following:
Tracking Memory on: 2006/11/20 at 10:43:17
Memory for database: TP1
Backup/Restore/Util Heap is of size 65536 bytes
Course materials may not be reproduced in whole or in part without the prior written permission of IBM.
3-8 DB2 for Linux, UNIX, and Windows © Copyright IBM Corp. 2001, 2006

Student ExercisesV3.1.0.1
EXempty
Package Cache is of size 589824 bytesCatalog Cache Heap is of size 196608 bytesBuffer Pool Heap (4) is of size 17039360 bytesBuffer Pool Heap (3) is of size 25493504 bytesBuffer Pool Heap (2) is of size 16646144 bytesBuffer Pool Heap (1) is of size 8585216 bytesBuffer Pool Heap (System 32k buffer pool) is of size 720896 bytesBuffer Pool Heap (System 16k buffer pool) is of size 458752 bytesBuffer Pool Heap (System 8k buffer pool) is of size 327680 bytesBuffer Pool Heap (System 4k buffer pool) is of size 262144 bytesShared Sort Heap is of size 65536 bytesLock Manager Heap is of size 393216 bytesDatabase Heap is of size 5111808 bytesOther Memory is of size 131072 bytesTotal: 76087296 bytesStart the MULTI application in a second terminal session using the following commands:
cd $HOME/bin multi tp1st3.cfg
To begin processing transactions, click the RUN button.
Wait for 3 minutes (180 seconds) seconds of Elapsed Time to complete.
Close the MULTI application now.
__ 3. Use the GET SNAPSHOT FOR DATABASE command to collect a set of database statistics for the TP1 database with multiple buffer pools. Save the statistics to a file and in the table SNAPDATA.
In the terminal session, issue the commands:
db2 -tvf savesnap.ddl
db2 get snapshot for database on tp1 > sndb31.txt
vi sndb31.txt
Record the following statistics in the table at the beginning of this lab exercise in the column labeled Multiple Buffer Pools.
Buffer Pool Data Logical Reads Buffer Pool Data Physical Reads BP Data Writes Buffer Pool Index Logical Reads Buffer Pool Index Physical Reads Total buffer pool read time (ms) Total buffer pool write time (ms) No victim buffers available Rows inserted
Course materials may not be reproduced in whole or in part without the prior written permission of IBM.
© Copyright IBM Corp. 2001, 2006 Exercise 3. DB2 Memory Management 3-9

Student Exercises
Log Pages Written
Run the DB2 command file snaphits.sql to list the buffer pool activity for each buffer pool including the hit ratios.
In the terminal session, issue the commands:
db2 connect to tp1
db2 -tvf snaphits.sql
The output will look similar to the following:
SELECT data_physical_reads, index_physical_reads, total_physical_reads, bp_name from sysibmadm.bp_hitratio where bp_name not like 'IBMSYSTEM%'
DATA_PHYSICAL_READS INDEX_PHYSICAL_READS TOTAL_PHYSICAL_READS BP_NAME -------------------- -------------------- -------------------- -------------------------
203 115 318 IBMDEFAULTBP 14 0 14 TP1H16K
6280 0 6280 TP1ADATA 35 3629 3664 TP1AINDX
4 record(s) selected.
SELECT data_logical_reads, index_logical_reads, total_logical_reads, bp_name from sysibmadm.bp_hitratio where bp_name not like 'IBMSYSTEM%'
DATA_LOGICAL_READS INDEX_LOGICAL_READS TOTAL_LOGICAL_READS BP_NAME ------------------- -------------------- -------------------- -------------------------
127443 76607 204050 IBMDEFAULTBP 25342 0 25342 TP1H16K 134484 0 134484 TP1ADATA
39 74879 74918 TP1AINDX
4 record(s) selected.
SELECT data_hit_ratio_percent, index_hit_ratio_percent , total_hit_ratio_percent, bp_name from sysibmadm.bp_hitratio where bp_name not like 'IBMSYSTEM%'
DATA_HIT_RATIO_PERCENT INDEX_HIT_RATIO_PERCENT TOTAL_HIT_RATIO_PERCENT BP_NAME --------------------- ----------------------- ----------------------- -----------------
99.84 99.84 99.84 IBMDEFAULTBP 99.94 - 99.94 TP1H16K 95.33 - 95.33 TP1ADATA 10.25 95.15 95.10 TP1AINDX
4 record(s) selected.
Your results will likely be somewhat different from those above. In general it would be expected that the hit ratio for the small tables in the default buffer pool, IBMDEFAULTBP would be higher that the hit ratio for the buffer pools with the larger tables and indexes.
Course materials may not be reproduced in whole or in part without the prior written permission of IBM.
3-10 DB2 for Linux, UNIX, and Windows © Copyright IBM Corp. 2001, 2006

Student ExercisesV3.1.0.1
EXempty
Run the DB2 command file bpioperformance.sql to check the I/O performance statistics for each buffer pool.In the terminal session, issue the commands:
db2 connect to tp1
db2 -tvf bpioperformace.sql
The output will include information similar to the following:
select substr(bp_name,1,15) as bp_name, total_physical_reads, average_read_time_ms from sysibmadm.bp_read_io where bp_name not like 'IBMSYSTEM%'
BP_NAME TOTAL_PHYSICAL_READS AVERAGE_READ_TIME_MS-------------- -------------------- --------------------IBMDEFAULTBP 318 3TP1H16K 14 4TP1ADATA 6280 22TP1AINDX 3664 25
4 record(s) selected.
select substr(bp_name,1,15) as bp_name, total_writes, average_write_time_ms from sysibmadm.bp_write_io where bp_name not like 'IBMSYSTEM%'
BP_NAME TOTAL_WRITES AVERAGE_WRITE_TIME_MS-------------- -------------------- ---------------------IBMDEFAULTBP 95 27TP1H16K 99 4TP1ADATA 7943 16TP1AINDX 0 -
4 record(s) selected.
Your results will likely be somewhat different from those above. These show that almost all of the disk reads are associated with the buffer pools TP1ADATA and TP1AINDX that support the ACCT table. Notice that since the ACCT table is being updated but no new rows are inserted or deleted, the indexes are only being read. The index buffer pool in the above report shows no write activity at all. New rows are being inserted into the HISTORY table, but the buffer pool is large enough to hold the changes without the need to do many writes.
Course materials may not be reproduced in whole or in part without the prior written permission of IBM.
© Copyright IBM Corp. 2001, 2006 Exercise 3. DB2 Memory Management 3-11

Student Exercises
Section 3 - Sort Activity and Sortheap Configuration
__ 1. The application SQLTP1ST does not require any sorting for its SQL processing. The TP1 database was configured with a small value for sortheap, 256 pages. A query will be run that produces a large sorted result set. Deactivate the database TP1 to clear all database statistics before the next performance test. The DBM instance will be stopped to clear its sort related statistics.
In the terminal session, issue the commands:
db2 terminate
db2 force application all db2 deactivate db tp1
db2stop db2start
db2 connect to tp1
Run the following query using the file sortquery.sql that contains the following sql statement:
select name, address from acct where acct_grp < 50 order by name
Note: The large result output will be piped to the UNIX grep command to avoid saving or viewing the result.
db2 –tf sortquery.sql | grep selected
The query will run for some time. Wait for the command to end normally.
__ 2. Use the GET SNAPSHOT command to collect sort related statistics from the TP1 database and the DBM instance.
In the terminal session, issue the commands:
db2 get snapshot for database on tp1 | grep -i sort
The output will look similar to this:
Total Private Sort heap allocated = 0Total Shared Sort heap allocated = 0Shared Sort heap high water mark = 256Post threshold sorts (shared memory = 0Total sorts = 1Total sort time (ms) = 203Sort overflows = 1Active sorts = 0
db2 get snapshot for dbm | grep -i sort
The output will look similar to this:
Private Sort heap allocated = 0
Course materials may not be reproduced in whole or in part without the prior written permission of IBM.
3-12 DB2 for Linux, UNIX, and Windows © Copyright IBM Corp. 2001, 2006

Student ExercisesV3.1.0.1
EXempty
Private Sort heap high water mark = 0Post threshold sorts = 0Piped sorts requested = 1Piped sorts accepted = 1Sorting Information (SORT) = ON 06-11-2006 06:54:28.000040Record the following statistics from your output:
Total Sorts = ______________________
Sort Overflows = ___________________
Total sort time (ms) = ______________
Shared Sort heap high water mark = ________________
Piped sorts requested = ____________________
Piped sorts accepted = ____________________
__ 3. This large result overflowed the allocated sort heap space. This overflow of sort heap will use space in the temporary table space TEMPSPACE1. Use the GET SNAPSHOT command to examine the activity in the TEMPSPACE1 table space, caused by the sorting or the result. Use Notepad
In the terminal session, issue the commands:
db2 get snapshot for tablespaces on tp1 > sntssort1.txt
vi sntssort1.txt
The report will contain a section for TEMPSPACE1 similar to this:
Tablespace name = TEMPSPACE1
Tablespace name = TEMPSPACE1 Tablespace ID = 1 Tablespace Type = System managed space Tablespace Content Type = System Temporary data Tablespace Page size (bytes) = 4096 Tablespace Extent size (pages) = 32 Automatic Prefetch size enabled = Yes Buffer pool ID currently in use = 1 Buffer pool ID next startup = 1 File system caching = Yes Tablespace State = 0x'00000000' Detailed explanation: Normal Tablespace Prefetch size (pages) = 32 Total number of pages = 33 Number of usable pages = 33 Number of used pages = 33 Minimum Recovery Time =
Course materials may not be reproduced in whole or in part without the prior written permission of IBM.
© Copyright IBM Corp. 2001, 2006 Exercise 3. DB2 Memory Management 3-13
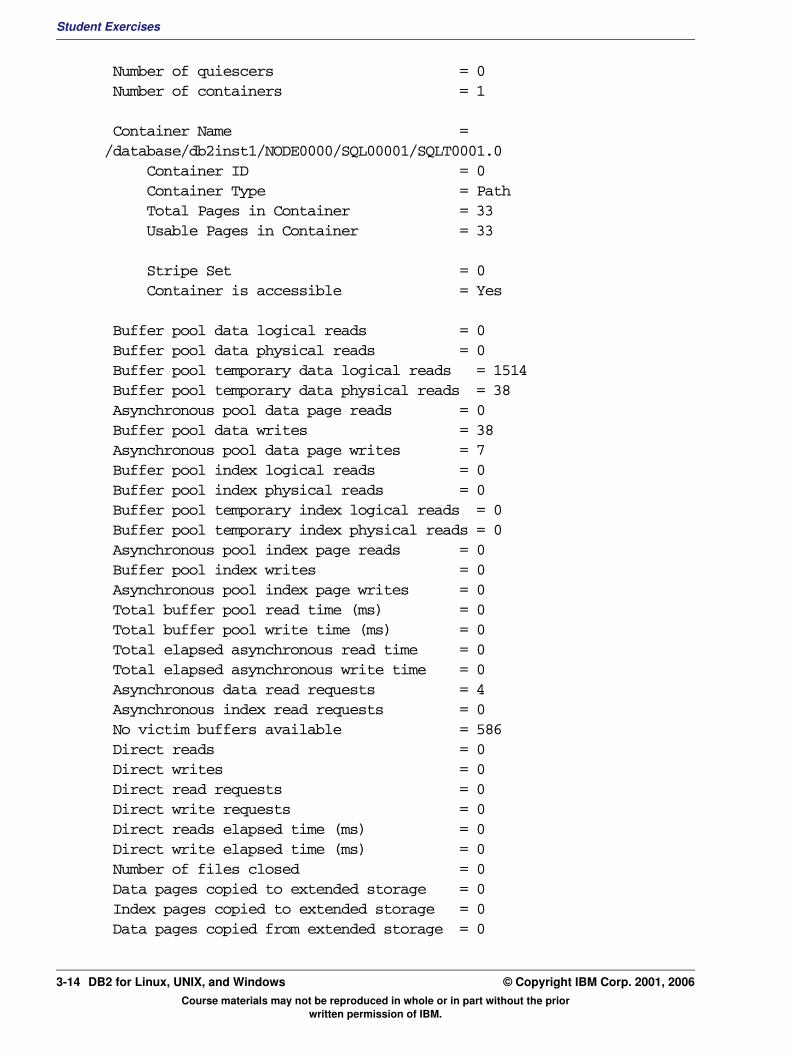
Student Exercises
Number of quiescers = 0 Number of containers = 1
Container Name = /database/db2inst1/NODE0000/SQL00001/SQLT0001.0 Container ID = 0 Container Type = Path Total Pages in Container = 33 Usable Pages in Container = 33 Stripe Set = 0 Container is accessible = Yes
Buffer pool data logical reads = 0 Buffer pool data physical reads = 0 Buffer pool temporary data logical reads = 1514 Buffer pool temporary data physical reads = 38 Asynchronous pool data page reads = 0 Buffer pool data writes = 38 Asynchronous pool data page writes = 7 Buffer pool index logical reads = 0 Buffer pool index physical reads = 0 Buffer pool temporary index logical reads = 0 Buffer pool temporary index physical reads = 0 Asynchronous pool index page reads = 0 Buffer pool index writes = 0 Asynchronous pool index page writes = 0 Total buffer pool read time (ms) = 0 Total buffer pool write time (ms) = 0 Total elapsed asynchronous read time = 0 Total elapsed asynchronous write time = 0 Asynchronous data read requests = 4 Asynchronous index read requests = 0 No victim buffers available = 586 Direct reads = 0 Direct writes = 0 Direct read requests = 0 Direct write requests = 0 Direct reads elapsed time (ms) = 0 Direct write elapsed time (ms) = 0 Number of files closed = 0 Data pages copied to extended storage = 0 Index pages copied to extended storage = 0 Data pages copied from extended storage = 0
Course materials may not be reproduced in whole or in part without the prior written permission of IBM.
3-14 DB2 for Linux, UNIX, and Windows © Copyright IBM Corp. 2001, 2006
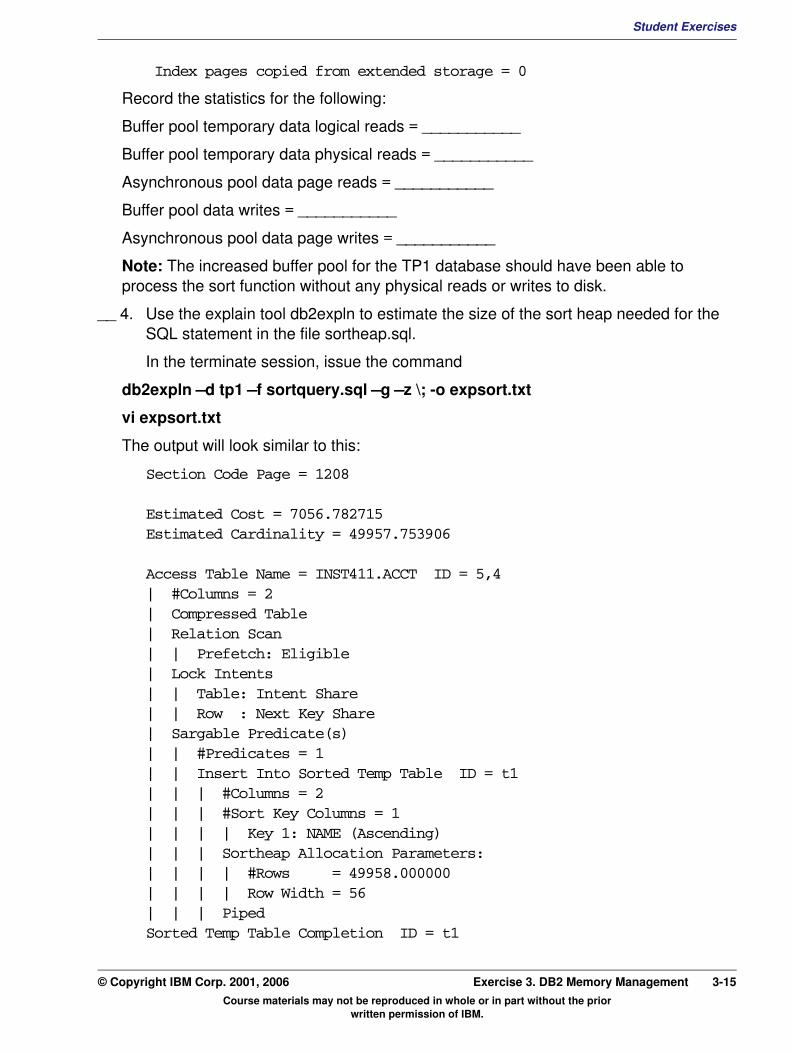
Student ExercisesV3.1.0.1
EXempty
Index pages copied from extended storage = 0Record the statistics for the following:
Buffer pool temporary data logical reads = ___________
Buffer pool temporary data physical reads = ___________
Asynchronous pool data page reads = ___________
Buffer pool data writes = ___________
Asynchronous pool data page writes = ___________
Note: The increased buffer pool for the TP1 database should have been able to process the sort function without any physical reads or writes to disk.
__ 4. Use the explain tool db2expln to estimate the size of the sort heap needed for the SQL statement in the file sortheap.sql.
In the terminate session, issue the command
db2expln –d tp1 –f sortquery.sql –g –z \; -o expsort.txt
vi expsort.txt
The output will look similar to this:
Section Code Page = 1208
Estimated Cost = 7056.782715Estimated Cardinality = 49957.753906
Access Table Name = INST411.ACCT ID = 5,4| #Columns = 2| Compressed Table| Relation Scan| | Prefetch: Eligible| Lock Intents| | Table: Intent Share| | Row : Next Key Share| Sargable Predicate(s)| | #Predicates = 1| | Insert Into Sorted Temp Table ID = t1| | | #Columns = 2| | | #Sort Key Columns = 1| | | | Key 1: NAME (Ascending)| | | Sortheap Allocation Parameters:| | | | #Rows = 49958.000000| | | | Row Width = 56| | | PipedSorted Temp Table Completion ID = t1
Course materials may not be reproduced in whole or in part without the prior written permission of IBM.
© Copyright IBM Corp. 2001, 2006 Exercise 3. DB2 Memory Management 3-15
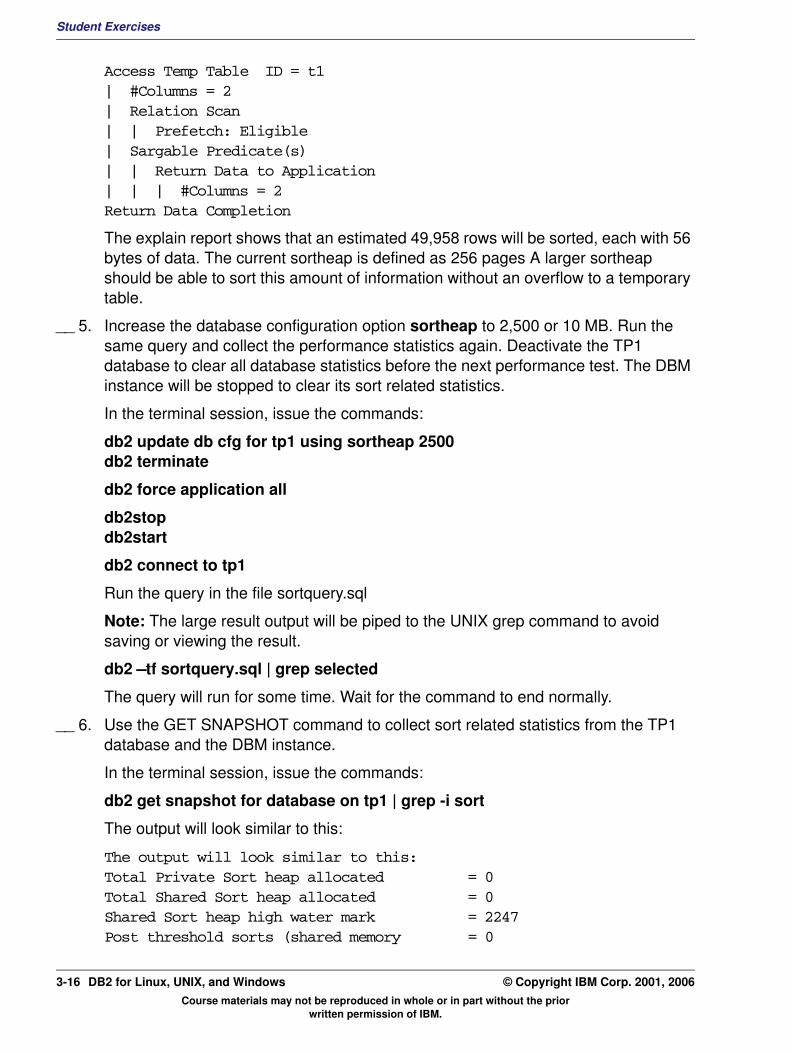
Student Exercises
Access Temp Table ID = t1| #Columns = 2| Relation Scan| | Prefetch: Eligible| Sargable Predicate(s)| | Return Data to Application| | | #Columns = 2Return Data Completion
The explain report shows that an estimated 49,958 rows will be sorted, each with 56 bytes of data. The current sortheap is defined as 256 pages A larger sortheap should be able to sort this amount of information without an overflow to a temporary table.
__ 5. Increase the database configuration option sortheap to 2,500 or 10 MB. Run the same query and collect the performance statistics again. Deactivate the TP1 database to clear all database statistics before the next performance test. The DBM instance will be stopped to clear its sort related statistics.
In the terminal session, issue the commands:
db2 update db cfg for tp1 using sortheap 2500 db2 terminate
db2 force application all
db2stop db2start
db2 connect to tp1
Run the query in the file sortquery.sql
Note: The large result output will be piped to the UNIX grep command to avoid saving or viewing the result.
db2 –tf sortquery.sql | grep selected
The query will run for some time. Wait for the command to end normally.
__ 6. Use the GET SNAPSHOT command to collect sort related statistics from the TP1 database and the DBM instance.
In the terminal session, issue the commands:
db2 get snapshot for database on tp1 | grep -i sort
The output will look similar to this:
The output will look similar to this: Total Private Sort heap allocated = 0Total Shared Sort heap allocated = 0Shared Sort heap high water mark = 2247Post threshold sorts (shared memory = 0
Course materials may not be reproduced in whole or in part without the prior written permission of IBM.
3-16 DB2 for Linux, UNIX, and Windows © Copyright IBM Corp. 2001, 2006
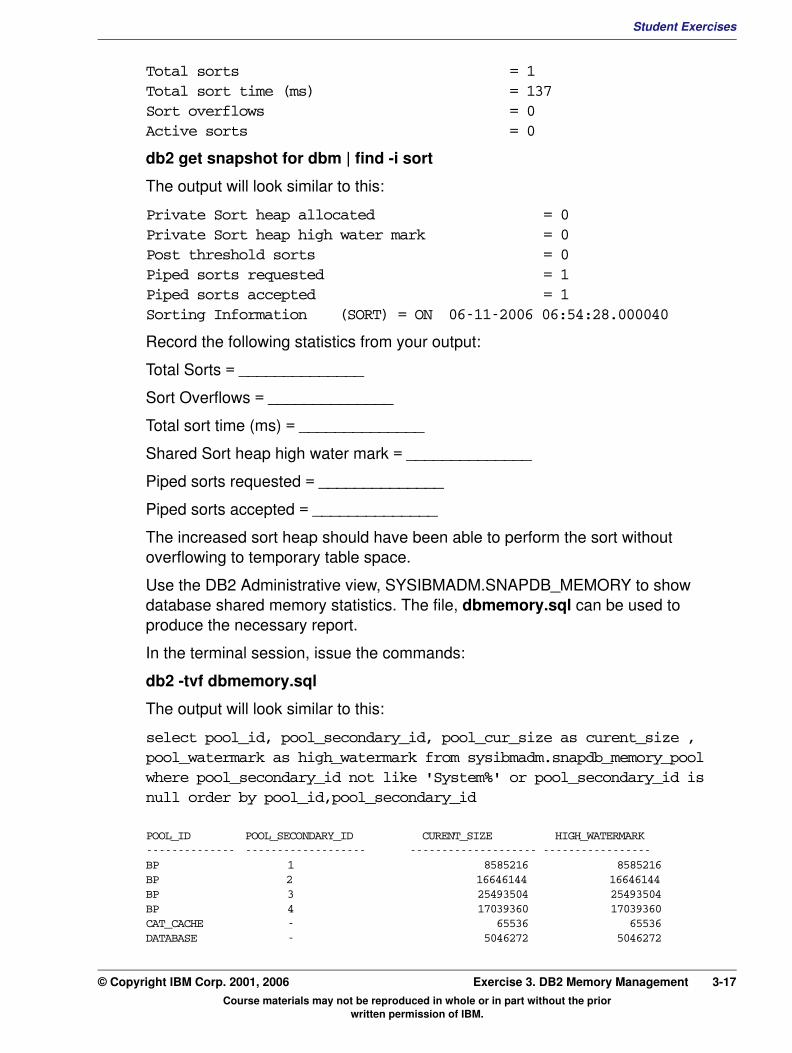
Student ExercisesV3.1.0.1
EXempty
Total sorts = 1Total sort time (ms) = 137Sort overflows = 0Active sorts = 0db2 get snapshot for dbm | find -i sort
The output will look similar to this:
Private Sort heap allocated = 0Private Sort heap high water mark = 0Post threshold sorts = 0Piped sorts requested = 1Piped sorts accepted = 1Sorting Information (SORT) = ON 06-11-2006 06:54:28.000040
Record the following statistics from your output:
Total Sorts = ______________
Sort Overflows = ______________
Total sort time (ms) = ______________
Shared Sort heap high water mark = ______________
Piped sorts requested = ______________
Piped sorts accepted = ______________
The increased sort heap should have been able to perform the sort without overflowing to temporary table space.
Use the DB2 Administrative view, SYSIBMADM.SNAPDB_MEMORY to show database shared memory statistics. The file, dbmemory.sql can be used to produce the necessary report.
In the terminal session, issue the commands:
db2 -tvf dbmemory.sql
The output will look similar to this:
select pool_id, pool_secondary_id, pool_cur_size as curent_size , pool_watermark as high_watermark from sysibmadm.snapdb_memory_pool where pool_secondary_id not like 'System%' or pool_secondary_id is null order by pool_id,pool_secondary_id
POOL_ID POOL_SECONDARY_ID CURENT_SIZE HIGH_WATERMARK -------------- ------------------- -------------------- -----------------BP 1 8585216 8585216BP 2 16646144 16646144BP 3 25493504 25493504BP 4 17039360 17039360CAT_CACHE - 65536 65536DATABASE - 5046272 5046272
Course materials may not be reproduced in whole or in part without the prior written permission of IBM.
© Copyright IBM Corp. 2001, 2006 Exercise 3. DB2 Memory Management 3-17

Student Exercises
LOCK_MGR - 393216 393216OTHER - 131072 131072PACKAGE_CACHE - 262144 262144SHARED_SORT - 0 5505024UTILITY - 65536 65536
11 record(s) selected.
__ 7. Close the connection now.
In the terminal session, issue the commands:
db2 terminate
END OF EXERCISE
Course materials may not be reproduced in whole or in part without the prior written permission of IBM.
3-18 DB2 for Linux, UNIX, and Windows © Copyright IBM Corp. 2001, 2006
Student ExercisesV3.1.0.1
EXempty
Exercise 4. DB2 Automated Memory ManagementWhat This Exercise Is About
This exercise is an online lab which allows the student to configure a DB2 database to implement the Self Tuning Memory Management function to automatically adjust the database memory configuration.
What You Should Be Able to Do
At the end of the lab, you should be able to:
• Use the DB2 command db2mtrk to collect information about the current status of database memory heaps that are being managed by STMM.
• Configure a database for Self Tuning Memory.
• Use db2pd command options to retrieve statistics about database memory usage.
• Review the changes made by STMM from messages in the db2diag.log file.
Course materials may not be reproduced in whole or in part without the prior written permission of IBM.
© Copyright IBM Corp. 2001, 2006 Exercise 4. DB2 Automated Memory Management 4-1
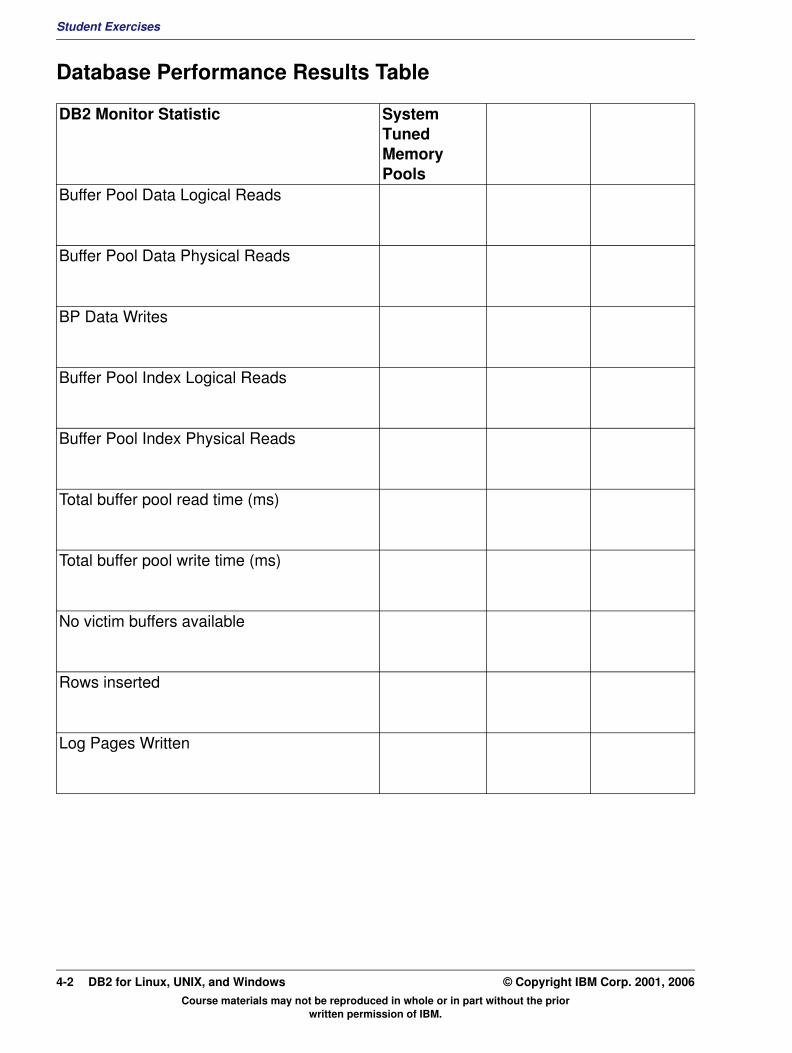
Student Exercises
Database Performance Results Table
DB2 Monitor Statistic System Tuned Memory Pools
Buffer Pool Data Logical Reads
Buffer Pool Data Physical Reads
BP Data Writes
Buffer Pool Index Logical Reads
Buffer Pool Index Physical Reads
Total buffer pool read time (ms)
Total buffer pool write time (ms)
No victim buffers available
Rows inserted
Log Pages Written
Course materials may not be reproduced in whole or in part without the prior written permission of IBM.
4-2 DB2 for Linux, UNIX, and Windows © Copyright IBM Corp. 2001, 2006
Student ExercisesV3.1.0.1
EXempty
Exercise InstructionsIntroduction
In this exercise, you will be configuring the TP1 database for self tuning memory. The MULTI applications will run for 30 minutes, to allow the STMM function to adjust the database buffer pools and memory heaps for the applications.
Note: The first section of the lab should be run immediately following the previous exercise.This allows the 30 minutes of automated processing to overlap with the lecture time for the automatic memory management unit.
A new set of performance tests will be run to check the transaction performance after the memory has been tuned by STMM. The db2mtrk and db2pd commands will be used to collect statistics about buffer pool and database memory heap sizes.
Course materials may not be reproduced in whole or in part without the prior written permission of IBM.
© Copyright IBM Corp. 2001, 2006 Exercise 4. DB2 Automated Memory Management 4-3
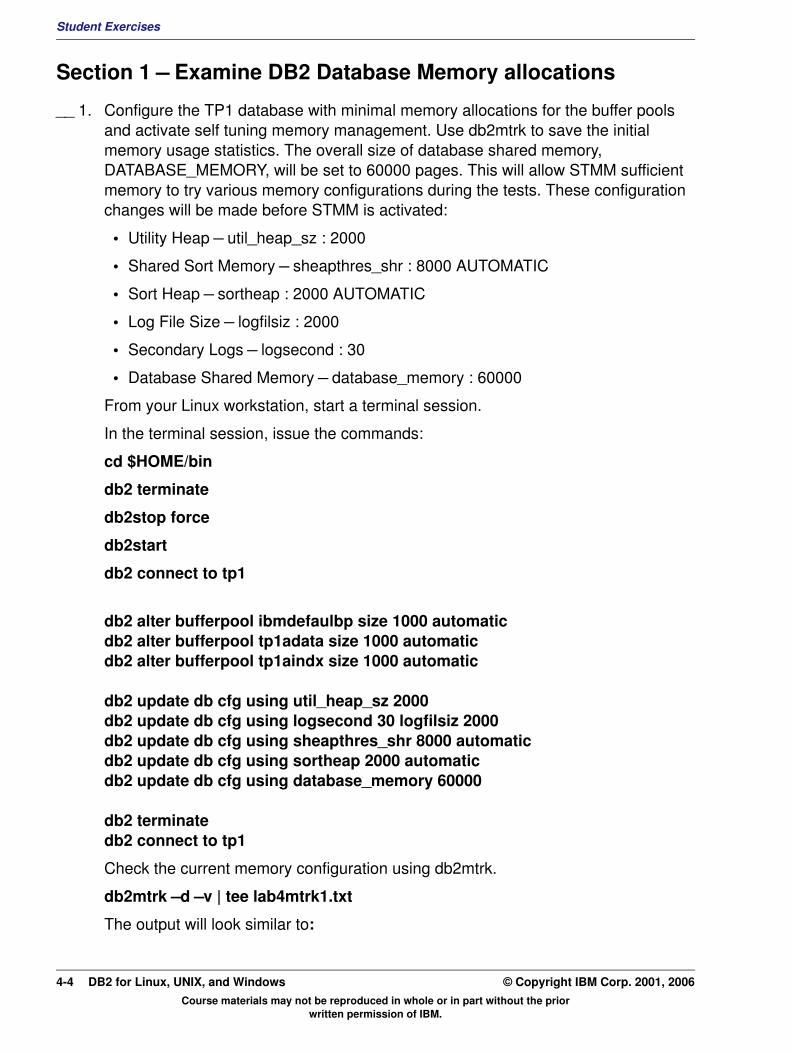
Student Exercises
Section 1 – Examine DB2 Database Memory allocations
__ 1. Configure the TP1 database with minimal memory allocations for the buffer pools and activate self tuning memory management. Use db2mtrk to save the initial memory usage statistics. The overall size of database shared memory, DATABASE_MEMORY, will be set to 60000 pages. This will allow STMM sufficient memory to try various memory configurations during the tests. These configuration changes will be made before STMM is activated:
• Utility Heap – util_heap_sz : 2000
• Shared Sort Memory – sheapthres_shr : 8000 AUTOMATIC
• Sort Heap – sortheap : 2000 AUTOMATIC
• Log File Size – logfilsiz : 2000
• Secondary Logs – logsecond : 30
• Database Shared Memory – database_memory : 60000
From your Linux workstation, start a terminal session.
In the terminal session, issue the commands:
cd $HOME/bin
db2 terminate
db2stop force
db2start
db2 connect to tp1
db2 alter bufferpool ibmdefaulbp size 1000 automatic db2 alter bufferpool tp1adata size 1000 automatic db2 alter bufferpool tp1aindx size 1000 automatic
db2 update db cfg using util_heap_sz 2000 db2 update db cfg using logsecond 30 logfilsiz 2000 db2 update db cfg using sheapthres_shr 8000 automatic db2 update db cfg using sortheap 2000 automaticdb2 update db cfg using database_memory 60000
db2 terminatedb2 connect to tp1
Check the current memory configuration using db2mtrk.
db2mtrk –d –v | tee lab4mtrk1.txt
The output will look similar to:
Course materials may not be reproduced in whole or in part without the prior written permission of IBM.
4-4 DB2 for Linux, UNIX, and Windows © Copyright IBM Corp. 2001, 2006

Student ExercisesV3.1.0.1
EXempty
Tracking Memory on: 2006/11/02 at 16:53:39Tracking Memory on: 2006/11/21 at 07:28:47
Memory for database: TP1
Backup/Restore/Util Heap is of size 65536 bytesPackage Cache is of size 131072 bytesCatalog Cache Heap is of size 65536 bytesBuffer Pool Heap (4) is of size 4521984 bytesBuffer Pool Heap (3) is of size 4521984 bytesBuffer Pool Heap (2) is of size 16646144 bytesBuffer Pool Heap (1) is of size 4521984 bytesBuffer Pool Heap (System 32k buffer pool) is of size 720896 bytesBuffer Pool Heap (System 16k buffer pool) is of size 458752 bytesBuffer Pool Heap (System 8k buffer pool) is of size 327680 bytesBuffer Pool Heap (System 4k buffer pool) is of size 262144 bytesShared Sort Heap is of size 65536 bytesLock Manager Heap is of size 393216 bytesDatabase Heap is of size 4915200 bytesOther Memory is of size 131072 bytesTotal: 37748736 bytes
Use db2pd to examine the memory sets.
db2pd –db tp1 –memsets | tee lab4mset1.txt
The output will look similar to:
Database Partition 0 -- Database TP1 -- Active -- Up 0 days 00:04:11
Memory Sets:Name Address Id Size(Kb) Key DBP Type Unrsv(Kb) Used(Kb) TP1 0x134B0000 1114128 240128 0x0 0 1 143424 36928 App23 0x00000000 0 0 0x0 0 0 0 0 App22 0x00000000 0 0 0x0 0 0 0 0 App21 0x00000000 0 0 0x0 0 0 0 0 App20 0xB74BE000 1081359 128 0x0 0 3 0 128
The total size of database memory for the TP1 database is 240,128 KB. The current configuration is using 36,928 KB. STMM will be activated and allowed to reconfigure the memory heaps and buffer pools to run the applications more efficiently.
In the terminal session, issue the command:
db2 update db cfg using self_tuning_mem on
Course materials may not be reproduced in whole or in part without the prior written permission of IBM.
© Copyright IBM Corp. 2001, 2006 Exercise 4. DB2 Automated Memory Management 4-5
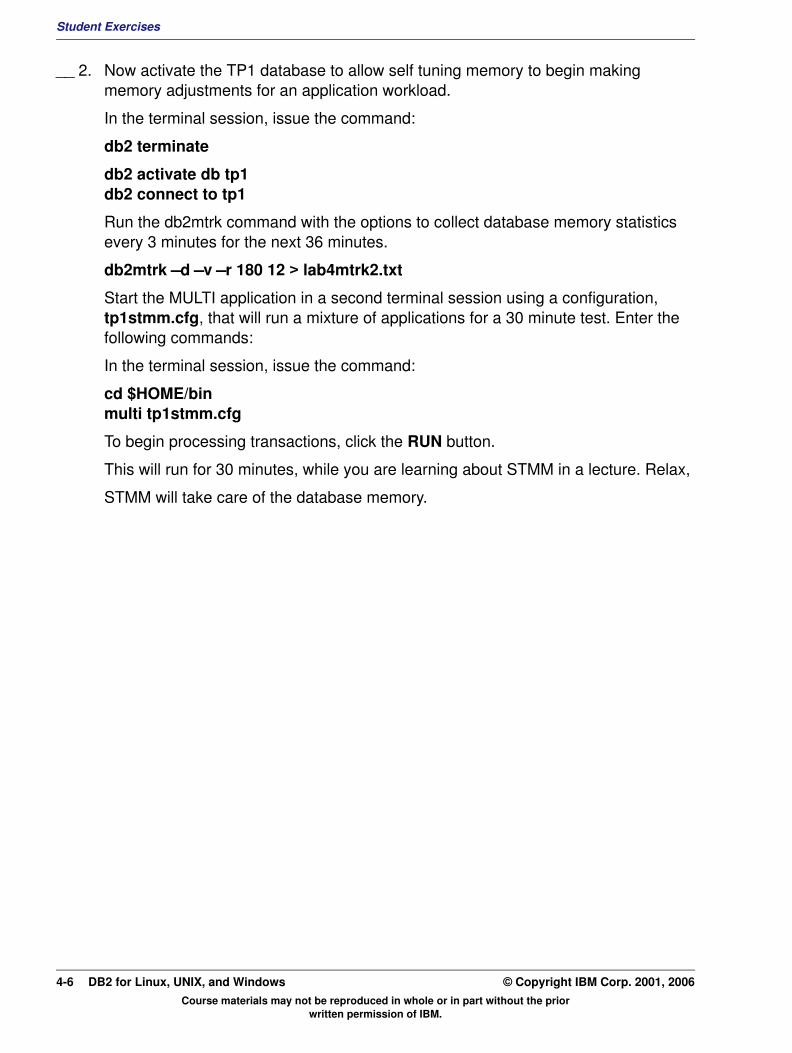
Student Exercises
__ 2. Now activate the TP1 database to allow self tuning memory to begin making memory adjustments for an application workload.
In the terminal session, issue the command:
db2 terminate
db2 activate db tp1db2 connect to tp1
Run the db2mtrk command with the options to collect database memory statistics every 3 minutes for the next 36 minutes.
db2mtrk –d –v –r 180 12 > lab4mtrk2.txt
Start the MULTI application in a second terminal session using a configuration, tp1stmm.cfg, that will run a mixture of applications for a 30 minute test. Enter the following commands:
In the terminal session, issue the command:
cd $HOME/bin multi tp1stmm.cfg
To begin processing transactions, click the RUN button.
This will run for 30 minutes, while you are learning about STMM in a lecture. Relax,
STMM will take care of the database memory.
Course materials may not be reproduced in whole or in part without the prior written permission of IBM.
4-6 DB2 for Linux, UNIX, and Windows © Copyright IBM Corp. 2001, 2006
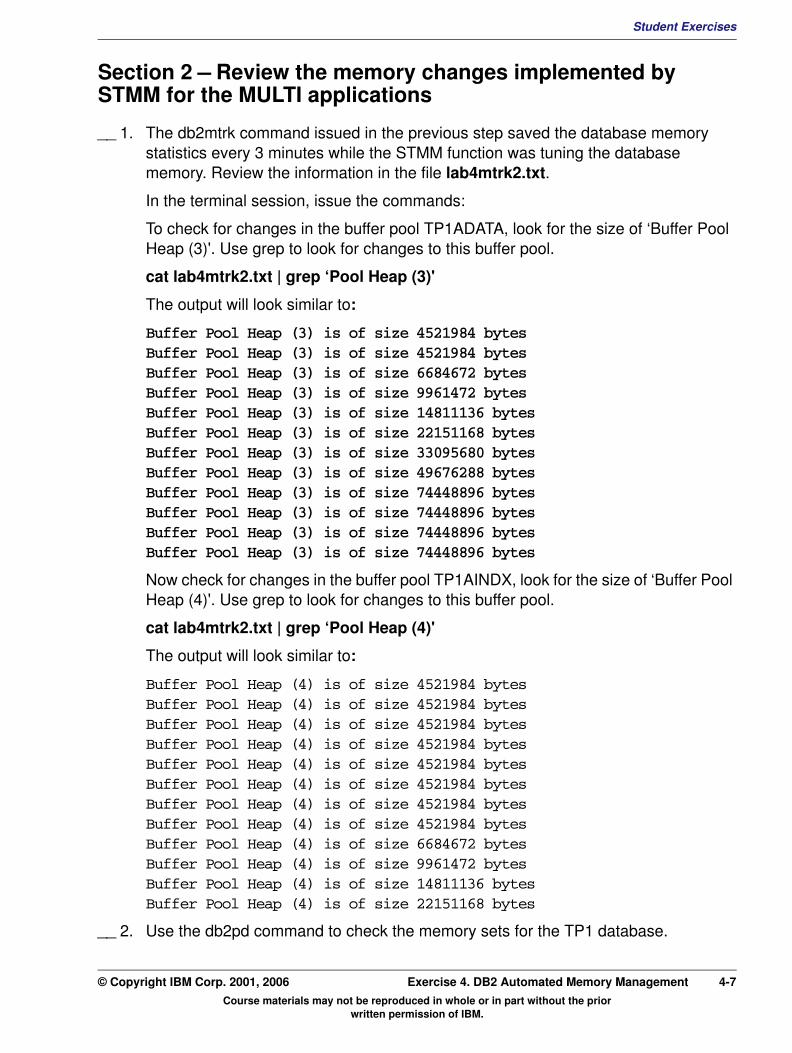
Student ExercisesV3.1.0.1
EXempty
Section 2 – Review the memory changes implemented by STMM for the MULTI applications__ 1. The db2mtrk command issued in the previous step saved the database memory statistics every 3 minutes while the STMM function was tuning the database memory. Review the information in the file lab4mtrk2.txt.
In the terminal session, issue the commands:
To check for changes in the buffer pool TP1ADATA, look for the size of ‘Buffer Pool Heap (3)'. Use grep to look for changes to this buffer pool.
cat lab4mtrk2.txt | grep ‘Pool Heap (3)'
The output will look similar to:
Buffer Pool Heap (3) is of size 4521984 bytesBuffer Pool Heap (3) is of size 4521984 bytesBuffer Pool Heap (3) is of size 6684672 bytesBuffer Pool Heap (3) is of size 9961472 bytesBuffer Pool Heap (3) is of size 14811136 bytesBuffer Pool Heap (3) is of size 22151168 bytesBuffer Pool Heap (3) is of size 33095680 bytesBuffer Pool Heap (3) is of size 49676288 bytesBuffer Pool Heap (3) is of size 74448896 bytesBuffer Pool Heap (3) is of size 74448896 bytesBuffer Pool Heap (3) is of size 74448896 bytesBuffer Pool Heap (3) is of size 74448896 bytes
Now check for changes in the buffer pool TP1AINDX, look for the size of ‘Buffer Pool Heap (4)'. Use grep to look for changes to this buffer pool.
cat lab4mtrk2.txt | grep ‘Pool Heap (4)'
The output will look similar to:
Buffer Pool Heap (4) is of size 4521984 bytesBuffer Pool Heap (4) is of size 4521984 bytesBuffer Pool Heap (4) is of size 4521984 bytesBuffer Pool Heap (4) is of size 4521984 bytesBuffer Pool Heap (4) is of size 4521984 bytesBuffer Pool Heap (4) is of size 4521984 bytesBuffer Pool Heap (4) is of size 4521984 bytesBuffer Pool Heap (4) is of size 4521984 bytesBuffer Pool Heap (4) is of size 6684672 bytesBuffer Pool Heap (4) is of size 9961472 bytesBuffer Pool Heap (4) is of size 14811136 bytesBuffer Pool Heap (4) is of size 22151168 bytes
__ 2. Use the db2pd command to check the memory sets for the TP1 database.
Course materials may not be reproduced in whole or in part without the prior written permission of IBM.
© Copyright IBM Corp. 2001, 2006 Exercise 4. DB2 Automated Memory Management 4-7

Student Exercises
In the terminal session, issue the commands:
db2pd –db tp1 –memsets | tee lab4mset2.txt
The output will include information similar to the following:
Database Partition 0 -- Database TP1 -- Active -- Up 0 days 01:31:21
Memory Sets:Name Address Id Size(Kb) Key DBP Type Unrsv(Kb) Used(Kb) TP1 0x134B0000 1638416 240128 0x0 0 1 57920 122752 App41 0x00000000 0 0 0x0 0 0 0 0 App40 0x00000000 0 0 0x0 0 0 0 0 App39 0x00000000 0 0 0x0 0 0 0 0
In the example shown, STMM has increased the ‘Used’ memory for the TP1 database to 122,752K over the 30 minutes of testing. Use a query, in the file dbmemory.sql to show current memory heap sizes.
In the terminal session, issue the commands:
db2 –tvf dbmemory.sql > lab4dbmem2.txt
The output will include information similar to the following:
select pool_id, pool_secondary_id, pool_cur_size as curent_size , pool_watermark as high_watermark from sysibmadm.snapdb_memory_pool where pool_secondary_id not like 'System%' or pool_secondary_id is null order by pool_id,pool_secondary_id
POOL_ID POOL_SECONDARY_ID CURENT_SIZE HIGH_WATERMARK ------------- ------------------ -------------------- --------------------BP 1 4521984 4521984BP 2 16646144 16646144BP 3 74448896 74448896BP 4 22151168 22151168CAT_CACHE - 65536 65536DATABASE - 5111808 5111808LOCK_MGR - 393216 393216OTHER - 131072 131072PACKAGE_CACHE - 327680 327680SHARED_SORT - 196608 196608UTILITY - 65536 65536
11 record(s) selected.
__ 3. Use the vi editor to examine the list of db2mtrk reports in the file lab4mtrk2.txt. Record the memory size of each are from the first and last reports.
In the terminal session, issue the commands:
vi lab4mtrk2.txt
Course materials may not be reproduced in whole or in part without the prior written permission of IBM.
4-8 DB2 for Linux, UNIX, and Windows © Copyright IBM Corp. 2001, 2006

Student ExercisesV3.1.0.1
EXempty
__ 4. Use the db2diag command to locate the informational messages in the db2diag.log file that were generated by the memory changes made by STMM.
In the terminal session, issue the commands:
db2diag -gi message:=automatic
The output will include information similar to the following:
2006-10-31-07.02.06.374240-300 I1803G455 LEVEL: InfoPID : 3687 TID : 3086804672 PROC : db2stmm (TP1) 0INSTANCE: inst411 NODE : 000 DB : TP1APPHDL : 0-8 APPID: *LOCAL.inst411.061031115900AUTHID : INST411 FUNCTION: DB2 UDB, buffer pool services, sqlbAlterBufferPoolAct, probe:90MESSAGE : Altering bufferpool "TP1ADATA" From: "1000" <automatic> To: "1512" <automatic>
2006-10-31-07.05.06.858684-300 I2259G455 LEVEL: InfoPID : 3687 TID : 3086804672 PROC : db2stmm (TP1) 0INSTANCE: inst411 NODE : 000 DB : TP1APPHDL : 0-8 APPID: *LOCAL.inst411.061031115900AUTHID : INST411 FUNCTION: DB2 UDB, buffer pool services, sqlbAlterBufferPoolAct, probe:90MESSAGE : Altering bufferpool "TP1ADATA" From: "1512" <automatic> To: "2280" <automatic>
2006-10-31-07.08.08.044027-300 I3159G455 LEVEL: InfoPID : 3687 TID : 3086804672 PROC : db2stmm (TP1) 0INSTANCE: inst411 NODE : 000 DB : TP1APPHDL : 0-8 APPID: *LOCAL.inst411.061031115900AUTHID : INST411 FUNCTION: DB2 UDB, buffer pool services, sqlbAlterBufferPoolAct, probe:90MESSAGE : Altering bufferpool "TP1ADATA" From: "2280" <automatic> To: "3432" <automatic>
2006-10-31-07.11.08.506849-300 I4059G455 LEVEL: Info
Memory Heap Description Size in First db2mtrk report
Size in Last db2mtrk Report
Backup/Restore/Util HeapPackage CacheCatalog Cache HeapBuffer Pool Heap (4)Buffer Pool Heap (3)Buffer Pool Heap (2)Buffer Pool Heap (1)Shared Sort HeapLock Manager Heap
Course materials may not be reproduced in whole or in part without the prior written permission of IBM.
© Copyright IBM Corp. 2001, 2006 Exercise 4. DB2 Automated Memory Management 4-9
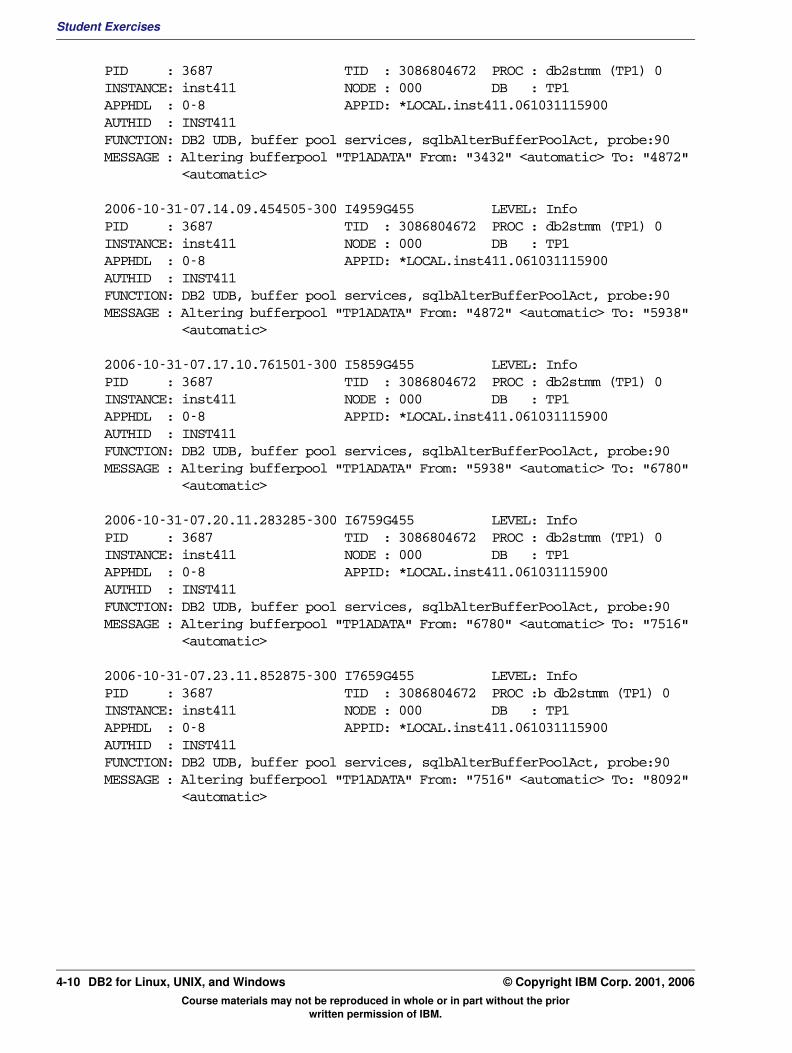
Student Exercises
PID : 3687 TID : 3086804672 PROC : db2stmm (TP1) 0INSTANCE: inst411 NODE : 000 DB : TP1APPHDL : 0-8 APPID: *LOCAL.inst411.061031115900AUTHID : INST411 FUNCTION: DB2 UDB, buffer pool services, sqlbAlterBufferPoolAct, probe:90MESSAGE : Altering bufferpool "TP1ADATA" From: "3432" <automatic> To: "4872" <automatic>
2006-10-31-07.14.09.454505-300 I4959G455 LEVEL: InfoPID : 3687 TID : 3086804672 PROC : db2stmm (TP1) 0INSTANCE: inst411 NODE : 000 DB : TP1APPHDL : 0-8 APPID: *LOCAL.inst411.061031115900AUTHID : INST411 FUNCTION: DB2 UDB, buffer pool services, sqlbAlterBufferPoolAct, probe:90MESSAGE : Altering bufferpool "TP1ADATA" From: "4872" <automatic> To: "5938" <automatic>
2006-10-31-07.17.10.761501-300 I5859G455 LEVEL: InfoPID : 3687 TID : 3086804672 PROC : db2stmm (TP1) 0INSTANCE: inst411 NODE : 000 DB : TP1APPHDL : 0-8 APPID: *LOCAL.inst411.061031115900AUTHID : INST411 FUNCTION: DB2 UDB, buffer pool services, sqlbAlterBufferPoolAct, probe:90MESSAGE : Altering bufferpool "TP1ADATA" From: "5938" <automatic> To: "6780" <automatic>
2006-10-31-07.20.11.283285-300 I6759G455 LEVEL: InfoPID : 3687 TID : 3086804672 PROC : db2stmm (TP1) 0INSTANCE: inst411 NODE : 000 DB : TP1APPHDL : 0-8 APPID: *LOCAL.inst411.061031115900AUTHID : INST411 FUNCTION: DB2 UDB, buffer pool services, sqlbAlterBufferPoolAct, probe:90MESSAGE : Altering bufferpool "TP1ADATA" From: "6780" <automatic> To: "7516" <automatic>
2006-10-31-07.23.11.852875-300 I7659G455 LEVEL: InfoPID : 3687 TID : 3086804672 PROC :b db2stmm (TP1) 0INSTANCE: inst411 NODE : 000 DB : TP1APPHDL : 0-8 APPID: *LOCAL.inst411.061031115900AUTHID : INST411 FUNCTION: DB2 UDB, buffer pool services, sqlbAlterBufferPoolAct, probe:90MESSAGE : Altering bufferpool "TP1ADATA" From: "7516" <automatic> To: "8092" <automatic>
Course materials may not be reproduced in whole or in part without the prior written permission of IBM.
4-10 DB2 for Linux, UNIX, and Windows © Copyright IBM Corp. 2001, 2006
Student ExercisesV3.1.0.1
EXempty
Section 3 – Collect performance statistics with the new memory Configuration__ 1. The database will need to be stopped and reactivated to reset database statistics. Run three minute of MULTI transactions and collect the database statistics using a GET SNAPSHOT for database command and SQL queries.
In the terminal session, issue the commands:
db2 terminate
db2 force application all db2 deactivate db tp1 db2 activate db tp1 db2 connect to tp1
Start the MULTI application in a second terminal session using the following commands:
cd $HOME/bin multi tp1st3.cfg
To begin processing transactions, click the RUN button.
Wait for 3 minutes (180 seconds) seconds of Elapsed Time to complete.
Close the MULTI application now.
__ 2. Use the GET SNAPSHOT FOR DATABASE command to collect a set of database statistics for the TP1 database with multiple buffer pools. Save the statistics to a file and in the table SNAPDATA.
In the terminal session, issue the commands:
db2 -tvf savesnap.ddl
db2 get snapshot for database on tp1 > sndb41.txt
vi sndb41.txt
Record the following statistics in the table at the beginning of this lab exercise in the column labeled System Tuned Memory Pools.
Buffer Pool Data Logical Reads Buffer Pool Data Physical Reads BP Data Writes Buffer Pool Index Logical Reads Buffer Pool Index Physical Reads Total buffer pool read time (ms) Total buffer pool write time (ms) No victim buffers available Rows inserted Log Pages Written
Course materials may not be reproduced in whole or in part without the prior written permission of IBM.
© Copyright IBM Corp. 2001, 2006 Exercise 4. DB2 Automated Memory Management 4-11
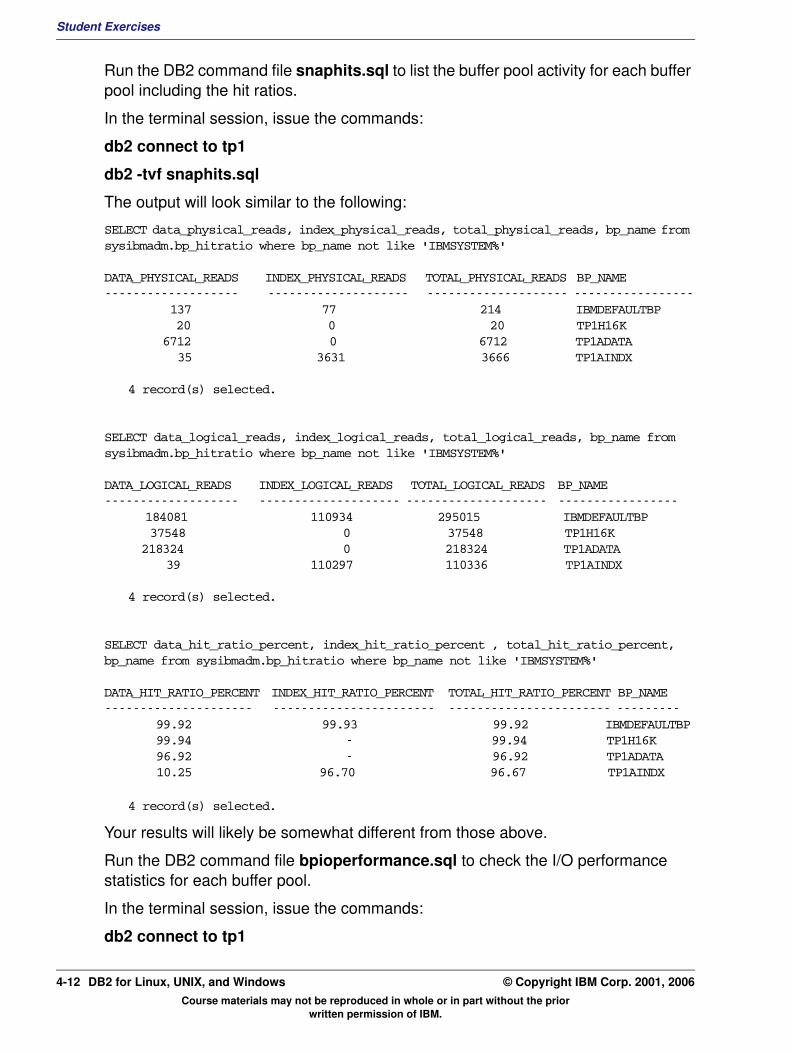
Student Exercises
Run the DB2 command file snaphits.sql to list the buffer pool activity for each buffer pool including the hit ratios.
In the terminal session, issue the commands:
db2 connect to tp1
db2 -tvf snaphits.sql
The output will look similar to the following:
SELECT data_physical_reads, index_physical_reads, total_physical_reads, bp_name from sysibmadm.bp_hitratio where bp_name not like 'IBMSYSTEM%'
DATA_PHYSICAL_READS INDEX_PHYSICAL_READS TOTAL_PHYSICAL_READS BP_NAME ------------------- -------------------- -------------------- -----------------
137 77 214 IBMDEFAULTBP 20 0 20 TP1H16K
6712 0 6712 TP1ADATA 35 3631 3666 TP1AINDX
4 record(s) selected.
SELECT data_logical_reads, index_logical_reads, total_logical_reads, bp_name from sysibmadm.bp_hitratio where bp_name not like 'IBMSYSTEM%'
DATA_LOGICAL_READS INDEX_LOGICAL_READS TOTAL_LOGICAL_READS BP_NAME ------------------- -------------------- -------------------- -----------------
184081 110934 295015 IBMDEFAULTBP 37548 0 37548 TP1H16K
218324 0 218324 TP1ADATA 39 110297 110336 TP1AINDX
4 record(s) selected.
SELECT data_hit_ratio_percent, index_hit_ratio_percent , total_hit_ratio_percent, bp_name from sysibmadm.bp_hitratio where bp_name not like 'IBMSYSTEM%'
DATA_HIT_RATIO_PERCENT INDEX_HIT_RATIO_PERCENT TOTAL_HIT_RATIO_PERCENT BP_NAME --------------------- ----------------------- ----------------------- ---------
99.92 99.93 99.92 IBMDEFAULTBP 99.94 - 99.94 TP1H16K 96.92 - 96.92 TP1ADATA 10.25 96.70 96.67 TP1AINDX
4 record(s) selected.
Your results will likely be somewhat different from those above.
Run the DB2 command file bpioperformance.sql to check the I/O performance statistics for each buffer pool.
In the terminal session, issue the commands:
db2 connect to tp1
Course materials may not be reproduced in whole or in part without the prior written permission of IBM.
4-12 DB2 for Linux, UNIX, and Windows © Copyright IBM Corp. 2001, 2006
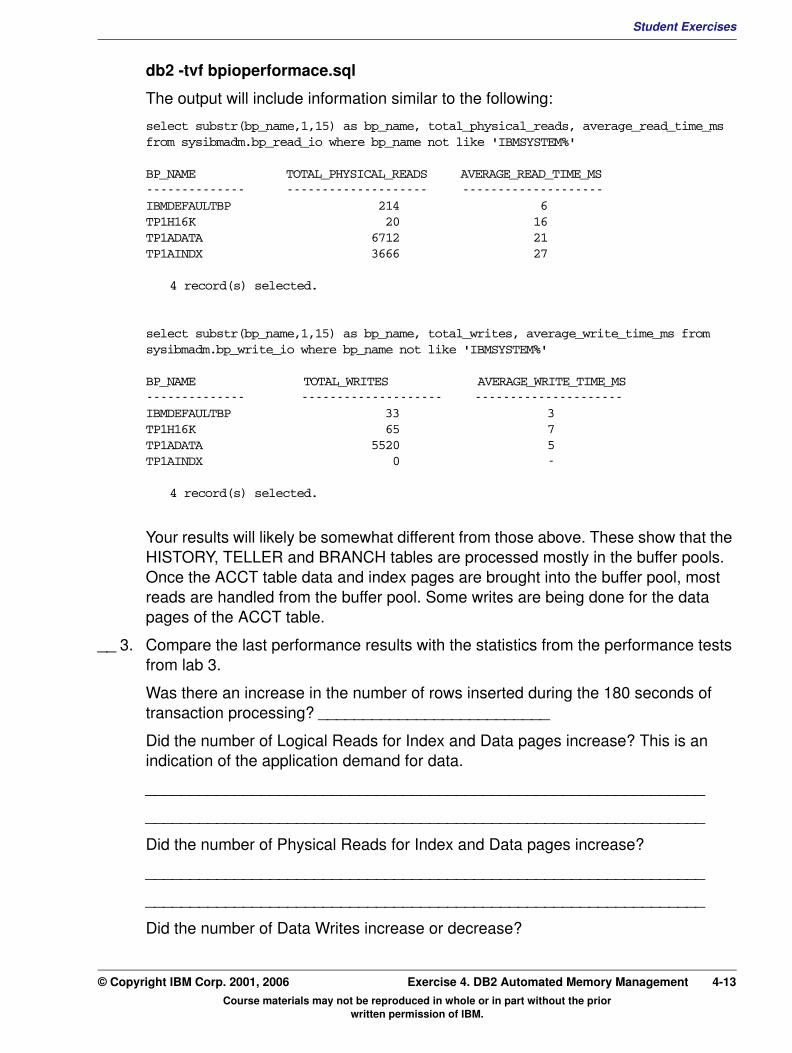
Student ExercisesV3.1.0.1
EXempty
db2 -tvf bpioperformace.sqlThe output will include information similar to the following:
select substr(bp_name,1,15) as bp_name, total_physical_reads, average_read_time_ms from sysibmadm.bp_read_io where bp_name not like 'IBMSYSTEM%'
BP_NAME TOTAL_PHYSICAL_READS AVERAGE_READ_TIME_MS-------------- -------------------- --------------------IBMDEFAULTBP 214 6TP1H16K 20 16TP1ADATA 6712 21TP1AINDX 3666 27
4 record(s) selected.
select substr(bp_name,1,15) as bp_name, total_writes, average_write_time_ms from sysibmadm.bp_write_io where bp_name not like 'IBMSYSTEM%'
BP_NAME TOTAL_WRITES AVERAGE_WRITE_TIME_MS-------------- -------------------- ---------------------IBMDEFAULTBP 33 3TP1H16K 65 7TP1ADATA 5520 5TP1AINDX 0 -
4 record(s) selected.
Your results will likely be somewhat different from those above. These show that the HISTORY, TELLER and BRANCH tables are processed mostly in the buffer pools. Once the ACCT table data and index pages are brought into the buffer pool, most reads are handled from the buffer pool. Some writes are being done for the data pages of the ACCT table.
__ 3. Compare the last performance results with the statistics from the performance tests from lab 3.
Was there an increase in the number of rows inserted during the 180 seconds of transaction processing? __________________________
Did the number of Logical Reads for Index and Data pages increase? This is an indication of the application demand for data.
_______________________________________________________________
_______________________________________________________________
Did the number of Physical Reads for Index and Data pages increase?
_______________________________________________________________
_______________________________________________________________
Did the number of Data Writes increase or decrease?
Course materials may not be reproduced in whole or in part without the prior written permission of IBM.
© Copyright IBM Corp. 2001, 2006 Exercise 4. DB2 Automated Memory Management 4-13
Student Exercises
_______________________________________________________________
_______________________________________________________________
__ 4. Turn off the Self Tuning Memory and deactivate the TP1 database.
In the terminal session, issue the commands:
db2 update db cfg using self_tuning_mem off
db2 terminate
db2 force application all
db2 deactivate db tp1
END OF EXERCISE
Course materials may not be reproduced in whole or in part without the prior written permission of IBM.
4-14 DB2 for Linux, UNIX, and Windows © Copyright IBM Corp. 2001, 2006
Student ExercisesV3.1.0.1
EXempty
Exercise 5. DB2 Explain ToolsWhat This Exercise Is About
This exercise is an online lab which allows the student to become familiar with the DB2 explain tools. These tools can be used to understand the processing required to execute SQL statements.
What You Should Be Able to Do
At the end of the lab, you should be able to:
• Use the Visual Explain tool from within the DB2 Control Center.
• Invoke the Visual Explain tool to analyze a dynamic SQL statement using the Command Editor.
• Utilize the db2exfmt tool to create a report containing the information stored in the explain tables during a bind for static SQL.
• Use db2exfmt to create a report for a dynamic SQL statement using the command line processor.
Course materials may not be reproduced in whole or in part without the prior written permission of IBM.
© Copyright IBM Corp. 2001, 2006 Exercise 5. DB2 Explain Tools 5-1
Student Exercises
Exercise Instructions
Introduction
In this exercise, you will be using DB2 Explain tools to review the detailed information used by the DB2 Optimizer to determine the least costly method for running SQL statements.
First, the db2exfmt tool will be used to analyze the simple SELECT from the ACCT table contained in the SQLTP1ST application.
The db2exfmt tool will next be used to show the explain information for a SELECT that performs a full table scan and requires a sort to be performed.
The Control Center will then be used to invoke the graphical Visual Explain tool to look at the same table scan query.
Next the Command Editor will be used to see the Visual Explain information for a query that joins two tables and uses indexes to access the tables.
Note: The examples are shown to help you locate the information, the costs and other statistics in your reports may vary from the values shown.
Course materials may not be reproduced in whole or in part without the prior written permission of IBM.
5-2 DB2 for Linux, UNIX, and Windows © Copyright IBM Corp. 2001, 2006
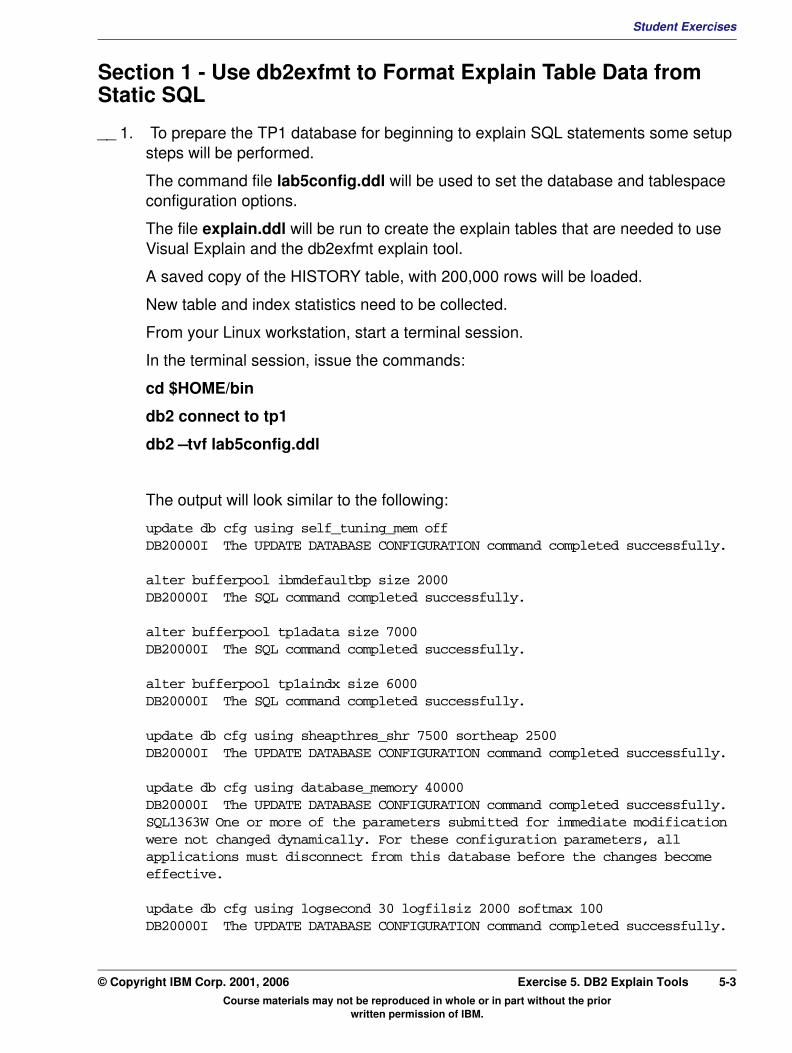
Student ExercisesV3.1.0.1
EXempty
Section 1 - Use db2exfmt to Format Explain Table Data from Static SQL__ 1. To prepare the TP1 database for beginning to explain SQL statements some setup steps will be performed.
The command file lab5config.ddl will be used to set the database and tablespace configuration options.
The file explain.ddl will be run to create the explain tables that are needed to use Visual Explain and the db2exfmt explain tool.
A saved copy of the HISTORY table, with 200,000 rows will be loaded.
New table and index statistics need to be collected.
From your Linux workstation, start a terminal session.
In the terminal session, issue the commands:
cd $HOME/bin
db2 connect to tp1
db2 –tvf lab5config.ddl
The output will look similar to the following:
update db cfg using self_tuning_mem off DB20000I The UPDATE DATABASE CONFIGURATION command completed successfully.
alter bufferpool ibmdefaultbp size 2000 DB20000I The SQL command completed successfully.
alter bufferpool tp1adata size 7000 DB20000I The SQL command completed successfully.
alter bufferpool tp1aindx size 6000 DB20000I The SQL command completed successfully.
update db cfg using sheapthres_shr 7500 sortheap 2500 DB20000I The UPDATE DATABASE CONFIGURATION command completed successfully.
update db cfg using database_memory 40000 DB20000I The UPDATE DATABASE CONFIGURATION command completed successfully.SQL1363W One or more of the parameters submitted for immediate modification were not changed dynamically. For these configuration parameters, all applications must disconnect from this database before the changes become effective.
update db cfg using logsecond 30 logfilsiz 2000 softmax 100 DB20000I The UPDATE DATABASE CONFIGURATION command completed successfully.
Course materials may not be reproduced in whole or in part without the prior written permission of IBM.
© Copyright IBM Corp. 2001, 2006 Exercise 5. DB2 Explain Tools 5-3
Student Exercises
SQL1363W One or more of the parameters submitted for immediate modification were not changed dynamically. For these configuration parameters, all applications must disconnect from this database before the changes become effective.
alter tablespace tp1dmsad overhead 12.67 transferrate .18 DB20000I The SQL command completed successfully.
alter tablespace tp1dmsai overhead 12.67 transferrate .18 DB20000I The SQL command completed successfully.
alter tablespace tp1dmsh overhead 12.67 transferrate .18 DB20000I The SQL command completed successfully.
alter tablespace tp1sms overhead 12.67 transferrate .18 DB20000I The SQL command completed successfully.
db2 –tvf explain.ddl
db2 “load from hist200k.ixf of ixf replace into history”
A new index will be added to the HISTORY table on the branch_id column using the file crhistix.ddl.
db2 –tvf crhistix.ddl
tp1stats
__ 2. The application SQLTP1ST was written using static SQL. The explain information for applications that use static SQL can be generated as part of the BIND command processing. Bind the application SQLTP1ST with the EXPLAIN and EXPLSNAP options to save the explain data for analysis. Use the utility db2exfmt to format the explain data for the first SQL statement in the SQLTP1ST application and save the output to a file.
In the terminal session, issue the commands:
db2 connect to tp1
db2 bind sqltp1st.bnd explain yes explsnap yes
db2exfmt -1 -d tp1 -n SQLTP1ST -# 1 -o exptp1.txt
The output will look similar to the following:
DB2 Universal Database Version 8.1, 5622-044 (c) Copyright IBM Corp. 1991, 2002Licensed Material - Program Property of IBMIBM DATABASE 2 Explain Table Format Tool
Connecting to the Database.Connect to Database Successful.Output is in exptp1.txt.
Course materials may not be reproduced in whole or in part without the prior written permission of IBM.
5-4 DB2 for Linux, UNIX, and Windows © Copyright IBM Corp. 2001, 2006
Student ExercisesV3.1.0.1
EXempty
Executing Connect Reset -- Connect Reset was Successful.__ 3. Use the UNIX vi editor to review the explain data saved in the file exptp1.txt.
vi exptp1.txt
Locate the Database Context section.
The output will look similar to:
Database Context:---------------
Parallelism: NoneCPU Speed: 3.857478e-07Comm Speed: 100Buffer Pool size: 16000Sort Heap size: 2500Database Heap size: 2392Lock List size: 50Maximum Lock List: 60Average Applications: 1Locks Available: 2550
The Database Context section has information about the configuration of the TP1 database at the time the explain data was saved. For example, the Buffer Pool size is 16000, the total number of pages in all four buffer pools. This also shows that there is space available for 2550 locks without exceeding the maximum number of locks configured per connection.
Locate the Original Statement section which shows the SQL SELECT statement from the ACCT table.
The output will look similar to:
Original Statement:-----------------
DECLARE CURSOR1 CURSOR FOR
SELECT BALANCE, ACCT_GRP FROM ACCT WHERE ACCT_ID = :H00001 FOR UPDATE OF BALANCE
Locate the Access Plan section which shows a graph of the processing for the SQL SELECT statement from the ACCT table.
The output will look similar to:
Access Plan:-----------
Course materials may not be reproduced in whole or in part without the prior written permission of IBM.
© Copyright IBM Corp. 2001, 2006 Exercise 5. DB2 Explain Tools 5-5
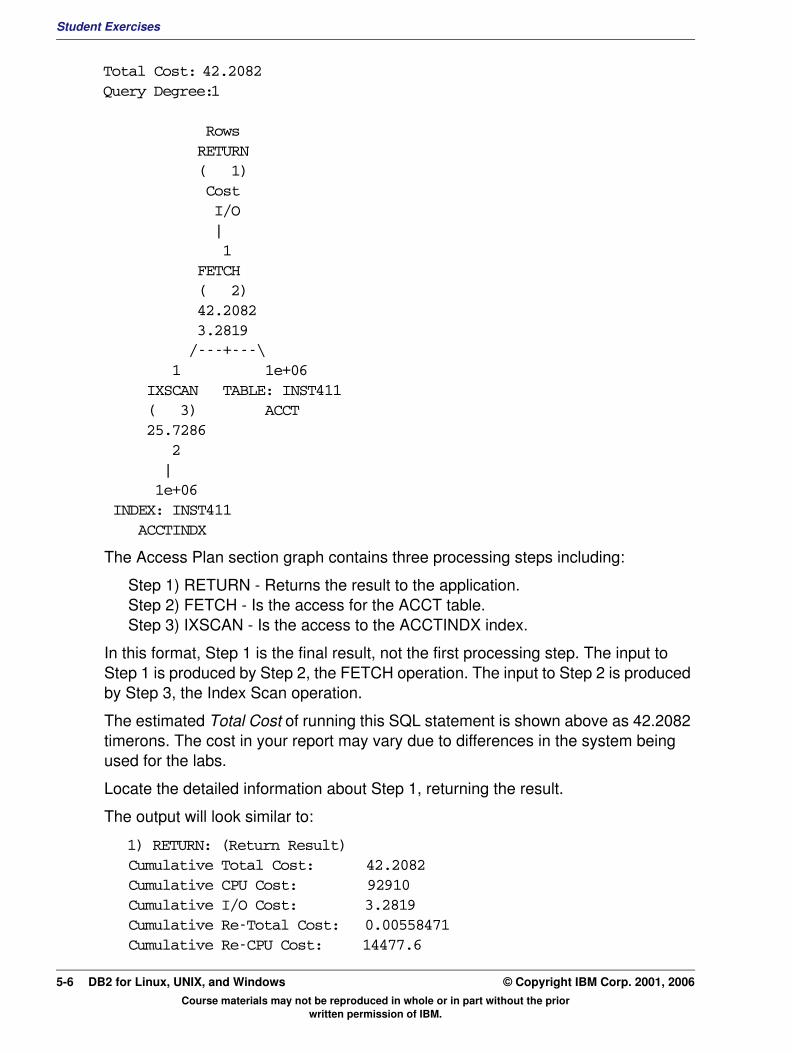
Student Exercises
Total Cost: 42.2082Query Degree:1
Rows RETURN ( 1) Cost I/O | 1 FETCH ( 2) 42.2082 3.2819 /---+---\ 1 1e+06 IXSCAN TABLE: INST411 ( 3) ACCT 25.7286 2 | 1e+06 INDEX: INST411 ACCTINDX
The Access Plan section graph contains three processing steps including:
Step 1) RETURN - Returns the result to the application. Step 2) FETCH - Is the access for the ACCT table. Step 3) IXSCAN - Is the access to the ACCTINDX index.
In this format, Step 1 is the final result, not the first processing step. The input to Step 1 is produced by Step 2, the FETCH operation. The input to Step 2 is produced by Step 3, the Index Scan operation.
The estimated Total Cost of running this SQL statement is shown above as 42.2082 timerons. The cost in your report may vary due to differences in the system being used for the labs.
Locate the detailed information about Step 1, returning the result.
The output will look similar to:
1) RETURN: (Return Result)Cumulative Total Cost: 42.2082Cumulative CPU Cost: 92910Cumulative I/O Cost: 3.2819Cumulative Re-Total Cost: 0.00558471Cumulative Re-CPU Cost: 14477.6
Course materials may not be reproduced in whole or in part without the prior written permission of IBM.
5-6 DB2 for Linux, UNIX, and Windows © Copyright IBM Corp. 2001, 2006
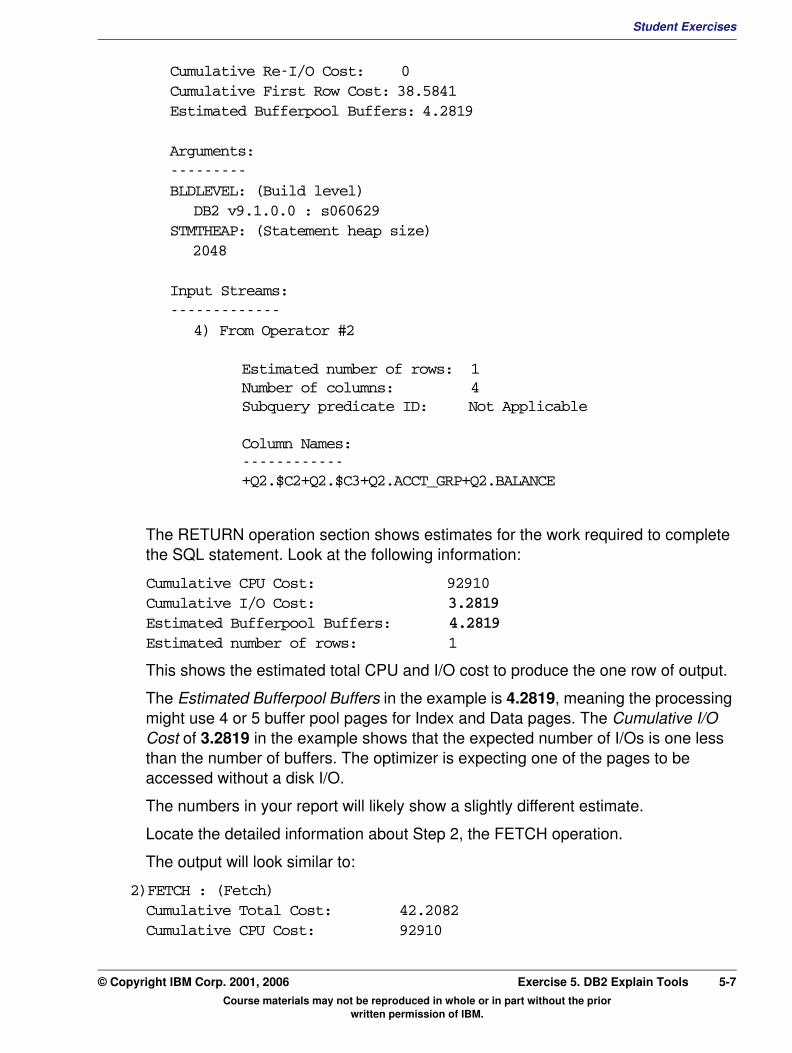
Student ExercisesV3.1.0.1
EXempty
Cumulative Re-I/O Cost: 0Cumulative First Row Cost: 38.5841Estimated Bufferpool Buffers: 4.2819Arguments:---------BLDLEVEL: (Build level)
DB2 v9.1.0.0 : s060629STMTHEAP: (Statement heap size)
2048
Input Streams:-------------
4) From Operator #2
Estimated number of rows: 1Number of columns: 4Subquery predicate ID: Not Applicable
Column Names:------------+Q2.$C2+Q2.$C3+Q2.ACCT_GRP+Q2.BALANCE
The RETURN operation section shows estimates for the work required to complete the SQL statement. Look at the following information:
Cumulative CPU Cost: 92910Cumulative I/O Cost: 3.2819Estimated Bufferpool Buffers: 4.2819 Estimated number of rows: 1
This shows the estimated total CPU and I/O cost to produce the one row of output.
The Estimated Bufferpool Buffers in the example is 4.2819, meaning the processing might use 4 or 5 buffer pool pages for Index and Data pages. The Cumulative I/O Cost of 3.2819 in the example shows that the expected number of I/Os is one less than the number of buffers. The optimizer is expecting one of the pages to be accessed without a disk I/O.
The numbers in your report will likely show a slightly different estimate.
Locate the detailed information about Step 2, the FETCH operation.
The output will look similar to:
2)FETCH : (Fetch)Cumulative Total Cost: 42.2082Cumulative CPU Cost: 92910
Course materials may not be reproduced in whole or in part without the prior written permission of IBM.
© Copyright IBM Corp. 2001, 2006 Exercise 5. DB2 Explain Tools 5-7
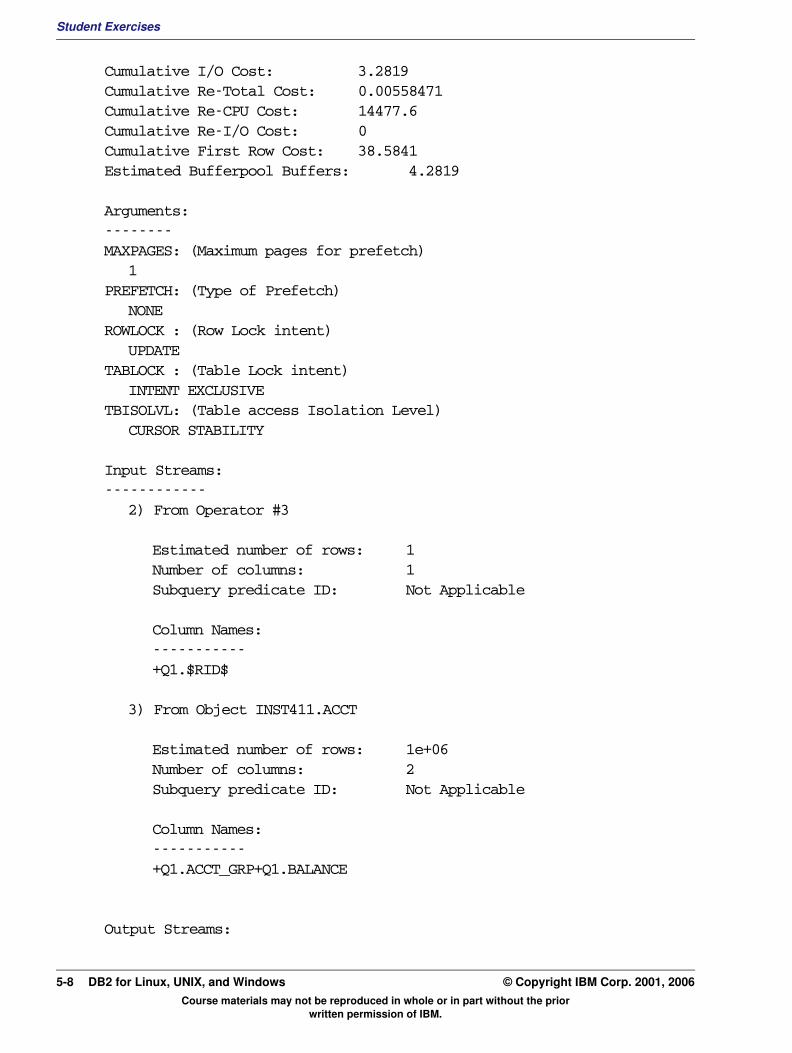
Student Exercises
Cumulative I/O Cost: 3.2819Cumulative Re-Total Cost: 0.00558471Cumulative Re-CPU Cost: 14477.6Cumulative Re-I/O Cost: 0Cumulative First Row Cost: 38.5841Estimated Bufferpool Buffers: 4.2819
Arguments:--------MAXPAGES: (Maximum pages for prefetch)
1PREFETCH: (Type of Prefetch)
NONEROWLOCK : (Row Lock intent)
UPDATETABLOCK : (Table Lock intent)
INTENT EXCLUSIVETBISOLVL: (Table access Isolation Level)
CURSOR STABILITY
Input Streams:------------
2) From Operator #3
Estimated number of rows: 1Number of columns: 1Subquery predicate ID: Not Applicable
Column Names:-----------+Q1.$RID$
3) From Object INST411.ACCT
Estimated number of rows: 1e+06Number of columns: 2Subquery predicate ID: Not Applicable
Column Names:-----------+Q1.ACCT_GRP+Q1.BALANCE
Output Streams:
Course materials may not be reproduced in whole or in part without the prior written permission of IBM.
5-8 DB2 for Linux, UNIX, and Windows © Copyright IBM Corp. 2001, 2006

Student ExercisesV3.1.0.1
EXempty
-------------4) To Operator #1Estimated number of rows: 1Number of columns: 4Subquery predicate ID: Not Applicable
Column Names:-----------+Q2.$C2+Q2.$C3+Q2.ACCT_GRP+Q2.BALANCE
Look at the Input Streams for the FETCH operation. This states that one row of input is expected from Step 3 - IXSCAN, which is the RID, the row pointer stored in the Index. The ACCT table is the second input to the FETCH operation. The type of locking that will be performed is also shown here. The PREFETCH indicates NONE, which means the pages will be read with synchronous I/O rather than being prefetched asynchronously by DB2's I/O servers. The cumulative I/O costs are the same as the total, so all of the I/O activity will be completed during the FETCH operation.
Locate the detailed information about Step 3, the IXSCAN operation.
The output will look similar to:
3) IXSCAN: (Index Scan)Cumulative Total Cost: 25.7286Cumulative CPU Cost: 74118.6Cumulative I/O Cost: 2Cumulative Re-Total Cost: 0.00488264Cumulative Re-CPU Cost: 12657.6Cumulative Re-I/O Cost: 0Cumulative First Row Cost: 25.7286Estimated Bufferpool Buffers: 3
Arguments:--------MAXPAGES: (Maximum pages for prefetch)
1PREFETCH: (Type of Prefetch)
NONEROWLOCK : (Row Lock intent)
UPDATESCANDIR : (Scan Direction)
FORWARDTABLOCK : (Table Lock intent)
INTENT EXCLUSIVE
Course materials may not be reproduced in whole or in part without the prior written permission of IBM.
© Copyright IBM Corp. 2001, 2006 Exercise 5. DB2 Explain Tools 5-9
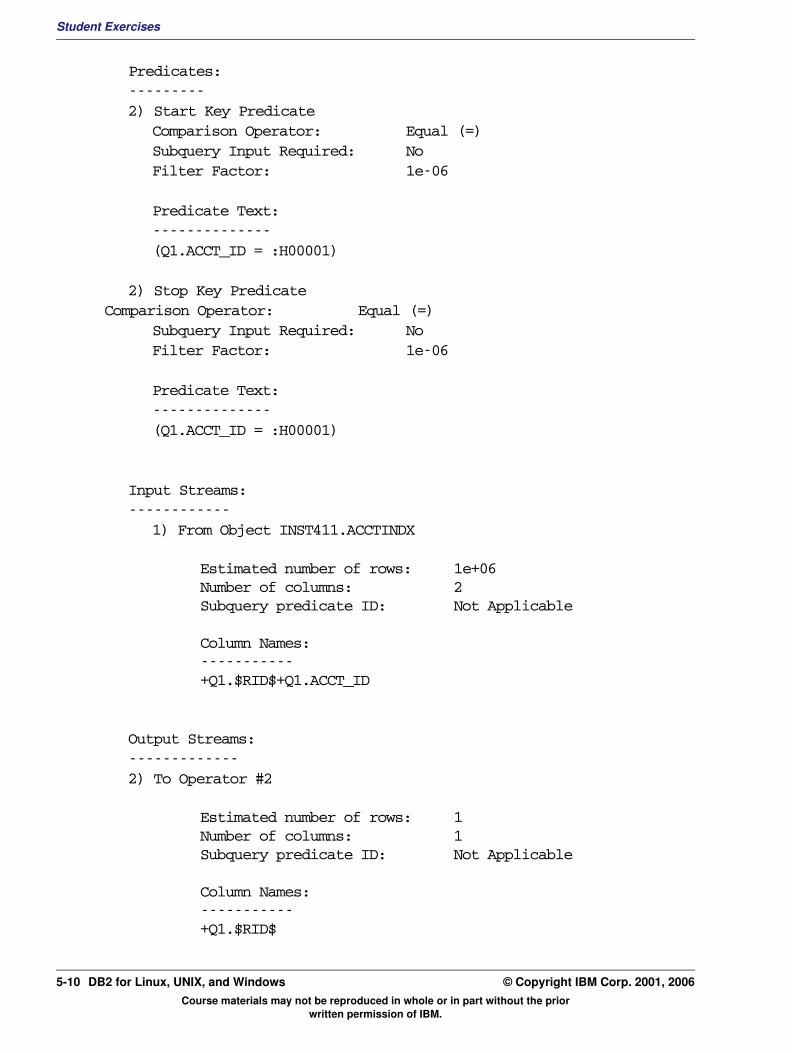
Student Exercises
Predicates:---------2) Start Key Predicate
Comparison Operator: Equal (=)Subquery Input Required: NoFilter Factor: 1e-06
Predicate Text:--------------(Q1.ACCT_ID = :H00001)
2) Stop Key PredicateComparison Operator: Equal (=)
Subquery Input Required: NoFilter Factor: 1e-06
Predicate Text:--------------(Q1.ACCT_ID = :H00001)
Input Streams:------------
1) From Object INST411.ACCTINDX
Estimated number of rows: 1e+06Number of columns: 2Subquery predicate ID: Not Applicable
Column Names:-----------+Q1.$RID$+Q1.ACCT_ID
Output Streams:-------------2) To Operator #2
Estimated number of rows: 1Number of columns: 1Subquery predicate ID: Not Applicable
Column Names:-----------+Q1.$RID$
Course materials may not be reproduced in whole or in part without the prior written permission of IBM.
5-10 DB2 for Linux, UNIX, and Windows © Copyright IBM Corp. 2001, 2006
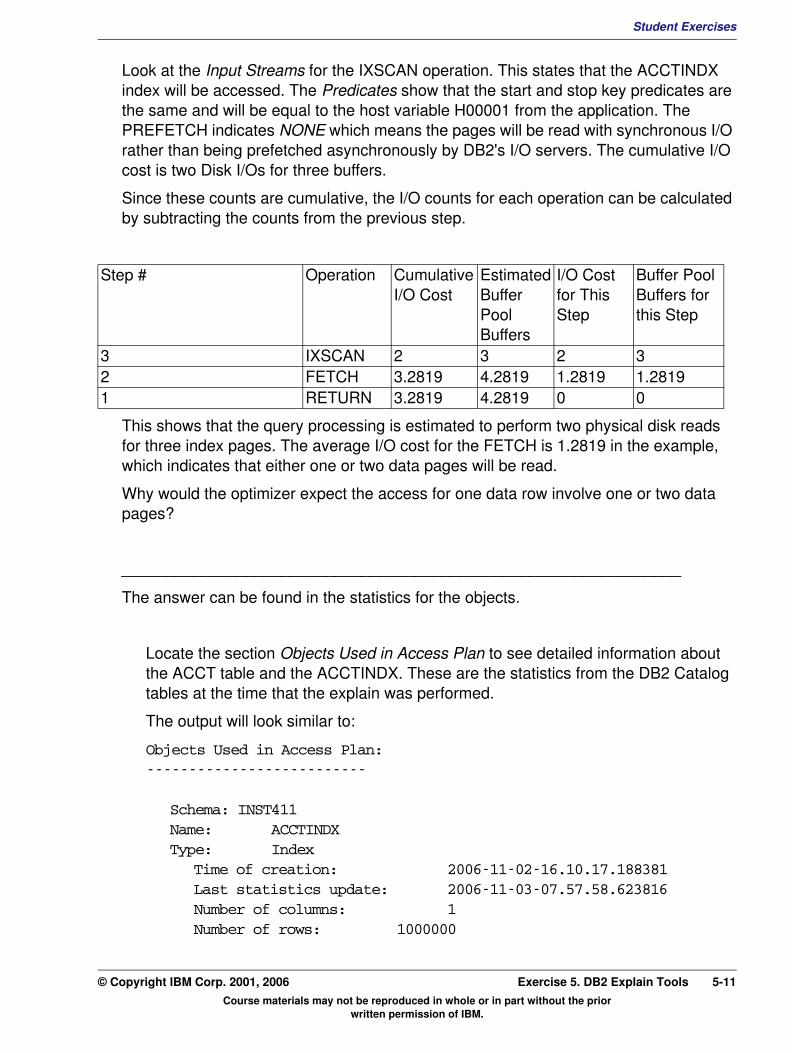
Student ExercisesV3.1.0.1
EXempty
Look at the Input Streams for the IXSCAN operation. This states that the ACCTINDX index will be accessed. The Predicates show that the start and stop key predicates are the same and will be equal to the host variable H00001 from the application. The PREFETCH indicates NONE which means the pages will be read with synchronous I/O rather than being prefetched asynchronously by DB2's I/O servers. The cumulative I/O cost is two Disk I/Os for three buffers.Since these counts are cumulative, the I/O counts for each operation can be calculated by subtracting the counts from the previous step.
This shows that the query processing is estimated to perform two physical disk reads for three index pages. The average I/O cost for the FETCH is 1.2819 in the example, which indicates that either one or two data pages will be read.
Why would the optimizer expect the access for one data row involve one or two data pages?
_______________________________________________________________
The answer can be found in the statistics for the objects.
Locate the section Objects Used in Access Plan to see detailed information about the ACCT table and the ACCTINDX. These are the statistics from the DB2 Catalog tables at the time that the explain was performed.
The output will look similar to:
Objects Used in Access Plan:--------------------------
Schema: INST411 Name: ACCTINDXType: Index
Time of creation: 2006-11-02-16.10.17.188381Last statistics update: 2006-11-03-07.57.58.623816Number of columns: 1Number of rows: 1000000
Step # Operation Cumulative I/O Cost
Estimated Buffer Pool Buffers
I/O Cost for This Step
Buffer Pool Buffers for this Step
3 IXSCAN 2 3 2 3 2 FETCH 3.2819 4.2819 1.2819 1.28191 RETURN 3.2819 4.2819 0 0
Course materials may not be reproduced in whole or in part without the prior written permission of IBM.
© Copyright IBM Corp. 2001, 2006 Exercise 5. DB2 Explain Tools 5-11
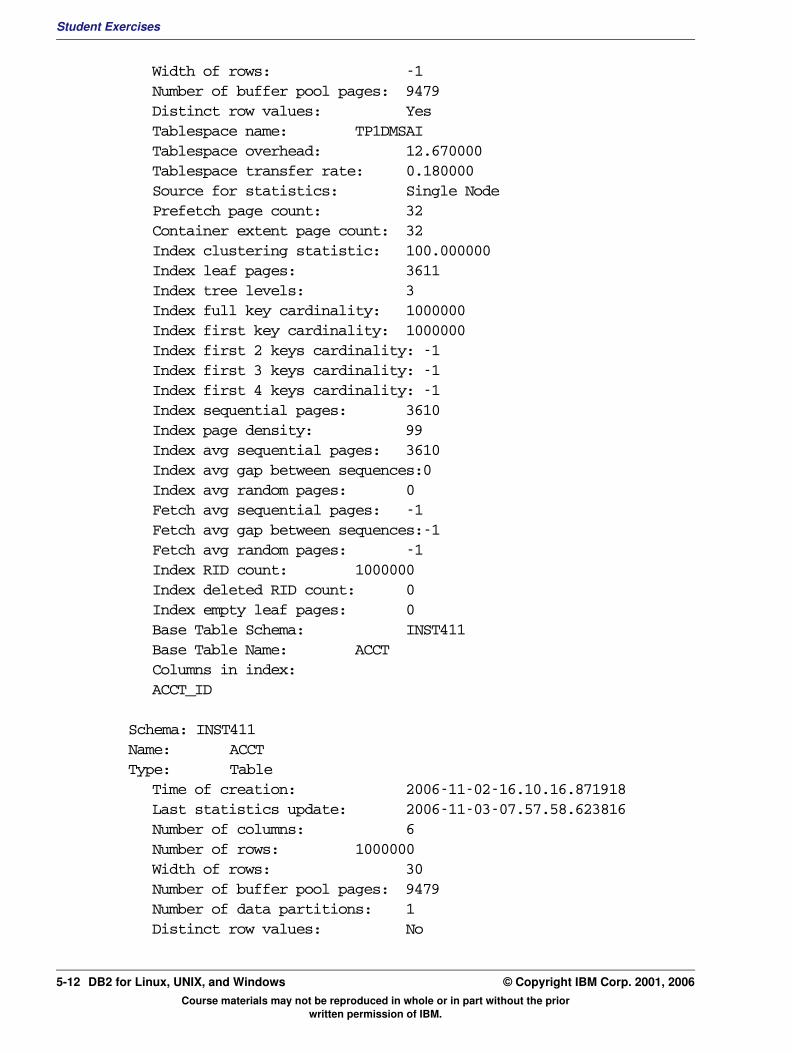
Student Exercises
Width of rows: -1Number of buffer pool pages: 9479Distinct row values: YesTablespace name: TP1DMSAITablespace overhead: 12.670000Tablespace transfer rate: 0.180000Source for statistics: Single NodePrefetch page count: 32Container extent page count: 32Index clustering statistic: 100.000000Index leaf pages: 3611Index tree levels: 3Index full key cardinality: 1000000Index first key cardinality: 1000000Index first 2 keys cardinality: -1Index first 3 keys cardinality: -1Index first 4 keys cardinality: -1Index sequential pages: 3610Index page density: 99Index avg sequential pages: 3610Index avg gap between sequences:0Index avg random pages: 0Fetch avg sequential pages: -1Fetch avg gap between sequences:-1Fetch avg random pages: -1Index RID count: 1000000Index deleted RID count: 0Index empty leaf pages: 0Base Table Schema: INST411 Base Table Name: ACCTColumns in index:ACCT_ID
Schema: INST411 Name: ACCTType: Table
Time of creation: 2006-11-02-16.10.16.871918Last statistics update: 2006-11-03-07.57.58.623816Number of columns: 6Number of rows: 1000000Width of rows: 30Number of buffer pool pages: 9479Number of data partitions: 1Distinct row values: No
Course materials may not be reproduced in whole or in part without the prior written permission of IBM.
5-12 DB2 for Linux, UNIX, and Windows © Copyright IBM Corp. 2001, 2006
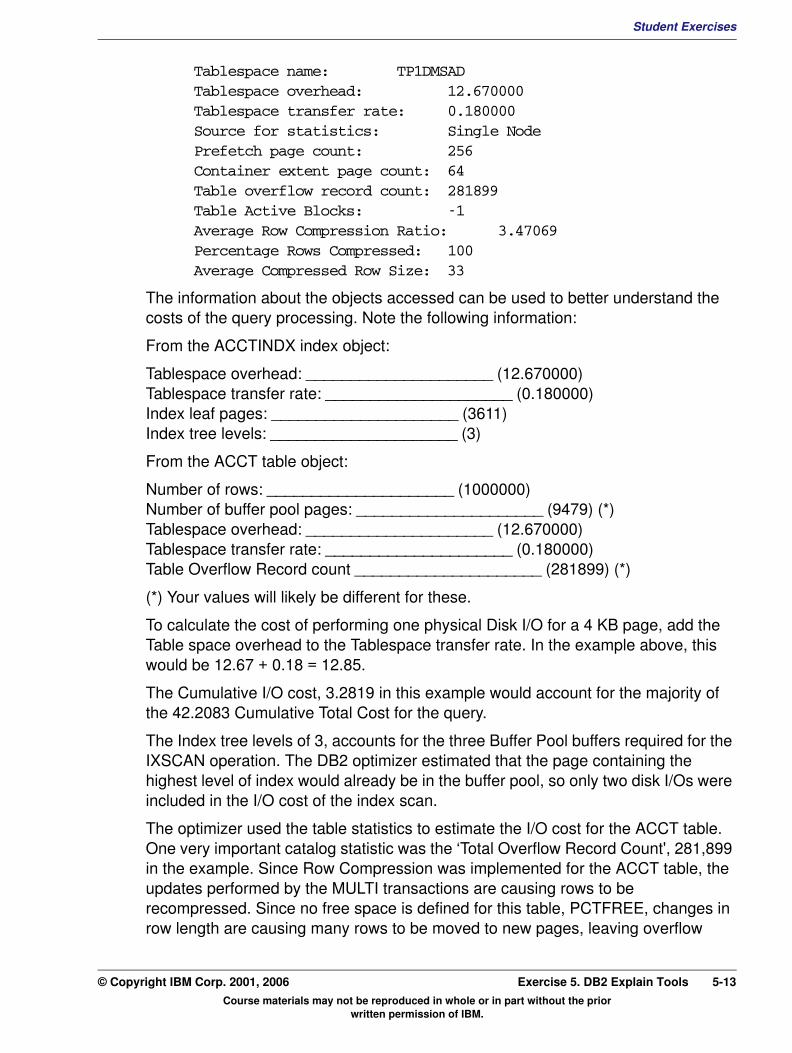
Student ExercisesV3.1.0.1
EXempty
Tablespace name: TP1DMSAD Tablespace overhead: 12.670000Tablespace transfer rate: 0.180000Source for statistics: Single NodePrefetch page count: 256Container extent page count: 64Table overflow record count: 281899Table Active Blocks: -1Average Row Compression Ratio: 3.47069Percentage Rows Compressed: 100Average Compressed Row Size: 33The information about the objects accessed can be used to better understand the costs of the query processing. Note the following information:
From the ACCTINDX index object:
Tablespace overhead: _____________________ (12.670000)Tablespace transfer rate: _____________________ (0.180000)Index leaf pages: _____________________ (3611)Index tree levels: _____________________ (3)
From the ACCT table object:
Number of rows: _____________________ (1000000)Number of buffer pool pages: _____________________ (9479) (*)Tablespace overhead: _____________________ (12.670000)Tablespace transfer rate: _____________________ (0.180000) Table Overflow Record count _____________________ (281899) (*)
(*) Your values will likely be different for these.
To calculate the cost of performing one physical Disk I/O for a 4 KB page, add the Table space overhead to the Tablespace transfer rate. In the example above, this would be 12.67 + 0.18 = 12.85.
The Cumulative I/O cost, 3.2819 in this example would account for the majority of the 42.2083 Cumulative Total Cost for the query.
The Index tree levels of 3, accounts for the three Buffer Pool buffers required for the IXSCAN operation. The DB2 optimizer estimated that the page containing the highest level of index would already be in the buffer pool, so only two disk I/Os were included in the I/O cost of the index scan.
The optimizer used the table statistics to estimate the I/O cost for the ACCT table. One very important catalog statistic was the ‘Total Overflow Record Count', 281,899 in the example. Since Row Compression was implemented for the ACCT table, the updates performed by the MULTI transactions are causing rows to be recompressed. Since no free space is defined for this table, PCTFREE, changes in row length are causing many rows to be moved to new pages, leaving overflow
Course materials may not be reproduced in whole or in part without the prior written permission of IBM.
© Copyright IBM Corp. 2001, 2006 Exercise 5. DB2 Explain Tools 5-13

Student Exercises
record pointers in the original page. That is why the optimizer is expecting some percentage of the data rows to require two pages to be read from disk. This accounts for the I/O cost for the FETCH being 1.2819.
What should be done to improve the efficiency of the updates to the compressed rows in the ACCT table?
______________________________________________________________
______________________________________________________________
______________________________________________________________
______________________________________________________________
The ACCT table should be altered to implement some free space on each data page using the PCTFREE option. This would allow the updates to expand rows when needed without creating overflow records. A table reorganization will be needed to rebuild the table with page free space. A new compression dictionary should also be created to reflect the current data.
__ 4. Alter the ACCT table to add 15% free space per page. Use the REORG utility to implement the free space and also to rebuild the compression dictionary. Update the statistics for the ACCT table using the RUNSTATS utility.
In the terminal session, issue the commands:
db2 connect to tp1
db2 alter table acct pctfree 15
db2 reorg table acct index acctindx use tempspace1 resetdictionary
db2 runstats on table inst411.acct and indexes all
db2 terminate
Course materials may not be reproduced in whole or in part without the prior written permission of IBM.
5-14 DB2 for Linux, UNIX, and Windows © Copyright IBM Corp. 2001, 2006
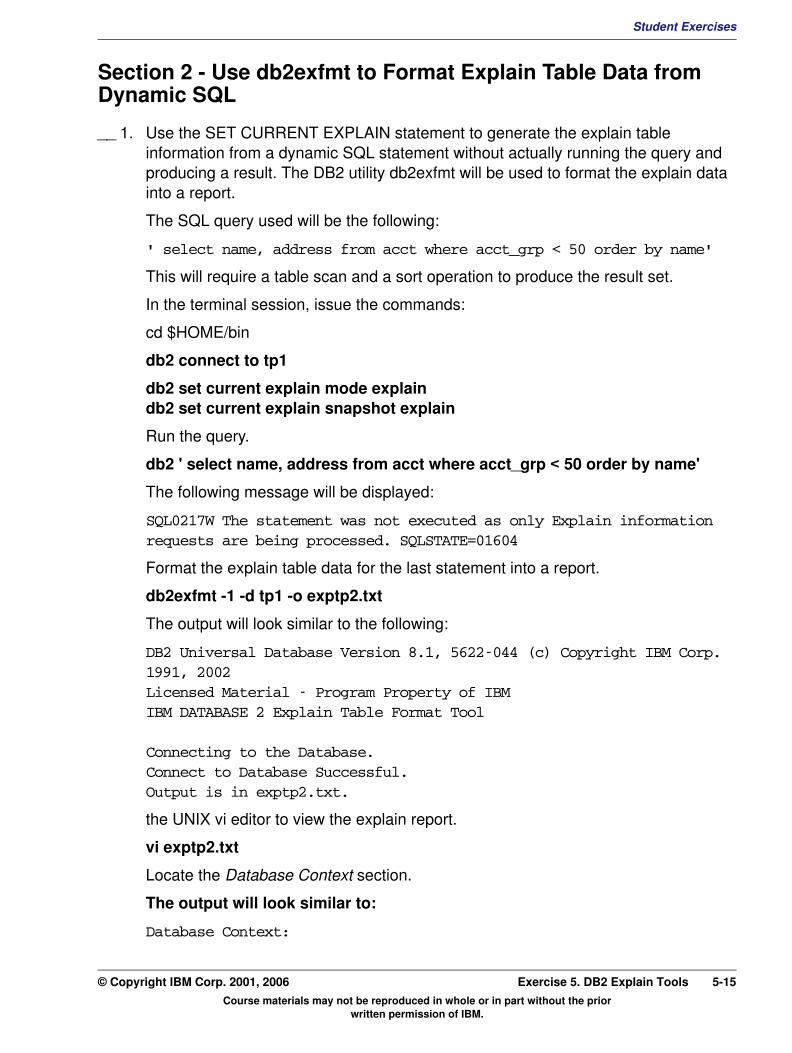
Student ExercisesV3.1.0.1
EXempty
Section 2 - Use db2exfmt to Format Explain Table Data from Dynamic SQL__ 1. Use the SET CURRENT EXPLAIN statement to generate the explain table information from a dynamic SQL statement without actually running the query and producing a result. The DB2 utility db2exfmt will be used to format the explain data into a report.
The SQL query used will be the following:
' select name, address from acct where acct_grp < 50 order by name'
This will require a table scan and a sort operation to produce the result set.
In the terminal session, issue the commands:
cd $HOME/bin
db2 connect to tp1
db2 set current explain mode explain db2 set current explain snapshot explain
Run the query.
db2 ' select name, address from acct where acct_grp < 50 order by name'
The following message will be displayed:
SQL0217W The statement was not executed as only Explain information requests are being processed. SQLSTATE=01604
Format the explain table data for the last statement into a report.
db2exfmt -1 -d tp1 -o exptp2.txt
The output will look similar to the following:
DB2 Universal Database Version 8.1, 5622-044 (c) Copyright IBM Corp. 1991, 2002Licensed Material - Program Property of IBMIBM DATABASE 2 Explain Table Format Tool
Connecting to the Database.Connect to Database Successful.Output is in exptp2.txt.
the UNIX vi editor to view the explain report.
vi exptp2.txt
Locate the Database Context section.
The output will look similar to:
Database Context:
Course materials may not be reproduced in whole or in part without the prior written permission of IBM.
© Copyright IBM Corp. 2001, 2006 Exercise 5. DB2 Explain Tools 5-15

Student Exercises
---------------Parallelism: NoneCPU Speed: 3.857478e-007Comm Speed: 100Buffer Pool size: 16000Sort Heap size: 2500Database Heap size: 2392Lock List size: 50Maximum Lock List: 60Average Applications: 1Locks Available: 2550
This shows that the TP1 database is configured with a Sort Heap size of 2500, which is 10 MB.
Locate the Access Plan section which shows a graph of the processing for the SQL SELECT statement from the ACCT table.
The output will look similar to:
Access Plan:----------
Total Cost: 14440Query Degree:1
Rows RETURN ( 1) Cost I/O | 49957.8 TBSCAN ( 2) 14440 7620 | 49957.8 SORT ( 3) 14440 7620 | 49957.8 TBSCAN ( 4) 14403
Course materials may not be reproduced in whole or in part without the prior written permission of IBM.
5-16 DB2 for Linux, UNIX, and Windows © Copyright IBM Corp. 2001, 2006
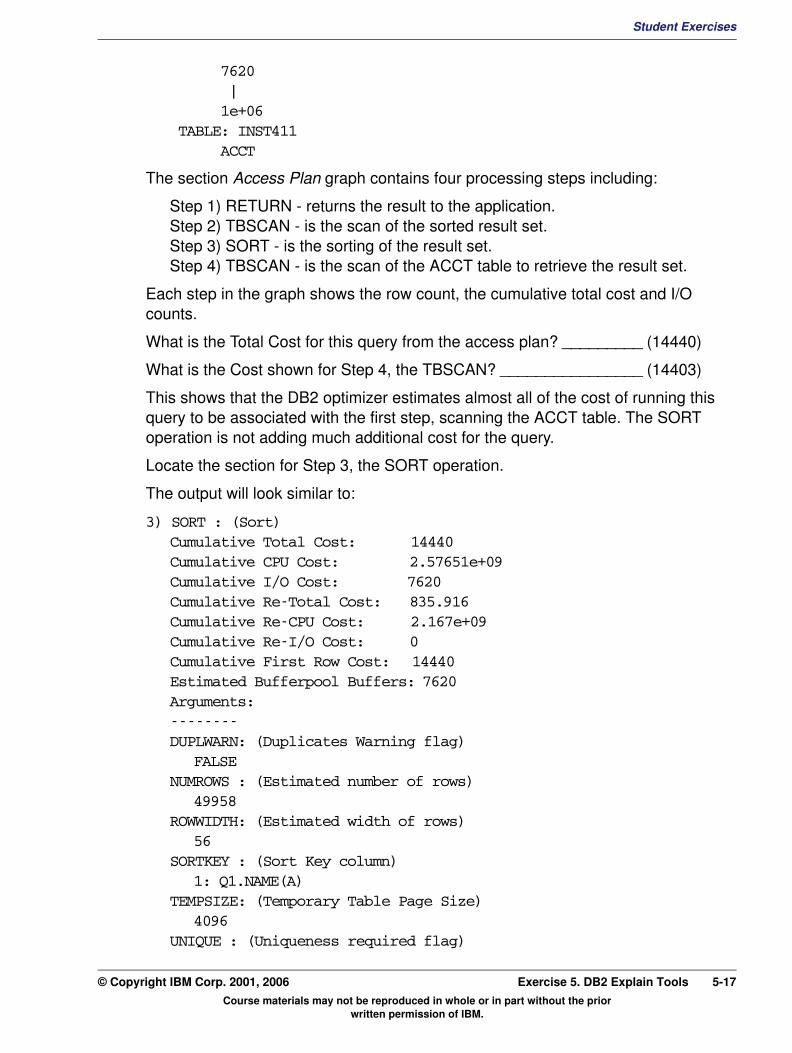
Student ExercisesV3.1.0.1
EXempty
7620 | 1e+06 TABLE: INST411 ACCTThe section Access Plan graph contains four processing steps including:
Step 1) RETURN - returns the result to the application. Step 2) TBSCAN - is the scan of the sorted result set. Step 3) SORT - is the sorting of the result set. Step 4) TBSCAN - is the scan of the ACCT table to retrieve the result set.
Each step in the graph shows the row count, the cumulative total cost and I/O counts.
What is the Total Cost for this query from the access plan? _________ (14440)
What is the Cost shown for Step 4, the TBSCAN? ________________ (14403)
This shows that the DB2 optimizer estimates almost all of the cost of running this query to be associated with the first step, scanning the ACCT table. The SORT operation is not adding much additional cost for the query.
Locate the section for Step 3, the SORT operation.
The output will look similar to:
3) SORT : (Sort)Cumulative Total Cost: 14440Cumulative CPU Cost: 2.57651e+09Cumulative I/O Cost: 7620Cumulative Re-Total Cost: 835.916Cumulative Re-CPU Cost: 2.167e+09Cumulative Re-I/O Cost: 0Cumulative First Row Cost: 14440Estimated Bufferpool Buffers: 7620Arguments:--------DUPLWARN: (Duplicates Warning flag)
FALSENUMROWS : (Estimated number of rows)
49958ROWWIDTH: (Estimated width of rows)
56SORTKEY : (Sort Key column)
1: Q1.NAME(A)TEMPSIZE: (Temporary Table Page Size)
4096UNIQUE : (Uniqueness required flag)
Course materials may not be reproduced in whole or in part without the prior written permission of IBM.
© Copyright IBM Corp. 2001, 2006 Exercise 5. DB2 Explain Tools 5-17
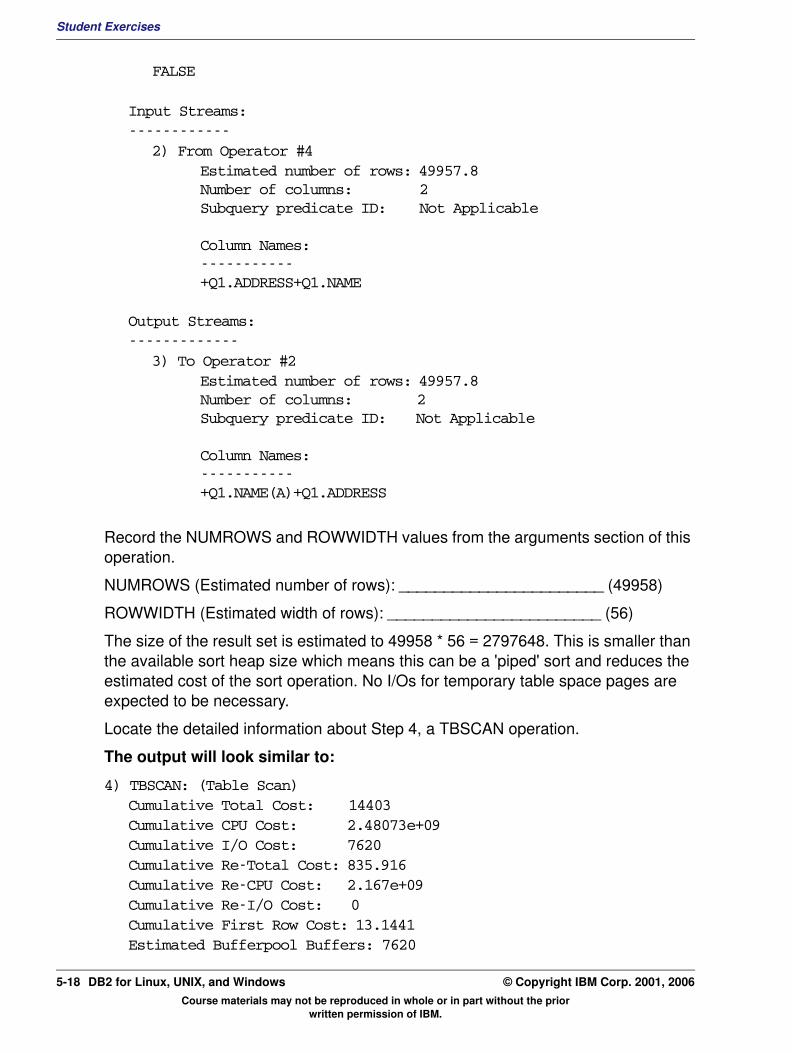
Student Exercises
FALSE
Input Streams:------------
2) From Operator #4Estimated number of rows: 49957.8Number of columns: 2Subquery predicate ID: Not Applicable
Column Names:-----------+Q1.ADDRESS+Q1.NAME
Output Streams:-------------
3) To Operator #2Estimated number of rows: 49957.8Number of columns: 2Subquery predicate ID: Not Applicable
Column Names:-----------+Q1.NAME(A)+Q1.ADDRESS
Record the NUMROWS and ROWWIDTH values from the arguments section of this operation.
NUMROWS (Estimated number of rows): _______________________ (49958)
ROWWIDTH (Estimated width of rows): ________________________ (56)
The size of the result set is estimated to 49958 * 56 = 2797648. This is smaller than the available sort heap size which means this can be a 'piped' sort and reduces the estimated cost of the sort operation. No I/Os for temporary table space pages are expected to be necessary.
Locate the detailed information about Step 4, a TBSCAN operation.
The output will look similar to:
4) TBSCAN: (Table Scan)Cumulative Total Cost: 14403Cumulative CPU Cost: 2.48073e+09Cumulative I/O Cost: 7620Cumulative Re-Total Cost: 835.916Cumulative Re-CPU Cost: 2.167e+09Cumulative Re-I/O Cost: 0Cumulative First Row Cost: 13.1441Estimated Bufferpool Buffers: 7620
Course materials may not be reproduced in whole or in part without the prior written permission of IBM.
5-18 DB2 for Linux, UNIX, and Windows © Copyright IBM Corp. 2001, 2006
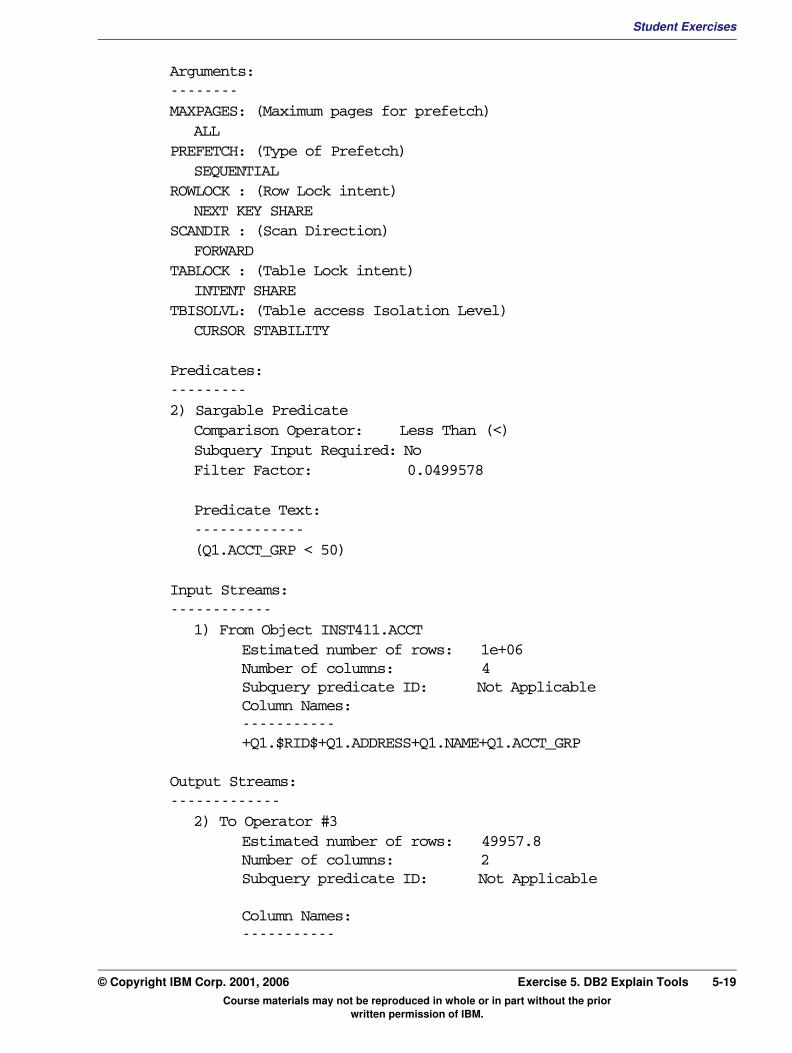
Student ExercisesV3.1.0.1
EXempty
Arguments:--------MAXPAGES: (Maximum pages for prefetch)ALLPREFETCH: (Type of Prefetch)
SEQUENTIALROWLOCK : (Row Lock intent)
NEXT KEY SHARESCANDIR : (Scan Direction)
FORWARDTABLOCK : (Table Lock intent)
INTENT SHARETBISOLVL: (Table access Isolation Level)
CURSOR STABILITY
Predicates:---------2) Sargable Predicate
Comparison Operator: Less Than (<)Subquery Input Required: NoFilter Factor: 0.0499578
Predicate Text:-------------(Q1.ACCT_GRP < 50)
Input Streams:------------
1) From Object INST411.ACCTEstimated number of rows: 1e+06Number of columns: 4Subquery predicate ID: Not ApplicableColumn Names:-----------+Q1.$RID$+Q1.ADDRESS+Q1.NAME+Q1.ACCT_GRP
Output Streams:-------------
2) To Operator #3Estimated number of rows: 49957.8Number of columns: 2Subquery predicate ID: Not Applicable
Column Names:-----------
Course materials may not be reproduced in whole or in part without the prior written permission of IBM.
© Copyright IBM Corp. 2001, 2006 Exercise 5. DB2 Explain Tools 5-19

Student Exercises
+Q1.ADDRESS+Q1.NAME
The Cumulative I/O Cost of this table scan is 7620 in the above example, which is the number of pages in the ACCT table based on DB2 Catalog statistics. This can be verified in the Objects Used in Access Plan portion at the end of this report.
Record the MAXPAGES and PREFETCH values from the arguments section of this operation.
MAXPAGES (Maximum pages for prefetch): _______________________ (ALL)
PREFETCH: (Type of Prefetch)________________________ (SEQUENTIAL)
This shows that the Optimizer plans to perform asynchronous data page reads using the I/O servers.
Record the Filter Factor from the Arguments section. This is used to estimate the number of rows that will be in the result set when the WHERE clause of (Q1.ACCT_GRP < 50) is checked.
Filter Factor: _______________ ( 0.0499578 )
This Filter factor is multiplied by the Estimated number of rows: 1e+0 06 (1 million) in the Input Streams to determine the get the Estimated number of rows: 49013.9 49957.8 that appears in the Output Streams.
Course materials may not be reproduced in whole or in part without the prior written permission of IBM.
5-20 DB2 for Linux, UNIX, and Windows © Copyright IBM Corp. 2001, 2006

Student ExercisesV3.1.0.1
EXempty
Section 3 - Using Visual Explain Tool from the Control Center to View Explain Information__ 1. Use the DB2 Control Center to invoke the Visual Explain tool. The data that was formatted into a report by db2exfmt in Section 2 can be displayed with Visual Explain.
In the terminal session, issue the command:
db2cc
Expand the left panel of the Control Center to access the TP1 database.
Right-click the TP1 database and select Show Explained Statements History.
The display contains a column SQL text. Scroll through the list of previously explained SQL statements to find the following SQL text:
select name, address from acct where acct_grp < 50 order by name
Once the entry for this statement is located, select Statement from the menu line, then select Show Access Plan.
Look the Visual Explain tool representation of the query processing.
This is very similar to the Access Plan section of the db2exfmt report. It shows the same four steps, the numbering may be different:
Step 1) ReturnStep 3) TBSCANStep 5) SORTStep 7) TBSCAN
Visual Explain also shows a rectangle with the name of the ACCT table. The Visual Explain tool uses these objects to show where tables are accessed.
Double-click the ACCT table rectangle or use the right mouse button to select Show Statistics.
There are two columns of information, Explained are the catalog statistics that were saved when the explain data was created. The Current column shows the catalog statistics for this table now. If the statistics have changed significantly, the DB2 optimizer might produce a different access plan.
Select Statement from the menu line, then select Show Optimization Parameters.
Similar to the table statistics, there are two columns of information, Explained are the database configuration and bind command options that were saved when the explain data was created. The Current column shows the database configuration options now. If the database configuration has changed significantly, like increasing
Course materials may not be reproduced in whole or in part without the prior written permission of IBM.
© Copyright IBM Corp. 2001, 2006 Exercise 5. DB2 Explain Tools 5-21

Student Exercises
the size of the buffer pools or sort heap, the DB2 optimizer might produce a different access plan.
The cumulative cost is shown for each step, so for this query Step 4, the ACCT table scan, accounts for almost all of the query cost.
Double-click the TBSCAN at the bottom or use the right mouse button to select Show Detail.
Scroll through the Input Arguments section to find the Sargable Predicates and locate the Selectivity. This is shown as 0.05 meaning that approximately 5% of the rows will be selected.
Browse through the other steps and sections to locate the information that was contained in the db2exfmt report from the previous lab step.
Close the Visual Explain application window and exit from the Control Center.
Section 4 - Use Visual Explain Tool from Command Editor to View Explain Information for Dynamic SQL
__ 1. Use the DB2 Command Editor to invoke the Visual Explain tool.
In the terminal session, issue the command:
db2ce
Using the Command Editor, enter the following statement:
connect to TP1
Select the menu item Selected, then select Execute to run start processing the statement.
Enter the following SQL Select statement:
SELECT HISTORY.BRANCH_ID, TELLER.TELLER_NAME, HISTORY.ACCTNAME,HISTORY.ACCT_ID, HISTORY.BALANCE FROM HISTORY AS HISTORY, TELLER AS TELLER
WHERE HISTORY.TELLER_ID = TELLER.TELLER_ID AND HISTORY.BRANCH_ID = 25ORDER BY HISTORY.BRANCH_ID ASC, HISTORY.ACCT_ID ASC ;
This query joins the HISTORY and TELLER tables. The HISTORY transactions for a single Branch are being selected.
To invoke the Visual Explain tool for this query without running the query, select the menu item Selected, then select Access Plan.
This query produces a more complex, but very interesting sequence of operations.
First find the method that the optimizer selected for joining the two tables. The HSJOIN shown is a hash join operation. This join will bring the TELLER table column data into the sort heap to be joined with the selected data from the HISTORY table.
Course materials may not be reproduced in whole or in part without the prior written permission of IBM.
5-22 DB2 for Linux, UNIX, and Windows © Copyright IBM Corp. 2001, 2006

Student ExercisesV3.1.0.1
EXempty
Two indexes will be used for this query, HISTIX1 for the HISTORY table and TELLINDX for the TELLER table. Select each Index shown and look at the statistics for each index.Record the following:
Look at the IXSCAN operations for each index and find the predicates listed in the input Arguments panel. The IXSCAN for the HISTIX index is being used to find the transactions for one branch. The IXSCAN for the TELLINDX does not have any predicates, so this will scan the entire index.
Using the TELLINDX index is considered efficient because it is small and highly clustered, even though it is not being used to limit the number of TELLER table pages retrieved.
Notice that two operations, a SORT and RIDSCN follow the IXSCAN for the HISTIX index, before the FETCH operation is performed. These two operations sort the row pointers or RIDs from the index into page number sequence to improve the I/O efficiency of accessing the HISTORY table. This is based on the low cluster ratio of the HISTIX1 index. The transactions are not physically ordered by branch number and scanning directly using this index could generate more disk I/O requests.
The following is the db2exfmt Access Plan for this same query.
Access Plan:----------- Total Cost: 434.453 Query Degree: 1
Rows RETURN ( 1) Cost I/O | 1037.33
Statistics HISTIX1 TELLINDXNLEAF Number of Leaf Pages NLEVEL Number of Index Levels CLUSTERRATIO% Clustered
Statistics HISTIX1 TELLINDXNLEAF Number of Leaf Pages 84 4NLEVEL Number of Index Levels 2 2CLUSTERRATIO% Clustered 62 100
Course materials may not be reproduced in whole or in part without the prior written permission of IBM.
© Copyright IBM Corp. 2001, 2006 Exercise 5. DB2 Explain Tools 5-23
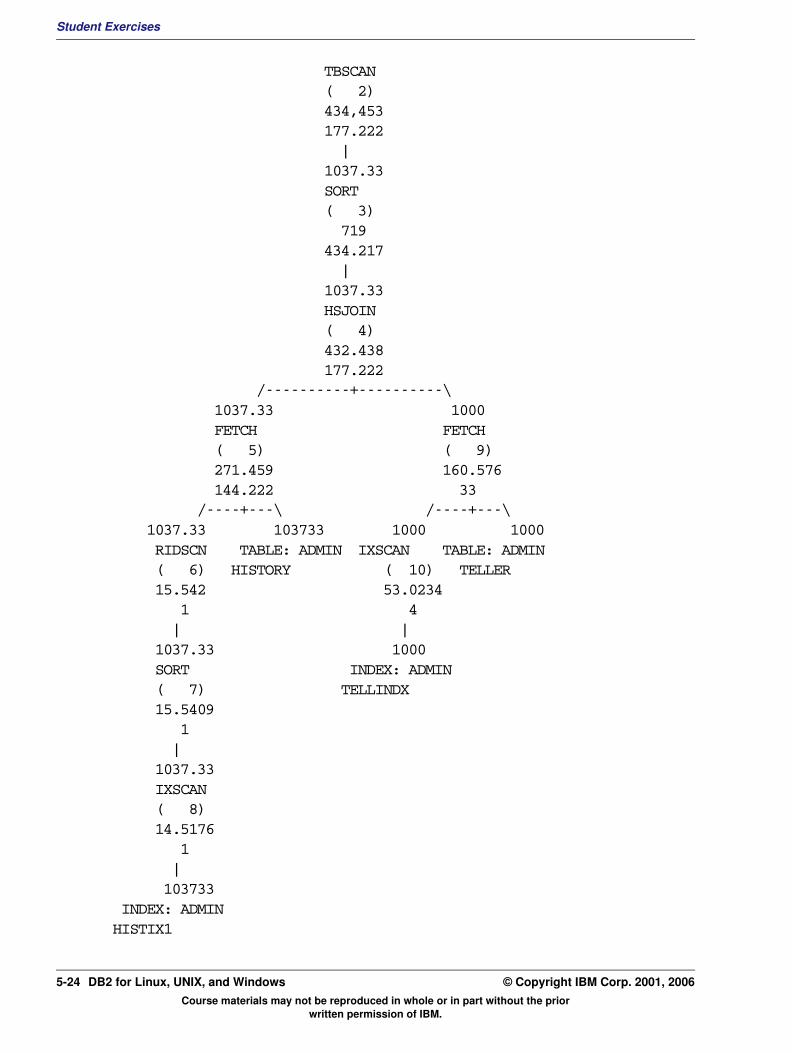
Student Exercises
TBSCAN ( 2) 434,453 177.222 | 1037.33 SORT ( 3) 719 434.217 | 1037.33 HSJOIN ( 4) 432.438 177.222 /----------+----------\ 1037.33 1000 FETCH FETCH ( 5) ( 9) 271.459 160.576 144.222 33 /----+---\ /----+---\ 1037.33 103733 1000 1000 RIDSCN TABLE: ADMIN IXSCAN TABLE: ADMIN ( 6) HISTORY ( 10) TELLER 15.542 53.0234 1 4 | | 1037.33 1000 SORT INDEX: ADMIN ( 7) TELLINDX 15.5409 1 | 1037.33 IXSCAN ( 8) 14.5176 1 | 103733 INDEX: ADMIN HISTIX1
Course materials may not be reproduced in whole or in part without the prior written permission of IBM.
5-24 DB2 for Linux, UNIX, and Windows © Copyright IBM Corp. 2001, 2006
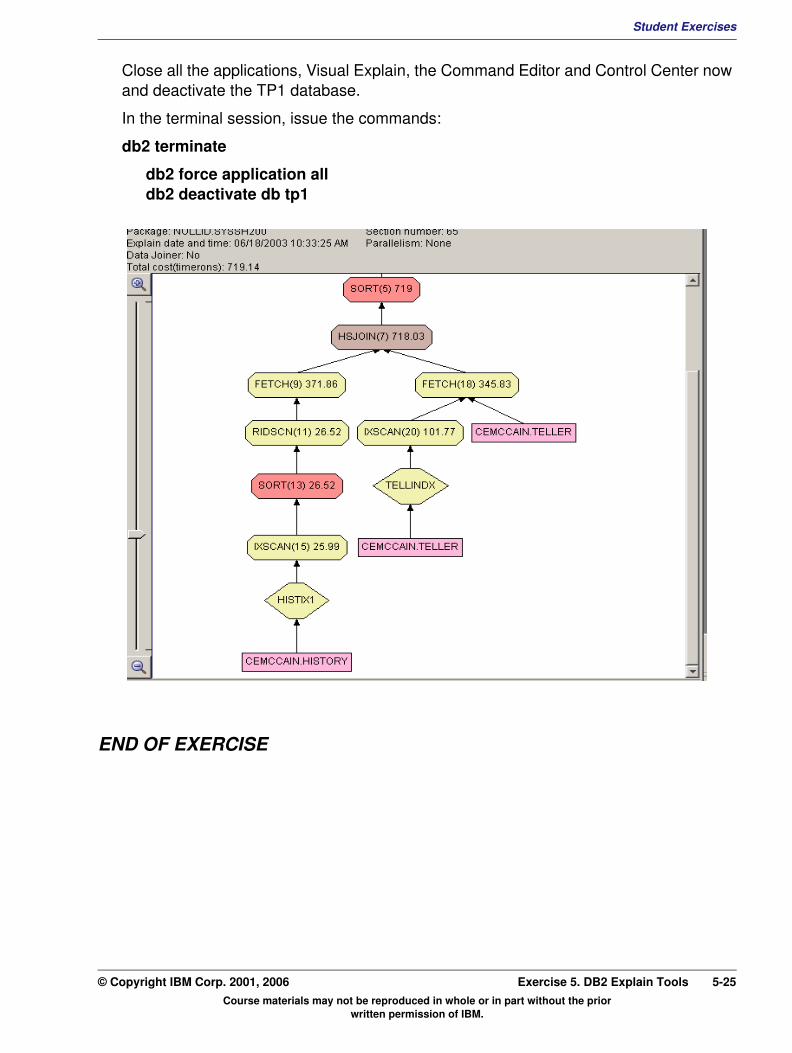
Student ExercisesV3.1.0.1
EXempty
Close all the applications, Visual Explain, the Command Editor and Control Center now and deactivate the TP1 database.In the terminal session, issue the commands:
db2 terminate
db2 force application all db2 deactivate db tp1
END OF EXERCISE
Course materials may not be reproduced in whole or in part without the prior written permission of IBM.
© Copyright IBM Corp. 2001, 2006 Exercise 5. DB2 Explain Tools 5-25

Student Exercises
Course materials may not be reproduced in whole or in part without the prior written permission of IBM.
5-26 DB2 for Linux, UNIX, and Windows © Copyright IBM Corp. 2001, 2006
Student ExercisesV3.1.0.1
EXempty
Exercise 6. DB2 OptimizerWhat This Exercise Is About
This exercise is an online lab which allows the student to use the DB2 UDB Explain tools to better understand access plan selections of the DB2 Optimizer.
What You Should Be Able to Do
At the end of the lab, you should be able to:
• Configure the DB2 Query Optimization Level to generate different access plans for an SQL query.
• Utilize the RUNSTATS utility to collect distribution statistics to improve cardinality estimates for SQL query.
• Use the DB2 explain tools to evaluate the access plan for a query using a table with no catalog statistics and a table that is set to VOLATILE.
Course materials may not be reproduced in whole or in part without the prior written permission of IBM.
© Copyright IBM Corp. 2001, 2006 Exercise 6. DB2 Optimizer 6-1
Student Exercises
Exercise Instructions
Introduction
In this exercise, you will be using the DB2 Explain tool DB2EXPLN to review the DB2 Optimizer access strategies for running an SQL query with different query optimization levels. The query used, joins two tables and uses indexes to access the tables.
A new table, HIST2, will be created with data from the current HISTORY table. A query will be analyzed that references the new HIST2 table that has no catalog statistics. The HIST2 table will be altered to have the VOLATILE option to determine the effect of this option on the optimizer access plan.
A set of transaction will be loaded in the HIST2 that have a non-uniform distribution for the branch_id column. The db2exfmt explain tool will be used to show difference between optimizer cardinality estimates with basic table statistics and more detailed distribution statistics for the branch_id column.
Note: The examples are shown to help you locate the information, the costs and other statistics in your reports may vary from the values shown. If a different level of DB2 UDB product is used for this exercise, some of the processing operations selected by the optimizer could also be changed.
Course materials may not be reproduced in whole or in part without the prior written permission of IBM.
6-2 DB2 for Linux, UNIX, and Windows © Copyright IBM Corp. 2001, 2006

Student ExercisesV3.1.0.1
EXempty
Section 1 - Use db2expln to Explain a Query That Joins Two Tables with Various Optimization Levels__ 1. The db2expln tool can be used to produce a simple report that shows the DB2 optimizer's access plan for dynamic SQL statements. A query will be explained with different levels of optimization to see the differences in access plans and estimated query costs. The following query will be used:
SELECT HISTORY.BRANCH_ID, TELLER.TELLER_NAME, HISTORY.ACCTNAME, HISTORY.ACCT_ID, HISTORY.BALANCE FROM HISTORY AS HISTORY, TELLER AS TELLER WHERE HISTORY.TELLER_ID = TELLER.TELLER_ID AND HISTORY.BRANCH_ID = 25 ORDER BY HISTORY.BRANCH_ID ASC, HISTORY.ACCT_ID ASC
This query joins the HISTORY and TELLER tables. The HISTORY transactions for a single Branch are being selected.
In the terminal session, issue the commands:
cd $HOME/bin db2 connect to tp1
Check the current database configuration option for DFT_QUERYOPT.
db2 get db cfg | grep QUERYOPT
The output will look similar to the following:
Default query optimization class (DFT_QUERYOPT) = 5
This shows that the TP1 database has the default level of query optimization, which is 5.
Run the db2expln tool and save the report to a file, lab61.txt. The SQL statement is contained in a file lab60.sql.
db2expln -d tp1 -f lab60.sql -z \; -g -o lab61.txt
The output will look similar to the following:
DB2 Universal Database Version 8.1, 5622-044 (c) Copyright IBM Corp. 1991, 2002Licensed Material - Program Property of IBMIBM DB2 Universal Database SQL Explain Tool
Output is available in 'lab61.txt'.
__ 2. Use the UNIX vi editor to review the explain data saved in the file lab61.txt.
In the terminal session, issue the command:
vi lab61.txt
Course materials may not be reproduced in whole or in part without the prior written permission of IBM.
© Copyright IBM Corp. 2001, 2006 Exercise 6. DB2 Optimizer 6-3

Student Exercises
The output will look similar to:
DB2 Universal Database Version 9.1, 5622-044 (c) Copyright IBM Corp. 1991, 2006Licensed Material - Program Property of IBMIBM DB2 Universal Database SQL and XQUERY Explain Tool
******************** DYNAMIC ***************************************
==================== STATEMENT ==========================================
Isolation Level = Cursor StabilityBlocking = Block Unambiguous CursorsQuery Optimization Class = 5
Partition Parallel = NoIntra-Partition Parallel = No
SQL Path = "SYSIBM", "SYSFUN", "SYSPROC", "SYSIBMADM",
"INST411"
Statement: SELECT HISTORY.BRANCH_ID, TELLER.TELLER_NAME, HISTORY.ACCTNAME, HISTORY.ACCT_ID, HISTORY.BALANCE FROM HISTORY AS HISTORY, TELLER AS TELLER WHERE HISTORY.TELLER_ID =TELLER.TELLER_ID AND HISTORY.BRANCH_ID =25 ORDER BY HISTORY.BRANCH_ID ASC, HISTORY.ACCT_ID ASC
Section Code Page = 1208
Estimated Cost = 769.963318Estimated Cardinality = 2000.000000
Access Table Name = INST411.TELLER ID = 3,4| Index Scan: Name = INST411.TELLINDX ID = 1| | Regular Index (Not Clustered)| | Index Columns:| | | 1: TELLER_ID (Ascending)| #Columns = 2| #Key Columns = 0| | Start Key: Beginning of Index| | Stop Key: End of Index
Course materials may not be reproduced in whole or in part without the prior written permission of IBM.
6-4 DB2 for Linux, UNIX, and Windows © Copyright IBM Corp. 2001, 2006
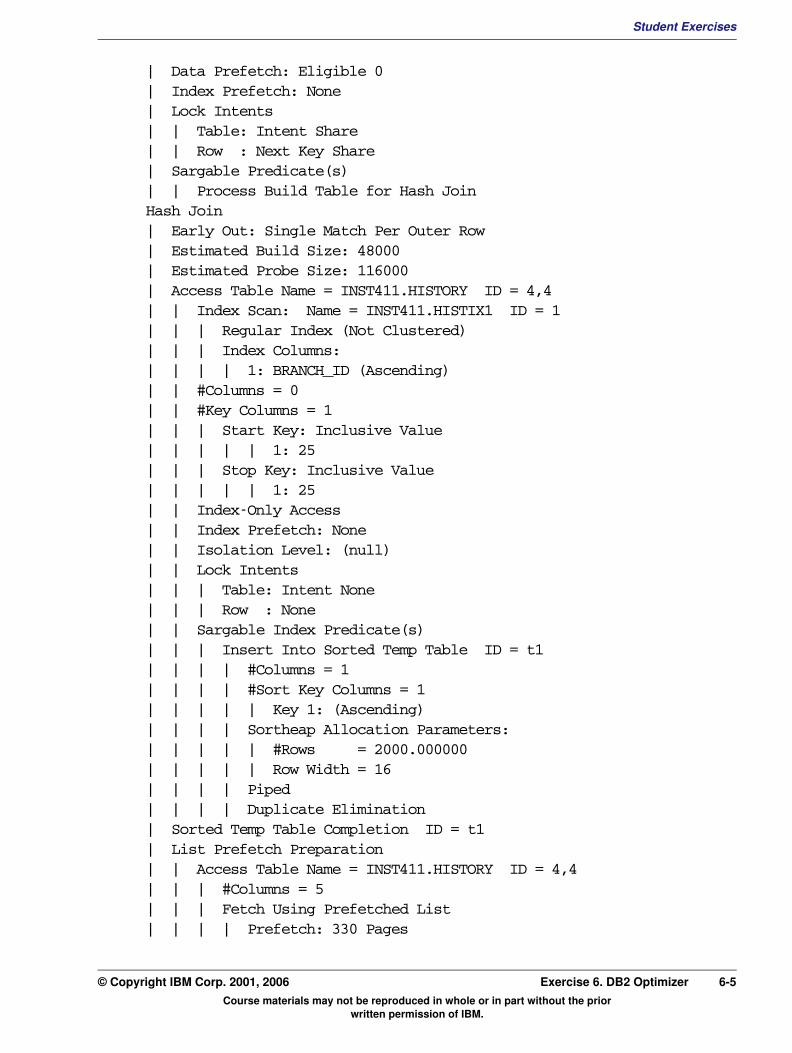
Student ExercisesV3.1.0.1
EXempty
| Data Prefetch: Eligible 0| Index Prefetch: None| Lock Intents| | Table: Intent Share| | Row : Next Key Share| Sargable Predicate(s)| | Process Build Table for Hash JoinHash Join| Early Out: Single Match Per Outer Row| Estimated Build Size: 48000 | Estimated Probe Size: 116000 | Access Table Name = INST411.HISTORY ID = 4,4| | Index Scan: Name = INST411.HISTIX1 ID = 1| | | Regular Index (Not Clustered)| | | Index Columns:| | | | 1: BRANCH_ID (Ascending)| | #Columns = 0| | #Key Columns = 1| | | Start Key: Inclusive Value| | | | | 1: 25| | | Stop Key: Inclusive Value| | | | | 1: 25| | Index-Only Access| | Index Prefetch: None| | Isolation Level: (null)| | Lock Intents| | | Table: Intent None| | | Row : None| | Sargable Index Predicate(s)| | | Insert Into Sorted Temp Table ID = t1| | | | #Columns = 1| | | | #Sort Key Columns = 1| | | | | Key 1: (Ascending)| | | | Sortheap Allocation Parameters:| | | | | #Rows = 2000.000000| | | | | Row Width = 16| | | | Piped| | | | Duplicate Elimination| Sorted Temp Table Completion ID = t1| List Prefetch Preparation| | Access Table Name = INST411.HISTORY ID = 4,4| | | #Columns = 5| | | Fetch Using Prefetched List| | | | Prefetch: 330 PagesCourse materials may not be reproduced in whole or in part without the prior written permission of IBM.
© Copyright IBM Corp. 2001, 2006 Exercise 6. DB2 Optimizer 6-5

Student Exercises
| | | Lock Intents| | | | Table: Intent Share| | | | Row : Next Key Share| | | Sargable Predicate(s)| | | | #Predicates = 1| | | | Process Probe Table for Hash JoinInsert Into Sorted Temp Table ID = t2| #Columns = 5| #Sort Key Columns = 1| | Key 1: ACCT_ID (Ascending)| Sortheap Allocation Parameters:| | #Rows = 2000.000000| | Row Width = 60| PipedAccess Temp Table ID = t2| #Columns = 5| Relation Scan| | Prefetch: Eligible| Sargable Predicate(s)| | Return Data to Application| | | #Columns = 5Return Data Completion
End of section
Optimizer Plan:
RETURN ( 1) | TBSCAN ( 2) | SORT ( 3) | HSJOIN ( 4) /-/ \-\ FETCH FETCH (----) ( 9) / \ / \ RIDSCN Table: IXSCAN Table:
Course materials may not be reproduced in whole or in part without the prior written permission of IBM.
6-6 DB2 for Linux, UNIX, and Windows © Copyright IBM Corp. 2001, 2006
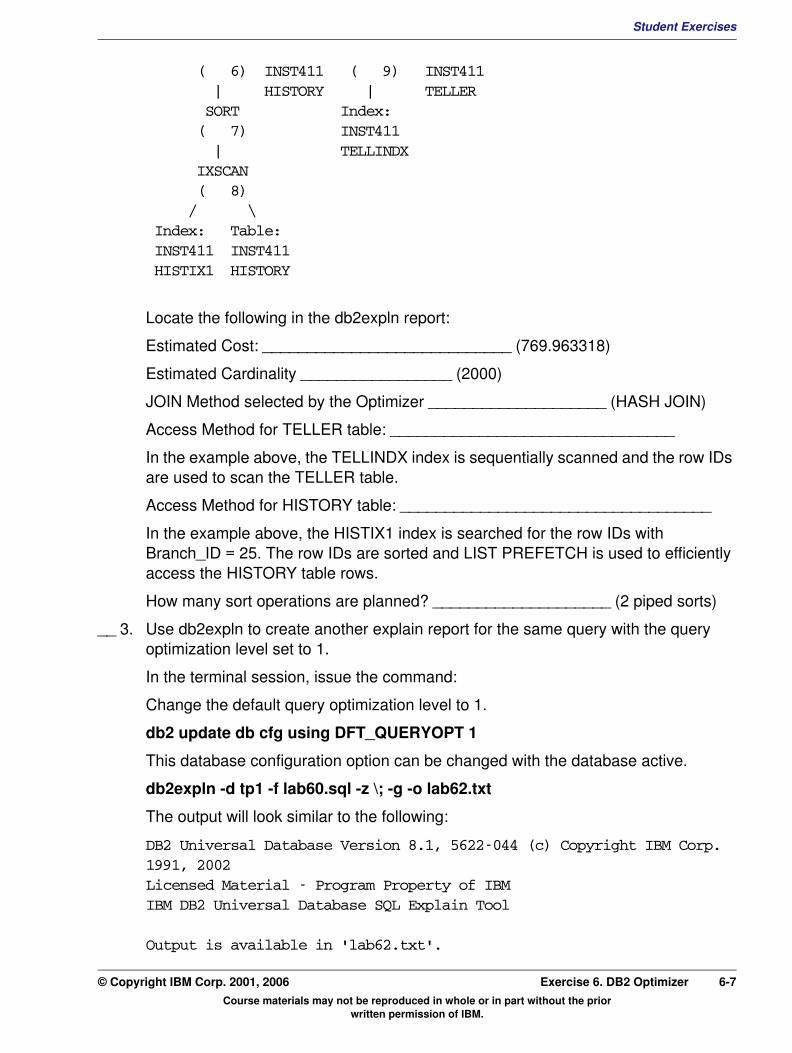
Student ExercisesV3.1.0.1
EXempty
( 6) INST411 ( 9) INST411 | HISTORY | TELLER SORT Index: ( 7) INST411 | TELLINDX IXSCAN ( 8) / \ Index: Table: INST411 INST411 HISTIX1 HISTORYLocate the following in the db2expln report:
Estimated Cost: ____________________________ (769.963318)
Estimated Cardinality _________________ (2000)
JOIN Method selected by the Optimizer ____________________ (HASH JOIN)
Access Method for TELLER table: ________________________________
In the example above, the TELLINDX index is sequentially scanned and the row IDs are used to scan the TELLER table.
Access Method for HISTORY table: ___________________________________
In the example above, the HISTIX1 index is searched for the row IDs with Branch_ID = 25. The row IDs are sorted and LIST PREFETCH is used to efficiently access the HISTORY table rows.
How many sort operations are planned? ____________________ (2 piped sorts)
__ 3. Use db2expln to create another explain report for the same query with the query optimization level set to 1.
In the terminal session, issue the command:
Change the default query optimization level to 1.
db2 update db cfg using DFT_QUERYOPT 1
This database configuration option can be changed with the database active.
db2expln -d tp1 -f lab60.sql -z \; -g -o lab62.txt
The output will look similar to the following:
DB2 Universal Database Version 8.1, 5622-044 (c) Copyright IBM Corp. 1991, 2002Licensed Material - Program Property of IBMIBM DB2 Universal Database SQL Explain Tool
Output is available in 'lab62.txt'.
Course materials may not be reproduced in whole or in part without the prior written permission of IBM.
© Copyright IBM Corp. 2001, 2006 Exercise 6. DB2 Optimizer 6-7

Student Exercises
__ 4. Use the UNIX vi editor to review the explain data saved in the file lab62.txt.
In the terminal session, issue the command:
vi lab62.txt
The output will look similar to:
DB2 Universal Database Version 9.1, 5622-044 (c) Copyright IBM Corp. 1991, 2006Licensed Material - Program Property of IBMIBM DB2 Universal Database SQL and XQUERY Explain Tool
******************** DYNAMIC ***************************************
==================== STATEMENT ==========================================
Isolation Level = Cursor StabilityBlocking = Block Unambiguous CursorsQuery Optimization Class = 1
Partition Parallel = NoIntra-Partition Parallel = No
SQL Path = "SYSIBM", "SYSFUN", "SYSPROC", "SYSIBMADM", "INST411"
Statement: SELECT HISTORY.BRANCH_ID, TELLER.TELLER_NAME, HISTORY.ACCTNAME, HISTORY.ACCT_ID, HISTORY.BALANCE FROM HISTORY AS HISTORY, TELLER AS TELLER WHERE HISTORY.TELLER_ID =TELLER.TELLER_ID AND HISTORY.BRANCH_ID =25 ORDER BY HISTORY.BRANCH_ID ASC, HISTORY.ACCT_ID ASC
Section Code Page = 1208
Estimated Cost = 833.405945Estimated Cardinality = 2000.000000
Access Table Name = INST411.TELLER ID = 3,4| Index Scan: Name = INST411.TELLINDX ID = 1| | Regular Index (Not Clustered)| | Index Columns:
Course materials may not be reproduced in whole or in part without the prior written permission of IBM.
6-8 DB2 for Linux, UNIX, and Windows © Copyright IBM Corp. 2001, 2006
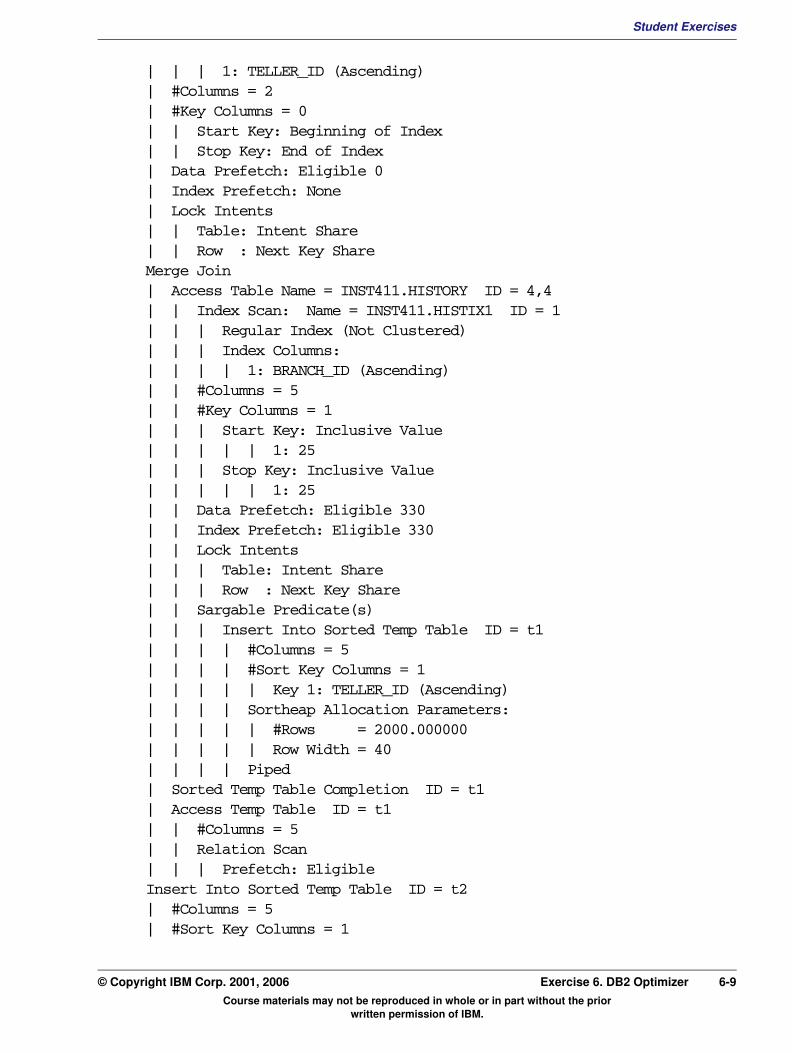
Student ExercisesV3.1.0.1
EXempty
| | | 1: TELLER_ID (Ascending)| #Columns = 2| #Key Columns = 0| | Start Key: Beginning of Index| | Stop Key: End of Index| Data Prefetch: Eligible 0| Index Prefetch: None| Lock Intents| | Table: Intent Share| | Row : Next Key ShareMerge Join| Access Table Name = INST411.HISTORY ID = 4,4| | Index Scan: Name = INST411.HISTIX1 ID = 1| | | Regular Index (Not Clustered)| | | Index Columns:| | | | 1: BRANCH_ID (Ascending)| | #Columns = 5| | #Key Columns = 1| | | Start Key: Inclusive Value| | | | | 1: 25| | | Stop Key: Inclusive Value| | | | | 1: 25| | Data Prefetch: Eligible 330| | Index Prefetch: Eligible 330| | Lock Intents| | | Table: Intent Share| | | Row : Next Key Share| | Sargable Predicate(s)| | | Insert Into Sorted Temp Table ID = t1| | | | #Columns = 5| | | | #Sort Key Columns = 1| | | | | Key 1: TELLER_ID (Ascending)| | | | Sortheap Allocation Parameters:| | | | | #Rows = 2000.000000| | | | | Row Width = 40| | | | Piped| Sorted Temp Table Completion ID = t1| Access Temp Table ID = t1| | #Columns = 5| | Relation Scan| | | Prefetch: EligibleInsert Into Sorted Temp Table ID = t2| #Columns = 5| #Sort Key Columns = 1Course materials may not be reproduced in whole or in part without the prior written permission of IBM.
© Copyright IBM Corp. 2001, 2006 Exercise 6. DB2 Optimizer 6-9
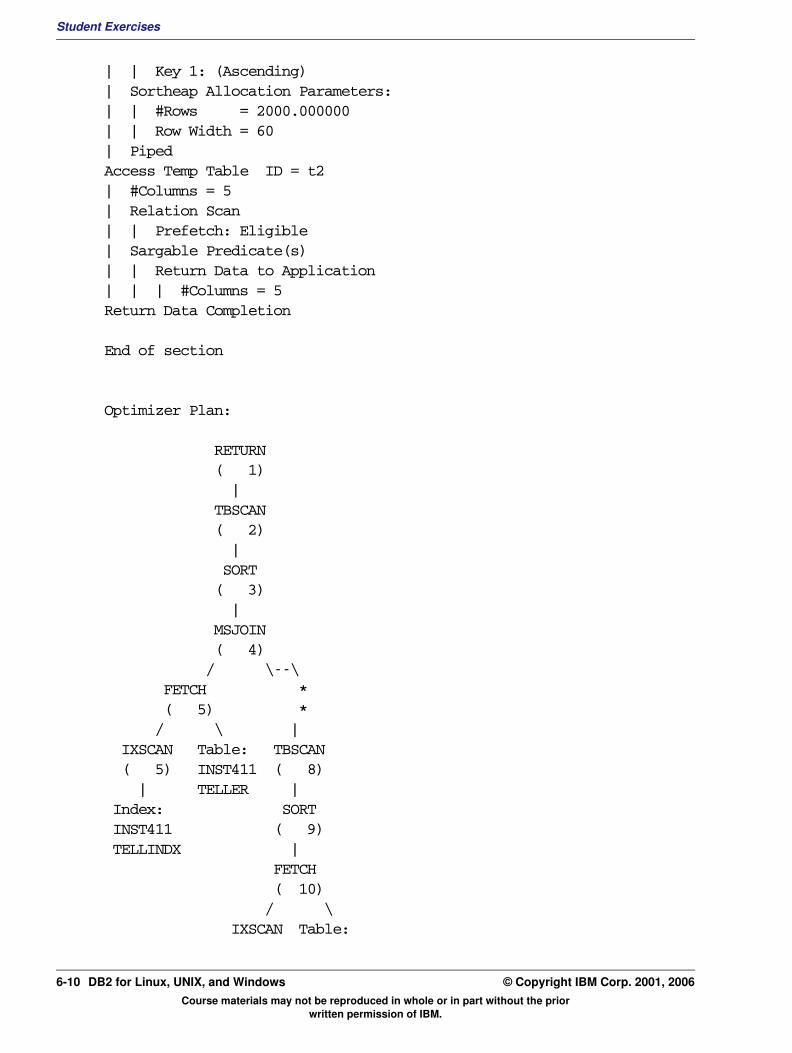
Student Exercises
| | Key 1: (Ascending)| Sortheap Allocation Parameters:| | #Rows = 2000.000000| | Row Width = 60| PipedAccess Temp Table ID = t2| #Columns = 5| Relation Scan| | Prefetch: Eligible| Sargable Predicate(s)| | Return Data to Application| | | #Columns = 5Return Data Completion
End of section
Optimizer Plan:
RETURN ( 1) | TBSCAN ( 2) | SORT ( 3) | MSJOIN ( 4) / \--\ FETCH * ( 5) * / \ | IXSCAN Table: TBSCAN ( 5) INST411 ( 8) | TELLER | Index: SORT INST411 ( 9) TELLINDX | FETCH ( 10) / \ IXSCAN Table:
Course materials may not be reproduced in whole or in part without the prior written permission of IBM.
6-10 DB2 for Linux, UNIX, and Windows © Copyright IBM Corp. 2001, 2006

Student ExercisesV3.1.0.1
EXempty
( 10) INST411 | HISTORY Index: INST411 HISTIX1Locate the following in the db2expln report:
Estimated Cost: ____________________________ (833.405945)
This is slightly higher than the estimated cost with optimization level set to 5.
JOIN Method selected by the Optimizer _____________________ (MERGE JOIN)
Access Method for TELLER table: _____________________________________
In the example above, the TELLINDX index is sequentially scanned and the row IDs are used to scan the TELLER table.
Access Method for HISTORY table: ____________________________________
In the example above, the index HISTIX1 is used to access the HISTORY table. An Index Scan is used to retrieve the transactions with Branch_ID = 25. The rows are then sorted by TELLER_ID for the join.
How many sort operations are planned? ____________________ (2 piped sorts)
__ 5. Use db2expln to create another explain report for the same query with the query optimization level set to 0.
In the terminal session, issue the commands:
Change the default query optimization level to 0.
db2 update db cfg using DFT_QUERYOPT 0
db2expln -d tp1 -f lab60.sql -z \; -g -o lab63.txt
The output will look similar to the following:
DB2 Universal Database Version 8.1, 5622-044 (c) Copyright IBM Corp. 1991, 2002Licensed Material - Program Property of IBMIBM DB2 Universal Database SQL Explain Tool
Output is available in 'lab53.txt'.
__ 6. Use the UNIX vi editor application to review the explain data saved in the file Lab63.txt.
In the terminal session, issue the following command:
vi lab63.txt
Course materials may not be reproduced in whole or in part without the prior written permission of IBM.
© Copyright IBM Corp. 2001, 2006 Exercise 6. DB2 Optimizer 6-11
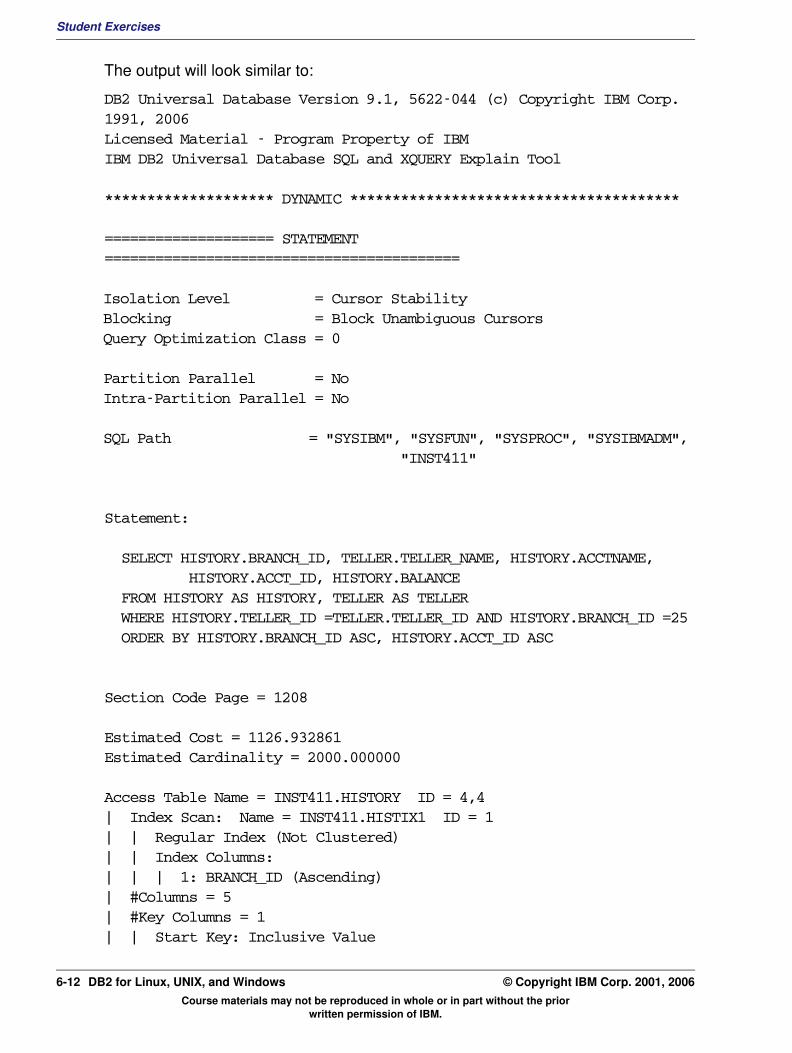
Student Exercises
The output will look similar to:
DB2 Universal Database Version 9.1, 5622-044 (c) Copyright IBM Corp. 1991, 2006Licensed Material - Program Property of IBMIBM DB2 Universal Database SQL and XQUERY Explain Tool
******************** DYNAMIC ***************************************
==================== STATEMENT ==========================================
Isolation Level = Cursor StabilityBlocking = Block Unambiguous CursorsQuery Optimization Class = 0
Partition Parallel = NoIntra-Partition Parallel = No
SQL Path = "SYSIBM", "SYSFUN", "SYSPROC", "SYSIBMADM", "INST411"
Statement: SELECT HISTORY.BRANCH_ID, TELLER.TELLER_NAME, HISTORY.ACCTNAME, HISTORY.ACCT_ID, HISTORY.BALANCE FROM HISTORY AS HISTORY, TELLER AS TELLER WHERE HISTORY.TELLER_ID =TELLER.TELLER_ID AND HISTORY.BRANCH_ID =25 ORDER BY HISTORY.BRANCH_ID ASC, HISTORY.ACCT_ID ASC
Section Code Page = 1208
Estimated Cost = 1126.932861Estimated Cardinality = 2000.000000
Access Table Name = INST411.HISTORY ID = 4,4| Index Scan: Name = INST411.HISTIX1 ID = 1| | Regular Index (Not Clustered)| | Index Columns:| | | 1: BRANCH_ID (Ascending)| #Columns = 5| #Key Columns = 1| | Start Key: Inclusive Value
Course materials may not be reproduced in whole or in part without the prior written permission of IBM.
6-12 DB2 for Linux, UNIX, and Windows © Copyright IBM Corp. 2001, 2006

Student ExercisesV3.1.0.1
EXempty
| | | | 1: 25| | Stop Key: Inclusive Value| | | | 1: 25| Data Prefetch: Eligible 330| Index Prefetch: Eligible 330| Lock Intents| | Table: Intent Share| | Row : Next Key Share| Sargable Predicate(s)| | Insert Into Sorted Temp Table ID = t1| | | #Columns = 5| | | #Sort Key Columns = 1| | | | Key 1: ACCT_ID (Ascending)| | | Sortheap Allocation Parameters:| | | | #Rows = 2000.000000| | | | Row Width = 40| | | PipedSorted Temp Table Completion ID = t1Access Temp Table ID = t1| #Columns = 5| Relation Scan| | Prefetch: EligibleNested Loop Join| Access Table Name = INST411.TELLER ID = 3,4| | Index Scan: Name = INST411.TELLINDX ID = 1| | | Regular Index (Not Clustered)| | | Index Columns:| | | | 1: TELLER_ID (Ascending)| | #Columns = 1| | Single Record| | Fully Qualified Unique Key| | #Key Columns = 1| | | Start Key: Inclusive Value| | | | | 1: ?| | | Stop Key: Inclusive Value| | | | | 1: ?| | Data Prefetch: None| | Index Prefetch: None| | Lock Intents| | | Table: Intent Share| | | Row : Next Key ShareReturn Data to Application| #Columns = 5Course materials may not be reproduced in whole or in part without the prior written permission of IBM.
© Copyright IBM Corp. 2001, 2006 Exercise 6. DB2 Optimizer 6-13
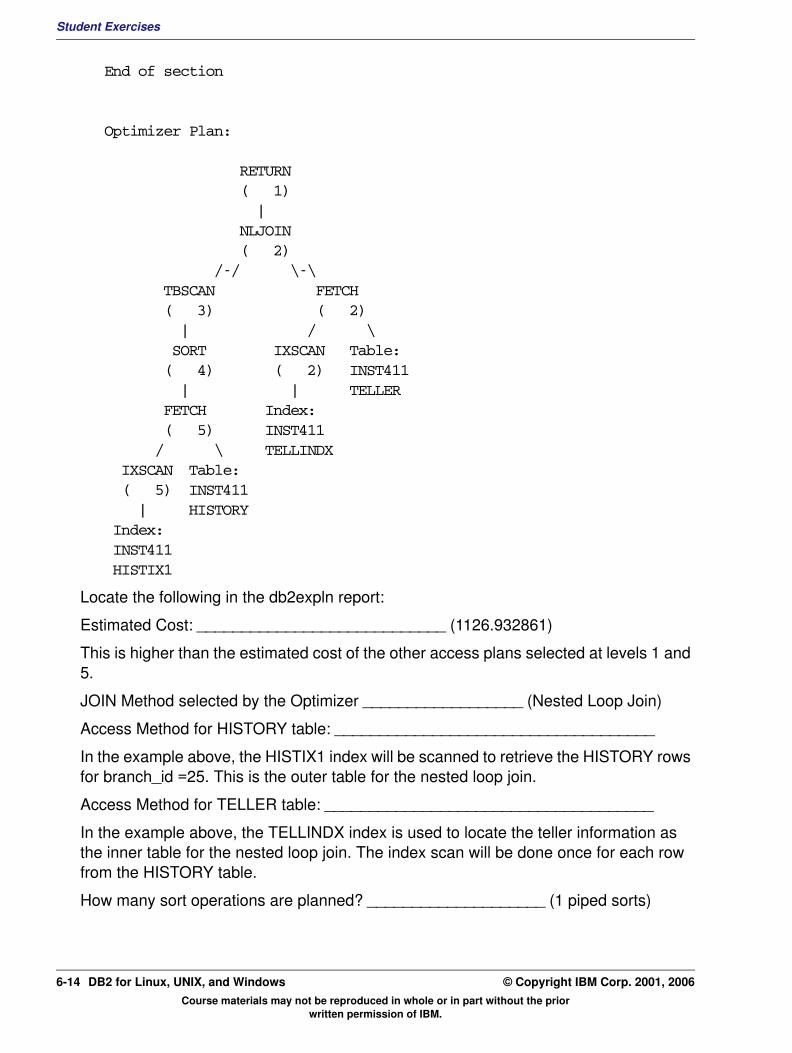
Student Exercises
End of section
Optimizer Plan:
RETURN ( 1) | NLJOIN ( 2) /-/ \-\ TBSCAN FETCH ( 3) ( 2) | / \ SORT IXSCAN Table: ( 4) ( 2) INST411 | | TELLER FETCH Index: ( 5) INST411 / \ TELLINDX IXSCAN Table: ( 5) INST411 | HISTORY Index: INST411 HISTIX1
Locate the following in the db2expln report:
Estimated Cost: ____________________________ (1126.932861)
This is higher than the estimated cost of the other access plans selected at levels 1 and 5.
JOIN Method selected by the Optimizer __________________ (Nested Loop Join)
Access Method for HISTORY table: ____________________________________
In the example above, the HISTIX1 index will be scanned to retrieve the HISTORY rows for branch_id =25. This is the outer table for the nested loop join.
Access Method for TELLER table: _____________________________________
In the example above, the TELLINDX index is used to locate the teller information as the inner table for the nested loop join. The index scan will be done once for each row from the HISTORY table.
How many sort operations are planned? ____________________ (1 piped sorts)
Course materials may not be reproduced in whole or in part without the prior written permission of IBM.
6-14 DB2 for Linux, UNIX, and Windows © Copyright IBM Corp. 2001, 2006

Student ExercisesV3.1.0.1
EXempty
For this query, the DB2 optimization level of 5 selected a lower cost access plan when compared to levels 1 and 0.__ 7. Change the default query optimization level for the TP1 database back to 5.
In the terminal session, issue the command:
db2 update db cfg using DFT_QUERYOPT 5
Course materials may not be reproduced in whole or in part without the prior written permission of IBM.
© Copyright IBM Corp. 2001, 2006 Exercise 6. DB2 Optimizer 6-15
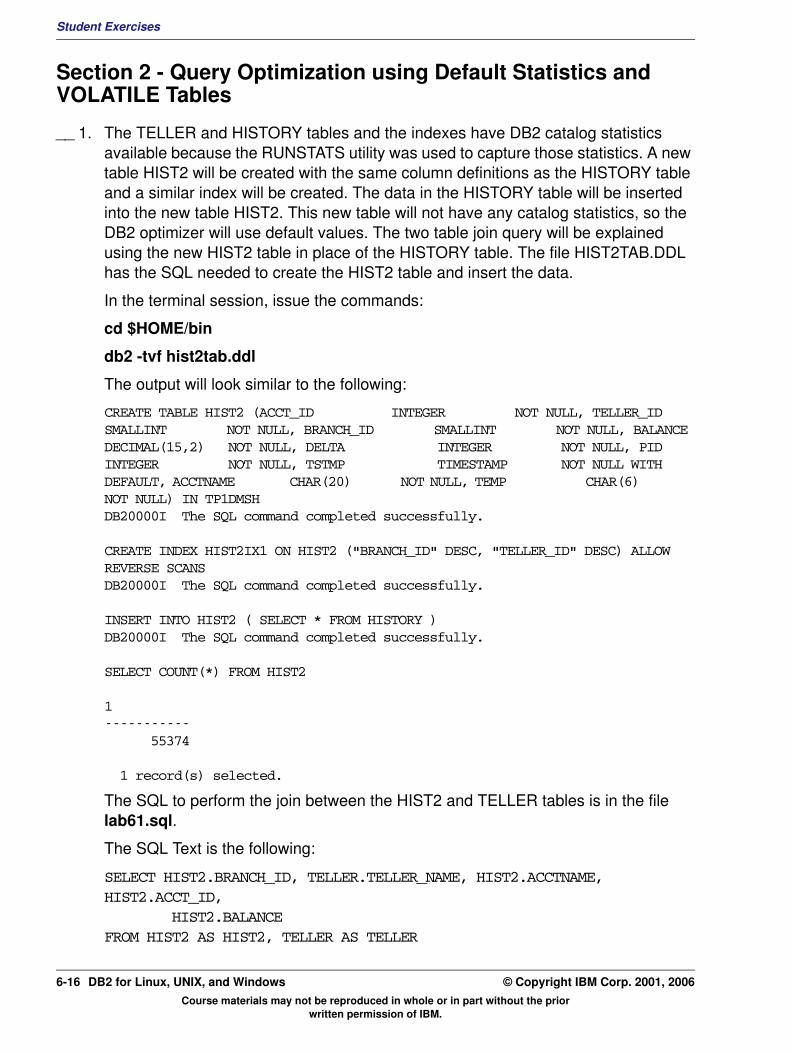
Student Exercises
Section 2 - Query Optimization using Default Statistics and VOLATILE Tables
__ 1. The TELLER and HISTORY tables and the indexes have DB2 catalog statistics available because the RUNSTATS utility was used to capture those statistics. A new table HIST2 will be created with the same column definitions as the HISTORY table and a similar index will be created. The data in the HISTORY table will be inserted into the new table HIST2. This new table will not have any catalog statistics, so the DB2 optimizer will use default values. The two table join query will be explained using the new HIST2 table in place of the HISTORY table. The file HIST2TAB.DDL has the SQL needed to create the HIST2 table and insert the data.
In the terminal session, issue the commands:
cd $HOME/bin
db2 -tvf hist2tab.ddl
The output will look similar to the following:
CREATE TABLE HIST2 (ACCT_ID INTEGER NOT NULL, TELLER_ID SMALLINT NOT NULL, BRANCH_ID SMALLINT NOT NULL, BALANCE DECIMAL(15,2) NOT NULL, DELTA INTEGER NOT NULL, PID INTEGER NOT NULL, TSTMP TIMESTAMP NOT NULL WITH DEFAULT, ACCTNAME CHAR(20) NOT NULL, TEMP CHAR(6) NOT NULL) IN TP1DMSHDB20000I The SQL command completed successfully.
CREATE INDEX HIST2IX1 ON HIST2 ("BRANCH_ID" DESC, "TELLER_ID" DESC) ALLOW REVERSE SCANSDB20000I The SQL command completed successfully.
INSERT INTO HIST2 ( SELECT * FROM HISTORY )DB20000I The SQL command completed successfully.
SELECT COUNT(*) FROM HIST2
1----------- 55374
1 record(s) selected.
The SQL to perform the join between the HIST2 and TELLER tables is in the file lab61.sql.
The SQL Text is the following:
SELECT HIST2.BRANCH_ID, TELLER.TELLER_NAME, HIST2.ACCTNAME, HIST2.ACCT_ID, HIST2.BALANCE FROM HIST2 AS HIST2, TELLER AS TELLER
Course materials may not be reproduced in whole or in part without the prior written permission of IBM.
6-16 DB2 for Linux, UNIX, and Windows © Copyright IBM Corp. 2001, 2006
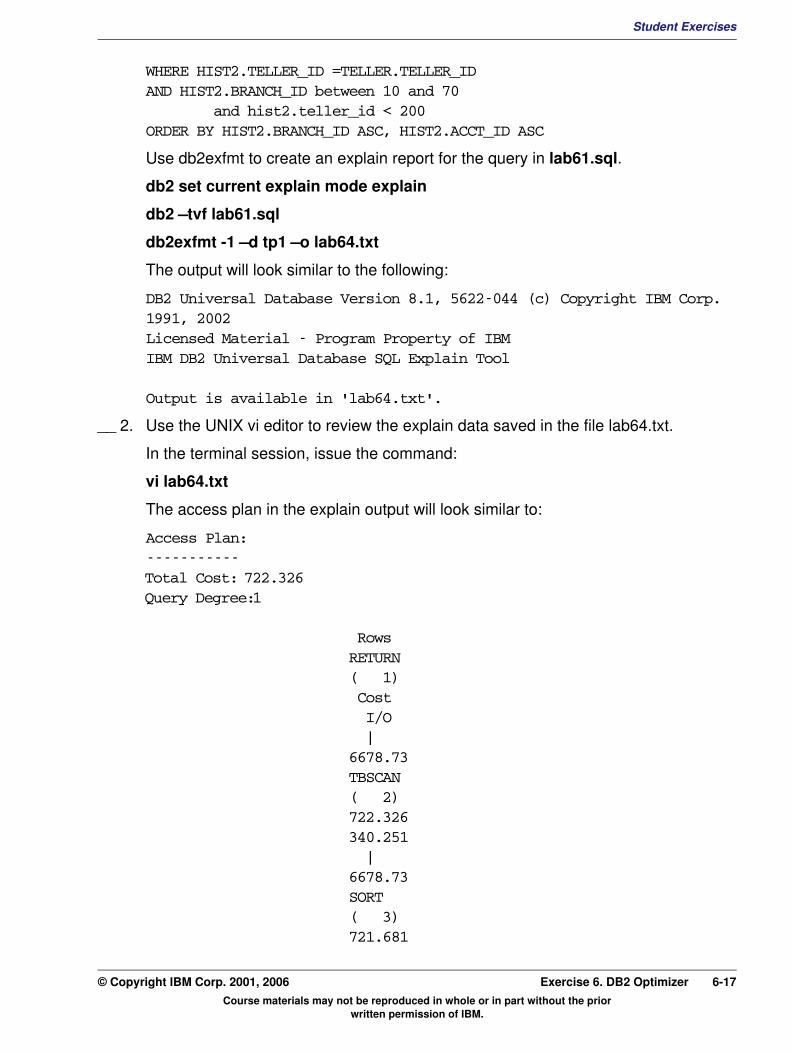
Student ExercisesV3.1.0.1
EXempty
WHERE HIST2.TELLER_ID =TELLER.TELLER_ID AND HIST2.BRANCH_ID between 10 and 70 and hist2.teller_id < 200 ORDER BY HIST2.BRANCH_ID ASC, HIST2.ACCT_ID ASCUse db2exfmt to create an explain report for the query in lab61.sql.
db2 set current explain mode explain
db2 –tvf lab61.sql
db2exfmt -1 –d tp1 –o lab64.txt
The output will look similar to the following:
DB2 Universal Database Version 8.1, 5622-044 (c) Copyright IBM Corp. 1991, 2002Licensed Material - Program Property of IBMIBM DB2 Universal Database SQL Explain Tool
Output is available in 'lab64.txt'.
__ 2. Use the UNIX vi editor to review the explain data saved in the file lab64.txt.
In the terminal session, issue the command:
vi lab64.txt
The access plan in the explain output will look similar to:
Access Plan:-----------Total Cost: 722.326Query Degree:1
Rows RETURN ( 1) Cost I/O | 6678.73 TBSCAN ( 2) 722.326 340.251 | 6678.73 SORT ( 3) 721.681
Course materials may not be reproduced in whole or in part without the prior written permission of IBM.
© Copyright IBM Corp. 2001, 2006 Exercise 6. DB2 Optimizer 6-17
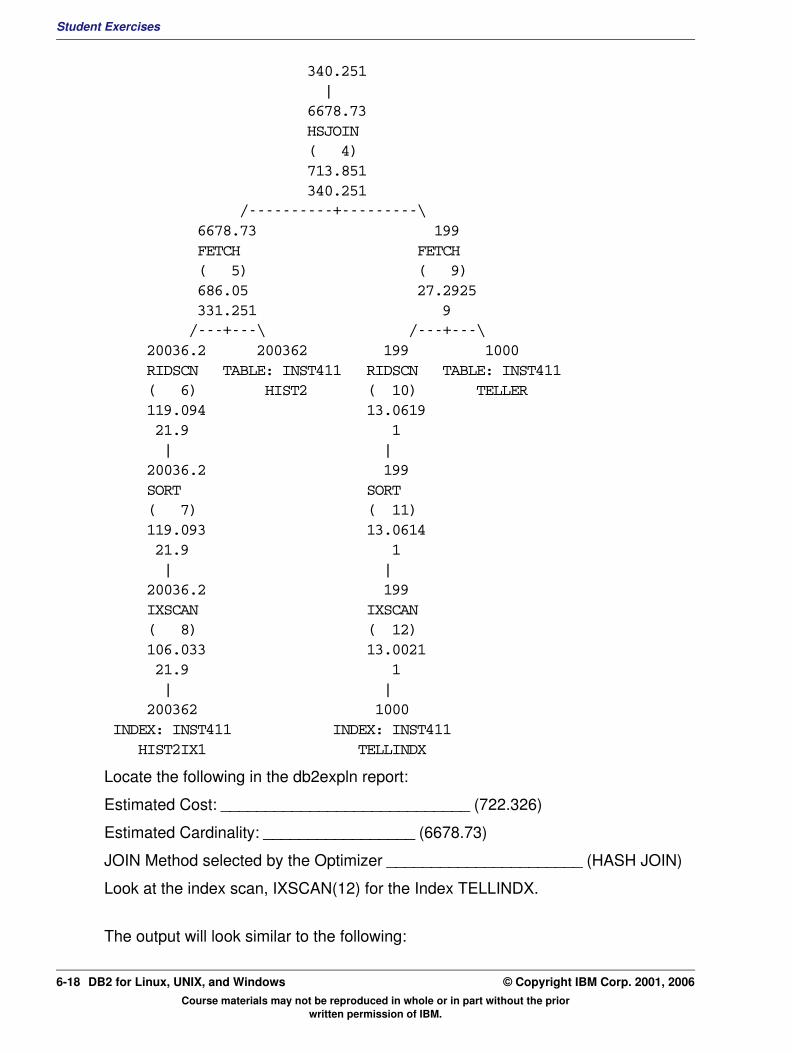
Student Exercises
340.251 | 6678.73 HSJOIN ( 4) 713.851 340.251 /----------+---------\ 6678.73 199 FETCH FETCH ( 5) ( 9) 686.05 27.2925 331.251 9 /---+---\ /---+---\ 20036.2 200362 199 1000 RIDSCN TABLE: INST411 RIDSCN TABLE: INST411 ( 6) HIST2 ( 10) TELLER 119.094 13.0619 21.9 1 | | 20036.2 199 SORT SORT ( 7) ( 11) 119.093 13.0614 21.9 1 | | 20036.2 199 IXSCAN IXSCAN ( 8) ( 12) 106.033 13.0021 21.9 1 | | 200362 1000 INDEX: INST411 INDEX: INST411 HIST2IX1 TELLINDX
Locate the following in the db2expln report:
Estimated Cost: ____________________________ (722.326)
Estimated Cardinality: _________________ (6678.73)
JOIN Method selected by the Optimizer ______________________ (HASH JOIN)
Look at the index scan, IXSCAN(12) for the Index TELLINDX.
The output will look similar to the following:
Course materials may not be reproduced in whole or in part without the prior written permission of IBM.
6-18 DB2 for Linux, UNIX, and Windows © Copyright IBM Corp. 2001, 2006

Student ExercisesV3.1.0.1
EXempty
12) IXSCAN: (Index Scan)Cumulative Total Cost: 13.0021Cumulative CPU Cost: 394376Cumulative I/O Cost: 1Cumulative Re-Total Cost: 0.134593Cumulative Re-CPU Cost: 348915Cumulative Re-I/O Cost: 0Cumulative First Row Cost: 12.87Estimated Bufferpool Buffers: 2Arguments:--------MAXPAGES: (Maximum pages for prefetch)
1PREFETCH: (Type of Prefetch)
NONEROWLOCK : (Row Lock intent)
NONESCANDIR : (Scan Direction)
FORWARDTABLOCK : (Table Lock intent)
INTENT NONE
Predicates:---------2) Stop Key Predicate
Comparison Operator: Less Than (<)Subquery Input Required: NoFilter Factor: 0.199
Predicate Text:-------------(Q1.TELLER_ID < 200)
Input Streams:------------7) From Object INST411.TELLINDX
Estimated number of rows: 1000Number of columns: 2Subquery predicate ID: Not Applicable
Column Names:
Course materials may not be reproduced in whole or in part without the prior written permission of IBM.
© Copyright IBM Corp. 2001, 2006 Exercise 6. DB2 Optimizer 6-19
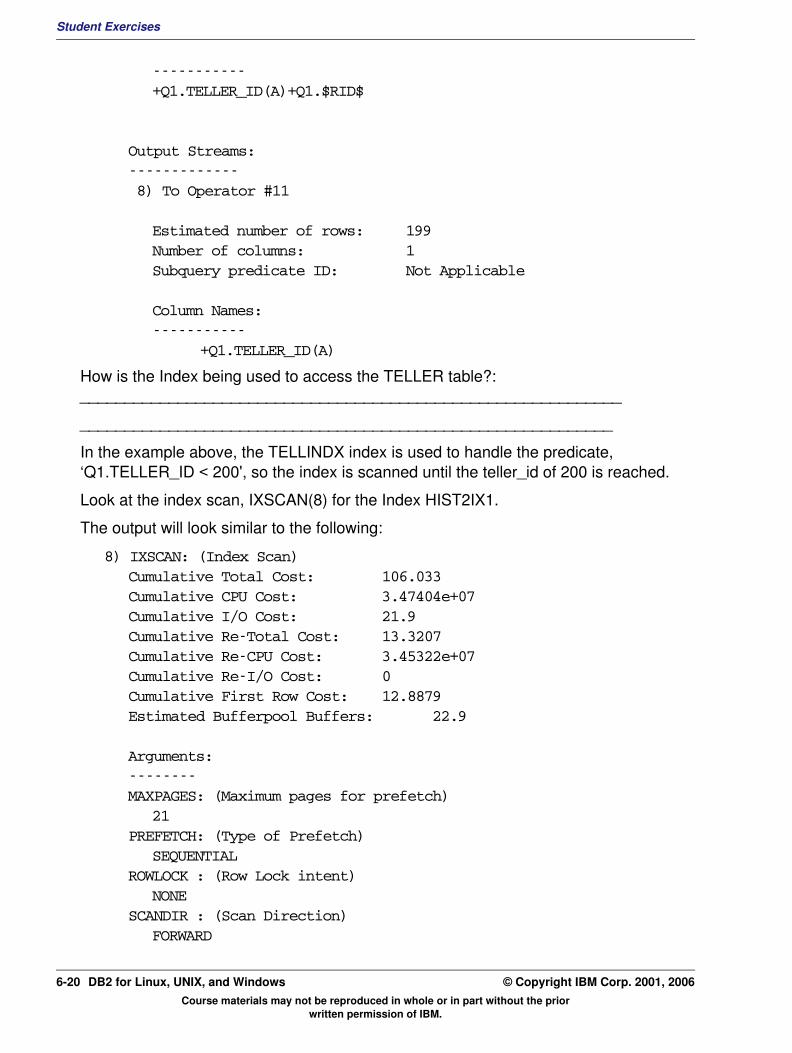
Student Exercises
-----------+Q1.TELLER_ID(A)+Q1.$RID$
Output Streams:------------- 8) To Operator #11
Estimated number of rows: 199Number of columns: 1Subquery predicate ID: Not Applicable
Column Names:-----------
+Q1.TELLER_ID(A)
How is the Index being used to access the TELLER table?: _____________________________________________________________
____________________________________________________________
In the example above, the TELLINDX index is used to handle the predicate, ‘Q1.TELLER_ID < 200', so the index is scanned until the teller_id of 200 is reached.
Look at the index scan, IXSCAN(8) for the Index HIST2IX1.
The output will look similar to the following:
8) IXSCAN: (Index Scan)Cumulative Total Cost: 106.033Cumulative CPU Cost: 3.47404e+07Cumulative I/O Cost: 21.9Cumulative Re-Total Cost: 13.3207Cumulative Re-CPU Cost: 3.45322e+07Cumulative Re-I/O Cost: 0Cumulative First Row Cost: 12.8879Estimated Bufferpool Buffers: 22.9
Arguments:--------MAXPAGES: (Maximum pages for prefetch)
21PREFETCH: (Type of Prefetch)
SEQUENTIALROWLOCK : (Row Lock intent)
NONESCANDIR : (Scan Direction)
FORWARD
Course materials may not be reproduced in whole or in part without the prior written permission of IBM.
6-20 DB2 for Linux, UNIX, and Windows © Copyright IBM Corp. 2001, 2006
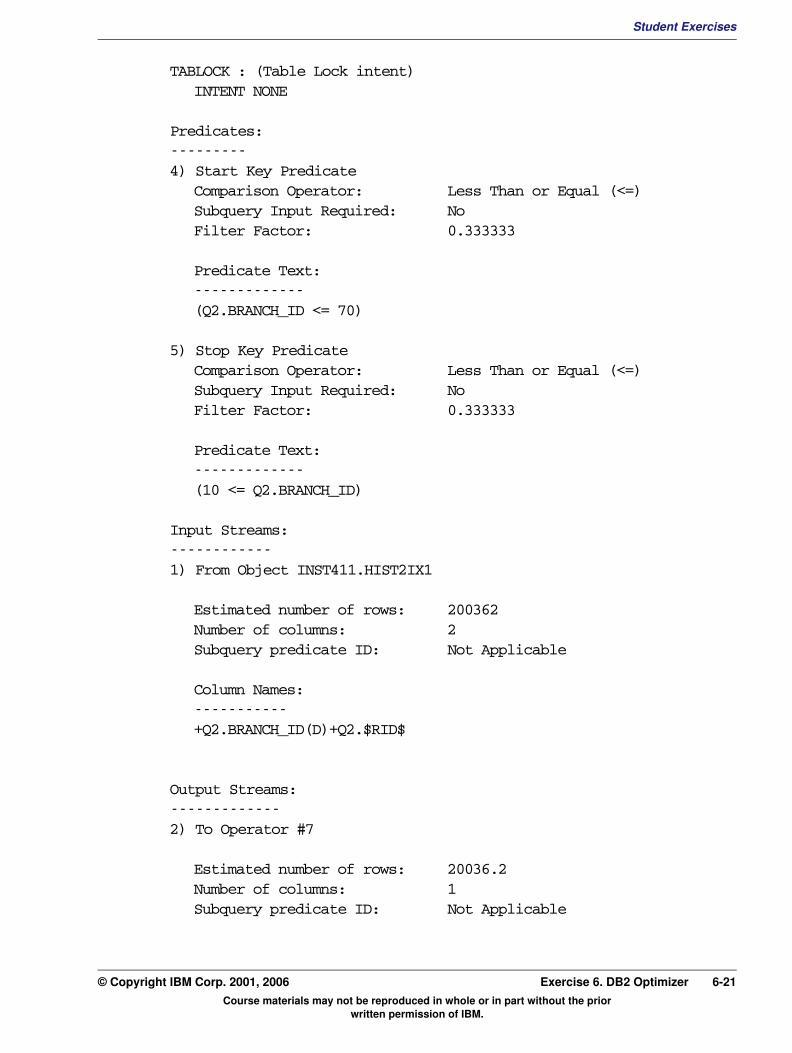
Student ExercisesV3.1.0.1
EXempty
TABLOCK : (Table Lock intent)INTENT NONEPredicates:---------4) Start Key Predicate
Comparison Operator: Less Than or Equal (<=)Subquery Input Required: NoFilter Factor: 0.333333
Predicate Text:-------------(Q2.BRANCH_ID <= 70)
5) Stop Key PredicateComparison Operator: Less Than or Equal (<=)Subquery Input Required: NoFilter Factor: 0.333333
Predicate Text:-------------(10 <= Q2.BRANCH_ID)
Input Streams:------------1) From Object INST411.HIST2IX1
Estimated number of rows: 200362Number of columns: 2Subquery predicate ID: Not Applicable
Column Names:-----------+Q2.BRANCH_ID(D)+Q2.$RID$
Output Streams:-------------2) To Operator #7
Estimated number of rows: 20036.2Number of columns: 1Subquery predicate ID: Not Applicable
Course materials may not be reproduced in whole or in part without the prior written permission of IBM.
© Copyright IBM Corp. 2001, 2006 Exercise 6. DB2 Optimizer 6-21

Student Exercises
Column Names:-----------+Q2.BRANCH_ID(D)
The Input Streams shows an estimated number of rows at 200362, which is very close to the actual row count of 200000. The index scan is being used to retrieve the rows with a branch_id between 10 and 70. The start predicate is (Q2.BRANCH_ID <= 70) and the stop predicate is (10 <= Q2.BRANCH_ID). This is done because the index was created with the branch_id in a descending sequence.
How many rows are expected to result from the index scan of the HIST2 table? _______________________________________
The example shows 20036.2 rows of output are expected.
Next look at the FETCH (5) operation for the HIST2 table.
The output will look similar to the following:
5) FETCH : (Fetch)Cumulative Total Cost: 686.05Cumulative CPU Cost: 1.13041e+08Cumulative I/O Cost: 331.251Cumulative Re-Total Cost: 31.6263Cumulative Re-CPU Cost: 8.1987e+07Cumulative Re-I/O Cost: 0Cumulative First Row Cost: 132.004Estimated Bufferpool Buffers: 332.251
Arguments:--------JN INPUT: (Join input leg)
OUTERMAX RIDS: (Maximum RIDs per list prefetch request)
1024PREFETCH: (Type of Prefetch)
LISTROWLOCK : (Row Lock intent)
NEXT KEY SHARETABLOCK : (Table Lock intent)
INTENT SHARETBISOLVL: (Table access Isolation Level)
CURSOR STABILITY
Predicates:---------8) Sargable PredicateComparison Operator: Less Than (<)
Course materials may not be reproduced in whole or in part without the prior written permission of IBM.
6-22 DB2 for Linux, UNIX, and Windows © Copyright IBM Corp. 2001, 2006
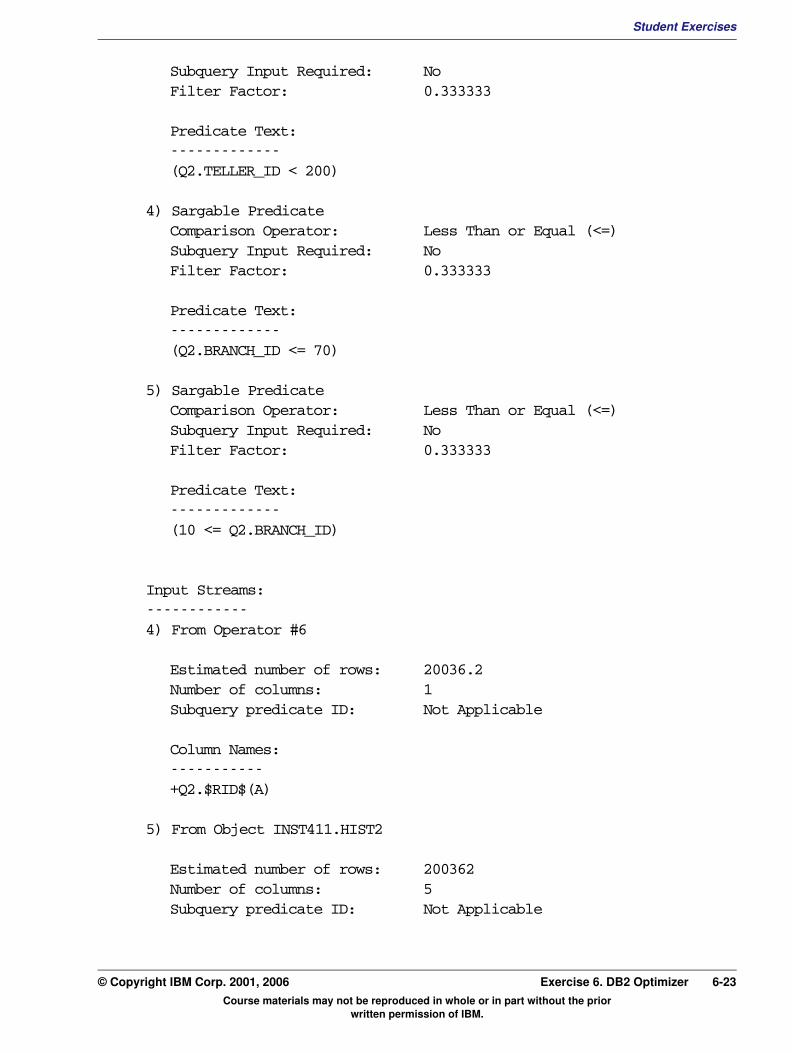
Student ExercisesV3.1.0.1
EXempty
Subquery Input Required: NoFilter Factor: 0.333333Predicate Text:-------------(Q2.TELLER_ID < 200)
4) Sargable PredicateComparison Operator: Less Than or Equal (<=)Subquery Input Required: NoFilter Factor: 0.333333
Predicate Text:-------------(Q2.BRANCH_ID <= 70)
5) Sargable PredicateComparison Operator: Less Than or Equal (<=)Subquery Input Required: NoFilter Factor: 0.333333
Predicate Text:-------------(10 <= Q2.BRANCH_ID)
Input Streams:------------4) From Operator #6
Estimated number of rows: 20036.2Number of columns: 1Subquery predicate ID: Not Applicable
Column Names:-----------+Q2.$RID$(A)
5) From Object INST411.HIST2
Estimated number of rows: 200362Number of columns: 5Subquery predicate ID: Not Applicable
Course materials may not be reproduced in whole or in part without the prior written permission of IBM.
© Copyright IBM Corp. 2001, 2006 Exercise 6. DB2 Optimizer 6-23
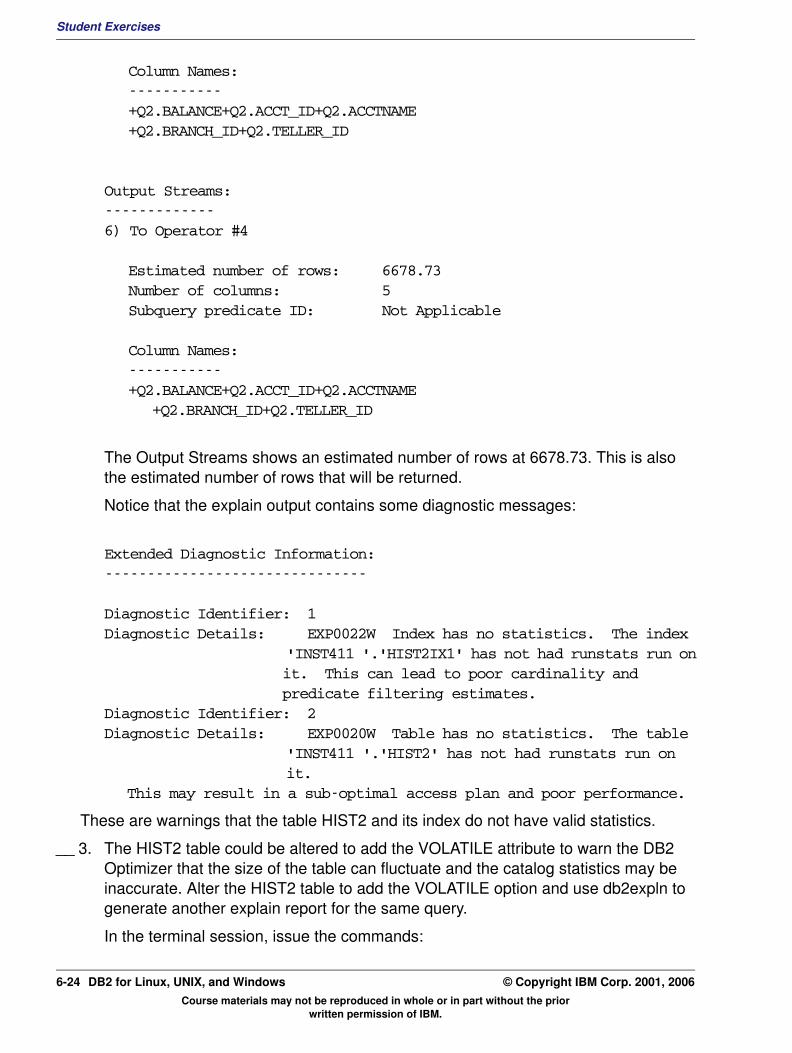
Student Exercises
Column Names:-----------+Q2.BALANCE+Q2.ACCT_ID+Q2.ACCTNAME+Q2.BRANCH_ID+Q2.TELLER_ID
Output Streams:-------------6) To Operator #4
Estimated number of rows: 6678.73Number of columns: 5Subquery predicate ID: Not Applicable
Column Names:-----------+Q2.BALANCE+Q2.ACCT_ID+Q2.ACCTNAME
+Q2.BRANCH_ID+Q2.TELLER_ID
The Output Streams shows an estimated number of rows at 6678.73. This is also the estimated number of rows that will be returned.
Notice that the explain output contains some diagnostic messages:
Extended Diagnostic Information:-------------------------------
Diagnostic Identifier: 1Diagnostic Details: EXP0022W Index has no statistics. The index
'INST411 '.'HIST2IX1' has not had runstats run onit. This can lead to poor cardinality andpredicate filtering estimates.
Diagnostic Identifier: 2Diagnostic Details: EXP0020W Table has no statistics. The table
'INST411 '.'HIST2' has not had runstats run onit.
This may result in a sub-optimal access plan and poor performance.
These are warnings that the table HIST2 and its index do not have valid statistics.
__ 3. The HIST2 table could be altered to add the VOLATILE attribute to warn the DB2 Optimizer that the size of the table can fluctuate and the catalog statistics may be inaccurate. Alter the HIST2 table to add the VOLATILE option and use db2expln to generate another explain report for the same query.
In the terminal session, issue the commands:
Course materials may not be reproduced in whole or in part without the prior written permission of IBM.
6-24 DB2 for Linux, UNIX, and Windows © Copyright IBM Corp. 2001, 2006

Student ExercisesV3.1.0.1
EXempty
db2 alter table HIST2 VOLATILEdb2 terminate
db2 connect to TP1
Use db2exfmt to create an explain report for the query in lab61.sql.
db2 set current explain mode explain
db2 –tvf lab61.sql
db2exfmt -1 –d tp1 –o lab65.txt
The access plan in the output will look similar to the following:
DB2 Universal Database Version 8.1, 5622-044 (c) Copyright IBM Corp. 1991, 2002Licensed Material - Program Property of IBMIBM DB2 Universal Database SQL Explain Tool
Output is available in 'lab65.txt'.
__ 4. Use the UNIX vi editor to review the explain data saved in the file lab65.txt.
In the terminal session, issue the following command:
vi lab65.txt
The output will look similar to:
Access Plan:-----------Total Cost: 375.323Query Degree:1
Rows RETURN ( 1) Cost I/O | 13.2667 TBSCAN ( 2) 375.323 116.9 | 13.2667 SORT ( 3)
Course materials may not be reproduced in whole or in part without the prior written permission of IBM.
© Copyright IBM Corp. 2001, 2006 Exercise 6. DB2 Optimizer 6-25
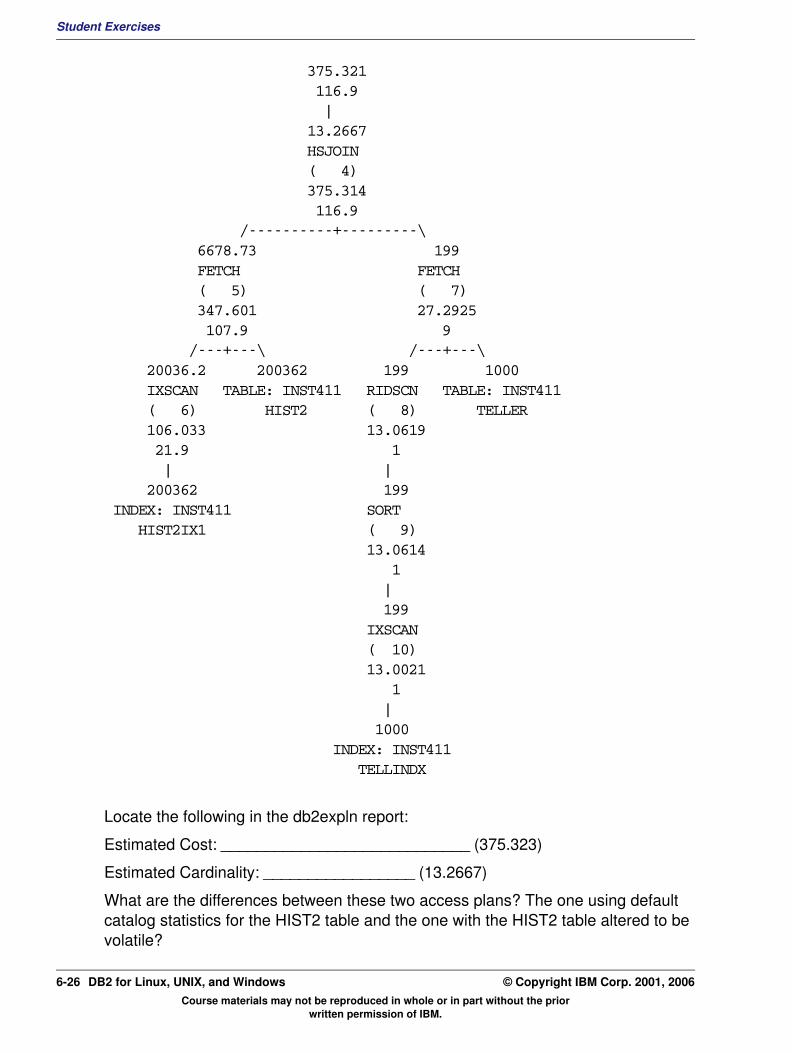
Student Exercises
375.321 116.9 | 13.2667 HSJOIN ( 4) 375.314 116.9 /----------+---------\ 6678.73 199 FETCH FETCH ( 5) ( 7) 347.601 27.2925 107.9 9 /---+---\ /---+---\ 20036.2 200362 199 1000 IXSCAN TABLE: INST411 RIDSCN TABLE: INST411 ( 6) HIST2 ( 8) TELLER 106.033 13.0619 21.9 1 | | 200362 199 INDEX: INST411 SORT HIST2IX1 ( 9) 13.0614 1 | 199 IXSCAN ( 10) 13.0021 1 | 1000 INDEX: INST411 TELLINDX
Locate the following in the db2expln report:
Estimated Cost: ____________________________ (375.323)
Estimated Cardinality: _________________ (13.2667)
What are the differences between these two access plans? The one using default catalog statistics for the HIST2 table and the one with the HIST2 table altered to be volatile?
Course materials may not be reproduced in whole or in part without the prior written permission of IBM.
6-26 DB2 for Linux, UNIX, and Windows © Copyright IBM Corp. 2001, 2006

Student ExercisesV3.1.0.1
EXempty
____________________________________________________________________________________________________________________________________
__________________________________________________________________
The estimated cost for access to the volatile table has been reduced and the number of estimated rows is much less.
The 2nd access plan is not using a list prefetch to retrieve the HIST2 rows once the index is accessed.
One big difference is that the estimated number of rows resulting from the Hash Join of the two tables is now only 13.2667.
Course materials may not be reproduced in whole or in part without the prior written permission of IBM.
© Copyright IBM Corp. 2001, 2006 Exercise 6. DB2 Optimizer 6-27
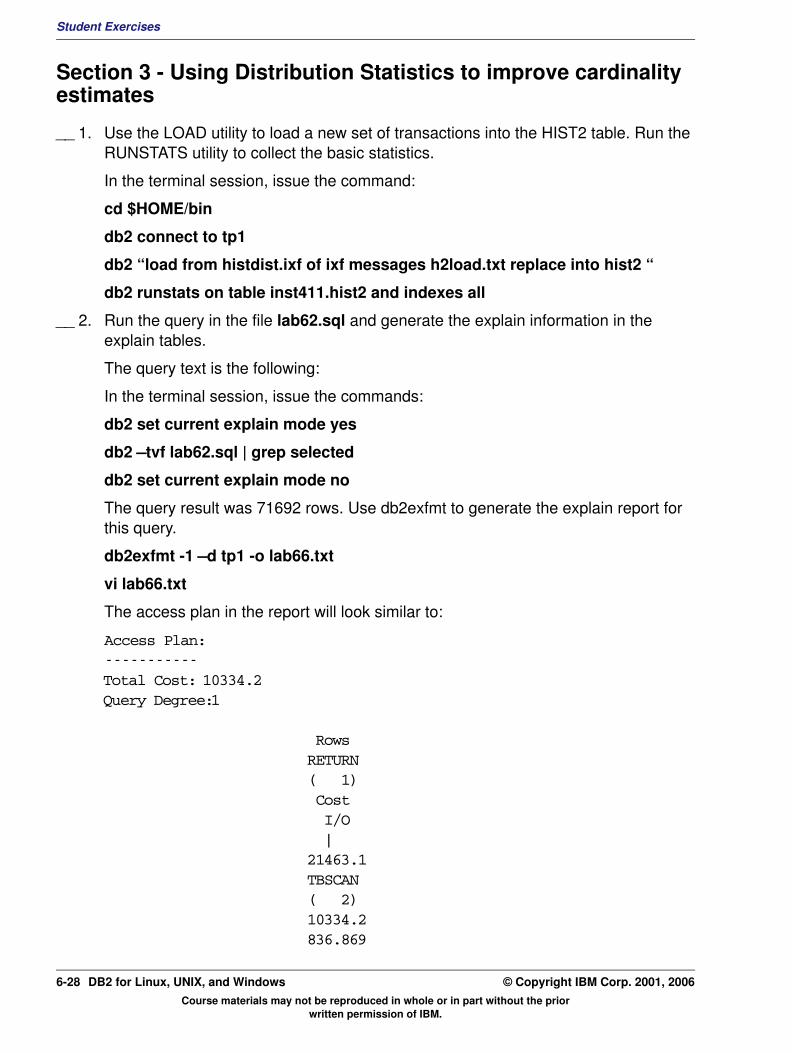
Student Exercises
Section 3 - Using Distribution Statistics to improve cardinality estimates
__ 1. Use the LOAD utility to load a new set of transactions into the HIST2 table. Run the RUNSTATS utility to collect the basic statistics.
In the terminal session, issue the command:
cd $HOME/bin
db2 connect to tp1
db2 “load from histdist.ixf of ixf messages h2load.txt replace into hist2 “
db2 runstats on table inst411.hist2 and indexes all
__ 2. Run the query in the file lab62.sql and generate the explain information in the explain tables.
The query text is the following:
In the terminal session, issue the commands:
db2 set current explain mode yes
db2 –tvf lab62.sql | grep selected
db2 set current explain mode no
The query result was 71692 rows. Use db2exfmt to generate the explain report for this query.
db2exfmt -1 –d tp1 -o lab66.txt
vi lab66.txt
The access plan in the report will look similar to:
Access Plan:-----------Total Cost: 10334.2Query Degree:1
Rows RETURN ( 1) Cost I/O | 21463.1 TBSCAN ( 2) 10334.2 836.869
Course materials may not be reproduced in whole or in part without the prior written permission of IBM.
6-28 DB2 for Linux, UNIX, and Windows © Copyright IBM Corp. 2001, 2006
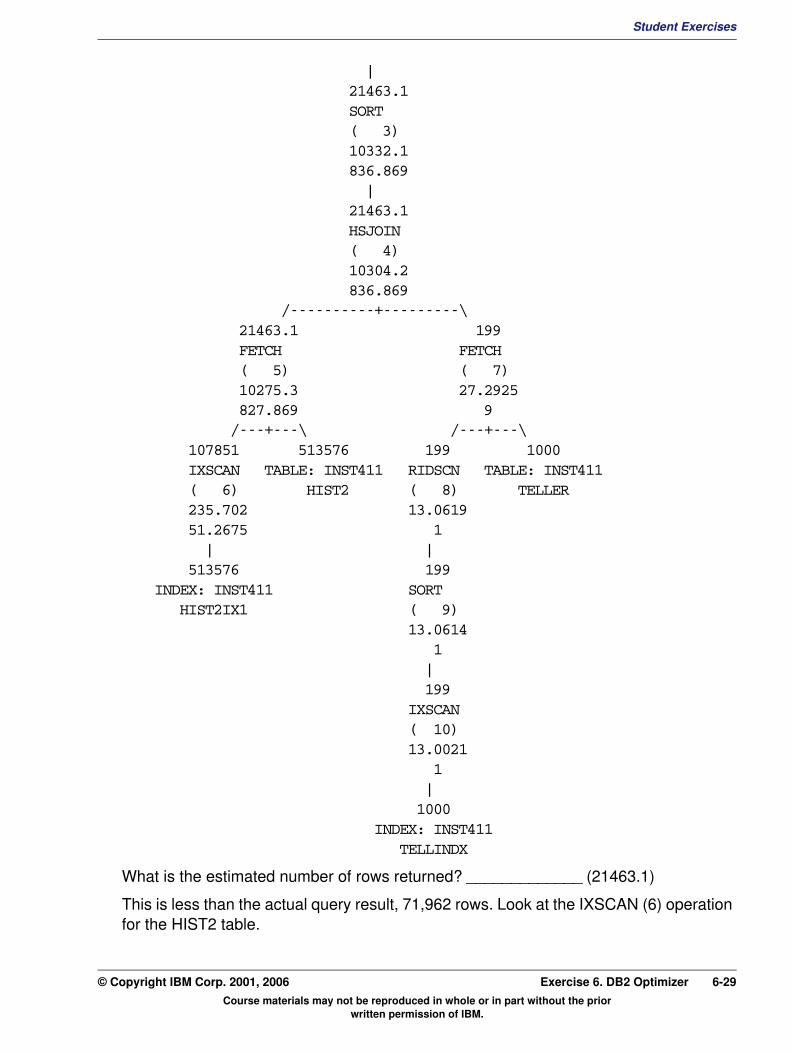
Student ExercisesV3.1.0.1
EXempty
| 21463.1 SORT ( 3) 10332.1 836.869 | 21463.1 HSJOIN ( 4) 10304.2 836.869 /----------+---------\ 21463.1 199 FETCH FETCH ( 5) ( 7) 10275.3 27.2925 827.869 9 /---+---\ /---+---\ 107851 513576 199 1000 IXSCAN TABLE: INST411 RIDSCN TABLE: INST411 ( 6) HIST2 ( 8) TELLER 235.702 13.0619 51.2675 1 | | 513576 199 INDEX: INST411 SORT HIST2IX1 ( 9) 13.0614 1 | 199 IXSCAN ( 10) 13.0021 1 | 1000 INDEX: INST411 TELLINDXWhat is the estimated number of rows returned? _____________ (21463.1)
This is less than the actual query result, 71,962 rows. Look at the IXSCAN (6) operation for the HIST2 table.
Course materials may not be reproduced in whole or in part without the prior written permission of IBM.
© Copyright IBM Corp. 2001, 2006 Exercise 6. DB2 Optimizer 6-29
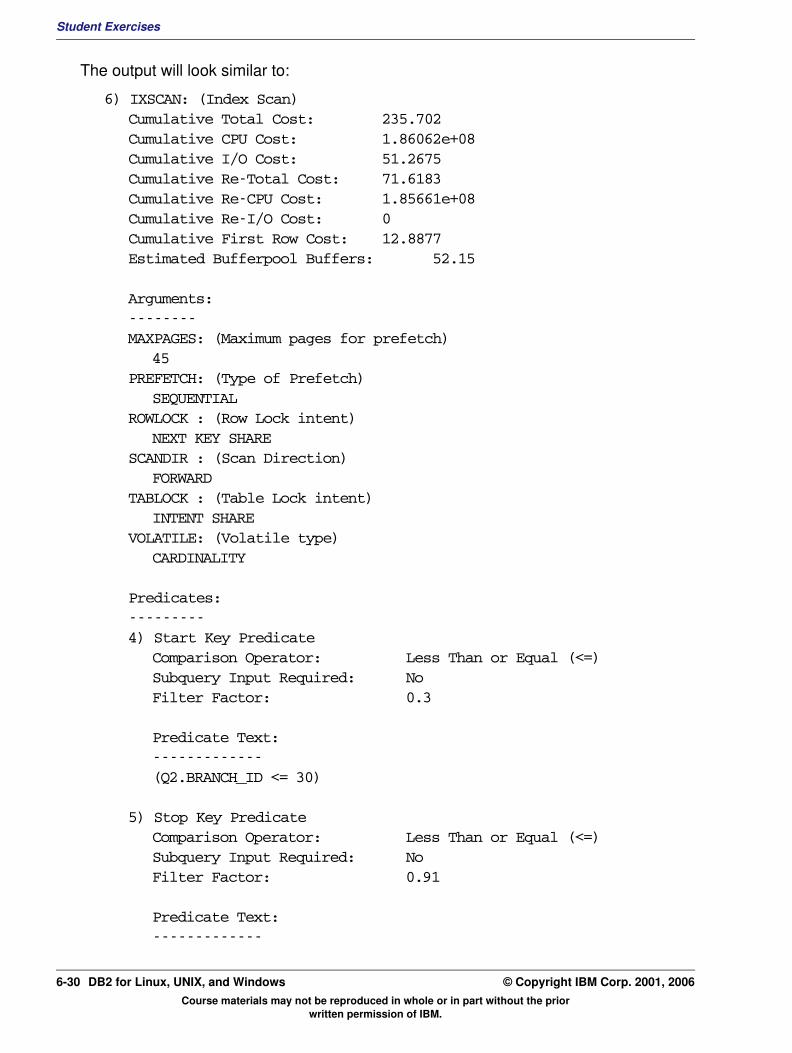
Student Exercises
The output will look similar to:
6) IXSCAN: (Index Scan)Cumulative Total Cost: 235.702Cumulative CPU Cost: 1.86062e+08Cumulative I/O Cost: 51.2675Cumulative Re-Total Cost: 71.6183Cumulative Re-CPU Cost: 1.85661e+08Cumulative Re-I/O Cost: 0Cumulative First Row Cost: 12.8877Estimated Bufferpool Buffers: 52.15
Arguments:--------MAXPAGES: (Maximum pages for prefetch)
45PREFETCH: (Type of Prefetch)
SEQUENTIALROWLOCK : (Row Lock intent)
NEXT KEY SHARESCANDIR : (Scan Direction)
FORWARDTABLOCK : (Table Lock intent)
INTENT SHAREVOLATILE: (Volatile type)
CARDINALITY
Predicates:---------4) Start Key Predicate
Comparison Operator: Less Than or Equal (<=)Subquery Input Required: NoFilter Factor: 0.3
Predicate Text:-------------(Q2.BRANCH_ID <= 30)
5) Stop Key PredicateComparison Operator: Less Than or Equal (<=)Subquery Input Required: NoFilter Factor: 0.91
Predicate Text:-------------
Course materials may not be reproduced in whole or in part without the prior written permission of IBM.
6-30 DB2 for Linux, UNIX, and Windows © Copyright IBM Corp. 2001, 2006
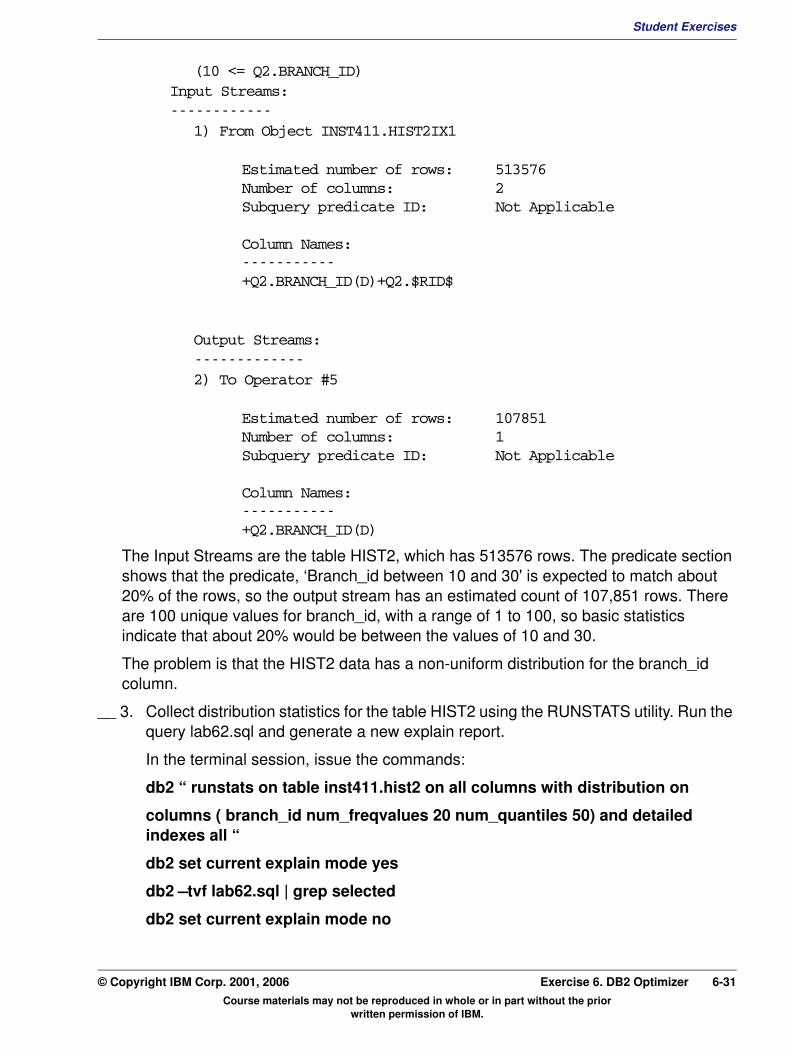
Student ExercisesV3.1.0.1
EXempty
(10 <= Q2.BRANCH_ID)Input Streams:------------1) From Object INST411.HIST2IX1
Estimated number of rows: 513576Number of columns: 2Subquery predicate ID: Not Applicable
Column Names:-----------+Q2.BRANCH_ID(D)+Q2.$RID$
Output Streams:-------------2) To Operator #5
Estimated number of rows: 107851Number of columns: 1Subquery predicate ID: Not Applicable
Column Names:-----------+Q2.BRANCH_ID(D)
The Input Streams are the table HIST2, which has 513576 rows. The predicate section shows that the predicate, ‘Branch_id between 10 and 30' is expected to match about 20% of the rows, so the output stream has an estimated count of 107,851 rows. There are 100 unique values for branch_id, with a range of 1 to 100, so basic statistics indicate that about 20% would be between the values of 10 and 30.
The problem is that the HIST2 data has a non-uniform distribution for the branch_id column.
__ 3. Collect distribution statistics for the table HIST2 using the RUNSTATS utility. Run the query lab62.sql and generate a new explain report.
In the terminal session, issue the commands:
db2 “ runstats on table inst411.hist2 on all columns with distribution on
columns ( branch_id num_freqvalues 20 num_quantiles 50) and detailed indexes all “
db2 set current explain mode yes
db2 –tvf lab62.sql | grep selected
db2 set current explain mode no
Course materials may not be reproduced in whole or in part without the prior written permission of IBM.
© Copyright IBM Corp. 2001, 2006 Exercise 6. DB2 Optimizer 6-31
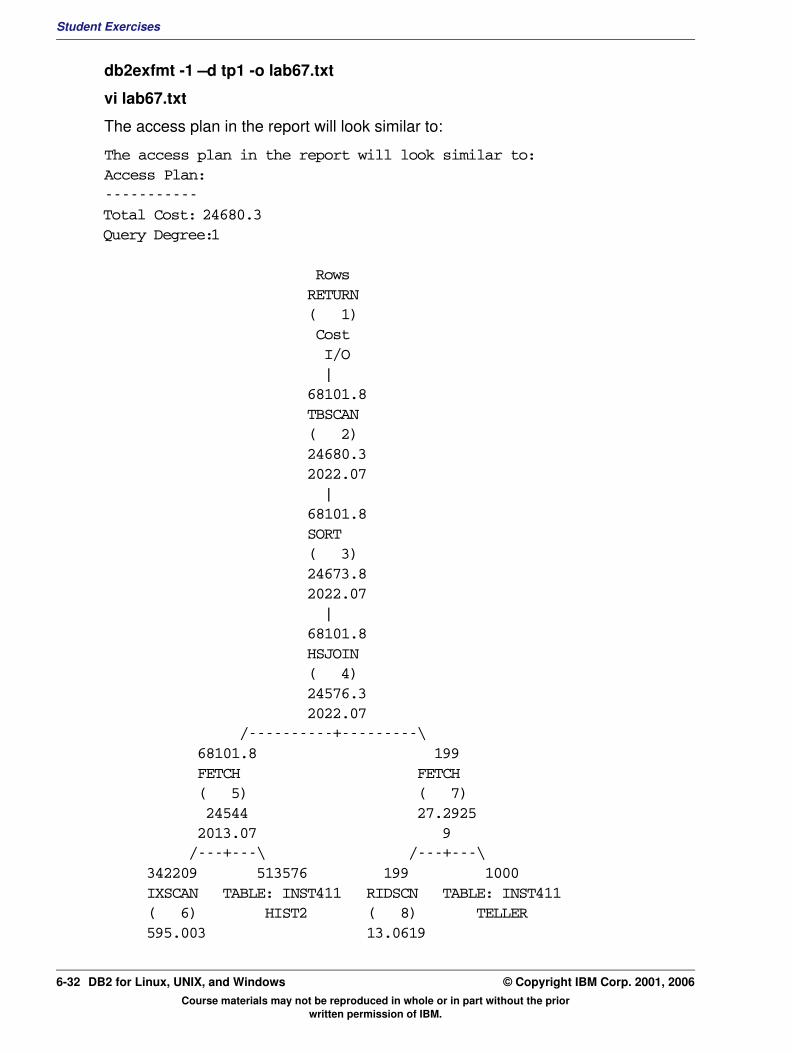
Student Exercises
db2exfmt -1 –d tp1 -o lab67.txt
vi lab67.txt
The access plan in the report will look similar to:
The access plan in the report will look similar to: Access Plan:-----------Total Cost: 24680.3Query Degree:1
Rows RETURN ( 1) Cost I/O | 68101.8 TBSCAN ( 2) 24680.3 2022.07 | 68101.8 SORT ( 3) 24673.8 2022.07 | 68101.8 HSJOIN ( 4) 24576.3 2022.07 /----------+---------\ 68101.8 199 FETCH FETCH ( 5) ( 7) 24544 27.2925 2013.07 9 /---+---\ /---+---\ 342209 513576 199 1000 IXSCAN TABLE: INST411 RIDSCN TABLE: INST411 ( 6) HIST2 ( 8) TELLER 595.003 13.0619
Course materials may not be reproduced in whole or in part without the prior written permission of IBM.
6-32 DB2 for Linux, UNIX, and Windows © Copyright IBM Corp. 2001, 2006
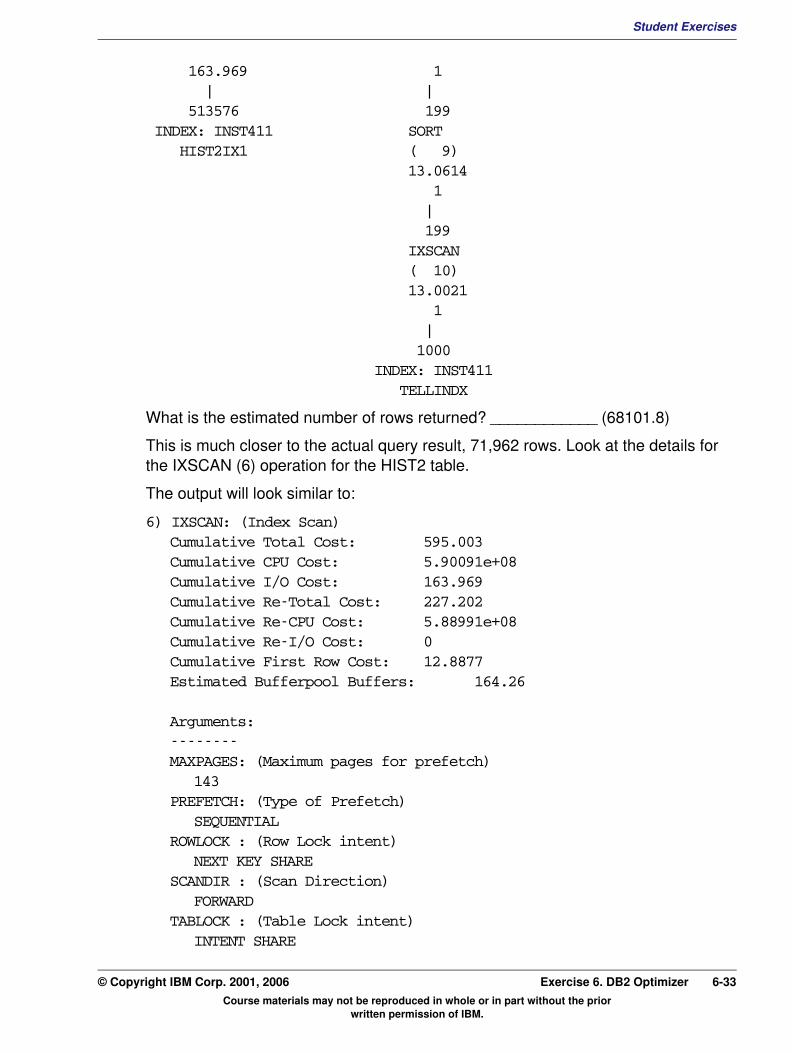
Student ExercisesV3.1.0.1
EXempty
163.969 1 | | 513576 199 INDEX: INST411 SORT HIST2IX1 ( 9) 13.0614 1 | 199 IXSCAN ( 10) 13.0021 1 | 1000 INDEX: INST411 TELLINDXWhat is the estimated number of rows returned? ____________ (68101.8)
This is much closer to the actual query result, 71,962 rows. Look at the details for the IXSCAN (6) operation for the HIST2 table.
The output will look similar to:
6) IXSCAN: (Index Scan)Cumulative Total Cost: 595.003Cumulative CPU Cost: 5.90091e+08Cumulative I/O Cost: 163.969Cumulative Re-Total Cost: 227.202Cumulative Re-CPU Cost: 5.88991e+08Cumulative Re-I/O Cost: 0Cumulative First Row Cost: 12.8877Estimated Bufferpool Buffers: 164.26
Arguments:--------MAXPAGES: (Maximum pages for prefetch)
143PREFETCH: (Type of Prefetch)
SEQUENTIALROWLOCK : (Row Lock intent)
NEXT KEY SHARESCANDIR : (Scan Direction)
FORWARDTABLOCK : (Table Lock intent)
INTENT SHARE
Course materials may not be reproduced in whole or in part without the prior written permission of IBM.
© Copyright IBM Corp. 2001, 2006 Exercise 6. DB2 Optimizer 6-33
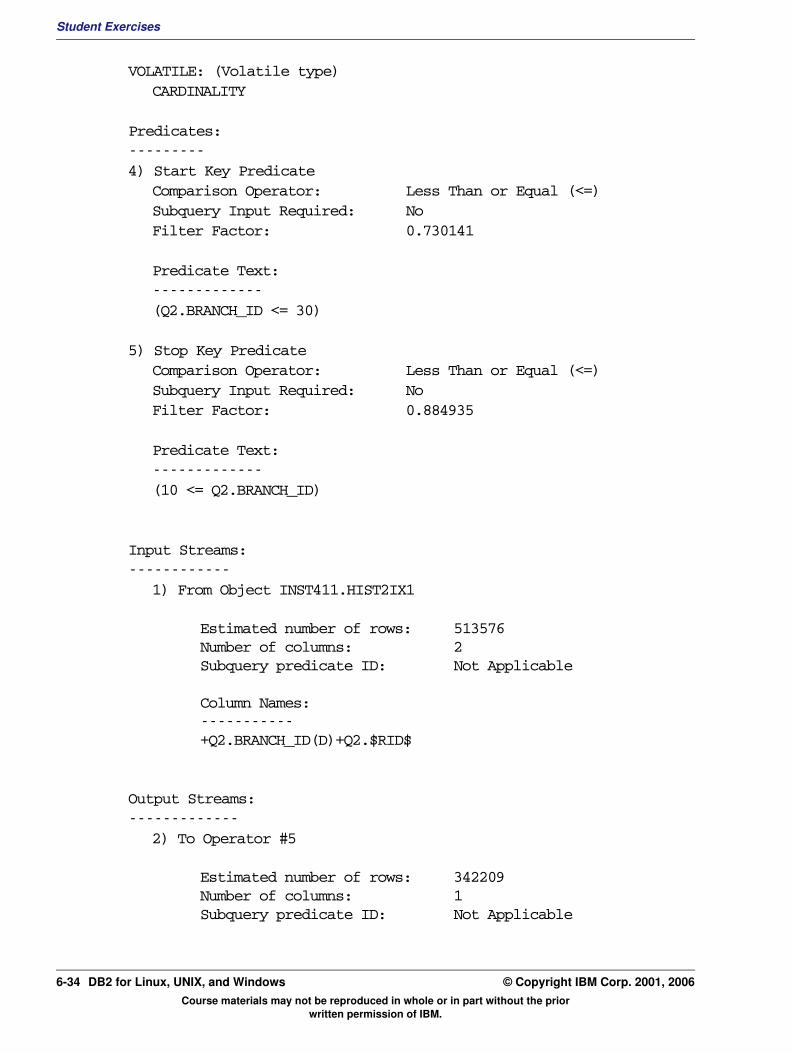
Student Exercises
VOLATILE: (Volatile type)CARDINALITY
Predicates:---------4) Start Key Predicate
Comparison Operator: Less Than or Equal (<=)Subquery Input Required: NoFilter Factor: 0.730141
Predicate Text:-------------(Q2.BRANCH_ID <= 30)
5) Stop Key PredicateComparison Operator: Less Than or Equal (<=)Subquery Input Required: NoFilter Factor: 0.884935
Predicate Text:-------------(10 <= Q2.BRANCH_ID)
Input Streams:------------
1) From Object INST411.HIST2IX1
Estimated number of rows: 513576Number of columns: 2Subquery predicate ID: Not Applicable
Column Names:-----------+Q2.BRANCH_ID(D)+Q2.$RID$
Output Streams:-------------
2) To Operator #5
Estimated number of rows: 342209Number of columns: 1Subquery predicate ID: Not Applicable
Course materials may not be reproduced in whole or in part without the prior written permission of IBM.
6-34 DB2 for Linux, UNIX, and Windows © Copyright IBM Corp. 2001, 2006

Student ExercisesV3.1.0.1
EXempty
Column Names:-----------+Q2.BRANCH_ID(D)The Input Streams are the table HIST2, which has 513576 rows, and the result of the index scan, which is expected to have 342209 row pointers. With distribution statistics on the branch_id column, the optimizer now estimates that about 66% of the HIST2 rows will be returned by the index scan.
In this example the generated access plans had the same operations for both sets of statistics. In many cases the access plan would be different when the cardinality changes significantly. For example, if the index on the HIST2 table had a lower cluster ratio, the optimizer might have selected a table scan for a larger expected result.
__ 4. Close all the applications now and deactivate the TP1 database.
In the terminal session, issue the commands:
db2 terminate
db2 force application all db2 deactivate db tp1
END OF EXERCISE
Course materials may not be reproduced in whole or in part without the prior written permission of IBM.
© Copyright IBM Corp. 2001, 2006 Exercise 6. DB2 Optimizer 6-35

Student Exercises
Course materials may not be reproduced in whole or in part without the prior written permission of IBM.
6-36 DB2 for Linux, UNIX, and Windows © Copyright IBM Corp. 2001, 2006
Student ExercisesV3.1.0.1
EXempty
Exercise 7. Using Indexes for PerformanceWhat This Exercise Is About
This exercise is an online lab which allows the student to analyze the performance impact of indexes to improve the efficiency of processing SQL statements.
What You Should Be Able to Do
At the end of the lab, you should be able to:
• Use the DB2 design advisor command, db2advis to recommend new indexes for a defined SQL workload.
• Implement new indexes to reduce query processing costs.
• Use the explain tools db2exfmt and db2expln to review access plans that contain dynamic bitmap index anding operations.
• Examine a db2expln report for a query that uses multiple indexes for an OR clause.
Course materials may not be reproduced in whole or in part without the prior written permission of IBM.
© Copyright IBM Corp. 2001, 2006 Exercise 7. Using Indexes for Performance 7-1
Student Exercises
Exercise Instructions
Introduction
In this exercise, you will be using the DB2 design Advisor, in command mode, to evaluate new indexes to reduce processing costs for a set of SQL queries. A new index will be implemented for the HISTORY table, based on the TELLER_ID column.
Two SQL queries will be explained. One contains predicates for the BRANCH_ID and TELLER_ID with an AND condition. The other SQL query contains an OR condition for two predicates. The explain tools will be used to examine access plans that combine multiple indexes on a single table to reduce query processing costs.
Course materials may not be reproduced in whole or in part without the prior written permission of IBM.
7-2 DB2 for Linux, UNIX, and Windows © Copyright IBM Corp. 2001, 2006

Student ExercisesV3.1.0.1
EXempty
Section 1 – Use the DB2 Design Advisor to recommend Indexes for an application workload.__ 1. A new application is being developed that will require efficient access to selected HISTORY table transactions. The HISTORY table will grow much larger over time, so indexes need to be created to avoid scanning the entire table for these applications. Examples of the SQL queries are in a file named advisesql.txt. Use the UNIX vi editor to look at the SQL text.
In the terminal session, issue the command:
vi advisesql.txt
--SELECT BRANCH_ID, TELLER_ID, ACCT_ID, BALANCE, ACCTNAME FROM HISTORY WHERE BRANCH_ID = 50 ORDER BY TELLER_ID ASC ;--SELECT * FROM HISTORY WHERE BRANCH_ID = 50 ORDER BY TELLER_ID ASC ;--SELECT * FROM HISTORY WHERE BRANCH_ID = 10 and teller_id = 200 ;
SELECT BRANCH_ID, TELLER_ID, ACCT_ID, BALANCE, ACCTNAME FROM HISTORY WHERE TELLER_ID BETWEEN 100 AND 300 ORDER BY TELLER_ID ASC ;
SELECT BRANCH_ID, TELLER_ID, ACCT_ID, BALANCE, ACCTNAMEFROM HISTORY WHERE BRANCH_ID < 20 AND TELLER_ID BETWEEN 700 AND 800 ;
The SQL statements are selecting data from the HISTORY table for specific BRANCH_ID and TELLER_ID values and ranges.
__ 2. Use the DB2ADVIS command to analyze the SQL statements in the file advisesql.txt.
In the terminal session, issue the commands:
db2 connect to tp1
Run the db2advis application and save the output to a file.
db2advis -d tp1 -i advisesql.txt -o newindex.ddl > adviseout.txt
vi adviseout.txt
Review the Index Advisor output.
The output will look similar to the following:
execution started at timestamp 2006-11-22-08.30.27.227664found [5] SQL statements from the input fileRecommending indexes...
Course materials may not be reproduced in whole or in part without the prior written permission of IBM.
© Copyright IBM Corp. 2001, 2006 Exercise 7. Using Indexes for Performance 7-3

Student Exercises
total disk space needed for initial set [ 14.004] MBtotal disk space constrained to [ 29.105] MBTrying variations of the solution set.Optimization finished. 4 indexes in current solution [4819.0000] timerons (without recommendations) [2969.0000] timerons (with current solution) [38.39%] improvement
------ LIST OF RECOMMENDED INDEXES-- ===========================-- index[1], 2.688MB CREATE INDEX "INST411 "."IDX611221330330000" ON "INST411 "."HISTORY" ("BRANCH_ID" ASC, "TELLER_ID" ASC, "ACCTNAME" ASC, "BALANCE" ASC, "ACCT_ID" ASC) ALLOW REVERSE SCANS ; COMMIT WORK ; RUNSTATS ON TABLE "INST411 "."HISTORY" FOR INDEX "INST411 "."IDX611221330330000" ; COMMIT WORK ;-- index[2], 4.314MB CREATE INDEX "INST411 "."IDX611221331200000" ON "INST411 "."HISTORY" ("BRANCH_ID" ASC, "TELLER_ID" ASC, "TEMP" ASC, "ACCTNAME" ASC, "TSTMP" ASC, "PID" ASC, "DELTA" ASC, "BALANCE" ASC, "ACCT_ID" ASC) ALLOW REVERSE SCANS ; COMMIT WORK ; RUNSTATS ON TABLE "INST411 "."HISTORY" FOR INDEX "INST411 "."IDX611221331200000" ; COMMIT WORK ;-- index[3], 4.314MB CREATE INDEX "INST411 "."IDX611221332570000" ON "INST411 "."HISTORY" ("TELLER_ID" ASC, "BRANCH_ID" ASC, "TEMP" ASC, "ACCTNAME" ASC, "TSTMP" ASC, "PID" ASC, "DELTA" ASC, "BALANCE" ASC, "ACCT_ID" ASC) ALLOW REVERSE SCANS ; COMMIT WORK ; RUNSTATS ON TABLE "INST411 "."HISTORY" FOR INDEX "INST411 "."IDX611221332570000" ; COMMIT WORK ;-- index[4], 2.688MB
Course materials may not be reproduced in whole or in part without the prior written permission of IBM.
7-4 DB2 for Linux, UNIX, and Windows © Copyright IBM Corp. 2001, 2006
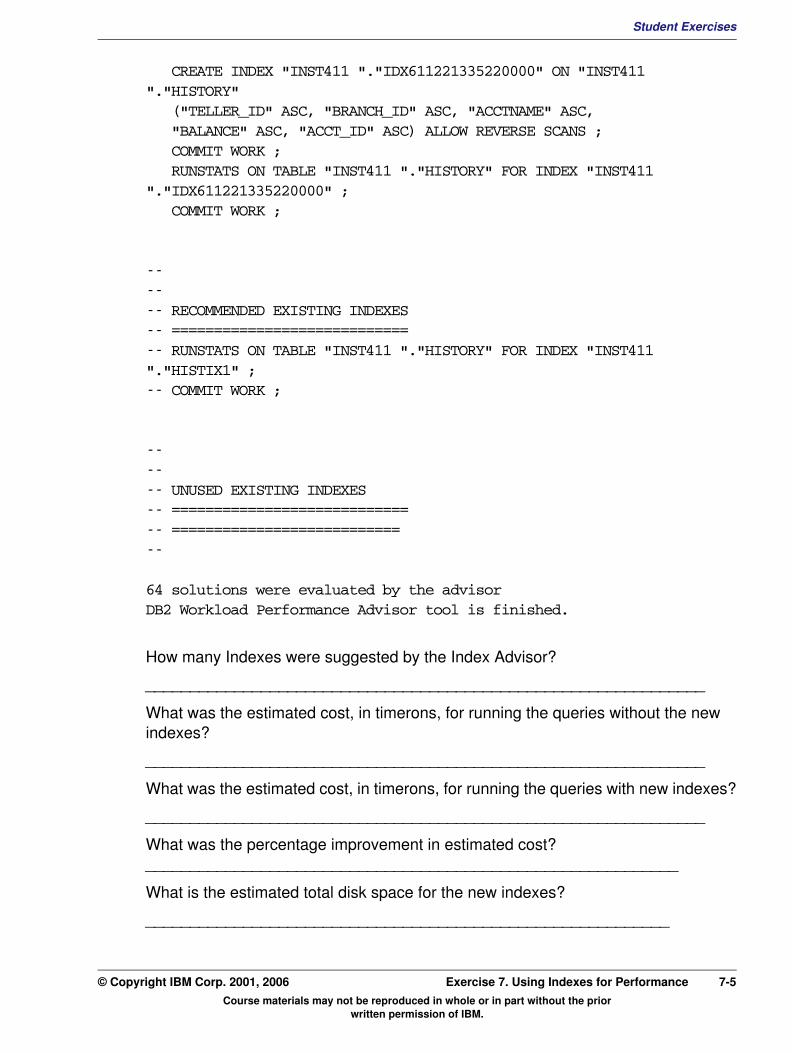
Student ExercisesV3.1.0.1
EXempty
CREATE INDEX "INST411 "."IDX611221335220000" ON "INST411 "."HISTORY" ("TELLER_ID" ASC, "BRANCH_ID" ASC, "ACCTNAME" ASC, "BALANCE" ASC, "ACCT_ID" ASC) ALLOW REVERSE SCANS ; COMMIT WORK ; RUNSTATS ON TABLE "INST411 "."HISTORY" FOR INDEX "INST411 "."IDX611221335220000" ; COMMIT WORK ;------ RECOMMENDED EXISTING INDEXES-- ============================-- RUNSTATS ON TABLE "INST411 "."HISTORY" FOR INDEX "INST411 "."HISTIX1" ;-- COMMIT WORK ;
------ UNUSED EXISTING INDEXES-- ============================-- ===========================--
64 solutions were evaluated by the advisorDB2 Workload Performance Advisor tool is finished.
How many Indexes were suggested by the Index Advisor?
_______________________________________________________________
What was the estimated cost, in timerons, for running the queries without the new indexes?
_______________________________________________________________
What was the estimated cost, in timerons, for running the queries with new indexes?
_______________________________________________________________
What was the percentage improvement in estimated cost? ____________________________________________________________
What is the estimated total disk space for the new indexes?
___________________________________________________________
Course materials may not be reproduced in whole or in part without the prior written permission of IBM.
© Copyright IBM Corp. 2001, 2006 Exercise 7. Using Indexes for Performance 7-5
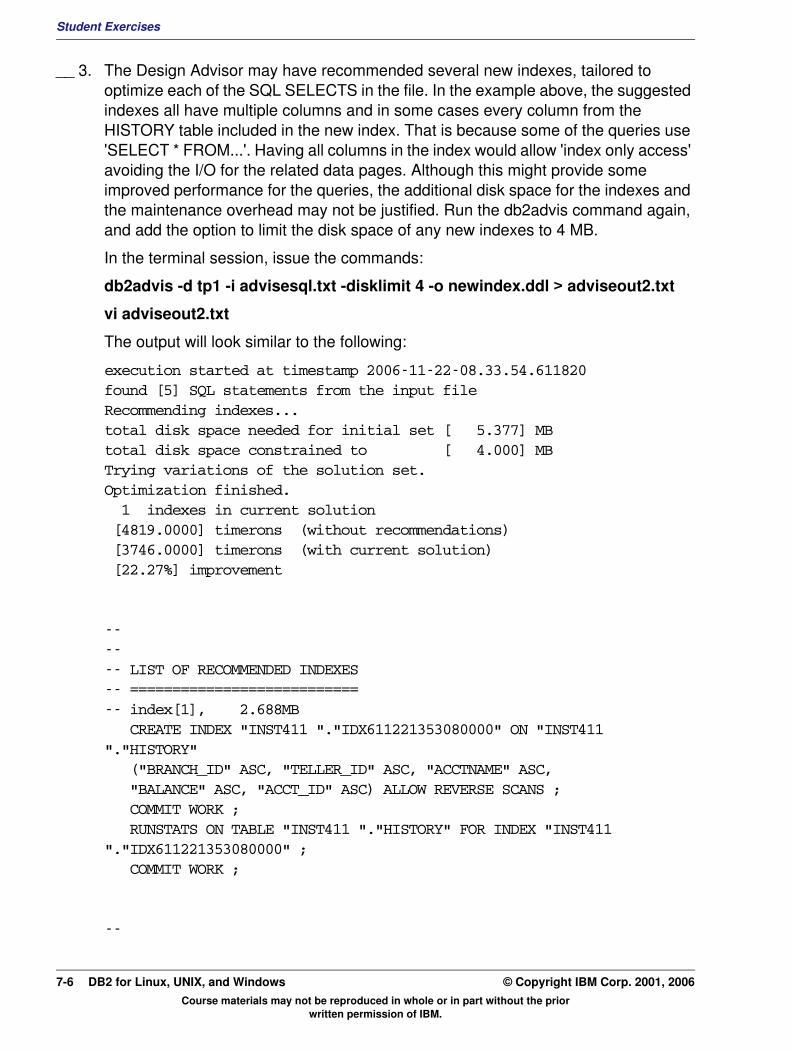
Student Exercises
__ 3. The Design Advisor may have recommended several new indexes, tailored to optimize each of the SQL SELECTS in the file. In the example above, the suggested indexes all have multiple columns and in some cases every column from the HISTORY table included in the new index. That is because some of the queries use 'SELECT * FROM...'. Having all columns in the index would allow 'index only access' avoiding the I/O for the related data pages. Although this might provide some improved performance for the queries, the additional disk space for the indexes and the maintenance overhead may not be justified. Run the db2advis command again, and add the option to limit the disk space of any new indexes to 4 MB.
In the terminal session, issue the commands:
db2advis -d tp1 -i advisesql.txt -disklimit 4 -o newindex.ddl > adviseout2.txt
vi adviseout2.txt
The output will look similar to the following:
execution started at timestamp 2006-11-22-08.33.54.611820found [5] SQL statements from the input fileRecommending indexes...total disk space needed for initial set [ 5.377] MBtotal disk space constrained to [ 4.000] MBTrying variations of the solution set.Optimization finished. 1 indexes in current solution [4819.0000] timerons (without recommendations) [3746.0000] timerons (with current solution) [22.27%] improvement
------ LIST OF RECOMMENDED INDEXES-- ===========================-- index[1], 2.688MB CREATE INDEX "INST411 "."IDX611221353080000" ON "INST411 "."HISTORY" ("BRANCH_ID" ASC, "TELLER_ID" ASC, "ACCTNAME" ASC, "BALANCE" ASC, "ACCT_ID" ASC) ALLOW REVERSE SCANS ; COMMIT WORK ; RUNSTATS ON TABLE "INST411 "."HISTORY" FOR INDEX "INST411 "."IDX611221353080000" ; COMMIT WORK ;
--
Course materials may not be reproduced in whole or in part without the prior written permission of IBM.
7-6 DB2 for Linux, UNIX, and Windows © Copyright IBM Corp. 2001, 2006

Student ExercisesV3.1.0.1
EXempty
---- RECOMMENDED EXISTING INDEXES-- ============================-- RUNSTATS ON TABLE "INST411 "."HISTORY" FOR INDEX "INST411 "."HISTIX1" ;-- COMMIT WORK ;------ UNUSED EXISTING INDEXES-- ============================-- ===========================--
64 solutions were evaluated by the advisorDB2 Workload Performance Advisor tool is finished.
How many Indexes were suggested by the Index Advisor?
_______________________________________________________________
What was the estimated cost, in timerons, for running the queries without indexes additional indexes?
_______________________________________________________________
What was the estimated cost, in timerons, for running the queries with new indexes?
_______________________________________________________________
What was the percentage improvement in estimated cost?
_______________________________________________________________
What is the estimated total disk space for the new index?
_______________________________________________________________
The new index suggested this time would have the columns Branch_ID and Teller_ID and some additional columns. Four of the five queries include predicates based on the Branch_ID column. There is already a single column index on the Branch_ID column.
To add a new index with the smallest amount of overhead to processing the inserts into the HISTORY table, a new index with the TELLER_ID column will be added. Run the DB2 command file, crhistix2.ddl, to create the new index. The index statistics will be collected during index creation to avoid the need to run a RUNSTATS command.
Course materials may not be reproduced in whole or in part without the prior written permission of IBM.
© Copyright IBM Corp. 2001, 2006 Exercise 7. Using Indexes for Performance 7-7
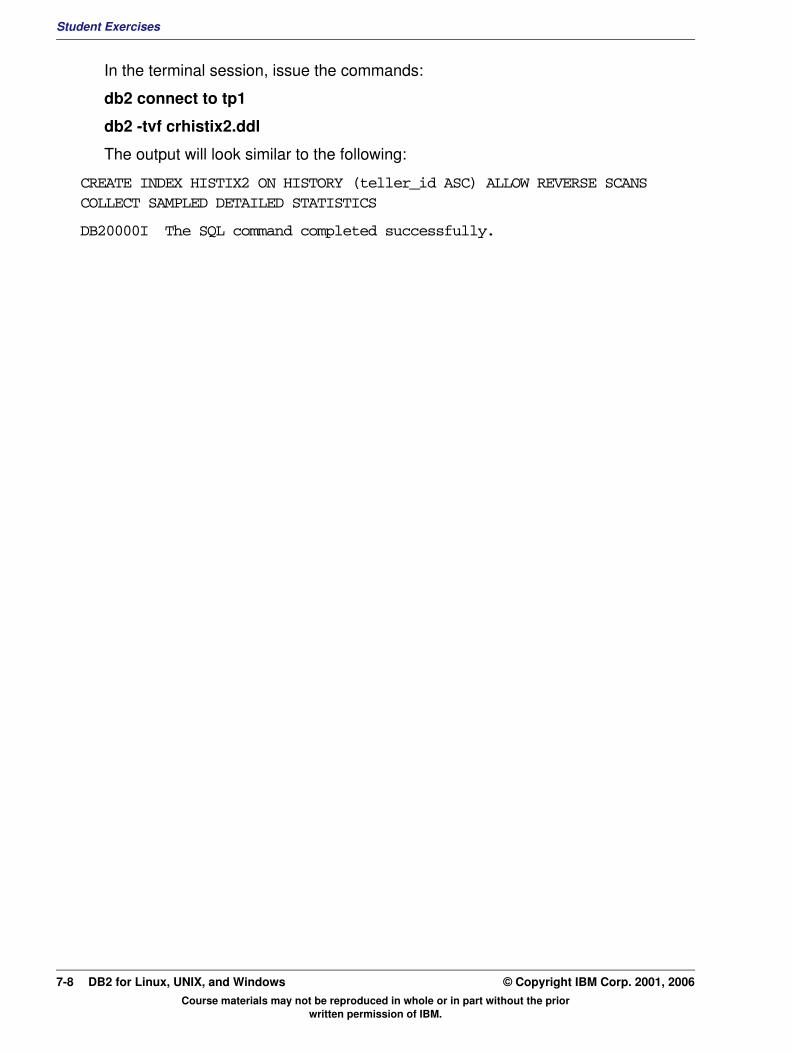
Student Exercises
In the terminal session, issue the commands:
db2 connect to tp1
db2 -tvf crhistix2.ddl
The output will look similar to the following:
CREATE INDEX HISTIX2 ON HISTORY (teller_id ASC) ALLOW REVERSE SCANS COLLECT SAMPLED DETAILED STATISTICS
DB20000I The SQL command completed successfully.
Course materials may not be reproduced in whole or in part without the prior written permission of IBM.
7-8 DB2 for Linux, UNIX, and Windows © Copyright IBM Corp. 2001, 2006
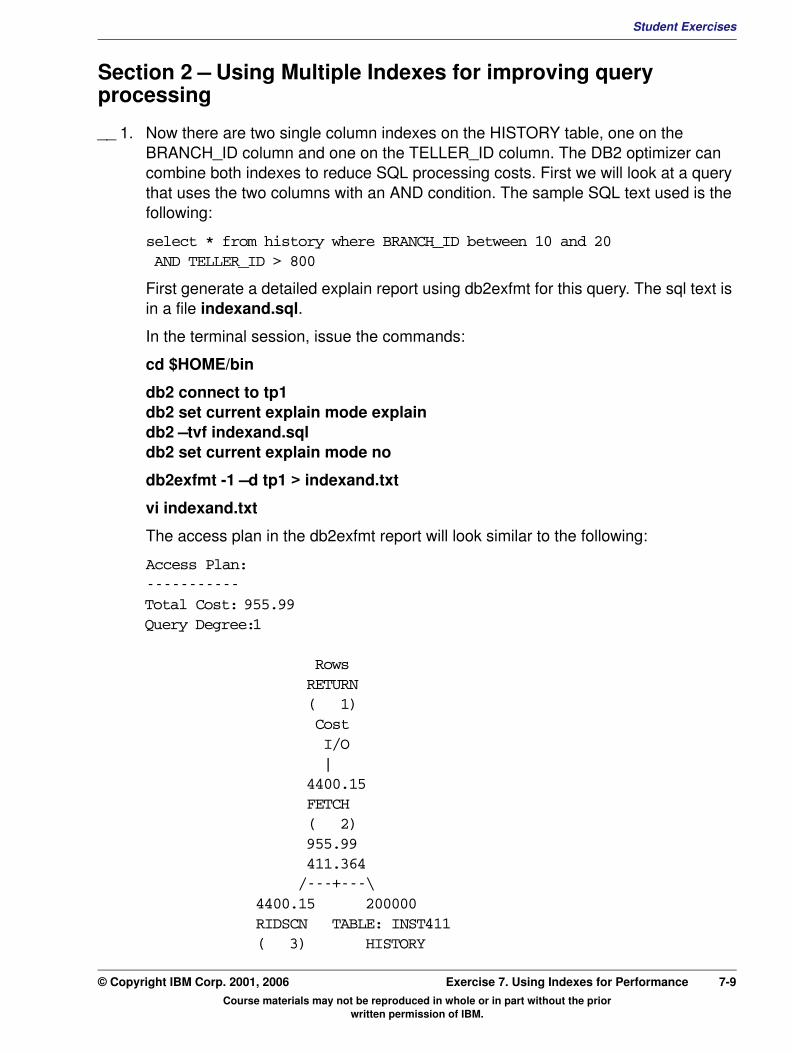
Student ExercisesV3.1.0.1
EXempty
Section 2 – Using Multiple Indexes for improving query processing__ 1. Now there are two single column indexes on the HISTORY table, one on the BRANCH_ID column and one on the TELLER_ID column. The DB2 optimizer can combine both indexes to reduce SQL processing costs. First we will look at a query that uses the two columns with an AND condition. The sample SQL text used is the following:
select * from history where BRANCH_ID between 10 and 20 AND TELLER_ID > 800
First generate a detailed explain report using db2exfmt for this query. The sql text is in a file indexand.sql.
In the terminal session, issue the commands:
cd $HOME/bin
db2 connect to tp1db2 set current explain mode explain db2 –tvf indexand.sql db2 set current explain mode no
db2exfmt -1 –d tp1 > indexand.txt
vi indexand.txt
The access plan in the db2exfmt report will look similar to the following:
Access Plan:-----------Total Cost: 955.99Query Degree:1
Rows RETURN ( 1) Cost I/O | 4400.15 FETCH ( 2) 955.99 411.364 /---+---\ 4400.15 200000 RIDSCN TABLE: INST411 ( 3) HISTORY
Course materials may not be reproduced in whole or in part without the prior written permission of IBM.
© Copyright IBM Corp. 2001, 2006 Exercise 7. Using Indexes for Performance 7-9
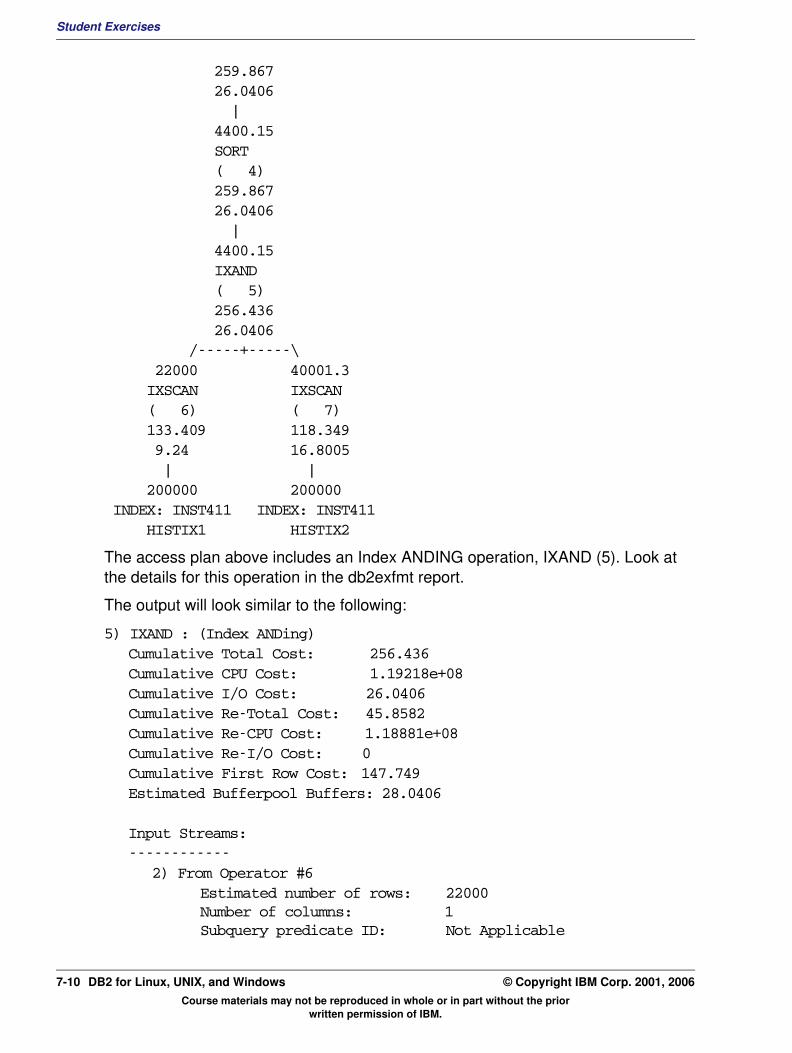
Student Exercises
259.867 26.0406 | 4400.15 SORT ( 4) 259.867 26.0406 | 4400.15 IXAND ( 5) 256.436 26.0406 /-----+-----\ 22000 40001.3 IXSCAN IXSCAN ( 6) ( 7) 133.409 118.349 9.24 16.8005 | | 200000 200000 INDEX: INST411 INDEX: INST411 HISTIX1 HISTIX2
The access plan above includes an Index ANDING operation, IXAND (5). Look at the details for this operation in the db2exfmt report.
The output will look similar to the following:
5) IXAND : (Index ANDing)Cumulative Total Cost: 256.436Cumulative CPU Cost: 1.19218e+08Cumulative I/O Cost: 26.0406Cumulative Re-Total Cost: 45.8582Cumulative Re-CPU Cost: 1.18881e+08Cumulative Re-I/O Cost: 0Cumulative First Row Cost: 147.749Estimated Bufferpool Buffers: 28.0406
Input Streams:------------
2) From Operator #6Estimated number of rows: 22000Number of columns: 1Subquery predicate ID: Not Applicable
Course materials may not be reproduced in whole or in part without the prior written permission of IBM.
7-10 DB2 for Linux, UNIX, and Windows © Copyright IBM Corp. 2001, 2006

Student ExercisesV3.1.0.1
EXempty
Column Names:-----------+Q1.BRANCH_ID(A)4) From Operator #7Estimated number of rows: 40001.3Number of columns: 1Subquery predicate ID: Not Applicable
Column Names:-----------+Q1.TELLER_ID(A)
Output Streams:-------------
5) To Operator #4Estimated number of rows: 4400.15Number of columns: 2Subquery predicate ID: Not Applicable
Column Names:-----------+Q1.TELLER_ID(A)+Q1.$RID$
The Input Streams, shows that the two index scans are being used as input to the index anding operation. This is the ‘Dynamic Bitmap Index Anding' operation that uses sortheap memory to compare lists of RIDs from multiple index scans.
In this example the index scan from the index on TELLER_ID is estimated to generate 40001.3 rows. The index scan from the BRANCH_ID index is estimated to generate 22000 rows. So either index alone would require access to a large portion of the HISTORY table.
The Output Streams section for this operation shows that an estimated 4400.15 rows would be expected to match both index lists. That should reduce the number of pages in the HISTORY table that need to be accessed. A list prefetch operation will be used to efficiently retrieve the list of pages that contain the rows resulting from the index anding function.
Next we will look at the information about this same SQL statement in the shorter report generated by the db2expln tool.
__ 2. Use the db2expln tool to generate a simple access plan report for the same query, in the file indexand.sql.
In the terminal session, issue the command:
db2expln –d tp1 –f indexand.sql –g –I –z \; -o indexand2.txt
The output will look similar to the following:
Course materials may not be reproduced in whole or in part without the prior written permission of IBM.
© Copyright IBM Corp. 2001, 2006 Exercise 7. Using Indexes for Performance 7-11

Student Exercises
Isolation Level = Cursor StabilityBlocking = Block Unambiguous CursorsQuery Optimization Class = 5
Partition Parallel = NoIntra-Partition Parallel = No
SQL Path = "SYSIBM", "SYSFUN", "SYSPROC", "SYSIBMADM",
"INST411"
Statement: select * from history where branch_id between 10 and 20 and teller_id > 800
Section Code Page = 1208
Estimated Cost = 955.989746Estimated Cardinality = 4400.145020
Index ANDing| Optimizer Estimate of Set Size: 4400| Index ANDing Bitmap Build Using Row IDs| | Access Table Name = INST411.HISTORY ID = 4,4| | | Index Scan: Name = INST411.HISTIX1 ID = 1| | | | Regular Index (Not Clustered)| | | | Index Columns:| | | | | 1: BRANCH_ID (Ascending)| | | #Columns = 0| | | #Key Columns = 1| | | | Start Key: Inclusive Value| | | | | | 1: 10| | | | Stop Key: Inclusive Value| | | | | | 1: 20| | | Index-Only Access| | | Index Prefetch: None| | | Isolation Level: (null)| | | Lock Intents| | | | Table: Intent None| | | | Row : None
Course materials may not be reproduced in whole or in part without the prior written permission of IBM.
7-12 DB2 for Linux, UNIX, and Windows © Copyright IBM Corp. 2001, 2006
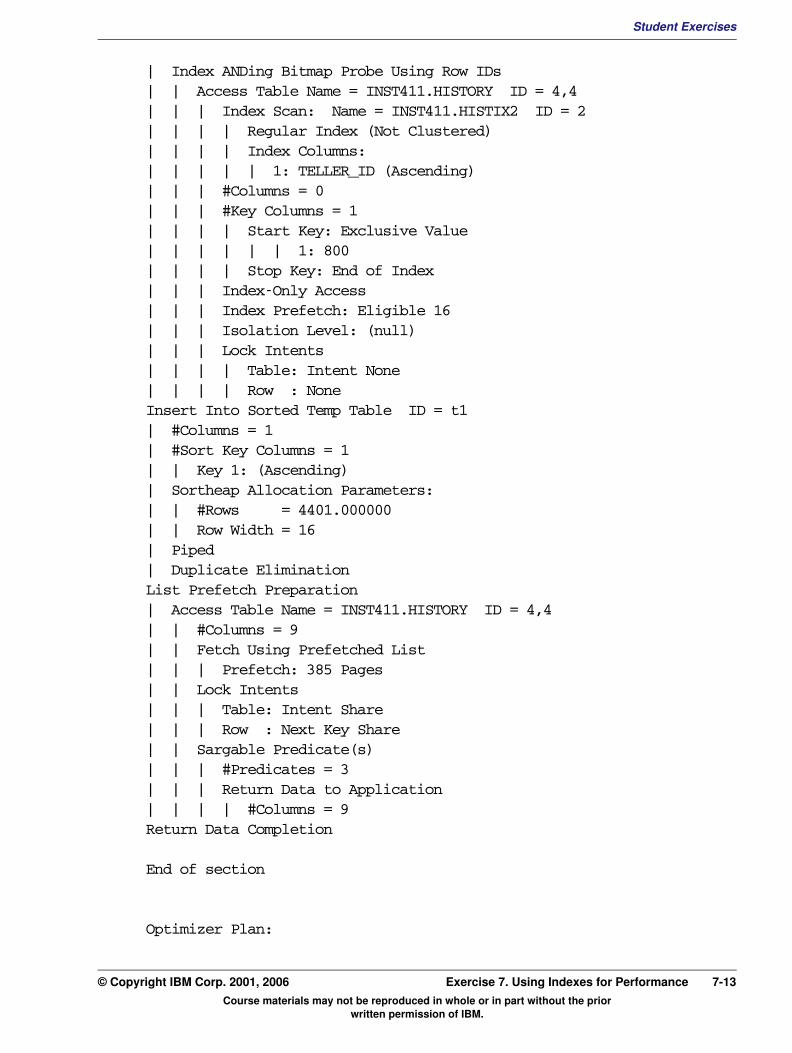
Student ExercisesV3.1.0.1
EXempty
| Index ANDing Bitmap Probe Using Row IDs| | Access Table Name = INST411.HISTORY ID = 4,4| | | Index Scan: Name = INST411.HISTIX2 ID = 2| | | | Regular Index (Not Clustered)| | | | Index Columns:| | | | | 1: TELLER_ID (Ascending)| | | #Columns = 0| | | #Key Columns = 1| | | | Start Key: Exclusive Value| | | | | | 1: 800| | | | Stop Key: End of Index| | | Index-Only Access| | | Index Prefetch: Eligible 16| | | Isolation Level: (null)| | | Lock Intents| | | | Table: Intent None| | | | Row : NoneInsert Into Sorted Temp Table ID = t1| #Columns = 1| #Sort Key Columns = 1| | Key 1: (Ascending)| Sortheap Allocation Parameters:| | #Rows = 4401.000000| | Row Width = 16| Piped| Duplicate EliminationList Prefetch Preparation| Access Table Name = INST411.HISTORY ID = 4,4| | #Columns = 9| | Fetch Using Prefetched List| | | Prefetch: 385 Pages| | Lock Intents| | | Table: Intent Share| | | Row : Next Key Share| | Sargable Predicate(s)| | | #Predicates = 3| | | Return Data to Application| | | | #Columns = 9Return Data CompletionEnd of section
Optimizer Plan:
Course materials may not be reproduced in whole or in part without the prior written permission of IBM.
© Copyright IBM Corp. 2001, 2006 Exercise 7. Using Indexes for Performance 7-13
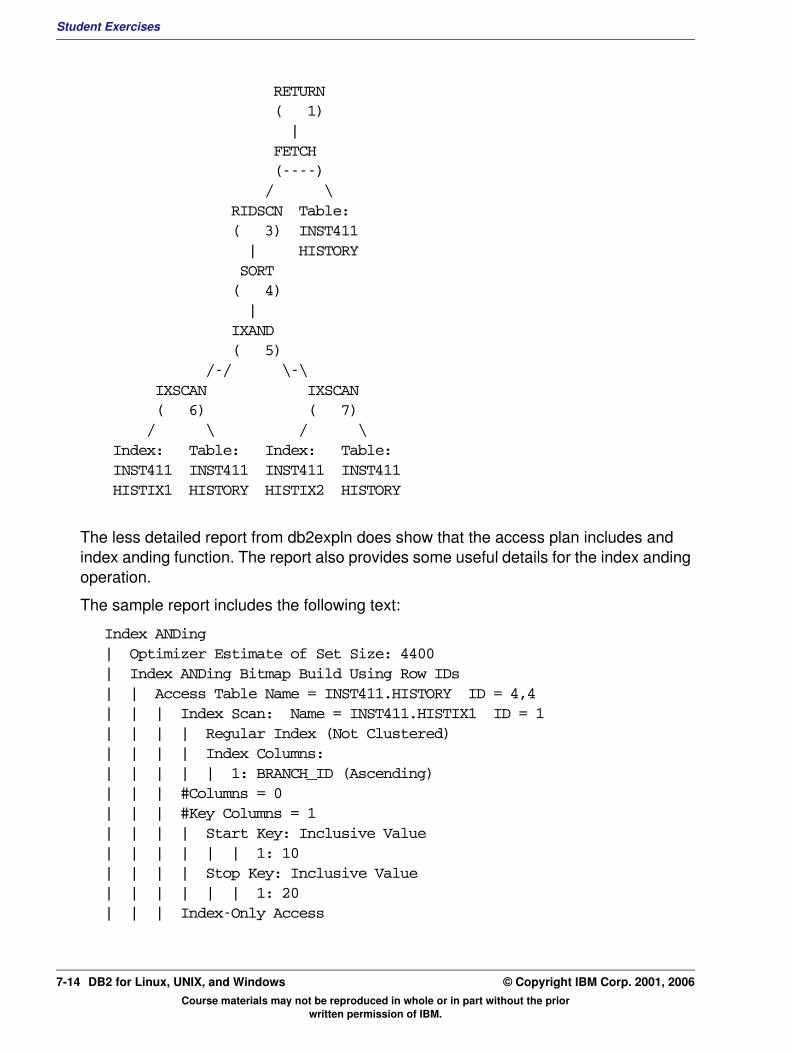
Student Exercises
RETURN ( 1) | FETCH (----) / \ RIDSCN Table: ( 3) INST411 | HISTORY SORT ( 4) | IXAND ( 5) /-/ \-\ IXSCAN IXSCAN ( 6) ( 7) / \ / \ Index: Table: Index: Table: INST411 INST411 INST411 INST411 HISTIX1 HISTORY HISTIX2 HISTORY
The less detailed report from db2expln does show that the access plan includes and index anding function. The report also provides some useful details for the index anding operation.
The sample report includes the following text:
Index ANDing| Optimizer Estimate of Set Size: 4400| Index ANDing Bitmap Build Using Row IDs| | Access Table Name = INST411.HISTORY ID = 4,4| | | Index Scan: Name = INST411.HISTIX1 ID = 1| | | | Regular Index (Not Clustered)| | | | Index Columns:| | | | | 1: BRANCH_ID (Ascending)| | | #Columns = 0| | | #Key Columns = 1| | | | Start Key: Inclusive Value| | | | | | 1: 10| | | | Stop Key: Inclusive Value| | | | | | 1: 20| | | Index-Only Access
Course materials may not be reproduced in whole or in part without the prior written permission of IBM.
7-14 DB2 for Linux, UNIX, and Windows © Copyright IBM Corp. 2001, 2006

Student ExercisesV3.1.0.1
EXempty
This shows that the index INST411.HISTIX1 will be used to ‘build' the initial bitmap. It also shows that 4400 rows are estimated to result from the index anding operation. It does not show the estimates for each index scan.The other index access is shown as follows:
| Index ANDing Bitmap Probe Using Row IDs| | Access Table Name = INST411.HISTORY ID = 4,4| | | Index Scan: Name = INST411.HISTIX2 ID = 2| | | | Regular Index (Not Clustered)| | | | Index Columns:| | | | | 1: TELLER_ID (Ascending)| | | #Columns = 0| | | #Key Columns = 1| | | | Start Key: Exclusive Value| | | | | | 1: 800| | | | Stop Key: End of Index
This shows that the second index, INST411.HISTIX2 will be used to ‘probe' the bitmap and generate the subset of row ids that match both index lists.
__ 3. Next we will look at a query that uses an OR clause instead of the AND clause for selecting rows from the HISTORY table. The sample SQL text is the following:
select * from history where BRANCH_ID between 10 and 12 OR TELLER_ID =800
Generate a simple explain report using db2expln for this query.
The sql text is in a file indexor.sql.
db2expln –d tp1 –f indexor.sql –g –I –z \; -o indexor.txt
vi indexor.txt
The output will look similar to the following:
DB2 Universal Database Version 9.1, 5622-044 (c) Copyright IBM Corp. 1991, 2006Licensed Material - Program Property of IBMIBM DB2 Universal Database SQL and XQUERY Explain Tool
******************** DYNAMIC ***************************************==================== STATEMENT ==========================================Isolation Level = Cursor StabilityBlocking = Block Unambiguous CursorsQuery Optimization Class = 5Partition Parallel = NoIntra-Partition Parallel = NoSQL Path = "SYSIBM", "SYSFUN", "SYSPROC", "SYSIBMADM",
Course materials may not be reproduced in whole or in part without the prior written permission of IBM.
© Copyright IBM Corp. 2001, 2006 Exercise 7. Using Indexes for Performance 7-15
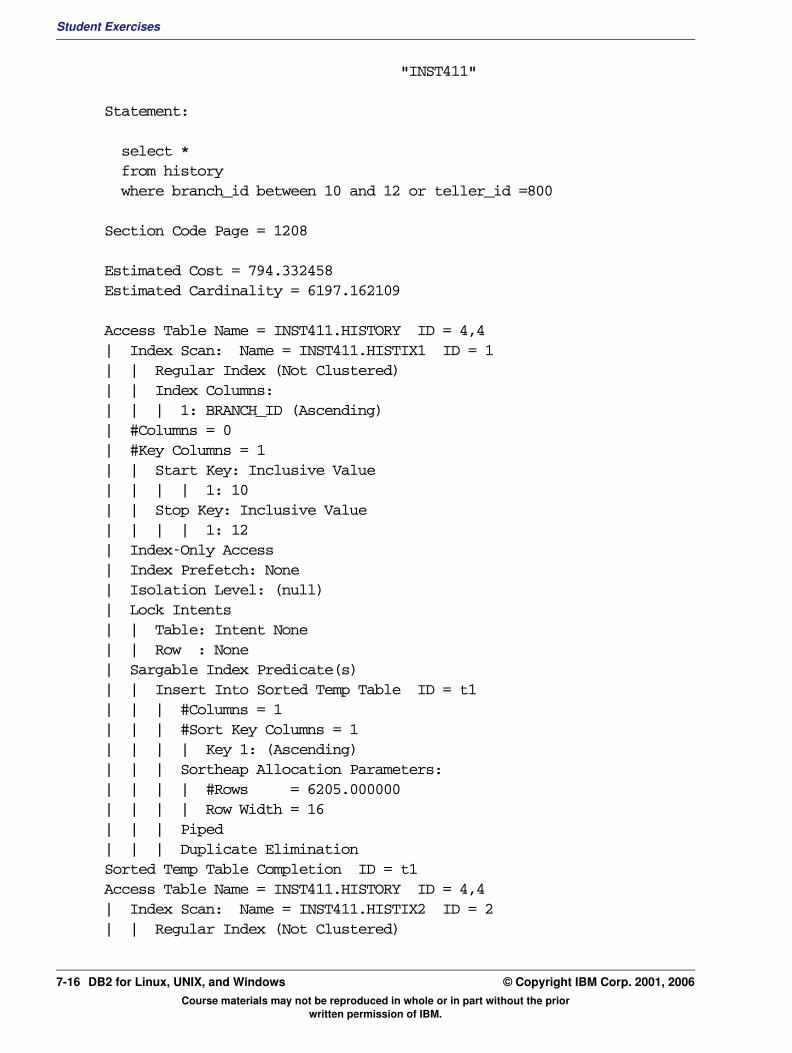
Student Exercises
"INST411"
Statement: select * from history where branch_id between 10 and 12 or teller_id =800
Section Code Page = 1208
Estimated Cost = 794.332458Estimated Cardinality = 6197.162109
Access Table Name = INST411.HISTORY ID = 4,4| Index Scan: Name = INST411.HISTIX1 ID = 1| | Regular Index (Not Clustered)| | Index Columns:| | | 1: BRANCH_ID (Ascending)| #Columns = 0| #Key Columns = 1| | Start Key: Inclusive Value| | | | 1: 10| | Stop Key: Inclusive Value| | | | 1: 12| Index-Only Access| Index Prefetch: None| Isolation Level: (null)| Lock Intents| | Table: Intent None| | Row : None| Sargable Index Predicate(s)| | Insert Into Sorted Temp Table ID = t1| | | #Columns = 1| | | #Sort Key Columns = 1| | | | Key 1: (Ascending)| | | Sortheap Allocation Parameters:| | | | #Rows = 6205.000000| | | | Row Width = 16| | | Piped| | | Duplicate EliminationSorted Temp Table Completion ID = t1Access Table Name = INST411.HISTORY ID = 4,4| Index Scan: Name = INST411.HISTIX2 ID = 2| | Regular Index (Not Clustered)
Course materials may not be reproduced in whole or in part without the prior written permission of IBM.
7-16 DB2 for Linux, UNIX, and Windows © Copyright IBM Corp. 2001, 2006
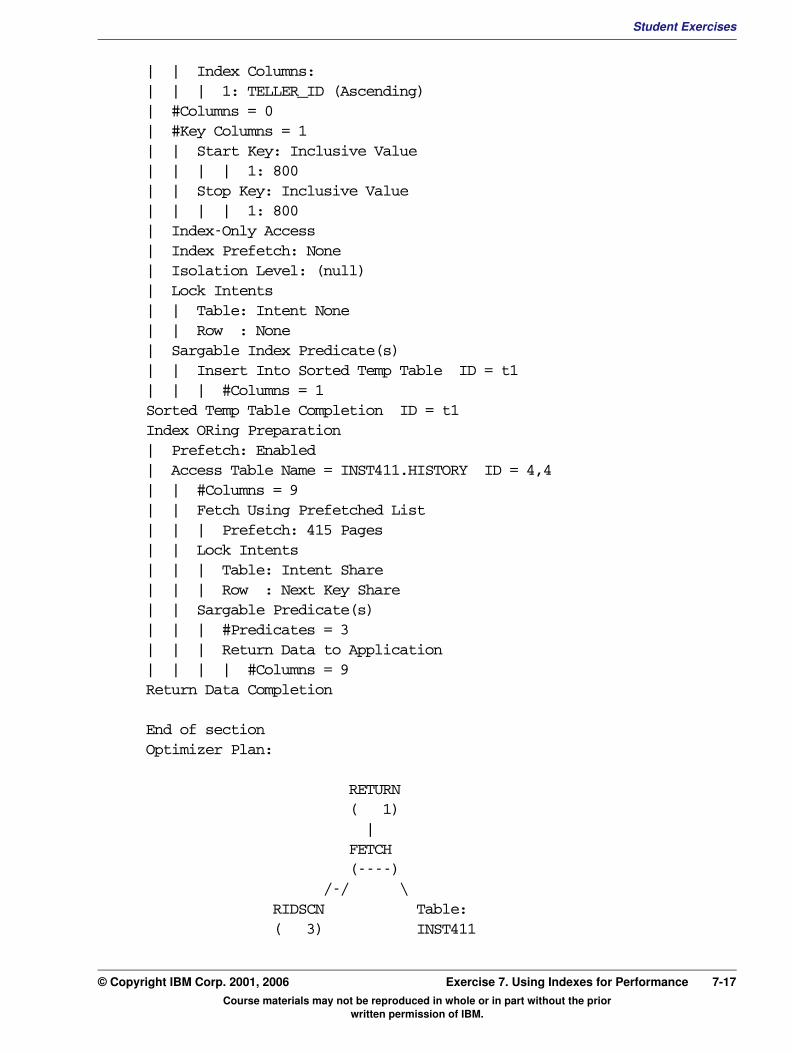
Student ExercisesV3.1.0.1
EXempty
| | Index Columns:| | | 1: TELLER_ID (Ascending)| #Columns = 0| #Key Columns = 1| | Start Key: Inclusive Value| | | | 1: 800| | Stop Key: Inclusive Value| | | | 1: 800| Index-Only Access| Index Prefetch: None| Isolation Level: (null)| Lock Intents| | Table: Intent None| | Row : None| Sargable Index Predicate(s)| | Insert Into Sorted Temp Table ID = t1| | | #Columns = 1Sorted Temp Table Completion ID = t1Index ORing Preparation| Prefetch: Enabled| Access Table Name = INST411.HISTORY ID = 4,4| | #Columns = 9| | Fetch Using Prefetched List| | | Prefetch: 415 Pages| | Lock Intents| | | Table: Intent Share| | | Row : Next Key Share| | Sargable Predicate(s)| | | #Predicates = 3| | | Return Data to Application| | | | #Columns = 9Return Data CompletionEnd of sectionOptimizer Plan:
RETURN ( 1) | FETCH (----) /-/ \ RIDSCN Table: ( 3) INST411
Course materials may not be reproduced in whole or in part without the prior written permission of IBM.
© Copyright IBM Corp. 2001, 2006 Exercise 7. Using Indexes for Performance 7-17
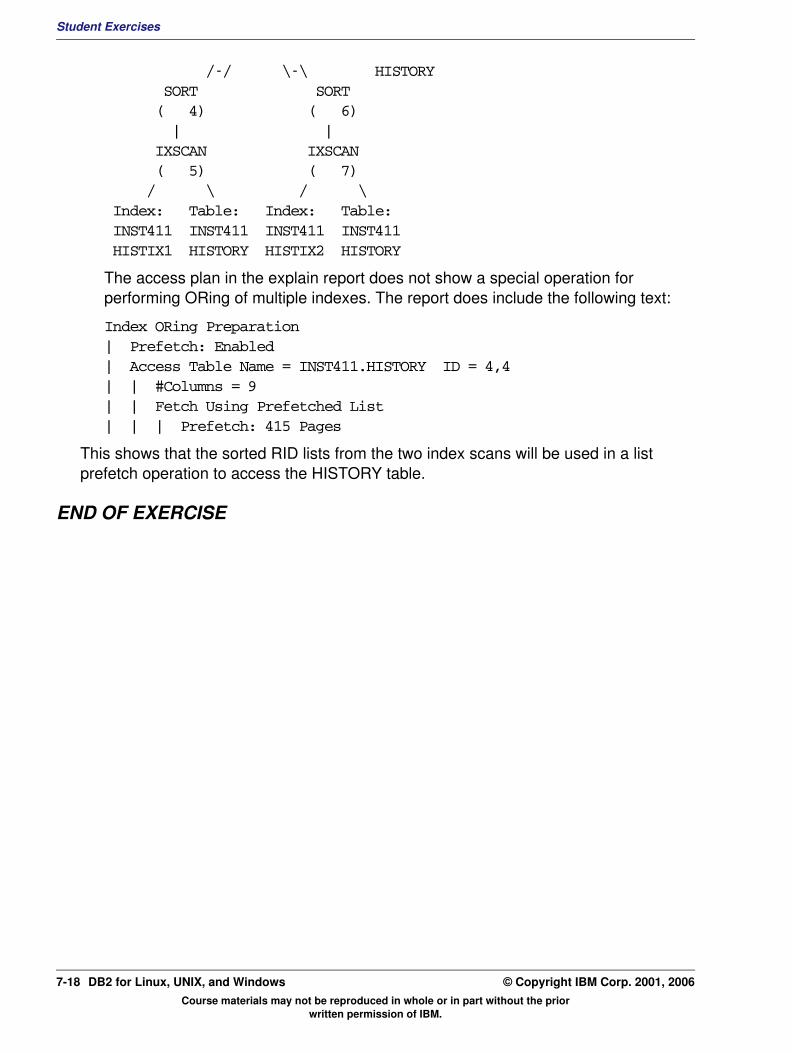
Student Exercises
/-/ \-\ HISTORY SORT SORT ( 4) ( 6) | | IXSCAN IXSCAN ( 5) ( 7) / \ / \ Index: Table: Index: Table: INST411 INST411 INST411 INST411 HISTIX1 HISTORY HISTIX2 HISTORY
The access plan in the explain report does not show a special operation for performing ORing of multiple indexes. The report does include the following text:
Index ORing Preparation| Prefetch: Enabled| Access Table Name = INST411.HISTORY ID = 4,4| | #Columns = 9| | Fetch Using Prefetched List| | | Prefetch: 415 Pages
This shows that the sorted RID lists from the two index scans will be used in a list prefetch operation to access the HISTORY table.
END OF EXERCISE
Course materials may not be reproduced in whole or in part without the prior written permission of IBM.
7-18 DB2 for Linux, UNIX, and Windows © Copyright IBM Corp. 2001, 2006
Student ExercisesV3.1.0.1
EXempty
Exercise 8. Complex SQL PerformanceWhat This Exercise Is About
This exercise is an online lab which allows the student to use the DB2 explain tools to better understand access strategies of the DB2 Optimizer, including using indexes to join tables. A range partitioned table will be created to better understand the use of ‘partition elimination’ for processing queries. A Materialized Query Table (MQT), will be used to improve query performance.
What You Should Be Able to Do
At the end of the lab, you should be able to:
• Use the explain tools to analyze SQL statements that access a range partitioned table and determine if ‘partition elimination’ is being utilized in the access plan.
• Create a Materialized Query Table to reduce the cost of running a SQL query that summarizes information from a large table.
• Create new indexes with INCLUDE columns to improve the performance of a multiple table join query.
Course materials may not be reproduced in whole or in part without the prior written permission of IBM.
© Copyright IBM Corp. 2001, 2006 Exercise 8. Complex SQL Performance 8-1

Student Exercises
Exercise Instructions
Introduction
In this exercise, you will be using the DB2 Explain tools and SNAPSHOT statistics to analyze SQL queries.
A Materialized Query Table or MQT will be created to provide efficient access to summarized information from the ACCT table without scanning the large ACCT table.
A three table join SQL statement will be analyzed to decide what new indexes could be created to improve the performance of this query. The indexes will be created and the performance will be measured to see if the expected benefits are realized.
A range partitioned table will be created using the branch_id column to separate data into multiple data partitions. Several example queries will be analyzed to understand how the DB2 optimizer can use ‘partition elimination’ to reduce processing costs for rage partitioned tables.
Note: The examples are shown to help you locate the information, the costs and other statistics in your reports may vary from the values shown. If a different level of DB2 UDB product is used for this exercise, some of the processing operations selected by the optimizer could also be changed.
Course materials may not be reproduced in whole or in part without the prior written permission of IBM.
8-2 DB2 for Linux, UNIX, and Windows © Copyright IBM Corp. 2001, 2006
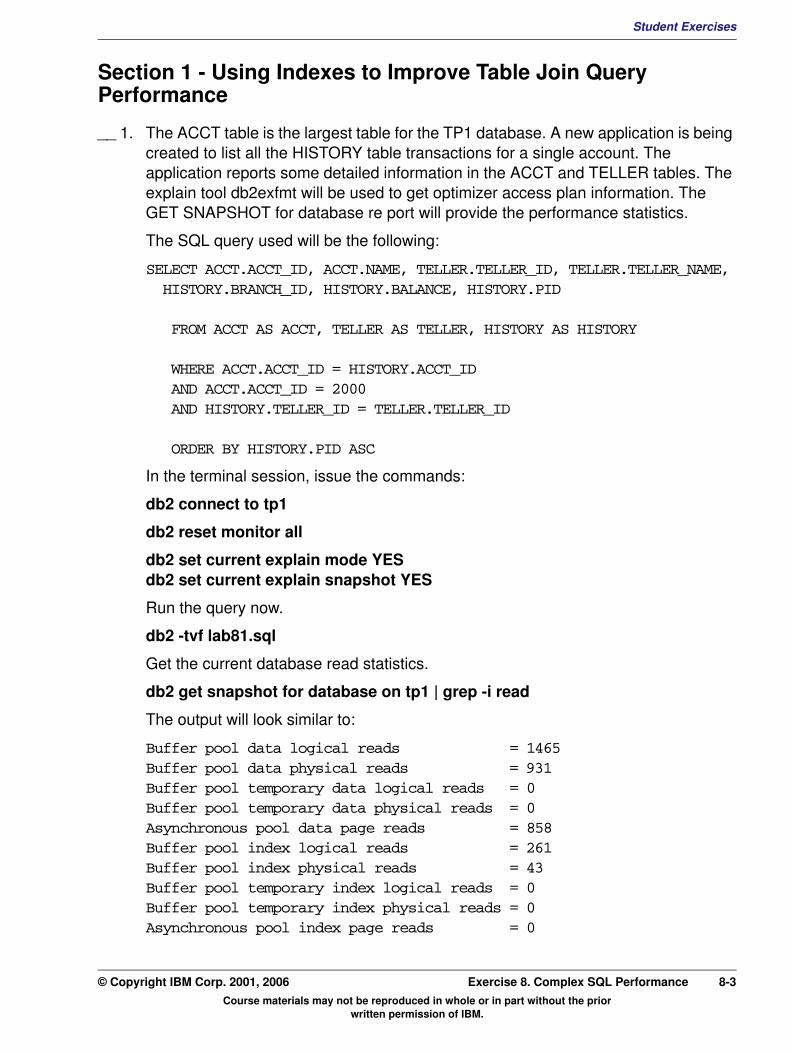
Student ExercisesV3.1.0.1
EXempty
Section 1 - Using Indexes to Improve Table Join Query Performance__ 1. The ACCT table is the largest table for the TP1 database. A new application is being created to list all the HISTORY table transactions for a single account. The application reports some detailed information in the ACCT and TELLER tables. The explain tool db2exfmt will be used to get optimizer access plan information. The GET SNAPSHOT for database re port will provide the performance statistics.
The SQL query used will be the following:
SELECT ACCT.ACCT_ID, ACCT.NAME, TELLER.TELLER_ID, TELLER.TELLER_NAME, HISTORY.BRANCH_ID, HISTORY.BALANCE, HISTORY.PID FROM ACCT AS ACCT, TELLER AS TELLER, HISTORY AS HISTORY
WHERE ACCT.ACCT_ID = HISTORY.ACCT_ID AND ACCT.ACCT_ID = 2000 AND HISTORY.TELLER_ID = TELLER.TELLER_ID
ORDER BY HISTORY.PID ASC
In the terminal session, issue the commands:
db2 connect to tp1
db2 reset monitor all
db2 set current explain mode YES db2 set current explain snapshot YES
Run the query now.
db2 -tvf lab81.sql
Get the current database read statistics.
db2 get snapshot for database on tp1 | grep -i read
The output will look similar to:
Buffer pool data logical reads = 1465Buffer pool data physical reads = 931Buffer pool temporary data logical reads = 0Buffer pool temporary data physical reads = 0Asynchronous pool data page reads = 858Buffer pool index logical reads = 261Buffer pool index physical reads = 43Buffer pool temporary index logical reads = 0Buffer pool temporary index physical reads = 0Asynchronous pool index page reads = 0
Course materials may not be reproduced in whole or in part without the prior written permission of IBM.
© Copyright IBM Corp. 2001, 2006 Exercise 8. Complex SQL Performance 8-3
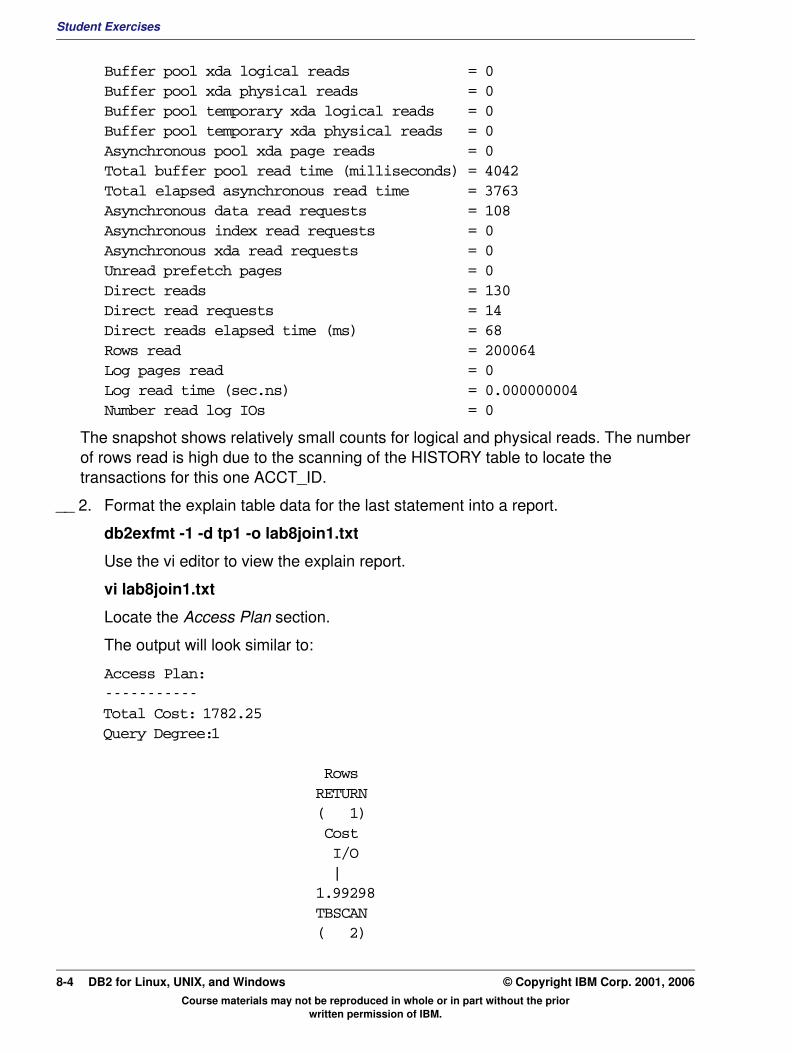
Student Exercises
Buffer pool xda logical reads = 0Buffer pool xda physical reads = 0Buffer pool temporary xda logical reads = 0Buffer pool temporary xda physical reads = 0Asynchronous pool xda page reads = 0Total buffer pool read time (milliseconds) = 4042Total elapsed asynchronous read time = 3763Asynchronous data read requests = 108Asynchronous index read requests = 0Asynchronous xda read requests = 0Unread prefetch pages = 0Direct reads = 130Direct read requests = 14Direct reads elapsed time (ms) = 68Rows read = 200064Log pages read = 0Log read time (sec.ns) = 0.000000004Number read log IOs = 0
The snapshot shows relatively small counts for logical and physical reads. The number of rows read is high due to the scanning of the HISTORY table to locate the transactions for this one ACCT_ID.
__ 2. Format the explain table data for the last statement into a report.
db2exfmt -1 -d tp1 -o lab8join1.txt
Use the vi editor to view the explain report.
vi lab8join1.txt
Locate the Access Plan section.
The output will look similar to:
Access Plan:-----------Total Cost: 1782.25Query Degree:1
Rows RETURN ( 1) Cost I/O | 1.99298 TBSCAN ( 2)
Course materials may not be reproduced in whole or in part without the prior written permission of IBM.
8-4 DB2 for Linux, UNIX, and Windows © Copyright IBM Corp. 2001, 2006
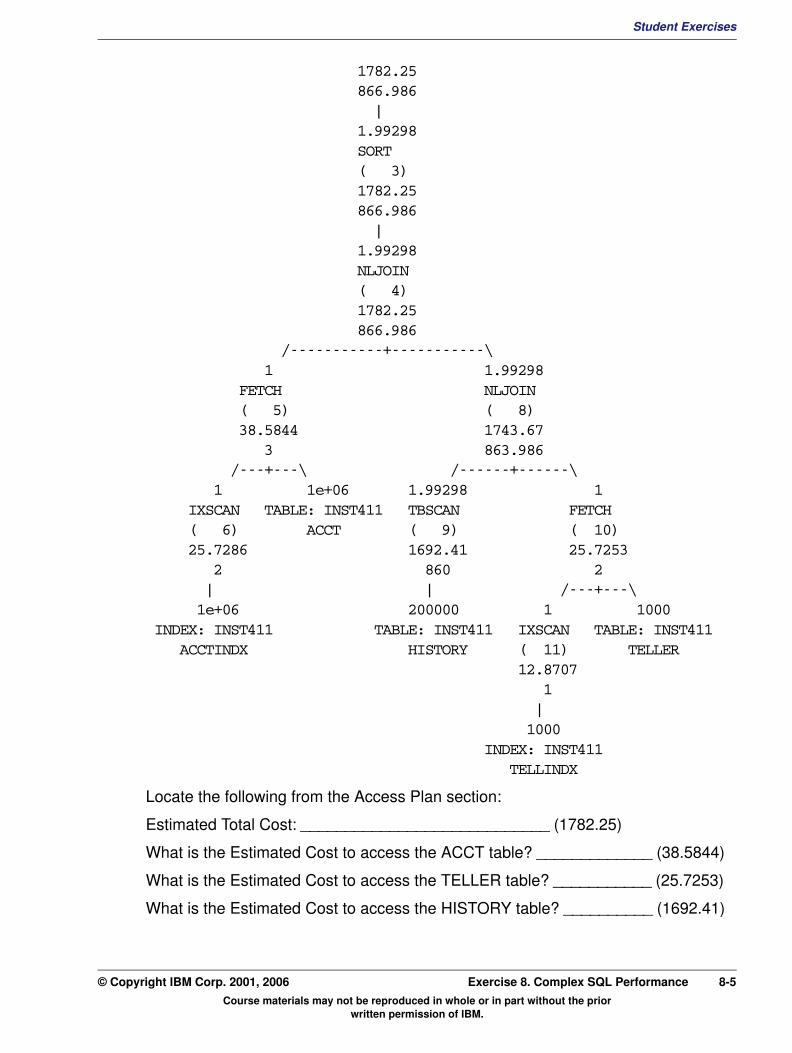
Student ExercisesV3.1.0.1
EXempty
1782.25 866.986 | 1.99298 SORT ( 3) 1782.25 866.986 | 1.99298 NLJOIN ( 4) 1782.25 866.986 /-----------+-----------\ 1 1.99298 FETCH NLJOIN ( 5) ( 8) 38.5844 1743.67 3 863.986 /---+---\ /------+------\ 1 1e+06 1.99298 1 IXSCAN TABLE: INST411 TBSCAN FETCH ( 6) ACCT ( 9) ( 10) 25.7286 1692.41 25.7253 2 860 2 | | /---+---\ 1e+06 200000 1 1000 INDEX: INST411 TABLE: INST411 IXSCAN TABLE: INST411 ACCTINDX HISTORY ( 11) TELLER 12.8707 1 | 1000 INDEX: INST411 TELLINDXLocate the following from the Access Plan section:
Estimated Total Cost: ____________________________ (1782.25)
What is the Estimated Cost to access the ACCT table? _____________ (38.5844)
What is the Estimated Cost to access the TELLER table? ___________ (25.7253)
What is the Estimated Cost to access the HISTORY table? __________ (1692.41)
Course materials may not be reproduced in whole or in part without the prior written permission of IBM.
© Copyright IBM Corp. 2001, 2006 Exercise 8. Complex SQL Performance 8-5
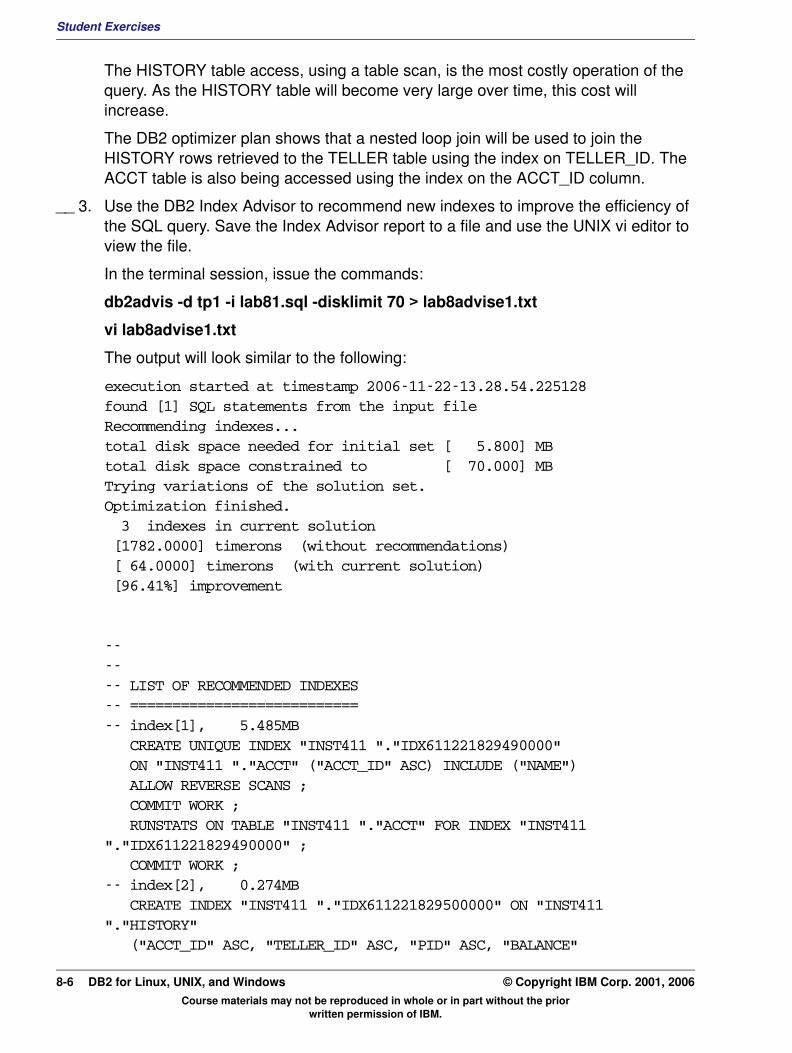
Student Exercises
The HISTORY table access, using a table scan, is the most costly operation of the query. As the HISTORY table will become very large over time, this cost will increase.
The DB2 optimizer plan shows that a nested loop join will be used to join the HISTORY rows retrieved to the TELLER table using the index on TELLER_ID. The ACCT table is also being accessed using the index on the ACCT_ID column.
__ 3. Use the DB2 Index Advisor to recommend new indexes to improve the efficiency of the SQL query. Save the Index Advisor report to a file and use the UNIX vi editor to view the file.
In the terminal session, issue the commands:
db2advis -d tp1 -i lab81.sql -disklimit 70 > lab8advise1.txt
vi lab8advise1.txt
The output will look similar to the following:
execution started at timestamp 2006-11-22-13.28.54.225128found [1] SQL statements from the input fileRecommending indexes...total disk space needed for initial set [ 5.800] MBtotal disk space constrained to [ 70.000] MBTrying variations of the solution set.Optimization finished. 3 indexes in current solution [1782.0000] timerons (without recommendations) [ 64.0000] timerons (with current solution) [96.41%] improvement
------ LIST OF RECOMMENDED INDEXES-- ===========================-- index[1], 5.485MB CREATE UNIQUE INDEX "INST411 "."IDX611221829490000" ON "INST411 "."ACCT" ("ACCT_ID" ASC) INCLUDE ("NAME") ALLOW REVERSE SCANS ; COMMIT WORK ; RUNSTATS ON TABLE "INST411 "."ACCT" FOR INDEX "INST411 "."IDX611221829490000" ; COMMIT WORK ;-- index[2], 0.274MB CREATE INDEX "INST411 "."IDX611221829500000" ON "INST411 "."HISTORY" ("ACCT_ID" ASC, "TELLER_ID" ASC, "PID" ASC, "BALANCE"
Course materials may not be reproduced in whole or in part without the prior written permission of IBM.
8-6 DB2 for Linux, UNIX, and Windows © Copyright IBM Corp. 2001, 2006
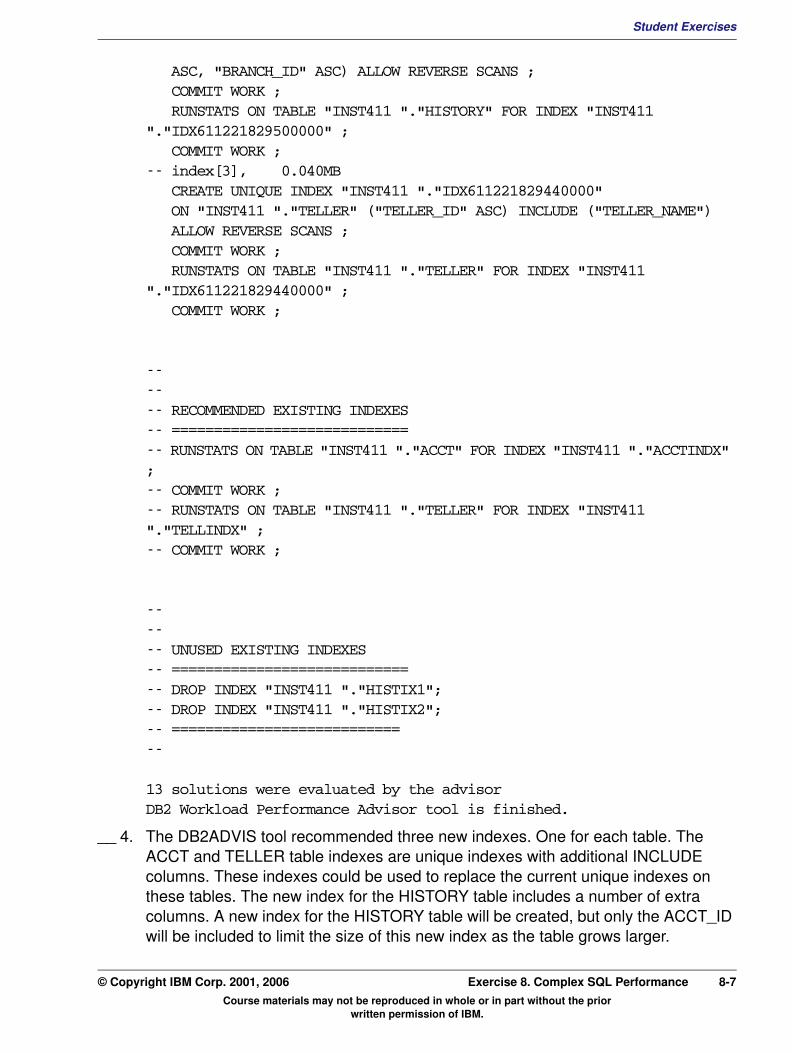
Student ExercisesV3.1.0.1
EXempty
ASC, "BRANCH_ID" ASC) ALLOW REVERSE SCANS ; COMMIT WORK ; RUNSTATS ON TABLE "INST411 "."HISTORY" FOR INDEX "INST411 "."IDX611221829500000" ; COMMIT WORK ;-- index[3], 0.040MB CREATE UNIQUE INDEX "INST411 "."IDX611221829440000" ON "INST411 "."TELLER" ("TELLER_ID" ASC) INCLUDE ("TELLER_NAME") ALLOW REVERSE SCANS ; COMMIT WORK ; RUNSTATS ON TABLE "INST411 "."TELLER" FOR INDEX "INST411 "."IDX611221829440000" ; COMMIT WORK ;------ RECOMMENDED EXISTING INDEXES-- ============================-- RUNSTATS ON TABLE "INST411 "."ACCT" FOR INDEX "INST411 "."ACCTINDX" ;-- COMMIT WORK ;-- RUNSTATS ON TABLE "INST411 "."TELLER" FOR INDEX "INST411 "."TELLINDX" ;-- COMMIT WORK ;
------ UNUSED EXISTING INDEXES-- ============================-- DROP INDEX "INST411 "."HISTIX1";-- DROP INDEX "INST411 "."HISTIX2";-- ===========================--
13 solutions were evaluated by the advisorDB2 Workload Performance Advisor tool is finished.
__ 4. The DB2ADVIS tool recommended three new indexes. One for each table. The ACCT and TELLER table indexes are unique indexes with additional INCLUDE columns. These indexes could be used to replace the current unique indexes on these tables. The new index for the HISTORY table includes a number of extra columns. A new index for the HISTORY table will be created, but only the ACCT_ID will be included to limit the size of this new index as the table grows larger.
Course materials may not be reproduced in whole or in part without the prior written permission of IBM.
© Copyright IBM Corp. 2001, 2006 Exercise 8. Complex SQL Performance 8-7

Student Exercises
The DB2 Command file, lab82.ddl, contains the following SQL statements to create the new indexes and generate index statistics.
-- ACCT Index DROP INDEX ACCTINDX ; CREATE UNIQUE INDEX ACCTINDX ON ACCT (ACCT_ID ASC) INCLUDE (NAME) ALLOW REVERSE SCANS ; RUNSTATS ON TABLE DB2INST1.ACCT FOR INDEXES ALL ; COMMIT WORK ;-- HISTORY INDEX CREATE INDEX HISTIX3 ON HISTORY (ACCT_ID ASC ) ALLOW REVERSE SCANS ;-- RUNSTATS ON TABLE DB2INST1.HISTORY FOR INDEXES ALL ; COMMIT WORK ;-- TELLER INDEX DROP INDEX TELLINDX ; CREATE UNIQUE INDEX TELLINDX ON TELLER (TELLER_ID ASC) INCLUDE (TELLER_NAME) ALLOW REVERSE SCANS ; RUNSTATS ON TABLE DB2INST1.TELLER FOR INDEXES ALL ;
In the terminal session, issue the commands:
db2 terminate
db2 connect to tp1
db2 -tvf lab82.ddl
__ 5. Now that new indexes are available, run the query again and collect the same information.
In the terminal session, issue the commands:
db2 reset monitor all
db2 set current explain mode YES db2 set current explain snapshot YES
db2 -tvf lab81.sql
Get the current database read statistics.
db2 get snapshot for database on tp1 | grep -i read
The output will look similar to:
Buffer pool data logical reads = 403Buffer pool data physical reads = 41Buffer pool temporary data logical reads = 0Buffer pool temporary data physical reads = 0Asynchronous pool data page reads = 0Buffer pool index logical reads = 227
Course materials may not be reproduced in whole or in part without the prior written permission of IBM.
8-8 DB2 for Linux, UNIX, and Windows © Copyright IBM Corp. 2001, 2006
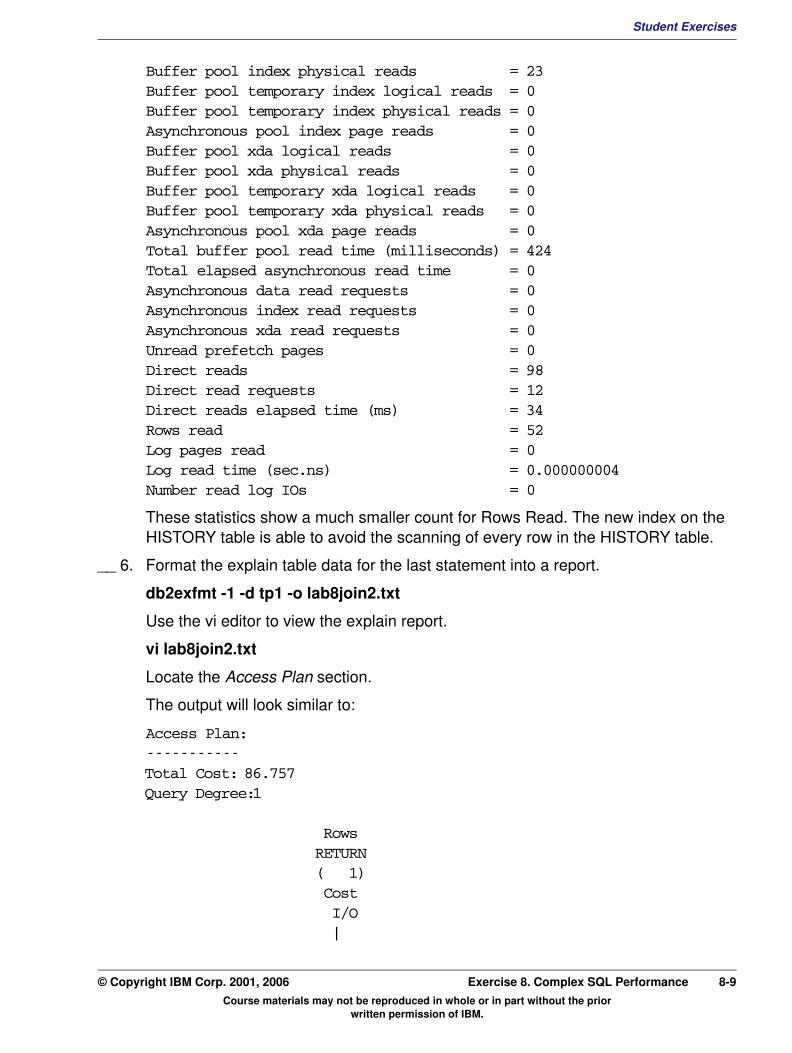
Student ExercisesV3.1.0.1
EXempty
Buffer pool index physical reads = 23Buffer pool temporary index logical reads = 0Buffer pool temporary index physical reads = 0Asynchronous pool index page reads = 0Buffer pool xda logical reads = 0Buffer pool xda physical reads = 0Buffer pool temporary xda logical reads = 0Buffer pool temporary xda physical reads = 0Asynchronous pool xda page reads = 0Total buffer pool read time (milliseconds) = 424Total elapsed asynchronous read time = 0Asynchronous data read requests = 0Asynchronous index read requests = 0Asynchronous xda read requests = 0Unread prefetch pages = 0Direct reads = 98Direct read requests = 12Direct reads elapsed time (ms) = 34Rows read = 52Log pages read = 0Log read time (sec.ns) = 0.000000004Number read log IOs = 0These statistics show a much smaller count for Rows Read. The new index on the HISTORY table is able to avoid the scanning of every row in the HISTORY table.
__ 6. Format the explain table data for the last statement into a report.
db2exfmt -1 -d tp1 -o lab8join2.txt
Use the vi editor to view the explain report.
vi lab8join2.txt
Locate the Access Plan section.
The output will look similar to:
Access Plan:-----------Total Cost: 86.757Query Degree:1
Rows RETURN ( 1) Cost I/O |
Course materials may not be reproduced in whole or in part without the prior written permission of IBM.
© Copyright IBM Corp. 2001, 2006 Exercise 8. Complex SQL Performance 8-9
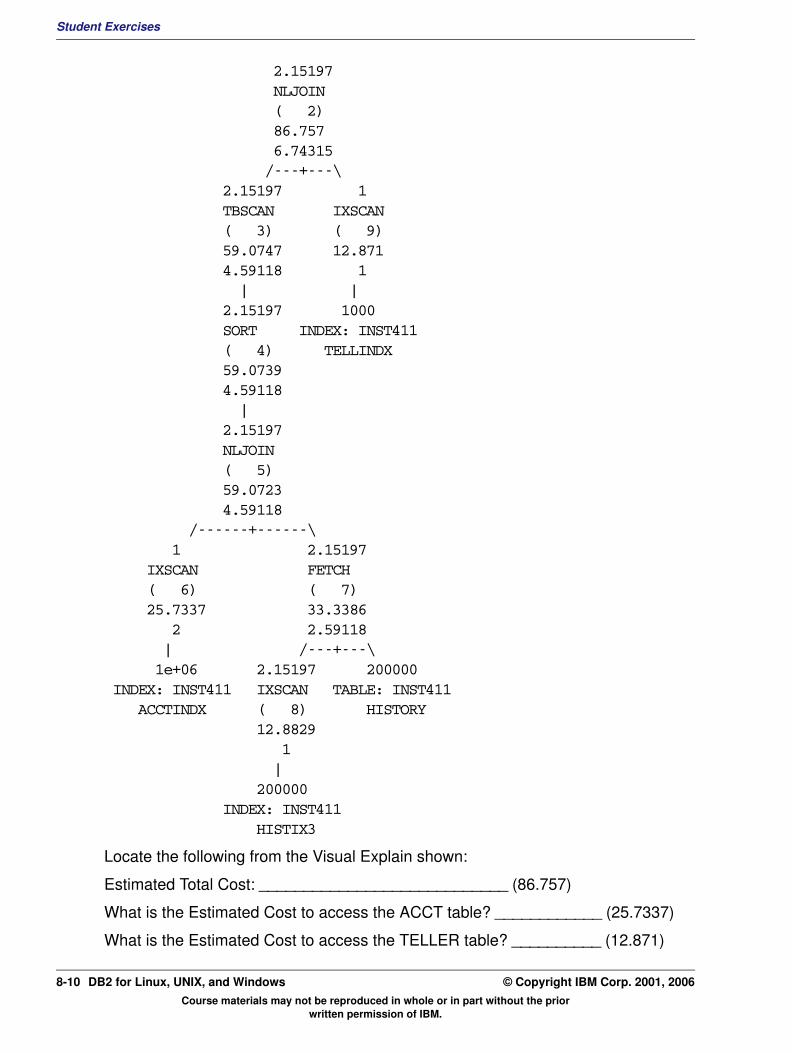
Student Exercises
2.15197 NLJOIN ( 2) 86.757 6.74315 /---+---\ 2.15197 1 TBSCAN IXSCAN ( 3) ( 9) 59.0747 12.871 4.59118 1 | | 2.15197 1000 SORT INDEX: INST411 ( 4) TELLINDX 59.0739 4.59118 | 2.15197 NLJOIN ( 5) 59.0723 4.59118 /------+------\ 1 2.15197 IXSCAN FETCH ( 6) ( 7) 25.7337 33.3386 2 2.59118 | /---+---\ 1e+06 2.15197 200000 INDEX: INST411 IXSCAN TABLE: INST411 ACCTINDX ( 8) HISTORY 12.8829 1 | 200000 INDEX: INST411 HISTIX3
Locate the following from the Visual Explain shown:
Estimated Total Cost: ____________________________ (86.757)
What is the Estimated Cost to access the ACCT table? ____________ (25.7337)
What is the Estimated Cost to access the TELLER table? __________ (12.871)
Course materials may not be reproduced in whole or in part without the prior written permission of IBM.
8-10 DB2 for Linux, UNIX, and Windows © Copyright IBM Corp. 2001, 2006
Student ExercisesV3.1.0.1
EXempty
What is the Estimated Cost to access the HISTORY table? __________ (33.3386)The new indexes allow Index Only access for the TELLER and ACCT tables. The index for the HISTORY table eliminates the need for a table scan. As the HISTORY table will become very large over time, this Access Plan should continue to provide efficient access at a much lower cost. These indexes will increase the processing costs for the MULTI transactions that insert rows into the HISTORY table.
Course materials may not be reproduced in whole or in part without the prior written permission of IBM.
© Copyright IBM Corp. 2001, 2006 Exercise 8. Complex SQL Performance 8-11
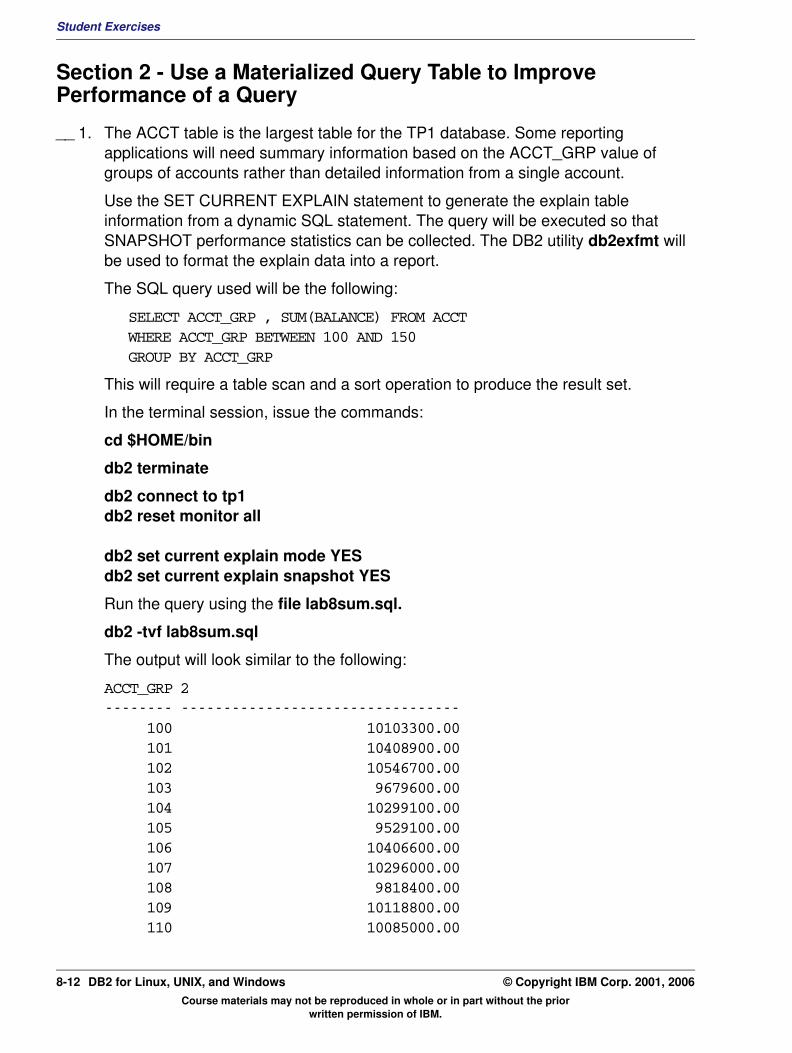
Student Exercises
Section 2 - Use a Materialized Query Table to Improve Performance of a Query
__ 1. The ACCT table is the largest table for the TP1 database. Some reporting applications will need summary information based on the ACCT_GRP value of groups of accounts rather than detailed information from a single account.
Use the SET CURRENT EXPLAIN statement to generate the explain table information from a dynamic SQL statement. The query will be executed so that SNAPSHOT performance statistics can be collected. The DB2 utility db2exfmt will be used to format the explain data into a report.
The SQL query used will be the following:
SELECT ACCT_GRP , SUM(BALANCE) FROM ACCT WHERE ACCT_GRP BETWEEN 100 AND 150GROUP BY ACCT_GRP
This will require a table scan and a sort operation to produce the result set.
In the terminal session, issue the commands:
cd $HOME/bin
db2 terminate
db2 connect to tp1 db2 reset monitor all
db2 set current explain mode YES db2 set current explain snapshot YES
Run the query using the file lab8sum.sql.
db2 -tvf lab8sum.sql
The output will look similar to the following:
ACCT_GRP 2-------- --------------------------------- 100 10103300.00 101 10408900.00 102 10546700.00 103 9679600.00 104 10299100.00 105 9529100.00 106 10406600.00 107 10296000.00 108 9818400.00 109 10118800.00 110 10085000.00
Course materials may not be reproduced in whole or in part without the prior written permission of IBM.
8-12 DB2 for Linux, UNIX, and Windows © Copyright IBM Corp. 2001, 2006
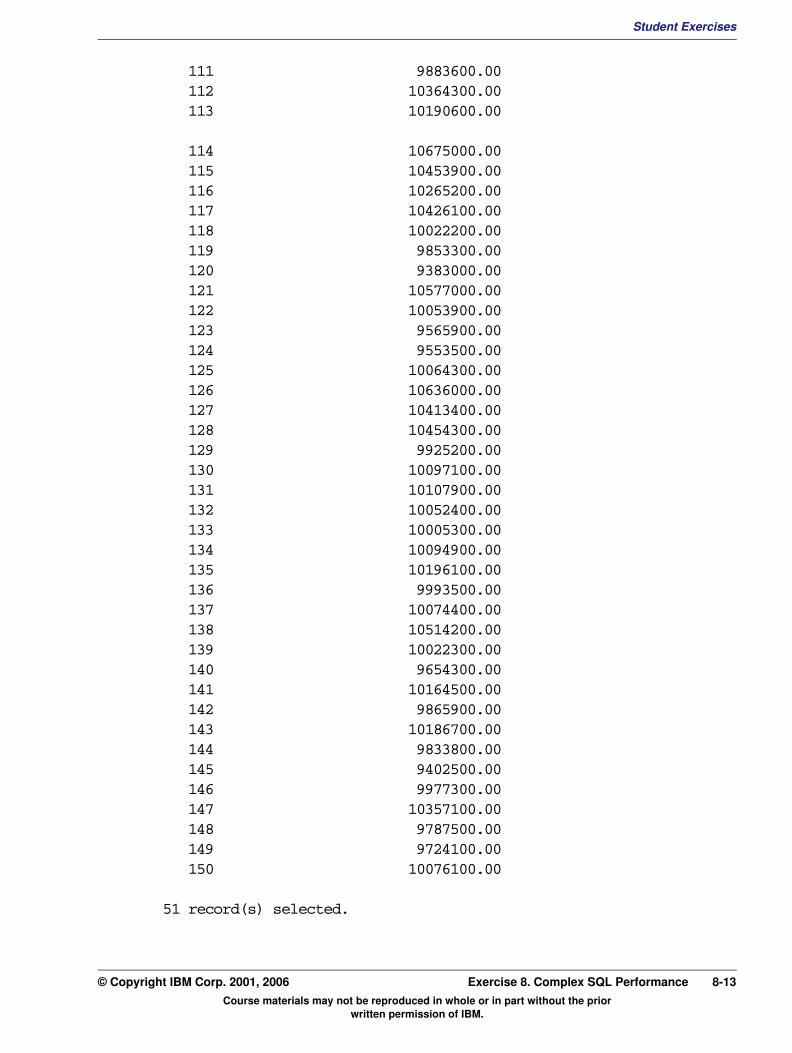
Student ExercisesV3.1.0.1
EXempty
111 9883600.00 112 10364300.00 113 10190600.00 114 10675000.00 115 10453900.00 116 10265200.00 117 10426100.00 118 10022200.00 119 9853300.00 120 9383000.00 121 10577000.00 122 10053900.00 123 9565900.00 124 9553500.00 125 10064300.00 126 10636000.00 127 10413400.00 128 10454300.00 129 9925200.00 130 10097100.00 131 10107900.00 132 10052400.00 133 10005300.00 134 10094900.00 135 10196100.00 136 9993500.00 137 10074400.00 138 10514200.00 139 10022300.00 140 9654300.00 141 10164500.00 142 9865900.00 143 10186700.00 144 9833800.00 145 9402500.00 146 9977300.00 147 10357100.00 148 9787500.00 149 9724100.00 150 10076100.0051 record(s) selected.
Course materials may not be reproduced in whole or in part without the prior written permission of IBM.
© Copyright IBM Corp. 2001, 2006 Exercise 8. Complex SQL Performance 8-13
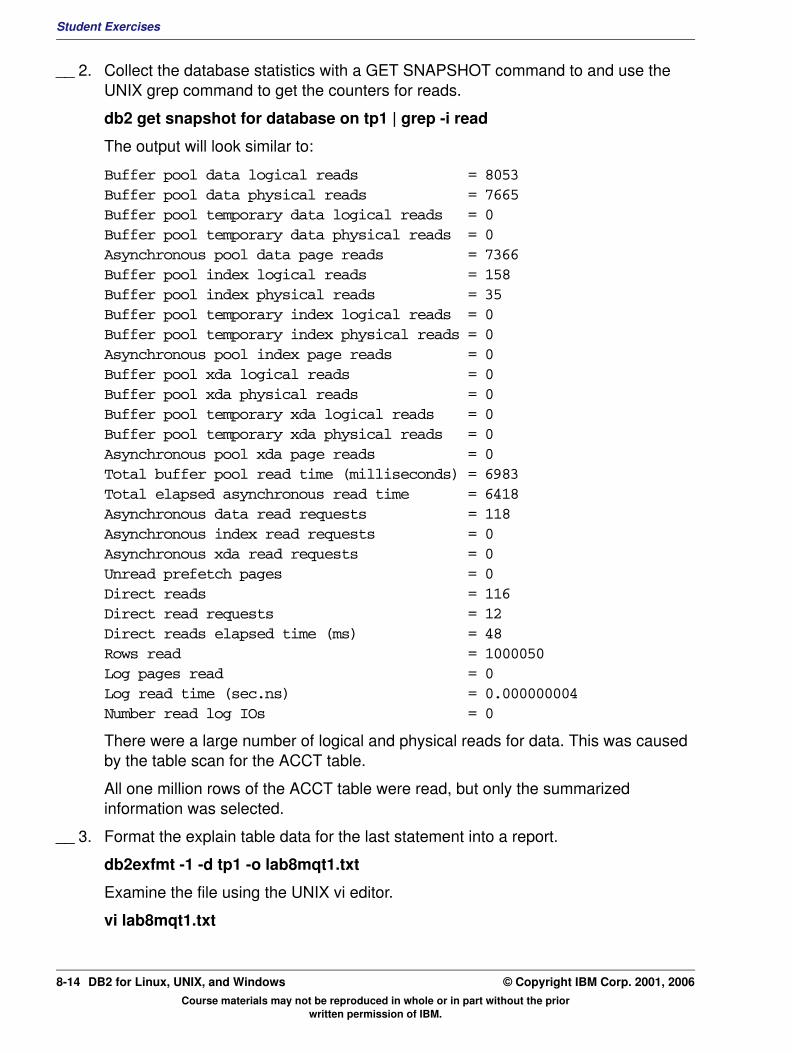
Student Exercises
__ 2. Collect the database statistics with a GET SNAPSHOT command to and use the UNIX grep command to get the counters for reads.
db2 get snapshot for database on tp1 | grep -i read
The output will look similar to:
Buffer pool data logical reads = 8053Buffer pool data physical reads = 7665Buffer pool temporary data logical reads = 0Buffer pool temporary data physical reads = 0Asynchronous pool data page reads = 7366Buffer pool index logical reads = 158Buffer pool index physical reads = 35Buffer pool temporary index logical reads = 0Buffer pool temporary index physical reads = 0Asynchronous pool index page reads = 0Buffer pool xda logical reads = 0Buffer pool xda physical reads = 0Buffer pool temporary xda logical reads = 0Buffer pool temporary xda physical reads = 0Asynchronous pool xda page reads = 0Total buffer pool read time (milliseconds) = 6983Total elapsed asynchronous read time = 6418Asynchronous data read requests = 118Asynchronous index read requests = 0Asynchronous xda read requests = 0Unread prefetch pages = 0Direct reads = 116Direct read requests = 12Direct reads elapsed time (ms) = 48Rows read = 1000050Log pages read = 0Log read time (sec.ns) = 0.000000004Number read log IOs = 0
There were a large number of logical and physical reads for data. This was caused by the table scan for the ACCT table.
All one million rows of the ACCT table were read, but only the summarized information was selected.
__ 3. Format the explain table data for the last statement into a report.
db2exfmt -1 -d tp1 -o lab8mqt1.txt
Examine the file using the UNIX vi editor.
vi lab8mqt1.txt
Course materials may not be reproduced in whole or in part without the prior written permission of IBM.
8-14 DB2 for Linux, UNIX, and Windows © Copyright IBM Corp. 2001, 2006
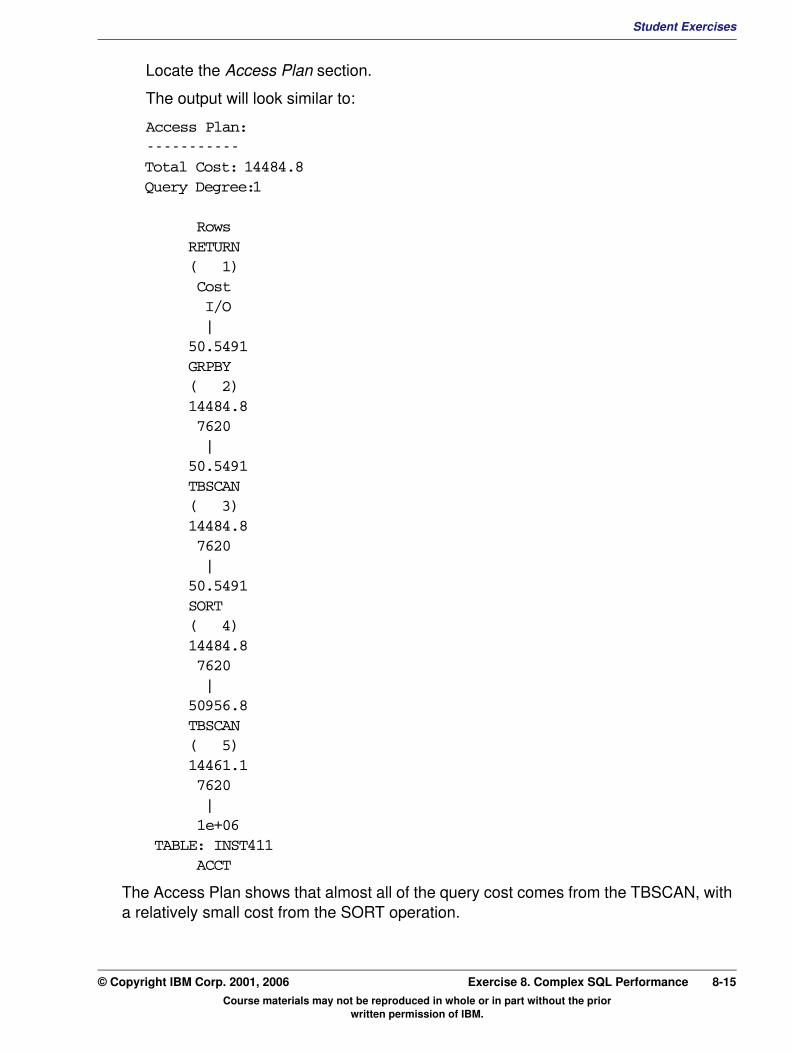
Student ExercisesV3.1.0.1
EXempty
Locate the Access Plan section.The output will look similar to:
Access Plan:-----------Total Cost: 14484.8Query Degree:1
Rows RETURN ( 1) Cost I/O | 50.5491 GRPBY ( 2) 14484.8 7620 | 50.5491 TBSCAN ( 3) 14484.8 7620 | 50.5491 SORT ( 4) 14484.8 7620 | 50956.8 TBSCAN ( 5) 14461.1 7620 | 1e+06 TABLE: INST411 ACCT
The Access Plan shows that almost all of the query cost comes from the TBSCAN, with a relatively small cost from the SORT operation.
Course materials may not be reproduced in whole or in part without the prior written permission of IBM.
© Copyright IBM Corp. 2001, 2006 Exercise 8. Complex SQL Performance 8-15
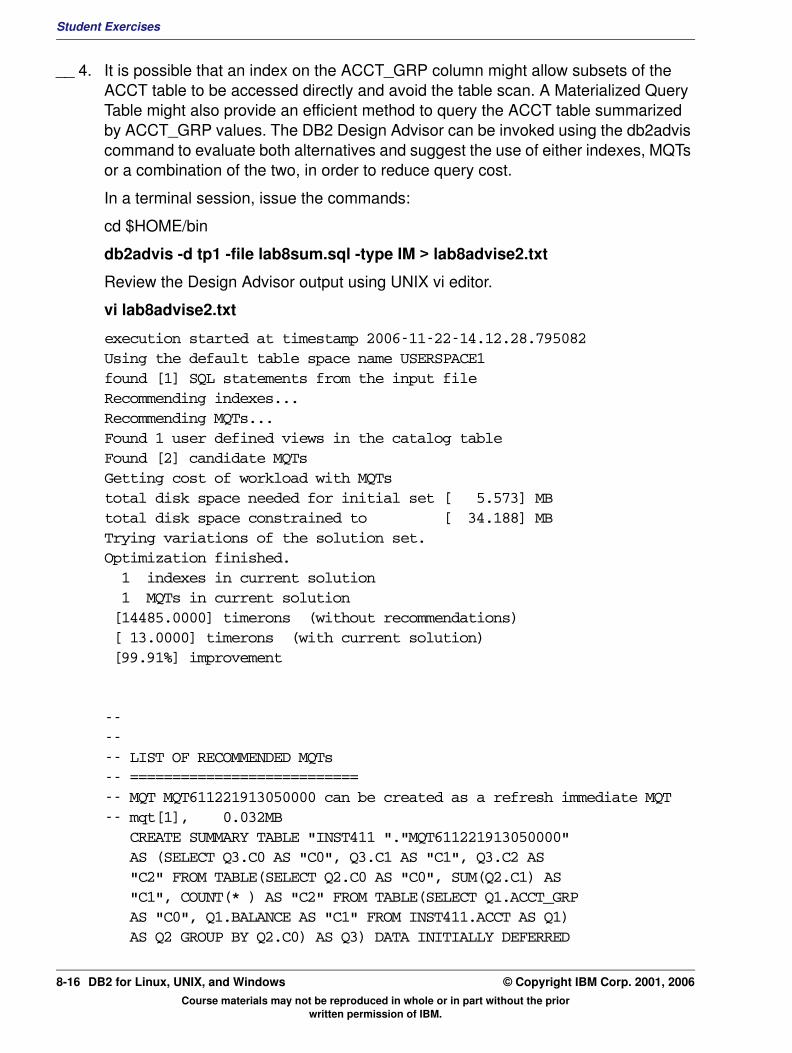
Student Exercises
__ 4. It is possible that an index on the ACCT_GRP column might allow subsets of the ACCT table to be accessed directly and avoid the table scan. A Materialized Query Table might also provide an efficient method to query the ACCT table summarized by ACCT_GRP values. The DB2 Design Advisor can be invoked using the db2advis command to evaluate both alternatives and suggest the use of either indexes, MQTs or a combination of the two, in order to reduce query cost.
In a terminal session, issue the commands:
cd $HOME/bin
db2advis -d tp1 -file lab8sum.sql -type IM > lab8advise2.txt
Review the Design Advisor output using UNIX vi editor.
vi lab8advise2.txt
execution started at timestamp 2006-11-22-14.12.28.795082Using the default table space name USERSPACE1found [1] SQL statements from the input fileRecommending indexes...Recommending MQTs...Found 1 user defined views in the catalog tableFound [2] candidate MQTsGetting cost of workload with MQTstotal disk space needed for initial set [ 5.573] MBtotal disk space constrained to [ 34.188] MBTrying variations of the solution set.Optimization finished. 1 indexes in current solution 1 MQTs in current solution [14485.0000] timerons (without recommendations) [ 13.0000] timerons (with current solution) [99.91%] improvement
------ LIST OF RECOMMENDED MQTs-- ===========================-- MQT MQT611221913050000 can be created as a refresh immediate MQT-- mqt[1], 0.032MB CREATE SUMMARY TABLE "INST411 "."MQT611221913050000" AS (SELECT Q3.C0 AS "C0", Q3.C1 AS "C1", Q3.C2 AS "C2" FROM TABLE(SELECT Q2.C0 AS "C0", SUM(Q2.C1) AS "C1", COUNT(* ) AS "C2" FROM TABLE(SELECT Q1.ACCT_GRP AS "C0", Q1.BALANCE AS "C1" FROM INST411.ACCT AS Q1) AS Q2 GROUP BY Q2.C0) AS Q3) DATA INITIALLY DEFERRED
Course materials may not be reproduced in whole or in part without the prior written permission of IBM.
8-16 DB2 for Linux, UNIX, and Windows © Copyright IBM Corp. 2001, 2006
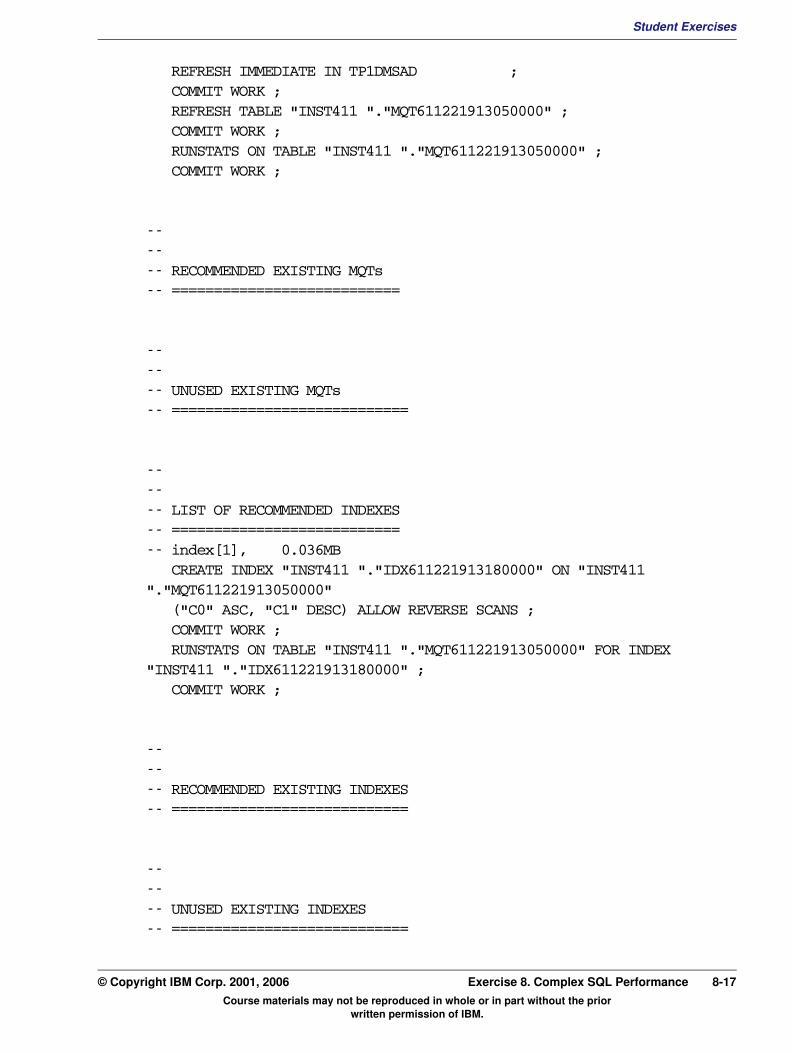
Student ExercisesV3.1.0.1
EXempty
REFRESH IMMEDIATE IN TP1DMSAD ; COMMIT WORK ; REFRESH TABLE "INST411 "."MQT611221913050000" ; COMMIT WORK ; RUNSTATS ON TABLE "INST411 "."MQT611221913050000" ; COMMIT WORK ;------ RECOMMENDED EXISTING MQTs-- ===========================
------ UNUSED EXISTING MQTs-- ============================
------ LIST OF RECOMMENDED INDEXES-- ===========================-- index[1], 0.036MB CREATE INDEX "INST411 "."IDX611221913180000" ON "INST411 "."MQT611221913050000" ("C0" ASC, "C1" DESC) ALLOW REVERSE SCANS ; COMMIT WORK ; RUNSTATS ON TABLE "INST411 "."MQT611221913050000" FOR INDEX "INST411 "."IDX611221913180000" ; COMMIT WORK ;
------ RECOMMENDED EXISTING INDEXES-- ============================
------ UNUSED EXISTING INDEXES-- ============================
Course materials may not be reproduced in whole or in part without the prior written permission of IBM.
© Copyright IBM Corp. 2001, 2006 Exercise 8. Complex SQL Performance 8-17
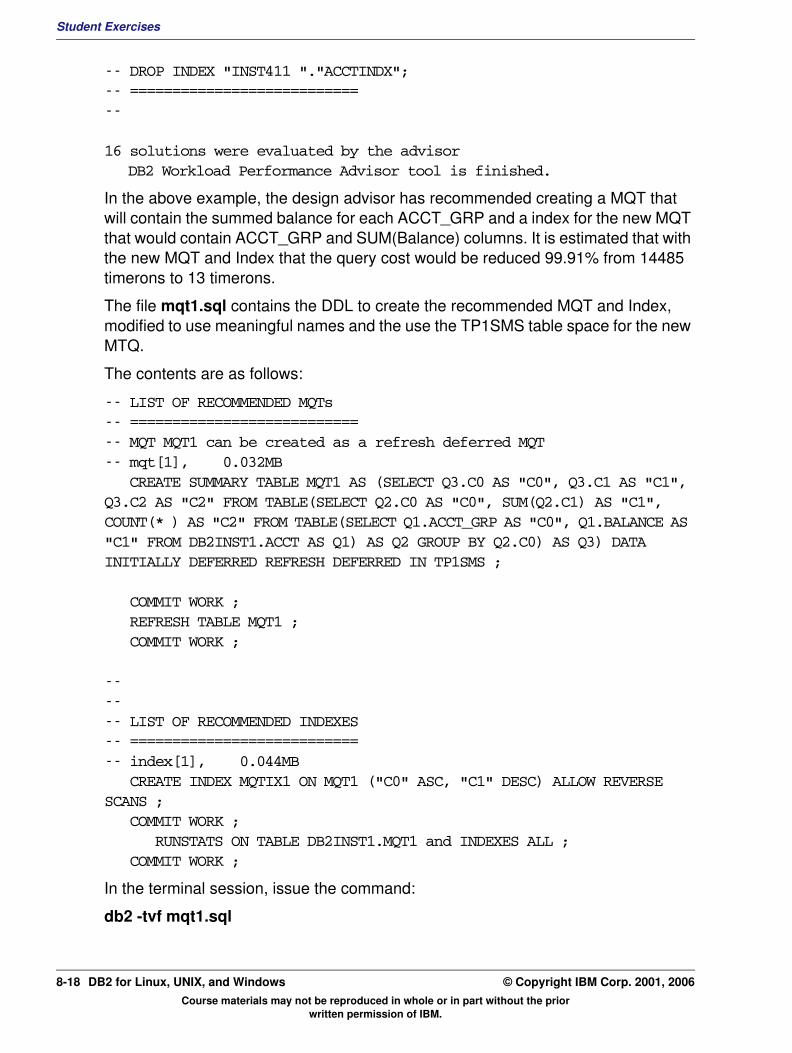
Student Exercises
-- DROP INDEX "INST411 "."ACCTINDX";-- ===========================--
16 solutions were evaluated by the advisorDB2 Workload Performance Advisor tool is finished.
In the above example, the design advisor has recommended creating a MQT that will contain the summed balance for each ACCT_GRP and a index for the new MQT that would contain ACCT_GRP and SUM(Balance) columns. It is estimated that with the new MQT and Index that the query cost would be reduced 99.91% from 14485 timerons to 13 timerons.
The file mqt1.sql contains the DDL to create the recommended MQT and Index, modified to use meaningful names and the use the TP1SMS table space for the new MTQ.
The contents are as follows:
-- LIST OF RECOMMENDED MQTs-- ===========================-- MQT MQT1 can be created as a refresh deferred MQT-- mqt[1], 0.032MB CREATE SUMMARY TABLE MQT1 AS (SELECT Q3.C0 AS "C0", Q3.C1 AS "C1", Q3.C2 AS "C2" FROM TABLE(SELECT Q2.C0 AS "C0", SUM(Q2.C1) AS "C1", COUNT(* ) AS "C2" FROM TABLE(SELECT Q1.ACCT_GRP AS "C0", Q1.BALANCE AS "C1" FROM DB2INST1.ACCT AS Q1) AS Q2 GROUP BY Q2.C0) AS Q3) DATA INITIALLY DEFERRED REFRESH DEFERRED IN TP1SMS ;
COMMIT WORK ; REFRESH TABLE MQT1 ; COMMIT WORK ;
------ LIST OF RECOMMENDED INDEXES-- ===========================-- index[1], 0.044MB CREATE INDEX MQTIX1 ON MQT1 ("C0" ASC, "C1" DESC) ALLOW REVERSE SCANS ; COMMIT WORK ; RUNSTATS ON TABLE DB2INST1.MQT1 and INDEXES ALL ; COMMIT WORK ;
In the terminal session, issue the command:
db2 -tvf mqt1.sql
Course materials may not be reproduced in whole or in part without the prior written permission of IBM.
8-18 DB2 for Linux, UNIX, and Windows © Copyright IBM Corp. 2001, 2006

Student ExercisesV3.1.0.1
EXempty
__ 5. Run the ACCT table summary query again now that the Materialized Query Table, TP1SUM has been created. The SET CURRENT REFRESH AGE SQL statement must be used to inform the optimizer that this query can tolerate noncurrent data. This is necessary because the Materialized Query Table, MQT1, was created with the REFRESH DEFERRED option and the contents could be old data. Check the read statistics when the query completes.In the terminal session, issue the commands:
db2 terminate
db2 connect to tp1
db2 reset monitor all
db2 set current REFRESH AGE ANY
db2 set current explain mode YES db2 set current explain snapshot YES
Run the query using the file lab8sum.sql.
db2 -tvf lab8sum.sql
Collect the database statistics with a GET SNAPSHOT command to and use the UNIX grep command to get the counters for reads.
db2 get snapshot for database on tp1 | grep -i read
The output will look similar to:
Buffer pool data logical reads = 276Buffer pool data physical reads = 74Buffer pool temporary data logical reads = 0Buffer pool temporary data physical reads = 0Asynchronous pool data page reads = 0Buffer pool index logical reads = 150Buffer pool index physical reads = 47Buffer pool temporary index logical reads = 0Buffer pool temporary index physical reads = 0Asynchronous pool index page reads = 0Buffer pool xda logical reads = 0Buffer pool xda physical reads = 0Buffer pool temporary xda logical reads = 0Buffer pool temporary xda physical reads = 0Asynchronous pool xda page reads = 0Total buffer pool read time (milliseconds) = 612Total elapsed asynchronous read time = 0Asynchronous data read requests = 0Asynchronous index read requests = 0Asynchronous xda read requests = 0Unread prefetch pages = 0
Course materials may not be reproduced in whole or in part without the prior written permission of IBM.
© Copyright IBM Corp. 2001, 2006 Exercise 8. Complex SQL Performance 8-19
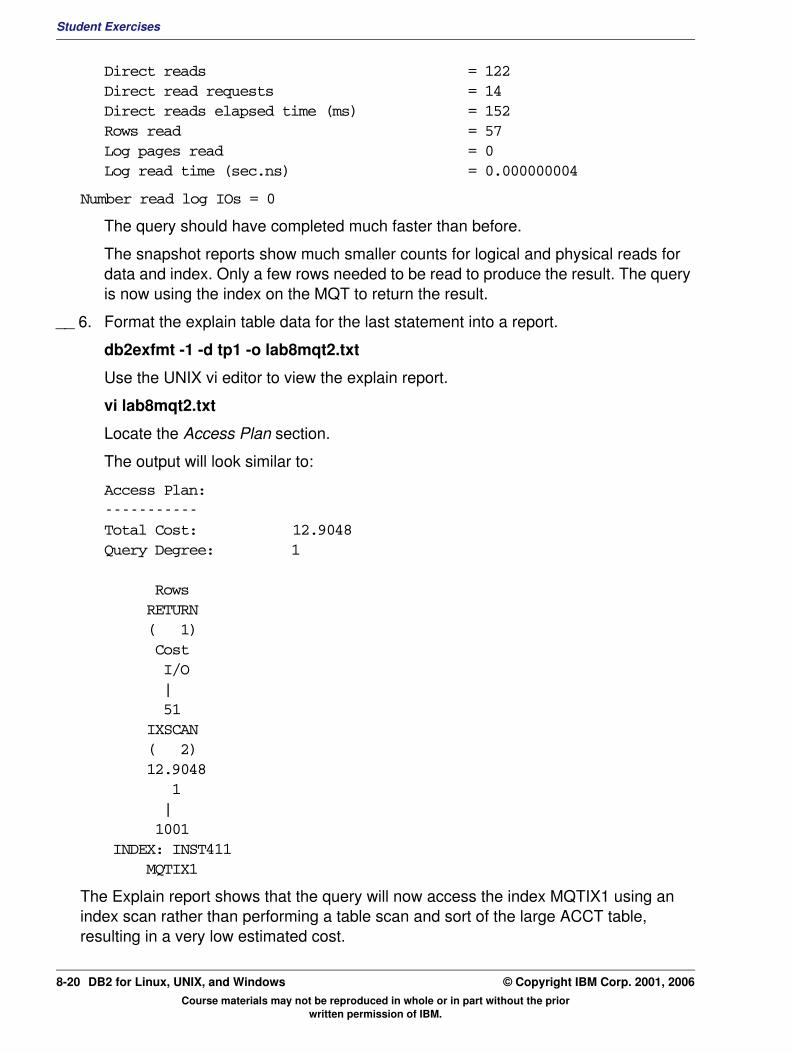
Student Exercises
Direct reads = 122Direct read requests = 14Direct reads elapsed time (ms) = 152Rows read = 57Log pages read = 0Log read time (sec.ns) = 0.000000004
Number read log IOs = 0
The query should have completed much faster than before.
The snapshot reports show much smaller counts for logical and physical reads for data and index. Only a few rows needed to be read to produce the result. The query is now using the index on the MQT to return the result.
__ 6. Format the explain table data for the last statement into a report.
db2exfmt -1 -d tp1 -o lab8mqt2.txt
Use the UNIX vi editor to view the explain report.
vi lab8mqt2.txt
Locate the Access Plan section.
The output will look similar to:
Access Plan:-----------Total Cost: 12.9048Query Degree: 1
Rows RETURN ( 1) Cost I/O | 51 IXSCAN ( 2) 12.9048 1 | 1001 INDEX: INST411 MQTIX1
The Explain report shows that the query will now access the index MQTIX1 using an index scan rather than performing a table scan and sort of the large ACCT table, resulting in a very low estimated cost.
Course materials may not be reproduced in whole or in part without the prior written permission of IBM.
8-20 DB2 for Linux, UNIX, and Windows © Copyright IBM Corp. 2001, 2006
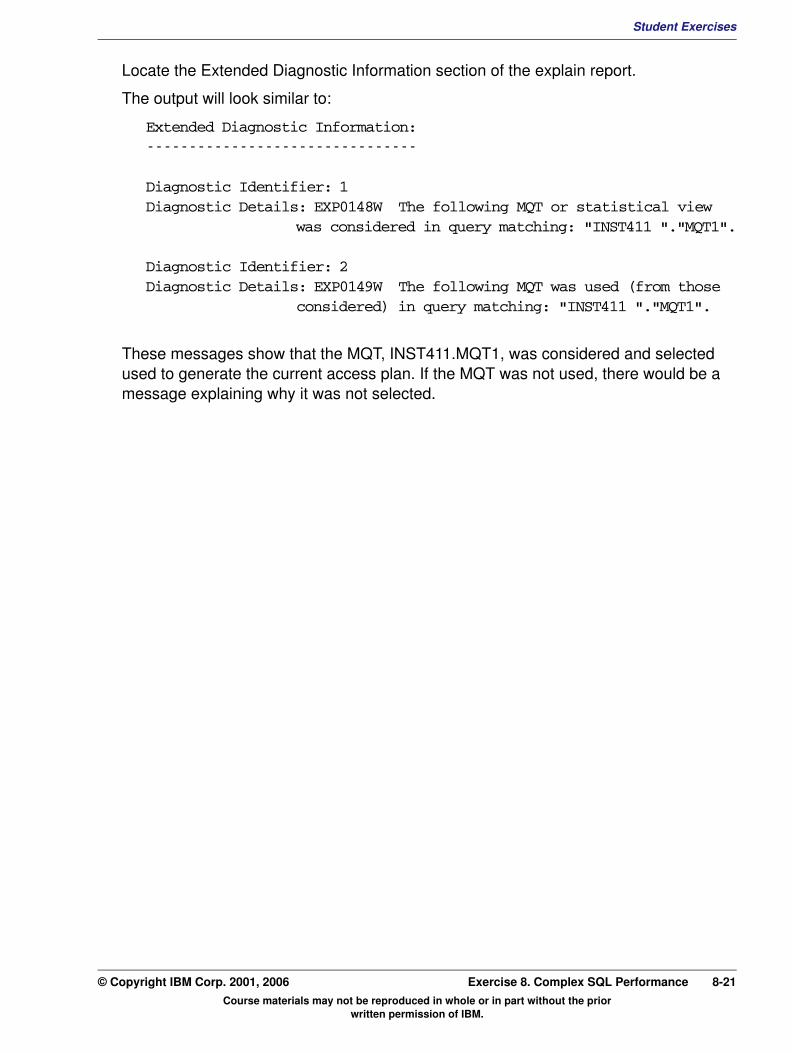
Student ExercisesV3.1.0.1
EXempty
Locate the Extended Diagnostic Information section of the explain report.The output will look similar to:
Extended Diagnostic Information:--------------------------------
Diagnostic Identifier: 1Diagnostic Details: EXP0148W The following MQT or statistical view
was considered in query matching: "INST411 "."MQT1".
Diagnostic Identifier: 2Diagnostic Details: EXP0149W The following MQT was used (from those
considered) in query matching: "INST411 "."MQT1".
These messages show that the MQT, INST411.MQT1, was considered and selected used to generate the current access plan. If the MQT was not used, there would be a message explaining why it was not selected.
Course materials may not be reproduced in whole or in part without the prior written permission of IBM.
© Copyright IBM Corp. 2001, 2006 Exercise 8. Complex SQL Performance 8-21

Student Exercises
Section 3 - Using a Range Partitioned Table to reduce query costs for large tables
__ 1. The HISTORY table with transactions could grow very large over time. A range partitioned table is designed to hold large amounts of data, spread over multiple tablespaces. It would also offer the function to attach and detach data partitions to roll in transactions or roll out transactions. A range partitioned table will be created to divide the 100 bank branches into 5 different data partitions, each with 20 banks. Each data partition will be assigned to a different table space. The indexes will be assigned to another tablespace. Use the command file tstablepart.ddl to create the necessary tablespace. Automatic Storage will be used to manage these tablespaces. The command file crhistpart.ddl to create the new table.
In the terminal session, issue the commands:
db2 connect to tp1
db2 –tvf tstablepart.ddl
The output will look similar to the following:
create tablespace tshistp1 managed by automatic storage initialsize 10 M DB20000I The SQL command completed successfully.
create tablespace tshistp2 managed by automatic storage initialsize 10 M DB20000I The SQL command completed successfully.
create tablespace tshistp3 managed by automatic storage initialsize 10 M DB20000I The SQL command completed successfully.
create tablespace tshistp4 managed by automatic storage initialsize 10 M DB20000I The SQL command completed successfully.
create tablespace tshistp5 managed by automatic storage initialsize 10 M DB20000I The SQL command completed successfully.
create tablespace tshistix managed by automatic storage initialsize 20 M DB20000I The SQL command completed successfully.
db2 –tvf crhistpart.ddl
The output will look similar to the following:
CREATE TABLE INST411.HISTORYPART ( ACCT_ID INTEGER NOT NULL , TELLER_ID SMALLINT NOT NULL , BRANCH_ID SMALLINT NOT NULL , BALANCE DECIMAL(15,2) NOT NULL , DELTA INTEGER NOT NULL , PID INTEGER NOT NULL , TSTMP TIMESTAMP NOT NULL WITH DEFAULT , ACCTNAME CHAR(20) NOT NULL , TEMP CHAR(6) NOT NULL ) IN TSHISTP1, TSHISTP2, TSHISTP3, TSHISTP4, TSHISTP5 INDEX IN TSHISTIX PARTITION BY RANGE (BRANCH_ID) (STARTING FROM (1) ENDING (100) EVERY (20) )
Course materials may not be reproduced in whole or in part without the prior written permission of IBM.
8-22 DB2 for Linux, UNIX, and Windows © Copyright IBM Corp. 2001, 2006

Student ExercisesV3.1.0.1
EXempty
DB20000I The SQL command completed successfully.CREATE INDEX INST411.HISTPIX1 ON INST411.HISTORYPART (TELLER_ID) DB20000I The SQL command completed successfully.
CREATE INDEX INST411.HISTPIX2 ON INST411.HISTORYPART (BRANCH_ID) DB20000I The SQL command completed successfully.
Now load data into the new table using the load utility.
In the terminal session, issue the commands:
db2 load from histdist.ixf of ixf replace into historypart
Use the command file partstat.cmd to collect the catalog statistics
db2 –tvf partstat.cmd
Use the describe command to show the data partitions for the table inst411.historypart.
db2 describe data partitions for table historypart show detail
The output will look similar to the following:
PartitionId Inclusive (y/n) Inclusive (y/n) Low Value High Value----------- - ------------------------------- - ------------------------------- 0 Y 1 N 21 1 Y 21 N 41 2 Y 41 N 61 3 Y 61 N 81 4 Y 81 Y 100
5 record(s) selected.
PartitionId PartitionName TableSpId PartObjId LongTblSpId AccessMode Status----------- ------------------------------- ----------- ----------- ----------- - ------ 0 PART0 9 4 9 F 1 PART1 10 4 10 F 2 PART2 11 4 11 F 3 PART3 12 4 12 F 4 PART4 13 4 13 F
5 record(s) selected.
This provides a summary of the data ranges for this table and shows which tablespace ID is assigned to each data partition.
__ 2. Run the first query, in the file tpart1.sql. Use the command file snaptbsio.sql to show the I/O counts for each tablespace. Use db2expln to produce a simple access plan for this query.
The SQL text is the following:
select * from historypart where branch_id between 11 and 60
Course materials may not be reproduced in whole or in part without the prior written permission of IBM.
© Copyright IBM Corp. 2001, 2006 Exercise 8. Complex SQL Performance 8-23

Student Exercises
In the terminal session, issue the commands:
db2 terminate db2 force application alldb2 deactivate db tp1
db2 connect to tp1 db2 -tvf tpart1.sql | grep selected
There should have been 385895 rows selected.
db2 -tvf snaptbsio.sql
The output will look similar to the following:
SELECT POOL_DATA_P_READS as DATA_Reads, POOL_INDEX_P_READS as INDEX_Reads, POOL_DATA_WRITES, substr(tbsp_name,1,16) as Table_space from sysibmadm.snaptbsp
DATA_READS INDEX_READS POOL_DATA_WRITES TABLE_SPACE -------------------- -------------------- -------------------- ---------------- 46 61 0 SYSCATSPACE 0 0 0 TEMPSPACE1 34 0 0 USERSPACE1 0 0 0 TP1SMS 10 0 0 TP1DMSH 66 0 0 TP1DMSAD 34 0 0 TP1DMSAI 11 3 0 SYSTOOLSPACE 0 0 0 SYSTOOLSTMPSPACE 6234 0 0 TSHISTP1 756 0 0 TSHISTP2 694 0 0 TSHISTP3 34 0 0 TSHISTP4 34 0 0 TSHISTP5 39 6 0 TSHISTIX
15 record(s) selected.
This shows that the first three tablespaces, TSHISTP1, TSHISTP2 and TSHISTP3 had significant reads. There are some I/Os for other tablespaces, but these were reads performed data database startup time.
Now run db2expln to generate an explain report for the query.
db2expln –d tp1 –f tpart1.sql –g –I –z \; -o lab8part1.txt
The output will look similar to:
Statement: select * from historypart where branch_id between 11 and 60
Course materials may not be reproduced in whole or in part without the prior written permission of IBM.
8-24 DB2 for Linux, UNIX, and Windows © Copyright IBM Corp. 2001, 2006
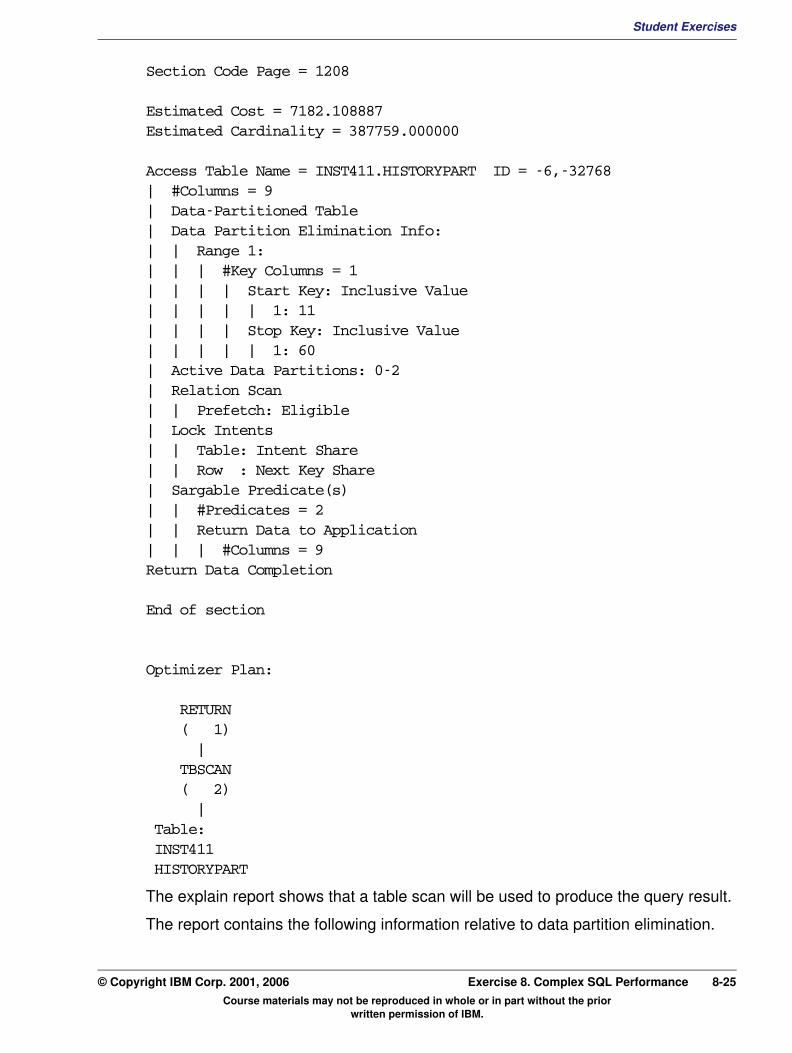
Student ExercisesV3.1.0.1
EXempty
Section Code Page = 1208Estimated Cost = 7182.108887Estimated Cardinality = 387759.000000
Access Table Name = INST411.HISTORYPART ID = -6,-32768| #Columns = 9| Data-Partitioned Table| Data Partition Elimination Info:| | Range 1:| | | #Key Columns = 1| | | | Start Key: Inclusive Value| | | | | 1: 11| | | | Stop Key: Inclusive Value| | | | | 1: 60| Active Data Partitions: 0-2| Relation Scan| | Prefetch: Eligible| Lock Intents| | Table: Intent Share| | Row : Next Key Share| Sargable Predicate(s)| | #Predicates = 2| | Return Data to Application| | | #Columns = 9Return Data Completion
End of section
Optimizer Plan:
RETURN ( 1) | TBSCAN ( 2) | Table: INST411 HISTORYPART
The explain report shows that a table scan will be used to produce the query result.
The report contains the following information relative to data partition elimination.
Course materials may not be reproduced in whole or in part without the prior written permission of IBM.
© Copyright IBM Corp. 2001, 2006 Exercise 8. Complex SQL Performance 8-25
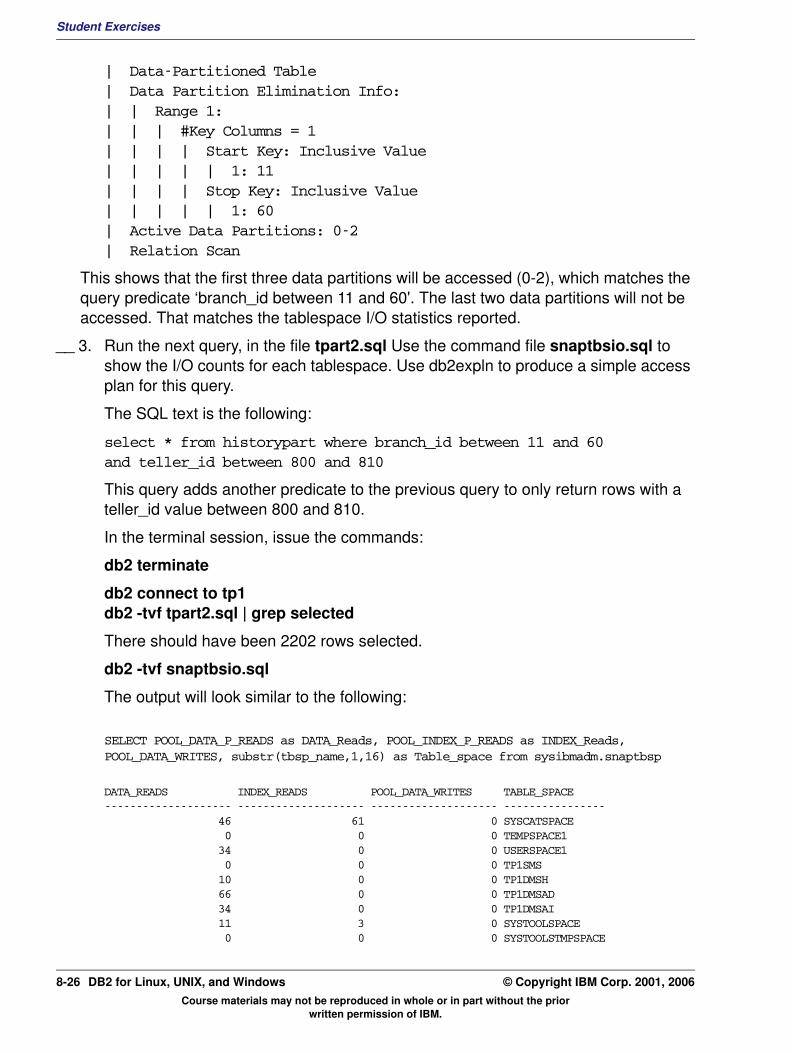
Student Exercises
| Data-Partitioned Table| Data Partition Elimination Info:| | Range 1:| | | #Key Columns = 1| | | | Start Key: Inclusive Value| | | | | 1: 11| | | | Stop Key: Inclusive Value| | | | | 1: 60| Active Data Partitions: 0-2| Relation Scan
This shows that the first three data partitions will be accessed (0-2), which matches the query predicate ‘branch_id between 11 and 60'. The last two data partitions will not be accessed. That matches the tablespace I/O statistics reported.
__ 3. Run the next query, in the file tpart2.sql Use the command file snaptbsio.sql to show the I/O counts for each tablespace. Use db2expln to produce a simple access plan for this query.
The SQL text is the following:
select * from historypart where branch_id between 11 and 60 and teller_id between 800 and 810
This query adds another predicate to the previous query to only return rows with a teller_id value between 800 and 810.
In the terminal session, issue the commands:
db2 terminate
db2 connect to tp1 db2 -tvf tpart2.sql | grep selected
There should have been 2202 rows selected.
db2 -tvf snaptbsio.sql
The output will look similar to the following:
SELECT POOL_DATA_P_READS as DATA_Reads, POOL_INDEX_P_READS as INDEX_Reads, POOL_DATA_WRITES, substr(tbsp_name,1,16) as Table_space from sysibmadm.snaptbsp
DATA_READS INDEX_READS POOL_DATA_WRITES TABLE_SPACE -------------------- -------------------- -------------------- ---------------- 46 61 0 SYSCATSPACE 0 0 0 TEMPSPACE1 34 0 0 USERSPACE1 0 0 0 TP1SMS 10 0 0 TP1DMSH 66 0 0 TP1DMSAD 34 0 0 TP1DMSAI 11 3 0 SYSTOOLSPACE 0 0 0 SYSTOOLSTMPSPACE
Course materials may not be reproduced in whole or in part without the prior written permission of IBM.
8-26 DB2 for Linux, UNIX, and Windows © Copyright IBM Corp. 2001, 2006
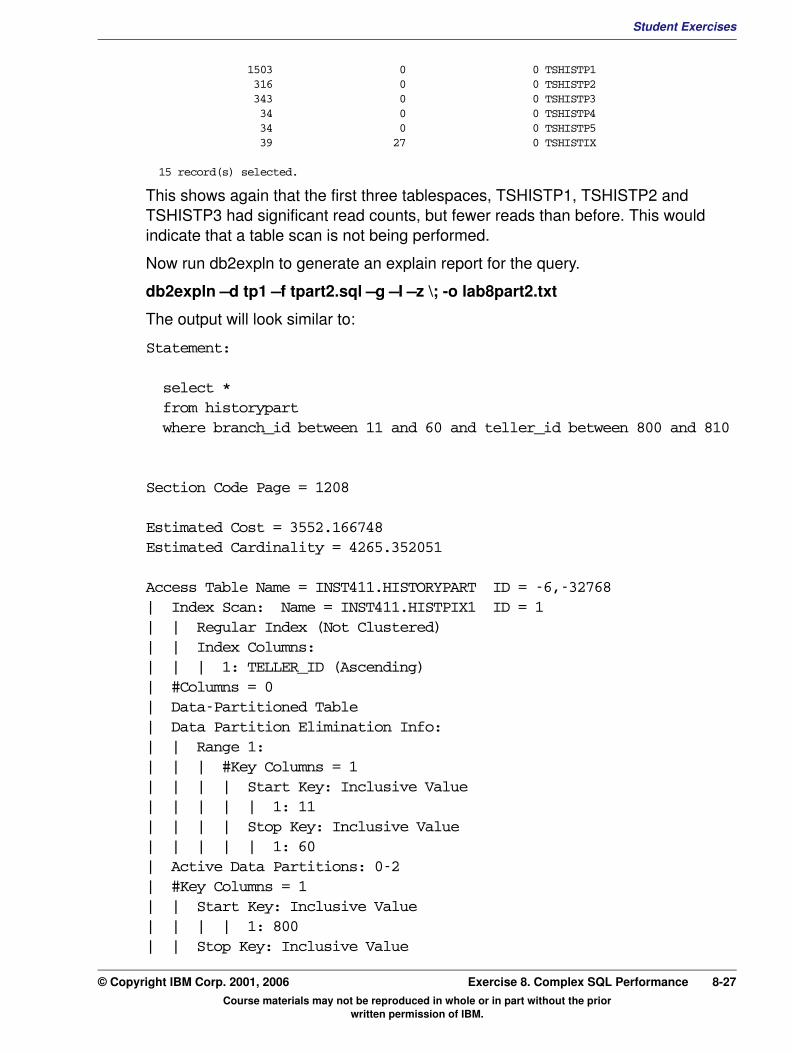
Student ExercisesV3.1.0.1
EXempty
1503 0 0 TSHISTP1 316 0 0 TSHISTP2 343 0 0 TSHISTP3 34 0 0 TSHISTP4 34 0 0 TSHISTP5 39 27 0 TSHISTIX15 record(s) selected.
This shows again that the first three tablespaces, TSHISTP1, TSHISTP2 and TSHISTP3 had significant read counts, but fewer reads than before. This would indicate that a table scan is not being performed.
Now run db2expln to generate an explain report for the query.
db2expln –d tp1 –f tpart2.sql –g –I –z \; -o lab8part2.txt
The output will look similar to:
Statement: select * from historypart where branch_id between 11 and 60 and teller_id between 800 and 810
Section Code Page = 1208
Estimated Cost = 3552.166748Estimated Cardinality = 4265.352051
Access Table Name = INST411.HISTORYPART ID = -6,-32768| Index Scan: Name = INST411.HISTPIX1 ID = 1| | Regular Index (Not Clustered)| | Index Columns:| | | 1: TELLER_ID (Ascending)| #Columns = 0| Data-Partitioned Table| Data Partition Elimination Info:| | Range 1:| | | #Key Columns = 1| | | | Start Key: Inclusive Value| | | | | 1: 11| | | | Stop Key: Inclusive Value| | | | | 1: 60| Active Data Partitions: 0-2| #Key Columns = 1| | Start Key: Inclusive Value| | | | 1: 800| | Stop Key: Inclusive Value
Course materials may not be reproduced in whole or in part without the prior written permission of IBM.
© Copyright IBM Corp. 2001, 2006 Exercise 8. Complex SQL Performance 8-27

Student Exercises
| | | | 1: 810| Index-Only Access| Index Prefetch: Eligible 16| Isolation Level: (null)| Lock Intents| | Table: Intent None| | Row : None| Sargable Index Predicate(s)| | Insert Into Sorted Temp Table ID = t1| | | #Columns = 1| | | #Sort Key Columns = 1| | | | Key 1: (Ascending)| | | Sortheap Allocation Parameters:| | | | #Rows = 4266.000000| | | | Row Width = 16| | | Piped| | | Duplicate EliminationSorted Temp Table Completion ID = t1List Prefetch Preparation| Access Table Name = INST411.HISTORYPART ID = -6,-32768| | #Columns = 9| | Data-Partitioned Table| | All data partitions will be accessed| | Fetch Using Prefetched List| | | Prefetch: 2455 Pages| | Lock Intents| | | Table: Intent Share| | | Row : Next Key Share| | Sargable Predicate(s)| | | #Predicates = 4| | | Return Data to Application| | | | #Columns = 9Return Data Completion
End of section
Optimizer Plan:
RETURN ( 1) | FETCH (----)
Course materials may not be reproduced in whole or in part without the prior written permission of IBM.
8-28 DB2 for Linux, UNIX, and Windows © Copyright IBM Corp. 2001, 2006

Student ExercisesV3.1.0.1
EXempty
/ \ RIDSCN Table: ( 3) INST411 | HISTORYPART SORT ( 4) | IXSCAN ( 5) / \ Index: Table: INST411 INST411 HISTPIX1 HISTORYPARTThe explain report shows that an index scan will be used. The index INST411.HISTPIX1 is on the teller_id column, so an index scan is used to find the rows that match the predicate ‘teller_id between 800 and 810'. This index has pointers to all data partitions, but the optimizer put in the access plan the following information:
Active Data Partitions: 0-2
This means that each index entry will check the two byte partition ID of the row, so that only rows on data partitions 0, 1 and 2 will be accessed. This is done because of the predicate ‘‘branch_id between 11 and 60'. The last two data partitions will not be accessed. That matches the tablespace I/O statistics reported.
__ 4. Run the next query, in the file tpart3.sql Use the command file snaptbsio.sql to show the I/O counts for each tablespace. Use db2expln to produce a simple access plan for this query.
The SQL text is the following:
select * from historypart where branch_id between 11 and 20 and teller_id > 800
This query selects a smaller range of branch_id values than the previous query, but includes a larger range of teller_id values, those with a teller_id greater then 800, which would be about 20% of all 1000 tellers.
In the terminal session, issue the commands:
db2 terminate
db2 connect to tp1
db2 -tvf tpart3.sql | grep selected
There should have been 66,888 rows selected.
db2 -tvf snaptbsio.sql
Course materials may not be reproduced in whole or in part without the prior written permission of IBM.
© Copyright IBM Corp. 2001, 2006 Exercise 8. Complex SQL Performance 8-29
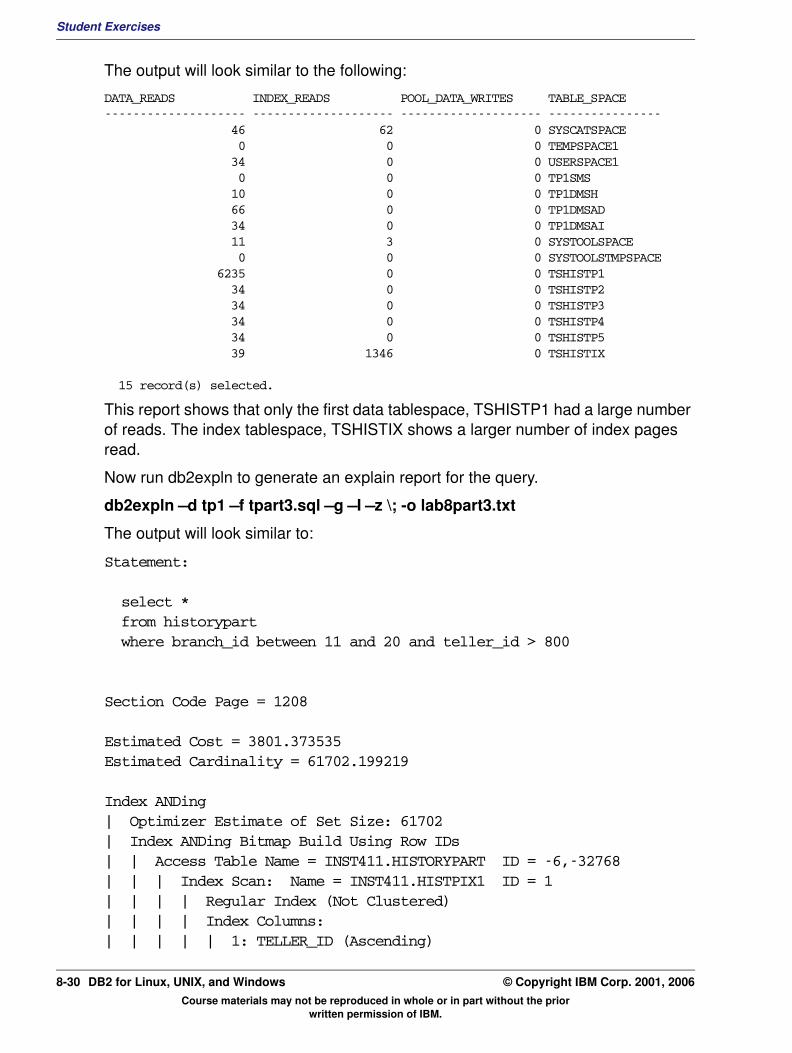
Student Exercises
The output will look similar to the following:
DATA_READS INDEX_READS POOL_DATA_WRITES TABLE_SPACE -------------------- -------------------- -------------------- ---------------- 46 62 0 SYSCATSPACE 0 0 0 TEMPSPACE1 34 0 0 USERSPACE1 0 0 0 TP1SMS 10 0 0 TP1DMSH 66 0 0 TP1DMSAD 34 0 0 TP1DMSAI 11 3 0 SYSTOOLSPACE 0 0 0 SYSTOOLSTMPSPACE 6235 0 0 TSHISTP1 34 0 0 TSHISTP2 34 0 0 TSHISTP3 34 0 0 TSHISTP4 34 0 0 TSHISTP5 39 1346 0 TSHISTIX
15 record(s) selected.
This report shows that only the first data tablespace, TSHISTP1 had a large number of reads. The index tablespace, TSHISTIX shows a larger number of index pages read.
Now run db2expln to generate an explain report for the query.
db2expln –d tp1 –f tpart3.sql –g –I –z \; -o lab8part3.txt
The output will look similar to:
Statement: select * from historypart where branch_id between 11 and 20 and teller_id > 800
Section Code Page = 1208
Estimated Cost = 3801.373535Estimated Cardinality = 61702.199219
Index ANDing| Optimizer Estimate of Set Size: 61702| Index ANDing Bitmap Build Using Row IDs| | Access Table Name = INST411.HISTORYPART ID = -6,-32768| | | Index Scan: Name = INST411.HISTPIX1 ID = 1| | | | Regular Index (Not Clustered)| | | | Index Columns:| | | | | 1: TELLER_ID (Ascending)
Course materials may not be reproduced in whole or in part without the prior written permission of IBM.
8-30 DB2 for Linux, UNIX, and Windows © Copyright IBM Corp. 2001, 2006
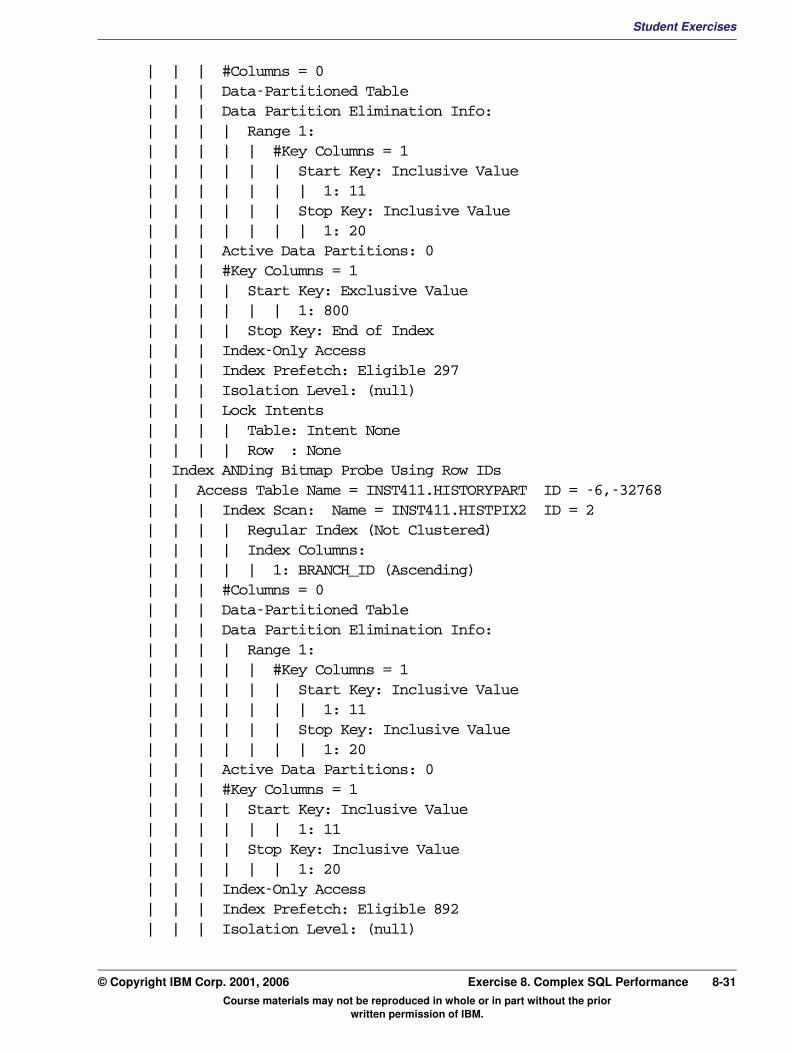
Student ExercisesV3.1.0.1
EXempty
| | | #Columns = 0| | | Data-Partitioned Table| | | Data Partition Elimination Info:| | | | Range 1:| | | | | #Key Columns = 1| | | | | | Start Key: Inclusive Value| | | | | | | 1: 11| | | | | | Stop Key: Inclusive Value| | | | | | | 1: 20| | | Active Data Partitions: 0| | | #Key Columns = 1| | | | Start Key: Exclusive Value| | | | | | 1: 800| | | | Stop Key: End of Index| | | Index-Only Access| | | Index Prefetch: Eligible 297| | | Isolation Level: (null)| | | Lock Intents| | | | Table: Intent None| | | | Row : None| Index ANDing Bitmap Probe Using Row IDs| | Access Table Name = INST411.HISTORYPART ID = -6,-32768| | | Index Scan: Name = INST411.HISTPIX2 ID = 2| | | | Regular Index (Not Clustered)| | | | Index Columns:| | | | | 1: BRANCH_ID (Ascending)| | | #Columns = 0| | | Data-Partitioned Table| | | Data Partition Elimination Info:| | | | Range 1:| | | | | #Key Columns = 1| | | | | | Start Key: Inclusive Value| | | | | | | 1: 11| | | | | | Stop Key: Inclusive Value| | | | | | | 1: 20| | | Active Data Partitions: 0| | | #Key Columns = 1| | | | Start Key: Inclusive Value| | | | | | 1: 11| | | | Stop Key: Inclusive Value| | | | | | 1: 20| | | Index-Only Access| | | Index Prefetch: Eligible 892| | | Isolation Level: (null)Course materials may not be reproduced in whole or in part without the prior written permission of IBM.
© Copyright IBM Corp. 2001, 2006 Exercise 8. Complex SQL Performance 8-31
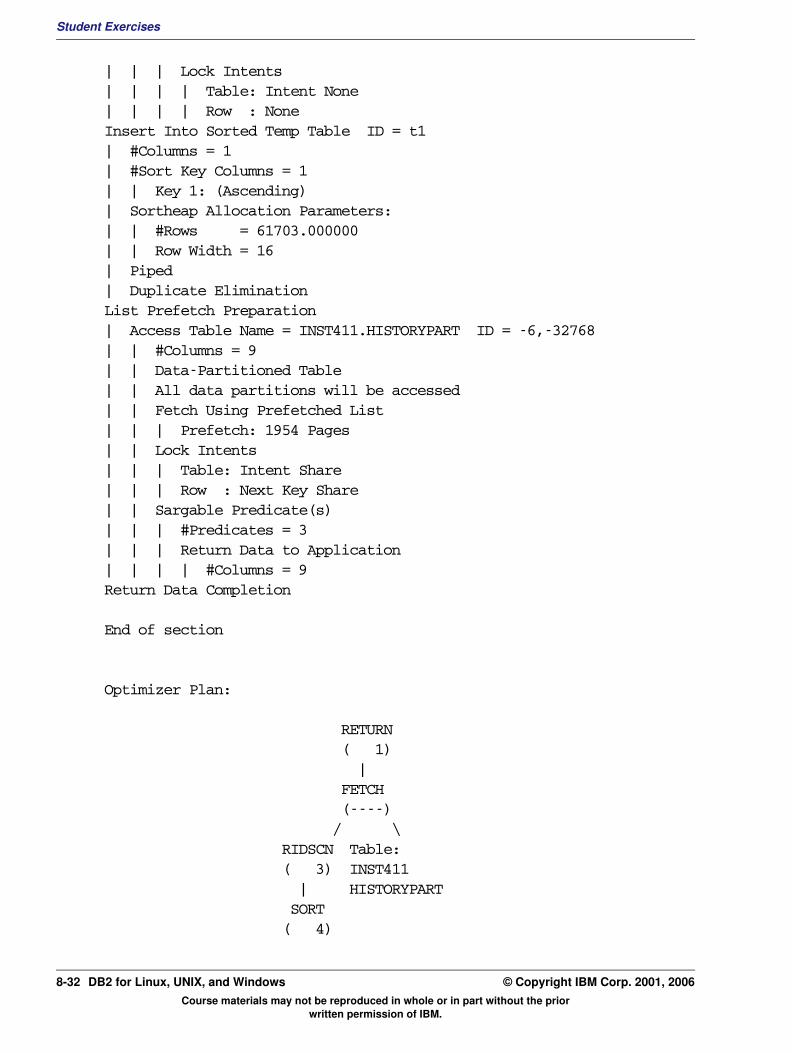
Student Exercises
| | | Lock Intents| | | | Table: Intent None| | | | Row : NoneInsert Into Sorted Temp Table ID = t1| #Columns = 1| #Sort Key Columns = 1| | Key 1: (Ascending)| Sortheap Allocation Parameters:| | #Rows = 61703.000000| | Row Width = 16| Piped| Duplicate EliminationList Prefetch Preparation| Access Table Name = INST411.HISTORYPART ID = -6,-32768| | #Columns = 9| | Data-Partitioned Table| | All data partitions will be accessed| | Fetch Using Prefetched List| | | Prefetch: 1954 Pages| | Lock Intents| | | Table: Intent Share| | | Row : Next Key Share| | Sargable Predicate(s)| | | #Predicates = 3| | | Return Data to Application| | | | #Columns = 9Return Data Completion
End of section
Optimizer Plan:
RETURN ( 1) | FETCH (----) / \ RIDSCN Table: ( 3) INST411 | HISTORYPART SORT ( 4)
Course materials may not be reproduced in whole or in part without the prior written permission of IBM.
8-32 DB2 for Linux, UNIX, and Windows © Copyright IBM Corp. 2001, 2006
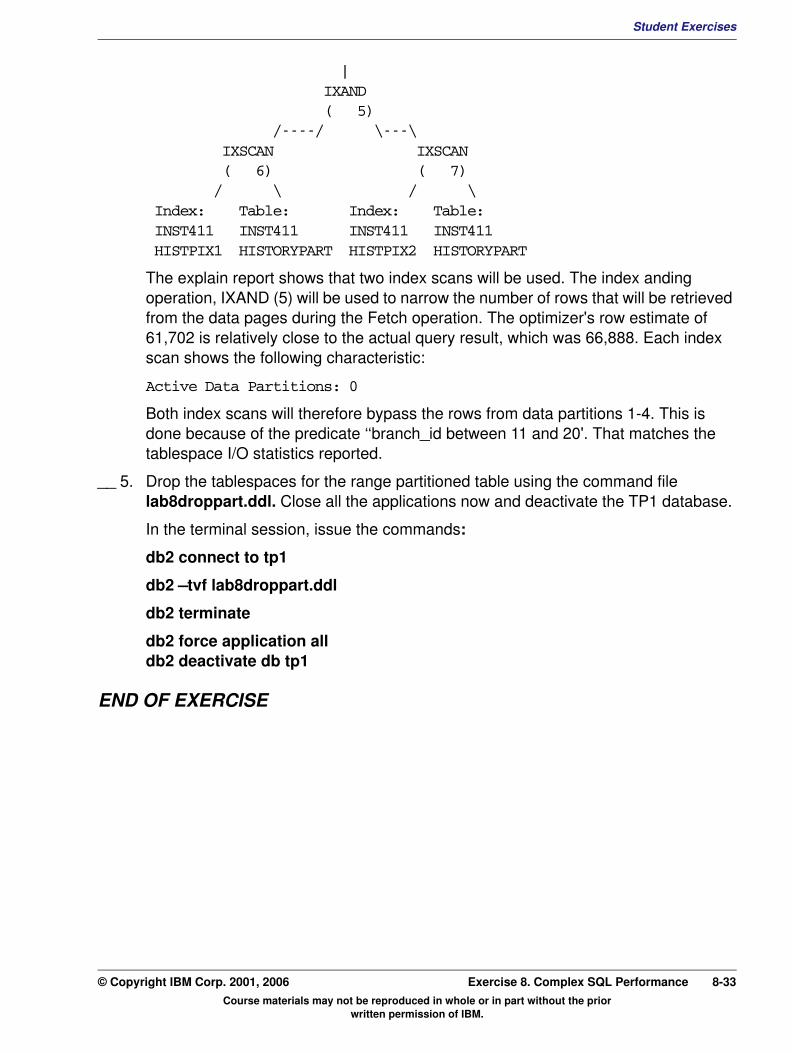
Student ExercisesV3.1.0.1
EXempty
| IXAND ( 5) /----/ \---\ IXSCAN IXSCAN ( 6) ( 7) / \ / \ Index: Table: Index: Table: INST411 INST411 INST411 INST411 HISTPIX1 HISTORYPART HISTPIX2 HISTORYPARTThe explain report shows that two index scans will be used. The index anding operation, IXAND (5) will be used to narrow the number of rows that will be retrieved from the data pages during the Fetch operation. The optimizer's row estimate of 61,702 is relatively close to the actual query result, which was 66,888. Each index scan shows the following characteristic:
Active Data Partitions: 0
Both index scans will therefore bypass the rows from data partitions 1-4. This is done because of the predicate ‘‘branch_id between 11 and 20'. That matches the tablespace I/O statistics reported.
__ 5. Drop the tablespaces for the range partitioned table using the command file lab8droppart.ddl. Close all the applications now and deactivate the TP1 database.
In the terminal session, issue the commands:
db2 connect to tp1
db2 –tvf lab8droppart.ddl
db2 terminate
db2 force application all db2 deactivate db tp1
END OF EXERCISE
Course materials may not be reproduced in whole or in part without the prior written permission of IBM.
© Copyright IBM Corp. 2001, 2006 Exercise 8. Complex SQL Performance 8-33

Student Exercises
Course materials may not be reproduced in whole or in part without the prior written permission of IBM.
8-34 DB2 for Linux, UNIX, and Windows © Copyright IBM Corp. 2001, 2006
Student ExercisesV3.1.0.1
EXempty
Exercise 9. Using DB2 Utilities for PerformanceWhat This Exercise Is About
This exercise is an online lab which allows the student to use the DB2 utilities to analyze and improve query performance. The DB2BATCH tool will be used to gather performance statistics. The REORG command will be used to change the sequence of rows in a table to improve query efficiency. The RUNSTATS command will be used update the DB2 Catalog statistics to provide accurate input to the DB2 Optimizer. The REORGCHK command will be used to report on index efficiency.
What You Should Be Able to Do
At the end of the lab, you should be able to:
• Use the DB2BATCH tool to run a set of SQL queries and collect statistics for performance analysis.
• Use the REORG utility to reorganize a table in a different clustered sequence based on an index.
• Update the DB2 catalog statistics using the RUNSTATS command to reflect changes in tables or indexes.
• Use sampled statistics options of RUNSTATS to collect catalog statistics with reduced system resources.
Course materials may not be reproduced in whole or in part without the prior written permission of IBM.
© Copyright IBM Corp. 2001, 2006 Exercise 9. Using DB2 Utilities for Performance 9-1
Student Exercises
Exercise Instructions
Introduction
In this exercise, you will be using DB2 utilities to collect performance statistics and improve the performance characteristics for a set of SQL statements.
The DB2BATCH utility will be run to collect the initial performance data and then rerun after each change to measure the effects of the change. In addition to collecting SNAPSHOT statistics for each SQL statement executed, DB2BATCH will report the elapsed times and CPU utilization.
A new index will be created for the ACCT to allow accounts to retrieved based on the ACCT_GRP value without a table scan. The REORG utility will be used to reorganize the ACCT using the new index and the RUNSTATS command will be used to update the DB2 catalog statistics.
It is common to focus on elapsed time as a measure of good or poor performance and in some cases the elapsed time is critical to achieve a performance objective, like processing an application according to an operations schedule. In this exercise elapsed times of several queries may be reported as very different when the amount of work each requires is very similar. This shows that it is sometimes necessary to look various performance statistics to see the whole picture. The RUNSTATS utility will be used to collect sampled statistics for a table to improve the accuracy of information used during query optimization at a reduced system resource cost.
Note: The examples are shown to help you locate the information, the costs and other statistics in your reports may vary from the values shown. If a different level of DB2 UDB product is used for this exercise, some of the processing operations selected by the optimizer could also be changed.
Course materials may not be reproduced in whole or in part without the prior written permission of IBM.
9-2 DB2 for Linux, UNIX, and Windows © Copyright IBM Corp. 2001, 2006
Student ExercisesV3.1.0.1
EXempty
Section 1 - Use db2batch to Run a Sequence of SQL Queries to Collect Performance Statistics__ 1. The db2batch utility provides a simple method for gathering performance data for one or more queries. The file batch1.sql contains a set of five SQL queries that will be run as follows:
Query 1: Joins TELLER and HISTORY tables for a range of BRANCH_IDs.
SELECT HISTORY.BRANCH_ID, TELLER.TELLER_NAME, HISTORY.ACCTNAME, HISTORY.ACCT_ID, HISTORY.BALANCE FROM HISTORY AS HISTORY, TELLER AS TELLER WHERE HISTORY.TELLER_ID = TELLER.TELLER_ID AND HISTORY.BRANCH_ID BETWEEN 20 AND 29 ORDER BY HISTORY.BRANCH_ID ASC, HISTORY.ACCT_ID ASC ;
Query 2: Lists HISTORY transactions for a range of TELLER-IDs.
SELECT ACCT_ID, ACCTNAME, TELLER_ID, BRANCH_ID, BALANCE FROM HISTORY WHERE TELLER_ID BETWEEN 100 AND 199;
Query 3: ACCT Summary Report for selected ACCT_GRPs.
SELECT ACCT_GRP , SUM(BALANCE) FROM ACCT WHERE ACCT_GRP BETWEEN 100 AND 150 GROUP BY ACCT_GRP;
Query 4: Join ACCT,TELLER,HISTORY information for Groups of Accounts.
SELECT ACCT.ACCT_ID, ACCT.NAME, TELLER.TELLER_ID, TELLER.TELLER_NAME, HISTORY.BRANCH_ID, HISTORY.BALANCE, HISTORY.PID FROM ACCT AS ACCT, TELLER AS TELLER, HISTORY AS HISTORY WHERE ACCT.ACCT_ID = HISTORY.ACCT_ID AND ACCT.ACCT_GRP BETWEEN 400 AND 500 AND HISTORY.TELLER_ID = TELLER.TELLER_ID ORDER BY HISTORY.PID ASC ;
Query 5: Partial NAME,ADDRESS List from ACCT.
SELECT NAME , ADDRESS FROM ACCT WHERE ACCT_GRP < 50 ORDER BY NAME ;
The file also contains several DB2BATCH options as follows:
--#SET ROWS_OUT 5
This tells DB2BATCH to fetch all of the result rows, but only list the first 5.
--#SET PERF_DETAIL 2
This tells DB2BATCH to produce a set of basic performance statistics for each query.
From your Linux workstation, start a terminal session.
Course materials may not be reproduced in whole or in part without the prior written permission of IBM.
© Copyright IBM Corp. 2001, 2006 Exercise 9. Using DB2 Utilities for Performance 9-3

Student Exercises
In the terminal session, issue the commands:
cd $HOME/bin db2 activate db tp1
db2 connect to tp1
Invoke db2batch to run the SQL statements in the file batch1.sql. Use an optimization level of 5 and generate explain data for each query. Save the output to a file, batch1.out.
db2batch -d tp1 -f batch1.sql -i complete -o o 5 e 2 > batch1.out
Use db2exfmt to format a report for the last query executed by db2batch, Query 5.
db2exfmt -1 -d tp1 -o expbat1.txt
Use the UNIX vi editor to view the db2batch report.
vi batch1.out
The db2batch output has a summary report at the bottom that will look similar to the following:
Summary Table:Type Number Repetitions Total Time (s) Min Time (s) Max Time (s) --------- ----------- ----------- -------------- -------------- -------------- Statement 1 1 2.042374 2.042374 2.042374 Statement 2 1 0.435254 0.435254 0.435254 Statement 3 1 3.156465 3.156465 3.156465 Statement 4 1 2.347792 2.347792 2.347792 Statement 5 1 1.234372 1.234372 1.234372
Arithmetic Mean Geometric Mean Row(s) Fetched Row(s) Output --------------- -------------- -------------- ------------- 2.042374 2.042374 21545 5 0.435254 0.435254 20151 5 3.156465 3.156465 51 5 2.347792 2.347792 20392 5 1.234372 1.234372 50335 5
Look at the report sections for Query 3 and Query 5 record the following information:
Report Statistic Query 3 Query 5Elapsed Time Buffer pool data logical reads Buffer pool data physical reads Buffer pool index logical reads Buffer pool index physical reads
Course materials may not be reproduced in whole or in part without the prior written permission of IBM.
9-4 DB2 for Linux, UNIX, and Windows © Copyright IBM Corp. 2001, 2006
Student ExercisesV3.1.0.1
EXempty
Example Output ReportBoth of these queries have large numbers for data logical and physical reads. In the examples above, the elapsed times were relatively short for the large number of physical reads, because the database had enough memory to keep most of the file pages in the buffer pools and some may have been read from the operating system's file cache. Your results for elapsed times may have been significantly different depending on your system.
__ 2. The SQL statements for Query 3, Query 4, and Query 5 all required table scans of the large ACCT table to produce the query results. All three queries were reporting on specific ACCT_GRP ranges in the ACCT table. Create a new index of the ACCT table on the ACCT_GRP column to allow quicker access to these subsets of the account information. The file cracctix.ddl has the SQL statement to create the new index. Use the RUNSTATS utility to collect statistics on the new index.
In the terminal session, issue the commands:
db2 -tvf cracctix.ddl
db2 runstats on table inst411.acct for index inst411.acctgrp
__ 3. Use db2batch to collect new performance statistics for the same SQL statements in the file batch1.sql. Use an optimization level of 5 and generate explain data for each query. Save the output to a file batch2.out.
In the terminal session, issue the command:
db2batch -d tp1 -f batch1.sql -i complete -o o 5 e 2 > batch2.out
Use db2exfmt to format a report for the last query executed by db2batch, Query 5.
db2exfmt -1 -d tp1 -o expbat2.txt
Use the UNIX vi editor to view the db2batch report.
vi batch2.out
The db2batch output has a summary report at the bottom that will look similar to the following:
* Summary Table:
Type Number Repetitions Total Time (s) Min Time (s) Max Time (s) --------- ----------- ----------- -------------- -------------- -------------- Statement 1 1 0.913562 0.913562 0.913562
Report Statistic Query 3 Query 5Elapsed Time 3.156465 1.234372Buffer pool data logical reads 7977 7882Buffer pool data physical reads 105 5940
Buffer pool index logical reads 129 94Buffer pool index physical reads 11 0
Course materials may not be reproduced in whole or in part without the prior written permission of IBM.
© Copyright IBM Corp. 2001, 2006 Exercise 9. Using DB2 Utilities for Performance 9-5

Student Exercises
Statement 2 1 0.430961 0.430961 0.430961 Statement 3 1 2.423290 2.423290 2.423290 Statement 4 1 1.931580 1.931580 1.931580 Statement 5 1 0.912278 0.912278 0.912278
Arithmetic Mean Geometric Mean Row(s) Fetched Row(s) Output -------------- --------------- -------------- -------------- 0.913562 0.913562 21545 5 0.430961 0.430961 20151 5 2.423290 2.423290 51 5 1.931580 1.931580 20392 5 0.912278 0.912278 50335 5
Look at the report sections for Query 3 and Query 5 record the following information:
Example Output Report
The addition of the index may have reduced elapsed times. Note that there was an increased count for index logical reads so the new index has changes by the access plan for the query. Use REORGCHK to compare the statistics for the two indexes on the ACCT table.
__ 4. Use the REORGCHK command to create a report for the acct table.
In the terminal session, issue the commands:
db2 reorgchk current statistics on table inst411.acct > stats1.txt
vi stats1.txt
The reorgchk output for the indexes will contain information similar to the following:
SCHEMA.NAME INDCARD LEAF ELEAF LVLS NDEL KEYS ...F4 F5 F6 F7 F8 REORG ------------------------------------------------------------------------------------------------Table: INST411.ACCT
Report Statistic Query 3 Query 5 Elapsed Time Buffer pool data logical reads Buffer pool data physical reads Buffer pool index logical reads Buffer pool index physical reads
Report Statistic Query 3 Query 5 Elapsed Time 2.423290 0.912278 Buffer pool data logical reads 7888 7862 Buffer pool data physical reads 2498 3907 Buffer pool index logical reads 345 322 Buffer pool index physical reads 0 0
Course materials may not be reproduced in whole or in part without the prior written permission of IBM.
9-6 DB2 for Linux, UNIX, and Windows © Copyright IBM Corp. 2001, 2006

Student ExercisesV3.1.0.1
EXempty
Index: INST411.ACCTGRP 1000000 3760 0 3 0 1000000 . 7 102 5 0 0 *---- Index: INST411.ACCTINDX 1000000 9175 0 3 0 1000000 . 100 90 2 0 0 ----- --------------------------------------------------------------------------------------------In this report, the F4 calculated value shows the cluster ratio for each index. The ACCT table is very clustered when accessed by the ACCTINDX index, but very unclustered when accessed using the ACCTGRP index.
The reporting queries access groups of rows by ACCT_GRP value. The transaction applications look for a single row by ACCT_ID. Reorganizing the ACCT table using the ACCTGRP index should allow both types of applications efficient access to the ACCT data.
__ 5. Use the REORG utility to reorganize the ACCT table using the ACCTGRP index. The REORG utility will use the temporary table space TEMPSPACE1. Increase the size of the IBMDEFAULT buffer pool to improve REORG performance.
In the terminal session, issue the commands:
db2 alter bufferpool ibmdefaultbp immediate size 5000
db2 reorg table acct index acctgrp use tempspace1 resetdictionary
Wait for the reorg to complete. Collect new statistics for the ACCT table and both indexes.
db2 runstats on table inst411.acct and indexes all
Use the REORGCHK command to create a new report for the acct table.
db2 reorgchk current statistics on table inst411.acct > stats2.txt vi stats2.txt
The reorgchk output for the indexes will look similar to the following:
SCHEMA.NAME INDCARD LEAF ELEAF LVLS NDEL KEYS ...F4 F5 F6 F7 F8 REORG ------------------------------------------------------------------------------------------------Table: INST411.ACCTIndex: INST411.ACCTGRP 1000000 3760 0 3 0 1000000 . 100 102 5 0 0 *---- Index: INST411.ACCTINDX 1000000 9175 0 3 0 1000000 . 1 90 2 0 0 ----- --------------------------------------------------------------------------------------------
Now the ACCT table is very clustered when accessed using the ACCTGRP index. In this example the ACCTINDX index is not clustered, but in most cases the clustering for non-clustered indexes is unpredictable.
__ 6. Use db2batch to collect new performance statistics for the same SQL statements in the file batch1.sql. Use an optimization level of 5 and generate explain data for each query. Save the output to a file batch3.out.
In the terminal session, issue the command:
db2batch -d tp1 -f batch1.sql -i complete -o o 5 e 2 > batch3.out
Course materials may not be reproduced in whole or in part without the prior written permission of IBM.
© Copyright IBM Corp. 2001, 2006 Exercise 9. Using DB2 Utilities for Performance 9-7
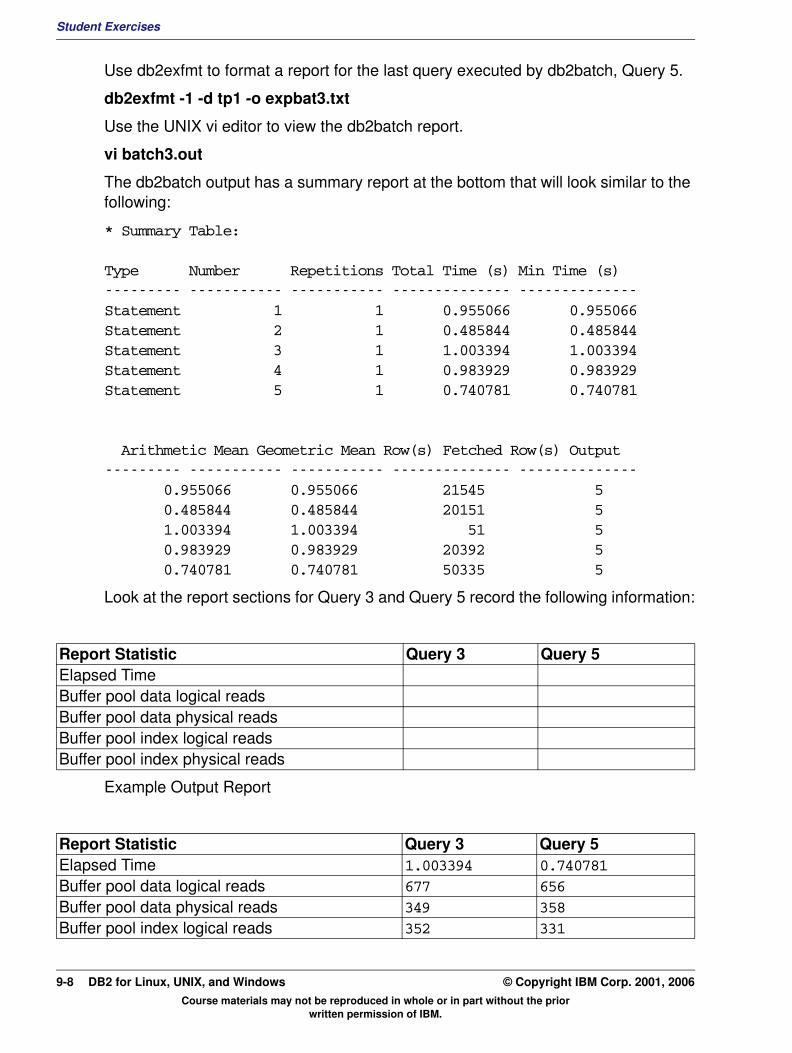
Student Exercises
Use db2exfmt to format a report for the last query executed by db2batch, Query 5.
db2exfmt -1 -d tp1 -o expbat3.txt
Use the UNIX vi editor to view the db2batch report.
vi batch3.out
The db2batch output has a summary report at the bottom that will look similar to the following:
* Summary Table:
Type Number Repetitions Total Time (s) Min Time (s) --------- ----------- ----------- -------------- -------------- Statement 1 1 0.955066 0.955066 Statement 2 1 0.485844 0.485844 Statement 3 1 1.003394 1.003394 Statement 4 1 0.983929 0.983929 Statement 5 1 0.740781 0.740781
Arithmetic Mean Geometric Mean Row(s) Fetched Row(s) Output--------- ----------- ----------- -------------- -------------- 0.955066 0.955066 21545 5 0.485844 0.485844 20151 5 1.003394 1.003394 51 5 0.983929 0.983929 20392 5 0.740781 0.740781 50335 5
Look at the report sections for Query 3 and Query 5 record the following information:
Example Output Report
Report Statistic Query 3 Query 5 Elapsed Time Buffer pool data logical reads Buffer pool data physical reads Buffer pool index logical reads Buffer pool index physical reads
Report Statistic Query 3 Query 5 Elapsed Time 1.003394 0.740781 Buffer pool data logical reads 677 656 Buffer pool data physical reads 349 358 Buffer pool index logical reads 352 331
Course materials may not be reproduced in whole or in part without the prior written permission of IBM.
9-8 DB2 for Linux, UNIX, and Windows © Copyright IBM Corp. 2001, 2006
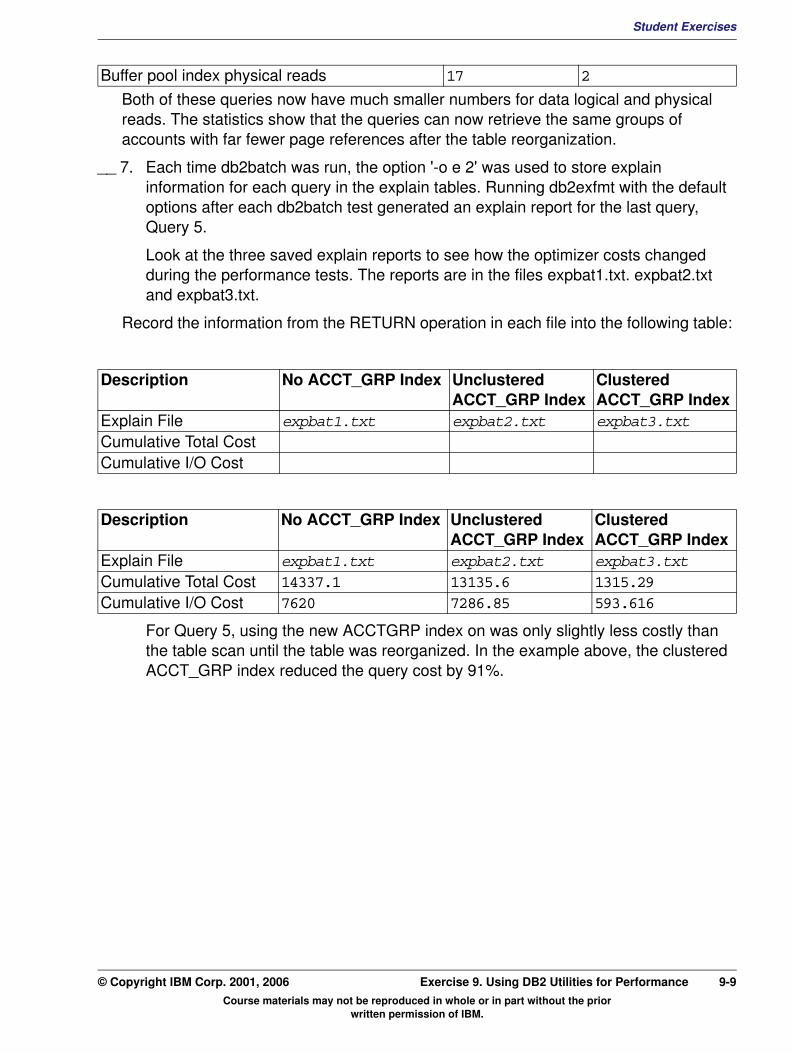
Student ExercisesV3.1.0.1
EXempty
Both of these queries now have much smaller numbers for data logical and physical reads. The statistics show that the queries can now retrieve the same groups of accounts with far fewer page references after the table reorganization.
__ 7. Each time db2batch was run, the option '-o e 2' was used to store explain information for each query in the explain tables. Running db2exfmt with the default options after each db2batch test generated an explain report for the last query, Query 5.
Look at the three saved explain reports to see how the optimizer costs changed during the performance tests. The reports are in the files expbat1.txt. expbat2.txt and expbat3.txt.
Record the information from the RETURN operation in each file into the following table:
For Query 5, using the new ACCTGRP index on was only slightly less costly than the table scan until the table was reorganized. In the example above, the clustered ACCT_GRP index reduced the query cost by 91%.
Buffer pool index physical reads 17 2
Description No ACCT_GRP Index Unclustered ACCT_GRP Index
Clustered ACCT_GRP Index
Explain File expbat1.txt expbat2.txt expbat3.txt Cumulative Total Cost Cumulative I/O Cost
Description No ACCT_GRP Index Unclustered ACCT_GRP Index
Clustered ACCT_GRP Index
Explain File expbat1.txt expbat2.txt expbat3.txt Cumulative Total Cost 14337.1 13135.6 1315.29Cumulative I/O Cost 7620 7286.85 593.616
Course materials may not be reproduced in whole or in part without the prior written permission of IBM.
© Copyright IBM Corp. 2001, 2006 Exercise 9. Using DB2 Utilities for Performance 9-9
Student Exercises
Section 2 - Using the TABLESAMPLE Option
In this exercise, we're going to use the TABLESAMPLE option of the RUNSTATS utility to collect table statistics using less system resources.
__ 1. The lack of accurate statistics can cause DB2 optimizer to inaccurately estimate query cardinalities and can lead to inefficient access plans. The gathering of table statistics on large tables can consume large amounts of processing and I/O capacity. In some cases, the use of sampling options of the RUNSTATS utility may provide sufficient statistical input to the optimizer at a reduced cost. Drop and recreate the table HIST2, to hold the HISTORY table transactions. The new table will not have any catalog statistics.
In the terminal session, issue the commands:
db2 terminate
db2 deactivate db tp1
db2 CONNECT TO TP1
db2 drop table hist2
db2 -tvf hist2tab.ddl
__ 2. Use db2expln to get estimated cardinality of a query that joins the HIST2 table to the teller table. The query is in the file lab61.sql and contains the following:
SELECT HIST2.BRANCH_ID, TELLER.TELLER_NAME, HIST2.ACCTNAME, HIST2.ACCT_ID, HIST2.BALANCE FROM HIST2 AS HIST2, TELLER AS TELLER WHERE HIST2.TELLER_ID =TELLER.TELLER_ID AND HIST2.BRANCH_ID between 10 and 70 and hist2.teller_id < 200 ORDER BY HIST2.BRANCH_ID ASC, HIST2.ACCT_ID ASC ;
In the terminal session, issue the commands:
db2expln -d tp1 -f lab61.sql -z \; -g -o lab91.txt vi lab91.txt
Find the following:
Estimated Cost = _________________ (718.203186)
Estimated Cardinality = ____________ (6678.733398)
__ 3. Use the RUNSTATS utility with a TABLESAMPLE option to collect statistics on 20% of the pages in the table HIST2. When the RUNSTATS is completed, use db2expln to get updated estimates for query cost and cardinality.
In the terminal session, issue the commands:
db2 CONNECT TO TP1
Course materials may not be reproduced in whole or in part without the prior written permission of IBM.
9-10 DB2 for Linux, UNIX, and Windows © Copyright IBM Corp. 2001, 2006

Student ExercisesV3.1.0.1
EXempty
db2 ' runstats on table inst411.hist2 tablesample system(20) 'db2expln -d tp1 -f lab61.sql -z \; -g -o lab92.txtvi lab92.txt
Find the following:
Estimated Cost = _________________ (1795.181519)
Estimated Cardinality = ____________ (24231.853516)
__ 4. Use the db2batch to get the actual count of rows that would result from running the query lab51.sql.
In the terminal session, issue the command:
db2batch -d tp1 -f lab61.sql -o r 0
The output should include information similar to the following:
* SQL Statement Number 1:
SELECT HIST2.BRANCH_ID, TELLER.TELLER_NAME, HIST2.ACCTNAME, HIST2.ACCT_ID, HIST2.BALANCE FROM HIST2 AS HIST2, TELLER AS TELLER WHERE HIST2.TELLER_ID =TELLER.TELLER_ID AND HIST2.BRANCH_ID between 10 and 70 and hist2.teller_id < 200 ORDER BY HIST2.BRANCH_ID ASC, HIST2.ACCT_ID ASC ;
BRANCH_ID TELLER_NAME ACCTNAME ACCT_ID BALANCE --------- -------------------- -------------------- ----------- -----------------
* 22945 row(s) fetched, 0 row(s) output.
* Elapsed Time is: 1.886950 seconds
Find the following:
Number of rows retrieved = ________________ (22945)
In the example above the actual count of 22,945 is about 5% less than the optimizer's estimate with the sampled statistics, but 344% larger than the estimate without statistics.
__ 5. Close all the applications now and deactivate the TP1 database.
In the terminal session, issue the commands:
db2 terminate db2 force application all db2 deactivate db tp1
END OF EXERCISE
Course materials may not be reproduced in whole or in part without the prior written permission of IBM.
© Copyright IBM Corp. 2001, 2006 Exercise 9. Using DB2 Utilities for Performance 9-11

Student Exercises
Course materials may not be reproduced in whole or in part without the prior written permission of IBM.
9-12 DB2 for Linux, UNIX, and Windows © Copyright IBM Corp. 2001, 2006

Student ExercisesV3.1.0.1
EXempty
Exercise 10. Monitoring Database Health and ActivityWhat This Exercise Is About
This exercise is an online lab which allows the student to use the DB2 Health Center and Activity Monitor tools to view the status of an active DB2 database.
What You Should Be Able to Do
At the end of the lab, you should be able to:
• Use the DB2 Health Center to check an active DB2 database for alert status indicators and get recommendations for actions to take if an alert condition occurs.
• Use the DB2 GET HEALTH SNAPSHOT command to view various health indicators for DB2 databases and table spaces.
• Use the Activity Monitor to report on the statistics for the Dynamic SQL statement cache and for current SQL activity.
Course materials may not be reproduced in whole or in part without the prior written permission of IBM.
© Copyright IBM Corp. 2001, 2006 Exercise 10. Monitoring Database Health and Activity 10-1
Student Exercises
Exercise Instructions
Introduction
In this exercise, you will be using the Health Center, Activity Monitor tools to view the status of an active DB2 database.
First, the DB2BATCH utility will be used to run several queries that perform large sort operations. The large sorts will cause overflows of the sortheap. The Health Center will be used to check the status of the TP1 database and show the high percentage of sort heap overflows.
The GET HEALTH SNAPSHOT command will be used to check the health indicators for the TP1 database and for the table spaces in the TP1 database.
The Activity Monitor will be used to examine the dynamic SQL statements in the database package cache after db2batch is used to run a series of queries.
Note: The examples are shown to help you locate the information, the statistics and other contents in your reports and may vary from the values shown.
Course materials may not be reproduced in whole or in part without the prior written permission of IBM.
10-2 DB2 for Linux, UNIX, and Windows © Copyright IBM Corp. 2001, 2006
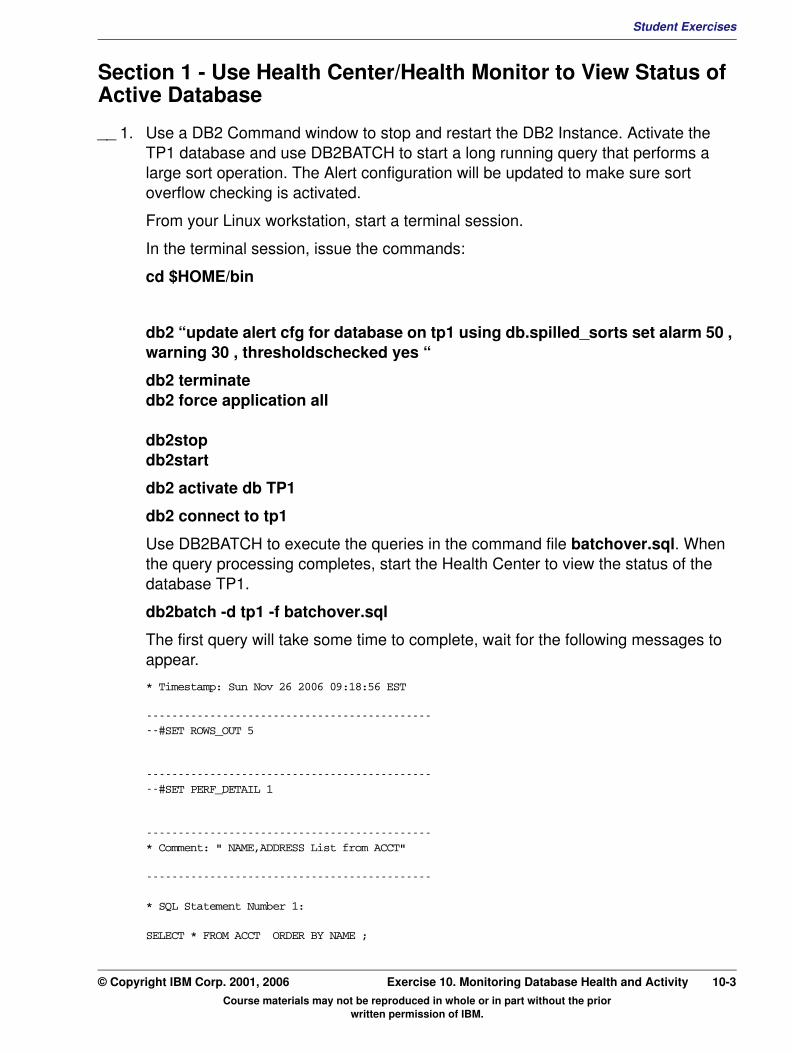
Student ExercisesV3.1.0.1
EXempty
Section 1 - Use Health Center/Health Monitor to View Status of Active Database__ 1. Use a DB2 Command window to stop and restart the DB2 Instance. Activate the TP1 database and use DB2BATCH to start a long running query that performs a large sort operation. The Alert configuration will be updated to make sure sort overflow checking is activated.
From your Linux workstation, start a terminal session.
In the terminal session, issue the commands:
cd $HOME/bin
db2 “update alert cfg for database on tp1 using db.spilled_sorts set alarm 50 , warning 30 , thresholdschecked yes “
db2 terminatedb2 force application all
db2stop db2start
db2 activate db TP1
db2 connect to tp1
Use DB2BATCH to execute the queries in the command file batchover.sql. When the query processing completes, start the Health Center to view the status of the database TP1.
db2batch -d tp1 -f batchover.sql
The first query will take some time to complete, wait for the following messages to appear.
* Timestamp: Sun Nov 26 2006 09:18:56 EST
-----------------------------------------------#SET ROWS_OUT 5
-----------------------------------------------#SET PERF_DETAIL 1
---------------------------------------------* Comment: " NAME,ADDRESS List from ACCT"
---------------------------------------------
* SQL Statement Number 1:
SELECT * FROM ACCT ORDER BY NAME ;
Course materials may not be reproduced in whole or in part without the prior written permission of IBM.
© Copyright IBM Corp. 2001, 2006 Exercise 10. Monitoring Database Health and Activity 10-3

Student Exercises
ACCT_ID NAME ACCT_GRP BALANCE ADDRESS TEMP ----------- -------------------- -------- ----------------- ------------------------------ ---------------------------------------- 1666 <--20 BYTE STRING--> 0 10000.00 <------ 30 BYTE STRING ------> <----------- 40 BYTE STRING -----------> 3127 <--20 BYTE STRING--> 0 10100.00 <------ 30 BYTE STRING ------> <----------- 40 BYTE STRING -----------> 4112 <--20 BYTE STRING--> 0 10000.00 <------ 30 BYTE STRING ------> <----------- 40 BYTE STRING -----------> 7480 <--20 BYTE STRING--> 0 10000.00 <------ 30 BYTE STRING ------> <----------- 40 BYTE STRING -----------> 8681 <--20 BYTE STRING--> 0 10000.00 <------ 30 BYTE STRING ------> <----------- 40 BYTE STRING ----------->
* 1000000 row(s) fetched, 5 row(s) output.
* Elapsed Time is: 9.299213 seconds
---------------------------------------------
* SQL Statement Number 2:
SELECT * FROM ACCT ORDER BY NAME desc ;
ACCT_ID NAME ACCT_GRP BALANCE ADDRESS TEMP ----------- -------------------- -------- ----------------- ------------------------------ ---------------------------------------- 1666 <--20 BYTE STRING--> 0 10000.00 <------ 30 BYTE STRING ------> <----------- 40 BYTE STRING -----------> 3127 <--20 BYTE STRING--> 0 10100.00 <------ 30 BYTE STRING ------> <----------- 40 BYTE STRING -----------> 4112 <--20 BYTE STRING--> 0 10000.00 <------ 30 BYTE STRING ------> <----------- 40 BYTE STRING -----------> 7480 <--20 BYTE STRING--> 0 10000.00 <------ 30 BYTE STRING ------> <----------- 40 BYTE STRING -----------> 8681 <--20 BYTE STRING--> 0 10000.00 <------ 30 BYTE STRING ------> <----------- 40 BYTE STRING ----------->
* 1000000 row(s) fetched, 5 row(s) output.
* Elapsed Time is: 8.841624 seconds
* Summary Table:
Type Number Repetitions Total Time (s) Min Time (s) Max Time (s) Arithmetic Mean Geometric Mean Row(s) Fetched Row(s) Output--------- ----------- ----------- -------------- -------------- -------------- --------------- -------------- -------------- -------------Statement 1 1 9.299213 9.299213 9.299213 9.299213 9.299213 1000000 5Statement 2 1 8.841624 8.841624 8.841624 8.841624 8.841624 1000000 5
* Total Entries: 2* Total Time: 18.140837 seconds* Minimum Time: 8.841624 seconds* Maximum Time: 9.299213 seconds* Arithmetic Mean Time: 9.070419 seconds* Geometric Mean Time: 9.067532 seconds---------------------------------------------
Course materials may not be reproduced in whole or in part without the prior written permission of IBM.
10-4 DB2 for Linux, UNIX, and Windows © Copyright IBM Corp. 2001, 2006

Student ExercisesV3.1.0.1
EXempty
* Timestamp: Sun Nov 26 2006 09:19:15 EST__ 2. Start the DB2 Health Center to show the status of the TP1 database.
Start a second terminal session for running the DB2 Health Center by issuing the following command:
db2hc
Expand the Instance inst411 to show the TP1 Database.
Set the Refresh time in the upper right hand corner to 1 Minute.
Wait for the Health Center to detect the sort overflow status for the TP1 database.
When the sort overflow indicator is detected by the Health Center, it will be shown similar to the following example.
Since the DB2BATCH processing was the only application that has executed since the TP1 database became active, the status for Percentage of Sorts That Overflowed is high, and an alarm is indicated.
__ 3. Use the GET SNAPSHOT FOR HEALTH command to retrieve the status of all of the DB2 Health indicators for the TP1 database.
Course materials may not be reproduced in whole or in part without the prior written permission of IBM.
© Copyright IBM Corp. 2001, 2006 Exercise 10. Monitoring Database Health and Activity 10-5
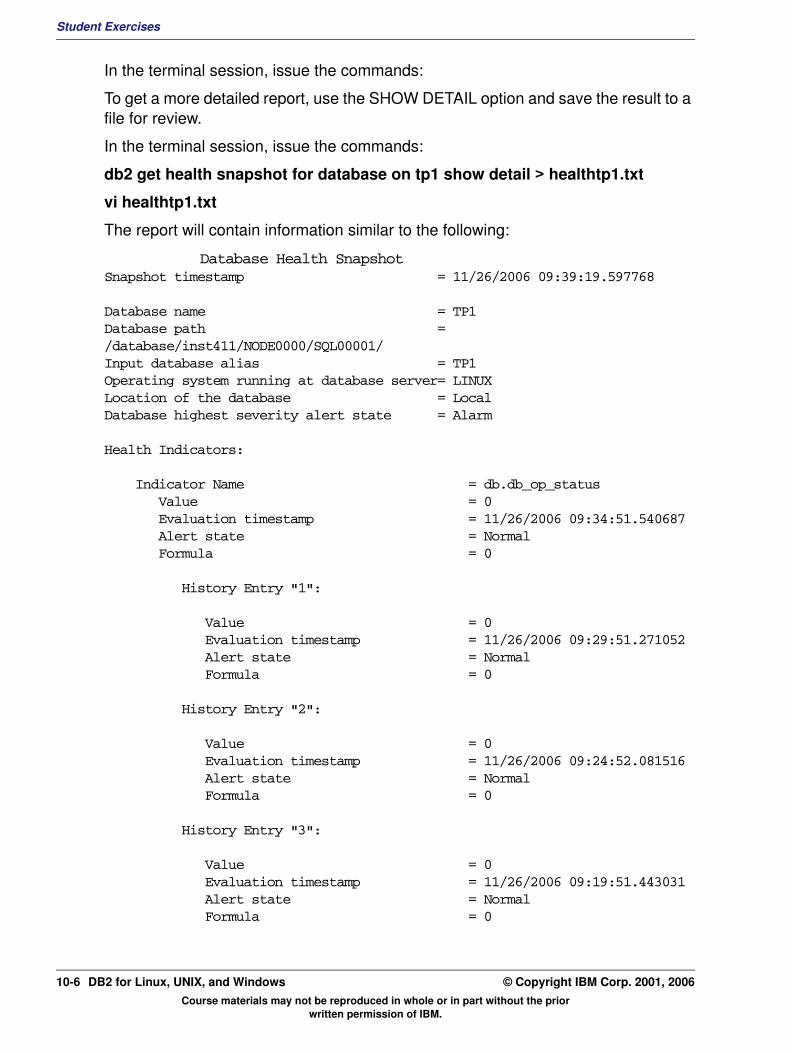
Student Exercises
In the terminal session, issue the commands:
To get a more detailed report, use the SHOW DETAIL option and save the result to a file for review.
In the terminal session, issue the commands:
db2 get health snapshot for database on tp1 show detail > healthtp1.txt
vi healthtp1.txt
The report will contain information similar to the following:
Database Health SnapshotSnapshot timestamp = 11/26/2006 09:39:19.597768
Database name = TP1Database path = /database/inst411/NODE0000/SQL00001/Input database alias = TP1Operating system running at database server= LINUXLocation of the database = LocalDatabase highest severity alert state = Alarm
Health Indicators:
Indicator Name = db.db_op_status Value = 0 Evaluation timestamp = 11/26/2006 09:34:51.540687 Alert state = Normal Formula = 0
History Entry "1":
Value = 0 Evaluation timestamp = 11/26/2006 09:29:51.271052 Alert state = Normal Formula = 0
History Entry "2":
Value = 0 Evaluation timestamp = 11/26/2006 09:24:52.081516 Alert state = Normal Formula = 0
History Entry "3":
Value = 0 Evaluation timestamp = 11/26/2006 09:19:51.443031 Alert state = Normal Formula = 0
Course materials may not be reproduced in whole or in part without the prior written permission of IBM.
10-6 DB2 for Linux, UNIX, and Windows © Copyright IBM Corp. 2001, 2006
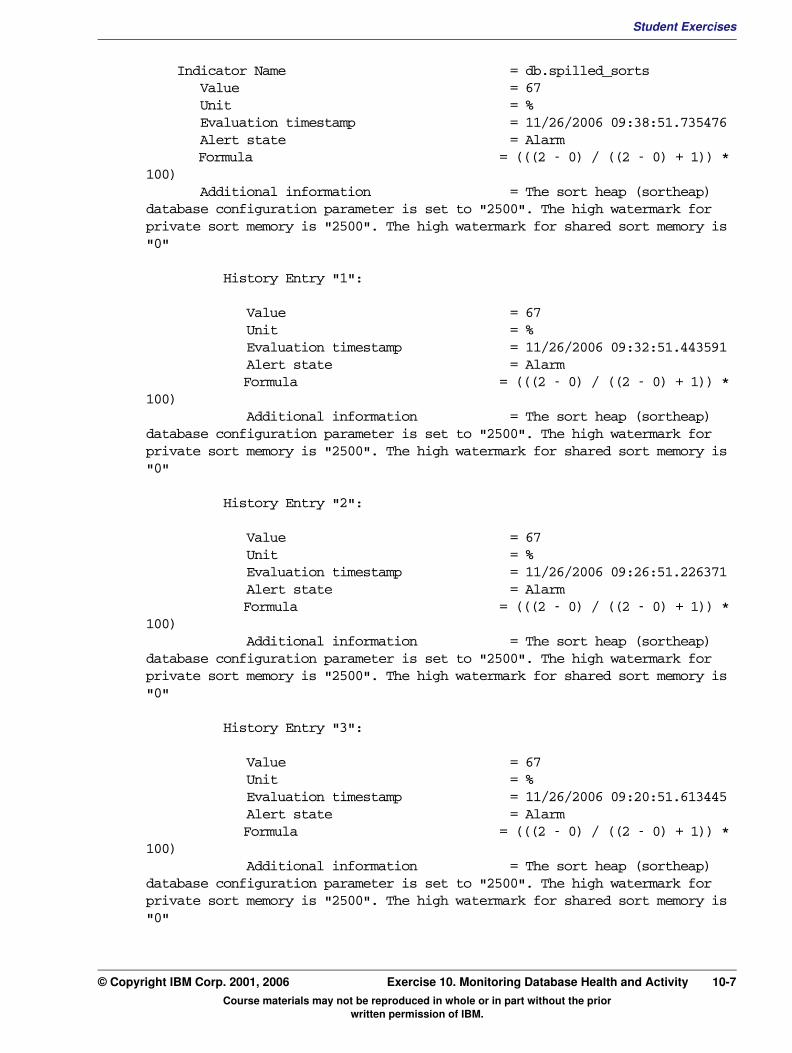
Student ExercisesV3.1.0.1
EXempty
Indicator Name = db.spilled_sorts Value = 67 Unit = % Evaluation timestamp = 11/26/2006 09:38:51.735476 Alert state = Alarm Formula = (((2 - 0) / ((2 - 0) + 1)) * 100) Additional information = The sort heap (sortheap) database configuration parameter is set to "2500". The high watermark for private sort memory is "2500". The high watermark for shared sort memory is "0"History Entry "1":
Value = 67 Unit = % Evaluation timestamp = 11/26/2006 09:32:51.443591 Alert state = Alarm Formula = (((2 - 0) / ((2 - 0) + 1)) * 100) Additional information = The sort heap (sortheap) database configuration parameter is set to "2500". The high watermark for private sort memory is "2500". The high watermark for shared sort memory is "0"
History Entry "2":
Value = 67 Unit = % Evaluation timestamp = 11/26/2006 09:26:51.226371 Alert state = Alarm Formula = (((2 - 0) / ((2 - 0) + 1)) * 100) Additional information = The sort heap (sortheap) database configuration parameter is set to "2500". The high watermark for private sort memory is "2500". The high watermark for shared sort memory is "0"
History Entry "3":
Value = 67 Unit = % Evaluation timestamp = 11/26/2006 09:20:51.613445 Alert state = Alarm Formula = (((2 - 0) / ((2 - 0) + 1)) * 100) Additional information = The sort heap (sortheap) database configuration parameter is set to "2500". The high watermark for private sort memory is "2500". The high watermark for shared sort memory is "0"
Course materials may not be reproduced in whole or in part without the prior written permission of IBM.
© Copyright IBM Corp. 2001, 2006 Exercise 10. Monitoring Database Health and Activity 10-7
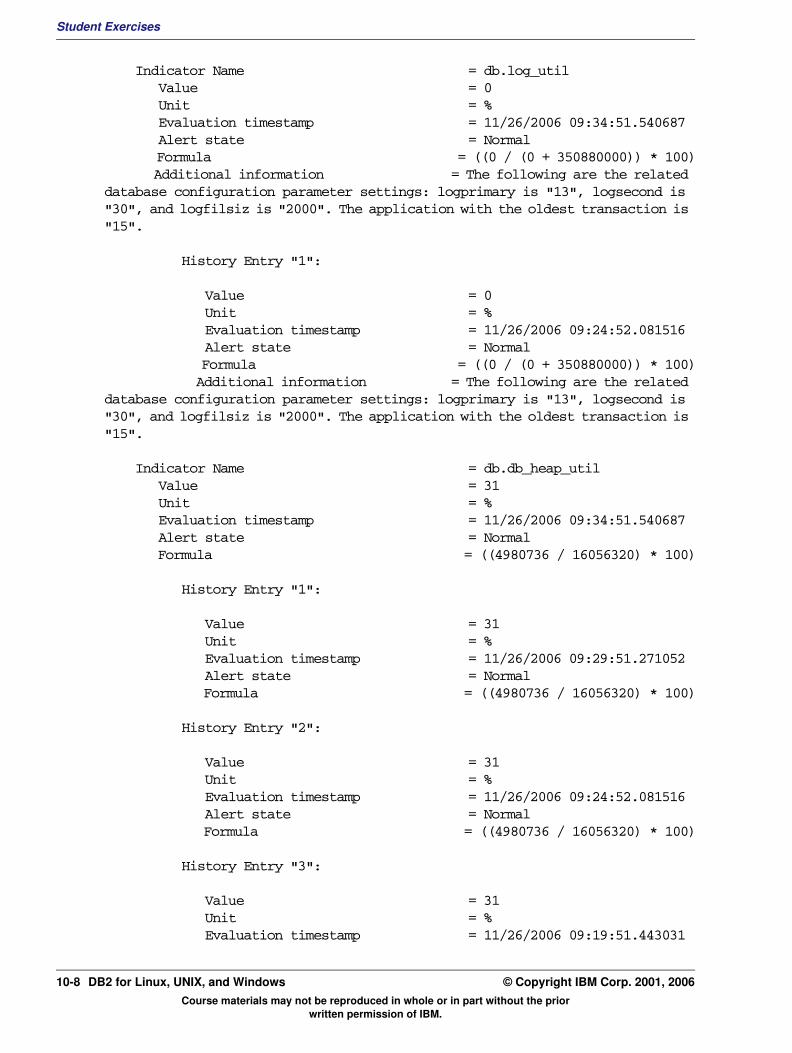
Student Exercises
Indicator Name = db.log_util Value = 0 Unit = % Evaluation timestamp = 11/26/2006 09:34:51.540687 Alert state = Normal Formula = ((0 / (0 + 350880000)) * 100) Additional information = The following are the related database configuration parameter settings: logprimary is "13", logsecond is "30", and logfilsiz is "2000". The application with the oldest transaction is "15".
History Entry "1":
Value = 0 Unit = % Evaluation timestamp = 11/26/2006 09:24:52.081516 Alert state = Normal Formula = ((0 / (0 + 350880000)) * 100) Additional information = The following are the related database configuration parameter settings: logprimary is "13", logsecond is "30", and logfilsiz is "2000". The application with the oldest transaction is "15".
Indicator Name = db.db_heap_util Value = 31 Unit = % Evaluation timestamp = 11/26/2006 09:34:51.540687 Alert state = Normal Formula = ((4980736 / 16056320) * 100)
History Entry "1":
Value = 31 Unit = % Evaluation timestamp = 11/26/2006 09:29:51.271052 Alert state = Normal Formula = ((4980736 / 16056320) * 100)
History Entry "2":
Value = 31 Unit = % Evaluation timestamp = 11/26/2006 09:24:52.081516 Alert state = Normal Formula = ((4980736 / 16056320) * 100)
History Entry "3":
Value = 31 Unit = % Evaluation timestamp = 11/26/2006 09:19:51.443031
Course materials may not be reproduced in whole or in part without the prior written permission of IBM.
10-8 DB2 for Linux, UNIX, and Windows © Copyright IBM Corp. 2001, 2006

Student ExercisesV3.1.0.1
EXempty
Alert state = Normal Formula = ((4980736 / 16056320) * 100)Indicator Name = db.auto_storage_util Value = 13 Unit = % Evaluation timestamp = 11/26/2006 09:34:51.540687 Alert state = Normal Formula = ((7428030464 / 56905404416) * 100) Additional information = The short term growth rate at which space is filling up on the database storage path filesystems from "11/26/2006 08:34:51.000540" to "11/26/2006 09:34:51.000540" is "N/A" bytes per second and the long term growth rate from "11/25/2006 09:34:51.000540" to "11/26/2006 09:34:51.000540" is "N/A" bytes per second. Time to fullness is projected to be "N/A" and "N/A" respectively.
History Entry "1":
Value = 13 Unit = % Evaluation timestamp = 11/26/2006 09:24:52.081516 Alert state = Normal Formula = ((7427743744 / 56905404416) * 100) Additional information = The short term growth rate at which space is filling up on the database storage path filesystems from "11/26/2006 08:24:52.000081" to "11/26/2006 09:24:52.000081" is "N/A" bytes per second and the long term growth rate from "11/25/2006 09:24:52.000081" to "11/26/2006 09:24:52.000081" is "N/A" bytes per second. Time to fullness is projected to be "N/A" and "N/A" respectively.
__ 4. Use the Health Center to view the recommended actions for the sort overflow condition.
Select the health indicator Percentage of Sorts that Overflowed.
Course materials may not be reproduced in whole or in part without the prior written permission of IBM.
© Copyright IBM Corp. 2001, 2006 Exercise 10. Monitoring Database Health and Activity 10-9

Student Exercises
Use the menu options Selected with Show Details.
Close the Health Center now.
__ 5. Use the GET SNAPSHOT FOR HEALTH command to retrieve the Health status of all of the table spaces the TP1 database.
In the terminal session, issue the command:
db2 get health snapshot for tablespaces on tp1 | more
The output will look similar to the following:
Tablespace Health SnapshotSnapshot timestamp = 11/26/2006 09:41:29.829912Database name = TP1Database path = /database/inst411/NODE0000/SQL00001/Input database alias = TP1Number of accessed tablespaces = 9
Tablespace name = SYSCATSPACETablespace highest severity alert state = Normal
Course materials may not be reproduced in whole or in part without the prior written permission of IBM.
10-10 DB2 for Linux, UNIX, and Windows © Copyright IBM Corp. 2001, 2006

Student ExercisesV3.1.0.1
EXempty
Health Indicators:Indicator Name = ts.ts_op_status Value = 0 Evaluation timestamp = 11/26/2006 09:34:51.540687 Alert state = Normal
Indicator Name = ts.ts_auto_resize_status Value = 0 Evaluation timestamp = 11/26/2006 09:34:51.540687 Alert state = Normal
Number of containers = 2
Container Name = /dbauto/path1/inst411/NODE0000/TP1/T0000000/C0000001.CAT
Health Indicators:
Indicator Name = tsc.tscont_op_status Value = 1 Evaluation timestamp = 11/26/2006 09:34:51.540687 Alert state = Normal
Container Name = /dbauto/path2/inst411/NODE0000/TP1/T0000000/C0000000.CAT
Health Indicators:
Indicator Name = tsc.tscont_op_status Value = 1 Evaluation timestamp = 11/26/2006 09:34:51.540687 Alert state = Normal
Tablespace name = SYSTOOLSPACETablespace highest severity alert state = Normal
Health Indicators:
Indicator Name = ts.ts_op_status Value = 0 Evaluation timestamp = 11/26/2006 09:34:51.540687 Alert state = Normal
Indicator Name = ts.ts_auto_resize_status
Course materials may not be reproduced in whole or in part without the prior written permission of IBM.
© Copyright IBM Corp. 2001, 2006 Exercise 10. Monitoring Database Health and Activity 10-11
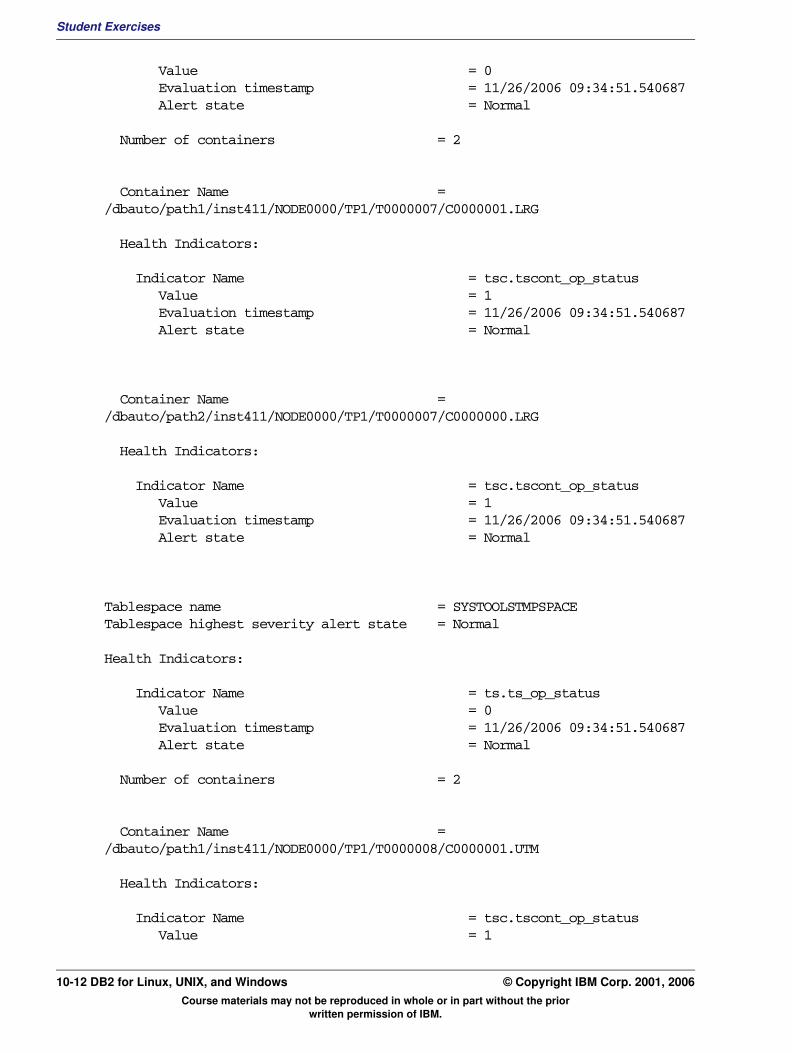
Student Exercises
Value = 0 Evaluation timestamp = 11/26/2006 09:34:51.540687 Alert state = Normal
Number of containers = 2
Container Name = /dbauto/path1/inst411/NODE0000/TP1/T0000007/C0000001.LRG
Health Indicators:
Indicator Name = tsc.tscont_op_status Value = 1 Evaluation timestamp = 11/26/2006 09:34:51.540687 Alert state = Normal
Container Name = /dbauto/path2/inst411/NODE0000/TP1/T0000007/C0000000.LRG
Health Indicators:
Indicator Name = tsc.tscont_op_status Value = 1 Evaluation timestamp = 11/26/2006 09:34:51.540687 Alert state = Normal
Tablespace name = SYSTOOLSTMPSPACETablespace highest severity alert state = Normal
Health Indicators:
Indicator Name = ts.ts_op_status Value = 0 Evaluation timestamp = 11/26/2006 09:34:51.540687 Alert state = Normal
Number of containers = 2
Container Name = /dbauto/path1/inst411/NODE0000/TP1/T0000008/C0000001.UTM
Health Indicators:
Indicator Name = tsc.tscont_op_status Value = 1
Course materials may not be reproduced in whole or in part without the prior written permission of IBM.
10-12 DB2 for Linux, UNIX, and Windows © Copyright IBM Corp. 2001, 2006
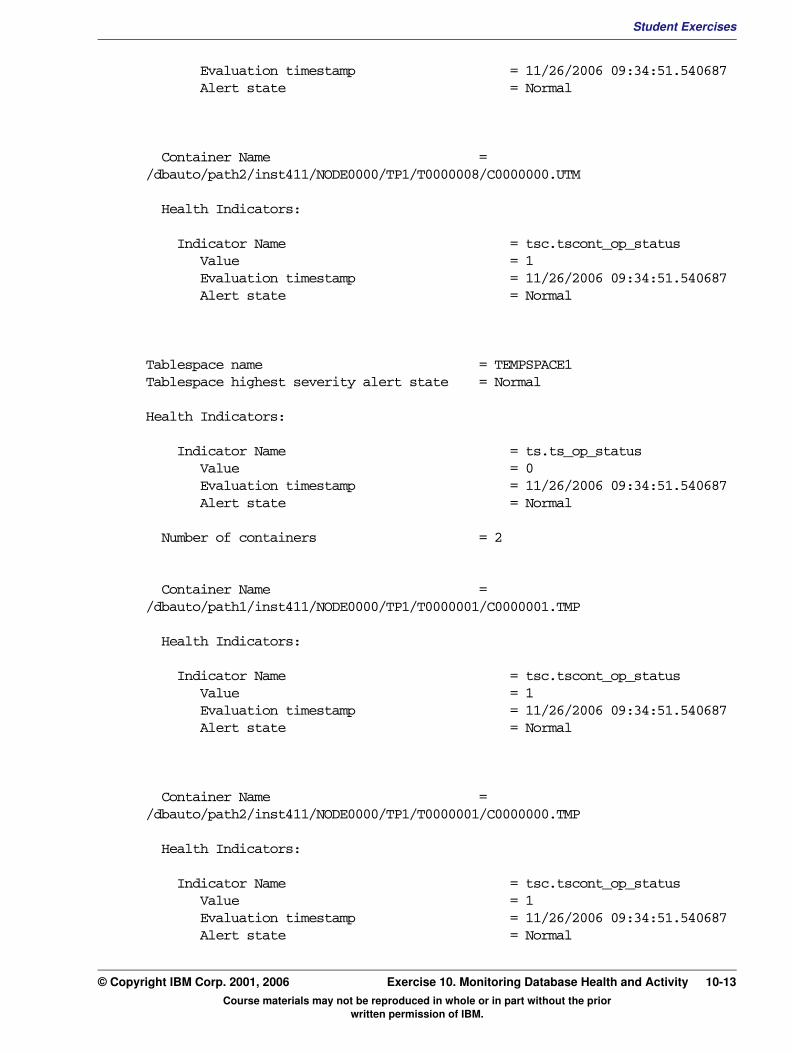
Student ExercisesV3.1.0.1
EXempty
Evaluation timestamp = 11/26/2006 09:34:51.540687 Alert state = NormalContainer Name = /dbauto/path2/inst411/NODE0000/TP1/T0000008/C0000000.UTM
Health Indicators:
Indicator Name = tsc.tscont_op_status Value = 1 Evaluation timestamp = 11/26/2006 09:34:51.540687 Alert state = Normal
Tablespace name = TEMPSPACE1Tablespace highest severity alert state = Normal
Health Indicators:
Indicator Name = ts.ts_op_status Value = 0 Evaluation timestamp = 11/26/2006 09:34:51.540687 Alert state = Normal
Number of containers = 2
Container Name = /dbauto/path1/inst411/NODE0000/TP1/T0000001/C0000001.TMP
Health Indicators:
Indicator Name = tsc.tscont_op_status Value = 1 Evaluation timestamp = 11/26/2006 09:34:51.540687 Alert state = Normal
Container Name = /dbauto/path2/inst411/NODE0000/TP1/T0000001/C0000000.TMP
Health Indicators:
Indicator Name = tsc.tscont_op_status Value = 1 Evaluation timestamp = 11/26/2006 09:34:51.540687 Alert state = Normal
Course materials may not be reproduced in whole or in part without the prior written permission of IBM.
© Copyright IBM Corp. 2001, 2006 Exercise 10. Monitoring Database Health and Activity 10-13
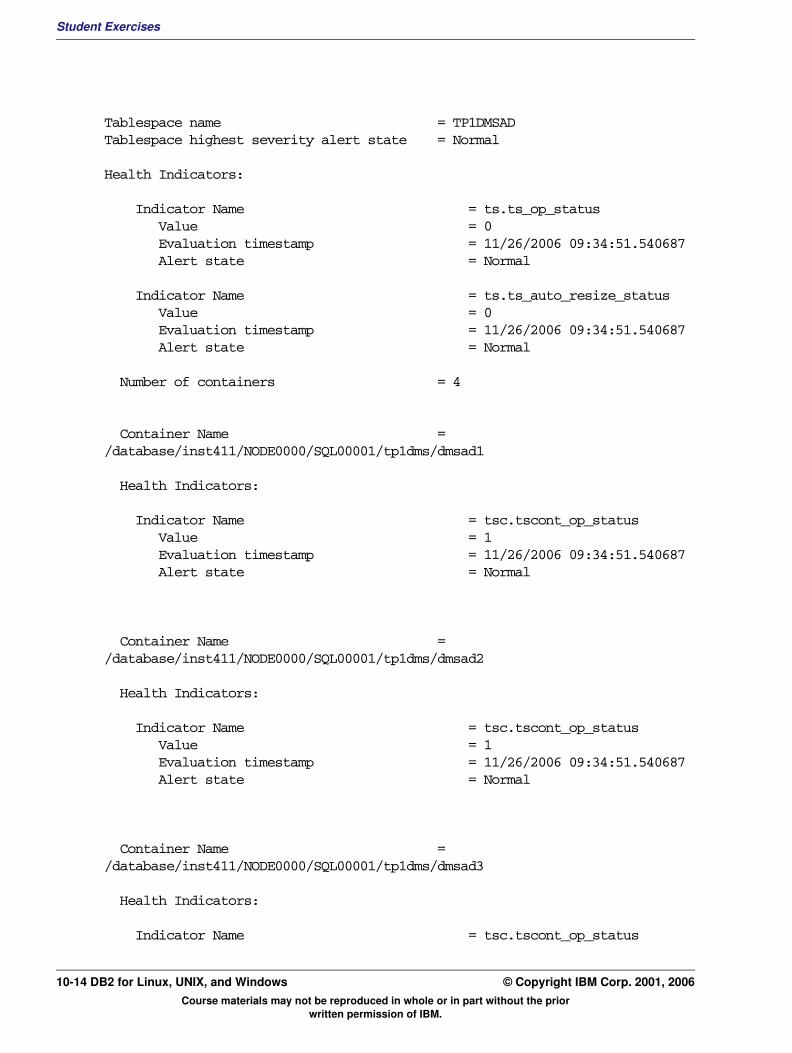
Student Exercises
Tablespace name = TP1DMSADTablespace highest severity alert state = Normal
Health Indicators:
Indicator Name = ts.ts_op_status Value = 0 Evaluation timestamp = 11/26/2006 09:34:51.540687 Alert state = Normal
Indicator Name = ts.ts_auto_resize_status Value = 0 Evaluation timestamp = 11/26/2006 09:34:51.540687 Alert state = Normal
Number of containers = 4
Container Name = /database/inst411/NODE0000/SQL00001/tp1dms/dmsad1
Health Indicators:
Indicator Name = tsc.tscont_op_status Value = 1 Evaluation timestamp = 11/26/2006 09:34:51.540687 Alert state = Normal
Container Name = /database/inst411/NODE0000/SQL00001/tp1dms/dmsad2
Health Indicators:
Indicator Name = tsc.tscont_op_status Value = 1 Evaluation timestamp = 11/26/2006 09:34:51.540687 Alert state = Normal
Container Name = /database/inst411/NODE0000/SQL00001/tp1dms/dmsad3
Health Indicators:
Indicator Name = tsc.tscont_op_status
Course materials may not be reproduced in whole or in part without the prior written permission of IBM.
10-14 DB2 for Linux, UNIX, and Windows © Copyright IBM Corp. 2001, 2006

Student ExercisesV3.1.0.1
EXempty
Value = 1 Evaluation timestamp = 11/26/2006 09:34:51.540687 Alert state = NormalContainer Name = /database/inst411/NODE0000/SQL00001/tp1dms/dmsad4
Health Indicators:
Indicator Name = tsc.tscont_op_status Value = 1 Evaluation timestamp = 11/26/2006 09:34:51.540687 Alert state = Normal
Tablespace name = TP1DMSAITablespace highest severity alert state = Normal
Health Indicators:
Indicator Name = ts.ts_op_status Value = 0 Evaluation timestamp = 11/26/2006 09:34:51.540687 Alert state = Normal
Indicator Name = ts.ts_auto_resize_status Value = 0 Evaluation timestamp = 11/26/2006 09:34:51.540687 Alert state = Normal
Number of containers = 1
Container Name = /database/inst411/NODE0000/SQL00001/tp1dms/dmsai
Health Indicators:
Indicator Name = tsc.tscont_op_status Value = 1 Evaluation timestamp = 11/26/2006 09:34:51.540687 Alert state = Normal
Tablespace name = TP1DMSHTablespace highest severity alert state = Normal
Course materials may not be reproduced in whole or in part without the prior written permission of IBM.
© Copyright IBM Corp. 2001, 2006 Exercise 10. Monitoring Database Health and Activity 10-15
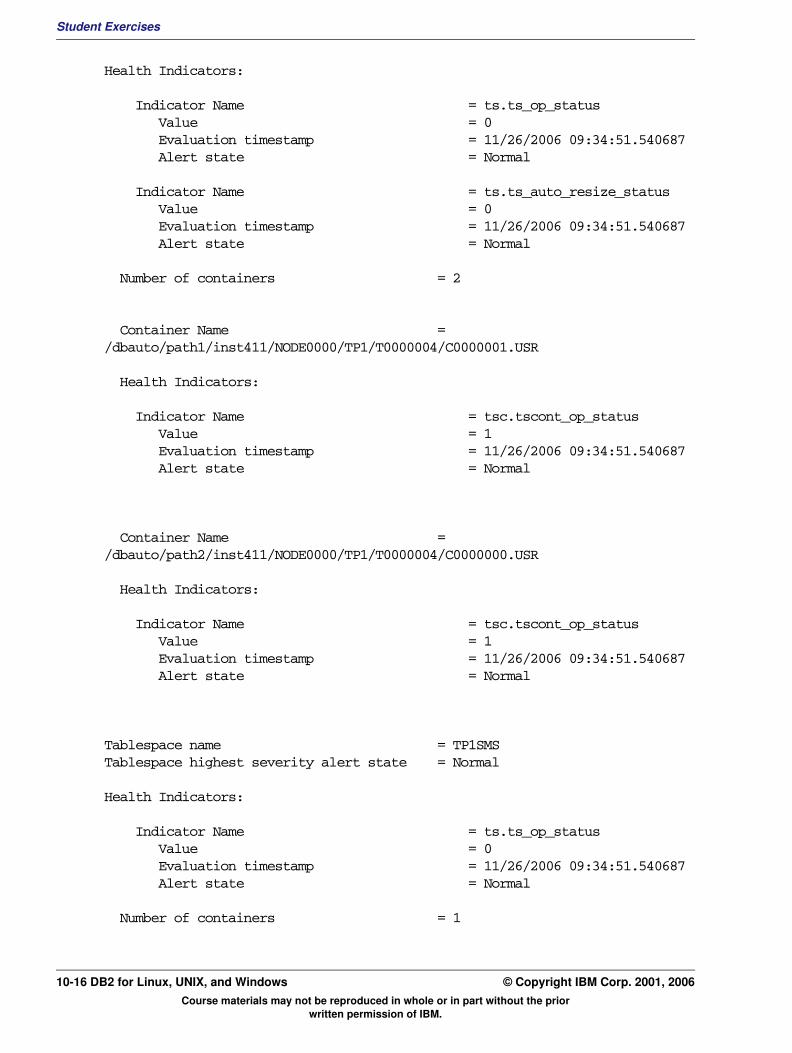
Student Exercises
Health Indicators:
Indicator Name = ts.ts_op_status Value = 0 Evaluation timestamp = 11/26/2006 09:34:51.540687 Alert state = Normal
Indicator Name = ts.ts_auto_resize_status Value = 0 Evaluation timestamp = 11/26/2006 09:34:51.540687 Alert state = Normal
Number of containers = 2
Container Name = /dbauto/path1/inst411/NODE0000/TP1/T0000004/C0000001.USR
Health Indicators:
Indicator Name = tsc.tscont_op_status Value = 1 Evaluation timestamp = 11/26/2006 09:34:51.540687 Alert state = Normal
Container Name = /dbauto/path2/inst411/NODE0000/TP1/T0000004/C0000000.USR
Health Indicators:
Indicator Name = tsc.tscont_op_status Value = 1 Evaluation timestamp = 11/26/2006 09:34:51.540687 Alert state = Normal
Tablespace name = TP1SMSTablespace highest severity alert state = Normal
Health Indicators:
Indicator Name = ts.ts_op_status Value = 0 Evaluation timestamp = 11/26/2006 09:34:51.540687 Alert state = Normal
Number of containers = 1
Course materials may not be reproduced in whole or in part without the prior written permission of IBM.
10-16 DB2 for Linux, UNIX, and Windows © Copyright IBM Corp. 2001, 2006
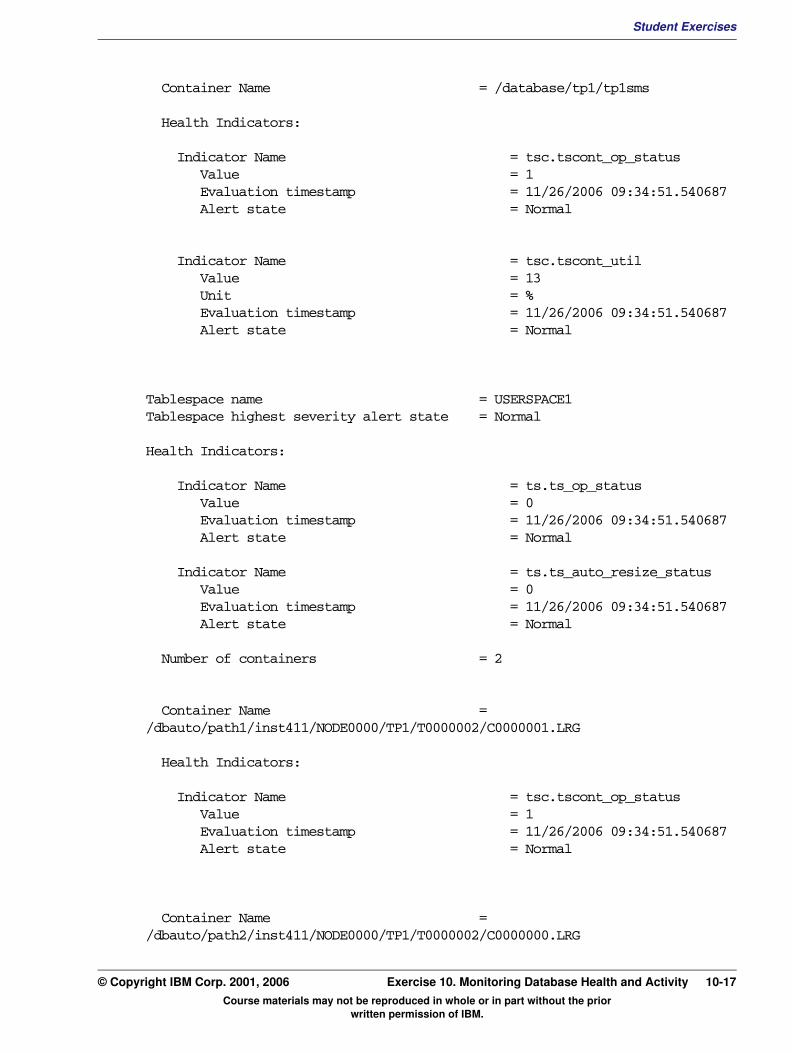
Student ExercisesV3.1.0.1
EXempty
Container Name = /database/tp1/tp1smsHealth Indicators:
Indicator Name = tsc.tscont_op_status Value = 1 Evaluation timestamp = 11/26/2006 09:34:51.540687 Alert state = Normal
Indicator Name = tsc.tscont_util Value = 13 Unit = % Evaluation timestamp = 11/26/2006 09:34:51.540687 Alert state = Normal
Tablespace name = USERSPACE1Tablespace highest severity alert state = Normal
Health Indicators:
Indicator Name = ts.ts_op_status Value = 0 Evaluation timestamp = 11/26/2006 09:34:51.540687 Alert state = Normal
Indicator Name = ts.ts_auto_resize_status Value = 0 Evaluation timestamp = 11/26/2006 09:34:51.540687 Alert state = Normal
Number of containers = 2
Container Name = /dbauto/path1/inst411/NODE0000/TP1/T0000002/C0000001.LRG
Health Indicators:
Indicator Name = tsc.tscont_op_status Value = 1 Evaluation timestamp = 11/26/2006 09:34:51.540687 Alert state = Normal
Container Name = /dbauto/path2/inst411/NODE0000/TP1/T0000002/C0000000.LRG
Course materials may not be reproduced in whole or in part without the prior written permission of IBM.
© Copyright IBM Corp. 2001, 2006 Exercise 10. Monitoring Database Health and Activity 10-17
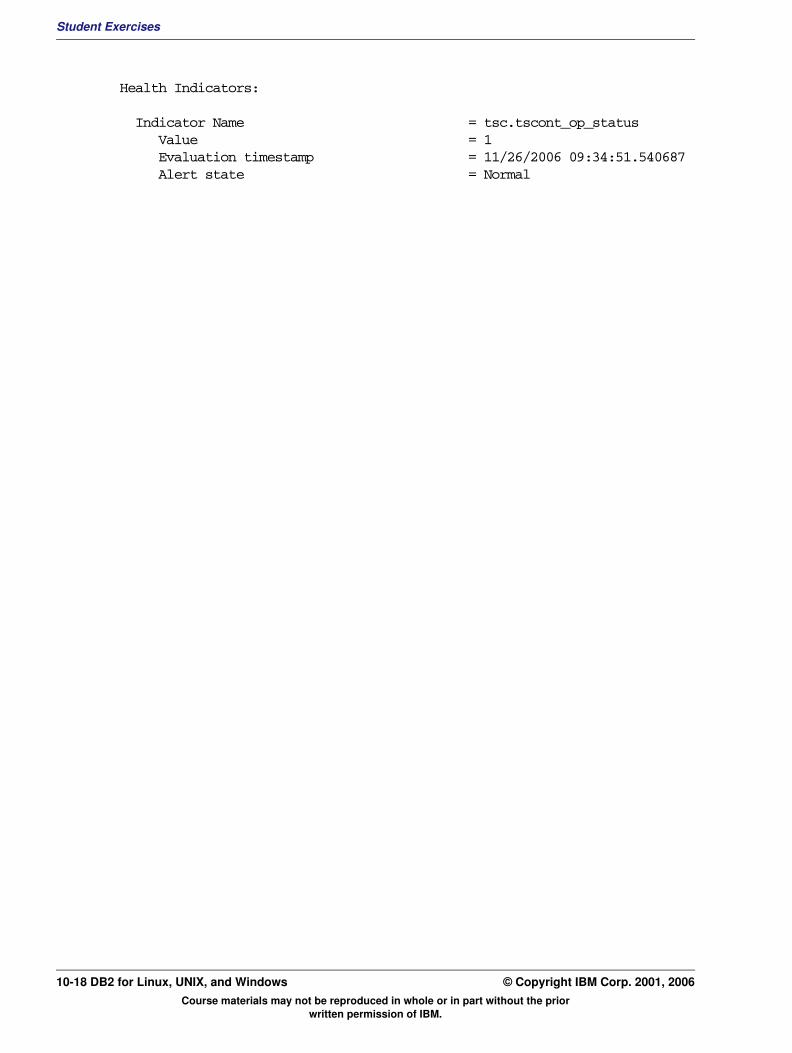
Student Exercises
Health Indicators:
Indicator Name = tsc.tscont_op_status Value = 1 Evaluation timestamp = 11/26/2006 09:34:51.540687 Alert state = Normal
Course materials may not be reproduced in whole or in part without the prior written permission of IBM.
10-18 DB2 for Linux, UNIX, and Windows © Copyright IBM Corp. 2001, 2006
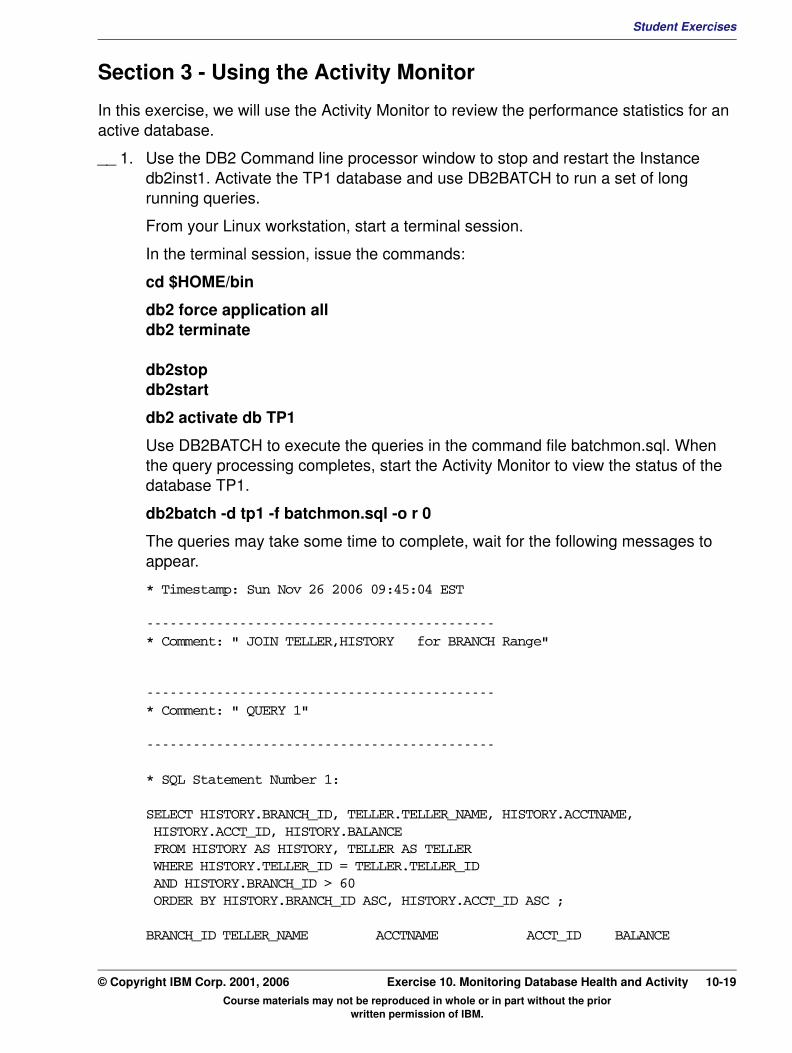
Student ExercisesV3.1.0.1
EXempty
Section 3 - Using the Activity MonitorIn this exercise, we will use the Activity Monitor to review the performance statistics for an active database.
__ 1. Use the DB2 Command line processor window to stop and restart the Instance db2inst1. Activate the TP1 database and use DB2BATCH to run a set of long running queries.
From your Linux workstation, start a terminal session.
In the terminal session, issue the commands:
cd $HOME/bin
db2 force application all db2 terminate
db2stop db2start
db2 activate db TP1
Use DB2BATCH to execute the queries in the command file batchmon.sql. When the query processing completes, start the Activity Monitor to view the status of the database TP1.
db2batch -d tp1 -f batchmon.sql -o r 0
The queries may take some time to complete, wait for the following messages to appear.
* Timestamp: Sun Nov 26 2006 09:45:04 EST
---------------------------------------------* Comment: " JOIN TELLER,HISTORY for BRANCH Range"
---------------------------------------------* Comment: " QUERY 1"
---------------------------------------------
* SQL Statement Number 1:
SELECT HISTORY.BRANCH_ID, TELLER.TELLER_NAME, HISTORY.ACCTNAME, HISTORY.ACCT_ID, HISTORY.BALANCE FROM HISTORY AS HISTORY, TELLER AS TELLER WHERE HISTORY.TELLER_ID = TELLER.TELLER_ID AND HISTORY.BRANCH_ID > 60 ORDER BY HISTORY.BRANCH_ID ASC, HISTORY.ACCT_ID ASC ;
BRANCH_ID TELLER_NAME ACCTNAME ACCT_ID BALANCE
Course materials may not be reproduced in whole or in part without the prior written permission of IBM.
© Copyright IBM Corp. 2001, 2006 Exercise 10. Monitoring Database Health and Activity 10-19
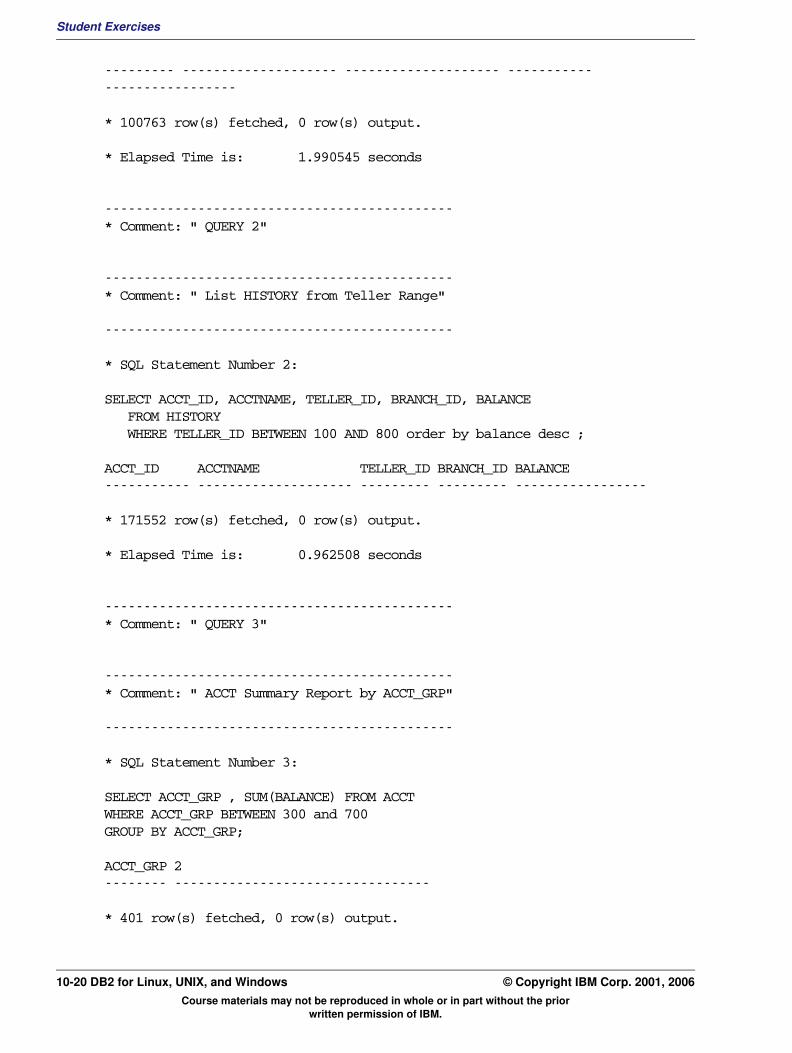
Student Exercises
--------- -------------------- -------------------- ----------- -----------------
* 100763 row(s) fetched, 0 row(s) output.
* Elapsed Time is: 1.990545 seconds
---------------------------------------------* Comment: " QUERY 2"
---------------------------------------------* Comment: " List HISTORY from Teller Range"
---------------------------------------------
* SQL Statement Number 2:
SELECT ACCT_ID, ACCTNAME, TELLER_ID, BRANCH_ID, BALANCE FROM HISTORY WHERE TELLER_ID BETWEEN 100 AND 800 order by balance desc ;
ACCT_ID ACCTNAME TELLER_ID BRANCH_ID BALANCE ----------- -------------------- --------- --------- -----------------
* 171552 row(s) fetched, 0 row(s) output.
* Elapsed Time is: 0.962508 seconds
---------------------------------------------* Comment: " QUERY 3"
---------------------------------------------* Comment: " ACCT Summary Report by ACCT_GRP"
---------------------------------------------
* SQL Statement Number 3:
SELECT ACCT_GRP , SUM(BALANCE) FROM ACCTWHERE ACCT_GRP BETWEEN 300 and 700GROUP BY ACCT_GRP;
ACCT_GRP 2 -------- ---------------------------------
* 401 row(s) fetched, 0 row(s) output.
Course materials may not be reproduced in whole or in part without the prior written permission of IBM.
10-20 DB2 for Linux, UNIX, and Windows © Copyright IBM Corp. 2001, 2006
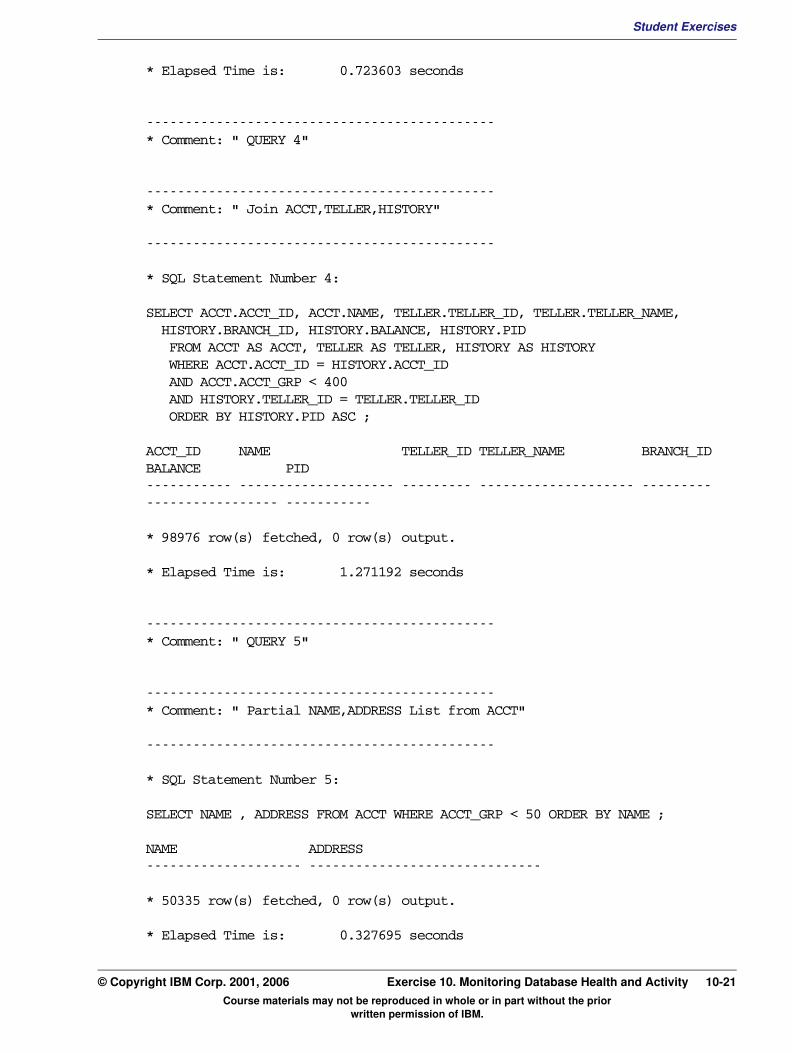
Student ExercisesV3.1.0.1
EXempty
* Elapsed Time is: 0.723603 seconds---------------------------------------------* Comment: " QUERY 4"
---------------------------------------------* Comment: " Join ACCT,TELLER,HISTORY"
---------------------------------------------
* SQL Statement Number 4:
SELECT ACCT.ACCT_ID, ACCT.NAME, TELLER.TELLER_ID, TELLER.TELLER_NAME, HISTORY.BRANCH_ID, HISTORY.BALANCE, HISTORY.PID FROM ACCT AS ACCT, TELLER AS TELLER, HISTORY AS HISTORY WHERE ACCT.ACCT_ID = HISTORY.ACCT_ID AND ACCT.ACCT_GRP < 400 AND HISTORY.TELLER_ID = TELLER.TELLER_ID ORDER BY HISTORY.PID ASC ;
ACCT_ID NAME TELLER_ID TELLER_NAME BRANCH_ID BALANCE PID ----------- -------------------- --------- -------------------- --------- ----------------- -----------
* 98976 row(s) fetched, 0 row(s) output.
* Elapsed Time is: 1.271192 seconds
---------------------------------------------* Comment: " QUERY 5"
---------------------------------------------* Comment: " Partial NAME,ADDRESS List from ACCT"
---------------------------------------------
* SQL Statement Number 5:
SELECT NAME , ADDRESS FROM ACCT WHERE ACCT_GRP < 50 ORDER BY NAME ;
NAME ADDRESS -------------------- ------------------------------
* 50335 row(s) fetched, 0 row(s) output.
* Elapsed Time is: 0.327695 seconds
Course materials may not be reproduced in whole or in part without the prior written permission of IBM.
© Copyright IBM Corp. 2001, 2006 Exercise 10. Monitoring Database Health and Activity 10-21

Student Exercises
---------------------------------------------
* SQL Statement Number 6:
SELECT COUNT(*) FROM HISTORY ;
1 -----------
* 1 row(s) fetched, 0 row(s) output.
* Elapsed Time is: 0.027180 seconds
* Summary Table:
Type Number Repetitions Total Time (s) Min Time (s) Max Time (s) Arithmetic Mean Geometric Mean Row(s) Fetched Row(s) Output--------- ----------- ----------- -------------- -------------- -------------- --------------- -------------- -------------- -------------Statement 1 1 1.990545 1.990545 1.990545 1.990545 1.990545 100763 0Statement 2 1 0.962508 0.962508 0.962508 0.962508 0.962508 171552 0Statement 3 1 0.723603 0.723603 0.723603 0.723603 0.723603 401 0Statement 4 1 1.271192 1.271192 1.271192 1.271192 1.271192 98976 0Statement 5 1 0.327695 0.327695 0.327695 0.327695 0.327695 50335 0Statement 6 1 0.027180 0.027180 0.027180 0.027180 0.027180 1 0
* Total Entries: 6* Total Time: 5.302723 seconds* Minimum Time: 0.027180 seconds* Maximum Time: 1.990545 seconds* Arithmetic Mean Time: 0.883787 seconds* Geometric Mean Time: 0.500381 seconds---------------------------------------------* Timestamp: Sun Nov 26 2006 09:45:10 EST
__ 2. Start the DB2 Activity Monitor to show the status of the TP1 database.
From your Linux workstation, start a terminal session.
In a the terminal session, issue the command:
db2cc
When the Control Center starts, locate and select the TP1 database under All Databases.
In the panel on the bottom right portion of the Control Center, click Activity Monitor.
Select the TP1 Database in the Instance inst411 for monitoring.
Course materials may not be reproduced in whole or in part without the prior written permission of IBM.
10-22 DB2 for Linux, UNIX, and Windows © Copyright IBM Corp. 2001, 2006
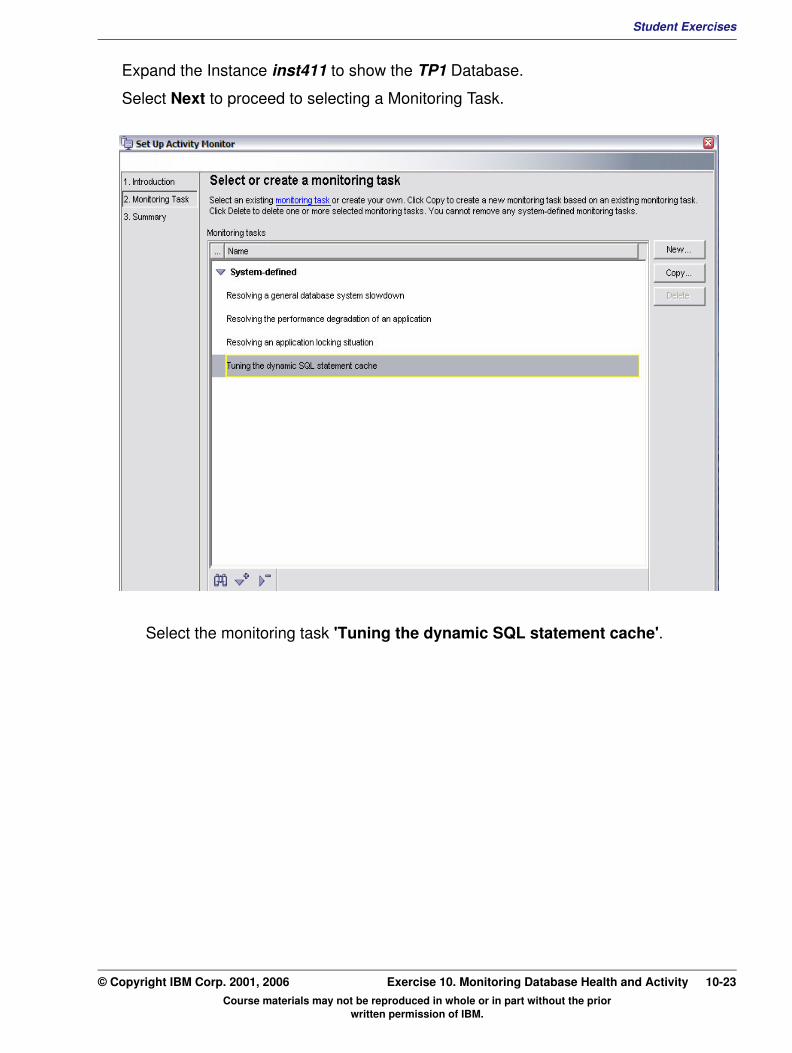
Student ExercisesV3.1.0.1
EXempty
Expand the Instance inst411 to show the TP1 Database.Select Next to proceed to selecting a Monitoring Task.
Select the monitoring task 'Tuning the dynamic SQL statement cache'.
Course materials may not be reproduced in whole or in part without the prior written permission of IBM.
© Copyright IBM Corp. 2001, 2006 Exercise 10. Monitoring Database Health and Activity 10-23

Student Exercises
Select Finish.
Select the report 'Dynamic SQL statements in the cache with the largest number of rows read'.
Select the SQL statement at the top of the list and choose the menu option Selected and Explain Query to show the access plan using Visual Explain.
Exit the Activity Monitor and Close the Control Center application.
__ 3. In the terminal session, deactivate the TP1 database now.
In the terminal session, issue the commands:
db2 force application all db2 terminate
db2 deactivate db TP1
END OF EXERCISE
Course materials may not be reproduced in whole or in part without the prior written permission of IBM.
10-24 DB2 for Linux, UNIX, and Windows © Copyright IBM Corp. 2001, 2006

Student ExercisesV3.1.0.1
EXempty
Exercise 11. Application PerformanceWhat This Exercise Is About
This exercise is an online lab which allows the student to analyze the performance impact of using different application development techniques, including Static SQL and Dynamic SQL.
What You Should Be Able to Do
At the end of the lab, you should be able to:
• Use the DB2 GET SNAPSHOT command to collect database statistics for applications using Static and Dynamic SQL.
• Analyze the DB2 database statistics to look for package cache and catalog cache utilization.
• Use the GET SNAPSHOT FOR DYNAMIC SQL report to see the information available about previously executed dynamic SQL statements in the package cache.
• Use the db2pd command to get information about the static and dynamic SQL usage of the package cache and current application locks.
Course materials may not be reproduced in whole or in part without the prior written permission of IBM.
© Copyright IBM Corp. 2001, 2006 Exercise 11. Application Performance 11-1
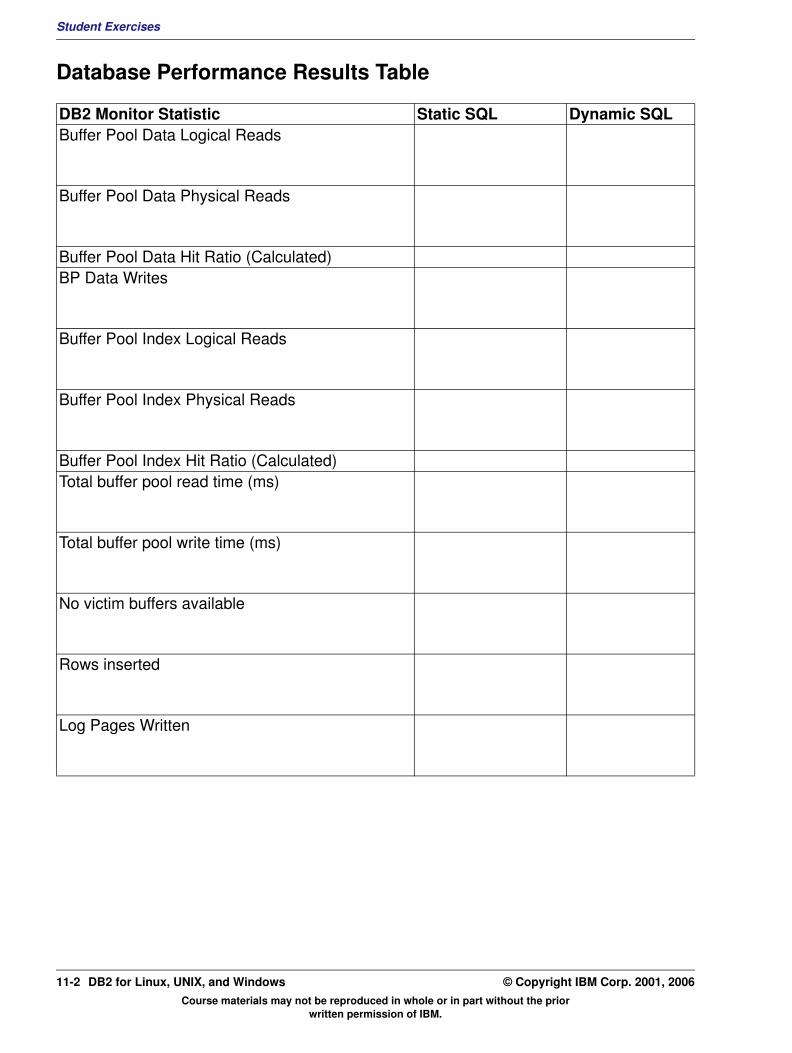
Student Exercises
Database Performance Results Table
DB2 Monitor Statistic Static SQL Dynamic SQL Buffer Pool Data Logical Reads Buffer Pool Data Physical Reads Buffer Pool Data Hit Ratio (Calculated) BP Data Writes Buffer Pool Index Logical Reads Buffer Pool Index Physical Reads Buffer Pool Index Hit Ratio (Calculated) Total buffer pool read time (ms) Total buffer pool write time (ms) No victim buffers available Rows inserted Log Pages Written
Course materials may not be reproduced in whole or in part without the prior written permission of IBM.
11-2 DB2 for Linux, UNIX, and Windows © Copyright IBM Corp. 2001, 2006
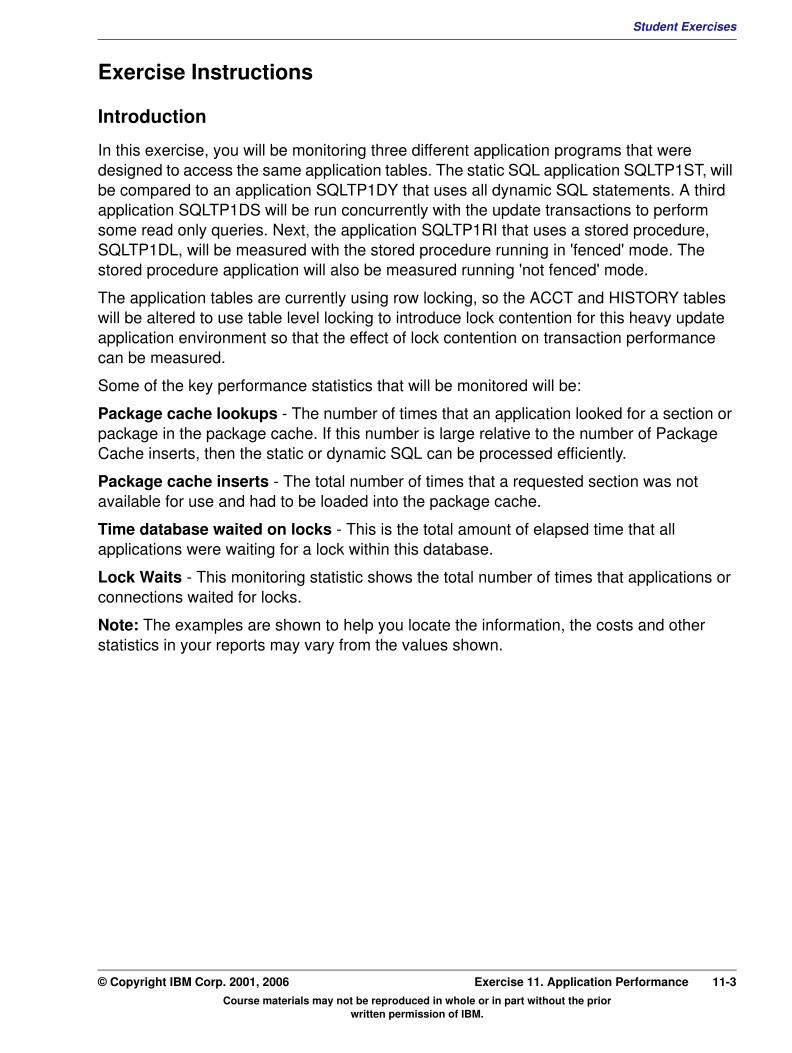
Student ExercisesV3.1.0.1
EXempty
Exercise InstructionsIntroduction
In this exercise, you will be monitoring three different application programs that were designed to access the same application tables. The static SQL application SQLTP1ST, will be compared to an application SQLTP1DY that uses all dynamic SQL statements. A third application SQLTP1DS will be run concurrently with the update transactions to perform some read only queries. Next, the application SQLTP1RI that uses a stored procedure, SQLTP1DL, will be measured with the stored procedure running in 'fenced' mode. The stored procedure application will also be measured running 'not fenced' mode.
The application tables are currently using row locking, so the ACCT and HISTORY tables will be altered to use table level locking to introduce lock contention for this heavy update application environment so that the effect of lock contention on transaction performance can be measured.
Some of the key performance statistics that will be monitored will be:
Package cache lookups - The number of times that an application looked for a section or package in the package cache. If this number is large relative to the number of Package Cache inserts, then the static or dynamic SQL can be processed efficiently.
Package cache inserts - The total number of times that a requested section was not available for use and had to be loaded into the package cache.
Time database waited on locks - This is the total amount of elapsed time that all applications were waiting for a lock within this database.
Lock Waits - This monitoring statistic shows the total number of times that applications or connections waited for locks.
Note: The examples are shown to help you locate the information, the costs and other statistics in your reports may vary from the values shown.
Course materials may not be reproduced in whole or in part without the prior written permission of IBM.
© Copyright IBM Corp. 2001, 2006 Exercise 11. Application Performance 11-3
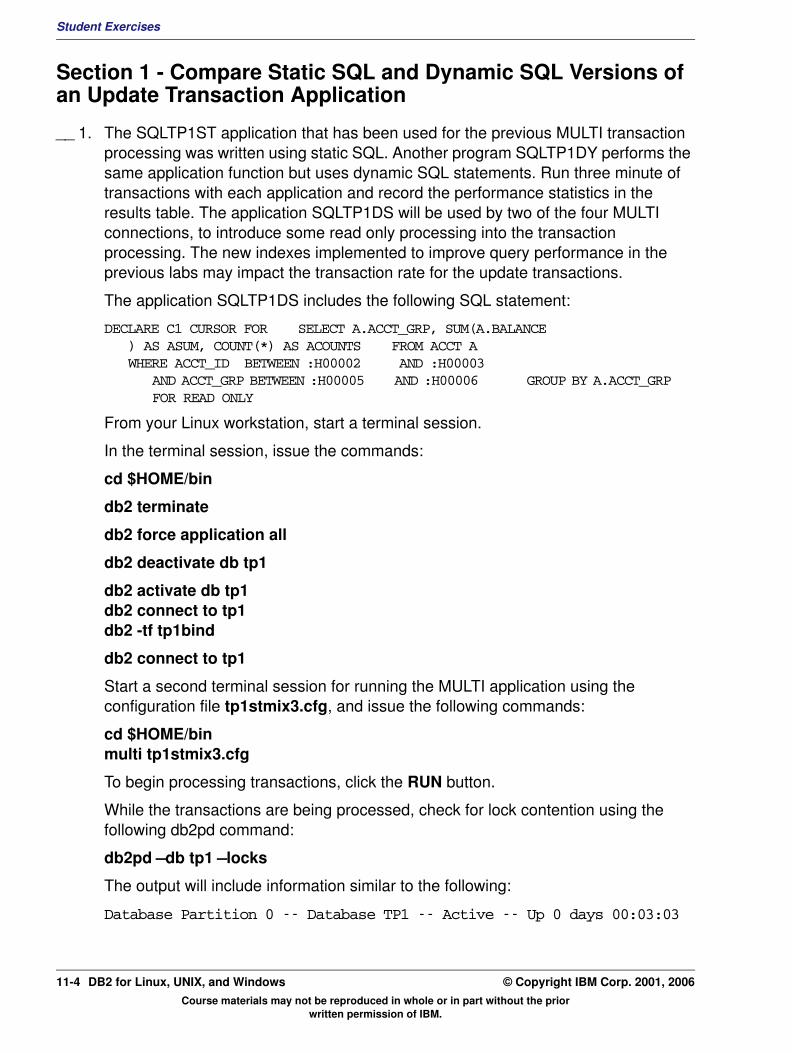
Student Exercises
Section 1 - Compare Static SQL and Dynamic SQL Versions of an Update Transaction Application
__ 1. The SQLTP1ST application that has been used for the previous MULTI transaction processing was written using static SQL. Another program SQLTP1DY performs the same application function but uses dynamic SQL statements. Run three minute of transactions with each application and record the performance statistics in the results table. The application SQLTP1DS will be used by two of the four MULTI connections, to introduce some read only processing into the transaction processing. The new indexes implemented to improve query performance in the previous labs may impact the transaction rate for the update transactions.
The application SQLTP1DS includes the following SQL statement:
DECLARE C1 CURSOR FOR SELECT A.ACCT_GRP, SUM(A.BALANCE) AS ASUM, COUNT(*) AS ACOUNTS FROM ACCT AWHERE ACCT_ID BETWEEN :H00002 AND :H00003
AND ACCT_GRP BETWEEN :H00005 AND :H00006 GROUP BY A.ACCT_GRP FOR READ ONLY
From your Linux workstation, start a terminal session.
In the terminal session, issue the commands:
cd $HOME/bin
db2 terminate
db2 force application all
db2 deactivate db tp1
db2 activate db tp1 db2 connect to tp1 db2 -tf tp1bind
db2 connect to tp1
Start a second terminal session for running the MULTI application using the configuration file tp1stmix3.cfg, and issue the following commands:
cd $HOME/bin multi tp1stmix3.cfg
To begin processing transactions, click the RUN button.
While the transactions are being processed, check for lock contention using the following db2pd command:
db2pd –db tp1 –locks
The output will include information similar to the following:
Database Partition 0 -- Database TP1 -- Active -- Up 0 days 00:03:03
Course materials may not be reproduced in whole or in part without the prior written permission of IBM.
11-4 DB2 for Linux, UNIX, and Windows © Copyright IBM Corp. 2001, 2006

Student ExercisesV3.1.0.1
EXempty
Locks:Address TranHdl Lockname Type Mode Sts Owner 0x13852480 6 030004000D001B000000000052 Row ..X G 6 0x13850960 6 030003001A0000000000000052 Row ..X G 6 0x13851540 6 53514C54503153549C4BE7A241 Internal P ..S G 6 0x13851E70 8 53514C54503153549C4BE7A241 Internal P ..S G 8 0x138509C0 8 03000300110001000000000052 Row ..X G 8 0x13851390 9 53514C54503144530AFBE9E841 Internal P ..S G 9 0x138515D0 7 53514C54503144530AFBE9E841 Internal P ..S G 7 0x13851240 8 040004003D00A2080000000052 Row ..X G 8 0x13852690 6 050004005700511F0000000052 Row ..X G 6 0x138511B0 7 050004005700511F0000000052 Row .NS W 0 0x13850630 6 040004003C00A2080000000052 Row ..X G 6 0x138507B0 8 050004005200BA190000000052 Row ..X G 8 0x13851C30 8 03000400220006000000000052 Row ..X G 8 0x13851B70 6 03000400000000000000000054 Table .IX G 6 0x13851570 8 03000400000000000000000054 Table .IX G 8 0x13850720 9 05000400000000000000000054 Table .IS G 9 0x13852570 6 05000400000000000000000054 Table .IX G 6 0x13850900 8 05000400000000000000000054 Table .IX G 8 0x138512A0 7 05000400000000000000000054 Table .IS G 7 0x13852660 6 04000400000000000000000054 Table .IX G 6 0x13850B40 8 04000400000000000000000054 Table .IX G 8 0x13851600 6 03000300000000000000000054 Table .IX G 6 0x13851E40 8 03000300000000000000000054 Table .IX G 8You may catch some lock waits, but there should not be much contention at the row level between these applications. A lock wait would be indicated by a ‘W' in the Sts column. The applications are using IX and IS table locks and getting row locks based on the SQL statement processing.
Allow the MULTI transactions to complete 3 minutes of processing.
What is the Total Count of transactions for the application mixture using the static SQL application? _________
Use the db2pd command to examine the information about the static application packages in the package cache for the database.
db2pd –db tp1 –static > pdstatic.txt
The output will include information similar to the following:
Database Partition 0 -- Database TP1 -- Active -- Up 0 days 00:04:14
Static Cache:Current Memory Used 232867Total Heap Size 6090792
Course materials may not be reproduced in whole or in part without the prior written permission of IBM.
© Copyright IBM Corp. 2001, 2006 Exercise 11. Application Performance 11-5
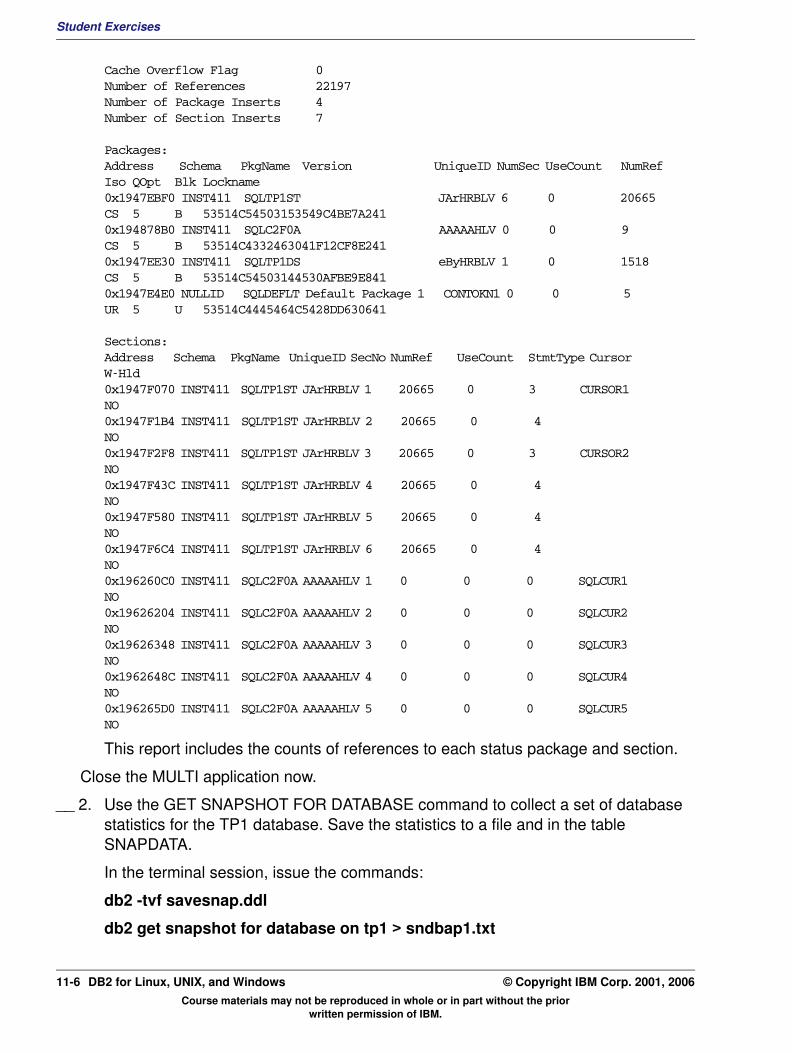
Student Exercises
Cache Overflow Flag 0Number of References 22197Number of Package Inserts 4Number of Section Inserts 7
Packages:Address Schema PkgName Version UniqueID NumSec UseCount NumRef Iso QOpt Blk Lockname 0x1947EBF0 INST411 SQLTP1ST JArHRBLV 6 0 20665 CS 5 B 53514C54503153549C4BE7A2410x194878B0 INST411 SQLC2F0A AAAAAHLV 0 0 9 CS 5 B 53514C4332463041F12CF8E2410x1947EE30 INST411 SQLTP1DS eByHRBLV 1 0 1518 CS 5 B 53514C54503144530AFBE9E8410x1947E4E0 NULLID SQLDEFLT Default Package 1 CONTOKN1 0 0 5 UR 5 U 53514C4445464C5428DD630641
Sections:Address Schema PkgName UniqueID SecNo NumRef UseCount StmtType Cursor W-Hld0x1947F070 INST411 SQLTP1ST JArHRBLV 1 20665 0 3 CURSOR1 NO 0x1947F1B4 INST411 SQLTP1ST JArHRBLV 2 20665 0 4 NO 0x1947F2F8 INST411 SQLTP1ST JArHRBLV 3 20665 0 3 CURSOR2 NO 0x1947F43C INST411 SQLTP1ST JArHRBLV 4 20665 0 4 NO 0x1947F580 INST411 SQLTP1ST JArHRBLV 5 20665 0 4 NO 0x1947F6C4 INST411 SQLTP1ST JArHRBLV 6 20665 0 4 NO 0x196260C0 INST411 SQLC2F0A AAAAAHLV 1 0 0 0 SQLCUR1 NO 0x19626204 INST411 SQLC2F0A AAAAAHLV 2 0 0 0 SQLCUR2 NO 0x19626348 INST411 SQLC2F0A AAAAAHLV 3 0 0 0 SQLCUR3 NO 0x1962648C INST411 SQLC2F0A AAAAAHLV 4 0 0 0 SQLCUR4 NO 0x196265D0 INST411 SQLC2F0A AAAAAHLV 5 0 0 0 SQLCUR5 NO
This report includes the counts of references to each status package and section.
Close the MULTI application now.
__ 2. Use the GET SNAPSHOT FOR DATABASE command to collect a set of database statistics for the TP1 database. Save the statistics to a file and in the table SNAPDATA.
In the terminal session, issue the commands:
db2 -tvf savesnap.ddl
db2 get snapshot for database on tp1 > sndbap1.txt
Course materials may not be reproduced in whole or in part without the prior written permission of IBM.
11-6 DB2 for Linux, UNIX, and Windows © Copyright IBM Corp. 2001, 2006
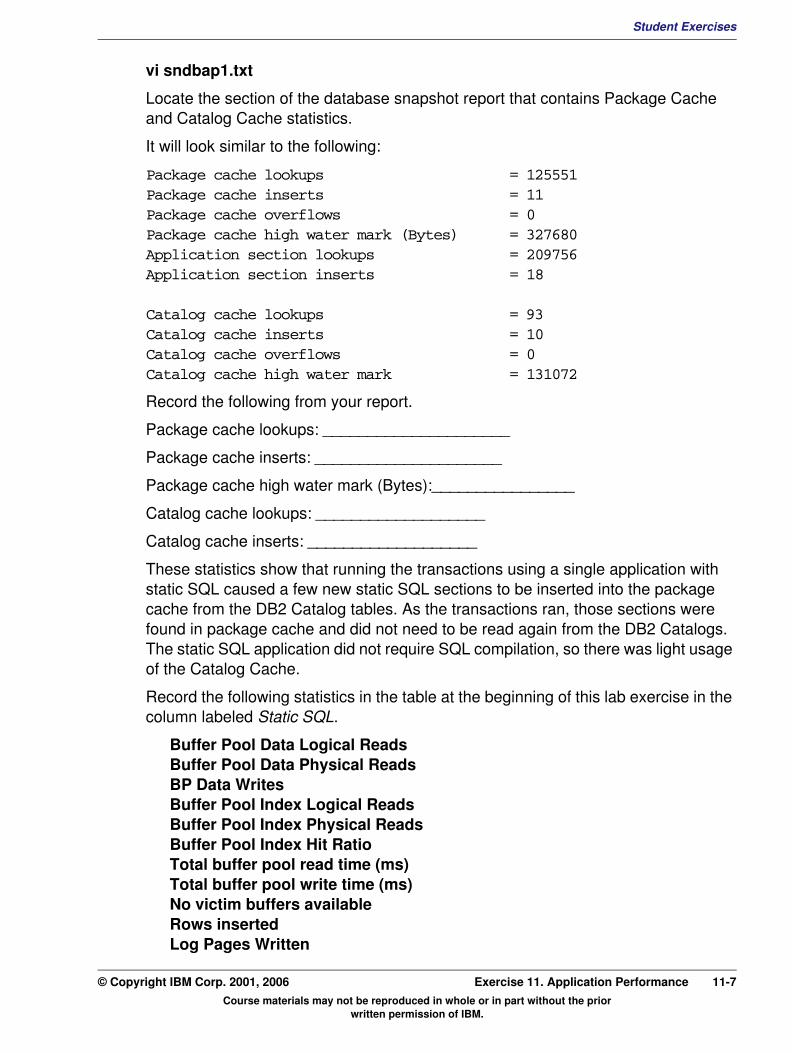
Student ExercisesV3.1.0.1
EXempty
vi sndbap1.txtLocate the section of the database snapshot report that contains Package Cache and Catalog Cache statistics.
It will look similar to the following:
Package cache lookups = 125551Package cache inserts = 11Package cache overflows = 0Package cache high water mark (Bytes) = 327680Application section lookups = 209756Application section inserts = 18
Catalog cache lookups = 93Catalog cache inserts = 10Catalog cache overflows = 0Catalog cache high water mark = 131072
Record the following from your report.
Package cache lookups: _____________________
Package cache inserts: _____________________
Package cache high water mark (Bytes):________________
Catalog cache lookups: ___________________
Catalog cache inserts: ___________________
These statistics show that running the transactions using a single application with static SQL caused a few new static SQL sections to be inserted into the package cache from the DB2 Catalog tables. As the transactions ran, those sections were found in package cache and did not need to be read again from the DB2 Catalogs. The static SQL application did not require SQL compilation, so there was light usage of the Catalog Cache.
Record the following statistics in the table at the beginning of this lab exercise in the column labeled Static SQL.
Buffer Pool Data Logical Reads Buffer Pool Data Physical Reads BP Data Writes Buffer Pool Index Logical Reads Buffer Pool Index Physical Reads Buffer Pool Index Hit Ratio Total buffer pool read time (ms) Total buffer pool write time (ms) No victim buffers available Rows inserted Log Pages Written
Course materials may not be reproduced in whole or in part without the prior written permission of IBM.
© Copyright IBM Corp. 2001, 2006 Exercise 11. Application Performance 11-7
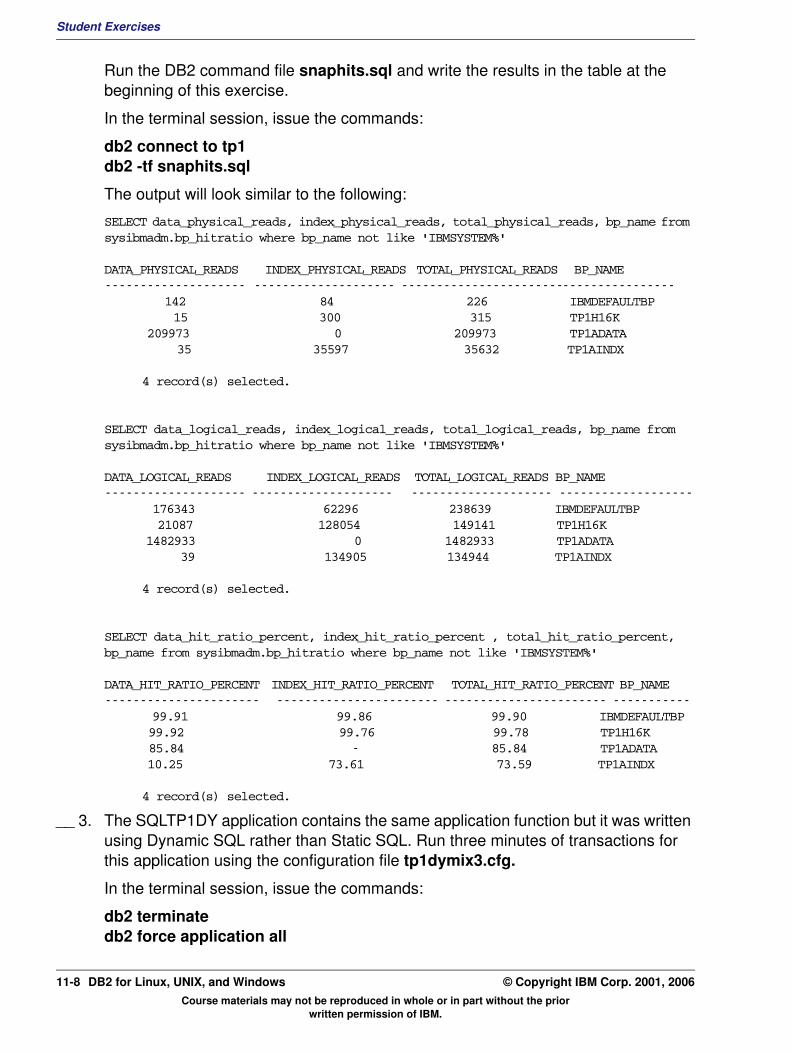
Student Exercises
Run the DB2 command file snaphits.sql and write the results in the table at the beginning of this exercise.
In the terminal session, issue the commands:
db2 connect to tp1 db2 -tf snaphits.sql
The output will look similar to the following:
SELECT data_physical_reads, index_physical_reads, total_physical_reads, bp_name from sysibmadm.bp_hitratio where bp_name not like 'IBMSYSTEM%'
DATA_PHYSICAL_READS INDEX_PHYSICAL_READS TOTAL_PHYSICAL_READS BP_NAME -------------------- -------------------- --------------------------------------- 142 84 226 IBMDEFAULTBP
15 300 315 TP1H16K 209973 0 209973 TP1ADATA 35 35597 35632 TP1AINDX
4 record(s) selected.
SELECT data_logical_reads, index_logical_reads, total_logical_reads, bp_name from sysibmadm.bp_hitratio where bp_name not like 'IBMSYSTEM%'
DATA_LOGICAL_READS INDEX_LOGICAL_READS TOTAL_LOGICAL_READS BP_NAME -------------------- -------------------- -------------------- ------------------- 176343 62296 238639 IBMDEFAULTBP
21087 128054 149141 TP1H16K 1482933 0 1482933 TP1ADATA 39 134905 134944 TP1AINDX
4 record(s) selected.
SELECT data_hit_ratio_percent, index_hit_ratio_percent , total_hit_ratio_percent, bp_name from sysibmadm.bp_hitratio where bp_name not like 'IBMSYSTEM%'
DATA_HIT_RATIO_PERCENT INDEX_HIT_RATIO_PERCENT TOTAL_HIT_RATIO_PERCENT BP_NAME ---------------------- ----------------------- ----------------------- ----------- 99.91 99.86 99.90 IBMDEFAULTBP
99.92 99.76 99.78 TP1H16K 85.84 - 85.84 TP1ADATA 10.25 73.61 73.59 TP1AINDX
4 record(s) selected.
__ 3. The SQLTP1DY application contains the same application function but it was written using Dynamic SQL rather than Static SQL. Run three minutes of transactions for this application using the configuration file tp1dymix3.cfg.
In the terminal session, issue the commands:
db2 terminate db2 force application all
Course materials may not be reproduced in whole or in part without the prior written permission of IBM.
11-8 DB2 for Linux, UNIX, and Windows © Copyright IBM Corp. 2001, 2006
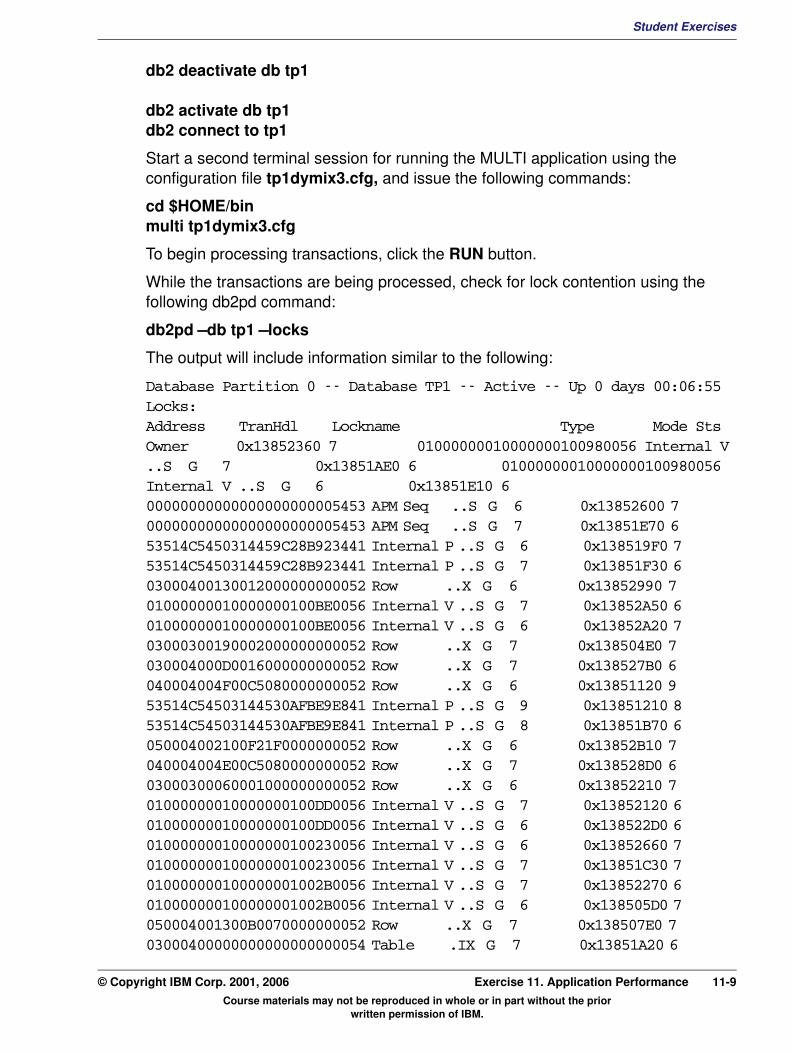
Student ExercisesV3.1.0.1
EXempty
db2 deactivate db tp1db2 activate db tp1 db2 connect to tp1
Start a second terminal session for running the MULTI application using the configuration file tp1dymix3.cfg, and issue the following commands:
cd $HOME/binmulti tp1dymix3.cfg
To begin processing transactions, click the RUN button.
While the transactions are being processed, check for lock contention using the following db2pd command:
db2pd –db tp1 –locks
The output will include information similar to the following:
Database Partition 0 -- Database TP1 -- Active -- Up 0 days 00:06:55Locks:Address TranHdl Lockname Type Mode Sts Owner 0x13852360 7 01000000010000000100980056 Internal V ..S G 7 0x13851AE0 6 01000000010000000100980056 Internal V ..S G 6 0x13851E10 6 00000000000000000000005453 APM Seq ..S G 6 0x13852600 7 00000000000000000000005453 APM Seq ..S G 7 0x13851E70 6 53514C5450314459C28B923441 Internal P ..S G 6 0x138519F0 7 53514C5450314459C28B923441 Internal P ..S G 7 0x13851F30 6 03000400130012000000000052 Row ..X G 6 0x13852990 7 01000000010000000100BE0056 Internal V ..S G 7 0x13852A50 6 01000000010000000100BE0056 Internal V ..S G 6 0x13852A20 7 03000300190002000000000052 Row ..X G 7 0x138504E0 7 030004000D0016000000000052 Row ..X G 7 0x138527B0 6 040004004F00C5080000000052 Row ..X G 6 0x13851120 9 53514C54503144530AFBE9E841 Internal P ..S G 9 0x13851210 8 53514C54503144530AFBE9E841 Internal P ..S G 8 0x13851B70 6 050004002100F21F0000000052 Row ..X G 6 0x13852B10 7 040004004E00C5080000000052 Row ..X G 7 0x138528D0 6 03000300060001000000000052 Row ..X G 6 0x13852210 7 01000000010000000100DD0056 Internal V ..S G 7 0x13852120 6 01000000010000000100DD0056 Internal V ..S G 6 0x138522D0 6 01000000010000000100230056 Internal V ..S G 6 0x13852660 7 01000000010000000100230056 Internal V ..S G 7 0x13851C30 7 010000000100000001002B0056 Internal V ..S G 7 0x13852270 6 010000000100000001002B0056 Internal V ..S G 6 0x138505D0 7 050004001300B0070000000052 Row ..X G 7 0x138507E0 7 03000400000000000000000054 Table .IX G 7 0x13851A20 6
Course materials may not be reproduced in whole or in part without the prior written permission of IBM.
© Copyright IBM Corp. 2001, 2006 Exercise 11. Application Performance 11-9
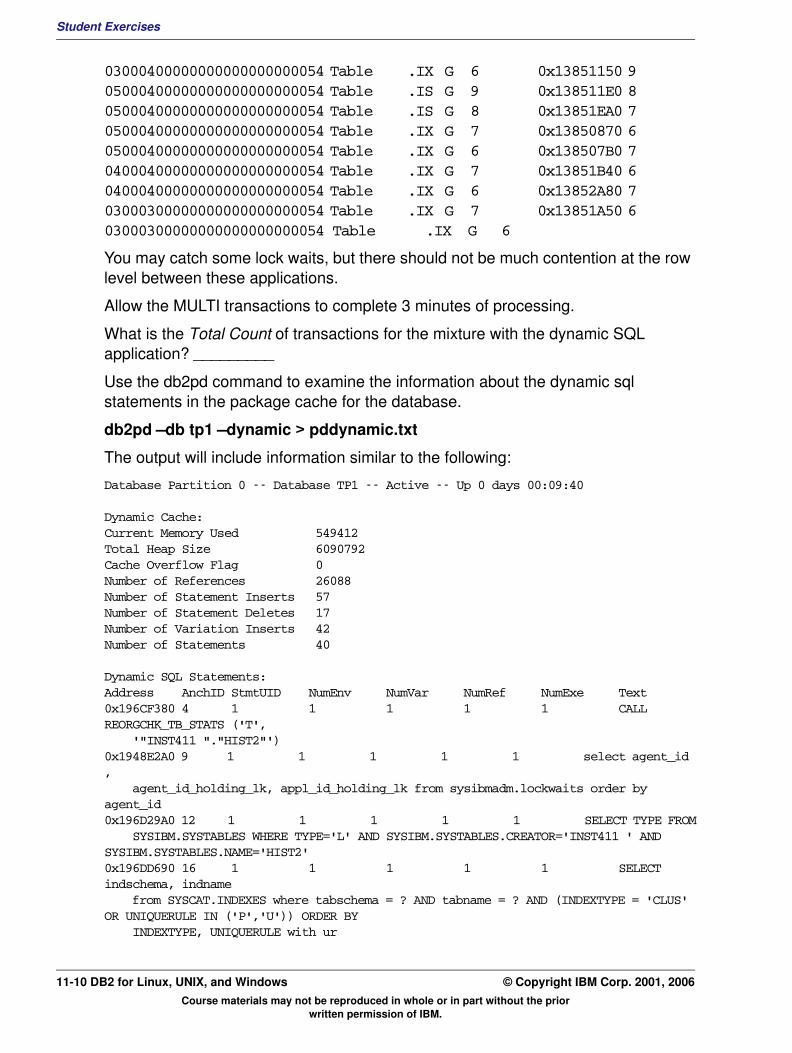
Student Exercises
03000400000000000000000054 Table .IX G 6 0x13851150 9 05000400000000000000000054 Table .IS G 9 0x138511E0 8 05000400000000000000000054 Table .IS G 8 0x13851EA0 7 05000400000000000000000054 Table .IX G 7 0x13850870 6 05000400000000000000000054 Table .IX G 6 0x138507B0 7 04000400000000000000000054 Table .IX G 7 0x13851B40 6 04000400000000000000000054 Table .IX G 6 0x13852A80 7 03000300000000000000000054 Table .IX G 7 0x13851A50 6 03000300000000000000000054 Table .IX G 6
You may catch some lock waits, but there should not be much contention at the row level between these applications.
Allow the MULTI transactions to complete 3 minutes of processing.
What is the Total Count of transactions for the mixture with the dynamic SQL application? _________
Use the db2pd command to examine the information about the dynamic sql statements in the package cache for the database.
db2pd –db tp1 –dynamic > pddynamic.txt
The output will include information similar to the following:
Database Partition 0 -- Database TP1 -- Active -- Up 0 days 00:09:40
Dynamic Cache:Current Memory Used 549412Total Heap Size 6090792Cache Overflow Flag 0Number of References 26088Number of Statement Inserts 57Number of Statement Deletes 17Number of Variation Inserts 42Number of Statements 40
Dynamic SQL Statements:Address AnchID StmtUID NumEnv NumVar NumRef NumExe Text 0x196CF380 4 1 1 1 1 1 CALL REORGCHK_TB_STATS ('T', '"INST411 "."HIST2"')0x1948E2A0 9 1 1 1 1 1 select agent_id , agent_id_holding_lk, appl_id_holding_lk from sysibmadm.lockwaits order by agent_id0x196D29A0 12 1 1 1 1 1 SELECT TYPE FROM SYSIBM.SYSTABLES WHERE TYPE='L' AND SYSIBM.SYSTABLES.CREATOR='INST411 ' AND SYSIBM.SYSTABLES.NAME='HIST2'0x196DD690 16 1 1 1 1 1 SELECT indschema, indname from SYSCAT.INDEXES where tabschema = ? AND tabname = ? AND (INDEXTYPE = 'CLUS' OR UNIQUERULE IN ('P','U')) ORDER BY INDEXTYPE, UNIQUERULE with ur
Course materials may not be reproduced in whole or in part without the prior written permission of IBM.
11-10 DB2 for Linux, UNIX, and Windows © Copyright IBM Corp. 2001, 2006
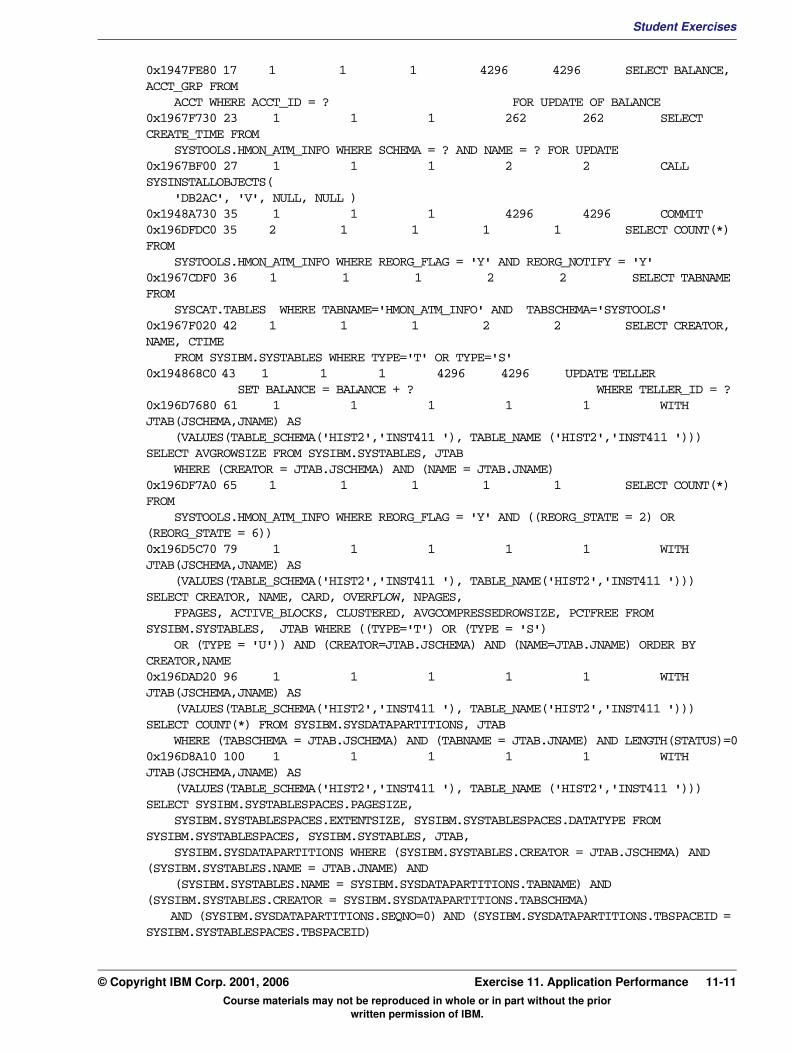
Student ExercisesV3.1.0.1
EXempty
0x1947FE80 17 1 1 1 4296 4296 SELECT BALANCE, ACCT_GRP FROM ACCT WHERE ACCT_ID = ? FOR UPDATE OF BALANCE0x1967F730 23 1 1 1 262 262 SELECT CREATE_TIME FROM SYSTOOLS.HMON_ATM_INFO WHERE SCHEMA = ? AND NAME = ? FOR UPDATE0x1967BF00 27 1 1 1 2 2 CALL SYSINSTALLOBJECTS( 'DB2AC', 'V', NULL, NULL )0x1948A730 35 1 1 1 4296 4296 COMMIT0x196DFDC0 35 2 1 1 1 1 SELECT COUNT(*) FROM SYSTOOLS.HMON_ATM_INFO WHERE REORG_FLAG = 'Y' AND REORG_NOTIFY = 'Y'0x1967CDF0 36 1 1 1 2 2 SELECT TABNAME FROM SYSCAT.TABLES WHERE TABNAME='HMON_ATM_INFO' AND TABSCHEMA='SYSTOOLS'0x1967F020 42 1 1 1 2 2 SELECT CREATOR, NAME, CTIME FROM SYSIBM.SYSTABLES WHERE TYPE='T' OR TYPE='S'0x194868C0 43 1 1 1 4296 4296 UPDATE TELLER SET BALANCE = BALANCE + ? WHERE TELLER_ID = ?0x196D7680 61 1 1 1 1 1 WITH JTAB(JSCHEMA,JNAME) AS (VALUES(TABLE_SCHEMA('HIST2','INST411 '), TABLE_NAME ('HIST2','INST411 '))) SELECT AVGROWSIZE FROM SYSIBM.SYSTABLES, JTAB WHERE (CREATOR = JTAB.JSCHEMA) AND (NAME = JTAB.JNAME)0x196DF7A0 65 1 1 1 1 1 SELECT COUNT(*) FROM SYSTOOLS.HMON_ATM_INFO WHERE REORG_FLAG = 'Y' AND ((REORG_STATE = 2) OR (REORG_STATE = 6))0x196D5C70 79 1 1 1 1 1 WITH JTAB(JSCHEMA,JNAME) AS (VALUES(TABLE_SCHEMA('HIST2','INST411 '), TABLE_NAME('HIST2','INST411 '))) SELECT CREATOR, NAME, CARD, OVERFLOW, NPAGES, FPAGES, ACTIVE_BLOCKS, CLUSTERED, AVGCOMPRESSEDROWSIZE, PCTFREE FROM SYSIBM.SYSTABLES, JTAB WHERE ((TYPE='T') OR (TYPE = 'S') OR (TYPE = 'U')) AND (CREATOR=JTAB.JSCHEMA) AND (NAME=JTAB.JNAME) ORDER BY CREATOR,NAME0x196DAD20 96 1 1 1 1 1 WITH JTAB(JSCHEMA,JNAME) AS (VALUES(TABLE_SCHEMA('HIST2','INST411 '), TABLE_NAME('HIST2','INST411 '))) SELECT COUNT(*) FROM SYSIBM.SYSDATAPARTITIONS, JTAB WHERE (TABSCHEMA = JTAB.JSCHEMA) AND (TABNAME = JTAB.JNAME) AND LENGTH(STATUS)=00x196D8A10 100 1 1 1 1 1 WITH JTAB(JSCHEMA,JNAME) AS (VALUES(TABLE_SCHEMA('HIST2','INST411 '), TABLE_NAME ('HIST2','INST411 '))) SELECT SYSIBM.SYSTABLESPACES.PAGESIZE, SYSIBM.SYSTABLESPACES.EXTENTSIZE, SYSIBM.SYSTABLESPACES.DATATYPE FROM SYSIBM.SYSTABLESPACES, SYSIBM.SYSTABLES, JTAB, SYSIBM.SYSDATAPARTITIONS WHERE (SYSIBM.SYSTABLES.CREATOR = JTAB.JSCHEMA) AND (SYSIBM.SYSTABLES.NAME = JTAB.JNAME) AND (SYSIBM.SYSTABLES.NAME = SYSIBM.SYSDATAPARTITIONS.TABNAME) AND (SYSIBM.SYSTABLES.CREATOR = SYSIBM.SYSDATAPARTITIONS.TABSCHEMA) AND (SYSIBM.SYSDATAPARTITIONS.SEQNO=0) AND (SYSIBM.SYSDATAPARTITIONS.TBSPACEID = SYSIBM.SYSTABLESPACES.TBSPACEID)Course materials may not be reproduced in whole or in part without the prior written permission of IBM.
© Copyright IBM Corp. 2001, 2006 Exercise 11. Application Performance 11-11

Student Exercises
0x196D0210 110 1 1 1 1 1 WITH VTYPED (NAME, SCHEMA) AS (VALUES(TABLE_NAME ('HIST2', 'INST411 '), TABLE_SCHEMA('HIST2', 'INST411 '))) SELECT TYPE FROM SYSIBM.SYSTABLES, VTYPED WHERE TYPE = 'U' AND SYSIBM.SYSTABLES.NAME = VTYPED.NAME AND SYSIBM.SYSTABLES.CREATOR = VTYPED.SCHEMA0x196E2800 114 1 1 1 1 1 SELECT MAX(REORG_AVG_RUNTIME) FROM SYSTOOLS.HMON_ATM_INFO0x1947EB10 116 1 0 0 0 0 SET CURRENT LOCALE LC_CTYPE = 'en_US'0x196C89A0 119 1 1 1 1 1 UPDATE SYSTOOLS.HMON_ATM_INFO AS ATM SET ATM.REORG_FLAG = 'N'
Close the MULTI application now.
__ 4. Use the GET SNAPSHOT FOR DATABASE command to collect a set of database statistics for the TP1 database. Save the statistics to a file and in the table SNAPDATA.
In the terminal session, issue the commands:
db2 -tvf savesnap.ddl
db2 get snapshot for database on tp1 > sndbap2.txt
vi sndbap2.txt
Locate the section of the database snapshot report that contains Package Cache and Catalog Cache statistics.
It will look similar to the following:
Package cache lookups = 26610Package cache inserts = 46Package cache overflows = 0Package cache high water mark (Bytes) = 655360Application section lookups = 57752Application section inserts = 70
Catalog cache lookups = 181Catalog cache inserts = 34Catalog cache overflows = 0Catalog cache high water mark = 262144
Record the following from your report.
Package cache lookups: _____________________
Package cache inserts: _____________________
Course materials may not be reproduced in whole or in part without the prior written permission of IBM.
11-12 DB2 for Linux, UNIX, and Windows © Copyright IBM Corp. 2001, 2006
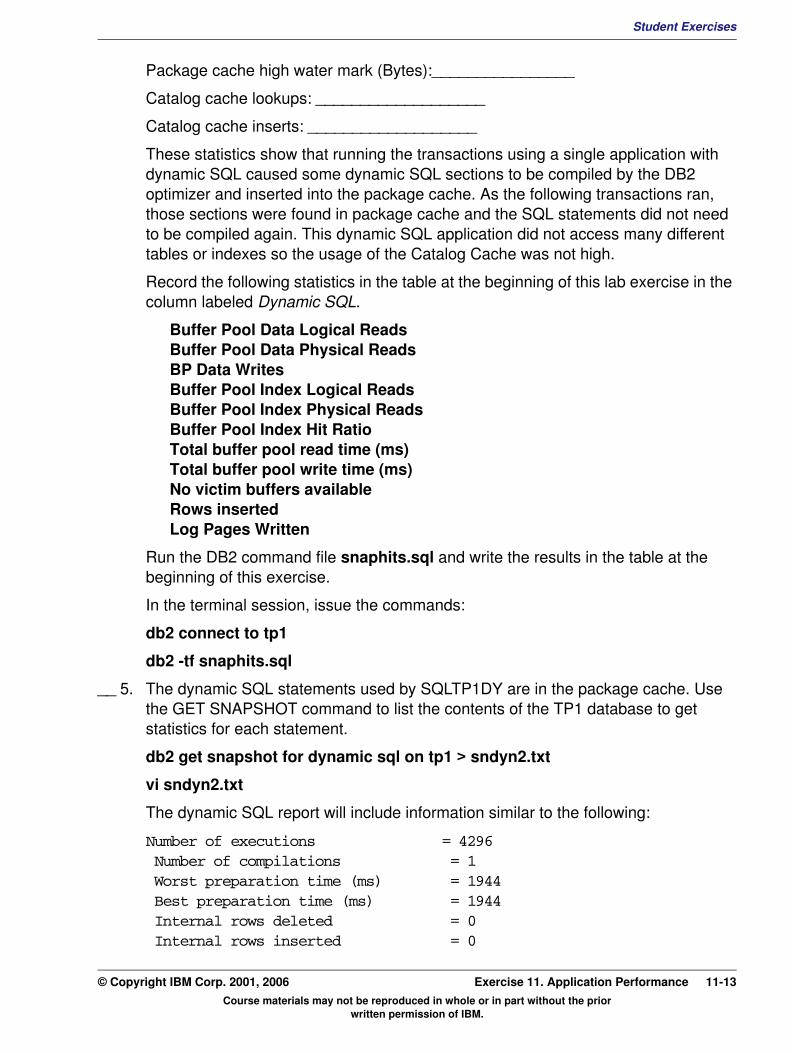
Student ExercisesV3.1.0.1
EXempty
Package cache high water mark (Bytes):________________Catalog cache lookups: ___________________
Catalog cache inserts: ___________________
These statistics show that running the transactions using a single application with dynamic SQL caused some dynamic SQL sections to be compiled by the DB2 optimizer and inserted into the package cache. As the following transactions ran, those sections were found in package cache and the SQL statements did not need to be compiled again. This dynamic SQL application did not access many different tables or indexes so the usage of the Catalog Cache was not high.
Record the following statistics in the table at the beginning of this lab exercise in the column labeled Dynamic SQL.
Buffer Pool Data Logical Reads Buffer Pool Data Physical Reads BP Data Writes Buffer Pool Index Logical Reads Buffer Pool Index Physical Reads Buffer Pool Index Hit Ratio Total buffer pool read time (ms) Total buffer pool write time (ms) No victim buffers available Rows inserted Log Pages Written
Run the DB2 command file snaphits.sql and write the results in the table at the beginning of this exercise.
In the terminal session, issue the commands:
db2 connect to tp1
db2 -tf snaphits.sql
__ 5. The dynamic SQL statements used by SQLTP1DY are in the package cache. Use the GET SNAPSHOT command to list the contents of the TP1 database to get statistics for each statement.
db2 get snapshot for dynamic sql on tp1 > sndyn2.txt
vi sndyn2.txt
The dynamic SQL report will include information similar to the following:
Number of executions = 4296 Number of compilations = 1 Worst preparation time (ms) = 1944 Best preparation time (ms) = 1944 Internal rows deleted = 0 Internal rows inserted = 0
Course materials may not be reproduced in whole or in part without the prior written permission of IBM.
© Copyright IBM Corp. 2001, 2006 Exercise 11. Application Performance 11-13
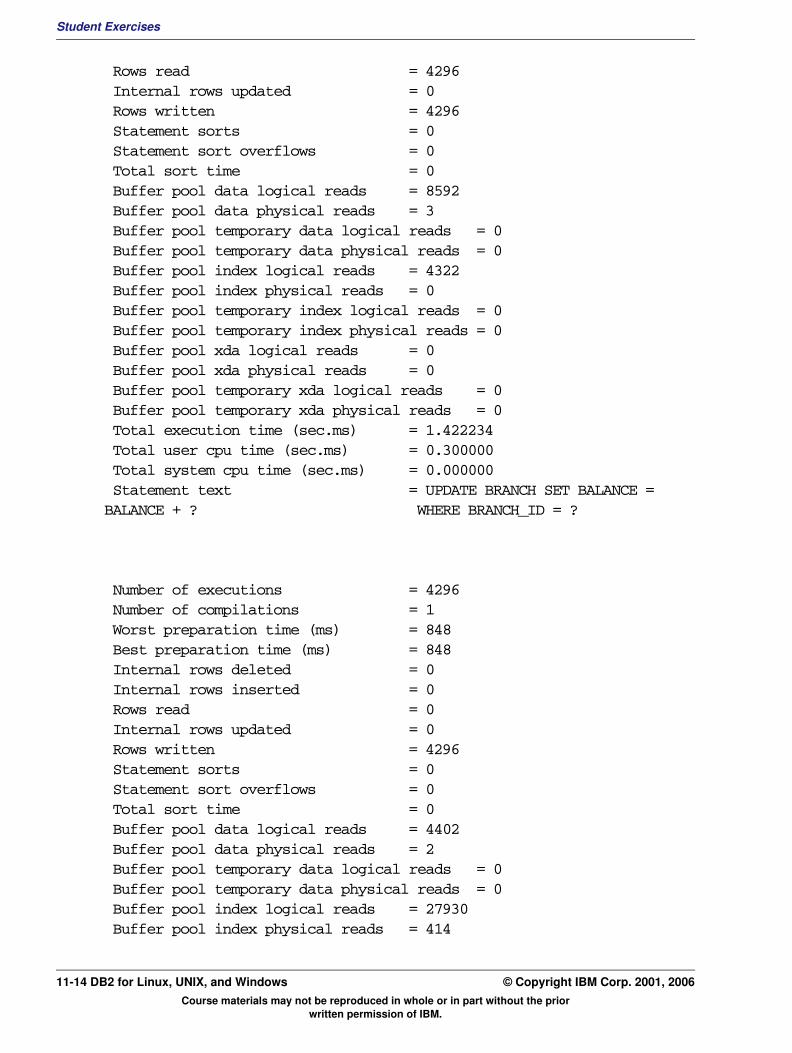
Student Exercises
Rows read = 4296 Internal rows updated = 0 Rows written = 4296 Statement sorts = 0 Statement sort overflows = 0 Total sort time = 0 Buffer pool data logical reads = 8592 Buffer pool data physical reads = 3 Buffer pool temporary data logical reads = 0 Buffer pool temporary data physical reads = 0 Buffer pool index logical reads = 4322 Buffer pool index physical reads = 0 Buffer pool temporary index logical reads = 0 Buffer pool temporary index physical reads = 0 Buffer pool xda logical reads = 0 Buffer pool xda physical reads = 0 Buffer pool temporary xda logical reads = 0 Buffer pool temporary xda physical reads = 0 Total execution time (sec.ms) = 1.422234 Total user cpu time (sec.ms) = 0.300000 Total system cpu time (sec.ms) = 0.000000 Statement text = UPDATE BRANCH SET BALANCE = BALANCE + ? WHERE BRANCH_ID = ?
Number of executions = 4296 Number of compilations = 1 Worst preparation time (ms) = 848 Best preparation time (ms) = 848 Internal rows deleted = 0 Internal rows inserted = 0 Rows read = 0 Internal rows updated = 0 Rows written = 4296 Statement sorts = 0 Statement sort overflows = 0 Total sort time = 0 Buffer pool data logical reads = 4402 Buffer pool data physical reads = 2 Buffer pool temporary data logical reads = 0 Buffer pool temporary data physical reads = 0 Buffer pool index logical reads = 27930 Buffer pool index physical reads = 414
Course materials may not be reproduced in whole or in part without the prior written permission of IBM.
11-14 DB2 for Linux, UNIX, and Windows © Copyright IBM Corp. 2001, 2006
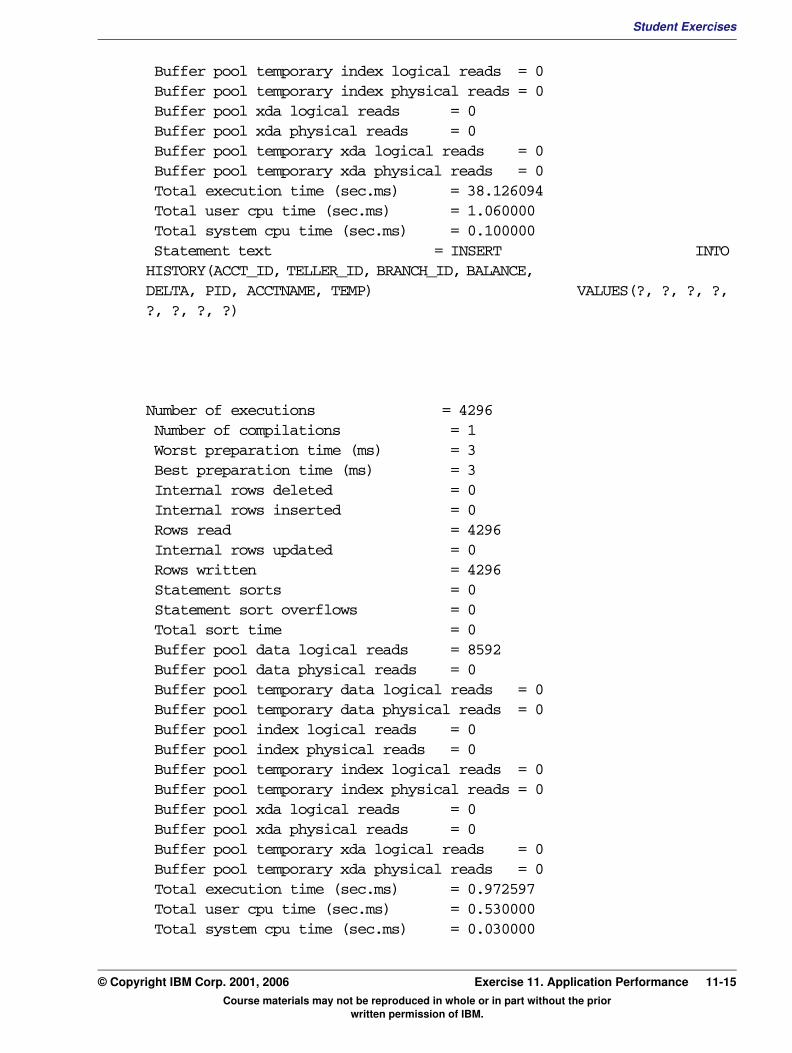
Student ExercisesV3.1.0.1
EXempty
Buffer pool temporary index logical reads = 0 Buffer pool temporary index physical reads = 0 Buffer pool xda logical reads = 0 Buffer pool xda physical reads = 0 Buffer pool temporary xda logical reads = 0 Buffer pool temporary xda physical reads = 0 Total execution time (sec.ms) = 38.126094 Total user cpu time (sec.ms) = 1.060000 Total system cpu time (sec.ms) = 0.100000 Statement text = INSERT INTO HISTORY(ACCT_ID, TELLER_ID, BRANCH_ID, BALANCE, DELTA, PID, ACCTNAME, TEMP) VALUES(?, ?, ?, ?, ?, ?, ?, ?)Number of executions = 4296 Number of compilations = 1 Worst preparation time (ms) = 3 Best preparation time (ms) = 3 Internal rows deleted = 0 Internal rows inserted = 0 Rows read = 4296 Internal rows updated = 0 Rows written = 4296 Statement sorts = 0 Statement sort overflows = 0 Total sort time = 0 Buffer pool data logical reads = 8592 Buffer pool data physical reads = 0 Buffer pool temporary data logical reads = 0 Buffer pool temporary data physical reads = 0 Buffer pool index logical reads = 0 Buffer pool index physical reads = 0 Buffer pool temporary index logical reads = 0 Buffer pool temporary index physical reads = 0 Buffer pool xda logical reads = 0 Buffer pool xda physical reads = 0 Buffer pool temporary xda logical reads = 0 Buffer pool temporary xda physical reads = 0 Total execution time (sec.ms) = 0.972597 Total user cpu time (sec.ms) = 0.530000 Total system cpu time (sec.ms) = 0.030000
Course materials may not be reproduced in whole or in part without the prior written permission of IBM.
© Copyright IBM Corp. 2001, 2006 Exercise 11. Application Performance 11-15

Student Exercises
Statement text = UPDATE ACCT SET BALANCE = BALANCE + ? WHERE CURRENT OF CURSOR1
The SQL statements show large numbers for executions and only one compilation. The SQL statement text used by the SQLTP1DY application contain '?' instead of specific key data. This allows the reuse of these statements from package cache.
__ 6. Use the query in the file dblockinfo.sql to retrieve information about locking at the database level. The query uses the Administrative view SYSIBMADM.SNAPDB.
Look at the database statistics for locking.
In the terminal session, issue the commands:
db2 –tvf dblockinfo.sql
The output should be similar to the following information:
select lock_waits, lock_wait_time, lock_list_in_use, deadlocks, lock_escals , lock_wait_time / lock_waits as avg_lock_wait_ms from sysibmadm.snapdb
LOCK_WAITS LOCK_WAIT_TIME LOCK_LIST_IN_USE DEADLOCKS LOCK_ESCALS AVG_LOCK_WAIT_MS -------------------- -------------------- -------------------- ----------------- -------------------- -------------------- 38 5177 4464 0 0 136
1 record(s) selected.
Record the following statistics:
Lock Waits: _________________________
Lock Wait Time : _________________________
The application tables are large enough and the applications access a few rows using the indexes, so lock contention is not a problem for this application.
Course materials may not be reproduced in whole or in part without the prior written permission of IBM.
11-16 DB2 for Linux, UNIX, and Windows © Copyright IBM Corp. 2001, 2006
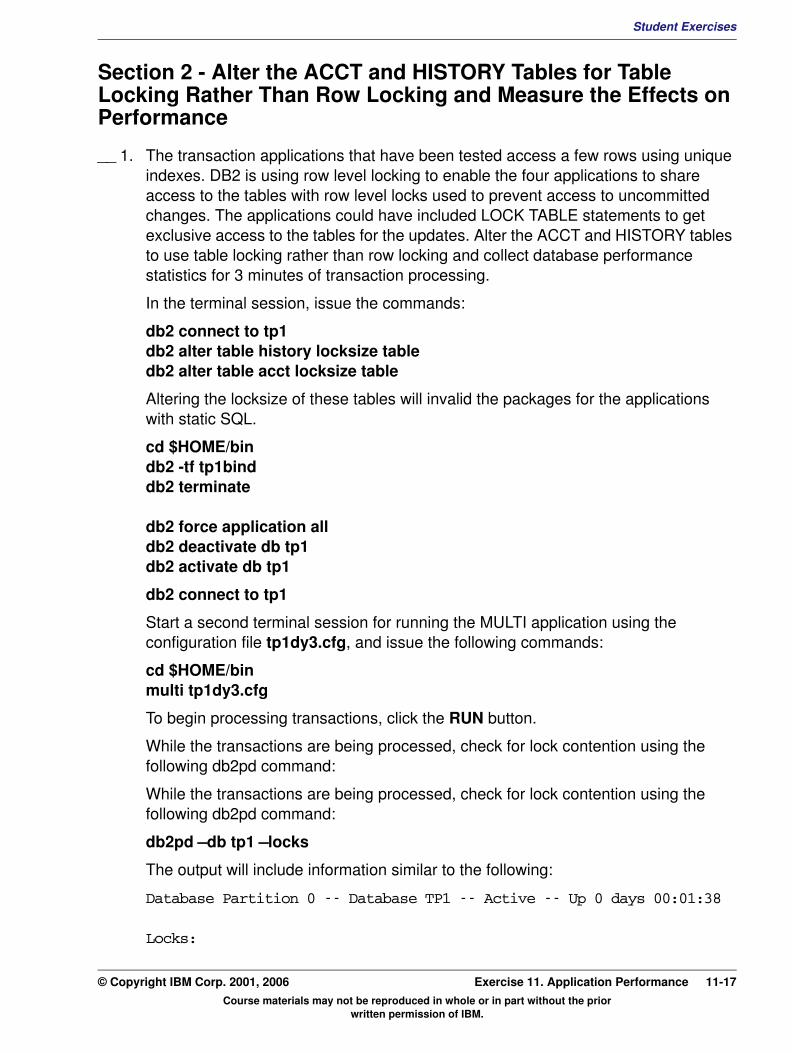
Student ExercisesV3.1.0.1
EXempty
Section 2 - Alter the ACCT and HISTORY Tables for Table Locking Rather Than Row Locking and Measure the Effects on Performance__ 1. The transaction applications that have been tested access a few rows using unique indexes. DB2 is using row level locking to enable the four applications to share access to the tables with row level locks used to prevent access to uncommitted changes. The applications could have included LOCK TABLE statements to get exclusive access to the tables for the updates. Alter the ACCT and HISTORY tables to use table locking rather than row locking and collect database performance statistics for 3 minutes of transaction processing.
In the terminal session, issue the commands:
db2 connect to tp1 db2 alter table history locksize table db2 alter table acct locksize table
Altering the locksize of these tables will invalid the packages for the applications with static SQL.
cd $HOME/bin db2 -tf tp1bind db2 terminate
db2 force application all db2 deactivate db tp1 db2 activate db tp1
db2 connect to tp1
Start a second terminal session for running the MULTI application using the configuration file tp1dy3.cfg, and issue the following commands:
cd $HOME/bin multi tp1dy3.cfg
To begin processing transactions, click the RUN button.
While the transactions are being processed, check for lock contention using the following db2pd command:
While the transactions are being processed, check for lock contention using the following db2pd command:
db2pd –db tp1 –locks
The output will include information similar to the following:
Database Partition 0 -- Database TP1 -- Active -- Up 0 days 00:01:38
Locks:
Course materials may not be reproduced in whole or in part without the prior written permission of IBM.
© Copyright IBM Corp. 2001, 2006 Exercise 11. Application Performance 11-17
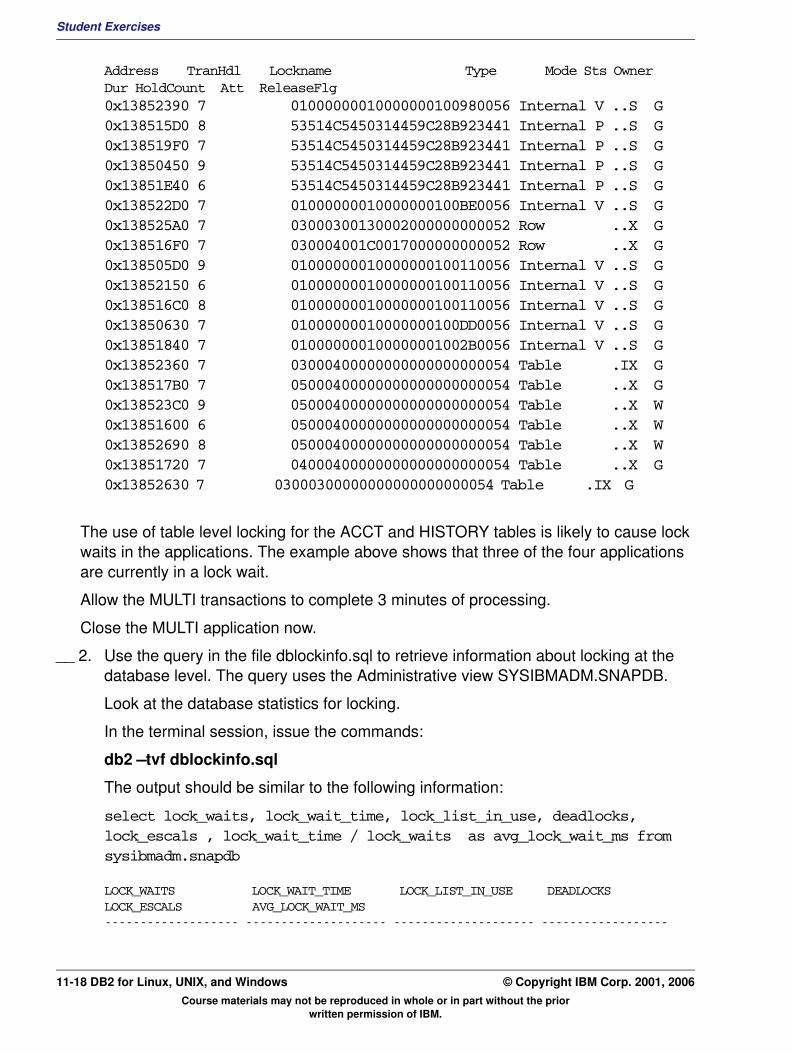
Student Exercises
Address TranHdl Lockname Type Mode Sts Owner Dur HoldCount Att ReleaseFlg0x13852390 7 01000000010000000100980056 Internal V ..S G 0x138515D0 8 53514C5450314459C28B923441 Internal P ..S G 0x138519F0 7 53514C5450314459C28B923441 Internal P ..S G 0x13850450 9 53514C5450314459C28B923441 Internal P ..S G 0x13851E40 6 53514C5450314459C28B923441 Internal P ..S G 0x138522D0 7 01000000010000000100BE0056 Internal V ..S G 0x138525A0 7 03000300130002000000000052 Row ..X G 0x138516F0 7 030004001C0017000000000052 Row ..X G 0x138505D0 9 01000000010000000100110056 Internal V ..S G 0x13852150 6 01000000010000000100110056 Internal V ..S G 0x138516C0 8 01000000010000000100110056 Internal V ..S G 0x13850630 7 01000000010000000100DD0056 Internal V ..S G 0x13851840 7 010000000100000001002B0056 Internal V ..S G 0x13852360 7 03000400000000000000000054 Table .IX G 0x138517B0 7 05000400000000000000000054 Table ..X G 0x138523C0 9 05000400000000000000000054 Table ..X W 0x13851600 6 05000400000000000000000054 Table ..X W 0x13852690 8 05000400000000000000000054 Table ..X W 0x13851720 7 04000400000000000000000054 Table ..X G 0x13852630 7 03000300000000000000000054 Table .IX G
The use of table level locking for the ACCT and HISTORY tables is likely to cause lock waits in the applications. The example above shows that three of the four applications are currently in a lock wait.
Allow the MULTI transactions to complete 3 minutes of processing.
Close the MULTI application now.
__ 2. Use the query in the file dblockinfo.sql to retrieve information about locking at the database level. The query uses the Administrative view SYSIBMADM.SNAPDB.
Look at the database statistics for locking.
In the terminal session, issue the commands:
db2 –tvf dblockinfo.sql
The output should be similar to the following information:
select lock_waits, lock_wait_time, lock_list_in_use, deadlocks, lock_escals , lock_wait_time / lock_waits as avg_lock_wait_ms from sysibmadm.snapdb
LOCK_WAITS LOCK_WAIT_TIME LOCK_LIST_IN_USE DEADLOCKS LOCK_ESCALS AVG_LOCK_WAIT_MS ------------------- -------------------- -------------------- ------------------
Course materials may not be reproduced in whole or in part without the prior written permission of IBM.
11-18 DB2 for Linux, UNIX, and Windows © Copyright IBM Corp. 2001, 2006
Student ExercisesV3.1.0.1
EXempty
9026 535906 3360 0 0 591 record(s) selected.
Record the following statistics:
Lock Waits : _________________________
Lock Wait time : ________________
The use of table locking has greatly increased the number of lock waits and the amount of time the applications were in lock waits.
__ 3. Change the ACCT and HISTORY tables back to row locking. Close all the applications and deactivate the TP1 database to clear all current statistics.
In the terminal session, issue the commands:
db2 alter table history locksize row db2 alter table acct locksize row
db2 -tf tp1bind
db2 terminate
db2 force application all db2 deactivate db tp1
END OF EXERCISE
Course materials may not be reproduced in whole or in part without the prior written permission of IBM.
© Copyright IBM Corp. 2001, 2006 Exercise 11. Application Performance 11-19

Student Exercises
Course materials may not be reproduced in whole or in part without the prior written permission of IBM.
11-20 DB2 for Linux, UNIX, and Windows © Copyright IBM Corp. 2001, 2006
Student ExercisesV3.1.0.1
EXempty
Exercise 12. Event MonitoringWhat This Exercise Is About
This exercise is an online lab which allows the student to use Event Monitors to collect performance statistics for transactions, SQL statements and application connections executing in the DB2 database. The event monitoring will use files and database tables to store the monitor data.
What You Should Be Able to Do
At the end of the lab, you should be able to:
• Create a file Event Monitor to collect SQL statement performance statistics for later analysis.
• Create a table Event Monitor to collect transaction performance statistics and use SQL queries to retrieve the information.
• Use the DB2EVMON utility to format the file Event Monitor data into a report.
• Use the Event Analyzer application to review table Event Monitor statistics.
Course materials may not be reproduced in whole or in part without the prior written permission of IBM.
© Copyright IBM Corp. 2001, 2006 Exercise 12. Event Monitoring 12-1
Student Exercises
Exercise Instructions
Introduction
In this exercise, you will be using the Event Monitoring facility of DB2 to collect performance statistics of several database applications. First, a File Event Monitor will be created to collect Statement and Connection Event data. DB2BATCH will be used to execute a set of five queries, and the DB2EVMON tool will be used to format a report from the collected statistics. Next a Table Event Monitor will be created to collect Transaction Events directly to a set of DB2 tables. The MULTI application will be used to generate a mixture of application transactions. The Table Event Monitor data will be reviewed using an SQL Query from the DB2 Tables. The DB2 Event Analyzer will be used to get another view of the transaction events.
Note: The examples are shown to help you locate the information, the costs and other statistics in your reports may vary from the values shown.
Course materials may not be reproduced in whole or in part without the prior written permission of IBM.
12-2 DB2 for Linux, UNIX, and Windows © Copyright IBM Corp. 2001, 2006
Student ExercisesV3.1.0.1
EXempty
Section 1 - Creating File Event Monitor and Using DB2EVMON CommandIn this exercise, we will create a File Event Monitor to collect SQL statement and Connection Event Monitor statistics. We will also use DB2EVMON command to format results into a report.
__ 1. Create a File Event Monitor, STMTFILE to collect SQL statement and connection event statistics. The event monitor should be have the following options:
NONBLOCKED BUFFERSIZE 8 MAXFILES 3 MAXFILESIZE 1024 FILE /home/inst411/stmt
From your Linux workstation, start a terminal session.
In the terminal session, issue the commands:
cd $HOME mkdir stmt db2 activate db tp1 db2 connect to tp1
db2 “CREATE EVENT MONITOR STMTFILE FOR STATEMENTS,CONNECTIONS WRITE TO FILE '/home/inst411/stmt' BUFFERSIZE 8 NONBLOCKED MAXFILES 3 MAXFILESIZE 1024 “
__ 2. Activate the new STMTFILE Event Monitor and run a DB2BATCH command to generate performance statistics for a group of SQL queries.
In the terminal session, issue the commands:
Check to see if the STMTFILE Event Monitor is active.
db2 ' select substr(evmonname,1,18) as event_monitor, event_mon_state(evmonname) as mon_state from syscat.eventmonitors '
The output will look similar to the following:
EVENT_MONITOR MON_STATE------------------ -----------DB2DETAILDEADLOCK 1STMTFILE 0
This shows that the new Event Monitor is not active, start the Event Monitor.
db2 set event monitor STMTFILE state 1
Use db2batch to run a set of SQL queries to generate Event Monitor data.
cd $HOME/bin
Course materials may not be reproduced in whole or in part without the prior written permission of IBM.
© Copyright IBM Corp. 2001, 2006 Exercise 12. Event Monitoring 12-3
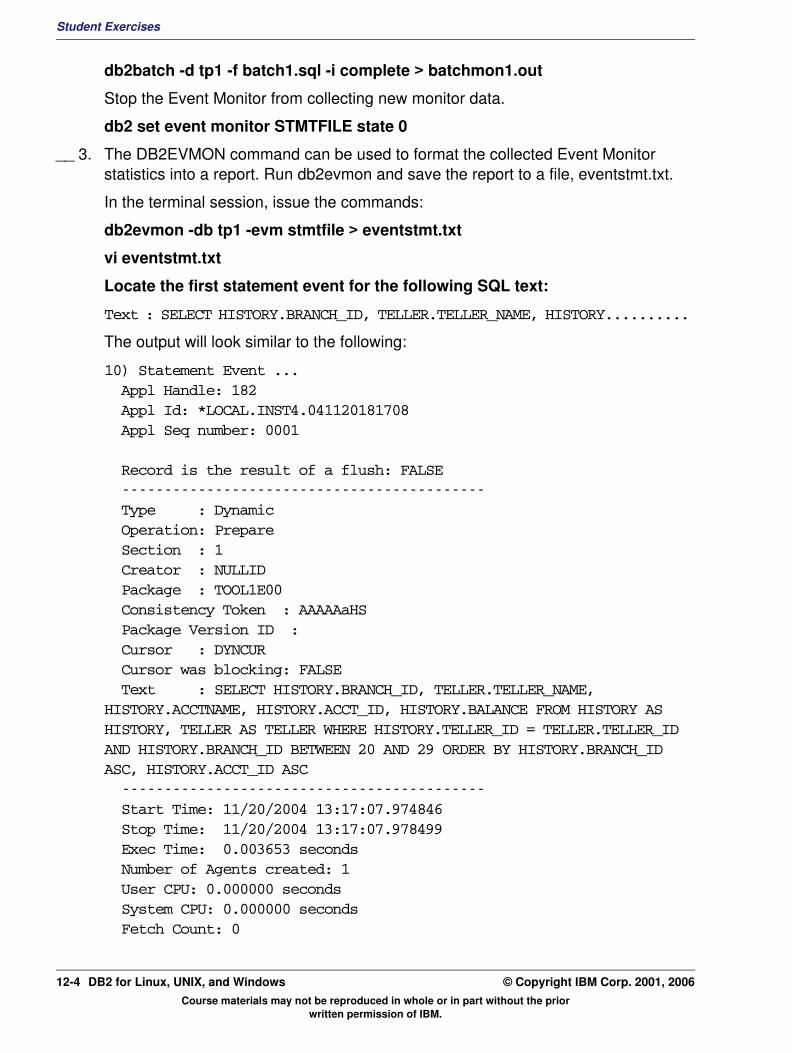
Student Exercises
db2batch -d tp1 -f batch1.sql -i complete > batchmon1.out
Stop the Event Monitor from collecting new monitor data.
db2 set event monitor STMTFILE state 0
__ 3. The DB2EVMON command can be used to format the collected Event Monitor statistics into a report. Run db2evmon and save the report to a file, eventstmt.txt.
In the terminal session, issue the commands:
db2evmon -db tp1 -evm stmtfile > eventstmt.txt
vi eventstmt.txt
Locate the first statement event for the following SQL text:
Text : SELECT HISTORY.BRANCH_ID, TELLER.TELLER_NAME, HISTORY..........
The output will look similar to the following:
10) Statement Event ... Appl Handle: 182 Appl Id: *LOCAL.INST4.041120181708 Appl Seq number: 0001
Record is the result of a flush: FALSE ------------------------------------------- Type : Dynamic Operation: Prepare Section : 1 Creator : NULLID Package : TOOL1E00 Consistency Token : AAAAAaHS Package Version ID : Cursor : DYNCUR Cursor was blocking: FALSE Text : SELECT HISTORY.BRANCH_ID, TELLER.TELLER_NAME, HISTORY.ACCTNAME, HISTORY.ACCT_ID, HISTORY.BALANCE FROM HISTORY AS HISTORY, TELLER AS TELLER WHERE HISTORY.TELLER_ID = TELLER.TELLER_ID AND HISTORY.BRANCH_ID BETWEEN 20 AND 29 ORDER BY HISTORY.BRANCH_ID ASC, HISTORY.ACCT_ID ASC ------------------------------------------- Start Time: 11/20/2004 13:17:07.974846 Stop Time: 11/20/2004 13:17:07.978499 Exec Time: 0.003653 seconds Number of Agents created: 1 User CPU: 0.000000 seconds System CPU: 0.000000 seconds Fetch Count: 0
Course materials may not be reproduced in whole or in part without the prior written permission of IBM.
12-4 DB2 for Linux, UNIX, and Windows © Copyright IBM Corp. 2001, 2006
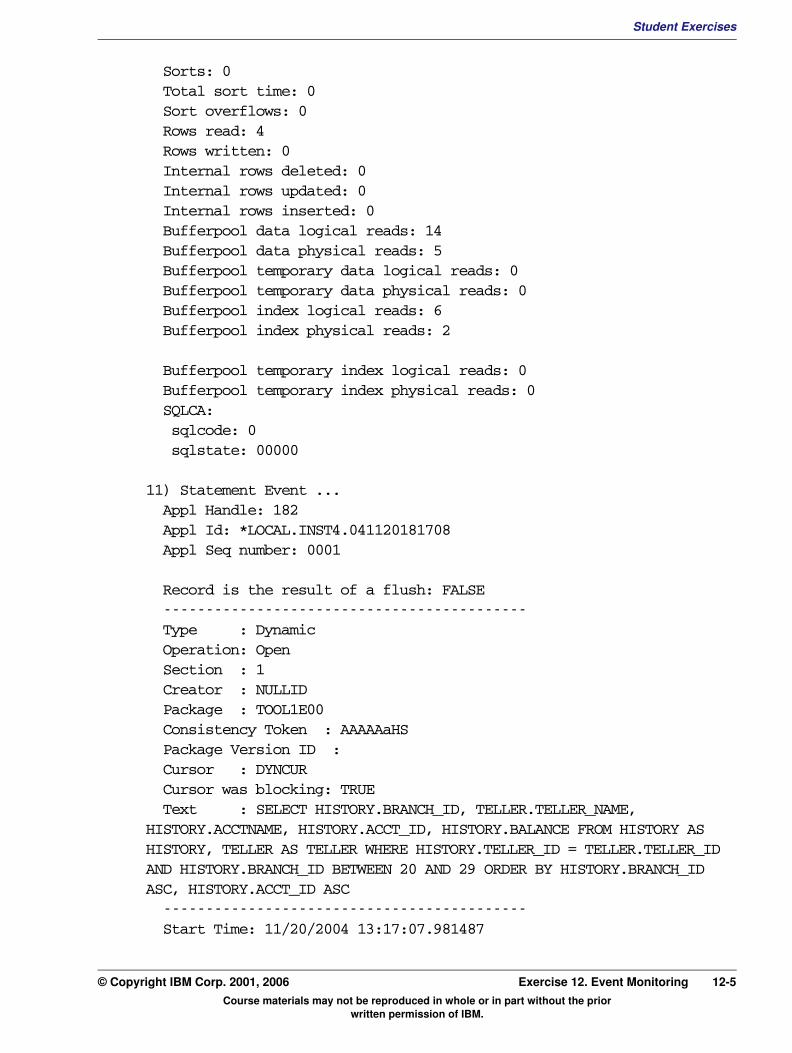
Student ExercisesV3.1.0.1
EXempty
Sorts: 0 Total sort time: 0 Sort overflows: 0 Rows read: 4 Rows written: 0 Internal rows deleted: 0 Internal rows updated: 0 Internal rows inserted: 0 Bufferpool data logical reads: 14 Bufferpool data physical reads: 5 Bufferpool temporary data logical reads: 0 Bufferpool temporary data physical reads: 0 Bufferpool index logical reads: 6 Bufferpool index physical reads: 2 Bufferpool temporary index logical reads: 0 Bufferpool temporary index physical reads: 0 SQLCA: sqlcode: 0 sqlstate: 0000011) Statement Event ... Appl Handle: 182 Appl Id: *LOCAL.INST4.041120181708 Appl Seq number: 0001
Record is the result of a flush: FALSE ------------------------------------------- Type : Dynamic Operation: Open Section : 1 Creator : NULLID Package : TOOL1E00 Consistency Token : AAAAAaHS Package Version ID : Cursor : DYNCUR Cursor was blocking: TRUE Text : SELECT HISTORY.BRANCH_ID, TELLER.TELLER_NAME, HISTORY.ACCTNAME, HISTORY.ACCT_ID, HISTORY.BALANCE FROM HISTORY AS HISTORY, TELLER AS TELLER WHERE HISTORY.TELLER_ID = TELLER.TELLER_ID AND HISTORY.BRANCH_ID BETWEEN 20 AND 29 ORDER BY HISTORY.BRANCH_ID ASC, HISTORY.ACCT_ID ASC ------------------------------------------- Start Time: 11/20/2004 13:17:07.981487
Course materials may not be reproduced in whole or in part without the prior written permission of IBM.
© Copyright IBM Corp. 2001, 2006 Exercise 12. Event Monitoring 12-5
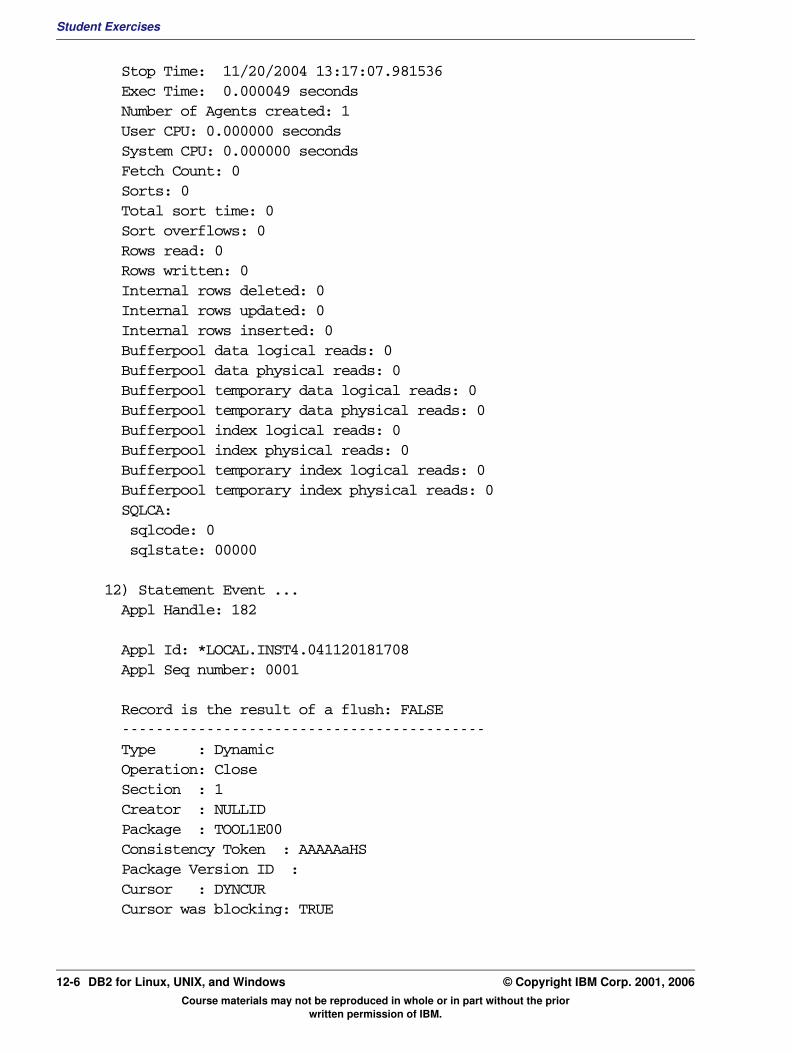
Student Exercises
Stop Time: 11/20/2004 13:17:07.981536 Exec Time: 0.000049 seconds Number of Agents created: 1 User CPU: 0.000000 seconds System CPU: 0.000000 seconds Fetch Count: 0 Sorts: 0 Total sort time: 0 Sort overflows: 0 Rows read: 0 Rows written: 0 Internal rows deleted: 0 Internal rows updated: 0 Internal rows inserted: 0 Bufferpool data logical reads: 0 Bufferpool data physical reads: 0 Bufferpool temporary data logical reads: 0 Bufferpool temporary data physical reads: 0 Bufferpool index logical reads: 0 Bufferpool index physical reads: 0 Bufferpool temporary index logical reads: 0 Bufferpool temporary index physical reads: 0 SQLCA: sqlcode: 0 sqlstate: 00000
12) Statement Event ... Appl Handle: 182 Appl Id: *LOCAL.INST4.041120181708 Appl Seq number: 0001
Record is the result of a flush: FALSE ------------------------------------------- Type : Dynamic Operation: Close Section : 1 Creator : NULLID Package : TOOL1E00 Consistency Token : AAAAAaHS Package Version ID : Cursor : DYNCUR Cursor was blocking: TRUE
Course materials may not be reproduced in whole or in part without the prior written permission of IBM.
12-6 DB2 for Linux, UNIX, and Windows © Copyright IBM Corp. 2001, 2006
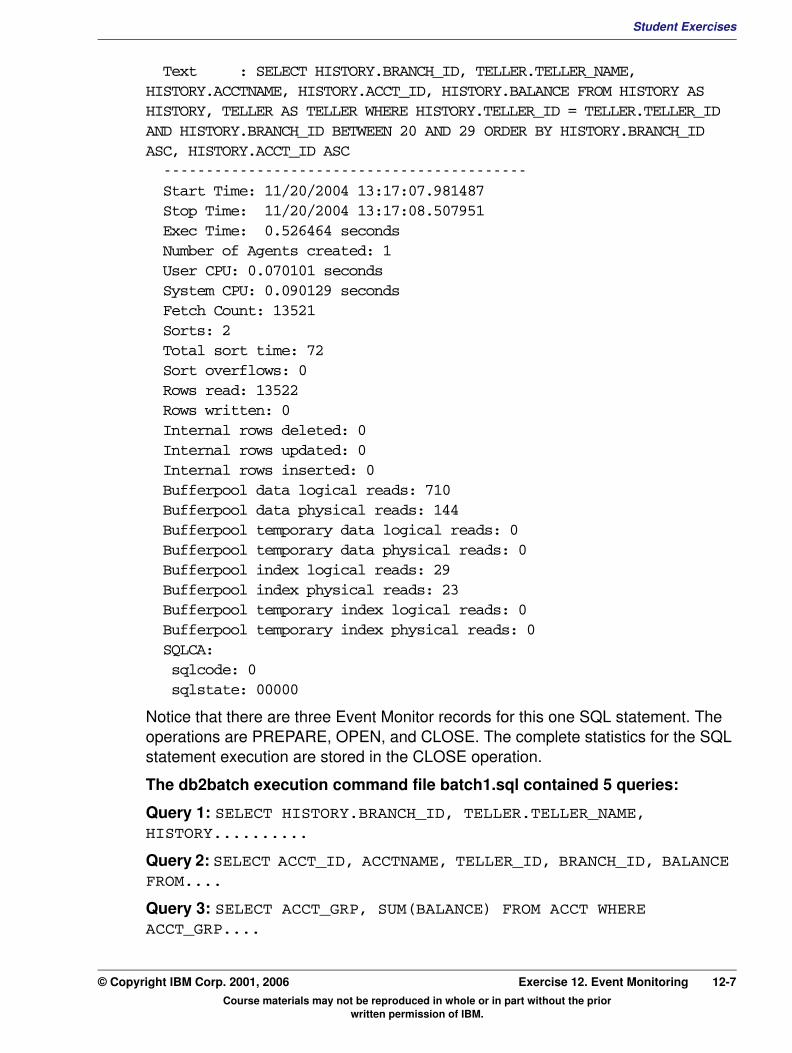
Student ExercisesV3.1.0.1
EXempty
Text : SELECT HISTORY.BRANCH_ID, TELLER.TELLER_NAME, HISTORY.ACCTNAME, HISTORY.ACCT_ID, HISTORY.BALANCE FROM HISTORY AS HISTORY, TELLER AS TELLER WHERE HISTORY.TELLER_ID = TELLER.TELLER_ID AND HISTORY.BRANCH_ID BETWEEN 20 AND 29 ORDER BY HISTORY.BRANCH_ID ASC, HISTORY.ACCT_ID ASC ------------------------------------------- Start Time: 11/20/2004 13:17:07.981487 Stop Time: 11/20/2004 13:17:08.507951 Exec Time: 0.526464 seconds Number of Agents created: 1 User CPU: 0.070101 seconds System CPU: 0.090129 seconds Fetch Count: 13521 Sorts: 2 Total sort time: 72 Sort overflows: 0 Rows read: 13522 Rows written: 0 Internal rows deleted: 0 Internal rows updated: 0 Internal rows inserted: 0 Bufferpool data logical reads: 710 Bufferpool data physical reads: 144 Bufferpool temporary data logical reads: 0 Bufferpool temporary data physical reads: 0 Bufferpool index logical reads: 29 Bufferpool index physical reads: 23 Bufferpool temporary index logical reads: 0 Bufferpool temporary index physical reads: 0 SQLCA: sqlcode: 0 sqlstate: 00000Notice that there are three Event Monitor records for this one SQL statement. The operations are PREPARE, OPEN, and CLOSE. The complete statistics for the SQL statement execution are stored in the CLOSE operation.
The db2batch execution command file batch1.sql contained 5 queries:
Query 1: SELECT HISTORY.BRANCH_ID, TELLER.TELLER_NAME, HISTORY..........
Query 2: SELECT ACCT_ID, ACCTNAME, TELLER_ID, BRANCH_ID, BALANCE FROM....
Query 3: SELECT ACCT_GRP, SUM(BALANCE) FROM ACCT WHERE ACCT_GRP....
Course materials may not be reproduced in whole or in part without the prior written permission of IBM.
© Copyright IBM Corp. 2001, 2006 Exercise 12. Event Monitoring 12-7
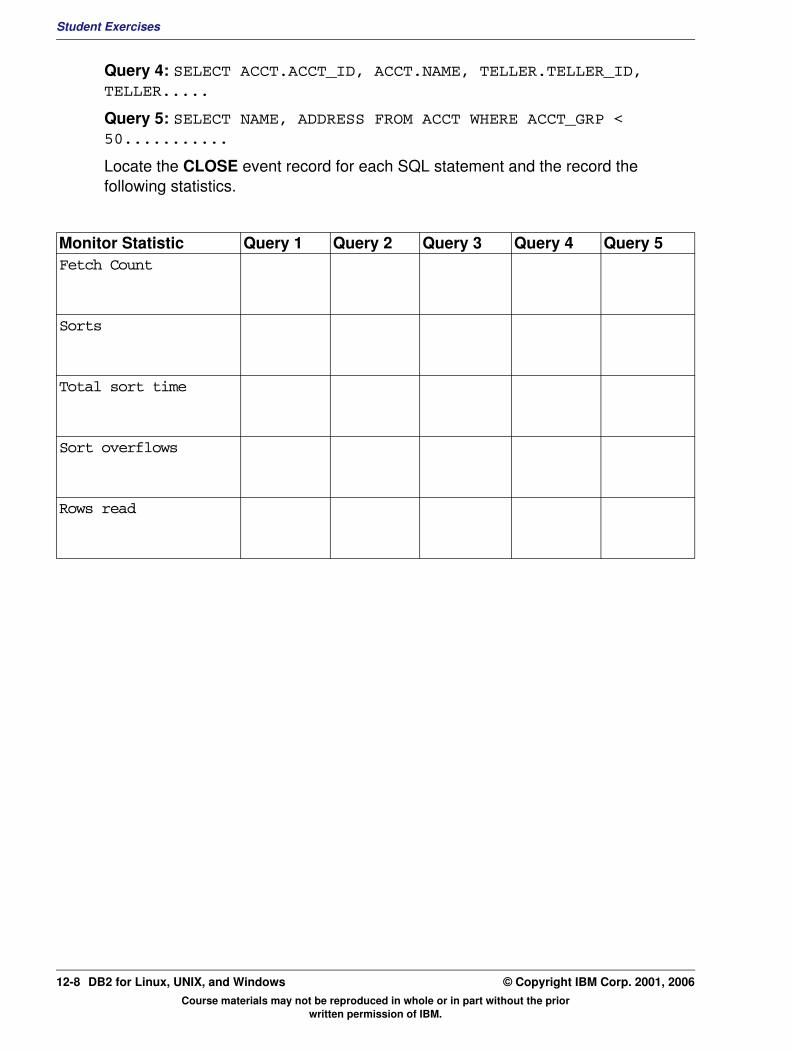
Student Exercises
Query 4: SELECT ACCT.ACCT_ID, ACCT.NAME, TELLER.TELLER_ID, TELLER.....
Query 5: SELECT NAME, ADDRESS FROM ACCT WHERE ACCT_GRP < 50...........
Locate the CLOSE event record for each SQL statement and the record the following statistics.
Monitor Statistic Query 1 Query 2 Query 3 Query 4 Query 5 Fetch Count Sorts Total sort time Sort overflows Rows read
Course materials may not be reproduced in whole or in part without the prior written permission of IBM.
12-8 DB2 for Linux, UNIX, and Windows © Copyright IBM Corp. 2001, 2006
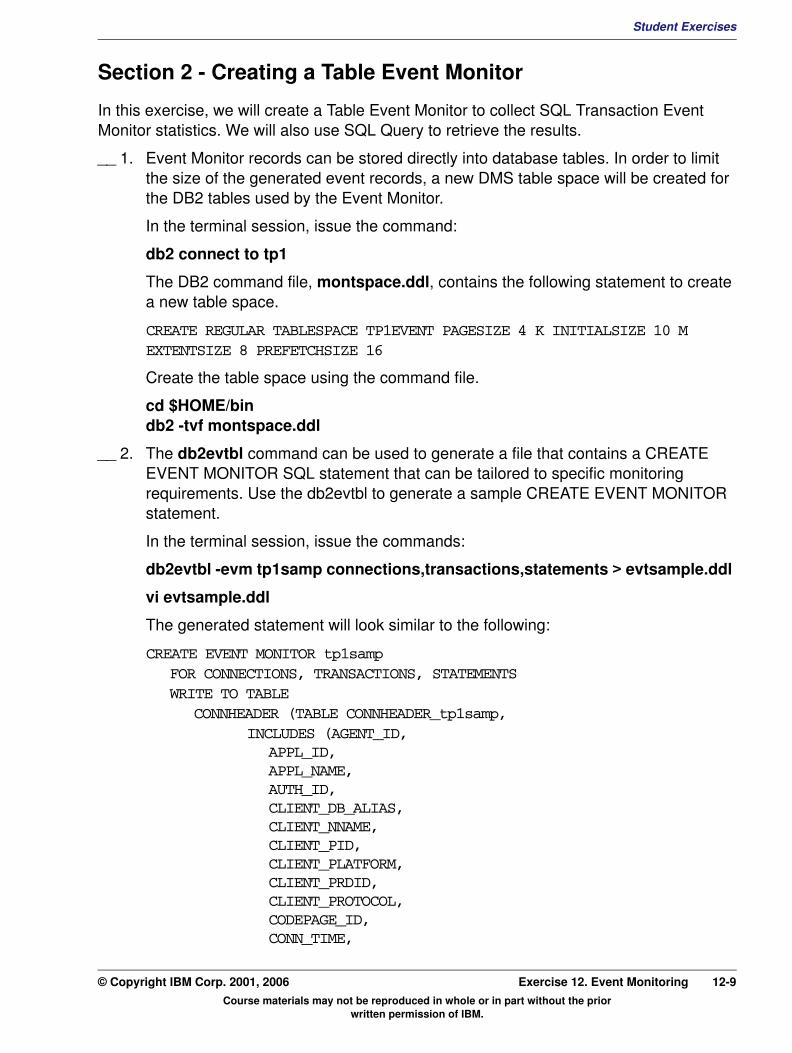
Student ExercisesV3.1.0.1
EXempty
Section 2 - Creating a Table Event MonitorIn this exercise, we will create a Table Event Monitor to collect SQL Transaction Event Monitor statistics. We will also use SQL Query to retrieve the results.
__ 1. Event Monitor records can be stored directly into database tables. In order to limit the size of the generated event records, a new DMS table space will be created for the DB2 tables used by the Event Monitor.
In the terminal session, issue the command:
db2 connect to tp1
The DB2 command file, montspace.ddl, contains the following statement to create a new table space.
CREATE REGULAR TABLESPACE TP1EVENT PAGESIZE 4 K INITIALSIZE 10 M EXTENTSIZE 8 PREFETCHSIZE 16
Create the table space using the command file.
cd $HOME/bin db2 -tvf montspace.ddl
__ 2. The db2evtbl command can be used to generate a file that contains a CREATE EVENT MONITOR SQL statement that can be tailored to specific monitoring requirements. Use the db2evtbl to generate a sample CREATE EVENT MONITOR statement.
In the terminal session, issue the commands:
db2evtbl -evm tp1samp connections,transactions,statements > evtsample.ddl
vi evtsample.ddl
The generated statement will look similar to the following:
CREATE EVENT MONITOR tp1sampFOR CONNECTIONS, TRANSACTIONS, STATEMENTSWRITE TO TABLE
CONNHEADER (TABLE CONNHEADER_tp1samp, INCLUDES (AGENT_ID,
APPL_ID, APPL_NAME, AUTH_ID, CLIENT_DB_ALIAS, CLIENT_NNAME, CLIENT_PID, CLIENT_PLATFORM, CLIENT_PRDID, CLIENT_PROTOCOL, CODEPAGE_ID, CONN_TIME,
Course materials may not be reproduced in whole or in part without the prior written permission of IBM.
© Copyright IBM Corp. 2001, 2006 Exercise 12. Event Monitoring 12-9
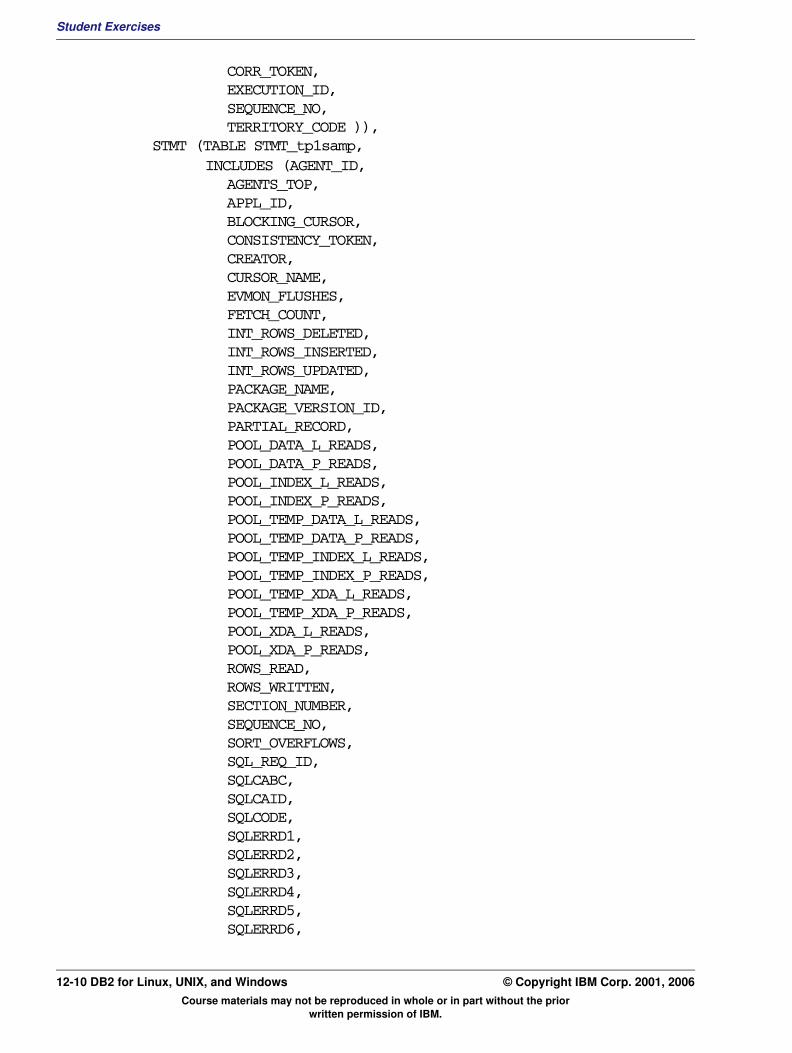
Student Exercises
CORR_TOKEN, EXECUTION_ID, SEQUENCE_NO, TERRITORY_CODE )),
STMT (TABLE STMT_tp1samp, INCLUDES (AGENT_ID,
AGENTS_TOP, APPL_ID, BLOCKING_CURSOR, CONSISTENCY_TOKEN, CREATOR, CURSOR_NAME, EVMON_FLUSHES, FETCH_COUNT, INT_ROWS_DELETED, INT_ROWS_INSERTED, INT_ROWS_UPDATED, PACKAGE_NAME, PACKAGE_VERSION_ID, PARTIAL_RECORD, POOL_DATA_L_READS, POOL_DATA_P_READS, POOL_INDEX_L_READS, POOL_INDEX_P_READS, POOL_TEMP_DATA_L_READS, POOL_TEMP_DATA_P_READS, POOL_TEMP_INDEX_L_READS, POOL_TEMP_INDEX_P_READS, POOL_TEMP_XDA_L_READS, POOL_TEMP_XDA_P_READS, POOL_XDA_L_READS, POOL_XDA_P_READS, ROWS_READ, ROWS_WRITTEN, SECTION_NUMBER, SEQUENCE_NO, SORT_OVERFLOWS, SQL_REQ_ID, SQLCABC, SQLCAID, SQLCODE, SQLERRD1, SQLERRD2, SQLERRD3, SQLERRD4, SQLERRD5, SQLERRD6,
Course materials may not be reproduced in whole or in part without the prior written permission of IBM.
12-10 DB2 for Linux, UNIX, and Windows © Copyright IBM Corp. 2001, 2006

Student ExercisesV3.1.0.1
EXempty
SQLERRM, SQLERRP, SQLSTATE, SQLWARN, START_TIME, STMT_OPERATION, STMT_TEXT, STMT_TYPE, STOP_TIME, SYSTEM_CPU_TIME, TOTAL_SORT_TIME, TOTAL_SORTS, USER_CPU_TIME )),XACT (TABLE XACT_tp1samp,INCLUDES (AGENT_ID, APPL_ID, EVMON_FLUSHES, LOCK_ESCALS, LOCK_WAIT_TIME, LOCKS_HELD_TOP, PARTIAL_RECORD, PREV_UOW_STOP_TIME, ROWS_READ, ROWS_WRITTEN, SEQUENCE_NO, STOP_TIME, SYSTEM_CPU_TIME, UOW_LOG_SPACE_USED, UOW_START_TIME, UOW_STATUS, USER_CPU_TIME, X_LOCK_ESCALS )),
CONN (TABLE CONN_tp1samp,INCLUDES (ACC_CURS_BLK, AGENT_ID, APPL_ID, APPL_PRIORITY, APPL_PRIORITY_TYPE, APPL_SECTION_INSERTS, APPL_SECTION_LOOKUPS, APPL_STATUS, AUTHORITY_LVL, BINDS_PRECOMPILES, CAT_CACHE_HEAP_FULL, CAT_CACHE_INSERTS, CAT_CACHE_LOOKUPS, CAT_CACHE_OVERFLOWS,
Course materials may not be reproduced in whole or in part without the prior written permission of IBM.
© Copyright IBM Corp. 2001, 2006 Exercise 12. Event Monitoring 12-11

Student Exercises
CAT_CACHE_SIZE_TOP, COMMIT_SQL_STMTS, COORD_NODE, DDL_SQL_STMTS, DEADLOCKS, DIRECT_READ_REQS, DIRECT_READ_TIME, DIRECT_READS, DIRECT_WRITE_REQS, DIRECT_WRITE_TIME, DIRECT_WRITES, DISCONN_TIME, DYNAMIC_SQL_STMTS, ELAPSED_EXEC_TIME, EVMON_FLUSHES, FAILED_SQL_STMTS, HASH_JOIN_OVERFLOWS, HASH_JOIN_SMALL_OVERFLOWS, INT_AUTO_REBINDS, INT_COMMITS, INT_DEADLOCK_ROLLBACKS, INT_ROLLBACKS, INT_ROWS_DELETED, INT_ROWS_INSERTED, INT_ROWS_UPDATED, LOCK_ESCALS, LOCK_TIMEOUTS, LOCK_WAIT_TIME, LOCK_WAITS, PARTIAL_RECORD, PKG_CACHE_INSERTS, PKG_CACHE_LOOKUPS, POOL_DATA_FROM_ESTORE, POOL_DATA_L_READS, POOL_DATA_P_READS, POOL_DATA_TO_ESTORE, POOL_DATA_WRITES, POOL_INDEX_FROM_ESTORE, POOL_INDEX_L_READS, POOL_INDEX_P_READS, POOL_INDEX_TO_ESTORE, POOL_INDEX_WRITES, POOL_READ_TIME, POOL_TEMP_DATA_L_READS, POOL_TEMP_DATA_P_READS, POOL_TEMP_INDEX_L_READS, POOL_TEMP_INDEX_P_READS, POOL_TEMP_XDA_L_READS,
Course materials may not be reproduced in whole or in part without the prior written permission of IBM.
12-12 DB2 for Linux, UNIX, and Windows © Copyright IBM Corp. 2001, 2006
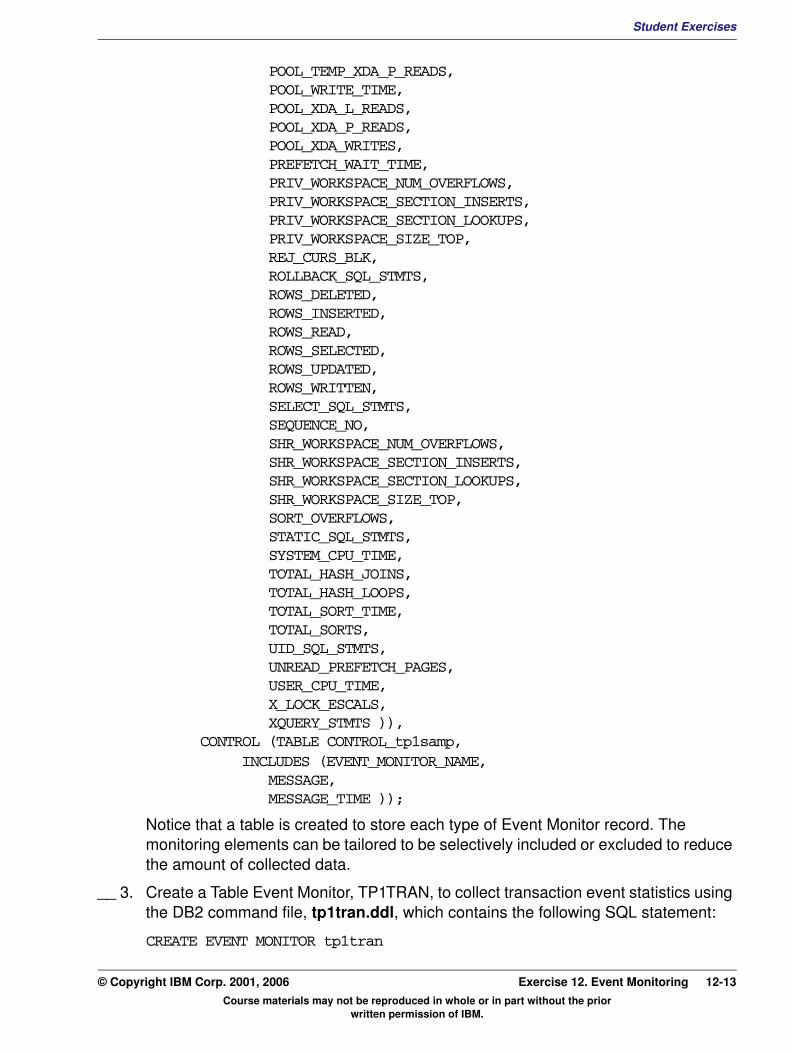
Student ExercisesV3.1.0.1
EXempty
POOL_TEMP_XDA_P_READS, POOL_WRITE_TIME, POOL_XDA_L_READS, POOL_XDA_P_READS, POOL_XDA_WRITES, PREFETCH_WAIT_TIME, PRIV_WORKSPACE_NUM_OVERFLOWS, PRIV_WORKSPACE_SECTION_INSERTS, PRIV_WORKSPACE_SECTION_LOOKUPS, PRIV_WORKSPACE_SIZE_TOP, REJ_CURS_BLK, ROLLBACK_SQL_STMTS, ROWS_DELETED, ROWS_INSERTED, ROWS_READ, ROWS_SELECTED, ROWS_UPDATED, ROWS_WRITTEN, SELECT_SQL_STMTS, SEQUENCE_NO, SHR_WORKSPACE_NUM_OVERFLOWS, SHR_WORKSPACE_SECTION_INSERTS, SHR_WORKSPACE_SECTION_LOOKUPS, SHR_WORKSPACE_SIZE_TOP, SORT_OVERFLOWS, STATIC_SQL_STMTS, SYSTEM_CPU_TIME, TOTAL_HASH_JOINS, TOTAL_HASH_LOOPS, TOTAL_SORT_TIME, TOTAL_SORTS, UID_SQL_STMTS, UNREAD_PREFETCH_PAGES, USER_CPU_TIME, X_LOCK_ESCALS, XQUERY_STMTS )),CONTROL (TABLE CONTROL_tp1samp,INCLUDES (EVENT_MONITOR_NAME, MESSAGE, MESSAGE_TIME ));
Notice that a table is created to store each type of Event Monitor record. The monitoring elements can be tailored to be selectively included or excluded to reduce the amount of collected data.
__ 3. Create a Table Event Monitor, TP1TRAN, to collect transaction event statistics using the DB2 command file, tp1tran.ddl, which contains the following SQL statement:
CREATE EVENT MONITOR tp1tran
Course materials may not be reproduced in whole or in part without the prior written permission of IBM.
© Copyright IBM Corp. 2001, 2006 Exercise 12. Event Monitoring 12-13

Student Exercises
FOR TRANSACTIONSWRITE TO TABLE
CONNHEADER (TABLE CONNHEADER_tp1tran, in tp1event,INCLUDES (AGENT_ID, APPL_ID, APPL_NAME, AUTH_ID, CLIENT_DB_ALIAS, CLIENT_NNAME, CLIENT_PID, CLIENT_PLATFORM, CLIENT_PRDID, CLIENT_PROTOCOL, CODEPAGE_ID, CONN_TIME, CORR_TOKEN, EXECUTION_ID, SEQUENCE_NO, TERRITORY_CODE )),
XACT (TABLE XACT_tp1tran, in tp1event,INCLUDES (AGENT_ID, APPL_ID, EVMON_FLUSHES, LOCK_ESCALS, LOCK_WAIT_TIME, LOCKS_HELD_TOP, PARTIAL_RECORD, PREV_UOW_STOP_TIME, ROWS_READ, ROWS_WRITTEN, SEQUENCE_NO, STOP_TIME, SYSTEM_CPU_TIME, UOW_LOG_SPACE_USED, UOW_START_TIME, UOW_STATUS, USER_CPU_TIME, X_LOCK_ESCALS )),
CONTROL (TABLE CONTROL_tp1tran, in tp1event,INCLUDES (EVENT_MONITOR_NAME, MESSAGE, MESSAGE_TIME )) MANUALSTART ;
In the terminal session, issue the command:
db2 -tvf tp1tran.ddl
Course materials may not be reproduced in whole or in part without the prior written permission of IBM.
12-14 DB2 for Linux, UNIX, and Windows © Copyright IBM Corp. 2001, 2006

Student ExercisesV3.1.0.1
EXempty
__ 4. Start the new Table Event Monitor, TP1TRAN, to collect transaction event statistics. Use the MULTI application with a configuration of TP1MIX.CFG to run a mixture of application transactions.In the terminal session, issue the command:
db2 set event monitor TP1TRAN state 1
Start a second terminal session for running the MULTI application and issue the following commands:
cd $HOME/bin multi tp1mix.cfg
To begin processing transactions, click the RUN button.
Wait for 60 seconds of Elapsed Time to complete.
Close the MULTI application now.
Stop the Event Monitor TP1TRAN from collecting new monitor data.
db2 set event monitor TP1TRAN state 0
__ 5. Use a SQL query to select some of the collected transaction statistics from the XACT_TP1TRAN table. The following query is in the DB2 command file evtquery1.sql:
SELECT AGENT_ID, STOP_TIME - UOW_START_TIME AS DURATION, ROWS_READ, ROWS_WRITTEN, UOW_LOG_SPACE_USED, LOCK_WAIT_TIME FROM XACT_TP1TRAN WHERE ROWS_READ > 30 ORDER BY ROWS_READ DESC ;
In the terminal session, issue the commands:
db2 -tvf evtquery1.sql > evtreport1.txt
vi evtreport1.txt
The output will look similar to the following:
SELECT AGENT_ID, STOP_TIME - UOW_START_TIME AS DURATION, ROWS_READ, ROWS_WRITTEN, UOW_LOG_SPACE_USED, LOCK_WAIT_TIME FROM XACT_TP1TRAN WHERE ROWS_READ > 30 ORDER BY ROWS_READ DESC
AGENT_ID DURATION ROWS_READ ROWS_WRITTEN UOW_LOG_SPACE_USED LOCK_WAIT_TIME -------------------- ---------------------- -------------------- -------------------- -------------------- -------------------- 1395 6.249325 19860 9930 0 0 1396 12.844741 19082 9541 0 0 1396 6.459015 18460 9230 0 0
Course materials may not be reproduced in whole or in part without the prior written permission of IBM.
© Copyright IBM Corp. 2001, 2006 Exercise 12. Event Monitoring 12-15
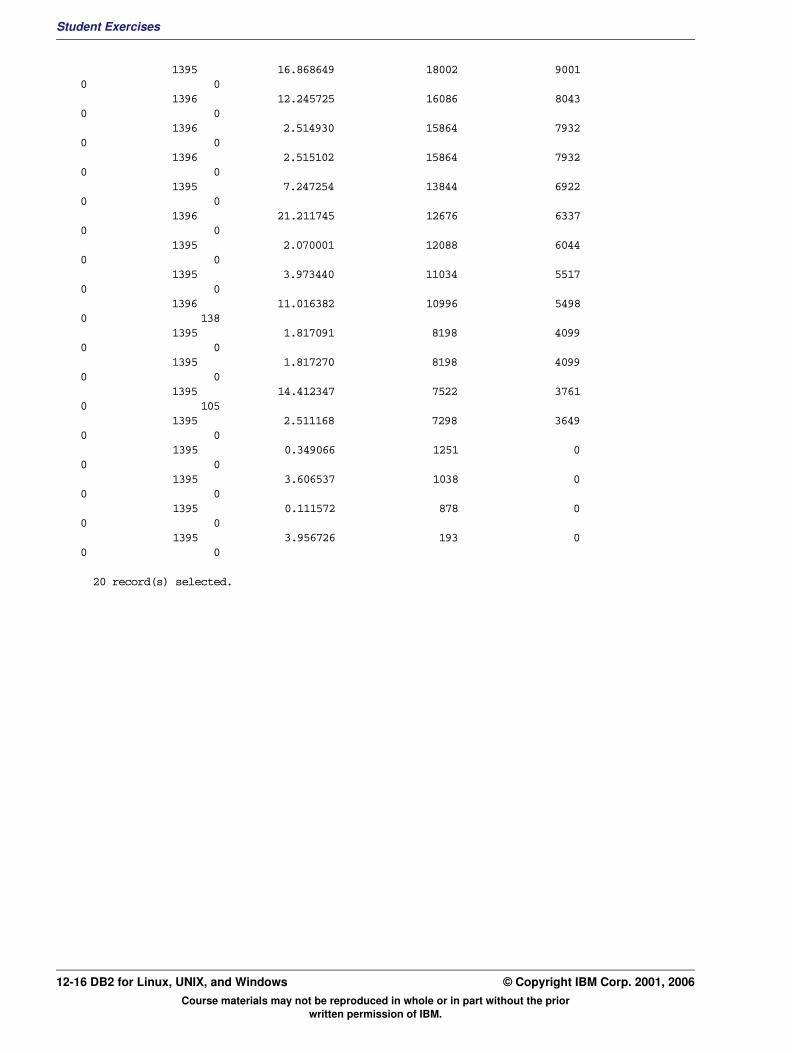
Student Exercises
1395 16.868649 18002 9001 0 0 1396 12.245725 16086 8043 0 0 1396 2.514930 15864 7932 0 0 1396 2.515102 15864 7932 0 0 1395 7.247254 13844 6922 0 0 1396 21.211745 12676 6337 0 0 1395 2.070001 12088 6044 0 0 1395 3.973440 11034 5517 0 0 1396 11.016382 10996 5498 0 138 1395 1.817091 8198 4099 0 0 1395 1.817270 8198 4099 0 0 1395 14.412347 7522 3761 0 105 1395 2.511168 7298 3649 0 0 1395 0.349066 1251 0 0 0 1395 3.606537 1038 0 0 0 1395 0.111572 878 0 0 0 1395 3.956726 193 0 0 0
20 record(s) selected.
Course materials may not be reproduced in whole or in part without the prior written permission of IBM.
12-16 DB2 for Linux, UNIX, and Windows © Copyright IBM Corp. 2001, 2006
Student ExercisesV3.1.0.1
EXempty
Section 3 - Using the Event Analyzer ToolIn this exercise, we will use the Event Analyzer Tool to view the Table Event Monitor for Transaction Event Monitor statistics collected by the TP1TRAN Event Monitor.
__ 1. Start a new terminal session for running the Event Analyzer application and issue the following command:
db2eva
For Database Name, select TP1 from the list.
For Event Monitor Name, select TP1TRAN.
Select OK.
Point to the entry that shows the Connection time and Start Time for the monitoring session.
Click the Selected menu item and choose Drill Down To and Transactions.
You can scroll down to see the list of transactions. Scroll to the right to view all the monitoring elements for each transaction.
The detailed information for a single transaction event can also viewed by clicking the transaction.
Choose one transaction from the Event Analyzer list.
Course materials may not be reproduced in whole or in part without the prior written permission of IBM.
© Copyright IBM Corp. 2001, 2006 Exercise 12. Event Monitoring 12-17

Student Exercises
Click the Selected menu item and choose Drill Down To and Data Elements.
Course materials may not be reproduced in whole or in part without the prior written permission of IBM.
12-18 DB2 for Linux, UNIX, and Windows © Copyright IBM Corp. 2001, 2006
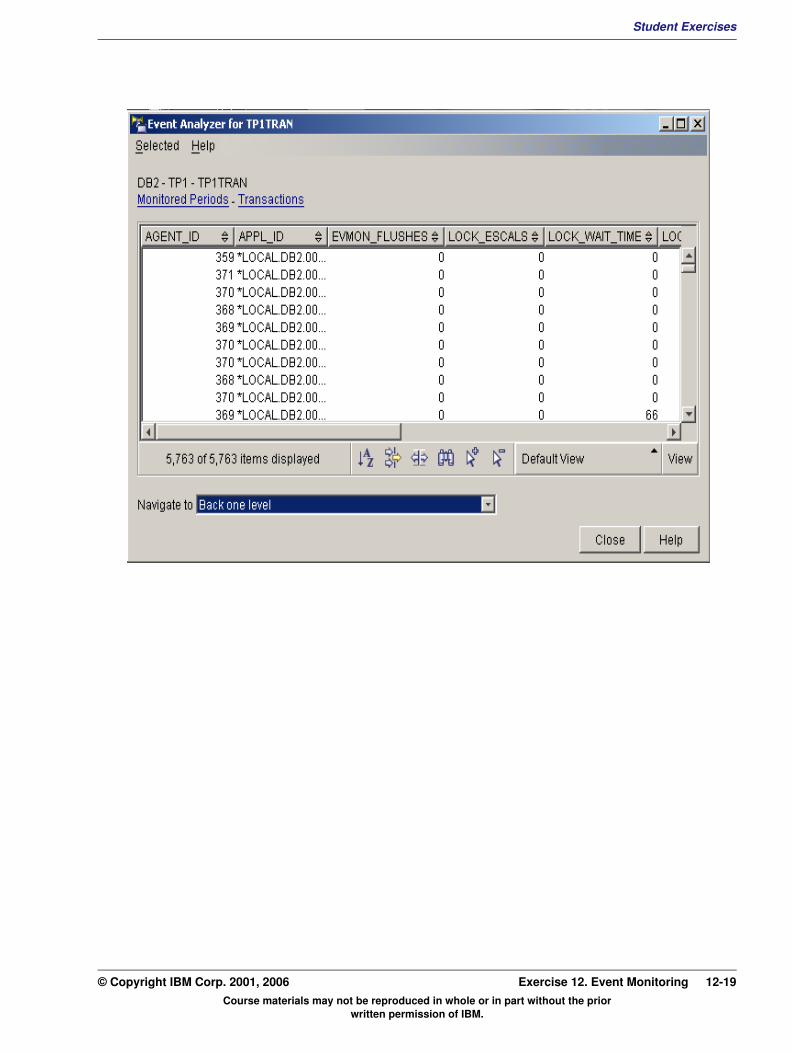
Student ExercisesV3.1.0.1
EXempty
Course materials may not be reproduced in whole or in part without the prior written permission of IBM.
© Copyright IBM Corp. 2001, 2006 Exercise 12. Event Monitoring 12-19
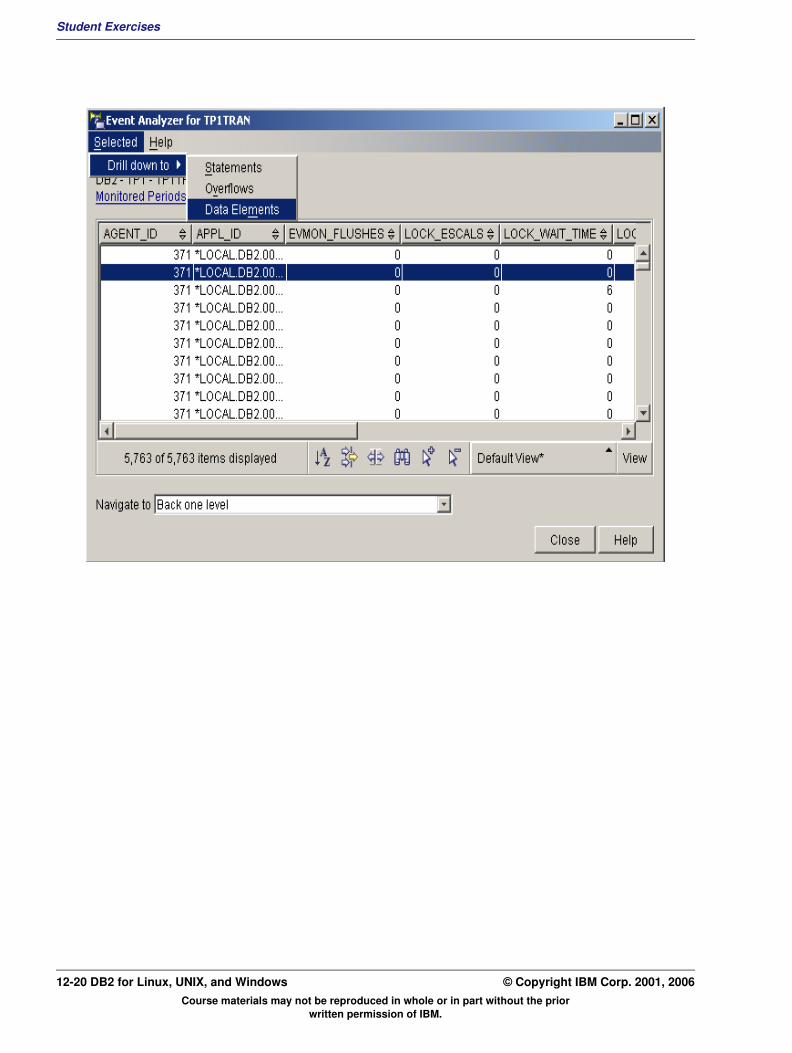
Student Exercises
Course materials may not be reproduced in whole or in part without the prior written permission of IBM.
12-20 DB2 for Linux, UNIX, and Windows © Copyright IBM Corp. 2001, 2006
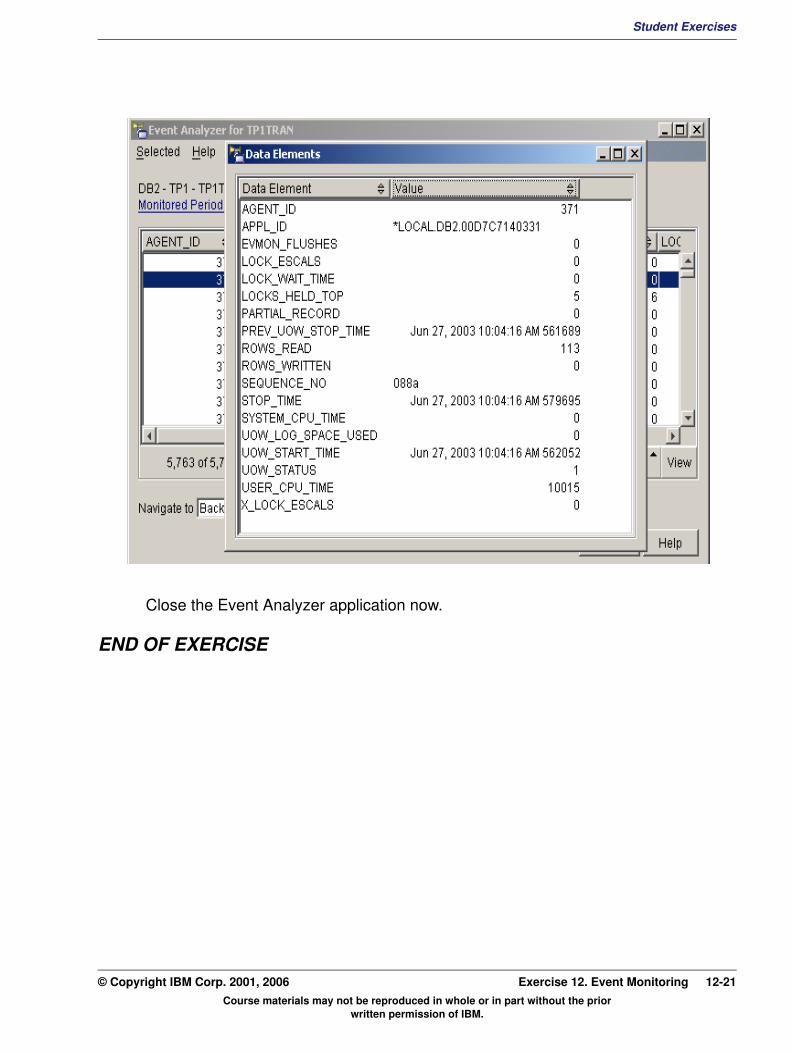
Student ExercisesV3.1.0.1
EXempty
Close the Event Analyzer application now.
END OF EXERCISE
Course materials may not be reproduced in whole or in part without the prior written permission of IBM.
© Copyright IBM Corp. 2001, 2006 Exercise 12. Event Monitoring 12-21

Student Exercises
Course materials may not be reproduced in whole or in part without the prior written permission of IBM.
12-22 DB2 for Linux, UNIX, and Windows © Copyright IBM Corp. 2001, 2006
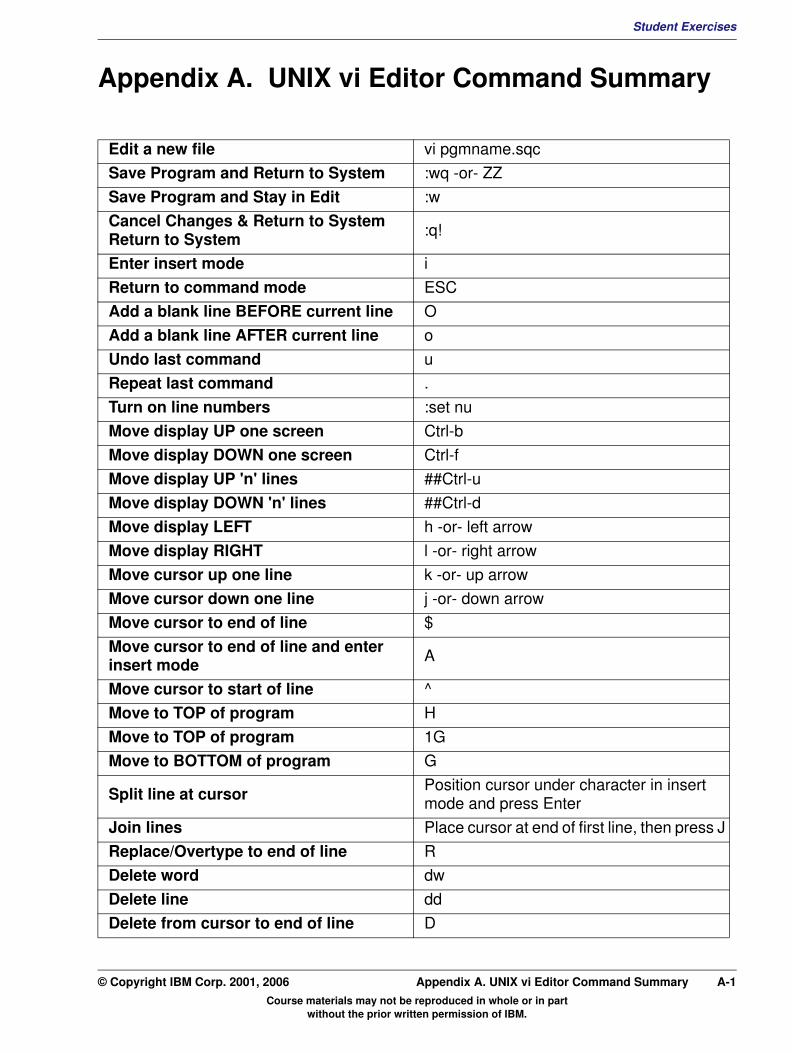
Student ExercisesV2.0
EXempty
Appendix A. UNIX vi Editor Command SummaryEdit a new file vi pgmname.sqc
Save Program and Return to System :wq -or- ZZ
Save Program and Stay in Edit :w
Cancel Changes & Return to System Return to System :q!
Enter insert mode i
Return to command mode ESC
Add a blank line BEFORE current line O
Add a blank line AFTER current line o
Undo last command u
Repeat last command .
Turn on line numbers :set nu
Move display UP one screen Ctrl-b
Move display DOWN one screen Ctrl-f
Move display UP 'n' lines ##Ctrl-u
Move display DOWN 'n' lines ##Ctrl-d
Move display LEFT h -or- left arrow
Move display RIGHT l -or- right arrow
Move cursor up one line k -or- up arrow
Move cursor down one line j -or- down arrow
Move cursor to end of line $
Move cursor to end of line and enter insert mode A
Move cursor to start of line ^
Move to TOP of program H
Move to TOP of program 1G
Move to BOTTOM of program G
Split line at cursor Position cursor under character in insert mode and press Enter
Join lines Place cursor at end of first line, then press J
Replace/Overtype to end of line R
Delete word dw
Delete line dd
Delete from cursor to end of line D
Course materials may not be reproduced in whole or in part without the prior written permission of IBM.
© Copyright IBM Corp. 2001, 2006 Appendix A. UNIX vi Editor Command Summary A-1
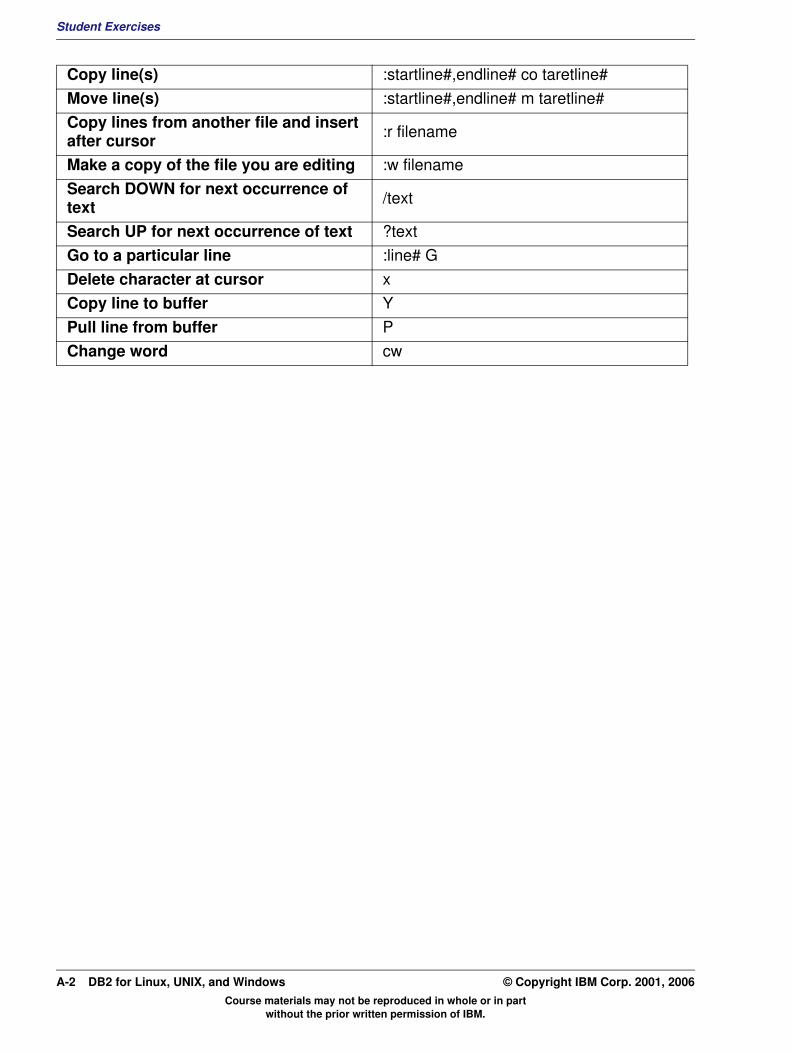
Student Exercises
Copy line(s) :startline#,endline# co taretline#
Move line(s) :startline#,endline# m taretline#
Copy lines from another file and insert after cursor :r filename
Make a copy of the file you are editing :w filename
Search DOWN for next occurrence of text /text
Search UP for next occurrence of text ?text
Go to a particular line :line# G
Delete character at cursor x
Copy line to buffer Y
Pull line from buffer P
Change word cw
Course materials may not be reproduced in whole or in part without the prior written permission of IBM.
A-2 DB2 for Linux, UNIX, and Windows © Copyright IBM Corp. 2001, 2006

V2.0
backpg
Back page
���®